Regoverning Markets: Small-scale producers in ... - GOV.UK
69
Regoverning Markets: Small-scale producers in modern national and regional agrifood markets Introduction Bill Vorley (IIED) DFID,17 November 2006
-
Upload
khangminh22 -
Category
Documents
-
view
0 -
download
0
Transcript of Regoverning Markets: Small-scale producers in ... - GOV.UK

Regoverning Markets: Small-scale producers in
modern national and regional agrifood markets
IntroductionBill Vorley (IIED)
DFID,17 November 2006

Structure of seminar
10:30-12:00 Open session:10:30-10.45 Introduction (background, objectives, methodology,
alliance/structure) – Bill Vorley10.45-10.55 Measuring inclusion and exclusion in dynamic agrifood
markets – Bill Vorley10.55-11.10 Capturing best practice in connecting small scale
producers with dynamic markets – Lucian Peppelenbos(KIT)
11.10-11.25 Policy linkages -- mapping and influencing public and private sector policy – Felicity Proctor (NRI)
11:25-11:30 Drawing together and next steps to early 2008 – Bill Vorley
11.30-12.00 Open discussion– Synergies, value addition, fit with current programmes
12:00-13:00 Closed session with DFID CRD, if required

Policy Paper Growth and poverty reduction:The role of agriculture, December 2005
33. “Poor farmers are also finding it harder to sell their produce as food processing, distribution and retailing becomes increasingly globalised. The appearance of large, international supermarket chains in many developing countries is leading to new demands on quality, quantity and delivery schedules. Supermarkets already dominate the retail food markets in most developed countries, and they are increasingly penetrating markets in developing countries ”

New UK Development White Paper, July 2006
Making markets work for poor people.“The UK will encourage developing country governments, the private sector and civil society.. to work together to promote growth and employment.”The private sector as partner in the UK development project

Markets working for the poor?

Re-structuring, Re-governance..
1. Marketing strategies built around..
– Trust – Defence of quality, consistency
and assurance to consumers– Reliability and continuity of
supply– Lower pricesThrough – Narrowing of supply base– Own brands– Traceability systems– Private standards– Economies of scale– Logistics: national and cross-
border systems to coordinate procurement and distribution
– Shaping regulatory envi2. Deregulation3. Liberalization4. Market concentration
Buyer-driven productionBarriers to entry –capital, technology, organisation, scale, financeCollaborative business models
Consumer as ‘regulator’Imports set price and qualityBuyer power

Retail strategy as practice..Cash and Carry investor in S Asia
• Setting up 2 stores in 2006, 5 more in 2007. Each store $30-40m
• 30% fresh produce, 80% delivered to collection centres• Suppliers must have tax number, fax machine etc.. • Lobby government on tax, to be competitive with grey
market• Success of C&C depends on inefficiency of wholesale.
Eg tomatoes.. Rp 20 at farm, and Rp 140 in city 5 days later, with up to 5 people involved along chain. Broker (arthi) provide very little service other than pre-financing. 40-45% losses -- packing, logistics, grading. C&C can buy for Rp40, sell for Rp60 and still get enough margin.
• “Arthi will have to change or will lose the market. Clever ones will see that have to work with farmers, provide logistical services etc”
• “Smallholders? For marketing, important to be able to guarantee source of product (bird flu..)”
• “Co-ops? Almost never use them – less flexible, less responsive to instructions (eg packaging, labelling..)”
Formal economy
‘Pro-poor’?
Producer organisations
Upgrading
Logistics
Regulatory envi

Regoverning Markets programme in short..
• Can the new agrifood business drivers be partners in development?
• Can smaller scale producers and their organisations be partners in new business?
• Can anticipatory public policy make any difference?

Emerging marketse.g. Vietnam
Key factors: large traditional wet markets, low tech >10%
Maturing marketse.g. South Africa
Supermarkets >45% of sales; few traditional wet market
Fragmented marketse.g. Pakistan
Key factors: large traditional wet markets, low tech, >5%
Anticipatory policy
Consolidated marketse.g. W. Europe
Supermarkets >65% of sales; few traditional wet markets, hi- tech
•“Policy agencies are floundering”
•“If we understand the process, we can design policies to shape the way in develops”

Reminders
• More than supermarkets..– Supermarkets are just one accelerator of structural change – Wider agrifood restructuring, including processing– Will advocate strengthening of traditional and wholesale
markets, where appropriate• Understanding the ‘vanguard’ is crucial for
anticipatory policy– As well as understanding the mass market– Even though not all agrifood structural innovations will
become the norm• We understand that sectors differ in speed of
restructuring– FFV slower than dairy and meat
• The term ‘small farmers’ has limitations– We are more interested in differentiation between asset-rich
and asset-poor

Consumer ‘pull’
Policy ‘push’
Urbanisation
Commercialopportunity
Food standards
Foreign Investment
Local investment
Technology
Management
Organization
Industry structure, concentration
Procurement
Standards
Finance
EXCLUSION
INCLUSION
Collective Action
Business Models
InstitutionsPolicies
Entry PointsSupport Systems
Research and Development
Factors driving dynamicmarket change
Createschanges in supply chains….
Skills and assets of producers and SMEs
Leading to small-scale producer and SME..
..in dynamicmarkets
Conceptual framework

Consumer ‘pull’
Policy ‘push’
Urbanisation
Commercialopportunity
Food standards
Foreign Investment
Local investment
Technology
Management
Organization
Industry structure, concentration
Procurement
Standards
Finance
EXCLUSION
INCLUSION
Collective Action
Business Models
InstitutionsPolicies
Entry PointsSupport Systems
Research and Development
Factors driving dynamicmarket change
Createschanges in supply chains….
Skills and assets of producers and SMEs
Leading to small-scale producer and SME..
..in dynamicmarkets
Consumer ‘pull’
Policy ‘push’
Urbanisation
Commercialopportunity
Food standards
Foreign Investment
Local investment
Technology
Management
Organization
Industry structure, concentration
Procurement
Standards
Finance
EXCLUSION
INCLUSION
Factors driving dynamicmarket change
Createschanges in supply chains….
Leading to small-scale producer and SME..
..in dynamicmarkets
Component 1
Big challenge:
Change is messy and takes time to influence upstream

Village-level survey, Shandong
Photo: CCAP

MLEKOVITA (large co-op)
35,1 31,3
19,812,4
1,2 0,20,0
10,020,030,040,050,060,070,0
upto25
25-60
60-120
120-250
250-500
over500
yearly milk deliveries per producer x1000
HOCHLAND (private, foreign)
0,7
14,2
44,6
32,8
6,80,9
0,010,020,030,040,050,060,070,0
upto25
25-60
60-120
120-250
250-500
over500
stru
ctur
e of
pro
duce
rs %
SOKŁÓKA (small co-op)
67,6
23,2
7,11,6 0,4 0,1
0,0
10,0
20,0
30,040,0
50,0
60,0
70,0
upto25
25-60
60-120
120-250
250-500
over500
Source: Poland team, “Survey on dairy sector in Poland: Introduction”
Size of producers related to size and structure of processing – Poland (2005)

Consumer ‘pull’
Policy ‘push’
Urbanisation
Commercialopportunity
Food standards
Foreign Investment
Local investment
Technology
Management
Organization
Industry structure, concentration
Procurement
Standards
Finance
EXCLUSION
INCLUSION
Collective Action
Business Models
InstitutionsPolicies
Entry PointsSupport Systems
Research and Development
Factors driving dynamicmarket change
Createschanges in supply chains….
Skills and assets of producers and SMEs
Leading to small-scale producer and SME..
..in dynamicmarkets
Consumer ‘pull’
Policy ‘push’
Urbanisation
Commercialopportunity
Food standards
Foreign Investment
Local investment
Technology
Management
Organization
Industry structure, concentration
Procurement
Standards
Finance
EXCLUSION
INCLUSION
Collective Action
Business Models
InstitutionsPolicies
Entry PointsSupport Systems
Research and Development
Factors driving dynamicmarket change
Createschanges in supply chains….
Skills and assets of producers and SMEs
Leading to small-scale producer and SME..
..in dynamicmarkets
Component 2
Collective Action
Business Models
InstitutionsPolicies
Entry PointsSupport Systems
Research and Development
Big challenge:
‘Best practice’ can be highly case-specific

Regoverning Markets 2005-2007
Conceptual Framework
Meta Research
Empirical Research(Component 1)
Innovation and Good Practice Case Studies
(Component 2)
Interactive Learning and Policy processes
(Component 3)
NationalRegional
International
Web based portal Capacity Building Information

ConsortiumRegional CoordinatorsChina Centre for Chinese Agricultural Policy (CCAP), China. Jikun HuangCentral and Eastern Europe Corvinus University of Budapest, Hungary. Csaba CsákiEast Mediterranean and Middle East Economic Research Centre on Mediterranean Countries, Turkey. Yavuz Tekelioglu and Ali KoçNorth and West Africa Association Interdisciplinaire pour le Développement et l’Environnement (TARGA), Morocco. Aziz SbaiSouth East Asia University of the Philippines in Mindanao, The Philippines. Larry Digal Latin America RIMISP Latin American Centre for Rural Development, Chile. Julio BerdeguéSouth Asia Sustainable Development Policy Institute (SDPI), Pakistan. Abid Suleri –East Africa Tegemeo Institute of Egerton University, Kenya. James NyoroSouthern Africa University of Pretoria, South Africa. Andre Louw
Component LeadersComponent 1 Empirical Research to Inform PolicyCentre for Chinese Agricultural Policy (CCAP), China. Jikun HuangMichigan State University (MSU), USA, Tom ReardonWithUMR MOISA, France. Jean-Marie Codron Component 2 Building on Innovation and Guiding PracticeRIMISP Latin American Centre for Rural Development. Julio BerdeguéRoyal Tropical Institute (KIT), Netherlands. Lucian PeppelenbosWithCentre de Coopération Internationale en Recherche Agronomique pour le Développement (CIRAD),France. Estelle Biénabe Component 3 Learning and Policy DialogueNatural Resources Institute (NRI), UK. Felicity ProctorUniversity of the Philippines in Mindanao, The Philippines. Larry DigalWithWageningen International, Netherlands. Jim Woodhill
Programme Team LeaderBill Vorley, International Institute for Environment and Development (IIED)

Decentralised structure
Component Component LeadershipLeadership
-Component 1- ( )
-Component 2- ( )
-Component 3-
Regional Regional CoordinationCoordination
-L America
-CEE
-EMME
-E Africa
-So Africa
-N&W Africa
-S Asia
-SE Asia
-China
Programme Programme CoordinationCoordination
IIED
Research TeamsResearch TeamsComponent 1
Component 2
Donor-Partners
Advisory Group
Local reference groups

What have we achieved so far?• Network fully in place
– Decentralised leadership of nine Regions and three Components
• Donor backing– £2m budget. Partnerships with DFID, IDRC, Cida,
ICCO, Cordaid, plus supplementary grant from USAID.• Advisory Group in place
– Representing food chain, academia, producer organisations, international organisations
• Methodology in place– Methodology of 3 components developed. – Plus: Policy and institutional mapping tools.
• Research underway– Two modules of Component 1– First round of 15 Component 2 case studies– Policy mapping (2 pilots) and processes
• Communications– Launch of upgraded website. Heavy investment in
technology to allow decentralised site development

Phase 1 Book
Programme Status Report

Launched Nov 2007..

Regoverning Markets 2005-2007
Conceptual Framework
Meta Research
Empirical Research(Component 1)
Innovation and Good Practice Case Studies
(Component 2)
Interactive Learning and Policy processes
(Component 3)
NationalRegional
International
Web based portal Capacity Building Information
Conceptual Framework
Meta Research
Empirical Research(Component 1)
Innovation and Good Practice Case Studies
(Component 2)
Interactive Learning and Policy processes
(Component 3)
NationalRegional
International
Web based portal Capacity Building Information
Big challenges:
Inter-country anticipatory learning
Finding the ‘sweet spots’ of policy leverage
Involving policy community (incl. private sector) in the process

The challenges
• Openness and Relevance– For policy– For the private sector– For producers and their organisations– Written in ‘non-foreign’ language
• Impartiality: Not selectively supporting preconceived ideas
• Quality control• Innovation• Integration
– Components that talk to each other• ‘Anticipatory’ element means what it says
– International learning• Impact properly measured
– Monitoring influence as well as outputs

Measuring inclusion and exclusion in dynamic agrifood markets
(Component 1)

Research Questions
1) HOW is the demand side (food industry/markets) restructuring?
2) WHO (on supply side) is participating in restructured markets?
… Do the poor (in land, in capital) participate?3) WHAT are the effects (technology, income)
of participation?4) WHAT are the policy/institution/
organizational determinants of 1-3?5) WHAT are the implications?
Component 1: Studies of market restructuring

Modules
1) Module 1: national-meso (retail, wholesale, processing restructuring and government policy and CS context)
2) Module 2: local-meso (food industry segments at local level plus supply side and local policy, institutional, and organizational context)
3) Module 3: local-micro (supply side study at farm and processor level)

Research questions
• What is observed market restructuring? What are determinants?
• What are observed marketing choices of farmers? What are determinants?
• What are impacts of market restructuring on farmers?
• What are implications?
• M1: macro/industry survey
• M1: trader survey
• M2: Village + PRA• M3: Household survey
• M3: Household survey
• C1 C3
Survey/data and module

Component 1: Studies of market restructuring
• Centre for Chinese Agricultural Policy• Centre for Management in Agriculture
(CMA), Indian Institute of Management• Centre for Agricultural Policy and
Agribusiness Studies (CAPAS) ofPadjadjaran University
• Secretariat of Agricultural Development, State of Michoacán(SEDAGRO), with RIMISP
• Warsaw University Department of Economics
• University of Pretoria• Economic Research Centre on
Mediterranean Countries with collaboration of MOISA Montpellier
• Farming Systems Association of Zambia
1. Horticulture Markets in China
2. Dairy Markets in India
3. Horticulture Markets in Indonesia
4. Strawberry Markets in Mexico
5. Dairy Markets in Poland
6. Horticulture Markets in South Africa
7. Tomato Markets in Turkey
8. Beef and Chicken Marketsin Zambia

Research underway

Three major sets of hypotheses formulated fromMeso study and theoretical expectations
1) Little penetration into farm level from observed significant changes in downstream.Less penetration may be due to:
• Small land holdings with relatively equal size;• Production largely distributed across space;• Almost no farmer cooperatives;• Cheaper labor cost (small trader);• Food safety demand is still in very initial stage
2) Farmer market choices are significantly affected by:
• Incentive• Risk• Farm Size• Other Assets• Policy shifters• Other shifters• MOthers (IVs-M)

3) Where there is penetration of market restructuring into farm level, the changes in downstream will significantly affect farmers’ marketing channels and the outcome • e.g., Income• Employment• Technology• Others
Three major sets of hypotheses formulated fromMeso study and theoretical expectations

Example: Component 1 in Mexico: Partners
• Government of the State of Michoacán, Secretariat for Agricultural Development
• Union of Strawberry Producers of Michoacán• Michoacán State Council of the Strawberry Industry• Inter-American Institute for Cooperation on
Agriculture• International Center for Tropical Agriculture • Michigan State University• Rimisp-Latin American Center for Rural
Development

Types of producers in Michoacán, Mexico
1996
1. Traditional system
2. Traditional system with higher input use
2006
1. Traditional system– Cost = $7,500/ha– 80% of farmers / 25%
production2. Medium tech system
– Cost = $20,000/ha– 15% of farmers / 40% of
production3. High tech system
– Cost = $45,000/ha– 5% of farmers / 35% of
production


Market channels of Michoacán growers
1. El Crucero – traditional local market2. Wholesalers in Michoacán3. Wholesalers in Mexico City (CEDA DF)4. Agri-processors in Michoacán
– Semi-processors– Frozen strawberries
5. Supermarkets – less than 10 farmers
6. Driscoll’s (USA-based multinational berry marketing corporation)

Productores Grandes• Entre 5 a 20 Ha.• Tecnología de producción:
- Tradicional 2%- Mediana 13%- Alta 85%
• Grandes propietarios• Manejan otros cultivos, muchos fueron
productores de papa antes.• No dependen del cultivo para su medio
de vida, son inversionistas, viven en Zamora.
• Contratan bastante mano de obra.• Mayoría aplican BPA• 5% de la población total de
productores. • Están creciendo en área manejada y
volumen producido.
Plantas madres• Importados desde
EE.UU. (UC Davis, U of Florida)
• Royalties pagados por caja de plantas madre.
• Importadores formales -Eurosemillas, S.A., la Unión Agrícola Regional de Productores de Fresas y Hortalizas del Valle de Zamora, empresas procesadoras.
Productores Medianos• Entre 2 a 4 Ha.• Tecnología de producción:
-Tradicional 80%-Mediana 20%
- Trabaja el productor y su familia en el cultivo y contratan mano de obra adicional.
- Cultivo es importante en su medio de vida pero tiene otros ingresos no agrícolas, viven en el campo o centro poblado.
- Algunos pocos aplican BPA, los que no tienen pozo tienen problemas con la calidad del agua.
- 60% de la población total de productores.
- Su número está estable.
Productores Pequeña Escala• Entre 0.33 a 2 Ha. • 100% de tecnología tradicional de
producción.• Trabaja el productor y su familia,
contratan mano de obra para la cosecha.
• Dependen del cultivo para su medio de vida, vive en el campo.
• Pocos aplicación de BPA, riego rodante de pozo o río, problemas con calidad de agua.
• 35 % de la población total de productores.
• Su número está declinando.
Strawberry value chain in the Zamora Valley, Michoacán
ConsumersInput suplier Producers Fresh market
Precio de CompraUS$ 220 / caja de
1.000 plantas (royalty US$ 150/caja)
Se necesita 2.5 cajas por cada Ha. de fresa
cultivada.Incluyendo flete y
vivero, costo aprox. US$ 1.000/Ha.
Prod
ucci
ón d
e fr
esa
(70,
122
ton
en 2
005)
Supermercados
Tecnología Alta
• 60 a 90 MT Ha.• $ 5 a 7.5 k• 67% export.• 33% industria
20%14,024 MT
50%35,061 MT
30%21,036 MT
Otros insumos• Tiendas de
agroquímicos.• Insumos incluyen:
- Fertilizantes- Plaguicidas- Foliares
• Tecnología- Sistemas de
riego por goteo, fertiriego
- Plástico para acolchado
- Invernaderos
Tecnología tradicional
• 20 a 25 MT Ha.• $ 5.6 a 7 k• 10% export.• 90% industria
Tecnología media
• 35 a 40 MT Ha.• $ 3.75 a 4.29 k• 10% export.• 90% industria
Industria Líder• Agrana, Frexport y
Profusa.• Productos: IQF, bases
para yogurt y mermeladas.
• Procesan entre 10 y 12.000 MT/año c/uno
Processing
Mediana industria “dinámica”
• 9 empresas• Principalmente de capital
familiar.• Fresa congelada en
diversas presentaciones.• Desarrollan nuevos
productos y mercados.
Mediana industria “tradicional”
• 11 empresas• Principalmente de capital
ejidal• Fresa congelada en
diversas presentaciones.• Mercados y productos
tradicionales
Beneficios de fruta (maquilas)
• 5 empresas• Trabajan estrechamente
con industria líder.
Costos• 0.69 p/kilo• 1 p/k admin.• 0.15 a 0.30 ganancia/k
Costos• 4.47 /k procesamiento• Costo final 11.01/k
Mercado externo EUA• Driscoll principalmente.• Ventana de 80 a 90
días, Nov a Feb.• 44 a 55,000 k/diario.
Mercados Mayoristas
• CEDA México• Otros estados de
todo el país.
El Crucero • Mercado informal• Producto no
diferenciado, manejo no sanitario (agua).
• Pago en efectivo• 130,000 k/día
Industria70%
49,085 MT
Distribuidores Nacionales
• Gaitan, Gutiérrez• 65,000 a 97,500 k/día
Procesadores en Irapuato
• Congelador El Niño• Congelador del Río• Duarte• Agriamericana• Mexfruit.
Importación
Fresco30%
21,037 MT
Clientes industriales nacionales
• Yogurt• Galletas• Mermelada• Jugos• Paleterias
Clientes internacionales
• Bases de fresa• Fruta congelada
Brokers EUA• Interamerican
Quality Foods• JSO Associates• Rigby Foods
Otros clientes EUA
100%
80%
Grupo GYC
Export23-28%
4,760 a 5,950 MT
Nacional formal28-42%
5,850 a 8,775 MT Informal35%
7,312 a MT
Líderes53-61%
26 a 30 MT
Dinámica19-21%
9.5 a 10 MT
Tradicional18-28%
9 a 14 MT

Low tech Medium tech High tech
Traditional
Wholesalers
Agriprocessors
Supermarkets
Driscoll’s

Supermarkets
• 1970s-80s– Producers would supply individual stores even within the
same chain• 1980s-90s
– Sourcing from wholesale market– Establishment of more stable relations with some
wholesalers• 2000s
– Four wholesalers supply most of the strawberry in supermarkets: 3 from CEDA-DF and 1 from CEDA-Guadalajara
– Some early examples of direct procurement from producers– Wal-mart sources from Driscoll’s

Regoverning MarketsComponent 2
Julio Berdegue, RIMISPEstelle Bienabe, CIRAD
Lucian Peppelenbos, KIT

Research focusCase study research on innovative practices in connecting small farmers to dynamic markets:• Private business• Collective action• Support agencies• Public policies
To understand:• The keys to inclusion of small farmers• The costs & benefits of inclusion• Lessons to guide policy & practice

First round cases (1/2)
39 proposals from 23 countries; 15 were selected
6 business models:• Carrefour, China, FFV, retail• MAs Foods, Sri Lanka, spices, processing• Haleeb Food, Pakistan, dairy, processing• Thandi, South Africa, FFV/wines, processing• Hortifruti, Honduras, FFV, wholesale• SPAR, South Africa, FFV, retail

First round cases (2/2)
7 collective action:• Ruoheng coop, China, watermelon brand• NorminVeggies, Philippines, FFV• BSUs, Kenya, indigenous vegetables• Morakert, Hungary, FFV• Avium, Hungary, chicken processing• Aj Ticonel, Guatemala, FFV• COPAG, Morrocco, dairy processing
Potato Thailand is difficult to classify; Suguo China is being translated from Chinese

Key insight 1In business model:• Less or no participation of farmers in chain governance• Less or no capacity building beyond production
But...• Low costs of collective action• No evidence of less economic benefits
And:• Capacities acquired by farmers can allow them to go independent • A stable relationship with a market channel is not the end of history for all farmers

Key insight 2In collective action model:• Farmers play a larger role in chain governance• Indirect benefits are larger
But...• Collective action has costs• No evidence of greater net economic benefits
And:• A leadership nucleus with contacts, experience, and information is present in successful cases• Not necessarily in marketing of products

Key insight 3In collective action model:• Dilemma: sustain the inclusion of the organization or that of the members? • Process of farmer exclusion and differentiation
Practical solutions:• Quasi-membership (learning and screening)• Clustering with larger farmers (incentives for the latter are volume and subsidies)

Key insight 4In business model & collective action:• Always mixture with external support and public policies• Hence always an externalization of some costs of the relationship
Receptive business sector
Capacitated farmers
Facilitating policy sector
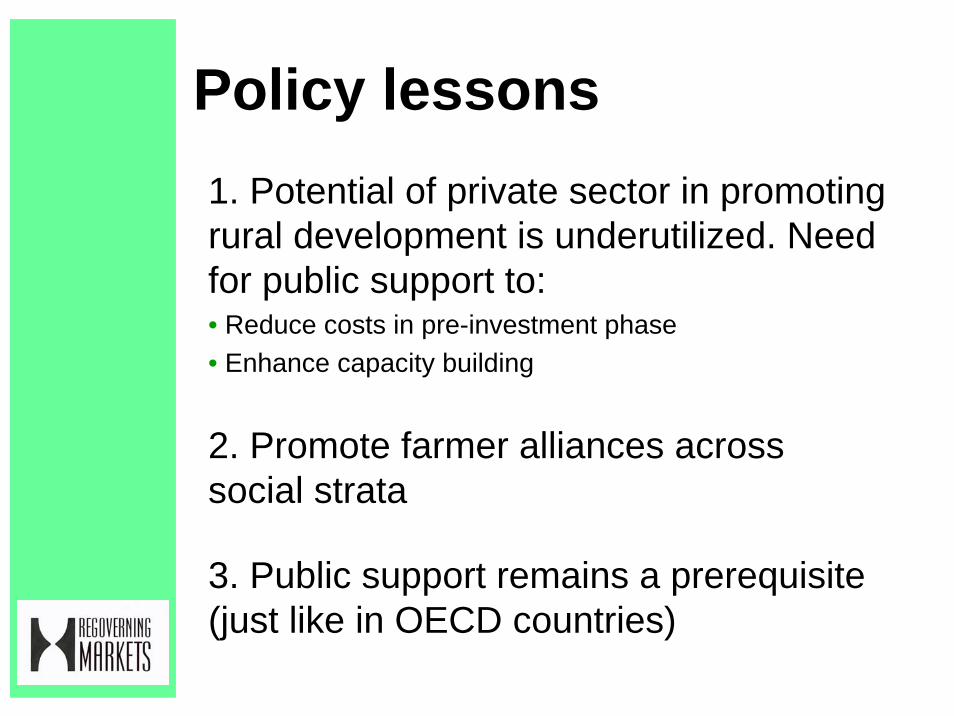
Policy lessons1. Potential of private sector in promoting rural development is underutilized. Need for public support to:• Reduce costs in pre-investment phase• Enhance capacity building
2. Promote farmer alliances across social strata
3. Public support remains a prerequisite (just like in OECD countries)

Program managementLessons first round:• Slim down research framework, define core insights• Improve coaching of the research teams• Harmonize contractual agreements• More emphasis on synthesis & editing
Second round:• Open competitive call • More involvement of partners• 12 empirical case studies & 18 desk studies• Focus on knowledge issues• Closure 26 November; Selection by 18 December;
Research from Jan to June 2007

Focus 2nd round1. Public & private policies for enabling environment
2. Private initiatives without public subsidies; with well-
organized farmers; with a partnership perspective
3. Collective action with successful management of
exclusion; with control over chain governance; without
public subsidies
4. Costs/benefits of exclusion and inclusion
5. Differences between male and female farmers

Policy linkages – mapping and influencing public and private sector policy
Felicity [email protected] 17, 2006

Policy processes at the Centre:Outputs for Regoverning Markets
• Structures and processes for policy dialoguebetween the public sector, private sector and civil society strengthened and supported at national, regional and international levels
• Guidelines for pre-emptive and anticipatory policyand for corrective policy generated and capacity built
• Capacity of direct and indirect stakeholders in the supply chain strengthened and reflecting a willingness to include small-scale supplier

The Regoverning Markets Framework – Links between Components
Footnote: - Component 3
Conceptual Framework
Meta Research
Empirical Research (Component 1)
Innovation and Good Practice
Case Studies (Component 2)
Interactive Learning and Policy Dialogue Processes
at all levels National Regional
International Key stakeholders
Web based portal Capacity Buildingfor country/ regional stakeholders e.g. exchange visits, learning alliances, working meetings
Clear and Useful Information e.g. policy briefs and tools, media materials. Generic papers

Country level: Some Highlights
• Multi-stakeholder Country Reference Groups (eight countries) in place – iterate with the evidence generation processes and involve stakeholders in the process from the outset. Membership of the RG in India:
• Managing Director Haryan Dairy Cooperative• Managing Director Gujarat Cooperative Milk Marketing Federation• Animal Husbandry Commissioner Gov of India• President Indian Dairy Association• Nestle India• Indian Institute of Management – Ahmedabad (ReGov Consortium
member)
• Component 1 macro-meso outputs and the emerging hypothesis for micro studies are important early products for national policy dialogue

Country/regional level: Some Highlights
• Wide range of specific policy focussed actions at regional and country levels
• Multi stakeholder learning groups/fora supported in non C1 countries e.g. Philippines, Pakistan, and Hungary in response to demand. South Asia interest network formed
• Seminars held in C1 and C2 countries to share findings• Linkages formed for joint learning with other donor
programmes and projects e.g. World Bank- SE Asia, MMWP (ADB, DFID) – Vietnam www.market4poor.org
• Regional Initiative for outreach in East Africa – proposed (SIDA)
• Three country scoping papers – Morocco, Egypt, and Jordan – more planned e.g. Russia, Tanzania
• Piloting of the Institutions and Mapping Initiative
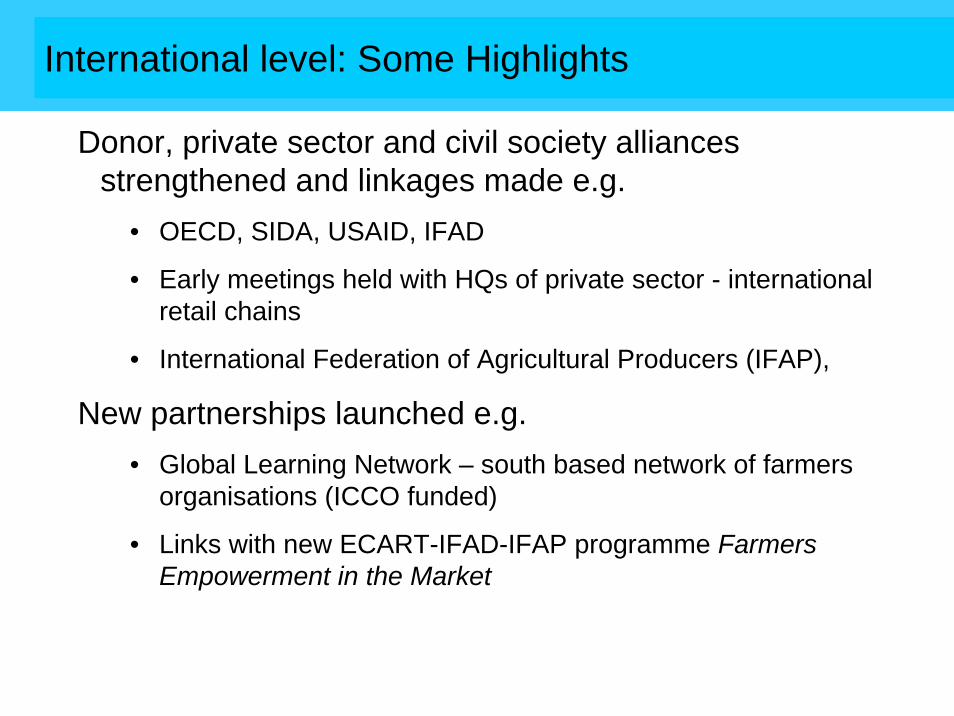
International level: Some Highlights
Donor, private sector and civil society alliances strengthened and linkages made e.g.
• OECD, SIDA, USAID, IFAD
• Early meetings held with HQs of private sector - international retail chains
• International Federation of Agricultural Producers (IFAP),
New partnerships launched e.g.• Global Learning Network – south based network of farmers
organisations (ICCO funded)
• Links with new ECART-IFAD-IFAP programme Farmers Empowerment in the Market

Objectives
Objectives:
• To develop a framework for understanding the institutional and policy dimensions of enabling small-scale producers to secure and enhance better their access to dynamic local and regional markets.
• To provide an approach and set of supportive tools that enables this understanding to be developed and utilised in an interactive way with the key stakeholders in particular identifying entry points for action.
Institutional and Policy Mapping Initiative

Guiding Principles
• Captures and maps dynamics between actors, institutions and markets (value chains)
• Enables active engagement with key stakeholders• Recognises the role of both private sector strategy and
public policy• Simple, practical and cost effective• Builds upon work of C1 – in C1 countries yet able to be
undertaken in non C1 countries• Looks at multiple scenarios and options (recognises
uncertainty)• Identifies ‘Hot spots’ for detailed analysis• Enables monitoring and evaluation of process and
impacts• Realistic about policy influencing
Guiding Principles

Guiding Principles
• Incremental funding secured – USAID and DFID• Process development working meeting – IIED, NRI,
IFPRI, WUR – draft of tool kit (May 2006)• Pilot roll-out Turkey, Indonesia, South Africa (July-
October 2006) with international and national teams and multiple stakeholder groups
• Revision of tool kit (November – December 2006)• Application in four further countries (SE Asia, Mexico,
Morocco and Poland (January – March 2007)• Training of use of tool kit - its instruments and processes
(South Africa and SE Asia – by March 2007)
Institutions and Policy Mapping Initiative - Key actions

Methodology OverviewMapping and Understanding the Value Chain
(functions, actors, influence, product flows)
DriversTrends
Issues and Opportunities
Future Scenarios for Markets and
Inclusion
Options for Greater
Inclusion
Strategies for Supporting
Change
Current structure
How things might change
Arrangements supportive of
inclusion
Influencing actors in the
chain
Current Situation
How things might change
Institutional Implications / requirements
Influencing Institutional
change
Mapping and Understanding the Institutional and Policy Environment(Government policies and laws, business strategies,
cultural influences, informal market relations)
1
3 4
2
5 6
Monitoring and Evaluation
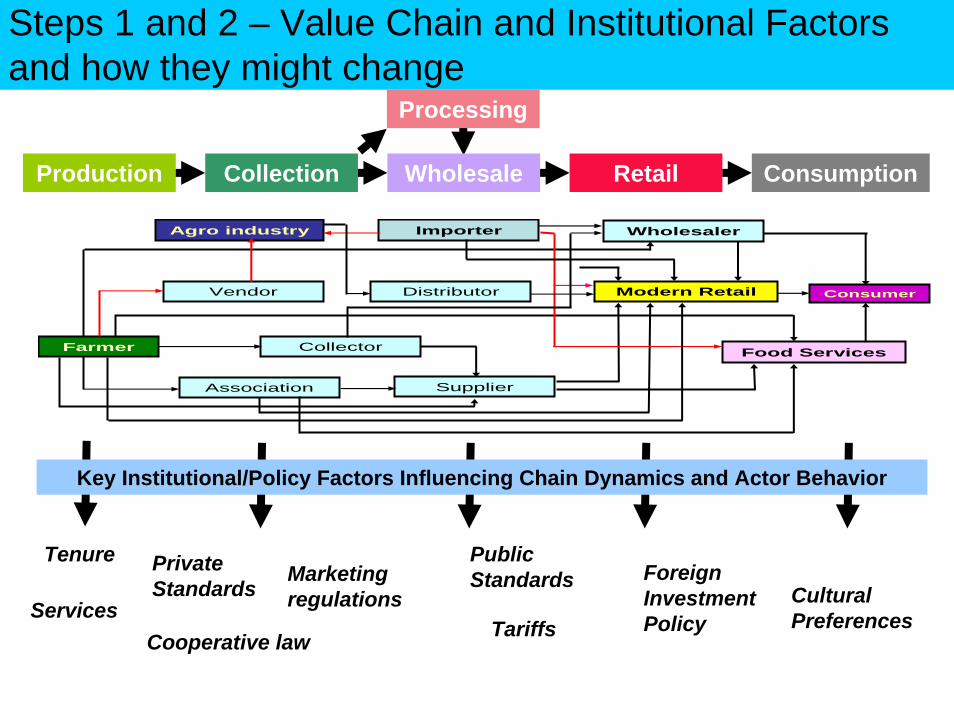
Steps 1 and 2 – Value Chain and Institutional Factors and how they might change
Agro industry
Farmer
Vendor
Association Supplier
Distributor Modern Retail Consumer
Importer Wholesaler
Collector Food Services
Key Institutional/Policy Factors Influencing Chain Dynamics and Actor Behavior
Production WholesaleCollection Retail Consumption
Processing
Tenure Private Standards
Marketing regulationsServices
Tariffs
Public Standards Foreign
InvestmentPolicy
Cultural Preferences
Cooperative law

Consultations in dynamic market environments - Turkey and Indonesia

Guiding Principles
At the Midterm Review • Working paper on M and E shared• Reviewed Logframe Objectives and Goal • Reconfirmed necessary indicators and measures • Discussed means to ensure M and E is fully place• Identified gaps• Reaffirmed the value of M and E as a programme management and
process change tool
At Objective level: many useful and valid indicators and measures (quantitative and qualitative) are embedded within the activity and outcome – the Regov team will capture these and better use the information
At Goal level: the Regov team will secure new indicators and baselines to measure the sought-after public and private sector changes as the programme moves to its next stage of implementation
Monitoring and Evaluation

Drawing together and next steps to early 2008
Bill Vorley

Major Milestones
• 7 March 2007 Narrative and Financial report, including workplan
• September 2007: Synthesis Workshop– 4 days synthesis between and between modules– 1+ days high level policy event
• January 2008: International conference– (1 day) + high level policy event (1 day)
• 7 March 2008 Final report

Requests from Advisory Group
• Strategy and plans for cross-programme analysis, synthesis and integration (including moving policy lessons between countries)
• Communications strategy, including involving the ‘customers’ of the research and ensuring that outputs are usable by business, producer organisations, policy makers
• Strategy for impact post December-07• Decisions on focus of activities, focus of policy
messages, and quality assurance• Additional member of Advisory Group, from food
processing sector

Links between projects
• Tesco and Asda-Wal Mart as global players• Partners for Sustainable Development?
– “.. a cultural divide seems to exist between DFID and the private sector..”
– “opportunity costs associated with participation in policy consultation.. [are] perceived by the private sector as a barrier to their engagement with DFID.”
(International Development Committee)
Links between DFID and the Food Industry
• Regoverning Markets (CRD)• Smallholders, supermarket standards and
horticulture exports from Africa (Policy Division)• Others: Synergies, value addition, fit