
A Study on the Effects of Dimensions of Service Quality on ...
22
Article A Study on the Effects of Dimensions of Service Quality on Customer Satisfaction in the Indian IT Hardware Industry with Special Emphasis on Medium Size B2B Sector P. S. Raychaudhuri* Rahela Farooqi Abstract The study conducted among the information technology users in business organizations in Delhi and NCR, addressed the issues of service quality and its impact on long-term customer satisfaction from an interaction approach and relationship marketing perspective in the medium size B2B sector. The objectives include identification of important customer requirements and service attributes that sig- nify internal processes and customer interaction. It reveals that, service improvements and technical preparedness emerge as new dimensions apart from the applicability of dual aspects of Gronroos’ perceived service quality model—technical and functional dimensions. Keywords Service quality, after-sales service, service improvement, technical preparedness, customer satisfaction, business markets, information technology Introduction The small and medium authorized service providers operate with less overhead expenses, and thus help in reducing the cost and fixed overhead expense of the bigger companies. However, the margin of incen- tives provided by the manufacturing vendors to the service providers is restricted. The falling prices of IT products have put pressure on the manufacturers in terms of having to reduce product design cost and components. It thus affects the product quality and reliability to some extent (Goffins, 2000). This in turn is leading to more demand of after-sales service calls to the authorized franchisees that are already under the pressure of rising operational costs and meagre profit margins. They have to combine and manage P. S. Raychaudhuri is Assistant Professor at Department of Management, Jamia Hamdard University, New Delhi, India. E-mail: [email protected] Rahela Farooqi is Associate Professor at Centre for Management Studies, Jamia Millia Islamia University, New Delhi, India. E-mail: [email protected] Global Business Review 14(3) 507–527 © 2013 IMI SAGE Publications Los Angeles, London, New Delhi, Singapore, Washington DC DOI: 10.1177/0972150913496883 http://gbr.sagepub.com * Authors are thankful to the anonymous referees of the journal for their useful comments in an earlier draft of the article. Usual disclaimers apply. at PENNSYLVANIA STATE UNIV on September 12, 2016 gbr.sagepub.com Downloaded from
-
Upload
khangminh22 -
Category
Documents
-
view
1 -
download
0
Transcript of A Study on the Effects of Dimensions of Service Quality on ...
Military-Madrasa-Mullah Complex 507
India Quarterly, 66, 2 (2010): 133–149
A Global Threat 507Article
A Study on the Effects of Dimensions of Service Quality on Customer Satisfaction in the Indian It Hardware Industry with Special Emphasis on Medium Size B2B Sector
P. S. Raychaudhuri*Rahela Farooqi
AbstractThe study conducted among the information technology users in business organizations in Delhi and NCR, addressed the issues of service quality and its impact on long-term customer satisfaction from an interaction approach and relationship marketing perspective in the medium size B2B sector. The objectives include identification of important customer requirements and service attributes that sig-nify internal processes and customer interaction. It reveals that, service improvements and technical preparedness emerge as new dimensions apart from the applicability of dual aspects of Gronroos’ perceived service quality model—technical and functional dimensions.
KeywordsService quality, after-sales service, service improvement, technical preparedness, customer satisfaction, business markets, information technology
Introduction
The small and medium authorized service providers operate with less overhead expenses, and thus help in reducing the cost and fixed overhead expense of the bigger companies. However, the margin of incen-tives provided by the manufacturing vendors to the service providers is restricted. The falling prices of IT products have put pressure on the manufacturers in terms of having to reduce product design cost and components. It thus affects the product quality and reliability to some extent (Goffins, 2000). This in turn is leading to more demand of after-sales service calls to the authorized franchisees that are already under the pressure of rising operational costs and meagre profit margins. They have to combine and manage
P. S. Raychaudhuri is Assistant Professor at Department of Management, Jamia Hamdard University, New Delhi, India. E-mail: [email protected] Farooqi is Associate Professor at Centre for Management Studies, Jamia Millia Islamia University, New Delhi, India. E-mail: [email protected]
Global Business Review14(3) 507–527
© 2013 IMISAGE Publications
Los Angeles, London,New Delhi, Singapore,
Washington DCDOI: 10.1177/0972150913496883
http://gbr.sagepub.com
* Authors are thankful to the anonymous referees of the journal for their useful comments in an earlier draft of the article. Usual disclaimers apply.
at PENNSYLVANIA STATE UNIV on September 12, 2016gbr.sagepub.comDownloaded from
Global Business Review, 14, 3 (2013): 507–527
508 P. S. Raychaudhuri and Rahela Farooqi
their human and physical resources (Brogowicz et al., 1990), including manpower, sales and service training needs, employee attrition, sales competition, outstanding client payments, spare parts availabil-ity, and cash-flow, to provide service to their customers in a satisfactory manner. So far research has not focused on the impact of all the preceding issues and above concern areas on determination of service quality and customer satisfaction provided by these ‘last mile’ small players that would help reduce the ‘total cost of ownership’ in the Indian IT hardware industry!
Review of Literature
In industrial and business markets, service is associated with an interaction with the product itself, as well as service firm’s personnel, anything that increases the value of the products to buyers (Singh, 1990).
Service enhancing the core offering and value creation is becoming an important criterion in the business-to-business markets (Gronroos, 2000). This value creation helps him to distinguish between different service providers offering products with similar features and that too, with short product life cycles, i.e., computer systems. The organizational buyers are much more concerned with service aspects of the product they buy, than a typical consumer (Reid and Plank, 2004). This service aspect also has a prominent impact in creating customer satisfaction among the industrial clients than the actual core offering e.g., in computer systems and software (Chumpitaz et al., 2004).
The computer systems are durable products that have a longer usage period unlike consumer products (Walter et al., 2000). The customers require regular interaction with the service provider for technical support, training, updates and a host of services during usage period from them. They also need to cover the bigger perceived risk of business customers arising out of non-homogeneity of service offerings in technology-oriented firms (Zeithaml et al., 1996; Gronroos, 2000). These service providers need to cre-ate trust and confidence among the customers through regular interactions and a sense of preparedness (Walter et al., 2000). It also helps to create customized solutions for the clients (Rossomme, 2003). Therefore, service quality is dependent upon the sequence of episodes based on interaction process; however empirical research addressing service quality from these multiple perspectives and interaction process is sparse (Svensson, 2003; Storbacka et al., 1994).
The study of service quality dimensions in business markets have been largely based on either Gronroos (1984, 1988) model of technical and functional service quality (Homburg and Garbe, 1999; Szmigin, 1993) or Parasuraman et al. (1988) model of Servqual dimensions (Bienstock et al., 1997; Mehta and Durvasula, 1998; Peterson et al., 2005; Powers, 1988). Both the models were initially pro-posed for service quality study in consumer markets. The following research issues and gaps could be identified as shortcomings of the past research.
Gronroos, 1984, identified three components of service quality, namely: technical quality; functional quality and image. However, this model does not explain how to formulate and measure the impact of technical and functional quality.
According to the Gap Analysis model and subsequent SERVQUAL model (Parasuraman et al., 1985, 1988), the service quality is a function of difference between perception and expectation. The model does not provide clear method for measurement of service gaps at different attribute levels. The model also does not mention any means to improve over these service gaps, if any.
at PENNSYLVANIA STATE UNIV on September 12, 2016gbr.sagepub.comDownloaded from
Global Business Review, 14, 3 (2013): 507–527
A Study on the Effects of Dimensions of Service Quality on Customer Satisfaction 509
Cronin and Taylor (1992, 1994) argued that service quality is like an attitude and developed SERVPERF in place of SERVQUAL, where service quality is evaluated by perceptions only, without expectations. They mentioned that service quality is an antecedent of customer satisfaction, which may have a better effect on purchase intentions than service quality. However the authors could not establish a quantitative relationship between service quality and consumer satisfaction.
Only limited work has been done to demonstrate causal nature of relationship between service quality and customer satisfaction in the industrial/business markets for information technology, both across the globe (Bolton et al., 2008; Chumpitaz et al., 2004; Gremeler et al., 1996; Sharma et al., 1999; Zeithaml et al., 1996) and in India (Rao and Krishna Mohan, 2005). However, no work till date seems to have been done to establish service quality dimensions from an interactive perspective of measuring satisfaction at each service attribute gap items and by grouping the relevant items into dimensions!
In the operational context, the customer satisfaction and service quality measurement should result in quality improvements (Rust et al., 1995). The expectancy-disconfirmation process in customer satisfac-tion helps to directly compare customer’s perception of service provider’s performance with his prior predictive expectation of the service. While computed difference of perception of service performance minus the ideal expectation of the service explains the service quality gap (Oliver, 1993).
The Return on Quality (ROQ) approach (Rust et al., 1995) structures the customer satisfaction questionnaire based on the satisfaction scale around each business process attribute, helping manage-ment specify the managerial processes and sub-processes (attributes), where service quality improve-ment efforts will have greatest impact on customer satisfaction and retention. However, the model was applied in a limited way only to the housekeeping service process of a national hotel chain in U.S. There is a scope that the model could be implemented with an expectancy-disconfirmation scale for better results.
Some researchers who have worked from the perspective of interaction and relationship approach leading to customer satisfaction in business markets (Chumpitaz et al., 2004; Gounaris, 2005; Rao et al., 2005; Rauyreun et al., 2007; Rossomme, 2003; Sharma et al., 1999; Stanworth et al., 2008; Storbacka et al., 1994; Svensson, 2003; Walter et al., 2000; Wilson, 1995; Woo and Ennew, 2005) did not investigate the nature of determinants of service quality construct taking into account both tangible and intangible core offerings together, which could lead to satisfaction (Zolkiewski et al., 2007). This aspect is more relevant in our case for computer systems hardware and supporting service solutions; how do the service providers manage their human and physical resources to deliver service, maintain satisfied customers, contain operational costs and manage achievable profit margins for sustained business growth? They have to manage different resources including manpower, sales and service training needs, employee attrition, sales competition, outstanding client payments, spare parts availability, cash-flow and yet pro-vide service to their customers in a satisfactory manner.
Objectives of the Study
The emerging research issues and gaps lead us in formulating the objectives. The objectives include,
(a) Identification of more relevant and appropriate group of customer service requirements and attribute items as valid and service interactive sub-processes in post-purchase stage;
at PENNSYLVANIA STATE UNIV on September 12, 2016gbr.sagepub.comDownloaded from
Global Business Review, 14, 3 (2013): 507–527
510 P. S. Raychaudhuri and Rahela Farooqi
(b) We also need to explore as to how service quality construct can be conceptualized and defined in terms of more appropriate groups of relevant dimensions that can be measured, in the field of IT hardware industry signifying service interactions, improvements and preparedness!
(c) The final objective of the study is to examine the linkages and strength of association between the after-sales service quality dimensions as predictor variables and overall customer satisfaction as dependent variable, and thus construct a model to understand the individual dimensional impact on customer satisfaction and their implications.
We develop a field applicable empirical model built on a theoretical and conceptual framework of dimensions of after-sales service quality based on interactive and relationship marketing approach and their impact on customer satisfaction in the Indian IT hardware industry. It starts with the conceptu-alization of various influencing factors and issues of different business process and sub-process of after-sales service quality, its customization and customer satisfaction in a broad framework. It leads to identification of the appropriate and relevant service attribute items that serve the above approach at detailed managerial sub-process level and help to conceptualize the after-sales service quality construct. A scale instrument is designed to measure user perception and attitude towards the attribute items. In order to measure the after-sales service quality, the measured perception of satisfaction, for individual attributes, are then grouped into relevant dimensions through exploratory factor analysis. These dimen-sions are analyzed as regards to their constituent items and implications. The scale development process is evaluated for different tests of validity. Then these dimensions are implemented as independent predictor variables in a regression model where customer satisfaction is dependent on those variables as an outcome variable. The effect of these predictor variables are analyzed and discussed on the busi-ness implication of satisfaction, i.e., ‘low total cost of ownership’, which is applied in this model as a surrogate for customer satisfaction.
theoretical Framework
The above objectives guide us to explore further about the base for theoretical and conceptual framework issues relating to the service attribute items. As the customer demand increased, IT industry grew and expanded. But there were also, more competitors and service providers. In the field of IT products, stand-ardization of components has reduced differences between the product features of the final hardware offered by the different global/domestic manufacturers in India. The customers had a wider choice to compare and expect, and became more demanding on price negotiations and after-sales service quality (Dataquest, 2003–2011). The fall in prices had an impact on product design and reliability. It is a critical task to satisfy the customers, in a given cost of operation and budget for the small service firms who are essentially entrepreneurial in nature.
And coupled with this, product obsolescence and technology advancement in the IT field calls for regular technical updating and training for the employees of the service organizations, who interacted with the customers. With thin and lean organization structure, each of the small players strive to get a footing in their own niche client segment through developing relationship contacts, marketing interac-tions, trained manpower, technical trainings to employees and clients as well. The intense competition and small operating margins limit their efforts. The ways to sustain and grow is to improve employees’
at PENNSYLVANIA STATE UNIV on September 12, 2016gbr.sagepub.comDownloaded from

Global Business Review, 14, 3 (2013): 507–527
A Study on the Effects of Dimensions of Service Quality on Customer Satisfaction 511
productivity by making both sales and service manpower more technically prepared and this in turn would help in service improvements.1 Interestingly, the factors may enhance service quality and lead to better customer satisfaction and loyalty. The following issues emerged:
(a) Issues on service improvements included factor items like front office’s complaint registering and handling process, front line engineers, fault diagnosis capability, technical specialist for backup and training, problem resolution time, operational efficiency, response times, spares arrival time;
(b) Issues on service performance and delivery consisted of factors like proactive technical support process, trained in new technology products, machine installation process, spares availability, spares management process, service recovery, consistent service team with trained members;
(c) Issues on service competitiveness/technical preparedness covered factors like technical compe-tence, technical preparedness, managerial interaction with the customers, training to customers, problem handling capability, manpower requirements, competitive standards, service employee empowerment, logistics and information support, understanding and implementing customers’ feedbacks; and
(d) Issues on service behavioural skills contained items like attitude and courteousness of the serv-ice people, listening to understand customer’s individual call problems, assuring customers of timely response and solutions etc.
Figure 1. The Framework for Interaction of Proposed Dimensions of After-Sales Service Quality and Customer Satisfaction
Source: Based on literature review, discussion and interviews with customers and service providers.
at PENNSYLVANIA STATE UNIV on September 12, 2016gbr.sagepub.comDownloaded from

Global Business Review, 14, 3 (2013): 507–527
512 P. S. Raychaudhuri and Rahela Farooqi
Determinant Items of Service Quality and Satisfaction
The different influencing factors and issues discussed above provided the lead for variables and concep-tualization of multiple items relating to customer requirements of different attributes of after-sales serv-ice and their practice gaps. These issues related to industry oriented operational aspects of service quality namely, service delivery, service improvements, service competitiveness, service recovery, service train-ing, service spares management, service employee attitude and behaviour and customer interactions as part of relationship service variables.
Methodology
Data Source
About twenty-five authorized dealers/resellers in Delhi/National Capital Region were conveniently cho-sen from the list of various trade journals like Dataquest, DQ Channels, and websites of computer com-panies in India. However, three small and medium entrepreneurial organizations among the authorized service providers came forward to share their client list, for the study. Each of them gave a list compris-ing of big and small clients based on convenience and judgmental sampling technique.
Sampling Plan and Technique
The sampling frame consisted of clients as business organizations, institutions and retail organizations in and around Delhi/NCR region, with large and small computer installations. The sampling unit was an individual client, which belonged to various industry segments like professional service firms, market and business research firms, travel consultancy, garment export, software design, hospitality, food and beverage, data centre/BPO, equipment manufacturing, electronic manufacturing, news media, agricul-tural cold storage and distribution etc. The respondents were IT in-charge or IT head.
The sampling unit consisted of big and small clients. Our three service providers categorized big customers as those who gave them business worth more than ` 1 million each every year. About 20 per cent to 30 per cent customers of service firm were big customers, and rests were small clients or retail customers. Finally, a sample of 130-client organizations (from the customer lists of the three service provider firms) participated in the final round of research questionnaire and interview. The responses of 117 respondents were found useable.
Sample Size
As has been suggested by Kerlinger (1978), Hair et al. (1998, 2006), the sample size should be at least 10 times the number of items/variables for factor analysis; but for larger number of items, this may be reduced to five (Ibid). Therefore, in the present study a sample of valid 117 respondents fulfils the crite-ria for a 23-item refined questionnaire.
at PENNSYLVANIA STATE UNIV on September 12, 2016gbr.sagepub.comDownloaded from
Global Business Review, 14, 3 (2013): 507–527
A Study on the Effects of Dimensions of Service Quality on Customer Satisfaction 513
Scale Development
Carman (1990) suggested that each service industry might reveal different and unique dimensions. He suggested that if a factor is particularly important to the customers, it may break down into sub-dimensions, and these sub-dimensions or items around business process or sub-process should be assessed separately. The study involved a quantitative assessment through questionnaire-based survey of the business customers and face-to-face in depth interview that led to do qualitative analysis of clients’ feedbacks. The conceptual framework and one questionnaire (for the customer’s perception feelings of satisfaction) were developed after extensive literature review and professional industry consultations.
Generation of Scale Items and their Content Validity
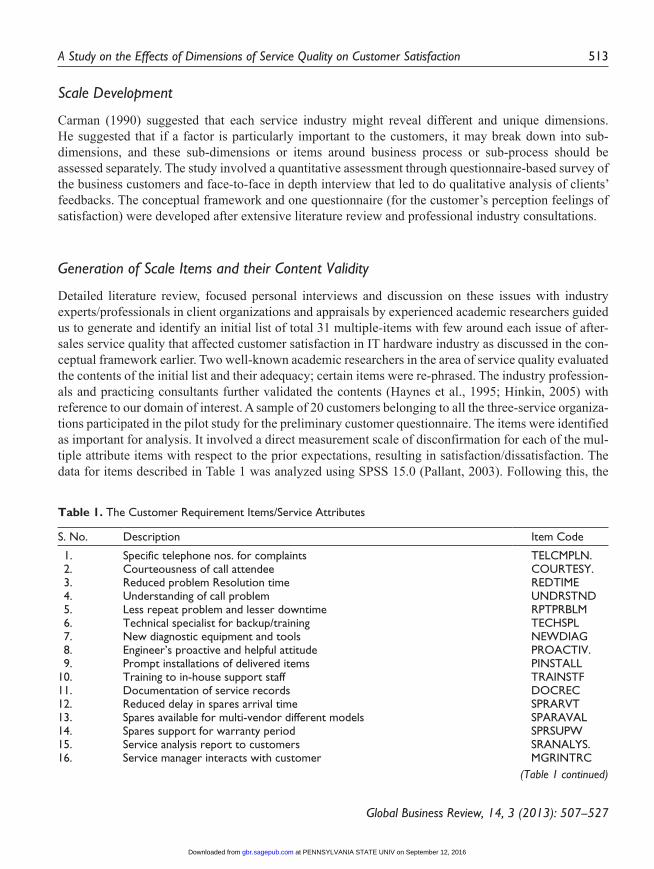
Detailed literature review, focused personal interviews and discussion on these issues with industry experts/professionals in client organizations and appraisals by experienced academic researchers guided us to generate and identify an initial list of total 31 multiple-items with few around each issue of after-sales service quality that affected customer satisfaction in IT hardware industry as discussed in the con-ceptual framework earlier. Two well-known academic researchers in the area of service quality evaluated the contents of the initial list and their adequacy; certain items were re-phrased. The industry profession-als and practicing consultants further validated the contents (Haynes et al., 1995; Hinkin, 2005) with reference to our domain of interest. A sample of 20 customers belonging to all the three-service organiza-tions participated in the pilot study for the preliminary customer questionnaire. The items were identified as important for analysis. It involved a direct measurement scale of disconfirmation for each of the mul-tiple attribute items with respect to the prior expectations, resulting in satisfaction/dissatisfaction. The data for items described in Table 1 was analyzed using SPSS 15.0 (Pallant, 2003). Following this, the
table 1. The Customer Requirement Items/Service Attributes
S. No. Description Item Code
1. Specific telephone nos. for complaints TELCMPLN. 2. Courteousness of call attendee COURTESY. 3. Reduced problem Resolution time REDTIME 4. Understanding of call problem UNDRSTND 5. Less repeat problem and lesser downtime RPTPRBLM 6. Technical specialist for backup/training TECHSPL 7. New diagnostic equipment and tools NEWDIAG 8. Engineer’s proactive and helpful attitude PROACTIV. 9. Prompt installations of delivered items PINSTALL10. Training to in-house support staff TRAINSTF11. Documentation of service records DOCREC12. Reduced delay in spares arrival time SPRARVT13. Spares available for multi-vendor different models SPARAVAL14. Spares support for warranty period SPRSUPW15. Service analysis report to customers SRANALYS.16. Service manager interacts with customer MGRINTRC
(Table 1 continued)
at PENNSYLVANIA STATE UNIV on September 12, 2016gbr.sagepub.comDownloaded from

Global Business Review, 14, 3 (2013): 507–527
514 P. S. Raychaudhuri and Rahela Farooqi
S. No. Description Item Code
17. Customer/meet/seminar/tech. literature CUSTTNFO18. Effective service agreements and acceptable prices SRVPRICE19. Online support by web and telephone ONLINSUP.20. Arrange critical spares, if it fails to arrive CRSPARE21. Arrange alternative, if required engineer fails to reach ALTENGR.22. Prompt backup machines, if delivered ones failed BAKUPMC23. Ability to identify and fix server/network problem FIXPROBM24. Availability of a consistent service team SERVTEAM25. Coordinate for multi-vendor equipments/total solutions TOTALSOL26. Trained on newer technology/other vendor machines TRAINEDN27. Undertakes feedback/survey to understand your priorities FDBKSRVY28. Implement feedbacks to improve service/products IMPLMNT29. Updates information on newer technology/other query UPDTINFO30. Provide up-gradation/migration to newer products/applications UPGRADE31. Assist you to keep total cost of ownership, lower [overall
satisfaction-criterion variable]LOWTCO
Source: Based on literature review, discussion and interviews with customers and service providers.
(Table 1 continued)
questionnaire was refined with tests of internal consistency of the scale (where items have high and acceptable mean scores values around 3.0, where item-total correlation > 0.4, and where Cronbach’s alpha coefficient of scale reliability > 0.7) and adapted with reduced but more appropriate 23 multiple-items in the final version for the main field study.
Scale Selection
We need to develop a scale that can measure all of them. We use direct attitude measurement based on expectancy-disconfirmation scale for individual’s perception of satisfaction/dissatisfaction feelings on each service requirement attribute/item. Thus we can measure the service quality gap across each item, which depicts a business sub-process. This was necessary since computed difference of service quality gap score has limitations regarding reliability (Babukus and Boller, 1992; Carman, 1990; Cronin and Taylor, 1992). This led them to recommend direct attitude measurement of disconfirmation with respect to the prior expectations, a comparison implicitly done mentally, resulting in satisfaction in a semantic differential scale of the type ‘Much more than expected’, ‘More than expected’, ‘Same as expected’, ‘Less than expected’ to ‘Much less than expected’ as descriptors with a continuous equal interval scale numbered 5 (for most positive descriptor) to 1 (for most negative descriptor) respectively (Babakus et al., 1992; Carman, 1990; Cronin and Taylor, 1992; Oliver, 1980; Rust et al., 1995). The respondents had to describe one of these perceptions against each of the customer requirement item mentioned in Table 1. This could give more accurate and direct results for improvements in those attributes with lower mean scores, taking into account that respondents would be more cautious in expressing their percep-tions after considering improvements of the service gaps at different internal process/item levels of the service provider company (Oliver, 1993; Friedman and Amoo, 1999). In a sense, it measures the perception of satisfaction across each attribute arising out of the service gaps in each of them!
at PENNSYLVANIA STATE UNIV on September 12, 2016gbr.sagepub.comDownloaded from

Global Business Review, 14, 3 (2013): 507–527
A Study on the Effects of Dimensions of Service Quality on Customer Satisfaction 515
Scale Measure Refinement
The perception measurement of the items with the survey instrument helps to refine and judge the inter-nal consistency of the scale.
The items had acceptable mean score values of nearly around 3.0; the expectancy-disconfirmation scale is expected to yield lower mean scores, as discussed earlier. The item-to-total correlation is high (> = 0.4) in most of the cases, thereby showing good construct validity, in terms of grouping them into factors/dimensions of service quality (Gliem and Gliem, 2003; Nargundkar, 2008; Nunnally and Bernstein, 1994). Only in the case of two items MGRINTRC and SERVTEAM, item-total correlation is less than 0.4, the alpha coefficient does not increase for SERVTEAM and it also does not increase significantly for MGRINTRC. Hence, both of them are retained. However, some other researchers have also suggested this criterion at < 0.3 (Ferketich, 1991; Hanna et al., 2007).
The result of inter-item correlation matrix shows that LOWTCO has positive correlation (0.29 to 0.68, significant at p < 0.01 level) with all items, thereby exhibiting a criterion—related validity. Therefore, we retain these 23-items in the refined scale as valid, relevant and identifiable items to meas-ure satisfaction at the attribute level arising out of each service gap.
table 2. Multiple–Item Service Attributes Measure of Customer’s Perception of Satisfaction for the Customer Requirements, (Field Sample, N = 117)
S.NO.
Customer Requirements/Service Attributes Mean Std. Dev.
Corr. Item-to-total Correlation
Alpha if Item Deleted
1 Telcmpln 3.10 0.71 .4229 .9182 2. Courtesy 3.15 0.77 .5753 .9154 3. Understnd 2.92 0.83 .4801 .9174 4. Redtime 2.71 0.78 .6635 .9136 5. Rptprblm 2.84 0.77 .6000 .9149 6. Techspl 2.87 0.68 .6003 .9151 7. Proactiv 3.20 0.56 .5283 .9165 8. Pinstall 3.00 0.82 .5890 .9151 9. Trainstf 2.58 0.84 .5332 .916310 Spararvt 2.74 0.90 .5347 .916511. Sparsupw 3.02 0.73 .5522 .915912. Mgrintrc 2.43 0.95 .3782 .920413. Srvprice 3.00 0.75 .4539 .917714. Crspare 2.84 0.73 .6129 .914715. Altengnr 2.82 0.71 .6078 .914916. Bakupmc 2.69 0.75 .7033 .912917. Servteam 2.76 0.48 .3798 .918718. Totalsol 2.84 0.66 .6235 .914719. TrainedN 2.66 0.52 .4374 .917920. Fdbksrvy 2.33 0.83 .5927 .915021. Implmnt 2.41 0.81 .6721 .913422. Updtinfo 2.46 0.78 .5414 .916123. Lowtco 2.53 0.71 .6928 .9133
Source: Researcher’s primary survey.Note: Alpha coefficient = 0.9192.
at PENNSYLVANIA STATE UNIV on September 12, 2016gbr.sagepub.comDownloaded from

Global Business Review, 14, 3 (2013): 507–527
516 P. S. Raychaudhuri and Rahela Farooqi
Following this result about the measure of satisfaction perception on each of the multiple item, we observe that there is a need to focus and quickly improve upon certain items like FDBKSRVY, IMPLMNT, UPDTINFO and MGRINTRC, which has bigger service gaps and hence lower mean scores than 2.5. The other items like TRAINEDN, TRAINSTF, SERVTEAM, BAKUPMC, SPARARVT and REDTIME have comparatively better mean scores though less than 3.0; they should be monitored and steadily improved, and maintained. The other items are near to the satisfaction score of 3.0 where service gaps are almost non-existent. These measures would help raise the mean score of criterion item of satisfaction, LOWTCO. Further, exploratory factor analysis is carried out to group the items into constructs/dimensions.
Construct Validity—Grouping the items into Dimensions—Exploratory Factor Analysis
The exploratory factor analysis was applied to reduce and group/summarize the 22-items (keeping aside the ‘LOWTCO’ item as the dependent variable item) into smaller sets of linear components that retained most of the information in the original dataset. In the initial testing of KMO measure of sampling ade-quacy, the value of 0.734 is obtained; and in Bartlett’s test of sphericity, value of 890.874 is obtained, significant at P 0.000 level. This is meritoriously appropriate and validates the suitability for factor analysis (Hair et al., 2006).
All the extracted items had communalities greater than 0.5 to 0.828 and it indicated a good data set, for the given sample size of N = 117 as useable observations. The Principal component analysis with Varimax rotated component matrix (converged in six rotations) was applied to derive the factor loadings and subsequent groupings.
Items with factor loadings of 0.50 or higher were grouped together to form separate constructs/dimen-sions as recommended by Hair et al. (2006) for a sample size of more than 100. The items that cross-loaded with value greater than 0.5 or more on two or more factors were dropped; the item SRVPRICE was a loaded single-item factor, which may be weak and unstable, and hence it was also dropped (Costello and Osborne, 2005). The reduced dataset resulted into four factors comprising of 14-items (Nargundkar, 2008; Hair et al., 2006).
Analysis of Dimensions
Factor 1 has five items with fairly high loadings of 0.629 to 0.826. Factor 2 contains four items with equally high loadings of 0.687 to 0.863. Factor 3 has three items with fairly high loadings of 0.741 to 0.804. The last one, factor 4 has only two items. Though it may not be a strong factor (Costello and Osborne, 2005), the high loadings of 0.847 and 0.787 in items suggest it to be a consistent and stable factor. Each factor with eigenvalue of more than 1.0 was considered and cumulatively, all four of them explained 71.453 per cent of total variance. The whole scale reliability coefficient of Cronbach’s Alpha was calculated to be 0.8792, which is reasonably good (Nunnally and Bernstein, 1994; Gliem and Gliem, 2003).
1. F1: SERVPERF– After sales service performance. This speaks of service delivery and outcome. The different aspects of service are included: service recovery and job done (ALTENGNR),
at PENNSYLVANIA STATE UNIV on September 12, 2016gbr.sagepub.comDownloaded from

Global Business Review, 14, 3 (2013): 507–527
A Study on the Effects of Dimensions of Service Quality on Customer Satisfaction 517
technical and commercial interaction (UPDTINFO), spares management (CRSPARE), trained service personnel with less attrition rate-consistent team (SERVTEAM) and engineers trained on evolving new technologies in IT field (TRAINEDN).
2. F2: SERVIMPR- Service Improvements. This corresponds to larger effectiveness in service in terms of better competence (TECHSPL), quicker problem resolution with reduced time (REDTIME), more reliable solution with lesser repeat problem, thereby reducing the downtime of machine (RPTPRBLM), and quicker arrangement of repair spares requirement (SPARARVT).
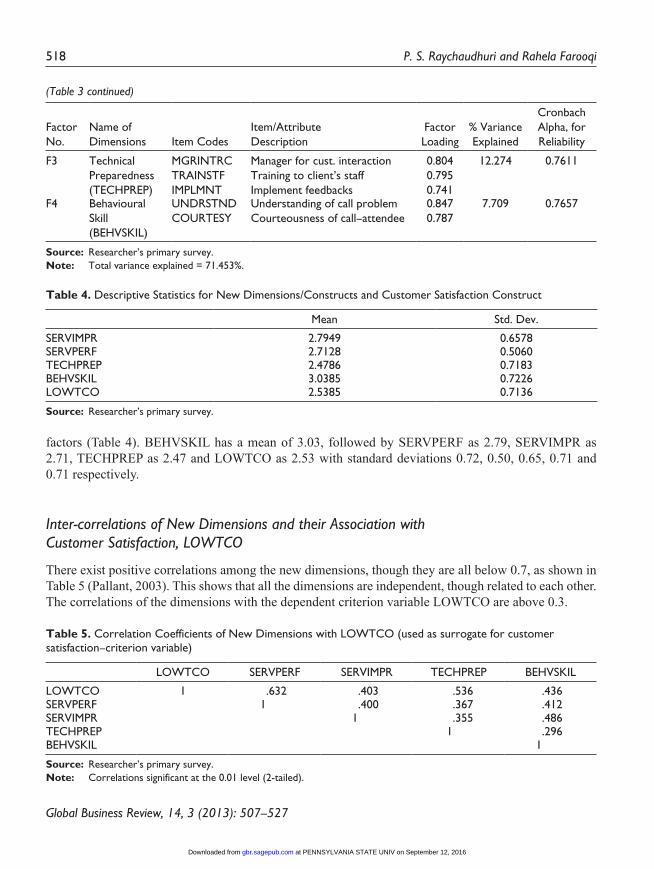
3. F3: TECHPREP-Technical Preparedness. This relates to technical robustness of the team, that helps create confidence in the client’s mind, and hence creates an opportunity for deeper techni-cal relationships and more sales order/repeat order. This pertains to maintaining technical and functional relationship with the clients, company attention and focus on potential requirements, good technical sales presentation and solution to client requirements (MGRINTRC), providing training to clients’ staff (TRAINSTF) and effectively able to implement client’s feedbacks and suggestions (IMPLMNT). It also includes that sales and service personnel keep themselves updated on new products and technologies and accordingly inform clients.
4. F4: BEHVSKIL- Behavioural skill. This construct portrays the behavioural aspect of the service personnel, either offline over phone/mail or in person face to face. It involves courteousness and empathy to understand customer’s problem distinctively and provide him with objective and responsive solution, in terms of hardware repairs, information, query or training related issues.
Variance of each Dimension and Reliability
All the four factors explain 71.4 per cent variance, with SERVPERF explaining the major share of vari-ance with 37.7 per cent, followed by SERVIMPR (13.6 per cent), TECH PREP (12.2 per cent) and BEHVSKIL (7.7 per cent). The Cronbach’s alpha reliability coefficients for each sub-scale factors have been shown in Table 3. All the above details help to support the construct validity of the scale.
The calculated average score for each construct, after grouping of items under each factor provides sufficient and credible support for them in terms of customers’ perception and choice of these latent
table 3. Naming of Factors
Factor No.
Name of Dimensions Item Codes
Item/Attribute Description
FactorLoading
% Variance Explained
Cronbach Alpha, for Reliability
F1 After-Sales service performance (SERVPERF)
ALTENGNRUPDTINFOCRSPARESERVTEAMTRAINEDN
Arrange Alternative engineerUpdates info on tech/queryArrange critical sparesConsistent service teamTrained on newer technology
0.8260.7720.7210.7060.689
37.774 0.8254
F2 ServiceImprovements(SERVIMPR)
TECHSPLRED TIMERPTPRBLMSPRARVT
Technical specialist backup.Reduced problem resol. timeLess repeat problem/downtimeReduced delay for spares arrival
0.8630.8090.7950.687
13.697 0.8514
(Table 3 continued)
at PENNSYLVANIA STATE UNIV on September 12, 2016gbr.sagepub.comDownloaded from
Global Business Review, 14, 3 (2013): 507–527
518 P. S. Raychaudhuri and Rahela Farooqi
table 4. Descriptive Statistics for New Dimensions/Constructs and Customer Satisfaction Construct
Mean Std. Dev.
SERVIMPR 2.7949 0.6578SERVPERF 2.7128 0.5060TECHPREP 2.4786 0.7183BEHVSKIL 3.0385 0.7226LOWTCO 2.5385 0.7136
Source: Researcher’s primary survey.
Factor No.
Name of Dimensions Item Codes
Item/Attribute Description
FactorLoading
% Variance Explained
Cronbach Alpha, for Reliability
F3 TechnicalPreparedness(TECHPREP)
MGRINTRCTRAINSTFIMPLMNT
Manager for cust. interactionTraining to client’s staffImplement feedbacks
0.8040.7950.741
12.274 0.7611
F4 BehaviouralSkill(BEHVSKIL)
UNDRSTNDCOURTESY
Understanding of call problemCourteousness of call–attendee
0.8470.787
7.709 0.7657
Source: Researcher’s primary survey.Note: Total variance explained = 71.453%.
(Table 3 continued)
factors (Table 4). BEHVSKIL has a mean of 3.03, followed by SERVPERF as 2.79, SERVIMPR as 2.71, TECHPREP as 2.47 and LOWTCO as 2.53 with standard deviations 0.72, 0.50, 0.65, 0.71 and 0.71 respectively.
Inter-correlations of New Dimensions and their Association with Customer Satisfaction, LOWTCO
There exist positive correlations among the new dimensions, though they are all below 0.7, as shown in Table 5 (Pallant, 2003). This shows that all the dimensions are independent, though related to each other. The correlations of the dimensions with the dependent criterion variable LOWTCO are above 0.3.
table 5. Correlation Coefficients of New Dimensions with LOWTCO (used as surrogate for customer satisfaction–criterion variable)
LOWTCO SERVPERF SERVIMPR TECHPREP BEHVSKIL
LOWTCO 1 .632 .403 .536 .436SERVPERF 1 .400 .367 .412SERVIMPR 1 .355 .486TECHPREP 1 .296BEHVSKIL 1
Source: Researcher’s primary survey.Note: Correlations significant at the 0.01 level (2-tailed).
at PENNSYLVANIA STATE UNIV on September 12, 2016gbr.sagepub.comDownloaded from

Global Business Review, 14, 3 (2013): 507–527
A Study on the Effects of Dimensions of Service Quality on Customer Satisfaction 519
Convergent Validity
It was observed that correlation among the dimensions ranges from 0.296 to 0.486. Besides, each dimension is correlated with the overall measure of LOWTCO with coefficients ranging from 0.403 to 0.632, which is moderate to high correlation. Convergent validity refers to degree of agreement between two or measures within the same construct. All the items within each factor exhibited fairly high correla-tion coefficient in the inter-correlation matrix of the finally extracted 14-items, four factors/dimensions and LOWTCO—overall satisfaction taken together. For first factor within item correlations ranged from 0.41 to 0.83, for the second factor,0.40 to 0.71, for the third factor, 0.47 to 0.58 and fourth factor, 0.62 existed; all the within factor correlation were greater than 0.42 and significantly different from 0 (P < 0.01) and all convergent on a common construct/variable, LOWTCO. These measures demonstrated adequate convergent validity (Campbell and Fiske, 1959).
Criterion-related Validity
This implies that a measuring instrument is consistent and agrees with independent measures of the same construct (Bailey and Pearson, 1983). To establish such validity, it was decided to look into the correla-tion between individual 14-items and their corresponding criterion summary construct/dimensions respectively and also with the overall measure, LOWTCO. The correlations are positive and significant at P < 0.01 levels. The correlations ranged from 0.41 to 0.90, which are considered fairly moderate to high correlations. These results suggest that the individual items are valid.
Model Selection
We consider the five variables multiple linear regression model with one dependent variable (Y) and four independent variables (x1, x2, x3 and x4) expected to be related to ‘Y’ and expected to explain or predict ‘Y’ (Roy et al., 2011). The regression function may be written as:
Y = a + b1.x1 + b2.x2 + b3.x3 + b4.x4
Where ‘Y’ is the dependent variable (or, regressed) representing LOWTCO—‘low total cost of own-ership’ as the customer satisfaction,
‘a’ is the constant or the intercept term,
x 1 is the independent variable (or, regressor) representing SERVPERF, after-sales service performance,
x 2 is the independent variable (or, regressor) representing SERVIMPR, service improvements,
x 3 is the independent variable (or, regressor) representing TECHPREP, technical preparedness,
x 4 is the independent variable (or, regressor) representing BEHVSKIL, behavioural skill.
at PENNSYLVANIA STATE UNIV on September 12, 2016gbr.sagepub.comDownloaded from

Global Business Review, 14, 3 (2013): 507–527
520 P. S. Raychaudhuri and Rahela Farooqi
The constant ‘a’ is the intercept term, which gives the mean or average effect on ‘y’ of all the variables excluded from the model. The coefficients b1, b2, b3 and b4 are called the partial regression or partial slope coefficients; b1 measures the change in the mean value of ‘y’, per unit change in x1, holding x2, x3 and x4 constant. Similarly b2 measures the change in mean value of ‘y’, per unit change in x2, holding x1, x3 and x4 constant. Likewise b3 and b4 measures the mean value of ‘y’, per unit change of each corresponding variable x3 and x4 respectively, holding the other variables constant.
Analysis
Thus, from Table 5 (Correlation coefficients of new dimensions with LOWTCO) it is observed that LOWTCO has a positive correlation of 0.632 with SERVPERF (after-sales service performance) and also has a positive correlation of 0.403 with SERVIMPR (service-improvements) respectively. Similarly, it is observed that LOWTCO has a positive correlation of 0.536 with TECHPREP (technical preparedness) and it also has a positive correlation of 0.136 with BEHVSKIL (Behavioural skill).
Therefore, it is possible to study and understand the positive linkage between the customer requirement dimensions (of service quality) and overall customer satisfaction. We apply the multiple linear regression model, which measures the strength of the association/linkage between the customer requirements (service quality) dimensions as predictor (independent) variables and overall customer satisfaction as the dependent variable.
Table 6 depicts that multiple correlation coefficient (R) is 0.726. The R2, regression coefficient for the model (0.527) accounts for 52.7 per cent of variability in the outcome of customer satisfaction,
table 6. Summary of Regression Analysis with SERVPERF, SERVIMPR, TECHPREP and BEHVSKIL as Predictors–Independent Variables, and LOWTCO as Customer Satisfaction (Overall criterion measure–as Dependent variable)
Criterion/PredictorsLOWTCO
‘b’Sig. level
‘g’‘t’
Value R R2 Adjusted R2
0.726 0.527 0.510SERVPERF(Std. b coeff.)
0.441 0.000 5.816
SERVIMPR(Std. b coeff.)
0.125 0.051 2.025
TECHPREP(Std. b coeff. )
0.316 0.000 4.373
BEHVSKIL(Std. b coeff. )Constant
0.138
B = –0.481
0.019
0.020
2.125
–2.186F-value 31.88 0.000 df = 112
Source: Researcher’s primary survey.Notes: R-Multiple correlation coefficient between impendent variables and dependent variable. R2 is the coefficient of determination; shows variance in the outcome of the dependent variable accounted for by the
predictor-independent variables.
at PENNSYLVANIA STATE UNIV on September 12, 2016gbr.sagepub.comDownloaded from

Global Business Review, 14, 3 (2013): 507–527
A Study on the Effects of Dimensions of Service Quality on Customer Satisfaction 521
LOWTCO by all the four-predictor (independent) variables, namely SERVPERF, SERVIMPR, TECHPREP and BEHVSKIL. R2, the regression coefficient is sufficiently high for the given sample size of 117 cases and the four independent variables (Hair et al., 2006) at the significance level < 0.001. This determines the strength of association.
It may be also observed that the difference between R2 and Adjusted R2 is small (0.527 – 0.510 = 0.017 or 1.7 per cent), thereby implying that this model is fairly generalizable to a population.
The F-statistic of 31.88 of significance level of 0.000 indicates that the independent variables have significant influence on the dependent variable, LOWTCO at significance level of 0.05. The standardized beta coefficient, β shows that SERVPERF (0.441) has the largest influence on customer satisfaction, followed by TECHPREP (0.316), BEHVSKIL (0.138) and SERVIMPR (0.125) at the end.
The extent of influence of SERVPERF (0.441) is predominantly large, compared to smaller beta value of 0.125 for the SERVIMPR. The customers primarily look for technical support performance and delivery from service providers; though the issue of service improvement remains important. SERVIMPR is important and becomes noticeable, once the customer becomes satisfied and the cost of ownership becomes within acceptable norms with good service performance.
The standardized beta coefficient determines the extent of influence of TECHPREP (0.316) is more compared to beta coefficient value of 0.138 for the BEHVSKIL. In the technology-oriented field of information technology and computers, customers appreciate technical preparedness and the confident nature of service/sales personnel in solving their requirements, which are largely technical in nature, whether it is an existing installation or a proposed project requirement for purchase. They also give due importance to the mannerism and good behavioural aspects of the service people. Both the dimensions define an approach for interactions with the customer—it may be termed as a kind of interaction quality. These dimensions may be interpreted in the light of the fact that in the interview discussions, customers have emphasized on regular interaction as means to know and evaluate vendor’s strengths, experiences and weaknesses.
This leads us to understand that SERVPERF, technical service performance delivery and TECHPREP, technical interactions lead to customer satisfaction and confidence; and have the greater impact on their perception and buying decisions.
Though, BEHVSKIL and SERVIMPR have lower beta coefficient, they are still important for the customers. Once the other two variables are satisfactory, then BEHVSKIL and SERVIMPR become the screening criteria, for further evaluation of the service provider/vendor. A negative value of –0.481 for the constant (intercept) term signifies negative satisfaction or dissatisfaction for the dependent variable, LOWTCO in the absence or exclusion of any of these dimensions (e.g., zero value for the factors) of service quality. Thus, the model equation appears as:
LOWTCO = Constt. + β1 SERVIMPR + β2 SERVPERF + β3 TECHPREP + β4 BEHVSKIL
Where β are the respective standardized beta coefficients as given in Table 6. Service Improvement is important and becomes noticeable, once the customer becomes satisfied and the cost of ownership becomes within acceptable norms with good service performance. The concept of service improvement has been formed with distinct efforts.
at PENNSYLVANIA STATE UNIV on September 12, 2016gbr.sagepub.comDownloaded from
Global Business Review, 14, 3 (2013): 507–527
522 P. S. Raychaudhuri and Rahela Farooqi
Conclusion
An attempt to understand customer satisfaction in the business markets of information technology indus-try in India was explored in the context of small service providers, in terms of detailed service attribute items that consisted of both tangible and intangible offerings. The impact of the resulting dimensions of service quality on customer satisfaction has been analyzed with the help of multiple linear regression model that helps to understand the satisfaction/dissatisfaction process in business organizations where customer plays an active role.
The study of customer service requirement at attribute level as designed in the questionnaire on serv-ice attributes serves as a diagnostic tool, to understand deeply about the service gaps, if any and uncover customer dissatisfaction. In fact, the expectancy-disconfirmation scale makes the response more prudent and accurate.
In the present study, an effort has been made to explore the ‘Service Improvement’ dimension. at managerial sub-process level. These items could be quantified and measured on time response and effec-tiveness aspects. The dimension of ‘Technical Preparedness’ is an outcome of interactive ability that combines training, technical skill and behavioural traits. It helps to project a good image of the firm, creates confidence and trust in the customer’s mind. It helps personnel to be effective, acceptable and convincing, whether one is on a service call or sales call or for techno-commercial negotiations.
Therefore, these four dimensions of after-sales service quality namely; after-sales service perform-ance (equivalent to technical quality), service improvements, technical preparedness, and behavioural skills (equivalent to functional quality) can now be measured in terms of customer perceptions on the constituent items. If it is compared with Perceived service quality model of Gronroos (1988), this study helps to establish two new dimensions of service quality – that is, service improvements and technical preparedness.
Significance of the Emerging Dimensions in Business-marketing Context
The IT and computer products technology have become increasingly similar with the ushering in of open architecture in the desktop/laptop/server segments under the guidance of Intel Corporation, USA and Microsoft Corporation, USA. Therefore, protecting satisfied customer base, along with attracting new customers became increasingly important with increased supply of essentially similar products and services (Berry, 1983; Gronroos, 1994; Storbacka et al., 1994).
Hence in the industrial and business markets, relationship marketing based on interactions, confi-dence building measures, developing bonds and networking through referrals and contacts have become dominant for the suppliers and service providers in order to develop a long-term buyer-seller relation-ship. Particularly in high technology areas like computers, technical training (both for service personnel and clients) have become crucial to sustain the competitiveness in this market along with close interac-tion to support customized requirements of the different clients.
Effective interactions with customers and training for service personnel, as well as clients play a dominant role in defining the dimensions SERVPERF, SERVIMPR, TECHPREP and BEHVSKIL, which extensively impacts customer satisfaction. The concept of service improvement, SERVIMPR con-sist of items based on time parameters, which could be saved in the interest of customers e.g., REDTIME, RPTPRBLM and SPARARVT.
at PENNSYLVANIA STATE UNIV on September 12, 2016gbr.sagepub.comDownloaded from
Global Business Review, 14, 3 (2013): 507–527
A Study on the Effects of Dimensions of Service Quality on Customer Satisfaction 523
Relevance for Managerial Practice
The study also highlighted the importance of service as a focus area when bundled with box hardware products like some standard models of the computer brands. The service firms’ effort is directed towards solution and services offerings that integrates directly into day-to-day core business process, e.g., restau-rant billing and display system, project supply chain inventory system, software project management system, manufacturing inventory and dispatch system etc. Along with satisfaction, the bundling of solu-tions and service with products yields better revenue margins for the service providers.
The four dimensions of after-sales service quality have focused the need for further service improvements and technical preparedness. It calls for getting acquainted with new products, features and functionality in an effective manner. It also stipulates that service/sales personnel should periodically interact with clients and their employees. This makes them more transparent. The technical training is required to keep oneself updated with knowledge and field service issues. The customer is able to understand the vendor’s strength, weaknesses and experiences. This helps the customer to trust the service provider.
Limitations of the Study
Further research is needed to validate and generalize these results in broader settings at national and international level with bigger service firms in business markets. One needs to mention at this point that assumption of linear model of regression may be an oversimplification of possible curvilinear nature of relationship that may exist between the variables.
It should be acknowledged that present research design used sampling based on convenience, and this type of sampling according to Churchill (1979) can be applied when the emphasis is on exploratory research.
The smaller sample size of the customers in business markets is due to the fact that industrial market-ers have fewer customers than consumer markets (Rossomme, 2003). Therefore, in business market this sample size may be considered as fairly adequate (Tikkanen et al., 2000). It took four to five days of coordination to meet an organizational customer and complete the survey. It may be possible that smaller sample size could have affected the precision of analysis.
Note1. For details see: (Beinstock et al., 1997; Bolton et al., 2008; Chase et al., 1992; Chumpitaz et al., 2004; Gummesson,
1978, 1993; Rust et al., 1995; Walter et al., 2000; Zeithaml et al., 1993); service performance and delivery (Banwet and Datta, 2000; Brady and Cronin, 2001; Brogowicz et al., 1990; Chase and Bowen, 1988; Chumpitaz et al., 2004; Cronin and Taylor, 1992; Donaldson, 1994; Garvin, 1988; Gronroos, 1983,2000; Gummesson, 1978, 1993; Heskett, 1986, 2006; Homburg et al., 1999; Lovelock, 1983; Oliver, 1993; Parasuraman et al., 1985; Rao and Krishna Mohan, 2005; Rossomme, 2003; Rust and Oliver, 1994; Schemenner, 1986 1993; Parasuraman et al., 1988; Seshadri et al., 1988; Sharma et al., 1999; Stanworth et al., 2008); service competitiveness/technical preparedness (Anderson et al., 1997; Chase and Hayes, 1992; Gounaris, 2005; Gummesson, 1978; Lehtinen et al., 1985; Lovelock, 2004; McCluskey, 2004; Parasuraman, 2000, Qualls et al., 1995; Rauyreun et al., 2007; Seshadri et al., 1988; Stanworth et al., 2008; Strobacka et al., 1994; Svensson, 2003; Walter et al., 2000; Wilson, 1995; Zolkiewski et al., 2007); effective service behavioural skills and customer interactions (Banwet and
at PENNSYLVANIA STATE UNIV on September 12, 2016gbr.sagepub.comDownloaded from

Global Business Review, 14, 3 (2013): 507–527
524 P. S. Raychaudhuri and Rahela Farooqi
Datta, 2002; Chase and Bowen, 1988; Chumpitaz et al., 2004; Gronroos, 1984; Haywood-Farmer, 1988; Homburg et al., 1999; Norman, 1991; Parasuraman et al., 1985; Stanworth et al., 2008; Sureshcander et al., 2001), organi-zational strategy, relationship marketing efforts and outcomes.
ReferencesAnderson, E.W., & Sullivan, M.W. (1993). The antecedents and consequences of customer satisfaction for firms.
Marketing Science, 12(2), 125–143.Anderson, E.W., Fornell, C., & Rust, R.T. (1997). Customer satisfaction, productivity and profitability: Differences
between goods and service. Marketing Service, 16(2), 129–145.Babakus, E., & Boller, G.W. (1992). An empirical assessment of the SERVQUAL scale. Journal of Business
Research, 24(3), 253–268.Babakus, E. & Mangold, W. Glynn. (1992). Adapting SERVQUAL scale to hospital services: An empirical investi-
gation. Health Service Research, 26(6), 769–786.Bailey, J.E., & Pearson, S.W. (1983). Development of a tool for measuring and analyzing computer user satisfaction.
Management Science, 29(5), 530–545.Banwet, D.K., & Datta, B. (2000). Effect of service quality on post–visit intentions: The case of a computer center.
Vikalpa, 25(3), 49–55.Berry, L.L., & Parasuraman, A. (1997). Listening to the customer–The concept of service–Quality information sys-
tem. Sloan Management Review, 38(3), Spring, 65–76.Bienstock, C.C., Mantzer, J.T., & Bird, M.M. (1997). Measuring physical distribution service quality. Academy of
Marketing Science Journal, 25(1), 31–44.Bolton, R.N., Lemon, K.N., & Verhoef, P.C. (2008). Expanding business-to-business customer relationships:
Modelling the customer upgrade decision. Journal of Marketing, 72(1), 46–64.Brady, M.K., & Cronin Jr, J.J. (2001). Some new thoughts on conceptualizing perceived service quality: A hierarchi-
cal approach. Journal of Marketing, 65(3), 34–49.Brogowicz, A.A., Delene, L.M., & Lyth, D.M. (1990). A synthesized service quality model with managerial implica-
tions. International Journal of Service Industry Management, 1(1), 27–45.Campbell, D.T., & Fiske, D.W. (1959). Convergent and discriminant validation by the multitrait-multimethod
matrix. Psychological Bulletin, 56(2), 81–105.Carman, J.M. (1990). Customer perception of service quality: An assessment of the SERVQUAL dimensions.
Journal of Retailing, 66(1), 33–35.Chase, R.B., & Bowen, D.A. (1988). Service quality and service delivery system: A diagnostic framework. Paper
presented in Quality in Service conference, Karlstad, Sweden.Chase, R.B., & Hayes, R.B. (1992). Applying operations strategy to service firms. In T.A. Swartz, D.E. Bowen and
S.W. Brown, (Eds) Advances in Service Marketing and Management, Vol.1, (pp. 53–74). Greenwich, CT: Jai Press Inc.
Chumpitaz, R., & Paparoidamis, N.G. (2004). Service quality and marketing performance in business-to-business markets: Exploring the mediating role of client satisfaction. Managing Service Quality, 14(2/3), 235–248.
Churchill, G.A. (1979). A paradigm for developing better measures of marketing constructs. Journal of Marketing Research, 16(1), 66–73.
Costello, A.B., & Osborne, J.W. (2005). Best practices in exploratory factor analysis: Four recommendations for getting the most from your analysis. Practical Assessment, Research & Evaluation, 10(7), 1–9.
Cronbach, L.J. (1951). Coefficient alpha and the internal structure of tests. Psychometrika, 16(3), 297–334.Cronin, J.J., & Taylor, S.A. (1992). Measuring service quality: A reexamination and extension. Journal of Marketing,
56(3), 55–68.Dataquest issues (2003–2011). Customer satisfaction audit reports. Delhi-Gurgaon: Cybermedia publications.
Accessed at http://dqindia.ciol.com in May–June 2009, September 2010, September 2011.
at PENNSYLVANIA STATE UNIV on September 12, 2016gbr.sagepub.comDownloaded from

Global Business Review, 14, 3 (2013): 507–527
A Study on the Effects of Dimensions of Service Quality on Customer Satisfaction 525
Donaldson, B. (1994). Supplier selection criteria on the service dimension. European Journal of Purchasing and Supply Management, 1(4), 209–217.
Ferketich, S. (1991). Focus on psychometrics: Aspects of item analysis. Research in Nursing & Health, 14(2), 165–168.
Friedman, H.H., & Amoo, T. (1999). Rating the rating scales. Journal of Marketing Management, 9(3), 114–123.Garvin, David .A. (1988). Managing quality. New York: Free Press.Gliem, J.A. & Gliem, R.R. (2003). Calculating, interpreting and reporting Cronbach’s alpha reliability coefficient
for Likert–type scales. Paper presented as proceedings at Midwest Research to Practice Conference in Adult, Continuing, and Community Education, The Ohio State University, Ohio, October, 82–88.
Goffins, Keith. (2000). Design for supportability: Essential components of a new product development. Research Technology Management, 43(2), 40–48.
Gounaris, S. (2005). Trust and commitment influences on customer retention: Insight from business-to-business services. Journal of Business Research, 58(2), 126–140.
Gremler, D.D., & Brown, S.W. (1996). Service loyalty: its nature, importance and implications. In Bo Edvardsson, Stephen W. Brown, Robert Johnston, & Eberhard E. Scheuing (Eds.), Advancing service quality: A global perspective (pp.171–180). International Service Quality Association.
Gronroos, C. (1984). A service quality model and its marketing implications. European Journal of Marketing, 18(4), 36–44.
———. (1988). Service quality: The six criteria of good perceived service quality. Review of Business, 9(3), 10–13.———. (1994). From Marketing Mix to Relationship Marketing: Towards a Paradigm Shift in Marketing.
Management Decision, 32(2), 4–20.———. (2000). Service management and marketing—A customer relationship management approach, 2ed.
England: John Wiley & Sons Ltd.Gummesson, E. (1978). Towards a theory of professional services marketing. Industrial Marketing Management,
7(2), 89–95.———. (1993). Quality management in service organizations. New York: International Service Quality Association.Hair, J.F., & Anderson, Rolph E. (1998). Multivariate data analysis. NJ: Prentice-Hall.———. (2006). Multivariate data analysis, (6th ed). New Delhi, India: Pearson Education.Hanna, K.M., Di Meglio, L.A., & Fortenberry, J.D. (2007). Initial testing of scales measuring parent and adoles-
cent perceptions of adolescents’ assumption of diabetes management. Journal of Pediatric Psychology, 32(3), 245–249.
Haywood–Farmer, J. (1988). A conceptual model of service quality. International Journal of Operations and Productions Management, 8(6), 19–29.
Heskett, J.L. (2006). Strategic service management: Examining and understanding it. In W.J. Glynn and J.G. Barnes (Ed.), Understanding services management (pp. 449–473). New Delhi: Prentice Hall of India.
Homburg, C., & Garbe, B. (1999). Towards an improved understanding of industrial services: Quality dimensions and their impact on buyer-seller relationships. Journal of Business-to-Business Marketing, 6(2), 39–72.
Kerlinger, F.N. (1978). Foundations of behavioural research. USA: McGraw-Hill.Lehtinen, J.R. (1985). Improving service quality by analyzing the service production process. In C. Gronroos &
E. Gummesson (Eds.), Service marketing-nordic school perspectives (pp. 110–119). Stockholm, Sweden: University of Stockholm, Department of Business Administration.
Lovelock, C.L. (1983). Classifying service to gain strategic marketing insights. Journal of Marketing, 47(3), 9–20.Lovelock, C., & Wirtz, J. (2004). Services marketing-People, technology, strategy (5th ed.). New Delhi: Pearson
Education, India.Mehta, S.C., & Druvasula, S. (1998). Relationships between SERVQUAL dimensions and organizational perform-
ance in the case of a business-to-business service. Journal of Business and Industrial Marketing, 13(1), 40–53.McCluskey, M. (2004). How mature is your service operation? Supply Chain Management Review, 8(5), 17–20.
at PENNSYLVANIA STATE UNIV on September 12, 2016gbr.sagepub.comDownloaded from

Global Business Review, 14, 3 (2013): 507–527
526 P. S. Raychaudhuri and Rahela Farooqi
Nargundkar, R. (2008). Marketing research: Text and cases, (3rd ed.). New Delhi: Tata McGraw Hill.Normann, R. (1991). Service management: Strategy and leadership in service business, 2ed. Chichester, England:
John Wiley & Sons Ltd.Nunnally, J.C., & Bernstein, I.H. (1994). Psychometric theory, (3rd ed.). New York: McGraw-Hill.Oliver, R.L. (1980). A cognitive model of the antecedents and consequences of satisfaction decisions. Journal of
Marketing Research, 17(4), 460–469.———. (1993). A conceptual model of service quality and service satisfaction: Compatible goals, different con-
cepts. In T.A. Swartz, D.E. Bowen and S.W. Brown, (Eds), Advances in services Marketing and Management (pp. 65–85), Volume 2. Greenwich, CT: Jai Press Inc.
Owlia, M.S., & Aspinwall, E.M. (1998). A framework for measuring quality in engineering education. Total Quality Management, 9(6), 501–518.
Pallant, J. (2003). SPSS Survival manual. Philadelphia, USA: Open University Press, McGraw Hill Education.Parasuraman, A. (1998). Customer service in business-to-business markets: An agenda for future research. Journal
of Business & Industrial Marketing, 13, 309–321.———. (2000). Superior customer service and marketing excellence: Two sides of the same coin. Vikalpa, 25(3),
3–14.Parasuraman, A., & Zeithaml, V.A. (1983). Differential perceptions of suppliers and clients of industrial services. In
L.L.Berry, G.L. Shostack, & G.D. Upah (Eds.), Emerging perspectives on services marketing. Chicago, Illinois: American Marketing Association.
Parasuraman, A., Zeithaml, V.A., & Berry, L.L. (1985). A conceptual model of service quality and its implication for future research. Journal of Marketing, 49(4), 41–50.
Peterson, M., Gregory, G. & Munch, J.M. (2005). Comparing US and European perspectives in B2B repair service quality of mission-critical equipment. International Marketing Review, 22(3), 353–368.
Powers, T.L. (1988). Identify and fulfill customer service expectations. Industrial Marketing Management, 17(4), 273–276.
Qualls, W.J., & Rosa, J. (1995). Assessing industrial buyers’ perception of quality and their effects on satisfaction. Industrial Marketing Management, 24(5), 359–368.
Rao, P.P., & Krishna Mohan, K.V.S. (2005). Marketing of maintenance service in Indian IT: Changing customer needs and expectations. The ICFAI Journal of Services Marketing, III(3), 43–50.
Rauyruen, P., & Miller, K.E. (2007). Relationship quality as a predictor of B2B customer loyalty. Journal of Business Research, 9(4), 312–326.
Reid, D.A., & Plank, R.E. (2004). Fundamentals of business marketing research. NY: Best Business Books, The Haworth Press Inc.
Rossomme, J. (2003). Customer satisfaction measuring in business-to-business context: A conceptual framework. Journal of Business and Industrial Marketing, 18(2), 179–195.
Roy, Rajib, Bhattacharya, A.K., & Sengupta, P.P. (2011). A comparative study of customer satisfaction between two Indian retail brands. Global Business Review, 12(2), 331–342.
Rust, R.T., Zahorik, A.J., & Keiningham, T.L. (1999). Service marketing (1st Indian Reprint). New York/Singapore: Addison Wesley Longman Inc.
———. (1995). Return on quality (ROQ): Making service quality financially accountable. Journal of Marketing, 59(April), 58–70.
Sabharwal, N., & Soch, H. (2011). Confirmatory factor analysis of determinants of service recovery. Global Business Review, 12(2), 297–314.
Sarkar, R., & Baisya, R.K. (2005). Some aspects of market dynamics and customer satisfaction in the Indian domes-tic airlines sector. Global Business Review, 6(1), 113–124.
Schmenner, R.W. (2004). Service business and productivity. Decision Sciences, 35(3), 333–347.Seshadri, T.V., & Kinra. N. (1988). Marketing a computer system: Implications of the buyers’ decision process.
Vikalpa, (Jan 1988), 13(1), 25–32.
at PENNSYLVANIA STATE UNIV on September 12, 2016gbr.sagepub.comDownloaded from
Global Business Review, 14, 3 (2013): 507–527
A Study on the Effects of Dimensions of Service Quality on Customer Satisfaction 527
Sharma, S., Niedrich, R.W., & Dobbins, G. (1999). A framework for monitoring customer satisfaction: an empirical illustration. Industrial Marketing Management, 28(3), 231–243.
Singh, M.P. (1990). Services as a marketing strategy: A case study at Reliance Electric. Industrial Marketing Management, 19(3), 193–200.
Stanworth, J.O., & Baillargeon, S.M. (2008). B2B relationships: Satisfiers and dissatisfiers of American & Canadian SMEs in deep partnerships. Proceedings of International Research Seminar on Service Management, AIX Graduate School of Management, Paul Cezanne University, France, May, 2008.
Storbacka, K., Strandvik, T., & Gronroos, C. (1994). Managing customer relationships for profit: The dynamics of relationship quality. International Journal of Service Industry Management, 5(3), 21–38.
Sureshchandar, G.S., Rajendran, C., & Kamalanabhan, T.J. (2001). Customer perceptions of service quality: A cri-tique. Total Quality Management, 12(1), 111–124.
Svensson, G. (2003). A generic conceptual framework of interactive service quality. Managing Service Quality, 13(4), 267–275.
Szmigin, I.T.D. (1993). Managing quality in business-to-business services. European Journal of Marketing, 27(1), 5–21.
Tikkanen, H., Alajoutsijarvi, K., & Tahtinen, J. (2000). The concept of satisfaction in industrial markets: A contex-tual perspective and a case study from the software industry. Industrial Marketing Management, 29(4), 373–386.
Walter, A., Muller, T.A., & Helfert, G. (2000). The impact of satisfaction, trust and relationship value on com-mitment: Theoretical considerations and empirical results. 16th Annual IMP Conference, Bath, England, September 7–9, 2000.
Wilson, D.T. (1995). An integrated model of buyer-seller relationships. Journal of the Academy of Marketing Science, 23, 335–345.
Zeithaml, V.A., Berry, L.L., & Parasuraman, A. (1996). The behavioural consequences of service quality. Journal of Marketing, 60(2), 31–46.
Zeithaml, V.A., Bitner, M.J., Gremler, D.D., & Pandit, A. (2008). Services marketing: Intergrating customer focus across the firm, (4ed.). New Delhi: Tata McGraw-Hill.
Zolkiewski, J., & Lewis, B. (2007). The assessment of customer service in business–to-business relationships. Journal of Service Marketing, 21(5), 313–325.
at PENNSYLVANIA STATE UNIV on September 12, 2016gbr.sagepub.comDownloaded from

at PENNSYLVANIA STATE UNIV on September 12, 2016gbr.sagepub.comDownloaded from