a study on financial analysis of nestle india pvt. ltd for past five ...
72
“A STUDY ON FINANCIAL ANALYSIS OF NESTLE INDIA PVT. LTD FOR PAST FIVE YEARS” Project Report submitted to UNIVERSITY OF CALICUT In partial fulfillment of the requirement for the award of the degree of BACHELOR OF COMMERCE (PROFESSIONAL) Submitted by SHYAMILY K.S (CCASBCP039) Under the supervision of Asst. Prof. PRASSY VISWAMBHARAN DEPARTMENT OF COMMERCE CHRIST COLLEGE (AUTONOMOUS), IRINJALAKUDA MARCH 2021
-
Upload
khangminh22 -
Category
Documents
-
view
0 -
download
0
Transcript of a study on financial analysis of nestle india pvt. ltd for past five ...

“A STUDY ON FINANCIAL ANALYSIS OF NESTLE INDIA
PVT. LTD FOR PAST FIVE YEARS”
Project Report submitted to
UNIVERSITY OF CALICUT
In partial fulfillment of the requirement for the award of the degree of
BACHELOR OF COMMERCE (PROFESSIONAL)
Submitted by
SHYAMILY K.S
(CCASBCP039)
Under the supervision of
Asst. Prof. PRASSY VISWAMBHARAN
DEPARTMENT OF COMMERCE
CHRIST COLLEGE (AUTONOMOUS), IRINJALAKUDA
MARCH 2021

CHRIST COLLEGE (AUTONOMOUS), IRINJALAKUDA
CALICUT UNIVERSITY
DEPARTMENT OF COMMERCE
CERTIFICATE
This is to certify that the project report entitled “A STUDY ON
FINANCIAL ANALYSIS OF NESTLE INDIA PVT. LTD FOR
PAST FIVE YEARS” is a bonafide record of project done by SHYAMILY
K.S, Reg. No. CCASBCP039, under my guidance and supervision in partial
fulfillment of the requirement for the award of the degree of BACHELOR OF
COMMERCE (PROFESSIONAL) and it has not previously formed the basis for
any Degree, Diploma and Associateship or Fellowship.
PROF. K.O.FRANCIS Asst. prof. PRASSY VISWAMBHARAN
Co-ordinator Project Guide

DECLARATION
I, SHYAMILY K.S, hereby declare that the project work entitled
“A STUDY ON FINANCIAL ANANLYSIS OF NESTLE INDIA
PVT. LTD FOR PAST FIVE YEARS” is a record of independent and
bonafide project work carried out by me under the supervision and guidance of
Asst. Prof. PRASSY VISWAMBHARAN, Department of Commerce and
management studies, Christ College, Irinjalakuda.
The information and data given in the report is authentic to the best of my
knowledge. The report has not been previously submitted for the award of any
Degree, Diploma, Associateship or other similar title of any other university or
institute.
Place: Irinjalakuda SHYAMILY K.S
Date: CCASBCP039

ACKNOWLEDGEMENT
I would like to take the opportunity to express my sincere gratitude to all people who have helped me with sound advice and able guidance.
Above all, I express my eternal gratitude to the Lord Almighty under whose divine guidance; I have been able to complete this work successfully.
I would like to express my sincere obligation to Rev. Dr. Jolly Andrews, Principal-in-Charge, Christ college Irinjalakuda for providing various facilities.
I am thankful to Prof. K.O.Francis, Co-ordinator of B.Com (Professional), for providing proper help and encouragement in the preparation of this report.
I am thankful to Ms. Teena Thomas, Class teacher for her cordial support, valuable information and guidance, which helped me in completing this task through various stages.
I express my sincere gratitude to Ms. Prassy viswambharan, Assistant Professor, whose guidance and support throughout the training period helped me to complete this work successfully.
I would like to express my gratitude to all the faculties of the Department for their interest and cooperation in this regard.
I extend my hearty gratitude to the librarian and other library staffs of my college for their wholehearted cooperation.
I express my sincere thanks to my friends and family for their support in completing this report successfully.
TABLES OF CONTENTS
CHAPTER NO. CONTENTS PAGE NO:
LIST OF TABLES
LIST OF FIGURES
CHAPTER 1 INTRODUCTION 1 – 3
CHAPTER 2 REVIEW OF LITERATURE 4 – 17
CHAPTER 3 INDUSTRY AND
COMPANY PROFILE 18 – 25
CHAPTER 4 DATA ANALYSIS AND
INTERPRETATION 26 – 41
CHAPTER 5 FINDINGS, SUGGESTIONS
& CONCLUSION 42 – 45
BIBLIOGRAPHY
ANNEXURE
LIST OF TABLES
TABLE NO:
TITLE PAGE NO:
4.1 Table showing current ratio 27
4.2 Table showing liquid ratio 28
4.3 Table showing debt-equity ratio 29
4.4 Table showing solvency ratio 30
4.5 Table showing proprietary ratio 31
4.6 Table showing fixed assets to net worth ratio 32
4.7 Table showing fixed assets turnover ratio 33
4.8 Table showing net profit ratio 34
4.9 Table showing working capital turnover ratio 35
4.10 Table showing total assets turnover ratio 36
4.11 Table showing return on shareholder’s equity 37
4.12 Table showing total liability to total assets ratio 38
4.13 Table showing operating profit ratio 39
4.14 Table showing operating ratio 40
4.15 Table showing common size statement 41
LIST OF CHARTS
FIGURE NO:
TITLE PAGE NO:
4.1 Chart showing current ratio 27
4.2 Chart showing liquid ratio 28
4.3 Chart showing debt-equity ratio 29
4.4 Chart showing solvency ratio 30
4.5 Chart showing proprietary ratio 31
4.6 Chart showing fixed assets to networth ratio 32
4.7 Chart showing fixed assets turnover ratio 33
4.8 Chart showing net profit ratio 34
4.9 Chart showing working capital turnover ratio 35
4.10 Chart showing total assets turnover ratio 36
4.11 Chart showing return on equity shareholders fund 37
4.12 Chart showing total liability to total asset ratio 38
4.13 Chart showing operating profit ratio 39
4.14 Chart showing operating ratio 40

CHAPTER Ⅰ
INTRODUCTION

1
1.1 Introduction
A healthy vibrant economy provides channels to transfer fund from
individual and groups who have saved money to individual and group who
want to borrow money. The financial system is complex in both function and
structure throughout the world.
Finance is regarded as life blood of business and it is the basic foundation of
all kinds of economic activities. Finance is defined as procurement of funds
and effective utilisation of funds. Finance is very essential for smooth
running of business. Finance is needed to promote or establish the business,
acquire fixed assets and to conduct business studies.
Financial statement analysis is the process of examining relationship among
financial statement elements and making comparisons with relevant
information. The purpose of financial analysis is to diagnose the information
contained in financial statements so as to judge profitability and financial
soundness of the firm. It is a valuable tool by investor, creditors, financial
analysts and others in their decision making process related to stocks, bonds,
other financial instruments. A financial analyst analysis the financial
statements with various tools of analysis before commenting upon the
financial health or weakness of an enterprise. The process of analysing
financial statement involves the rearranging, comparing and measuring the
significance of financial and operating data.
Financial statement analysis helps in comparing companies of different size
with each other and the most important benefit is that it provides an idea to
the investors about deciding on investing their funds in a particular company.
Financial statement analysis involves reviewing the financial statements of
an organization to gain an understanding of its financial situation. Financial
statements usually include a balance sheet, income statement, statement of
cash flows and supplementary notes. An internal analysis is conducted by
employees, executives or other individuals with access to a business firms
internal accounting records. In contrast an external analysis is conducted by
outsiders with access to published financial statements. These outsiders may

2
include creditors, investors, credit agencies, government agencies or the
general public. Tools and techniques used in financial analysis include cash
flow analysis, common-size statement analysis, cost-volume-profit analysis,
fund flow analysis, networking capital analysis and trend analysis.
Financial analysis can be conducted using either horizontal/vertical analysis
or analysis that uses ratios. Analysis by using ratio is used to calculate the
relative size of one figure in relation to another which can then be compared
to ratio for a prior period. Financial statement analysis involves careful
selection of data from financial statement for the primary purpose of
forecasting the financial health of the company. This is accomplished by
examining trends in key financial data across companies, and analysing key
financial ratio. This project entitled “A study on financial analysis of Nestle
India Limited” is mainly focusing on financial performance of Nestle India
limited for past five years.
1.2 Statement of the problem:
Financial analysis of company helps in identifying profit and in predicting
the risk of bankruptcy. Money is considered as life of an economy. The
subject matter of study is concerned with the financial performance of nestle
company. Company has diverse manufacturing of food products. In this
study analyse the last 5 year total sales, shareholders fund, Borrowings and
financial position of the Nestle India limited.
1.3 Significance of the study:
The COVID-19 pandemic crisis results in reduction in consumption of food
products as well as disrupted supply chains. Management should assess the
existing and anticipated effects of COVID-19 on the company’s activities,
financial performance and the position of the company. In scenario of this
recession stage, company should be able to provide products with more
offers or in less price.
1.4 Objective of the study:
Following are the important objectives of the study:-
To find out liquidity and solvency position of company
3
To know the profitability of company
To find out financial position of company
1.5 Research Design:
1.5.1 Nature of study:-
This is an analytical study
1.5.2 Nature of data:-
Secondary data is used in the study. Secondary data include financial
variables and accounting such as yearly net profit, dividend, book value
per share, earnings per share, market price of share, beta, book value of
equity, number of outstanding shares, etc., of each company.
1.5.3 Sources of data:-
The study used secondary data. Secondary sources include annual
reports of Nestle India, journals and other published sources
1.5.4 Period of study:-
Financial data is collected for a period of 5 years from 2015- 2019
1.6 Tools of study:
Ratio analysis is used for comparing for 5 year.
Common size statements is used for 2 year
1.7 Limitations:
The study was limited to only 5 year financial data
Resource available for data is limited
1.8 Chapterization:
Chapter 1- Introduction
Chapter 2- Review of literature
Chapter 3- Industry profile and company profile
Chapter 4- Data analysis and interpretation
Chapter 5- Findings, suggestions and conclusions
CHAPTER Ⅱ
REVIEW OF LITERATURE

4
2.1 Introduction
A literature review discusses published information in a particular subject area,
and sometimes information in a particular subject area within a certain time
period. A literature review can be just a simple summary of the source, but is
usually as an organizational pattern and combines both summary and synthesis.
It helps in clarifying and defining the problem, stating the objectives, formulating
hypothesis, selecting an appropriate design and methodology of research as well
as interpreting the result in the light of research work already undertaken in the
previous studies. In this chapter an endeavour has been made to provide and
present an overview of various aspects of this study through the review of
existing literature. The sources referred include journals, books, working papers,
report related to human resources etc.
Empirical research is published in books and in scholarly, peer-reviewed
journals. However, most library database does not offer straight forward ways to
locate empirical research.
2.2 Conceptual Review
The review of literature guides the researchers for getting better understanding
of methodology used, limitation of various available estimation procedures and
database, and lucid interpretation and reconciliation of the conflicting results.
Besides this, the review of empirical studies explores the avenues for future and
present research efforts related to the subject matter. In case of conflicting and
unexpected results, the research can take the advantage of knowledge of their
researchers simply through the medium of their published works. A number of
research studies have been carried out on different aspects of performance
appraisal by the researchers, economists and academicians in India and abroad.
Different authors have analysed performance in different perspectives. The
analysis of financial statements is a process of evaluating the relationship
between component parts of financial statements to obtain a better understanding
of the firm’s position and performance.

5
Financial statement analysis is largely a study of relationship among the various
financial factors in a business as disclosed by a single set of statements. It is a
process of evaluating the relationships component parts of a financial statement
to obtain a better understanding of a firm’s positions and performance. Financial
statements analysis is an attempt to determine the significance and meaning of
the financial data so that forecast may be made of the future ability to pay interest
and debt maturities a (both current and long term) and profitability of a sound
policy. The five key elements of financial analysis is Revenues, Profits,
operational efficiency, Capital efficiency, solvency and liquidity.
Financial statement present the financial activities and health of the business in
clear and concise manner. However the further disclosure are made as per
relevant laws, regulations and as required by accounting standard that is used.
Financial statement analysis is the process of evaluating business, projects,
budgets, and other finance related transactions to determine their performance
suitability. The main advantages of financial statement analysis is helpful to the
government agencies in analysing the taxation owed by the firm, company is
able to analyse its own performance over a specific time period, budget outline
in real- time, pattern detection and forecasting, communicate with shareholders.
The main disadvantages of financial statement analysis is making strategic
decisions based on figures and data pertaining to the current market conditions
which may fluctuate, analysis of at-one-time basis, ignores the price level
changes, influence of personal judgement.
2.3 Tools or Techniques of Financial Statements
2.3.1 Ratio Analysis
A ratio is a simple arithmetical expression of the relationship of one number to
another number. Ratio analysis can be defined as the process of ascertaining the
financial ratios that are used for indicating the ongoing financial performance of
a company. Ratio analysis is a widely used tool of financial analysis. It can be
used to compare the risk and return relationships of firms of different sizes. Ratio

6
analysis was perhaps the financial tools developed to analysis and interpret the
financial statement and is still used widely for this purpose. It is one of the most
prevalent method of analysing a balance sheet. Any number of ratio can be
prepared by comparing any two figures available in the balance sheet on profit
and loss account or both.
2.3.2 Classification of Ratios
Accounting ratio can be classified in several ways, in general accounting ratios
may be classified on the following basis;
Liquidity Ratios
Leverage Ratios
Activity Ratios
Profitability Ratios
Market Test Ratio
2.3.2.1 Liquidity Ratios
The term liquidity refers to the firm's ability to pay its current liabilities out of
it’s currently assets. Liquidity ratios are used to measure the liquidity position or
short term debt paying ability of a firm. These ratios are highly useful to creditors
and commercial banks that provide short term credit important liquidity ratios
are:
1. Current Ratio
Current Ratio is one of the oldest of all financial ratios. It was first used in 1891.
Current ratio is defined as the ratio of current assets to current liabilities. It shows
the relationship between total current assets and total current liabilities. It is the
measure of firm’s short term solvency. That is, its ability to meet short-term
obligations. In sound business a current ratio of 2:1 is considered as an ideal one.
Current Assets = Current assets
Current liabilities
7
2. Liquid Ratio or Quick Ratio
Liquid ratio is the ratio of liquid assets (or quick assets) to current liabilities. It
establishes the relationship between quick assets and current liabilities. It is the
measure of the instant debt paying ability of the business enterprise. It is also
called acid test ratio. An acid test ratio of 1:1 is considered to be satisfactory as
a firm can easily meet all its current liabilities. Inventory are considered to be
less liquid. It is computed as follows:
Liquid ratio = Liquid Assets
Current liabilities
3. Absolute Liquid Ratio or Cash Ratio
Cash ratio of absolute liquid ratio show the relationship between cash and current
liabilities. Absolute liquid asset includes cash in hand and cash at bank and
marketable securities are temporary investments. The acceptable norm for this
ratio is 0.75:1.
Absolute liquid ratio= cash and bank+ short term securities/current liabilities
2.3.2.2 Leverage Ratios
The term solvency means the ability of a firm to meet its long-term obligations.
The long-term creditors of firms are primary interested in knowing firms ability
to pay interest on long term borrowings, repayment of principle amount of
maturity etc. So this ratio indicates a firm's ability to meet with interest, cost and
repayment schedule associated with this long term borrowings. These ratios are:
1. Debt Equity Ratio
It shows the relationship between total debt and owned debt. It is the ratio of the
amount invested by the shareholders. This ratio reflects the relative claim of
shareholders and creditors against the Assets of the company. This ratio is also
known as external-internal equity ratio. It is computed as:
8
Debt equity ratio = Debt
Equity
2. Proprietary Ratio
Proprietary ratio establishes the relationship between shareholders or proprietors
fund and total assets. This ratio shows how much funds have been contributed
by the shareholders in the total assets of the firm. It is also known as equity ratio-
worth ratio. It is computed as:
Proprietary ratio = shareholders fund
Total asset
3. Fixed Asset Ratio
It is the ratio of fixed assets to long-term funds or capital employed. It is
computed as follows:
Fixed assets ratio= Fixed Assets (after depreciation)
Long term funds
4. Fixed assets to net worth ratio
It measures the percentage of fixed assets to network. This ratio helps to analysis
the long term solvency of the firm.
Fixed asset to net worth ratio = Fixed assets
Shareholders fund
5. Capital Gearing Ratio
This ratio is used to analyse the capital structure of a company. The capital
gearing or leverage ratio refers to the proportion between fixed income bearing
funds and equity shareholders fund. The capital gearing ratio is computed as
follows:

9
Capital gearing ratio = fixed income bearing funds Equity/ shareholders fund
i.e., Preference share capital + debentures + long term loans
Equity Shareholders fund
6. Solvency Ratio
This ratio expresses the relationship between total Assets and total liabilities of
a business. It measures the solvency of the business. This ratio is known as
solvency ratio. This ratio is generally expressed as a proportion. The following
formula is used for computing solvency and ratio.
Solvency ratio = Total assets
Total debt
Interest coverage ratio
The interest coverage ratio is a debt ratio and profitability ratio used to determine
how easily a company can pay interest on its outstanding debt. The interest
coverage ratio may be calculated by dividing a company's earnings before
interest and tax (EBIT) by its interest expense during a given period by the
company's interest payments due within the same period.
The interest coverage ratio is sometimes called the times interest earned (TIE)
ratio. Lenders, investors, and creditors often use this formula to determine a
company's riskiness relative to its current debt or for future borrowing
Interest coverage ratio = EBIT
Interest

10
2.3.2.3 Activity Ratio
These ratios indicate efficiency in Asset Management. These ratios are also
known as efficiency ratios or performance ratios of assets utilization ratios. The
ratio indicates the cash elasticity of current assets. This ratio indicates the speed
with which the resources are turned over or converted into cash. These ratios are
also known as turnover ratios. It should be noted that turnover ratios are always
expressed in number of times, i.e., rate of turning over. Important activity or
turnover ratios are:
1. Inventory Turnover Ratio
Inventory or stock turnover ratio shows the relationship between cost of goods
sold and average inventory on stock. It is also called merchandise turnover ratio,
it is obtained by dividing cost of goods sold by average stock. Stock turnover
ratio is computed by the following formula:
Stock turnover ratio = Cost of goods sold
Average stock
2. Debtors Turnover Ratio
Debtors‟ turnover ratio explain the relationship between net credit sales and
average debtors including bills receivable. This ratio shows how quickly debtors
are realized or converted into cash. It is also known as receivables turnover ratio.
The following formula used for calculating debtor’s turnover ratio:
Debtors turnover ratio = Net credit sales
Debtors including B/R
3. Creditors Turnover Ratio
It shows the relationship between net credit purchase and average creditors
including bills payable. This ratio indicates the number of times the creditors are

11
paid. It is also called payable turnover ratio, it is computed by the following
formula:
Creditors turnover ratio= Net Credit Purchase
Average Creditors including B/P
4. Working capital turnover ratio
Current asset will change with change in sales. This means working capital is
related with States. The relation between sales and working capital is called
working capital turnover ratio. This ratio shows how many times the working
capital is turned over to produce sales. Working capital turnover ratio is
computed by the following formula:
Working capital turnover ratio = Net sales
Working capital
5. Fixed asset turnover ratio
For knowing whether fixed asset or effectively utilized or not, fixed asset
turnover ratio is used. Fixed asset turnover ratio establishes the relationship
between net sales and fixed asset. It measures the efficiency with which a firm
is utilizing its fixed assets in producing sales. It is computed as follows:
Fixed asset turnover ratio = Net sales
Net fixed assets
2.3.2.4 Profitability Ratios
The term profitability refers to the ability of a firm to earn income. The
profitability of a firm can be easily measured by its profitability ratios.
Profitability ratios are always based on sales. Important profitability ratios are:

12
1. Gross profit ratio :
Gross profit or sales profit or gross margin is the difference between revenue and
the cost of making a product. This is the ratio of gross profit to sales expressed
as percentage. It is also known as gross margin. It is calculated as follows:
G/P ratio = Gross profit x100
Net sales
2. Operating ratio
Operating ratio expresses the relationship between operating cost and sales. It
indicates the overall efficiency in operating the business. The formula for
computing operating ratio is as follows:
Operating ratio = Cost of goods sold + operating expenses x 100
Sales
3. .Net profit ratio
Net profit ratio is the ratio of net profit earned by a business and its net sales. It
measures overall profitability. It is calculated as follows
N/P Ratio= Net profit x 100
Net Sales
4. Operating profit ratio
Operating profit ratio Explain the relationship between operating profit and net
sales. It is calculated by the following formula:
Operating profit ratio= operating profit x 100
Net sales

13
5. Return on investment (ROI)
ROI measures the overall profitability. It establishes the relationship between
profit or return and investment. It is also called the accounting rate of return. It
is computed as follows:
ROI = Profit before interest and tax x 100 /Capital employed
6. Return on shareholders fund
This is the ratio of net profit to shareholders fund or net-worth. It measures the
profitability from the shareholders point of view. It is calculated as follows:
Return on shareholders fund = Net profit after interest and tax x 100 Shareholders
fund
2.3.2.5 Market Test Ratio
Market test ratio are used for evaluating the shares and stocks which are traded
in the market. The value of shares in the stock exchange depends upon a number
of factors like book value of shares, future profitability of company, return on
equity shares, earnings per share, Dividend policy, dividend per share, dividend
pay-out ratio etc. Important Market test ratio are as follows:
1. Dividend per share
The dividend paid to equity shareholders on a per share basis is DPS. In other
words, it is a dividend paid to equity shareholder divided by the number of equity
shares outstanding. The formula is
DPS = Dividend paid to equity shareholders
No. of equity shares
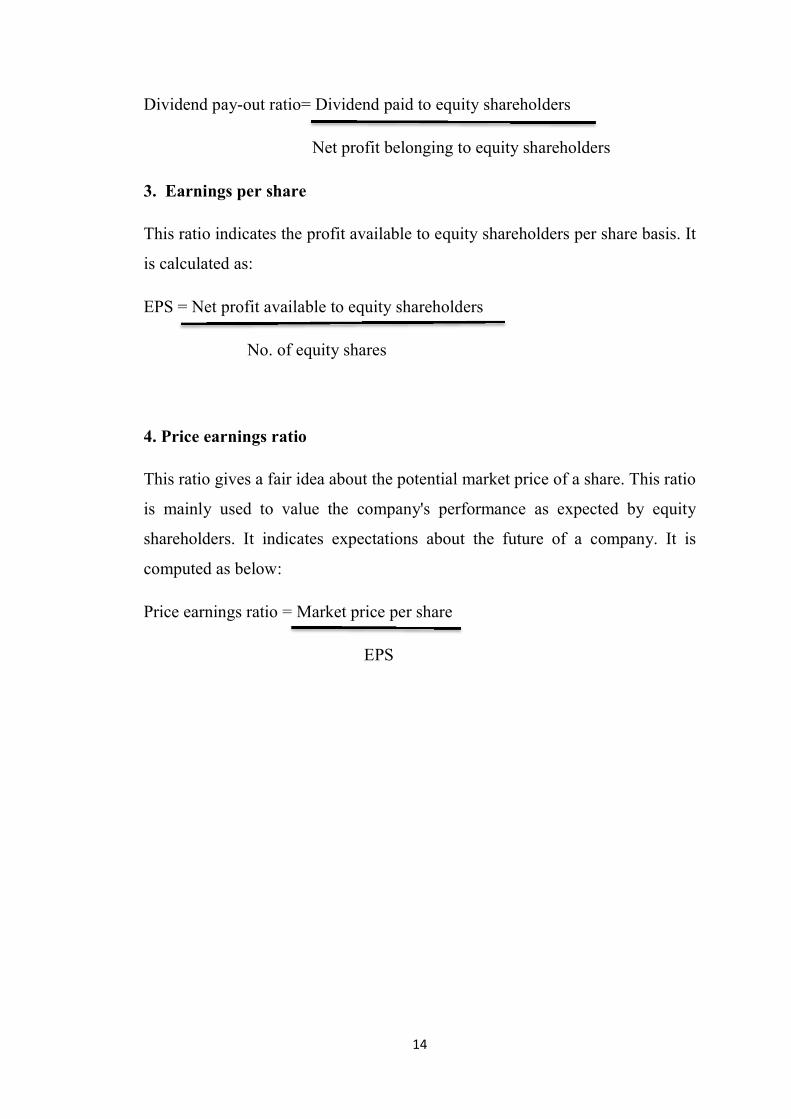
2. Dividend pay-out ratio
Dividend pay-out ratio measures the relationship between the dividend
paid to equity shareholders and the earnings belonging to them. It may be
expressed as follows:
14
Dividend pay-out ratio= Dividend paid to equity shareholders
Net profit belonging to equity shareholders
3. Earnings per share
This ratio indicates the profit available to equity shareholders per share basis. It
is calculated as:
EPS = Net profit available to equity shareholders
No. of equity shares
4. Price earnings ratio
This ratio gives a fair idea about the potential market price of a share. This ratio
is mainly used to value the company's performance as expected by equity
shareholders. It indicates expectations about the future of a company. It is
computed as below:
Price earnings ratio = Market price per share
EPS
15
2.3 Empirical Literature
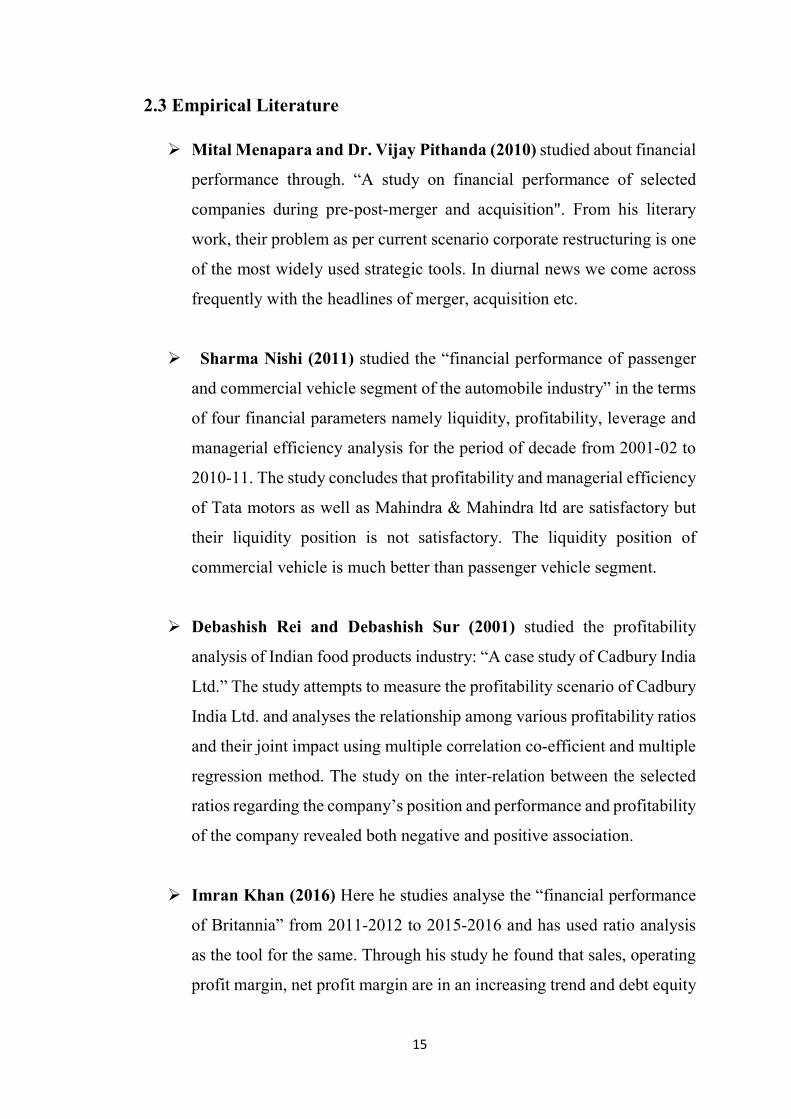
Mital Menapara and Dr. Vijay Pithanda (2010) studied about financial
performance through. “A study on financial performance of selected
companies during pre-post-merger and acquisition". From his literary
work, their problem as per current scenario corporate restructuring is one
of the most widely used strategic tools. In diurnal news we come across
frequently with the headlines of merger, acquisition etc.
Sharma Nishi (2011) studied the “financial performance of passenger
and commercial vehicle segment of the automobile industry” in the terms
of four financial parameters namely liquidity, profitability, leverage and
managerial efficiency analysis for the period of decade from 2001-02 to
2010-11. The study concludes that profitability and managerial efficiency
of Tata motors as well as Mahindra & Mahindra ltd are satisfactory but
their liquidity position is not satisfactory. The liquidity position of
commercial vehicle is much better than passenger vehicle segment.
Debashish Rei and Debashish Sur (2001) studied the profitability
analysis of Indian food products industry: “A case study of Cadbury India
Ltd.” The study attempts to measure the profitability scenario of Cadbury
India Ltd. and analyses the relationship among various profitability ratios
and their joint impact using multiple correlation co-efficient and multiple
regression method. The study on the inter-relation between the selected
ratios regarding the company’s position and performance and profitability
of the company revealed both negative and positive association.
Imran Khan (2016) Here he studies analyse the “financial performance
of Britannia” from 2011-2012 to 2015-2016 and has used ratio analysis
as the tool for the same. Through his study he found that sales, operating
profit margin, net profit margin are in an increasing trend and debt equity
16
ratio and return on assets how decrease. He also put up some suggestions
like current asset should be increased, debt capital should be increased.
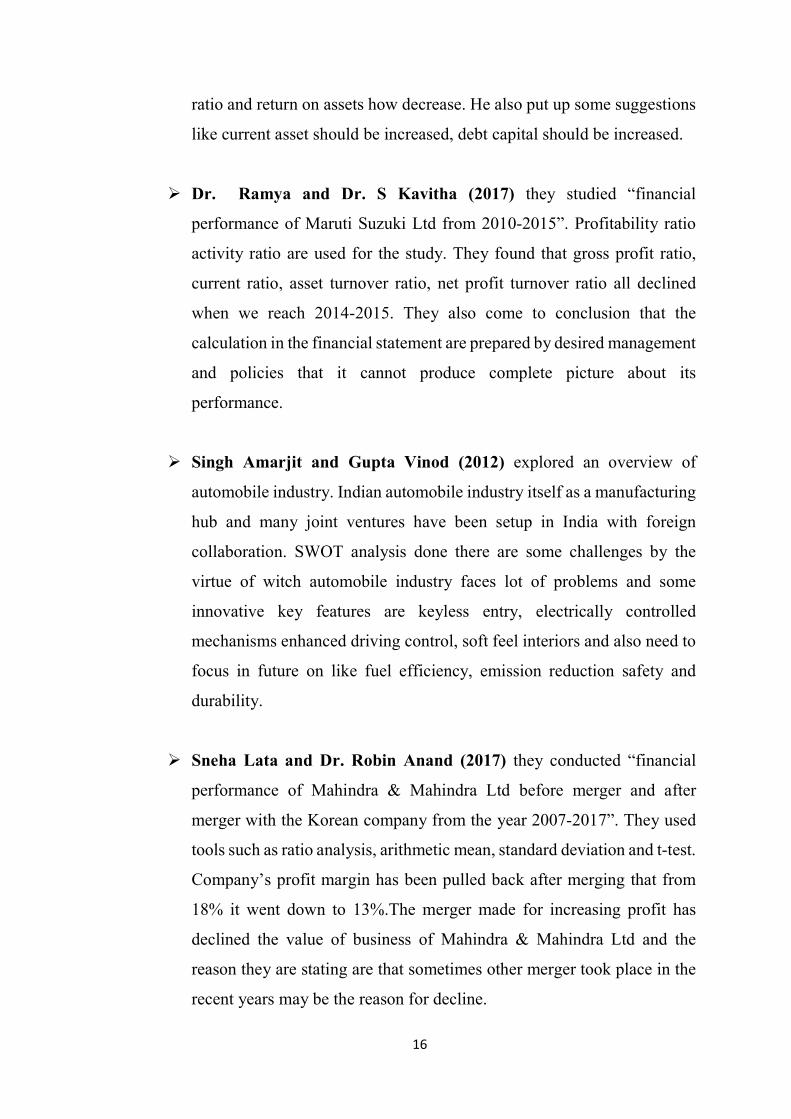
Dr. Ramya and Dr. S Kavitha (2017) they studied “financial
performance of Maruti Suzuki Ltd from 2010-2015”. Profitability ratio
activity ratio are used for the study. They found that gross profit ratio,
current ratio, asset turnover ratio, net profit turnover ratio all declined
when we reach 2014-2015. They also come to conclusion that the
calculation in the financial statement are prepared by desired management
and policies that it cannot produce complete picture about its
performance.
Singh Amarjit and Gupta Vinod (2012) explored an overview of
automobile industry. Indian automobile industry itself as a manufacturing
hub and many joint ventures have been setup in India with foreign
collaboration. SWOT analysis done there are some challenges by the
virtue of witch automobile industry faces lot of problems and some
innovative key features are keyless entry, electrically controlled
mechanisms enhanced driving control, soft feel interiors and also need to
focus in future on like fuel efficiency, emission reduction safety and
durability.
Sneha Lata and Dr. Robin Anand (2017) they conducted “financial
performance of Mahindra & Mahindra Ltd before merger and after
merger with the Korean company from the year 2007-2017”. They used
tools such as ratio analysis, arithmetic mean, standard deviation and t-test.
Company’s profit margin has been pulled back after merging that from
18% it went down to 13%.The merger made for increasing profit has
declined the value of business of Mahindra & Mahindra Ltd and the
reason they are stating are that sometimes other merger took place in the
recent years may be the reason for decline.
17
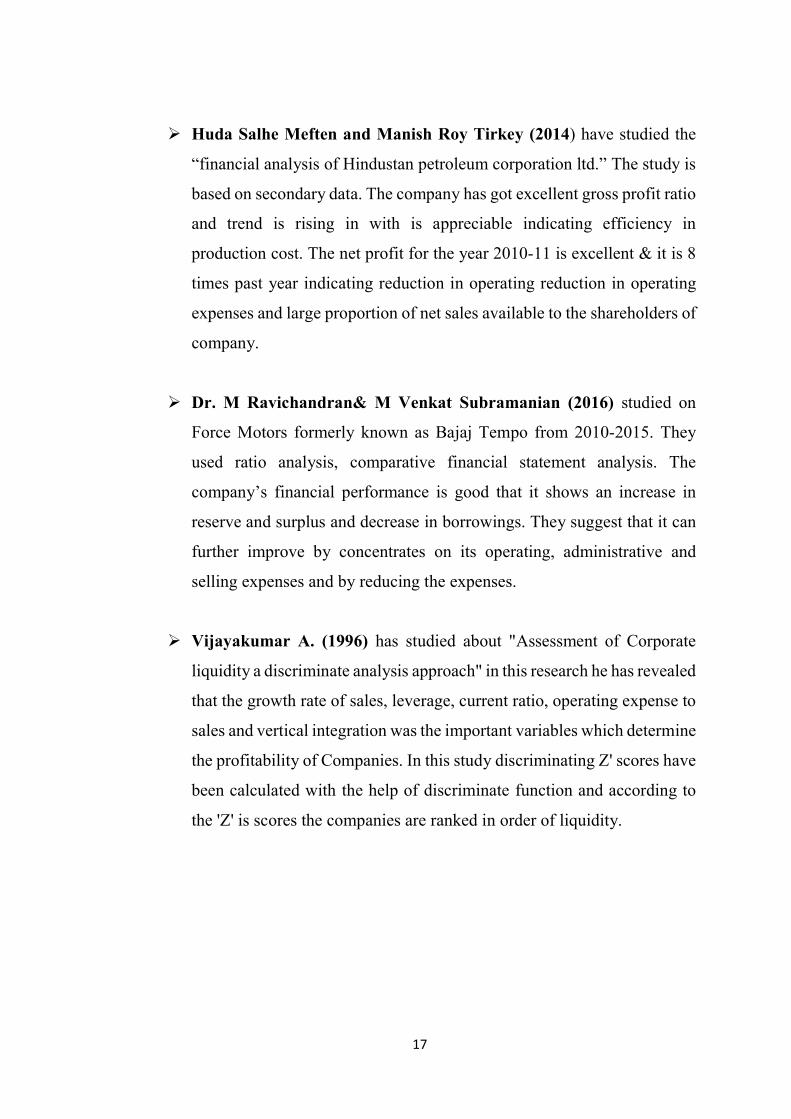
Huda Salhe Meften and Manish Roy Tirkey (2014) have studied the
“financial analysis of Hindustan petroleum corporation ltd.” The study is
based on secondary data. The company has got excellent gross profit ratio
and trend is rising in with is appreciable indicating efficiency in
production cost. The net profit for the year 2010-11 is excellent & it is 8
times past year indicating reduction in operating reduction in operating
expenses and large proportion of net sales available to the shareholders of
company.
Dr. M Ravichandran& M Venkat Subramanian (2016) studied on
Force Motors formerly known as Bajaj Tempo from 2010-2015. They
used ratio analysis, comparative financial statement analysis. The
company’s financial performance is good that it shows an increase in
reserve and surplus and decrease in borrowings. They suggest that it can
further improve by concentrates on its operating, administrative and
selling expenses and by reducing the expenses.
Vijayakumar A. (1996) has studied about "Assessment of Corporate
liquidity a discriminate analysis approach" in this research he has revealed
that the growth rate of sales, leverage, current ratio, operating expense to
sales and vertical integration was the important variables which determine
the profitability of Companies. In this study discriminating Z' scores have
been calculated with the help of discriminate function and according to
the 'Z' is scores the companies are ranked in order of liquidity.

CHAPTER Ⅲ
INDUSTRY AND COMPANY
PROFILE
18
3.1 Industry Profile
India is the world's second largest producer of food and has the potential of being
the biggest with the food and agricultural sector. The food industry is a complex,
global network of diverse business that supplies most of the food consumed by
the world's population. The term food industries covers a series of industrial
activities directed at the production, distribution, processing, conversion,
preparation, preservation, transport, certification and packaging of foodstuffs.
The food industry today has become highly diversified, with manufacturing
ranging from small, traditional, family-run activities that are highly labour-
intensive, to large, capital-intensive and highly mechanized industrial processes.
Many food industries depend almost entirely on local agriculture produce or
fishing. The Indian food industry is poised for huge growth, increasing its
contribution to world food trade every year. In India, the food sector has emerged
as a high-growth and high-profit sector due to its immense potential for value
addition, particularly within the food processing industry. The total food
production in India is likely to double in the next ten years and there is an
opportunity for large investments in food and food processing technologies,
skills and equipment, especially in areas of Canning, Dairy and Food Processing,
Specialty Processing, Packaging, Frozen Food/Refrigeration and Thermo
Processing. Fruits & Vegetables, Fisheries, Milk & Milk Products, Meat &
Poultry, Packaged/Convenience Foods, Alcoholic Beverages & Soft Drinks and
Grains are important sub-sectors of the food processing industry. The Indian food
and grocery market is the world’s sixth largest, with retail contributing 70 per
cent of the sales. The Indian food processing industry accounts for 32 per cent
of the country’s total food market, one of the largest industries in India and is
ranked fifth in terms of production, consumption, export and expected growth.
According to Ministry of Food Processing India, Food Processing Industry
accounts for about 32% of the country’s total food market, the Food Processing
Industry is one of the largest industries in India and is ranked fifth in terms of
production, consumption, export and expected growth. The Indian Food

19
Processing Industry has grown by 11% in the last decade and is expected to reach
$480 billion by 2020. The industry contributes to 14% of the country’s
manufacturing GDP, 13% of exports and 6% of total industrial investment. The
food industry has a large influence on consumerism. Food Processing Industry is
not only the need of the hour but also has the potential to bring prosperity in rural
economy and contribute to the socio economic development of the country. It is
certainly the pathway of a new future for India. However, the real challenge is
to develop industry in a way which takes care of small scale industry along with
attracting big ticket domestic and foreign investments. Indian food processing
industry is primarily export oriented. With the export growth rate of around 15%,
its share in the international market is only 1.7%. Again, only 2% of the total
food produced in India is processed for further consumption. Food consumption
drives demand, and this depends on population growth. The profitability of
individual companies depends on efficient operations, because products are
commodities subject to intense price competition. Companies compete largely
based on cost and their ability to distribute the finished product. Large companies
have economies of scale in purchasing and distribution. Small companies can
compete effectively in local or regional markets and by developing popular
products. The Indian food processing industry accounts for 32 per cent of the
country’s total food market, one of the largest industries in India and is ranked
fifth in terms of production, consumption, export and expected growth.
The Ministry of Food Processing Industries is a ministry of the Government of
India responsible for formulation and administration of the rules and regulations
and laws relating to food processing in India. The ministry was set up in the year
1988, with a view to develop a strong and vibrant food processing industry, to
create increased employment in rural sector and enable farmers to reap the
benefits of modern technology and to create a surplus for exports and stimulating
demand for processed food. The ministry is currently headed by Narendra Singh

20
Tomar, a Cabinet Minister who is also the Minister of Agriculture & Farmers
Welfare and Minister of Rural Development.
Reasons for the growth of the food industry
Increased urbanization in the country has given a boost to the food industry in
India.
Majority of the women in the country are working as a result of which families
have extra income which they are spending in buying food.
The standard of living in the country has improved as a result of which there
has been an increased demand for food.
Supermarkets and malls have opened all over the country and this has helped
in making shopping for food a pleasurable experience.
The consumers can select, inspect and pick up food items that they like in an
ambience that is comfortable. This too has helped to boost the sale of food
products in the country.
3.2 Company Profile
Nestle India Limited, is the Indian subsidiary of Nestle which is a Swiss
multinational company. Nestle was founded in 1867 in Geneva, Switzerland by
Henri Nestle. Nestle's first product was "Farine Lactee Nestle", an infant cereal.
In 1905, Nestle acquired the Anglo-Swiss Condensed Milk Company. Nestle’s
relationship with India started 1912, when it began trading as The Nestle Anglo-
Swiss Condensed Milk Company (Export) Limited, importing and selling
finished products in the Indian market. The company is headquartered in
Gurgaon, Haryana. The company's products include food, beverages, chocolate,
and confectioneries. The company was incorporated on 28 March 1959 and was
21
promoted by Nestle Alimentana S.A. via a subsidiary, Nestle Holdings Ltd. As
of 2020, the parent company Nestle owns 62.76% of Nestlé India. The company
has 8 production facilities in various locations across India. With eight factories
and a large number of co-packers, Nestle India is a vibrant Company that
provides consumers in India with products of global standards and is committed
to long-term sustainable growth and shareholder satisfaction. The Company
insists on honesty, integrity and fairness in all aspects of its business and expects
the same in its relationships. This has earned it the trust and respect of every
strata of society that it comes in contact with and is acknowledged amongst
India's 'Most Respected Companies' and amongst the 'Top Wealth Creators of
India'. Nestlé India, one the biggest players in FMCG segment, has a presence in
milk & nutrition, beverages, prepared dishes & cooking aids & chocolate &
confectionery segments. Nestle India manufactures products of truly
international quality under internationally famous brand names such as
NESCAFE, MAGGI, MILKYBAR, KIT KAT, BAR-ONE, MILKMAID and
NESTEA and in recent years the Company has also introduced products of daily
consumption and use such as NESTLE MILK, NESTLE SLIM MILK, NESTLE
Dahi and NESTLE Jeera Raita. Nestle has created brands like Nestle Milkmaid,
Nestle Everyday, Maggi Noodles, Maggi Soups, Polo, Kit Kat, Nescafe & many
more. The objective of Nestle is “We unlock the power of food to enhance
quality of life for everyone, today and for generations to come” and their motto
is ‘Good food, Good life’. As per the market-wise position Nestlé India stands
first in instant noodles & ketchups, second in healthy soups, No.1 in instant
coffee, & No.2 in overall chocolate category. The company innovates new
product & renovates existing one providing high quality, safe food products at
affordable prices. In June 2015, Nestle India's instant noodles product 'Maggi
Noodles' was banned by the Government of Delhi for a 15 day period after lead
and monosodium glutamate in samples of the product were found to be beyond
permissible limits. On 5 June 2015 Maggi noodles were banned nationwide by
the Food Safety and Standards Authority of India (FSSAI). The ban was
overturned on 13 August 2015 following the Bombay High Court's order and
22
samples of Maggi Noodles were ordered to be retested within 6 weeks by three
labs authorized by the National Accreditation Board for Testing and Calibration
Laboratories. Nestle was fined ₹45 lakh for the incident by the district
administration. Between 5 June 2015 when the noodles were first banned and 1
September 2015, Nestle recalled 38,000 tonnes of Maggi Noodles from stores
and incinerated them at 11 cement plants across India Nestle eventually cleared
the Bombay High Court mandated lab tests and Maggi Noodles were allowed to
be manufactured and sold again.
It’s 1867 in Switzerland, and a premature baby cannot breastfeed, which is
worrying in an era when many infants die of malnutrition due to a lack of
effective breast milk alternatives. Henri Nestle learns about the case and feeds
the child his new ‘farine lactee’ infant food. It is the only product that the boy
can digest, and he survives. Word of Nestle’s success spreads rapidly, and
through determination, commitment and a pioneering spirit he builds a thriving
business. His life-saving innovation is the model for all those that follow
throughout Nestle’s 150 years, which show the company’s skill in meeting and
anticipating consumers’ changing needs. Worldwide, people now consume more
than one billion servings of Nestle products per day. The company operates in
over 197 countries and employs almost 340,000 people. It’s a far cry from the
small-scale business that Henri Nestle founded in Vevey, Switzerland. But
Nestlé still embraces his values, his famous ‘Nest’ logo, and its headquarters in
the city. The company’s early success was due to its investment in science-based
products and modern factories to produce them efficiently. Railways and
steamships gave Nestle & Anglo-Swiss access to new urban markets worldwide,
and it made savvy use of modern advertising media – newspapers, magazines,
billboards – to educate people on product benefits. Namely, nutrition, quality,
safety, affordability and taste. It’s a blueprint for success that, bar a few
necessary updates, still applies today. One other benefit that Nestle products have
always offered is convenience, and this became especially important after World
War Two, when more women entered the workplace, and people demanded
foods that were easy to prepare. By 1938, people could ‘start the day with a
23
Nescafé’, the world’s first great-tasting instant coffee, simply by adding hot
water. By 1948 they could enjoy Nesquik, a cocoa-based powder that dissolves
easily in cold milk. And by 1957, they could finish the day with Maggi pasta
‘ready meals’ in cans, which were hugely successful. Cans weren’t new, but
nutritious meals in cans were, and this quickly became a high-growth segment
for Nestle. Such foods had a long shelf life, were easy to heat then eat, and you
could even enjoy them cold. Cans were also simple to transport, so you could
consume them on a camping trip, for instance, along with your cup of Nescafe.
Such products helped to shape our modern world, and life would never be the
same. From the 1960s, you could also enjoy the convenience of Nestle frozen
foods and ice creams, which the company entered as domestic fridges and
freezers grew in popularity. In 1986 Nestle went one step further by creating its
own breakthrough Nespresso system, which changed the way we experience
premium coffee. Nespresso is another Nestle innovation that enhances people’s
quality of life, everywhere, every day. In doing so it brings pleasure, an emotion
we associate strongly with chocolate. Nestle first entered this key business in
1904 when it took on export sales for Peter & Kohler, later adding brands such
as Cailler and KitKat. Today Nestle business spans beverages, waters, dairy,
confectionery, petcare, even skincare. In 2011 the company extended its
leadership in Nutrition, Health and Wellness by creating Nestle Health Science,
to develop nutritional healthcare products that target optimal brain health, for
example, or healthy aging. Such innovations will help Nestlé address the global
challenges of malnutrition, growing and aging populations and obesity. This
same passion for nutrition underpins a commitment to improve products by
reducing salt, sugar and saturated fats, and fortify them with vitamins, minerals,
vegetables and whole grains. The main objectives of Nestle India ltd is to
manufacture and market the company’s products in such a way so as to create
value that can be sustained over the long term for consumers, shareholders,
employees and business partners. Nestle aims to create value for consumers that
can be sustained over the long term by offering a wide variety of high quality,
safe food products at affordable prices. The company continuously focuses its
24
efforts to better understand the changing lifestyles of modern India and anticipate
consumer needs in order to provide convenience, taste, nutrition and wellness
through its product offerings. Achievements of Nestle India ltd are CNBC
Awaaz Consumer Awards has honoured Nescafe as the most preferred coffee
brand., Business India has rated Nestle India as No.1 on Return On Capital
Employed amongst Super 100 companies, In 2006-2007 Nestlé India was
awarded the ‘Best Exporter of Instant Coffee’ ‟Highest Exporter to Russia and
CIS”, ‘Highest Exporter to Far East Countries’, In 2009 Nestle India Board
approved Proposal to acquire Healthcare Nutrition Business of Speciality.
3.2.1 Mission of the company
Nestle is the world's leading nutrition, health and wellness company. Innovation
foundation mission is "Good Food, Good Life" is to provide consumers with the
best tasting, most nutritious choices in a wide range of food and beverage
categories and eating occasions, from morning to night.
3.2.2 Vision and value of the company
To be a leading, competitive, Nutrition, Health and Wellness Company
delivering improved shareholder value by being a preferred corporate citizen,
preferred employer, preferred supplier selling preferred products.
3.2.3 Shareholding and Listing
Nestle India shares are listed on Bombay stock exchange, Cochin stock exchange
limited, National stock exchange of India limited and MCX stock exchange.
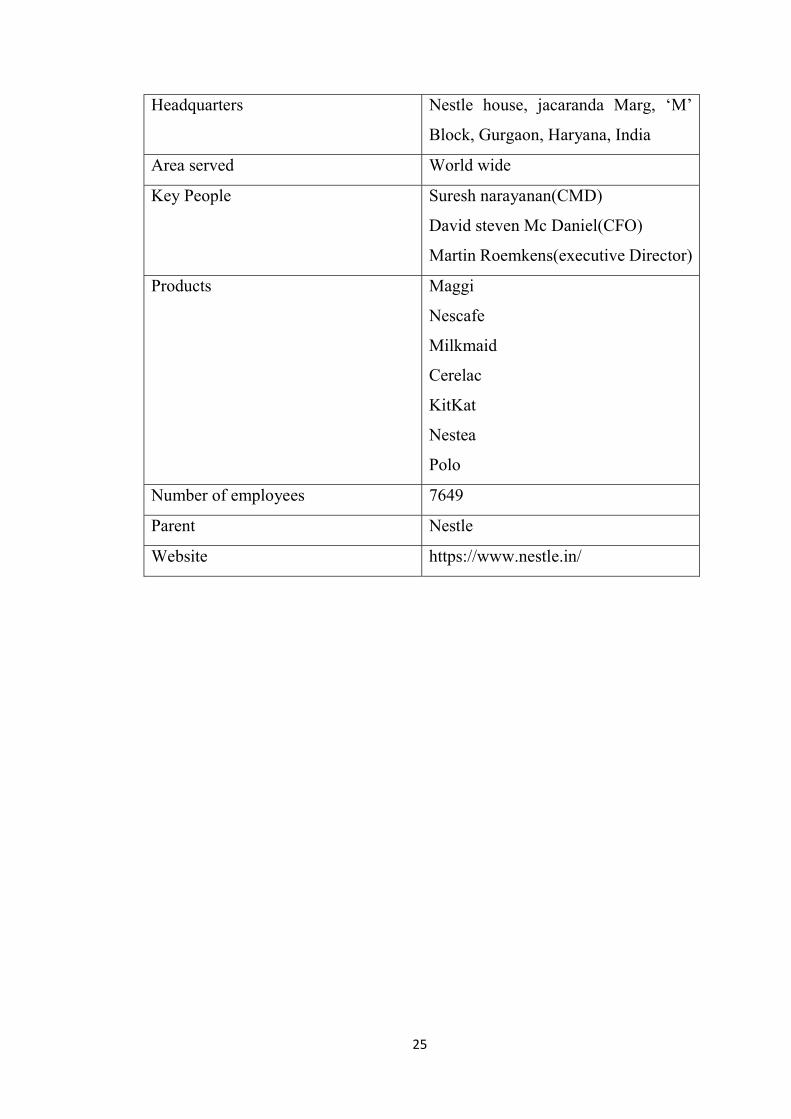
Type Public
Traded as: BSE
NSE
500790
NESTLEIND
Industry Food processing
Founded 28 March 1959
25
Headquarters Nestle house, jacaranda Marg, ‘M’
Block, Gurgaon, Haryana, India
Area served World wide
Key People Suresh narayanan(CMD)
David steven Mc Daniel(CFO)
Martin Roemkens(executive Director)
Products Maggi
Nescafe
Milkmaid
Cerelac
KitKat
Nestea
Polo
Number of employees 7649
Parent Nestle
Website https://www.nestle.in/
CHAPTER Ⅳ
DATA ANALYSIS AND
INTERPRETATION
26
Data analysis and interpretation
Data analysis and interpretation is the main heart of the study. It is the process
of inspecting, cleansing and transforming and modelling data with the goal of
discovering useful information, suggestion, conclusion and supporting decision
making. For this purpose, secondary sources are mainly used in this study. The
collection of secondary data was done by examination of relevant information
from the companies already published sources. The main tool used for data
analysis and interpretation is ratio analysis.
After identifying a research topic, doing a literature background research,
establishing philosophical assumptions and focus problem, deciding on an
appropriate research paradigm and methodology with specific purpose,
designing a research plan and collecting sufficient data, the next step in the
research process is data analysis and interpretation, which precedes reporting of
research. Data analysis is a process that involves examining and moulding
collected data for interpretation to discover relevant information, draw or
propose conclusions and support decision-making to solve a research problem.
meaning are identified and information is interpreted.
The ratio analysis is one of the most powerful tools of financial analysis. It is
the process of establishing and interpreting various ratios. The ratio analysis is
used to study the liquidity, profitability and solvency position of the company. It
is with the help of ratios that the financial statements can be analysed more
clearly and decision making can be made from such analysis
27
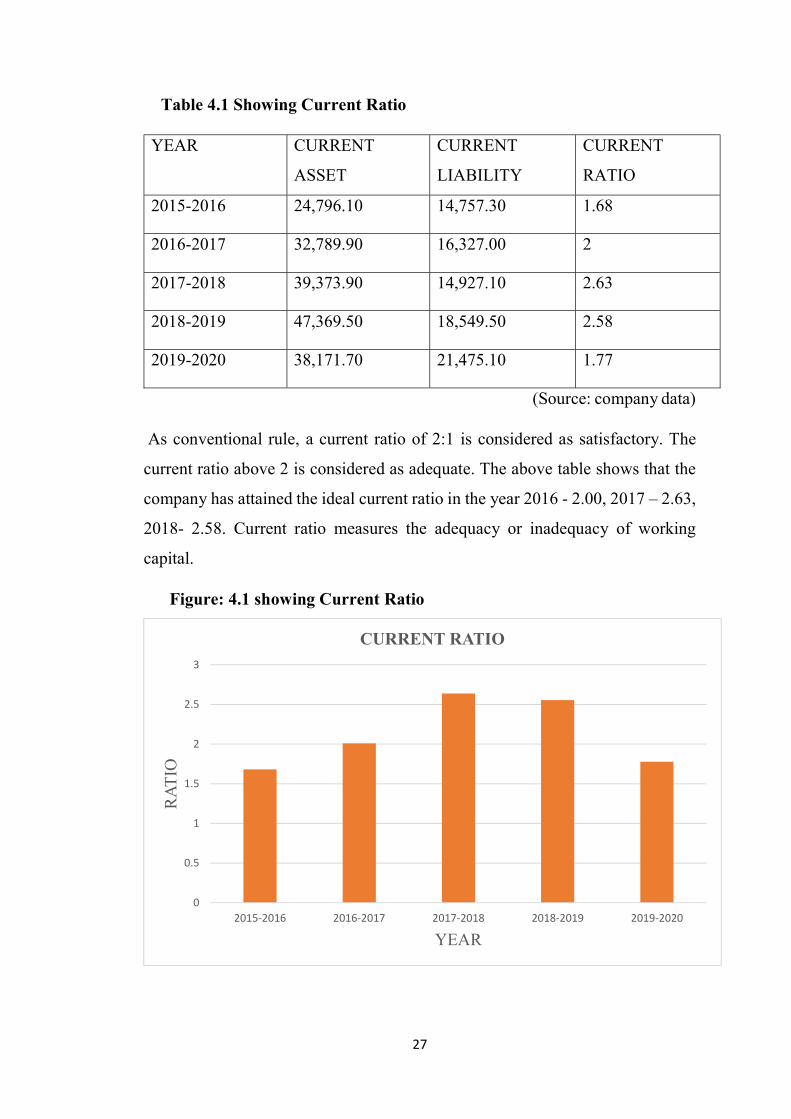
Table 4.1 Showing Current Ratio
YEAR CURRENT
ASSET
CURRENT
LIABILITY
CURRENT
RATIO
2015-2016 24,796.10 14,757.30 1.68
2016-2017 32,789.90 16,327.00 2
2017-2018 39,373.90 14,927.10 2.63
2018-2019 47,369.50 18,549.50 2.58
2019-2020 38,171.70 21,475.10 1.77
(Source: company data)
As conventional rule, a current ratio of 2:1 is considered as satisfactory. The
current ratio above 2 is considered as adequate. The above table shows that the
company has attained the ideal current ratio in the year 2016 - 2.00, 2017 – 2.63,
2018- 2.58. Current ratio measures the adequacy or inadequacy of working
capital.
Figure: 4.1 showing Current Ratio
0
0.5
1
1.5
2
2.5
3
2015-2016 2016-2017 2017-2018 2018-2019 2019-2020
RA
TIO
YEAR
CURRENT RATIO

28
Table 4.2 showing Liquid ratio
YEAR LIQUID ASSETS CURRENT
LIABILITIES
CURRENT
RATIOS
2015-2016 24701.5 14757.3 1.673
2016-2017 32692.2 16327 2.002
2017-2018 38851.9 14927.1 2.602
2018-2019 47309.4 18549.5 2.55
2019-2020 36468.9 21475.1 1.698
(Source: company data)
The above table shows the liquid ratio of the company. This ratio is used for
analysing liquidity or short term financial position of a firm. The ideal liquid
ratio is 1:1 or parity is considered as adequate. The liquid ratio of the company
increased from the year 2015-16 (1.673) to 2019-20 (1.698)
Figure: 4.2 showing Liquid Ratio
0
0.5
1
1.5
2
2.5
3
2015-2016 2016-2017 2017-2018 2018-2019 2019-2020
RA
TIO
YEAR
LIQUID RATIO

29
Table 4.3 Showing Debt Equity Ratio
YEAR TOTAL DEBT OWNED FUND DEBTEQUITY
RATIO
2015-2016 16139.6 28178.4 0.572
2016-2017 20053.6 30137 0.665
2017-2018 23266.4 34205.9 0.680
2018-2019 25000.6 36737.4 0.680
2019-2020 29600.5 19322.6 1.531
(Source: company data)
Above table shows the debt equity ratio of the company. The standard norms of
debt equity ratio is 1:1 for public sector and 2:1 for private sector. The lowest
ratio is in the year 2015-2016 and the highest ratio is in the year 2019-20. Low
ratio indicates smallest claim of creditors.
Figure: 4.3 showing Debt-Equity Ratio
0
0.2
0.4
0.6
0.8
1
1.2
1.4
1.6
1.8
2015-2016 2016-2017 2017-2018 2018-2019 2019-2020
RA
TIO
YEAR
DEBT-EQUITY RATIO
30
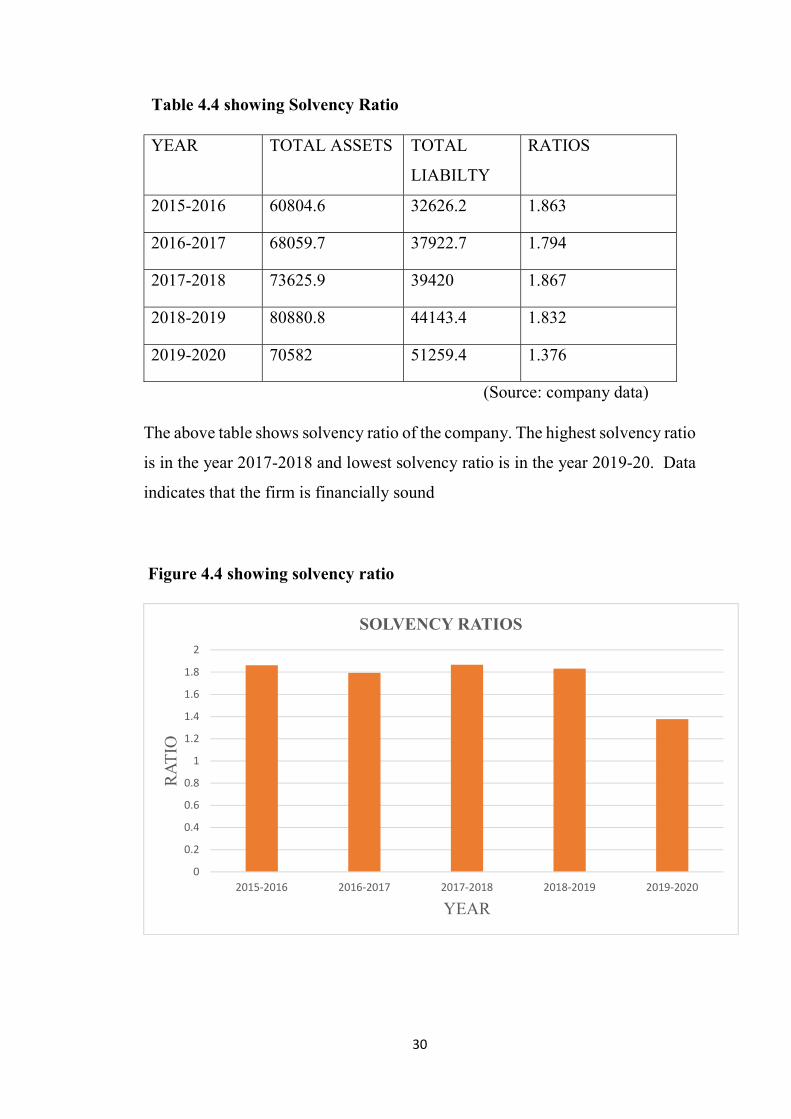
Table 4.4 showing Solvency Ratio
YEAR TOTAL ASSETS
TOTAL
LIABILTY
RATIOS
2015-2016 60804.6 32626.2 1.863
2016-2017 68059.7 37922.7 1.794
2017-2018 73625.9 39420 1.867
2018-2019 80880.8 44143.4 1.832
2019-2020 70582 51259.4 1.376
(Source: company data)
The above table shows solvency ratio of the company. The highest solvency ratio
is in the year 2017-2018 and lowest solvency ratio is in the year 2019-20. Data
indicates that the firm is financially sound
Figure 4.4 showing solvency ratio
0
0.2
0.4
0.6
0.8
1
1.2
1.4
1.6
1.8
2
2015-2016 2016-2017 2017-2018 2018-2019 2019-2020
RA
TIO
YEAR
SOLVENCY RATIOS

31
Table 4.5 showing Proprietary ratio
YEAR SHAREHOLDERS
FUND
TOTAL ASSETS RATIOS
2015-2016 28178.4 24796.1 1.1364
2016-2017 30137 68059.7 0.4428
2017-2018 34205.9 73625.9 0.4645
2018-2019 36737.4 80880.8 0.4542
2019-2020 19322.6 70582 0.2737
(Source: company data)
The above table shows the proprietary ratio of the company. The standard norm
of proprietary ratio is 0.5:1. The proprietary ratio in 2015-16 is 1.136 which
decreased to 0.2737 in 2019-20. It meant that more dependence on borrowed
fund and greater risk for creditors.
Figure 4.5 showing proprietary ratio
0
0.2
0.4
0.6
0.8
1
1.2
2015-2016 2016-2017 2017-2018 2018-2019 2019-2020
RA
TIO
YEAR
PROPRIETARY RATIO
32
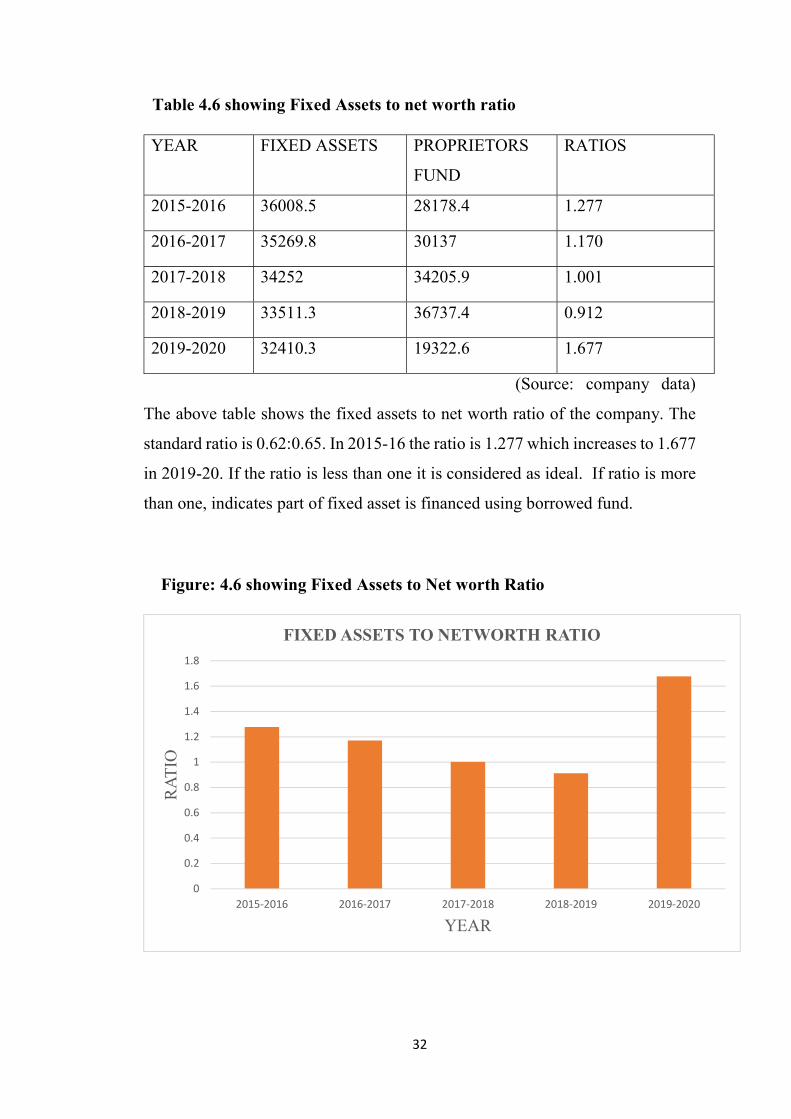
Table 4.6 showing Fixed Assets to net worth ratio
YEAR FIXED ASSETS PROPRIETORS
FUND
RATIOS
2015-2016 36008.5 28178.4 1.277
2016-2017 35269.8 30137 1.170
2017-2018 34252 34205.9 1.001
2018-2019 33511.3 36737.4 0.912
2019-2020 32410.3 19322.6 1.677
(Source: company data)
The above table shows the fixed assets to net worth ratio of the company. The
standard ratio is 0.62:0.65. In 2015-16 the ratio is 1.277 which increases to 1.677
in 2019-20. If the ratio is less than one it is considered as ideal. If ratio is more
than one, indicates part of fixed asset is financed using borrowed fund.
Figure: 4.6 showing Fixed Assets to Net worth Ratio
0
0.2
0.4
0.6
0.8
1
1.2
1.4
1.6
1.8
2015-2016 2016-2017 2017-2018 2018-2019 2019-2020
RA
TIO
YEAR
FIXED ASSETS TO NETWORTH RATIO
33
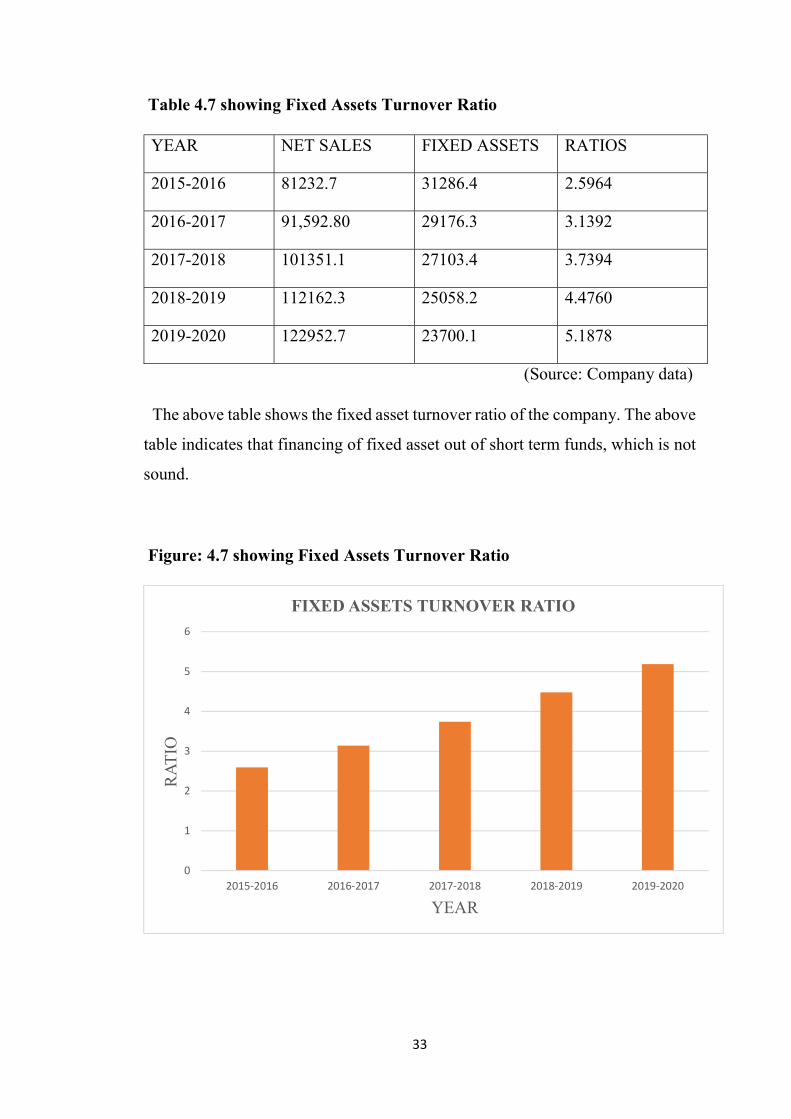
Table 4.7 showing Fixed Assets Turnover Ratio
YEAR NET SALES FIXED ASSETS RATIOS
2015-2016 81232.7 31286.4 2.5964
2016-2017 91,592.80 29176.3 3.1392
2017-2018 101351.1 27103.4 3.7394
2018-2019 112162.3 25058.2 4.4760
2019-2020 122952.7 23700.1 5.1878
(Source: Company data)
The above table shows the fixed asset turnover ratio of the company. The above
table indicates that financing of fixed asset out of short term funds, which is not
sound.
Figure: 4.7 showing Fixed Assets Turnover Ratio
0
1
2
3
4
5
6
2015-2016 2016-2017 2017-2018 2018-2019 2019-2020
RA
TIO
YEAR
FIXED ASSETS TURNOVER RATIO

34
Table 4.8 showing Net Profit Ratio
YEAR NET PROFIT SALES RATIOS
2015-2016 5633 81237 0.069
2016-2017 10014 91593 0.109
2017-2018 12252 101351 0.120
2018-2019 16069 112162 0.143
2019-2020 19696 122953 0.160
(Source: company data)
The above table shows the net profit of the company. The highest net profit
ratio is in the year 2019-2020. The lowest net profit ratio is in the year 2015-16.
Higher the N/P ratio, better is the profitability. This means higher returns to
shareholders.
Figure 4.8 showing Net Profit Ratio
0
0.02
0.04
0.06
0.08
0.1
0.12
0.14
0.16
0.18
2015-2016 2016-2017 2017-2018 2018-2019 2019-2020
RA
TIO
YEAR
NET PROFIT RATIO

35
Table 4.9 Working Capital Turnover Ratio
YEAR REVENUE WORKING
CAPITAL
RATIO
2015-2016 81753.1 10038.8 8.143
2016-2017 92238 16462.9 5.602
2017-2018 101921 24468.8 4.165
2018-2019 112922.7 28820 3.918
2019-2020 123689 8387.4 14.747
(Source: Company data)
The above table shows the working capital turnover ratio. The highest ratio is in
the year 2019-20 and lowest ratio is in the year 2018-19. Higher the ratio better
the efficiency in utilization of resources
Figure 4.9 showing Working Capital Turnover Ratio
0
2
4
6
8
10
12
14
16
2015-2016 2016-2017 2017-2018 2018-2019 2019-2020
RA
TIO
YEAR
WORKING CAPITAL TURNOVER RATIO
36
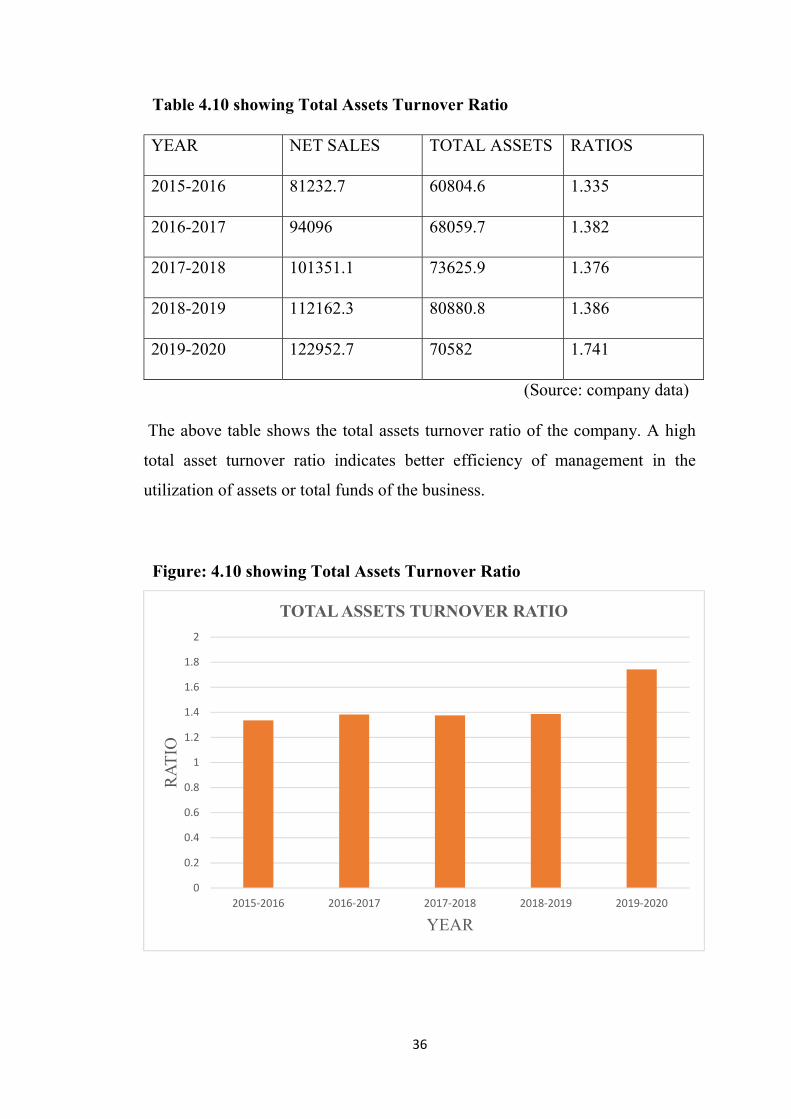
Table 4.10 showing Total Assets Turnover Ratio
YEAR NET SALES TOTAL ASSETS RATIOS
2015-2016 81232.7 60804.6 1.335
2016-2017 94096 68059.7 1.382
2017-2018 101351.1 73625.9 1.376
2018-2019 112162.3 80880.8 1.386
2019-2020 122952.7 70582 1.741
(Source: company data)
The above table shows the total assets turnover ratio of the company. A high
total asset turnover ratio indicates better efficiency of management in the
utilization of assets or total funds of the business.
Figure: 4.10 showing Total Assets Turnover Ratio
0
0.2
0.4
0.6
0.8
1
1.2
1.4
1.6
1.8
2
2015-2016 2016-2017 2017-2018 2018-2019 2019-2020
RA
TIO
YEAR
TOTAL ASSETS TURNOVER RATIO
37
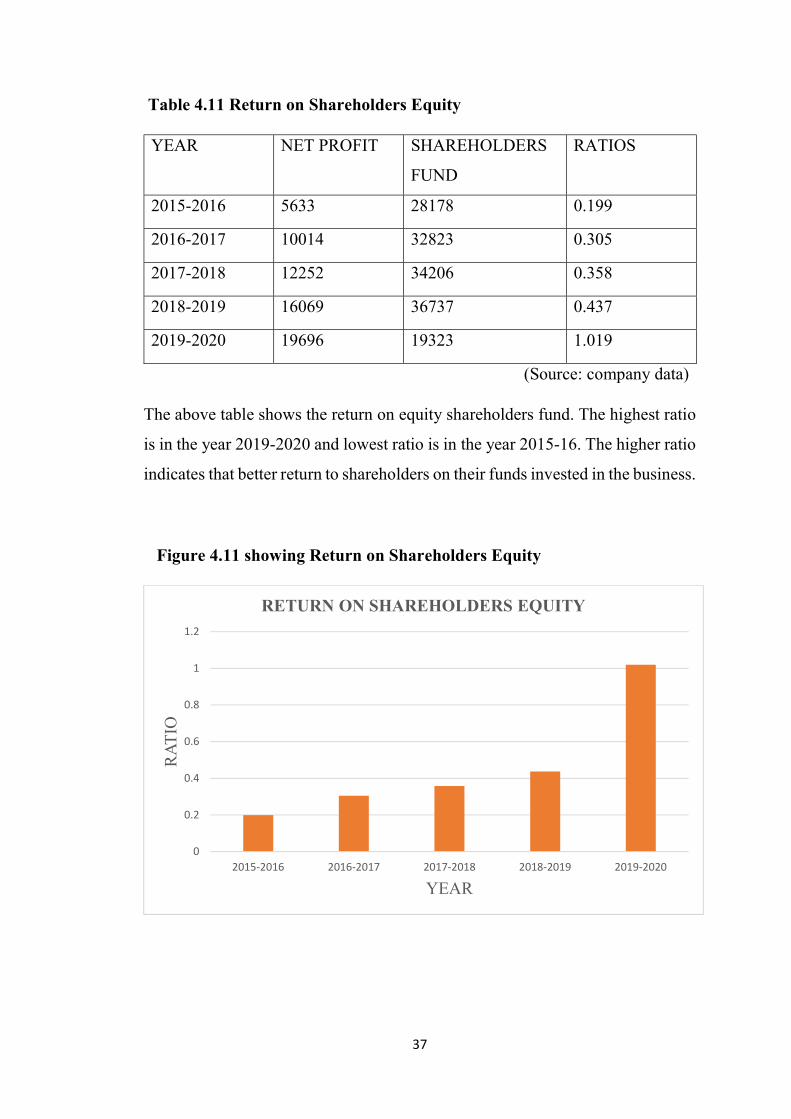
Table 4.11 Return on Shareholders Equity
YEAR NET PROFIT SHAREHOLDERS
FUND
RATIOS
2015-2016 5633 28178 0.199
2016-2017 10014 32823 0.305
2017-2018 12252 34206 0.358
2018-2019 16069 36737 0.437
2019-2020 19696 19323 1.019
(Source: company data)
The above table shows the return on equity shareholders fund. The highest ratio
is in the year 2019-2020 and lowest ratio is in the year 2015-16. The higher ratio
indicates that better return to shareholders on their funds invested in the business.
Figure 4.11 showing Return on Shareholders Equity
0
0.2
0.4
0.6
0.8
1
1.2
2015-2016 2016-2017 2017-2018 2018-2019 2019-2020
RA
TIO
YEAR
RETURN ON SHAREHOLDERS EQUITY

38
Table 4.12 Showing Total Liability to Total Asset Ratio
YEAR LIABILITY ASSET RATIO
2015-2016 16327 68059.7 0.239
2016-2017 14757.3 60804.6 0.242
2017-2018 14927 73625.9 0.202
2018-2019 18549.5 80880.8 0.229
2019-2020 21475.1 70582 0.304
(Source: Company data)
The above table shows current liability to asset ratio. Here the lower ratio
indicates that the assets are not funded by debt. High ratio indicates that a
company itself putting a risk of defaulting on its loan, if interest rates were to
rise suddenly.
Figure 4.12 showing Total liability To Total Asset Ratio
0
0.05
0.1
0.15
0.2
0.25
0.3
0.35
2015-2016 2016-2017 2017-2018 2018-2019 2019-2020
RA
TIO
YEAR
TOTAL LIABILITY TO TOTAL ASSET RATIO
39
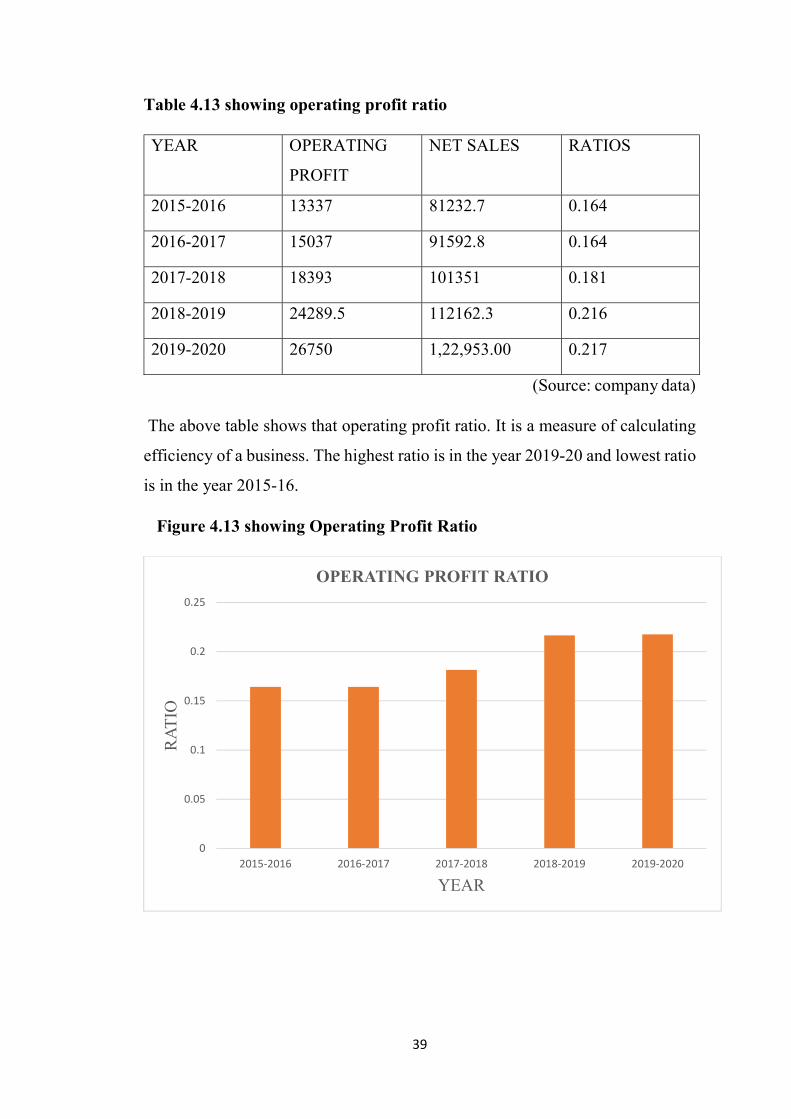
Table 4.13 showing operating profit ratio
YEAR OPERATING
PROFIT
NET SALES RATIOS
2015-2016 13337 81232.7 0.164
2016-2017 15037 91592.8 0.164
2017-2018 18393 101351 0.181
2018-2019 24289.5 112162.3 0.216
2019-2020 26750 1,22,953.00 0.217
(Source: company data)
The above table shows that operating profit ratio. It is a measure of calculating
efficiency of a business. The highest ratio is in the year 2019-20 and lowest ratio
is in the year 2015-16.
Figure 4.13 showing Operating Profit Ratio
0
0.05
0.1
0.15
0.2
0.25
2015-2016 2016-2017 2017-2018 2018-2019 2019-2020
RA
TIO
YEAR
OPERATING PROFIT RATIO
40
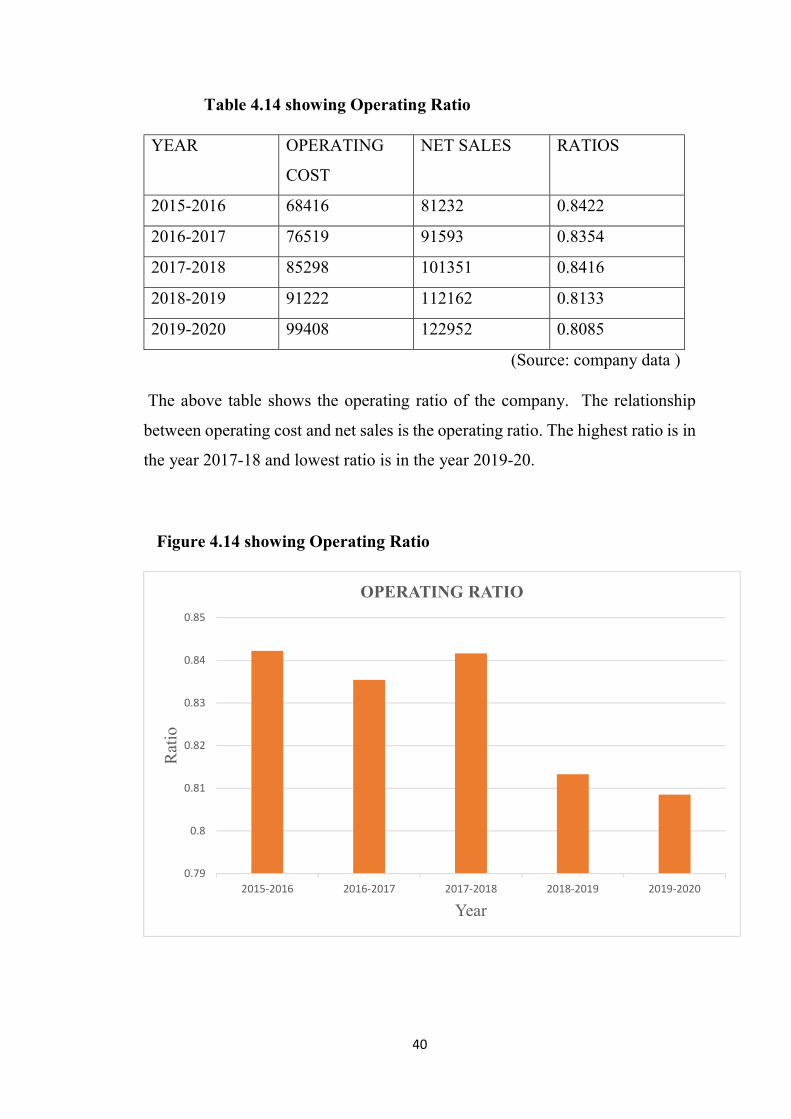
Table 4.14 showing Operating Ratio
YEAR OPERATING
COST
NET SALES RATIOS
2015-2016 68416 81232 0.8422
2016-2017 76519 91593 0.8354
2017-2018 85298 101351 0.8416
2018-2019 91222 112162 0.8133
2019-2020 99408 122952 0.8085
(Source: company data )
The above table shows the operating ratio of the company. The relationship
between operating cost and net sales is the operating ratio. The highest ratio is in
the year 2017-18 and lowest ratio is in the year 2019-20.
Figure 4.14 showing Operating Ratio
0.79
0.8
0.81
0.82
0.83
0.84
0.85
2015-2016 2016-2017 2017-2018 2018-2019 2019-2020
Rat
io
Year
OPERATING RATIO

41
4.15 Common Size Balance Sheet
Common size balance sheet for the year 2018-19, 2019-20
(Source: company data)
Non-current assets have increased from 41.43 in 2018-19 to 45.92 in 2019-20.
The current assets had decreased from 58.57 in 2018-19 to 54.08 in 2019-20.
Total equity in the year 2018-19 is 45.43 which decreased to 27.38 in the year
2019-20. The non-current liability during the year 2018-19 is 31.64 which
increased to 42.20 in 2019-20. The current liabilities have increased from 22.93
in 2018-19 to 30.42 in 2019-20.
Particulars Absolute amount Percentages 2018-19 2019-20 2018-2019 2019-20
I. Assets Non-current Assets 33511.3 32410.3 41.43 45.92
Current Assets 47369.5 38171.7 58.57 54.08 Total Assets 80880.8 70582 100 100
II. Equity and
Liabilities
Total Equity 36737.4 19322.6 45.43 27.38 Non-current Liabilities
25593.9 29784.3 31.64 42.20
Current liabilities 18549.5 21475.1 22.93 30.42 Total Equity and
Liability 80880.8 70582 100 100

CHAPTER Ⅴ
FINDINGS, SUGGESTIONS AND
CONCLUSION
42
5.1 Findings
The current ratio of the company in the year 2019-20 and 2015-16 is not
satisfactory. It is less than ideal ratio but in the year 2016-17, 2017-18,
2018-2019 is satisfactory it is more than 2.00. The company has to take
necessary steps to increase the current ratio as per previous years
The ideal quick ratio is 1:1. In all financial year company attained above
the ideal ratio. At first company shows increasing trend and in the year
2019-20 there is decrease in the ratio. The company has to take proper
measures to increase the quick ratio as per previous year.
Debt-equity ratio of private sector is 2:1. The company’s debt-equity ratio
is showing increasing trend but it’s less than ideal ratio. The company is
showing highest ratio in the year 2019-20. The company has to take
necessary steps to improve their debt-equity ratio.
A high solvency ratio indicates that the firm is depending more on
outsider’s fund. Here the company’s ratio are less than 1, therefore
financial risk associated with business is low and creditors is safe.
The standard norm of proprietary ratio is 0.5:1. Here the company shows
decreasing trend from the year 2016-17. The low ratio indicates more
dependence on borrowed funds.
The ideal fixed asset net worth ratio is 0.62:0.65. Here the company have
ratio of more than 1 which indicates part of fixed asset is used to financed
using borrowed fund.
The ideal fixed asset turnover ratio is 1.1. Here the company shows the
ratio of more than 1.00 which indicates financing of fixed assets out of
short term funds, which is not sound.
The company shows highest ratio of net profit in the year 2019-20. The
higher ratio indicates the better profitability but still the company has to
adopt strategies to increase profit.
43
The highest working capital turnover ratio shown in the year 2019-20.
There is an increasing trend in the working capital turnover ratio of the
company which indicates better efficiency in utilization of resources.
The highest total asset turnover ratio is in the year 2019-20. The company
shows increasing trend in total asset turnover ratio. The higher ratio
indicates the better utilization of assets or total fund of the business.
The highest Return on equity shareholders fund ratio is in the year 2019-
20. The company shows the increasing trend in the return on equity
shareholders fund which indicates the shareholders receive better return
to the fund invested by them.
The total liability to total asset ratio of the company shows that a company
itself putting in a risk of defaulting on its loan if interest rates were to rise
suddenly.
The highest operating profit ratio is in the year 2019-20. The company
shows increasing trend and it indicates greater efficiency in the business
The operating ratio of the firm shows the ratio of expense of the company.
Here the operating ratio of the company is less than 1and shows
decreasing trend which indicates expenses are becoming an increasingly
smaller percentage.
The common size statement of the company shows the current assets had
decreased. The company should take proper measure to restore and
maintain current assets

44
5.2 Suggestions
Based on the above mentioned findings the following are the suggestions:-
By analysing composition of current assets and liquid assets, it is found
that the amount of liquid cash kept in the company is low, so the company
has to keep an adequate amount as cash and bank balance. So as to meet
various short term liabilities.
Fluctuations in the ratios show that there are some kind of management
problems or production problems that exist in Nestle India pvt ltd. the top
management should take necessary step to assemble the management and
workers in best way.
The pricing strategies should be in such a way that it should be affordable
to all kinds of customers and to improve supply chain policies.
In order to improve it’s solvency as well as liquidity, the company has an
opportunity of trading on equity even to the legitimate extent, the
company may request bank to convert a part of the overdraft in to the
medium term loan, which would ultimately the financial health of the
company.
It is advisable to take more efforts to increase the overall efficiency of the
business.
It’s advisable to reduce inventory, reduce overheads, reduce overall
direct costs and adopt strategies to increase profit
45
5.3 Conclusion
Nestle good food, good life captures the very essence of Nestle and the promises
they commit to themselves every day, everywhere as the leading nutrition,
health and wellness company. The study on financial analysis of nestle India
pvt. Ltd shows that company’s overall performance is good. This project helps
to understand various aspects of financial side of company. Nestle India ltd. is
one of the leading company in food processing industry. The liquidity and
profitability of the company which is only satisfactory. The company wants to
take proper measures to increase it. The solvency capability of the company is
increasing. The company distributes dividend every year to its shareholders. The
company grew significantly during these years. There were many new products
and services that were launched during this time. Increased demand of products
helps the company remain strong. Nestle has known for process being oriented
with focus on quality and cost saving. The company always being careful to
bring unique taste and their own innovations in product. The changing lifestyle
and concepts of Indians have contributing much to the growth of the company.

BIBLIOGRAPHY
JOURNALS
❖ Mital Menanpara And Dr. Vijay Pithadia. (2010). A study on financial
performance of selected companies during pre-post merger and
acquisition. Merger and acquisition, Vol 1(Issue 4), 7.
❖ Sharma Nishi. (2011). Financial performance of passenger and
commercial vehicle segment of automobile industry. International
research of journal of vehicle segment in automobile industry.
❖ Debasish Rei And Debasish Sur. (2001). Case study of Cadbury India
ltd.. Profitability analysis of indian food products industry.
❖ Imran Khan. (2016). Case study of Britannia pvt. Ltd. Britannia analysis
of financial performance, Vol 1(48), 50.
❖ Dr. Ramya And Dr.S Kavitha. (2017). Study on financial analysis of
maruti suzuki India ltd. company. Analysis of financial statements,
(157), 191
❖ Singh Amarjit And Gupta Vinod. (2012). Indian automobile industry.
International journal of research in commerce and management, Vol
3(Issue 10), 200.
❖ Huda Salhe Meften And Manish Roy Tirkey. (2014). Analysis of
financial statements of Hindustan petroleum ltd. European academic
research, Vol 2 (Issue-8), 60.
❖ Sneha Lata And Dr.Robin Anand. (2017). Financial performance
analysis of Mahindra and Mahindra company- A pre and post merger
perspective. International journal of enhanced research in management,
Vol 6(Issue 11), 100.
❖ Dr. M Ravichandran And M. Venkata Subramanian. (2016). A study on
financial performance analysis of force motors Ltd. International journal
for innovative research in science and technology, Vol 2(Issue 11), 60.
❖ Vijayakumar A. (1996). Assessment of corporate liquidity. Journal for
bloomers of research, Vol 4(Issue 4), 100.

BOOKS
❖ Bhattacharyya debarshi (2011). Management Accounting. New delhi:
Dorling Kindersley Pvt.Ltd.
❖ Shashi k Gupta & R k sharma “Management Accounting”, kalyani
publications,11th revised edition.
❖ A Vinod “Accounting for management”, Calicut university, revised
edition 2017.
❖ Dr. K venugopalan, “Business Research Methods”, Calicut university
Central co-operative stories ltd. No.4347 Calicut University, 2016.
WEBSITES
❖ www.nestle.in
❖ www.wikipedia.org
❖ www.investopedia.com

ANNEXURE
38
NESTLÉ INDIA LIMITED
BALANCE SHEET AS AT DECEMBER 31, 2015NOTES 2015
(` in million)2014
(` in million)EQUITY AND LIABILITIES
SHAREHOLDERS’ FUNDSShare capital 3 964.2 964.2 Reserves and surplus 4 27,214.2 28,178.4 27,407.9 28,372.1 NON - CURRENT LIABILITIES Long-term borrowings 5 167.9 154.6 Deferred tax liabilities (net) 6 1,729.3 2,227.2 Long-term provisions 7 15,971.7 17,868.9 13,886.6 16,268.4 CURRENT LIABILITIES Short-term borrowings 8 9.4 41.1 Trade payables
Payable to micro enterprises and small enterprises 42 37.5 24.1 Other payables 7,397.9 7,263.0
Other current liabilities 9 4,659.3 4,095.7 Short-term provisions 10 2,653.2 14,757.3 2,130.6 13,554.5
60,804.6 58,195.0 ASSETS
NON - CURRENT ASSETS Fixed assets 11
Tangible assets 28,978.5 31,766.4 Capital work-in-progress 2,307.9 2,447.8
31,286.4 34,214.2 Non-current investments 12 3,417.8 3,044.6 Long-term loans and advances 13 1,304.3 1,299.5
36,008.5 38,558.3CURRENT ASSETS Current investments 14 9,831.4 5,073.6 Inventories 15 8,208.1 8,441.0 Trade receivables 16 784.2 991.0 Cash and bank balances 17 4,995.5 4,458.2 Short-term loans and advances 18 829.7 520.7 Other current assets 19 147.2 24,796.1 152.2 19,636.7
60,804.6 58,195.0See accompanying notes 1 to 47 forming part of the financial statements
SURESH NARAYANAN SHOBINDER DUGGAL B. MURLI Chairman and Managing Director Director - Finance & Control and CFO Sr. VP - Legal & Company Secretary (DIN-07246738) (DIN-00039580) In terms of our report attachedFebruary 12, 2016 For A.F. FERGUSON & CO.Gurgaon Firm’s Registration No. - 112066W Chartered AccountantsFebruary 12, 2016 (MANJULA BANERJI)New Delhi Partner
2 Nestle AR 2015-16.indd 38 3/28/2016 7:18:24 PM
39
STATEMENT OF PROFIT AND LOSSFOR THE YEAR ENDED DECEMBER 31, 2015
NOTES2015
(` in million)2014
(` in million)REVENUEGross Sales of products 20 84,304.4 101,295.0Less: Excise duty 3,071.7 81,232.7 3,232.3 98,062.7 Other operating revenues 20 520.4 485.7
A Total revenue from operations 81,753.1 98,548.4 EXPENSES 21
Cost of materials consumed 22 33,588.7 44,825.4 Purchases of stock-in-trade 980.7 1,088.5 Changes in inventories of finished goods, work-in-progress and stock-in-trade
23 119.7 (674.3)
Employee benefits expense 24 8,374.3 7,722.2 Depreciation 11 3,472.6 3,375.4 Other expenses 25 21,264.3 23,840.3 Impairment loss on fixed assets 11 282.2 81.1 Net provision for contingencies (from operations) 28 333.1 364.3
B Total Expenses 68,415.6 80,622.9 C PROFIT FROM OPERATIONS (A-B) (Refer note 1.1) 13,337.5 17,925.5 D Other income 26 1,100.9 873.2 E Finance costs 27 32.9 142.3 F Employee benefits expense due to passage of time 29 753.2 648.3 G Net provision for contingencies (others) 28 301.5 249.5 H PROFIT BEFORE EXCEPTIONAL ITEMS, CORPORATE
SOCIAL RESPONSIBILITY EXPENSE AND TAXATION (C+D-E-F-G)
13,350.8 17,758.6
I Exceptional items - Charge / (Credit) 30 5,008.4 (70.0)J Corporate social responsibility expense 31 206.1 85.1 K PROFIT BEFORE TAXATION (H-I-J) 8,136.3 17,743.5 L Tax expense
Current tax 2,898.9 5,824.1 Deferred tax (395.3) 2,503.6 72.5 5,896.6
M PROFIT AFTER TAXATION (K-L) 5,632.7 11,846.9 Weighted average number of equity shares outstanding Nos. 96,415,716 96,415,716 Basic and Diluted Earnings Per Share (Face value ` 10) ` 58.42 122.87
See accompanying notes 1 to 47 forming part of the financial statements
NESTLÉ INDIA LIMITED
SURESH NARAYANAN SHOBINDER DUGGAL B. MURLI Chairman and Managing Director Director - Finance & Control and CFO Sr. VP - Legal & Company Secretary (DIN-07246738) (DIN-00039580) In terms of our report attachedFebruary 12, 2016 For A.F. FERGUSON & CO.Gurgaon Firm’s Registration No. - 112066W Chartered AccountantsFebruary 12, 2016 (MANJULA BANERJI)New Delhi Partner
2 Nestle AR 2015-16.indd 39 3/28/2016 7:18:24 PM

38
NESTLÉ INDIA LIMITED
BALANCE SHEET AS AT DECEMBER 31, 2016NOTES 2016
(` in million)2015
(` in million)EQUITY AND LIABILITIES
SHAREHOLDERS’ FUNDSShare capital 3 964.2 964.2Reserves and surplus 4 29,172.8 30,137.0 27,214.2 28,178.4NON - CURRENT LIABILITIESLong-term borrowings 5 331.5 167.9Deferred tax liabilities (net) 6 1,542.1 1,729.3Long-term provisions 7 19,722.1 21,595.7 15,971.7 17,868.9CURRENT LIABILITIESShort-term borrowings 8 - 9.4Trade payables
Payable to micro enterprises and small enterprises 42 48.8 37.5Other payables 7,942.8 7,456.6
Other current liabilities 9 5,128.4 4,659.3Short-term provisions 10 3,207.0 16,327.0 2,653.2 14,816.0
68,059.7 60,863.3ASSETS
NON - CURRENT ASSETSFixed assets 11
Tangible assets 27,294.6 28,978.5Capital work-in-progress 1,881.7 2,307.9
29,176.3 31,286.4Non-current investments 12 4,743.1 3,417.8Long-term loans and advances 13 1,350.4 1,304.3
35,269.8 36,008.5CURRENT ASSETSCurrent investments 14 12,750.4 9,831.4Inventories 15 9,431.8 8,208.1Trade receivables 16 979.3 784.2Cash and bank balances 17 8,800.0 4,995.5Short-term loans and advances 18 570.2 888.4Other current assets 19 258.2 32,789.9 147.2 24,854.8
68,059.7 60,863.3See accompanying notes 1 to 47 forming part of the financial statements
SURESH NARAYANAN SHOBINDER DUGGAL B. MURLI Chairman and Managing Director Director - Finance & Control and CFO Sr. VP - Legal & Company Secretary (DIN-07246738) (DIN-00039580) In terms of our report attachedFebruary 15, 2017 For A.F. FERGUSON & CO.Gurgaon Firm’s Registration No. - 112066W Chartered AccountantsFebruary 15, 2017 (MANJULA BANERJI)New Delhi Partner
2 Nestle AR 2016-17 070417.indd 38 4/7/2017 4:17:06 PM
39
STATEMENT OF PROFIT AND LOSSFOR THE YEAR ENDED DECEMBER 31, 2016
NOTES 2016(` in million)
2015(` in million)
REVENUE
Gross Sales of products 20 94,917.2 84,304.4Less: Excise duty 3,324.4 91,592.8 3,071.7 81,232.7Other operating revenues 20 645.2 520.4
A Total revenue from operations 92,238.0 81,753.1EXPENSES 21
Cost of materials consumed 22 37,750.9 33,588.7Purchases of stock-in-trade 1,153.8 980.7Changes in inventories of finished goods, work-in-progress and stock-in-trade
23 (107.8) 119.7
Employee benefits expense 24 9,859.6 8,374.3Depreciation 11 3,536.2 3,472.6Other expenses 25 23,790.3 21,264.3Impairment loss on fixed assets 11 118.3 282.2Net provision for contingencies (from operations) 28 418.0 333.1
B Total Expenses 76,519.3 68,415.6C PROFIT FROM OPERATIONS (A-B) (Refer Note - 1.1) 15,718.7 13,337.5D Other income 26 1,493.9 1,100.9E Finance costs 27 35.1 32.9F Employee benefits expense due to passage of time 29 874.0 753.2G Net provision for contingencies (others) 28 1,266.7 301.5H PROFIT BEFORE EXCEPTIONAL ITEMS, CORPORATE
SOCIAL RESPONSIBILITY EXPENSE AND TAXATION (C+D-E-F-G)
15,036.8 13,350.8
I Exceptional items 30 307.8 5,008.4J Corporate social responsibility expense 31 313.6 206.1K PROFIT BEFORE TAXATION (H-I-J) 14,415.4 8,136.3L Tax expense
Current tax 5,337.1 2,898.9 Deferred tax (187.1) 5,150.0 (395.3) 2,503.6
M PROFIT AFTER TAXATION (K-L) 9,265.4 5,632.7Weighted average number of equity shares outstanding Nos. 96,415,716 96,415,716Basic and Diluted Earnings Per Share (Face value ` 10) ` 96.10 58.42
See accompanying notes 1 to 47 forming part of the financial statements
NESTLÉ INDIA LIMITED
SURESH NARAYANAN SHOBINDER DUGGAL B. MURLI Chairman and Managing Director Director - Finance & Control and CFO Sr. VP - Legal & Company Secretary (DIN-07246738) (DIN-00039580) In terms of our report attachedFebruary 15, 2017 For A.F. FERGUSON & CO.Gurgaon Firm’s Registration No. - 112066W Chartered AccountantsFebruary 15, 2017 (MANJULA BANERJI)New Delhi Partner
2 Nestle AR 2016-17 070417.indd 39 4/7/2017 4:17:07 PM

38
NESTLÉ INDIA LIMITED
BALANCE SHEET AS AT 31 DECEMBER 2017NOTES As at
31 December 2017(` in million)
As at31 December 2016
(` in million)
As at1 January 2016
(` in million)ASSETSNon-current assetsProperty, Plant and Equipment 5 26,161.8 27,301.4 28,978.5Capital work-in-progress 941.6 1,881.7 2,307.9Financial Assets
Investments 6 5,852.8 4,743.1 3,417.8Loans 7 463.5 643.7 627.4
Other non-current assets 8 832.3 706.7 676.934,252.0 35,276.6 36,008.5
Current assetsInventories 9 9,024.7 9,400.6 8,208.1Financial Assets
Investments 10 13,935.9 12,813.5 9,879.4Trade receivables 11 889.7 979.3 784.2Cash and cash equivalents 12 14,476.9 8,693.2 4,892.7Bank Balances other than cash and cash equivalents 13 97.3 106.8 102.8Loans 14 288.0 166.0 181.7Other financial assets 15 427.9 326.7 222.7
Current tax assets 63.9 27.3 327.6Other current assets 16 169.6 314.6 304.8
39,373.9 32,828.0 24,904.0Total Assets 73,625.9 68,104.6 60,912.5
EQUITY AND LIABILITIESEQUITYEquity Share Capital 17 964.2 964.2 964.2Other Equity 18 33,241.7 31,859.1 29,394.4
34,205.9 32,823.3 30,358.6LIABILITIESNon-current liabilitiesFinancial Liabilities
Borrowings 19 351.4 331.5 167.9Provisions 20 22,915.9 19,722.1 15,971.7Deferred tax liabilities (net) 21 1,219.6 1,553.4 1,747.0Other non-current liabilities 22 6.0 6.8 -
24,492.9 21,613.8 17,886.6Current liabilitiesFinancial Liabilities
Borrowings 23 - - 9.4Trade payables 24 9,846.4 7,991.6 7,494.1Other financial liabilities 25 3,140.2 3,116.4 2,492.7
Provisions 26 874.6 538.0 506.4Other current liabilities 27 1,065.9 2,021.5 2,164.7
14,927.1 13,667.5 12,667.3Total Equity and liabilities 73,625.9 68,104.6 60,912.5
See accompanying notes 1 to 54 forming part of the financial statementsAs per our report of even date attached For and on behalf of the Board of DirectorsFor B S R & CO. LLPF.R.N. : 101248W/W-100022Chartered Accountants
JITEN CHOPRA SURESH NARAYANAN SHOBINDER DUGGAL B. MURLIPartner Chairman and Managing Director Director - Finance & Control and CFO Sr. VP - Legal & Company SecretaryMembership No. - 092894 (DIN-07246738) (DIN-00039580)
14 February 2018 14 February 2018Gurugram Gurugram
Nestle AR 2017-18 030418.indd 38 4/3/2018 10:17:16 AM
39
STATEMENT OF PROFIT AND LOSSFOR THE YEAR ENDED 31 DECEMBER 2017
NOTES Year ended31 December 2017
(` in million)
Year ended31 December 2016
(` in million)A INCOME
Domestic Sales 94,724.5 87,530.8Export Sales 6,626.6 6,565.2Sale of products 35 101,351.1 94,096.0Other operating revenues 28 570.7 649.7
i Revenue from operations 101,921.8 94,745.7ii Other Income 29 1,769.2 1,509.0
Total Income 103,691.0 96,254.7
B EXPENSES
i Cost of materials consumed 30 42,316.6 37,750.9ii Purchases of stock-in-trade 1,747.6 1,153.8iii Changes in inventories of finished goods, work-in-progress
and stock-in-trade31 (795.6) (76.6)
iv Excise duty 1,825.8 3,332.3v Employee benefits expense 32 10,174.5 9,015.7vi Finance costs (including interest cost on employee benefit
plans)33 919.0 909.1
vii Depreciation and Amortisation 5 3,422.5 3,536.7viii Other expenses 34 24,170.2 22,954.6ix Impairment loss on property, plant and equipment 5 371.8 118.3
Net provision for contingencies 39x - Operations 383.6 418.0xi - Others 492.9 876.5 1,266.7 1684.7xii Corporate social responsibility expense 40 269.1 313.6
Total Expenses 85,298.0 80,693.1
C PROFIT BEFORE EXCEPTIONAL ITEMS AND TAX (A-B) 18,393.0 15,561.6D Exceptional items 41 - 107.8E PROFIT BEFORE TAX (C-D) 18,393.0 15,453.8F Tax expense
Current tax 42 6,491.7 5,611.9Deferred tax 42 (350.6) 6,141.1 (171.7) 5,440.2
G PROFIT AFTER TAX (E-F) 12,251.9 10,013.6
NESTLÉ INDIA LIMITED
Nestle AR 2017-18 030418.indd 39 4/3/2018 10:17:16 AM
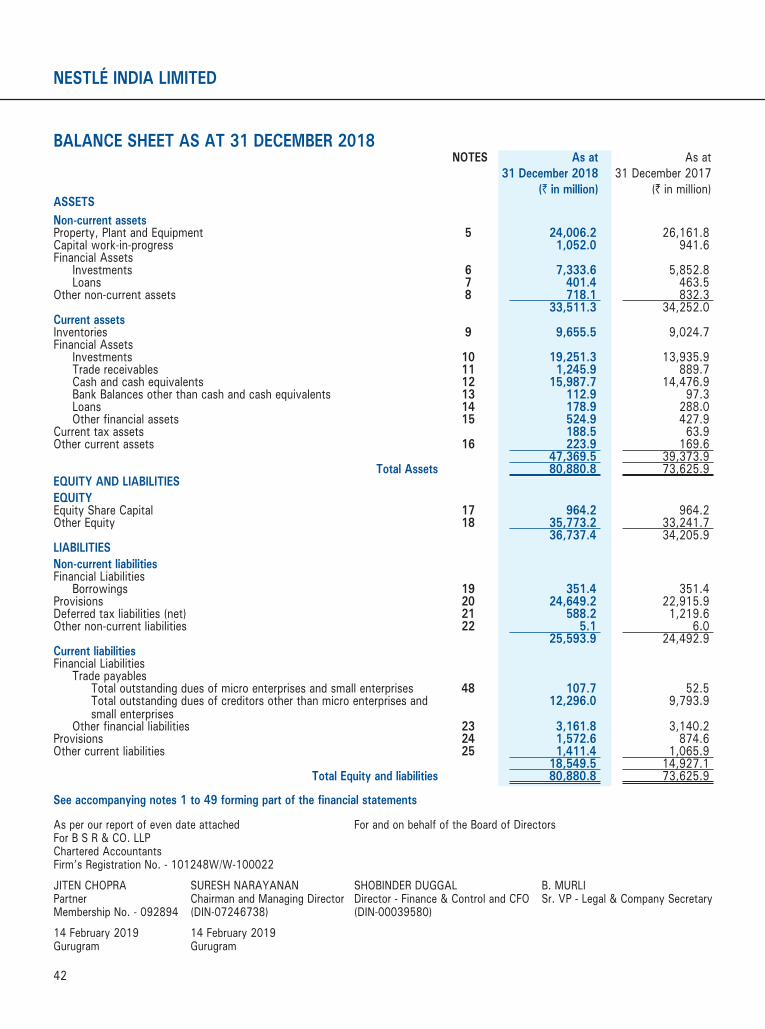
42
NESTLÉ INDIA LIMITED
BALANCE S EE AS A 1 DECEMBER 201NOTES As at
1 December 201(` in million)
Asat31December2017
(`inmillion)ASSETSNon-current assetsProperty,PlantandEquipment 5 2 ,00 .2 26,161.8Capitalwork-in-progress 1,052.0 941.6FinancialAssetsInvestments , . 5,852.8Loans 7 01. 463.5
Othernon-currentassets 1 .1 832.3,511. 34,252.0
Current assetsInventories 9 , 55.5 9,024.7FinancialAssetsInvestments 10 1 ,251. 13,935.9Tradereceivables 11 1,2 5. 889.7Cashandcashequivalents 12 15, . 14,476.9BankBalancesotherthancashandcashequivalents 13 112. 97.3Loans 14 1 . 288.0Otherfinancialassets 15 52 . 427.9
Currenttaxassets 1 .5 63.9Othercurrentassets 1 22 . 169.6
, .5 39,373.9Total Assets 0, 0. 73,625.9
EQUITY AND LIABILITIESEQUITYEquityShareCapital 17 .2 964.2OtherEquity 1 5, .2 33,241.7
, . 34,205.9LIABILITIESNon-current liabilitiesFinancialLiabilitiesBorrowings 19 351.4 351.4
Provisions 20 2 , .2 22,915.9Deferredtaxliabilities(net) 21 5 .2 1,219.6Othernon-currentliabilities 22 5.1 6.0
25,5 . 24,492.9Current liabilitiesFinancialLiabilitiesTradepayablesTotaloutstandingduesofmicroenterprisesandsmallenterprises 10 . 52.5Totaloutstandingduesofcreditorsotherthanmicroenterprisesandsmallenterprises
12,2 .0 9,793.9
Otherfinancialliabilities 2 ,1 1. 3,140.2Provisions 2 1,5 2. 874.6Othercurrentliabilities 25 1, 11. 1,065.9
1 ,5 .5 14,927.1Total Equity and liabilities 0, 0. 73,625.9
See accompanying notes 1 to forming part of the financial statements
Asperourreportofevendateattached ForandonbehalfoftheBoardofDirectorsForBSR CO.LLPCharteredAccountantsFirm’sRegistrationNo.-101248W/W-100022
ITENCHOPRA SURESHNARA ANAN SHOBINDERDUGGAL B.MURLIPartner ChairmanandManagingDirector Director-Finance ControlandCFO Sr.VP-Legal CompanySecretaryMembershipNo.-092894 (DIN-07246738) (DIN-00039580)
14February2019 14February2019Gurugram Gurugram
Nestle AR 2018-19 110319.indd 42 11-Mar-19 9:29:46 AM
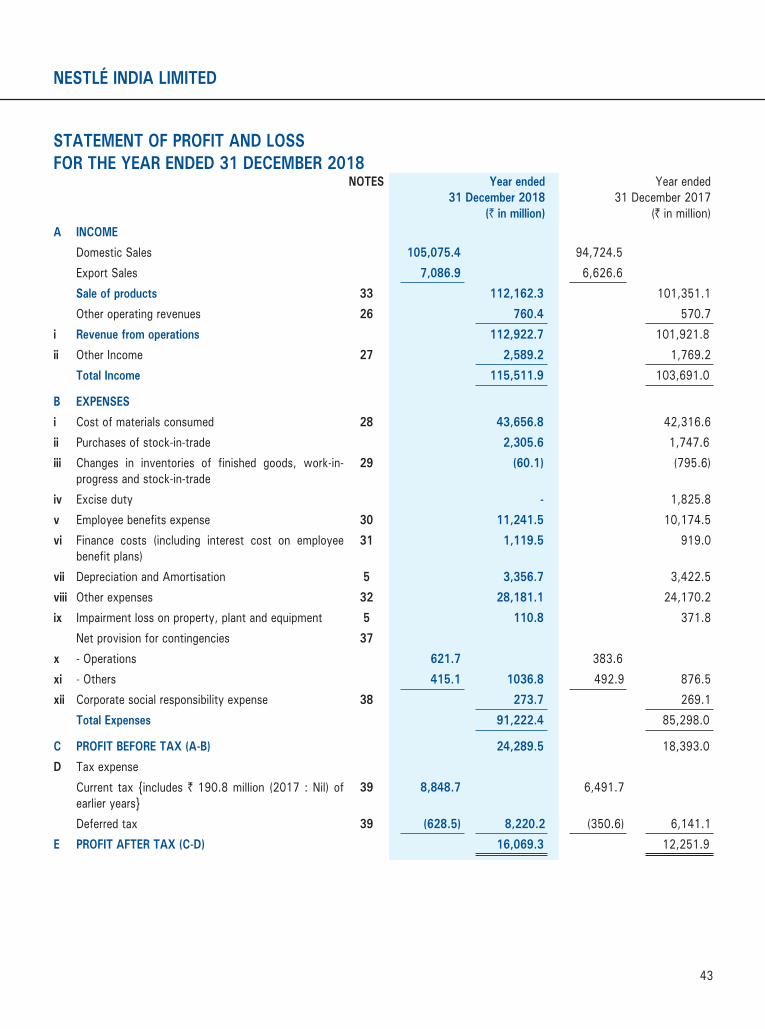
43
STATEMENT OF PROFIT AND LOSSFOR THE YEAR ENDED 1 DECEMBER 201
NOTES Year ended1 December 201
(` in million)
earended31December2017
(`inmillion)A INCOME
DomesticSales 105,0 5. 94,724.5ExportSales ,0 . 6,626.6Sale of products 33 112,1 2. 101,351.1Otheroperatingrevenues 2 0. 570.7
i Revenue from operations 112, 22. 101,921.8ii OtherIncome 2 2,5 .2 1,769.2
Total Income 115,511. 103,691.0
B EXPENSES
i Costofmaterialsconsumed 2 , 5 . 42,316.6ii Purchasesofstock-in-trade 2, 05. 1,747.6iii Changes in inventories of finished goods, work-in-
progressandstock-in-trade2 ( 0.1) (795.6)
iv Exciseduty - 1,825.8v Employeebenefitsexpense 0 11,2 1.5 10,174.5vi Finance costs (including interest cost on employee
benefitplans)31 1,11 .5 919.0
vii DepreciationandAmortisation 5 , 5 . 3,422.5viii Otherexpenses 2 2 ,1 1.1 24,170.2ix Impairmentlossonproperty,plantandequipment 5 110. 371.8
Netprovisionforcontingencies 37
x -Operations 21. 383.6xi -Others 415.1 10 . 492.9 876.5xii Corporatesocialresponsibilityexpense 2 . 269.1
Total Expenses 1,222. 85,298.0
C PRO I BE ORE A (A B) 2 ,2 .5 18,393.0D Taxexpense
Current tax includes`190.8million (2017 :Nil)ofearlieryears
39 , . 6,491.7
Deferredtax 39 ( 2 .5) ,220.2 (350.6) 6,141.1E PRO I A ER A (C D) 1 ,0 . 12,251.9
NESTLÉ INDIA LIMITED
Nestle AR 2018-19 110319.indd 43 11-Mar-19 9:29:47 AM
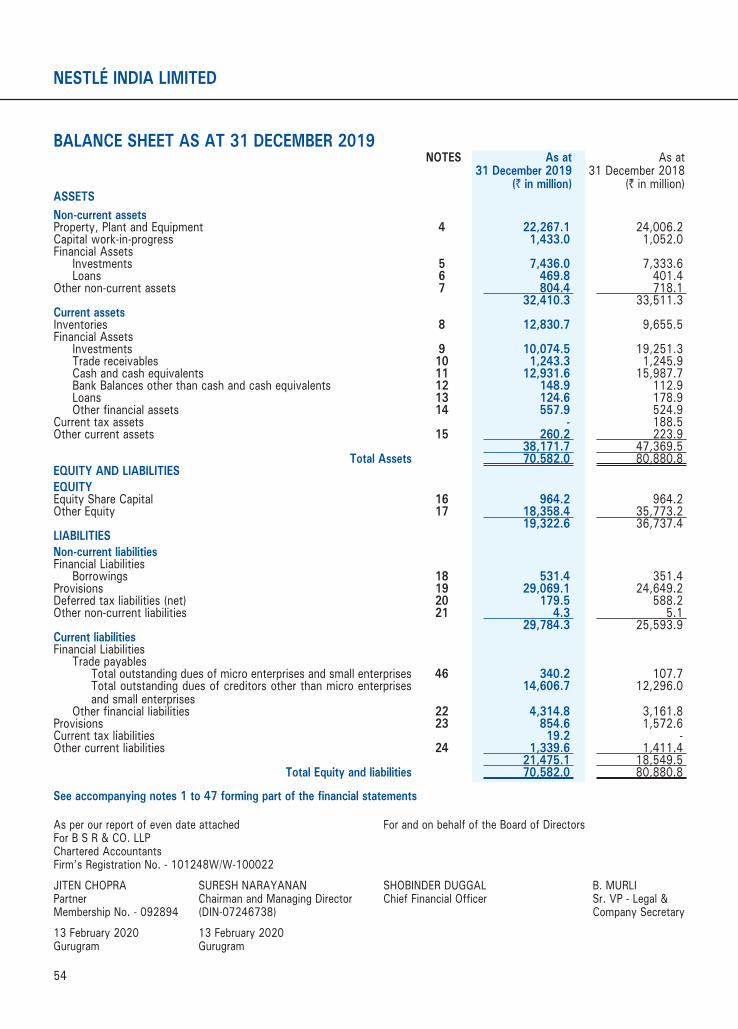
54
NESTLÉ INDIA LIMITED
BALANCE SHEET AS AT 31 DECEMBER 2019NOTES As at
31 December 2019(` in million)
As at31 December 2018
(` in million)ASSETSNon-current assetsProperty, Plant and Equipment 4 22,267.1 24,006.2Capital work-in-progress 1,433.0 1,052.0Financial Assets
Investments 5 7,436.0 7,333.6Loans 6 469.8 401.4
Other non-current assets 7 804.4 718.132,410.3 33,511.3
Current assetsInventories 8 12,830.7 9,655.5Financial Assets
Investments 9 10,074.5 19,251.3Trade receivables 10 1,243.3 1,245.9Cash and cash equivalents 11 12,931.6 15,987.7Bank Balances other than cash and cash equivalents 12 148.9 112.9Loans 13 124.6 178.9Other financial assets 14 557.9 524.9
Current tax assets - 188.5Other current assets 15 260.2 223.9
38,171.7 47,369.5Total Assets 70,582.0 80,880.8
EQUITY AND LIABILITIESEQUITYEquity Share Capital 16 964.2 964.2Other Equity 17 18,358.4 35,773.2
19,322.6 36,737.4LIABILITIESNon-current liabilitiesFinancial Liabilities
Borrowings 18 531.4 351.4Provisions 19 29,069.1 24,649.2Deferred tax liabilities (net) 20 179.5 588.2Other non-current liabilities 21 4.3 5.1
29,784.3 25,593.9Current liabilitiesFinancial Liabilities
Trade payablesTotal outstanding dues of micro enterprises and small enterprises 46 340.2 107.7Total outstanding dues of creditors other than micro enterprises and small enterprises
14,606.7 12,296.0
Other financial liabilities 22 4,314.8 3,161.8Provisions 23 854.6 1,572.6Current tax liabilities 19.2 -Other current liabilities 24 1,339.6 1,411.4
21,475.1 18,549.5Total Equity and liabilities 70,582.0 80,880.8
See accompanying notes 1 to 47 forming part of the financial statements
As per our report of even date attached For and on behalf of the Board of DirectorsFor B S R & CO. LLPChartered AccountantsFirm’s Registration No. - 101248W/W-100022
JITEN CHOPRA SURESH NARAYANAN SHOBINDER DUGGAL B. MURLIPartner Chairman and Managing Director Chief Financial Officer Sr. VP - Legal &Membership No. - 092894 (DIN-07246738) Company Secretary
13 February 2020 13 February 2020Gurugram Gurugram
Nestle AR 2019-20 220520.indd 54 5/26/2020 1:43:50 PM
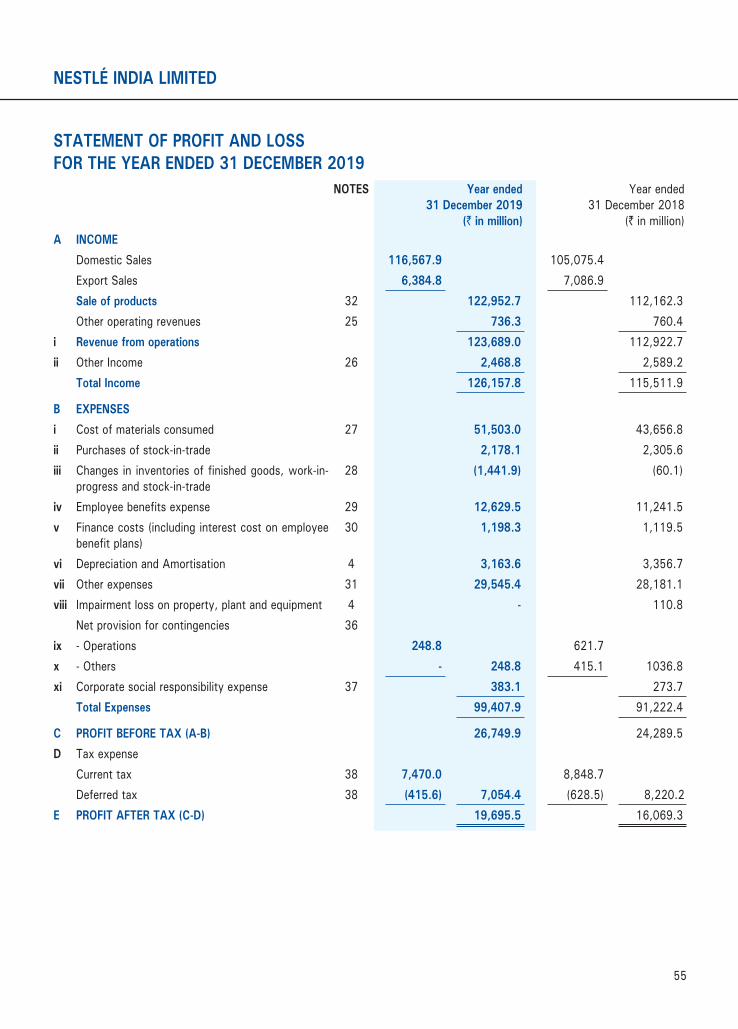
55
STATEMENT OF PROFIT AND LOSSFOR THE YEAR ENDED 31 DECEMBER 2019
NOTES Year ended31 December 2019
(` in million)
Year ended31 December 2018
(` in million)A INCOME
Domestic Sales 116,567.9 105,075.4Export Sales 6,384.8 7,086.9Sale of products 32 122,952.7 112,162.3Other operating revenues 25 736.3 760.4
i Revenue from operations 123,689.0 112,922.7ii Other Income 26 2,468.8 2,589.2
Total Income 126,157.8 115,511.9
B EXPENSES
i Cost of materials consumed 27 51,503.0 43,656.8ii Purchases of stock-in-trade 2,178.1 2,305.6iii Changes in inventories of finished goods, work-in-
progress and stock-in-trade28 (1,441.9) (60.1)
iv Employee benefits expense 29 12,629.5 11,241.5v Finance costs (including interest cost on employee
benefit plans)30 1,198.3 1,119.5
vi Depreciation and Amortisation 4 3,163.6 3,356.7vii Other expenses 31 29,545.4 28,181.1viii Impairment loss on property, plant and equipment 4 - 110.8
Net provision for contingencies 36ix - Operations 248.8 621.7x - Others - 248.8 415.1 1036.8xi Corporate social responsibility expense 37 383.1 273.7
Total Expenses 99,407.9 91,222.4
C PROFIT BEFORE TAX (A-B) 26,749.9 24,289.5D Tax expense
Current tax 38 7,470.0 8,848.7Deferred tax 38 (415.6) 7,054.4 (628.5) 8,220.2
E PROFIT AFTER TAX (C-D) 19,695.5 16,069.3
NESTLÉ INDIA LIMITED
Nestle AR 2019-20 220520.indd 55 5/26/2020 1:43:50 PM

56
NESTLÉ INDIA LIMITED
STATEMENT OF PROFIT AND LOSSFOR THE YEAR ENDED 31 DECEMBER 2019
NOTES Year ended31 December 2019
(` in million)
Year ended31 December 2018
(` in million)F OTHER COMPREHENSIVE INCOME
(a) (i) Items that will not be reclassified to profit or loss
Re-measurement of retiral defined benefit plans 33 (2,036.7) (464.0)Changes in fair value of equity instruments (30.0) (100.0)(ii) Income taxes relating to Items that will not be reclassified to profit or loss
523.3 162.0
(1,543.4) (402.0)(b) (i) Items that will be reclassified to profit or loss
Changes in fair value of cash flow hedges (8.0) (3.2)(ii) Income taxes relating to Items that will be reclassified to profit or loss
3.7 1.1
(4.3) (2.1)TOTAL OTHER COMPREHENSIVE INCOME (a+b) (1,547.7) (404.1)
G TOTAL COMPREHENSIVE INCOME (E+F) 18,147.8 15,665.2Weighted average number of equity shares outstanding Nos. 96,415,716 96,415,716
Basic and Diluted Earnings Per Share (Face value ̀ 10) ` 204.28 166.67
ADDITIONAL INFORMATION (Refer Note 2):
PROFIT FROM OPERATIONS [C - A(ii) + B(v)+B(x)+B(xi)]
25,862.5 23,508.6
See accompanying notes 1 to 47 forming part of the financial statements
As per our report of even date attached For and on behalf of the Board of DirectorsFor B S R & CO. LLPChartered AccountantsFirm’s Registration No. - 101248W/W-100022
JITEN CHOPRA SURESH NARAYANAN SHOBINDER DUGGAL B. MURLIPartner Chairman and Managing Director Chief Financial Officer Sr. VP - Legal &Membership No. - 092894 (DIN-07246738) Company Secretary
13 February 2020 13 February 2020Gurugram Gurugram
Nestle AR 2019-20 220520.indd 56 5/26/2020 1:43:50 PM