A STUDY ON CUSTOMER PERCEPTION ABOUT AIRTEL By ...
91
A STUDY ON CUSTOMER PERCEPTION ABOUT AIRTEL By, Chethan. D 1NH13MBA18 Submitted to, VISVESVARAYA TECHNOLOGICAL UNIVERSITY, BELGAUM In partial fulfillment of the requirements for the award of degree of MASTER OF BUSINESS ADMINISTRATION Under the Guidance of INTERNAL GUIDE EXTERNAL GUIDE Mr. Sancharan Roy, Proffesor Mr. Darshan, Proprietor Department of management studies Ganapa airtel Express store Department of MBA NEW HORIZON COLLEGE OF ENGINEERING Outer Ring Road, Marathalli, Bangalore- 560 103 2013-2015
-
Upload
khangminh22 -
Category
Documents
-
view
0 -
download
0
Transcript of A STUDY ON CUSTOMER PERCEPTION ABOUT AIRTEL By ...

A STUDY ON CUSTOMER PERCEPTION ABOUT AIRTEL
By,
Chethan. D
1NH13MBA18
Submitted to,
VISVESVARAYA TECHNOLOGICAL UNIVERSITY, BELGAUM In partial fulfillment of the
requirements for the award of degree of
MASTER OF BUSINESS ADMINISTRATION
Under the Guidance of
INTERNAL GUIDE EXTERNAL GUIDE
Mr. Sancharan Roy, Proffesor Mr. Darshan, Proprietor
Department of management studies Ganapa airtel Express store
Department of MBA
NEW HORIZON COLLEGE OF ENGINEERING
Outer Ring Road, Marathalli, Bangalore- 560 103
2013-2015


Acknowledgement
I would like to express my special thanks of gratitude to VTU as well as my college for giving this
opportunity to do the project work on "Consumer Perception about Airtel". It helped me to do the
research work and implement my theory knowledge into practical terms and I learned new things
through this project.
I would like to thank my parents, friends, faculties and airtel customers to help me to conduct the
survey very effectively. This project was not only done for my marks but also helped me gain some
knowledge.
CHETHAN D
1NH13MBA18

TABLE OF CONTENTS
Chapters Topics Page No.
1 INTRODUCTION
Needs of the study
Objective of the study
Scope of the study
Methodology adopted
Literature review
Limitations of the study
1-13
2 INDUSTRY PROFILE
COMPANY PROFILE
Vision & Mission
Product & Services
Infrastructure facility
Areas of Operations
Infrastructure facilities
Competitors information
SWOT Analysis
Financial Statements
15-42
3 THORETICAL BACKGROUND 48-59
4 ANALYSIS AND INTERPRETATION 61-83
5 SUMMARY OF FINDINGS
SUGGESTION
CONCLUSION
85-87
BIBLOGRAPHY 88
ANNEXTURES 89-91

LIST OF TABLES
TABLE NO; CONTENTS PAGE NO
4.1 Gender descriptions 61
4.2 Age group 62
4.3 Education qualification 62
4.4 Occupation status 63
4.5 Income level 64
4.6 Marital Status 64
4.7 Source of information to consumers 64
4.8 Type of mobile payment 65
4.9 Usage of mobile network 66
4.10 Mobile scheme 66
4.11 Number of years associated 67
4.12 Problems faced by consumers 67 - 68
4.13 Suggest the services to others 68
4.14 Ranking of the services 68
4.15 Correlation 70
4.16 Areas of improvement 70
4.17 Areas of improvement report 71
4.18 Rating of services 71
4.19 Statistics 72
4.20 Video call 72
4.21 Internet services 73
4.22 Live TV 74
4.23 Video downloads 75
4.24 Conference calls 76
4.25 Rating of 4G services 77
4.26 4G services report 78
4.27 Future service providers 78
4.28 Service providers 79
4.29 Satisfactory level of services 79
4.30 Credit facility 80

LIST OF GRAPH
SL NO. CONTENTS PAGE NO
4.1 Graph showing Gender descriptions 61
4.2 Graph showing Age group 62
4.3 Graph showing Education qualification 63
4.4 Graph showing Source of information to consumers 65
4.5 Graph showing Number of years associated 67
4.6 Graph showing Ranking of the services 69
4.7 Graph showing Video calls 73
4.8 Graph showing Internet services 74
4.9 Graph showing Live tv 75
4.10 Graph showing Video download 76
4.11 Graph showing Conference calls 77

Chapter
1
9 | P a g e

1. INTRODUCTION ABOUT THE INTERNSHIP 1. 1 TOPIC CHOSEN FOR STUDY
A Study on Consumer Perception about Airtel Services
Customer perception is defined as the way that customer usually view or feel about certain
services and products. It can also be related to customer satisfaction which is the expectation of
the customer towards the products. Once the customer is fully satisfied with the services the
company can progress to better heights, hence customers are the main reason for the success of
airtel.. Customer satisfaction is a frequently used term in the field of marketing, by which it is
able to increase its market share by gathering more number of customers. Customer satisfaction
can be done based on various circumstances that can be linked either to product or services. It is
also based on the satisfaction level of the management, customers, etc. by which it is able to
increase the working conditions. Hence satisfaction is the customers feeling of pleasure or
disappointment which he/she is able to express after being an Airtel customer. The Airtel
services for the project includes the mobile services, 3G, 4G, & Wi-Fi.
1.2 NEED FOR THE STUDY The need for the study is to conduct a survey on the Airtel services and check for the further
improvements to be made. It also specifies to know the availability of various offers and the
usage of these services by the customer. In the recent times there has seen a lot of changes in the
telecom sector where many companies have played their role in this. Among the many Airtel is
one of the leading telecom services provider. Hence the need for the study is to know the
effectiveness of the various services of Airtel. 1.3 OBJECTIVES OF STUDY
To study the perception about airtel from the customers and the customer support.
To find the usage of the offers available to the customers.
To find issues being faced while using the airtel network.
To study the further improvements to made in point of view of customers.
To measure the growth of newly introduced 4G services by airtel. 10 | P a g e

1.4 SCOPE OF STUDY
Effectiveness of the customers using airtel services
The further improvements to be made.
o It extends to the usage of the survey method of questionnaire. 1.5 METHODOLOGY ADOPTED
Methodology is a way to systematically solve the research problem. It may be understand
as a science of studying how research is done scientifically. Research methodology is a step by
step study of a problem. It involves preparing of questionnaires collected from the prospective
airtel customers and it is being analyzed using the SPSS software. 1.5.1 RESEARCH DESIGN
It is the conceptual structure within which research is conducted. It constitutes the blue
print for the collection, measurement and analysis of data. Descriptive Research is the research
method used for the collection of data. Which includes collection of data through questionnaire
and from the information taken from the consumers. 1.5.2 SAMPLING DESIGN/TECHNIQUE
Sampling is the process of selecting a sufficient number of elements from the population,
so that a study of the sample and an understanding of its properties or characteristics would make
it possible for us to generalize such properties or characteristics to the population elements.
The population for this survey includes the consumers associated with Airtel services.
The sample size is 150 respondents in Bangalore on specific areas. 1.5.3 DATA COLLECTION METHODS
Collection of data involves both primary and secondary data.
1.5.3.1 Primary Data
The data is collected through observation, direction communication and distribution of survey
questionnaire to the consumers. Using the Random sampling the consumer are selected to fill the
questionnaire. 1.5.3.2 Secondary Data
These data is collected from various sources likes internet, newspaper, magazines and other
sources available with the company.
11 | P a g e

1.5.4 QUESTIONNAIRE DESIGN The questionnaire consists of 3 groups which includes socio demographics, mobile services and
value added services. It consists of multiple choice questions, rating of the services, ranking of
services, satisfactory levels, etc. 1.6 LITERATURE REVIEW
1. Customer perception theory by Chris Blank, Demand Media
Customer perception theory attempts to explain consumer behavior by analyzing
motivations for buying or not buying particular items. Three areas of consumer perception theory
relate to self-perception, price perception and perception of a benefit quality of life. Consumer
perception applies the concept of sensory perception to marketing and advertising. Merchants
apply consumer perception theory to determine how their customer perceive them. They use
consumer perception theory to develop to develop marketing and advertising strategies intended
to retain current customers and attract new ones.
2. Understanding and managing Customer Perception by Dagmar Recklies
Customer perceptions are influenced by a variety of factors. Besides the actual outcome –
i.e. did the product or service deliver the expected function and did it fulfill the customers need –
the whole process of consumption and all interactions involved are of crucial importance.
Customer perceptions are dynamic. First of all, with the developing relationship between
customer and company, his perceptions of the company and its products or services will change.
3. Customer perception on Service Satisfaction with Third Party Logistics service by
Socrates J. Moschuris
The 3PL service industry is characterized by customer relationships than can extend over
several years, involving multiple instances of service industry. Customer‘s Satisfaction level has
a profound impact on attracting new customers and customer‘s retention. In his research he
investigates customer perception regarding the service offered by medium-sized 3PL operating
in Greece. Results indicated that customers are satisfied with the outfit of personnel, adequacy of
knowledge, speed of service, quality of service offered and politeness of personnel at the point of
sales as well as during the delivery. The major problem stated by the respondents was the long
hold time at the call center, which causes intensity and confusion among the customers.
12 | P a g e

4. Customer Perception of Luxury Fragrance Brand Advertising by DeFanti, Mark
Bird Companies in the beauty industry spend millions of dollars on marketing new fragrances. Hence
one of the biggest decisions brands make when creating a new fragrance is what to name it. He
reviews that the relative impact of the brand and sub brand featured in a new luxury fragrance
advertisement upon consumers‘ willingness to smell the fragrance and compares their effects
among well-known brands and less well-known brand.
5. Customer Perception of Sports Apparel by d’Astous Alain
Although popular sports garments like t-shirts and shoes are typically marketed as products
intended for the practice of sport activity, the majority of buyers in this market are not athletes
and are attracted to these products essentially on the basis of their fashion appeal. In his study the
author has proposed four factors that play a significant role in influencing the product
evaluations of buyers of sport apparel: brand name, store name, price and intended usage
situation.
6. Consumer Perception of Product Quality by Schniederjans, Cao & Olson
The customer has studied the U.S. consumer perception of product quality of Chinese made
Goods. He also explains consumer‘s perception about quality of the items imported from China.
Consumer product value was measured by a simple economic approach of indexation. He
suggested that the Chinese manufacturers should prioritize their quality improvement programs
by improving the material used in products and by improving their processes.
1.7 LIMITATIONS OF STUDY
The limitation of study is scarcity of time
The study is based entirely on the information collected through close-ended
questionnaires which makes the study incomplete.
Small area of sampling makes the collected information very less
Due to confidentiality matters company will not give sufficient information which is
another limitation of the study.
13 | P a g e

Chapter
2
14 | P a g e

2.1 INDUSTRY PROFILE
The beginning
The history of Indian telecom can be started with the introduction of telegraph. The Indian postal
and telecom sectors are one of the world‘s oldest. In 1850, the first experimental electric
telegraph line was started between Calcutta and Diamond Harbour. In 1851, it was opened for
the use of the British East India Company. The Posts and Telegraphs department occupied a
small corner of the Public Works Department, at that time.
Subsequently, the construction of 4,000 miles (6,400 km) of telegraph lines connecting Kolkata
(then Calcutta) and Peshawar in the north along with Agra, Mumbai (then Bombay) through
Sindwa Ghats, and Chennai (then Madras) in the south, as well as Ootacamund and
Bangalore was started in November 1853. William O'Shaughnessy, who pioneered
the telegraph and telephone in India, belonged to the Public Works Department, and worked
towards the development of telecom throughout this period. A separate department was opened
in 1854 when telegraph facilities were opened to the public.
In 1880, two telephone companies namely The Oriental Telephone Company Ltd. and The
Anglo-Indian Telephone Company Ltd. approached the Government of India to
establish telephone exchanges in India. The permission was refused on the grounds that the
establishment of telephones was a Government monopoly and that the Government itself would
undertake the work. In 1881, the Government later reversed its earlier decision and a license was
granted to the Oriental Telephone Company Limited of England for opening telephone
exchanges at Calcutta, Bombay, Madras and Ahmedabad and the first formal telephone service
was established in the country. On 28 January 1882, Major E. Baring, Member of the Governor
General of India's Council declared open the Telephone Exchanges in Calcutta, Bombay and
Madras. The exchange in Calcutta named the "Central Exchange" had a total of 93 subscribers in
its early stage. Later that year, Bombay also witnessed the opening of a telephone exchange.
Further developments and milestones
Pre-1902 – Cable telegraph
1902 – First wireless telegraph station established between Sagar Island and Sandhead.
1907 – First Central Battery of telephones introduced in Kanpur.
1913–1914 – First Automatic Exchange installed in Shimla.
1927 – Radio-telegraph system between the UK and India, with Imperial Wireless
Chain beam stations at Khadki and Daund. Inaugurated by Lord Irwin on 23 July by
exchanging greetings with King George V.
1933 – Radiotelephone system inaugurated between the UK and India.
1953 – 12 channel carrier system introduced.
1960 – First subscriber trunk dialing route commissioned between Lucknow and Kanpur.
15 | P a g e

1975 – First PCM system commissioned between Mumbai City and Andheri telephone
exchanges.
1976 – First digital microwave junction.
1979 – First optical fibre system for local junction commissioned at Pune.
1980 – First satellite earth station for domestic communications established at Sikandarabad,
[[Uttar Pradesh|U.P.] Noida Sector 62SCMS].
1983 – First analogue Stored Programme Control exchange for trunk lines commissioned at
Mumbai.
1984 – C-DOT established for indigenous development and production of digital exchanges.
1995 – First mobile telephone service started on non-commercial basis on 15 August 1995
in Delhi.
1995 – Internet Introduced in India starting with laxmi nagar Delhi on 15 August 1995.
Liberalisation and Privatisation
Liberalisation of Indian telecommunication industry started in 1981 when Prime Minister Indira
Gandhi signed contracts with Alcatel CIT of France to merge with the state owned Telecom
Company (ITI), in an effort to set up 5,000,000 lines per year. But soon the policy was let down
because of political opposition. Attempts to liberalise the telecommunication industry were
continued by the following government under the prime-minister-ship of Rajiv Gandhi. He
invited Sam Pitroda, a US-based Non-resident Indian NRI and a former Rockwell
International executive to set up a Centre for Development of Telematics(C-DOT) which
manufactured electronic telephone exchanges in India for the first time. Sam Pitroda had a
significant role as a consultant and adviser in the development of telecommunication in India. In
1985, the Department of Telecom (DoT) was separated from Indian Post & Telecommunication
Department. DoT was responsible for telecom services in entire country until 1986
when Mahanagar Telephone Nigam Limited (MTNL) and Videsh Sanchar Nigam
Limited (VSNL) were carved out of DoT to run the telecom services of metro cities (Delhi and
Mumbai) and international long distance operations respectively.
In 1997, the government set up TRAI (Telecom Regulatory Authority of India) which reduced
the interference of Government in deciding tariffs and policy making. The political powers
changed in 1999 and the new government under the leadership of Atal Bihari Vajpayee was
more pro-reforms and introduced better liberalisation policies. In 2000, the Vajpayee
government constituted the Telecom Disputes Settlement and Appellate Tribunal (TDSAT)
through an amendment of the TRAI Act, 1997.The primary objective of TDSAT's establishment
was to release TRAI from adjudicatory and dispute settlement functions in order to strengthen
the regulatory framework. Any dispute involving parties like licensor, licensee, service provider
and consumers are resolved by TDSAT. Moreover, any direction, order or decision of TRAI can
be challenged by appealing in TDSAT.
16 | P a g e

The government corporatised the operations wing of DoT on 1 October 2000 and named it
as Department of Telecommunication Services (DTS) which was later named as Bharat Sanchar
Nigam Limited (BSNL). The proposal of raising the stake of foreign investors from 49% to 74%
was rejected by the opposite political parties and leftist thinkers. Domestic business groups
wanted the government to privatise VSNL. Finally in April 2002, the government decided to cut
its stake of 53% to 26% in VSNL and to throw it open for sale to private enterprises. TATA
finally took 25% stake in VSNL.
In March 2008 the total GSM and CDMA mobile subscriber base in the country was 375 million,
which represented a nearly 50% growth when compared with previous year. As the unbranded
Chinese cell phones which do not have International Mobile Equipment Identity (IMEI) numbers
pose a serious security risk to the country, Mobile network operators therefore suspended the
usage of around 30 million mobile phones (about 8% of all mobiles in the country) by 30 April.
Phones without valid IMEI cannot be connected to cellular operators. 5–6 years the average
monthly subscribers additions were around 0.05 to 0.1 million only and the total mobile
subscribers base in December 2002 stood at 10.5 million. However, after a number of proactive
initiatives taken by regulators and licensors, the total number of mobile subscribers has increased
rapidly to over 929 million subscribers as of May 2012.
India has opted for the use of both the GSM (global system for mobile
communications) and CDMA (code-division multiple access) technologies in the mobile sector.
In addition to landline and mobile phones, some of the companies also provide the WLL service.
The mobile tariffs in India have also become lowest in the world. A new mobile connection can
be activated with a monthly commitment of US$0.15 only. In 2005 alone additions increased to
around 2 million per month in 2003–04 and 2004–05.
Key Statistics
The telecommunications industry attracted foreign direct investments (FDI) worth US$ 59,796
million between April 2000 to January 2014, an increase of 6 per cent to the total FDI inflows in
17 | P a g e
terms of US$, according to data published by Department of Industrial Policy and Promotion
(DIPP).
Online platforms that support user-generated content can become an important part of India‘s
internet economy and contribute around Rs 2,490 billion (US$ 41.5 billion) by 2015, according
to Global Network Initiative (GNI) report titled ‗Closing the Gap: Indian Online Intermediaries
and a Liability System Not Yet Fit for Purpose‘.
BlackBerry has chosen India as the third country to set up enterprise solutions centers to educate
corporate customers about various BlackBerry Enterprise Service (BES) 10 solutions. "India is
one of the fastest growing markets in terms of smartphone and mobile data adoption,‖ said Mr.
Sunil Lalvani, Managing Director (MD), BlackBerry India.
Market Dynamics
India‘s global system for mobile (GSM) operators added 4.14 million rural subscribers in
January 2014, taking the total to 285.35 million.
India's GSM cellular subscriber base increased marginally in November to 688.02 million with
an addition of 4.87 million new subscribers during the month, said industry body Cellular
Operators Association of India (COAI).
Data traffic powered by third generation (3G) services grew at 146 per cent in India during 2013,
higher than the global average that saw use double, according to an MBit Index study by Nokia
Siemens Networks (NSN). The data consumed per subscriber for 3G is 532 megabytes (MB),
against 146 MB for second generation (2G).
Tata Teleservices plans to set up nearly 4,000 Wi-Fi hotspots in nine cities across the country in
the next two years. India's smartphone market grew by 171 per cent last year to 44 million
devices from 16.2 million in 2012, as per research firm IDC India.
The 20 km free Wi-Fi zone the longest across the globe was unveiled by Mr. Nitish Kumar, the
Chief Minister of Bihar, Government of India.
Key Developments & Investments
Japanese companies are keen to establish telecom gear test labs in India even as the government
prepares to invite bids from private lab operators to pave the way for local testing from July
2014.
Airtel Networks Kenya Ltd has sought an approval from the Communications Authority of
Kenya to acquire the telecommunications licenses and subscribers of Essar Telecom Kenya Ltd.
Tata Communications has signed a collaboration agreement with Turkey's telecom operator
Turkcell Super online to set up a multi-protocol label switching (MPLS) node in Istanbul.
Bharti Airtel and six other GSM majors serving the Africa and Middle-East markets plan to
forge network infrastructure sharing pacts to provide internet and mobile broadband access to
18 | P a g e

unserved rural communities and drive down mobile services delivery costs for all sections of the
population in these regions.
InfoTech Enterprises, through its US arm, plans to buy the US-based Softential Inc, which
provides service management and service assurance solutions for telecom firms and cable
operators. The deal size is pegged in the range of Rs 150-180 crore (US$ 25-30 million).
Intelliverse Telecom, a cloud-based communication solutions provider launches IntelliGreeter, a
virtual voice attendant for call routing to any phone.
Bharti Airtel plans to invest more than Rs 4,000 crore (US$ 666.67 million) in Punjab over a
period of five years. The company aims to take its fourth generation long-term evolution (4G
LTE) services to all towns and villages across Punjab.
Reliance Jio Infocomm has signed a master services agreement with Bharti Infratel to utilise the
latter's telecom tower infrastructure to launch its high-speed 4G plans where it will also offer
voice over internet across the country
Introduction
The Indian telecommunication network is the 3rd largest in the world and the 2nd largest among
the emerging economies of Asia. Today, it is the fastest growing market in the world. The
telecommunication sector continued to register significant success during the year and has
emerged as one of the key sectors responsible for India‘s economic growth. This rapid growth
has been possible due to various proactive and positive decisions of the Government and
contribution of both the public and private sectors. The rapid strides in the telecom sector have
been facilitated by liberal policies of the Government that provide easy market access for
telecom equipment and a fair regulatory framework for offering telecom services to the Indian
consumers at affordable prices. It has also undergone a substantial change in terms of mobile
versus fixed phones and public versus private participation. The presence for use of wireless
phones has also been predominant in the sector. Participation of the private entities in the
telecom sector is rapidly increasing rate there by presenting the enormous growth opportunities.
There is a clear distinction between the Global Satellite Mobile Communication (GSM) and
Code Division Multiple Access (CDMA) technologies used. With increasing penetration of the
wireless services, the wire line services in the country in becoming stagnant. On the other hand,
Broadband demand has picked up and promises to stabilise fixed line growth. In terms of the
Global System for Mobile Communication (GSM) subscribers CDMA technology was
introduced in India as a limited mobility solution.
The introduction of CDMA services has created competition, lowered traffic and offered many
citizens access to communication services for the first time. Internet services were launched in
India on August 15 1995. In November 1998 the government opened up the sector to private
operators. A liberal licensing regime was put in place to increase Internet penetration across the
country. The growth of IP telephony or grey market is also a serious concern.
19 | P a g e

Government loses revenue, while unlicensed operation by certain operators violates the law and
depletes licensed operators market share. New services like IP-TV and IP-Telephony are
becoming popular with the demand likely to increase in coming years. The scope of services
under existing ISP license conditions are unclear. Rising demand for a wide range of telecom
equipment, particularly in the area of mobile telecommunication, has provided excellent
opportunities to domestic and foreign investors in the manufacturing sector. The last two years
saw many renowned telecom companies setting up their manufacturing base in India. Ericsson
has set up GSM Radio Base Station Manufacturing facility in Jaipur. Elcoteq has set up handset
manufacturing facilities in Bangalore. Nokia setup its manufacturing plant in Chennai. LG
Electronics set up plant of manufacturing GSM mobile phones near Pune. The Government has
already set up Telecom Equipment and Services Export Promotion Forum and Telecom Testing
and Security Certification Centre (TETC). A large number of companies like Alcatel, Cisco have
also shown interest in setting up their R&D centres in India. With above initiatives India is
expected to be a manufacturing hub for the telecom equipment. There are 3 major players in
telecom services:- state owned companies (BSNL & MTNL). Private owned (Reliance
infocomm, Tata teleservices) and Foreign companies (Hutchison-Essar, Bharti Tele-ventures,
Escotel, Idea Cellular, BPL mobile, Spice Communication).
Challenges FACED BY TELECOM INDUSTRY
Unlike many countries where the allocation of spectrum is separate from the grant of
license to provide service, in India licenses are still bundled with the allotment of a
certain amount of spectrum.
Limited spectrum availability and interconnection charges between the private and state
operators.
Telecom manufacturing in India is not in pace. With only a few equipment
manufacturers currently operating in the country, most of the telecom equipment is
imported as the country lags behind in terms of telecom R&D.
Lack of infrastructure in semi-rural and rural areas, which makes it difficult to make
inroads into this market segment as service providers have to incur a huge initial fixed
cost.
One of the major challenge is the absence of a uniform approval process across the
country for setting up telecom towers and other infrastructure.
Inadequate utilization of existing towers.
Multiple levies and high taxes on the set up of mobile towers.
Lack of reliable power for telecom towers and higher tariffs on telecom sites. This
increases the dependence on diesel- fueled power sources, which is considered expensive
and more harmful to the environment.

Low penetration.
The prepaid services were terminated by DoT during September 2009 which was
subsequently allowed in January 2010 on condition that all prepaid subscribers will be
reverified by the operators. For new customers the guidelines have been further
strengthened. Prepaid services in J&K and North East and Assam are renewed on yearly
basis.
The launch of 3G operations require huge funds for spectrum fee and also for network roll
out. The other challenges are rolling out new 3G value added services and ensuring
availability of 3G handsets at affordable prices. The 3G roll out will pose major challenge
to the non 3G operators
Telephone connections in millions
1090.504
35.997 220.743
837.195
Africa
America
Asia
Europe
Oceania
1744.815
The Indian Telecom sector has proved to be an international success story. The sector has
witnessed a commendable growth over the past two years. With an overall subscriber base of
914.60 million and a tele density of 76.03%, the sector continues to grow from strength to
strength. With the urban tele density reaching 166.54%, the market has been showing signs of
maturity. Rural India is the key target market likely to drive the next round of growth,
particularly for voice based services.

It is envisaged that rural tele density of 40% would be reached by end of 2014. 3G and BWA are
expected to reinvigorate the maturing urban markets and help in bringing balanced growth of
economy. The aggressive growth observed by mobile services is yet to be replicated in case of
broadband service, where the subscriber base currently stands at more than 12 million. The
Government has a vision to provide telephone connection and broadband facilities on demand
across the country at an affordable price and it strives to achieve the same.
The growth of telecom sector since 2007:
Subscribers
Subscribers' base ( in million)
March'07 March'08 March'09 March'10 March'11 October'11
Wireline 40.77 39.41 37.96 36.96 34.73 33.19
Wireless 165.09 261.08 391.76 584.32 811.60 881.41
Total Phones 205.87 300.49 429.73 621.28 846.33 914.60
Internet 9.21 11.05 13.65 16.10 19.69 -
Broadband 2.29 3.81 6.22 8.77 11.79 12.84*
Data services/
Wireless
internet#
31.3
65.5
117.82
177.87
381.40
-
# accessing internet through wireless networks as per quarterly reports of TRAI
*up to September 2011.
Major players of telecom industry
1. Bharti Airtel 1985
2. BSNL 2000
3. Vodafone Essar 2007
4. Reliance communications 1999
5. Idea cellular 1995
6. Tata communications 1986
7. Tata Teleservices 1996
8. Aircel 1999
9. MTNL 1986
10. TTML 1998

Telecom Companies market share in India as of August 2011
Telecom Companies market share in India as in august 2011

Impact of global crisis
As we know world economy is fighting with economic slowdown.
It seems something special about the telecom industry which renders it partially immune
to the worst effect of the down turn.
Total base of connection in world is 3.2 bln.
Quarterly 3, 2011 Anticipated 177 million connection worldwide but it could not cross
160 million mark.
There is less impact of global crisis on Indian telecom industry as India became the 1st
country in the world to have 10.4 million new connections in a month.
Future of Indian Telecom sector
Article as on September 5th 2013
Telecom companies will hope the current economic crisis will force quick decisions from
government.
The future of India‘s telecom industry riddled with corporate rivalries will depend on whether
the government accepts the five recommendations on radio spectrum. The industry leaving
behind it a bruising price war and the scandal over allocation of airwaves, has been unable to
present a united front with its demands. Instead, each operator has taken a position that best
benefits it or hurts the competition most on reallocation of airwaves, pricing and recurring usage
charges for these frequencies. Mint takes a look at what is at stake for mobile phone companies,
consumers and investors, as well as the exchequer on spectrum related issues that will shape the
future of mobile phones in India.
After two successive auctions in which the government failed to sell the bulk of the airwaves
because there was no demand for bandwidth in metro cities and important regions, the third
round is around the corner after the supreme court earlier said the center had failed to put for sale
all spectrum vacated by companies whose permits it had quashed in February 2012. The poor
response from earlier auctions forced the inter ministered panel overseeing the sale to go back to
the regular on setting minimum prices for the next auction.
Predictably telecom firms offering services on the GSM(Global Service Mobile
communications) technology platform have asked the base price to be reduced significantly from
around rs 14000 crore to five units of 2G septrum in the 1800 megahertz band in the previous
auction. They have been supported by the global GSM association which has also argued that
high airwaves cost would mean higher tariffs for consumers, result in higher debt and the limit
the ability of phone companies to invest in upgrading networks.
24 | P a g e

2. 2 COMPANY PROFILE
Type
Public company
Traded as
BSE: 532454NSE: BHARTIARTL
BSE SENSEX Constituent
Industry
Telecommunications
Founded
7 July 1995[1]
Founder(s)
Sunil Bharti Mittal
Headquarters
Bharti Crescent, 1, Nelson Mandela Road,
New Delhi, India[1]
Area served
India & South Asia, Africa, and the Channel
Islands
Key people
Sunil Bharti Mittal
(Chairman and MD)
Products
Fixed line and mobile
telephony, broadband and fixed-line internet
services,digital television and IPTV
Revenue
809.22 billion (US$14 billion) (2013-14)[2]
Operating
income
248.62 billion (US$4.2 billion) (2013-14)[2]
25 | P a g e

Profit
22.67 billion (US$380 million) (2013-14)[2]
Total assets
432.72 billion (US$7.3 billion) (2013-14)[2]
Total equity
1273.7 billion (US$21 billion) (2013-14)[2]
Employees
24,720 (2013-14)[3]
Parent
Bharti Enterprises (52.7%)[4][5]
SingTel (15.57%)[4][5]
Vodafone (4.4%)
Subsidiaries
Airtel Africa Airtel
Digital TV Airtel
Sri Lanka Airtel
Bangladesh
Website
www.airtel.com
Sunil Bharti Mittal founded the Bharti Group. In 1983, Mittal was in an agreement with
Germany's Siemens to manufacture push-button telephone models for the Indian market. In
1986, Mittal incorporated Bharti Telecom Limited (BTL), and his company became the first in
India to offer push-button telephones, establishing the basis of Bharti Enterprises. By the early
1990s, Sunil Mittal had also launched the country's first fax machines and its first cordless
telephones. In 1992, Mittal won a bid to build a cellular phone network in Delhi. In 1995, Mittal
incorporated the cellular operations as Bharti Tele-Ventures and launched service in Delhi. In
1996, cellular service was extended to Himachal Pradesh. In 1999, Bharti Enterprises acquired
control of JT Holdings, and extended cellular operations to Karnataka and Andhra Pradesh. In
2000, Bharti acquired control of Sky cell Communications, in Chennai. In 2001, the company
acquired control of Spice Cell in Calcutta. Bharti Enterprises went public in 2002, and the
company was listed on Bombay Stock Exchange and National Stock Exchange of India. In 2003,
the cellular phone operations were rebranded under the single Airtel brand. In 2004, Bharti
acquired control of Hexa com and entered Rajasthan. In 2005, Bharti extended its network to
Andaman and Nicobar. This expansion allowed it to offer voice services all across India. In
2009, Airtel launched its first international mobile network in Sri Lanka. In 2010, Airtel acquired
the African operations of the Kuwait based Zain Telecom. In March 2012, Airtel launched a
mobile operation in Rwanda.

Telecom giant Bharti Airtel is the flagship company of Bharti Enterprises. The Bharti Group, has
a diverse business portfolio and has created global brands in the telecommunication sector.
Bharti has recently forayed into retail business as Bharti Retail Pvt Ltd. under a MoU with Wal-
Mart for the cash & carry business. It has successfully launched an international venture with EL
Rothschild Group to export fresh agri products exclusively to markets in Europe and USA and
has launched Bharti AXA Life Insurance Company Ltd under a joint venture with AXA, world
leader in financial protection and wealth management. BHARTI AIRTEL LTD started in July 7
1995.Its headquarters is at Delhi. In 1998company started their first land line operation. Airtel is
the name of their brand. AIRTEL stands for Affectionate, Interested, Respectful, Tolerant,
Energetic and loving .Their logo is ―Think fresh Deliver More‖. Their first company is Bharti
Cellular Limited under the brand name of Airtel. Another one is Bharti Tele Sonic Ltd under the
brand name of India One. Then Bharti Tele Net Ltd under the brand name of Touch Net. Another
one is Bharti broad band Ltd under the brand name of Manthra Online. The companies Bharti
Telenet Ltd and Bharti Broadband Ltd combined together and form Bharti Broadband and
Teleservices Ltd. After sometime the companies Bharti Telesonic Ltd and Bharti Broadband and
Teleservices Ltd combined together and form Bharti Infotel Ltd. In 13th September 2004 all the
four companies combined together and form Bharti AIRTEL Ltd. Bharti Airtel is one of India‘s
leading private sector providers of telecommunications services with more than 79 million
subscribers as of November 2008. Bharti airtel limited is a leading global telecommunications
company with operations in 19 countries across Asia and Africa. The company offers mobile
voice & data services, fixed line, high speed broadband, IPTV, DTH, turnkey telecom solutions
for enterprises and national & international long distance services to carriers.
Bharti airtel has been ranked among the six best performing technology companies in the world
by business week. Bharti airtel had 200 million customers across its operations.
Airtel was born free, a force unleashed into the market with a relentless and unwavering
determination to succeed. A spirit charged with energy, creativity and a team driven ―to seize the
day‖ with an ambition to become the most admired telecom service provider globally. Airtel, in
just ten years of operations, rose to the pinnacle of achievement and continues to lead. As India‘s
leading Telecommunications Company, Airtel brand has played the role of a major catalyst in
India‘s reforms, contributing to its economic resurgence. Today it touch People‘s lives with their
Mobile services, Telemedia services, to connecting India‘s leading 1000+corporates. They also
connect Indians living in USA, UK and Canada with their call home service. Our Vision &
Promise By 2015 airtel will be the most loved brand, enriching the lives of millions. "Enriching
lives means putting the customer at the heart of everything we do. We will meet their needs
based on our deep understanding of their ambitions, wherever they are. By having this focus we
will enrich our own lives and those of our other key stakeholders. Only then will we be thought
of as exciting, innovation, on their side and a truly world class company." Airtel comes to you
from Bharti Airtel Limited, India‘s largest integrated and the first private telecom services
provider with a footprint in all the 23 telecom circles. Bharti Airtel since its inception has been at
the forefront of technology and has steered the course of the telecom sector in the country with
its world class products and services. The businesses at Bharti Airtel have been structured into
three individual strategic business units (SBU‟s);

1. Mobile Services
2. Airtel Tele media Services
3. Enterprise Services.
Airtel provides GSM mobile services in all the 22 telecom circles in India, Sri-lanka, Bangladesh
and now in 16 countries of Africa. Provides telemedia services (fixed line and broadband
services through DSL) in 87 cities in India. Provides an integrated suite of Enterprise solutions,
in addition to providing long distance connectivity both nationally and internationally. Airtel has
won the Most Preferred Cellular Service Provider Brand‟ award at the CNBC Awaaz Consumer
Awards in Mumbai. This is 6th year in a row that airtel has won the award in this category.
Business world CSR award was instituted in 1999 to recognize exemplary responsible business
practices by the Indian industry. Recruitment Process of Bharti Airtel Limited KTN circle –
Mobility Unit.
Man Power Planning Identification of Vacancies Sourcing of Candidates Rejection of Candidate
Screening of Profiles Selection of Candidate Assessment test, Line - Staff Manager Interviews
and HR Round Offer & Acceptance On boarding of the New Hire.
Airtel global presence
1. Africa 10. Burkina faso
2. Kenya 11. Gabon
3. Ghana 12. Chad
4. Sierra Leone 13. Congo B
5. Tanzania 14. Madagascar
6. Uganda 15. Seychelles
7. Malawi 16. Nigeria
8. DRC 17. Africa HQ
9. Niger 18. Rwanda
Asia
1. India
2. Bangladesh
3. Sri Lanka
Time Line
The chronology of events since Bharti Tele-Ventures was incorporated in 1995:
1995
Bharti Cellular launched cellular services as "AirTel" in Delhi.
28 | P a g e

2004
On 19 October 2004, Airtel announced the launch of a BlackBerry Wireless Solution in
India. The launch is a result of a tie-up between Bharti Tele-Ventures Limited and Research
in Motion (RIM).
2010
On 18 May 2010, Airtel won 3G spectrum in 13 circles: Delhi, Mumbai, Andhra
Pradesh, Karnataka, Tamil Nadu, Uttar Pradesh (West), Rajasthan, West Bengal, Himachal
Pradesh, Bihar, Assam, North East, Jammu & Kashmir for 122.95 billion.
Bharti Airtel wins broadband spectrum in four circles: Maharashtra, Karnataka, Punjab and
Kolkata for 33.14 billion.
2011
On 24 January 2011, Airtel announced the launch of its 3G services in India.[105]
On 31 January 2011, Airtel launched wallet service – Airtel Money in the millennium city of
Gurgaon.
On 18 February 2011, Airtel Digital TV brings cricket world cup in High Definition.
On 25 November 2011, Mr. Sharlin Thayil, CEO – Bharti Airtel, AP launches iPhone 4S in
Hyderabad.
2012
On 11 January 2012, Airtel launched Comedy FM on Airtel Mobile.
On 12 January 2012, Airtel launches all new "BBM Plan" for its postpaid mobile customers
on BlackBerry.
2013
On 4 February 2013, Bharti Airtel launches its emergency alert service in eastern region. In
2013 the department of telecommunications (DoT) was investigating Bharti Airtel for
violations of a license agreement the company violated between 2003 and 2005.
2014
On 18 February 2014, Bharti Airtel said it has signed a "strategic agreement" to acquire
Loop Mobile's three million subscribers and its 2G network comprising over 2,500 cell sites
and optic fibre in the financial capital, subject to regulatory approvals.
29 | P a g e

Together with its existing 4.3 million users, Bharti Airtel would replace Vodafone India –
with 7.1 million users – as the No. 1 in Mumbai by subscribers. It would, however, continue
to trail Vodafone in revenue market share —around 27% to nearly 36%
On 2 April 2014, Bharti Airtel renewed its infrastructure and application management
contract with IBM for five years.
Acquisitions and mergers
MTN Group merger negotiation
In May 2008, it emerged that Airtel was exploring the possibility of buying the MTN
Group, a South Africa-based telecommunications company with operations in 21
countries in Africa and the Middle East. The Financial Times reported that Bharti was
considering offering US$45 billion for a 100% stake in MTN, which would be the largest
overseas acquisition ever by an Indian firm. However, both sides emphasized the
tentative nature of the talks. In May 2009, Airtel confirmed that it was again in talks with
MTN and both companies agreed to discuss the potential transaction exclusively by 31
July 2009. The exclusivity period was extended twice up to 30 September 2009. Talks
eventually ended without agreement and on 30 September 2009, Bharti released a
statement saying that it had decided to disengage from discussions with the MTN Group
when the exclusivity period ended.
Zain
In March 2010, Bharti struck a deal to buy Zain's mobile operations in 15 African
countries, in India's second biggest overseas acquisition after Tata Steel's $13 billion buy
of Corus in 2007. Bharti Airtel completed its $10.7 billion acquisition of African
operations from Kuwaiti firm, making the Airtel the world's fifth largest wireless carrier
by subscriber base. Airtel has reported that its revenues for the fourth quarter of 2010
grew by 53% to US$3.2 billion compared to the previous year, newly acquired Zain
Africa division contributed US$911 million to the total. However, net profits dropped by
41% from US$470 million in 2009 to US$291 million 2010 due to a US$188 million
increase in radio spectrum charges in India and an increase of US$106 million in debt
interest.
Telecom Seychelles
On 11 August 2010, Bharti Airtel announced that it would acquire 100% stake in
Telecom Seychelles for US$62 million taking its global presence to 19 countries.
Telecom Seychelles began operations in 1998 and operates 3G, Fixed Line, ship to shore
services satellite telephony, among value added services like VSAT and Gateways for
International Traffic across the Seychelles under the Airtel brand. The company has over
57% share of the mobile market of Seychelles. Airtel announced plans to invest US$10
30 | P a g e

million in its fixed and mobile telecoms network in the Seychelles over three years,
whilst also participating in the Seychelles East Africa submarine cable (SEAS) project.
Wireless Business Service Private Limited
On 24 May 2012, Airtel announced an agreement to acquire a 49% stake in Wireless
Business Services Private Limited (WBSPL) at an investment of 907 crore (US$165
million). Airtel bought 26% in WBSPL from Global Holding Corporation and Tulip
Telecom and the balance 23% by subscribing to fresh equity of Qualcomm.
Global Holding Corporation and Tulip Telecom had bought 13% each in the BWA
entities for US$57.72 million (about 2.68 billion) in 2010
Joint Ventures
Airtel Ericson
As per a five-year managed services agreement signed recently, Ericsson will manage and
optimise Airtel's mobile networks in Africa. Ericsson will modernise and upgrade Airtel's
mobile networks in Africa with the latest technology including its multi standard RBS
6000 base station. As part of the modernisation, Ericsson will also provide technology
consulting, network planning & design and network deployment. Ericsson has been the
managed services and network technology partner in the Asian operations
Rebranding
On 18 November 2010, Airtel rebranded itself in India in the first phase of a global
rebranding strategy. The company unveiled a new logo with 'airtel' written in lower case.
Designed by London-based brand agency, The Brand Union the new logo is the letter 'a'
in lowercase, with 'airtel' written in lowercase under the logo. On 23 November 2010,
Airtel's Africa operations were rebranded to 'airtel'. Sri Lanka followed on 28 November
2010 and on 20 December 2010, Warid Telecom rebranded to 'airtel' in Bangladesh.
Sponsorship
On 9 May 2009 Airtel signed a major deal with Manchester United. As a result of the
deal, Airtel gets the rights to broadcast the matches played by the team to its customers.
Bharti Airtel signed a five-year deal with ESPN Star Sports to become the title sponsor of
the Champions League Twenty20 cricket tournament. But now the deal is terminated and
karbon is sponsoring Champions League Twenty20 cricket.
Airtel, also signed a deal to be title sponsor the inaugural Formula One Indian Grand Prix
during the 2011 season.
Airtel, signed a deal to be title sponsor the I-League for 2013–14 I-League.
Signature tune
The signature tune of Airtel is composed by Indian musician A. R. Rahman. The tune
became hugely popular and is the world's most downloaded mobile music with over 150
million downloads. A. R. Rahman along with Anu Malik has re-used the same tune in
Kannada movie titled Love.
31 | P a g e
A new version of the song was released on 18 November 2010, as part of the rebranding
of the company. This version too was composed by Rahman himself.
Green initiative
Green towers P7 program
Bharti Infratel is the only telecom tower company, which has installed almost 3 MWT of
solar capacity on their network, generating more than 5 million units of electricity every
year.
The Green Towers P7 program is scoped for 22,000 tower sites (primarily rural areas
having low or no Grid Power availability) out of which 5,500 sites have already been
implemented in the first year as a part of this 3-year program. Once completed, the
initiative will reduce diesel consumption by 66 million litres per year with a significant
carbon dioxide reduction of around 150,000 MT per year. Bharti Infratel bagged the 2011
'Green Mobile Award ' at the GSMA Mobile World Congress at Barcelona and was also
awarded the 2010 innovative infrastructure company of the year award at the CNBC
Infrastructure Awards for this groundbreaking initiative.
Energy Conservation
The company has installed solar hot water generator at its main campus in Gurgaon for
fulfilling the hot water requirement in the cafeteria. Majority of its facilities across NCR
region are now equipped with LES (Lighting Energy Savers) which have reduced energy
consumption in the lighting system to the tune of 10–25%. Variable Frequency Drives
installed in AHU (Air Handling Unit) at its campus have helped in enhancing the
efficiency of cooling system by 10%. These measures have resulted in a total saving of
850,000 units of electricity per year.
Airtel has embarked upon technology related initiatives like virtualization of servers that
has helped it release over 500 CPUs. Also the drive of sending e-bills to the post-paid
customers is helping save 12,840 trees annually. Within its campus the 'Secure Print
Solution' – an automated queue management–based secured printing solution has led to
an annualized saving of about 8 metric tonnes of paper.
2. 3 PROMOTER’S VISION, MISSION & QUALITY POLICY
2.3.1 VISION:
By 2015 Airtel will be the most loved brand, enriching the Lives of Million.
"Enriching lives means putting the customer at the heart of everything we do. We will meet their
needs based on our deep understanding of their ambitions, wherever they are. By having this
focus we will enrich our own lives and those of our other key stakeholders. Only then will we be
thought of as exciting, innovation, on their side and a truly world class company."

2.3.2 MISSION:
Customer service focus
Empowered employees
Innovative services
Cost efficiency
2.3.3 QUALITY POLICY:
This policy is applicable to all employees of the Bharti Group, and to all other stakeholders
interacting with the Bharti Group. It allows those individual employees and other stakeholders to
raise concerns, issues or information of acts or conduct that are in breach of the company's Code
of Conduct.
This policy aims to:
Provide an independent forum by means of the Office of the Ombudsperson, for employees and
external stakeholders of the company to raise concerns and complaints about improper practices
which are in breach of the Bharti Code of Conduct. Put in place a fair and equitable inquiry
process and redressal mechanism
Reassure employees and other stakeholders raising the concerns, that each one will be fully
protected against possible reprisals, intimidation, coercive action, dismissal, demotion or
victimization when a serious and genuine concern of apparent unprofessional conduct has been
made in good faith
2. 4 PRODUCTS/SERVICE PROFILE
Products and Services
Service revenue
Sale of products
Rebates & Discounts
Adjustments
Handset
Assembly sets
Modems
Sim cards traded
Broadband interact. Terminal
Product Name Year Sales Value
(Rs. Million)
% of STO
Service Revenue - Voice 2013 357425.00 78.81
Service Revenue - Others 2013 96061.00 21.18
Sale of Products 2013 23.00 0.01

Traded Goods 2013 0.00 0.00
Products
Prepaid Mobile Phone
Total cost control
Pre activated STD/ISD
Strong network coverage
Postpaid Mobile Phone
Easy billing
Easy payment options
Anytime, Anywhere
Credit limit
Strong network coverage
Long distance calling facility
Widest roaming (National and International)
GPRS – Roaming
Fixed wireless phone
Easy to use
Instant connection
Great Add-on services with features of a mobile phone
Broadband internet & internet
Switch today to Airtel Broadband
Power surfing
Surf while you talk
Other services provided by Airtel
o Turnkey solutions for VSAT network implementation and setting up VSAT teleport hubs.
o Turnkey solutions for Satellite ISP implementation including ATM, Frame Relay, MPLS
options.
o Satellite based connectivity solutions for ERP, SCM and banking solutions
o Disaster recovery solutions based on satellite connectivity
o Providing connectivity for GSM networks, MSC to Teleport
o E – learning
o Operations and maintenance of teleports

2. 5 AREAS OF OPERATION
MOBILE SERVICES
Airtel operates in all telecom circles of India. Its network is present in 5121 census towns and
457053 non-census towns and villages, covering approximately 86.6% of the country‘s
population as of September 2012. Airtel is the largest operator in Rural India with 83. 82%
million subscribers as of April 2013. Airtel is the 6th most valued brand according to an annual
survey conducted by Brand Finance and The Economic Times in 2010.
3G
On 18th may 2010, the 3G spectrum auction was completed and Airtel paid the Indian
Government 122.95 billion (US $2.1 billion) for spectrum in 13 circles, the most amount spent
by an operator in that auction. Airtel won 3G license in 13 telecom circles of India: Delhi,
Mumbai, Andhra Pradesh, Karnataka, Tamil Nadu, Uttar Pradesh, Rajasthan, West Bengal,
Himachal Pradesh, Bihar, Assam, North East, and Jammu & Kashmir.
Airtel also operates 3G services in Maharashtra & Goa and Kolkata circles through an agreement
with Vodafone and in Gujarat through an agreement with idea. This gives Airtel a 3G services
through Roaming Pacts outside its Licensed Zones in Seven Circles. On 24th January 2011,
Airtel launched 3G services in Bangalore, Karnataka – its largest circle by revenue. With this
launch, Airtel became the 3rd private operator (5th overall) to launch its 3G services in the
country following Tata Docomo and Reliance Communications. On 27th January 2011, Airtel
launched 3G in Chennai and Coimbatore in Tamil Nadu.
On 27th July 2011, 3G services were launched in Kerala‘s 3 largest cities Kochi, Kozhikode and
Thiruvananthapuram. Airtel 3G services are available in 200 cities through its network and in
500 cities through intra-circle roaming arrangements with other operators. Airtel had about 5.4
million 3G customers of which 4 million are 3G data customers as of September 2012.
4G
Airtel paid 33.1436 billion (US $550 million) for spectrum in 4 circles: Maharashtra and Goa,
Karnataka, Punjab and Kolkata. The company was allocated 20MHz of BWA spectrum in 2.3
GHz frequency band. Airtel‘s TD-LTE network is built and operated by ZTE in Kolkata and
Punjab, Huawei in Karnataka and Nokia Siemens Networks in Maharashtra and Goa. On 10th
April 2012, Airtel launched 4G services through dongles and modems using TD-LTE technology
in Kolkata, becoming the first company in India to offer 4G services. Airtel launched 4G
services on mobile from February 2014. The first city to get the service was Bangalore. Airtel
provides voice services for its TD-LTE subscribers through its existing GSM network which
made it the first operator in India to combine voice with TD-LTE services through GSM
network. Airtel had 1000000 4G subscribers as of January 2014.

Wi-Fi
Airtel has plans to launch Wi-Fi services in India. It intends to start offering Wi-Fi services in
Delhi NCR, Mumbai and Bangalore in initial phase. All plans will be on secure wireless
broadband internet with unlimited usage and will be session or time based. Users can use the
service by finding a hotspot, selecting airtel Wi-Fi Zone, activating the voucher and then login to
start browsing. Airtel intends to partner with establishment owner and Wi-Fi Partner for the café
and restaurant owners. Airtel Wi-Fi Partners can offer services at zero investments and can earn
commission on every Wi-Fi session sold.
Airtel Money
Airtel has started a new m-Commerce platform called Airtel Money in collaboration with Infosys
and Smart Trust (now Giesecke & Devrient). The platform was launched on 5 April 2012, at
Infosys headquarters in Bangalore. Using Airtel Money, users can transfer money, pay bills and
perform other financial transactions directly on the mobile phone. It has a all India presence.
Certain charges are levied per Airtel Money transactions.
Smart Drive
Smart Drive is navigation app exclusive to Airtel customers. The app features voice-based turn
by turn navigation, real time information update on traffic, approximate time of the travel on the
basis of the traffic situation on the various routes and also lets users see their location on the map
and plan the journey accordingly. It also suggests the subscribers an alternate route in case of
traffic congestion on the normal route. According to Airtel, Smart Drive calculates the traffic on
the basis of the numbers of GPS devices used on a particular road, their average speed, as well as
historical trends of traffic on that route. Smart Drive also allows users to search for points of
interest like restaurants, theatres and shopping malls. The app also allows users to keep a record
of all trips they make when using voice navigation for later reference through the ‗Trip
Recorder‘ feature, Wikipedia information of places for which information is available and the
ability to add frequently visited locations to favourites, in addition to weather information about
the place. Airtel will offer navigation at 10 per day or 99 per month. Live traffic will be cost
3 per day or 49 per month. Search and map viewer are available for free. The costs do not
include data charges. Airtel states in Smart Drive‘s FAQ that data is only used when the user
performs searches or calculates routes. The app is developed by Wise pilot, a mobile navigation
solutions provider and uses Navteq Maps for location and traffic info. It was launched on 12th
September 2012. At the time of launch, it was available only in Bangalore, Mumbai and NCR
services are currently available in Chennai. Service will be expanded to Pune and Hyderabad by
December 2012.
36 | P a g e

Network Experience Centre
Airtel has Network Experience Centre (NEC) which observes end to end customer experience, in
near real time, along with the standard network elements on Airtel‘s operations. The NEC is
located in Manesar, Haryana and went live on 31st October 2012. It is the first such facility in
India and will be able to monitor Airtel‘s network performance across mobile, fixed line,
broadband, DTH, M-Commerce, enterprise service, International Cable Systems and internet
peering points from a single location. It will monitor all Airtel and partner NOCs. In case of an
emergency, the NEC will enable the operator to prioritise actions to restore normalcy and reduce
resolution time. The NEC houses a video wall with 3600 square feet of solid state LED screen to
monitor Airtel‘s telecom network. This is the world‘s biggest video wall for a telecom operator.
Each cube in this wall is 1.6mx1.2m and there are 175 cubes arranged in a 25x7 matrix. The
clear span of the roof is 49mx18m and the beams, which are fireproof and about 8 feet deep,
have been specially designed to hold the structure without columns. The NCE was designed
specifically to be used as a command centre in case of national emergencies and natural
catastrophes. The facility is earthquake proof and also provides for a single control of command
and fully redundant technology layout.
iPhone
The iPhone 3G was rolled out in India in 2008 by Airtel. However, high prices and contract
bonds discouraged consumers and it was not as successful as the iPhone is in other markets of
the world. Airtel introduced the iPhone 4 on 27 May 2011 and the iPhone 5 on 2nd November
2012.
Telemedia
Airtel Broadband Blocking TPB under the Telemedia segment, Airtel provides broadband
internet access through DSL, internet leased lines as well as MPLs (multiprotocol label
switching) solutions, as well as IPTV and fixed line telephone services. Until 18th September
2004, Bharti provided fixed line telephony and broadband services under the Touchtel. Airtel
Broadband Blocking TPB under the Telemedia segment, Airtel provides broadband internet
access through DSL, internet leased lines as well as MPLs (multi-protocol label switching)
solutions, as well as IPTV and fixed line telephone services. Until 18th September 2004, Bharti
provided fixed line telephony and broadband service under the Touchtel brand. Bharti now
provides all telecom services including fixed line services under a common brand airtel. As of
September 2012, Airtel provides Telemedia services to 3.3 million customers in 87 cities. As on
30 November 2012, Airtel had 1.39 million broadband subscribers. Airtel Broadband provides
broadband and IPTV services. Airtel provides both capped as well as unlimited download plans.
However, Airtel‘s unlimited plans are subject to free usage policy (FUP) which reduced speed
after the customer crosses a certain data usage limit. In some plans, Airtel provides only 256
Kbit/s beyond FUP, which is lower than the TRAI specified limit of half the subscriber‘s original
speed. The maximum speed available for home users is 16Mbit/s.
37 | P a g e

2. 6 INFRASTRUCTURE FACILITIES
INTERNET INFRASTRUCTURE
The Internet backbone involves state of the art high-end routers and switchers as may deployed
on the best networks across the world to offer our customers reliable service of unmatched
quality. Three years back they had established satellite based gateway for internet access. This
was the first gateway by a private operator. Now we have established our fibre gateway on
Network i2i, first private submarine cable owned by them and SingTel.
FIXED LINE INFRASTRUCTURE
The high quality fibre-based, fixed line networks in Delhi, Haryana, Tamil Nadu, Karnataka,
Madhya Pradesh and Chhattisgarh intensively covers the most prominent commercial and
business district in the country. At Airtel Enterprise Services, provide the power of last mile
fixed line network to bring end to end voice and data solutions.
LONG DISTANCE INFRASTRUCTURE
The 25000 km advanced fiber – optic cable distance network covers India‘s top 200 cities. And it
powers the services of India‘s leading private telecom service providers- cellular, fixed line and
internet through Airtel Long Distance Services.
SUBMARINE CABLE INFRASTRUCTURE
Airtel has partnered with SingTel to create the world‘s largest submarine cable system- Network
i2i with 8.4 Tbps capacity. This 3200 km undersea cable structure stretchers from Chennai to
Singapore and thereon to Tier-1 carriers on SingTel‘s capacity on 175000 km of cables. The
huge capacity on network i2i is distributed locally in India through the 25000 km of advanced
fiber optic domestic long distance backbone, providing unprecedented capacity, speed and
reliability.
2. 7 COMPETITOR’S INFORMATION
The main competitors of Bharti Airtel are
1. Reliance
2. Idea
3. Vodafone
4. Tata Docomo
5. Aircel
6. MTNL
7. BSNL
38 | P a g e

MARKET CHALLENGERS
Vodafone
BSNL
FOLLOWERS
Idea
Reliance
NICHERS
Aircel
Docomo
Competitive Strengths
Businesses
Bharti Tele- Ventures current businesses include
Mobile services
Fixed line
National and international long distance services
VSAT, Internet services and network solutions.
Broadband services with DSL and Wi-Fi network.
Bharti Tele-Ventures believes that the following elements will contribute to the Company‘s
success as an integrated telecommunication services provider in India and will provide the
Company with a solid foundation to execute its business strategy:
o Nationwide footprint
o Focus on industry trends and capitalize on new telecommunications- related business
opportunities.
o The strong brand name recognition and a reputation
o The Company‘s strong relationships with international strategic and financial investors.
Conclusion
The conclusion is that Airtel‘s Advertisement has a major impact on its users.
Airtel had created a very good image on the mind of the new users of cellular service.
Airtel is successful in capturing the highest market share by adopting Celebrity
Endorsement
Strategies Adopted by Airtel:
Supply chain, Market division, Department of products, Vast Product Range,
Mind Blowing Advertisements.
But in students it isn‘t a popular one because there isn‘t much attracting schemes and
offers for the youth.
39 | P a g e
2.8 SWOT ANALYSIS
Bharti Airtel is the world‘s third largest mobile service provider by subscribers after China
Mobile and Vodafone with over 270 million global customers. It is also India‘s biggest wireless
telecom operator both by subscribers and revenue. Those numbers came in at 193.5 million and
Rs. 113 billion ($1.8 billion) respectively after the end of latest quarter. Again, these figures are
just for Airtel‘s mobile services in India. The telco also provides mobile telephony services in 20
other Asian and African countries. Given the challenging (but improving) telecom sector
sentiment in India, it is worthwhile to discuss a Strengths, Weaknesses, Opportunities, and
Threats (SWOT) analysis for the company.
Strengths
1. Largest cellular service provider in India, with over 164.61 million subscribers at the end
of April 2012.
2. Largest telecom operator in world with 207.8 million subscribers across 19 countries at
the end of 2011.
3. Only Indian operator, with VSNL, that has an international submarine cable.
4. High brand visibility.
5. Strong advertising with celebrity brand ambassadors.
Weakness
1. Price competition from BSNL & MTNL
2. Untapped Rural Market
Opportunity
1. Fast expanding cellular market
2. Latest and low cost technology
3. Untapped rural market.
Threats
1. New entrant‘s low price offering
2. Saturation point in Basic telephony service
3. Mobile number portability.
Segment
Elite class of people; Corporates
40 | P a g e

Target group
Elite class above 25 years age; YUPS (Young Upward Professionals)
Positioning
Aspirational and lifestyle brand; Premium category
2.9 FUTURE GROWTH PROSPECTS
Future outlook for Airtel will depend on following aspects:
1) Ability to sustain the fierce competitive environment with entry of new players.
2) Success on 3G services front.
3) Overseas expansion
4) Assistance in the form of diversification into new businesses under the Bharti Group.
India is set to witness entry of new players in the mobile services market. Names include
Datacom having the backing of Videocon and HFCL Group, Loop Telecom backed by Essars,
Unitech‘s telecom arm, Swan Telecom and Shyam which aspires to extend its foot print across
the nation. All these are considered to usher in a fierce competitive environment. Rural segment
is likely to be the focus of most of these players to build subscriber base.
Bharti Airtel should do well to sustain this challenge as it has on its disposal the incumbent
operator advantage. The company is well positioned to expand its network in the remote areas of
the country. Also the fact that while new entrants will only have start-up spectrum of 4.4MHz for
use, Bharti will benefit from having more spectrum in most of the circles.
Bharti through its association with SingTel is also on the positive side as far as experience in
offering 3G services goes. IT is expected to bid for pan-India 3G license and particularly for
metro circles where it is faced with the challenge of keeping a check on dwindling ARPUs.
Bharti off late is aggressively eying acquisitions in the overseas market with a special focus on
emerging markets. Few months back it was in highlight for its proposed merger with South
African MTN which ultimately turned to be futile. But the company has repeatedly suggested
that it is on top gears to hunt for an acquisition in the global telecom sector.
Bharti Airtel is also diversifying into new businesses now. IPTV and DTH are considered to be
two services which may again result in reasonable subscriber addition to the company as well as
help it to increase ARPU from current subscribers. More importantly its tie-up with Wal-Mart is
widely perceived to take Bharti Enterprises to the next level of Corporate Growth and
consolidate its position not only in the Indian business environment bur also on a global map.

Quarter EndeD Year Ended Particulars Y-on-Y Y-on-Y
Mar-14 Mar-13 Growth Mar-14 Mar-13 Growth
Total revenues EBITDA
EBITDA / Total revenues
EBIT
Finance cost (net)
Share of results of Joint Ventures/Associates
Profit before tax 5
Income tax expense 5
Net income 6
Capex
Operating Free Cash Flow (EBITDA - Capex)
Cumulative Investments
222,193
73,066
32.9%
33,622
9,911
1,673
25,384
13,306
9,616
195,821 13%
60,605 21%
30.9%
22,601 49%
11,158 -11%
875 91%
12,318 106%
7,255 83%
5,086 89%
32,878 1%
27,727 43%
1,861,643 16%
857,461
277,770
32.4%
121,274
48,380
5,211
78,105
44,478
27,727
33,278 105,843
39,788 171,927
2,158,800 2,158,800
2.10 FINANCIAL STATEMENTS
Bharti Airtel is a leading alternative provider of telecommunications services in India and among
the top ten global carriers offering services in about 20 other countries, particularly in Africa.
Through subsidiaries, the company operates three business units: Telemedia Services (broadband
and telephone), Enterprise Services, and Mobile Services. The Enterprise Services group aids
both long-distance carriers and corporate clients. Bharti Airtel has more than 220 million mainly
mobile subscribers. It provides digital television service for 5 million in India.
The company is a unit of Bharti Enterprises, a conglomerate with interests in financial services,
food, and retail, besides telecom. Table 2.1 Consolidated Summarized Statement of Operations (net of inter segment
eliminations)
Amount in Rs Mn, except ratios
769,045
232,579
30.2%
84,431
40,084
3,506
47,853
25,184
22,757
126,451
106,128
11%
19%
44%
21%
49%
63%
77%
22%
-16%
62%
1,861,643 16%
Note 5: Profit before Tax and Income Tax expense reported above for the quarter ended and full year ended March 31, 2014, excludes the impact of
exceptional items.
Note 6: Net Income for the quarter ended and full year ended March 31, 2014, includes the impact of exceptional items. Refer section 5.3.3 on
“Exceptional Items” on page 23 for details.

Particulars As at Mar 31,
2014 As at Mar 31,
2013
Assets
Non-current assets
Current assets
Total assets
Liabilities
Non-current liabilities
Current liabilities
Total liabilities
Equity & Non Controlling Interests
Equity
Non controlling interests
Total Equity & Non Controlling Interests
Total Equity and liabilities
1,607,915
223,857
1,831,772
624,060
568,050
1,192,110
597,560
42,102 639,662
1,831,772
Particulars
Quarter Ended Year Ended
Mar-14
Mar-13 Y-on-Y Growth
Mar-14
Mar-13 Y-on-Y Growth
Total revenues EBITDA
EBITDA / Total revenues
EBIT
Capex
Operating Free Cash Flow (EBITDA - Capex)
Cumulative Investments
10,242
3,816
37.3%
1,420
9,130 12%
3,783 1%
41.4%
1,866 558 -24%
3,225 246%
74,974 -42%
6%
39,352
14,771
37.5%
5,540
1,932 4,226
1,884 10,546
79,315 79,315
Table 2.2 Consolidated Summarized Statement of Financial Position
Amount in Rs Mn
1,395,347
196,906
1,592,253
627,603
420,547
1,048,150
503,217 40,886
544,103
1,592,253
Table 2.3 Telemedia Services
Amount in Rs Mn, except ratios
35,897
14,746
41.1%
6,999
3,408
11,338
10%
0%
-21%
24%
-7%
74,974 6%
Table 2.4 Stock market

Year after year, Bharti Airtel Limited has been seen their bottom line shrink from 42.6B INR to
22.6B INR despite an increase in revenues from 714.5B INR to 803.1B INR. An increase in the
percentage of sales devoted to cost of goods sold from 49.24% to 50.99% was a key component
in the falling bottom line in the face of rising revenues.
Share capital
Rs. 8340.15 million raised through the IPO
2002 Went Public
Shares in issue - 1,898,101, 604 as at September 30 2008
Market Capilitzation - approx. Rs. 1371 billion
P/E- 19.98, EPS – 36.16
Sources of funds
Graph 2.1 Reserves and surplus

Graph 2.2 Secure loans
Graph 2.3 Unsecured loans
45 | P a g e

Graph 2.4 Total
Graph 2.5 Fixed assets
46 | P a g e

Chapter
3
47 | P a g e
3.1 THORETICAL BACKGROUND OF THE STUDY ELOBORATIVE
INFORMATION ON SUBJECT CHOOSEN FOR BETTER
UNDERSTANDING AND USAGE IN THE ANAYLSIS
3.1.1 DEFINITON
Consumer Perception is the process through which the information from outside
environment is selected, received, organised and interpreted to make it meaningful to us. It is the
process by which individuals organise and interpret their sensory impressions in order to give
meaning to their environment.
According to Kolasa, ―Perception is selection and organisation of material which stems
from the outside environment at one time or the other to provide the meaningful entity we
experience‖.
According to S.P. Robbins, ―Perception may be defined as a process by which individuals
organise and interpret their sensory impressions in order to give meaning to their environment.
According to Joseph Reitz, ―Perception includes all those processes by which an
individual receives information about their environment – seeing, hearing, feelings, tasting, and
smelling.‖
3.1.2 WHY IS CONSUMER PERCEPTION IMPORTANT?
The consumer perceptions is the most important factory to know the growth or failure of a
company, as the consumer is the king of the market and he decides which product stays in the
market and which does not stay for long time. Taken the case of Airtel why it is important, the
reasons is discussed below:-
Meeting the needs of consumers is the underlying rationale for the existence of
community service organization. Customers have a right to quality services that deliver
outcomes.
Organization that strive beyond minimum standards exceed the expectations of their
consumers are likely to be leaders in their sector.
Consumers are recognized as key partners in shaping service developments and assessing
quality of service delivery.
The process for measuring consumer perception and obtaining feedback on organizational
performance are valuable tools for quality and continuous service improvements.
3.1.3 DYNAMICS OF PERCEPTION
Perception is a process consists of several sub-processes. One can take an input-
throughout-output approach to understand the dynamics of the perceptual process. This approach
emphasis that there is input, which is processed and gives output. The stimuli in the environment
- subjects, events, or people – can be considered as the perceptual inputs.
The actual transformation of these inputs through the perceptual mechanisms of selection,
organisation, and interpretation can be treated as the throughputs, and the resultant opinions,
48 | P a g e

feelings, attitudes, etc., which ultimately influence out behavior, can be viewed as the perceptual
outputs.
The steps in the perceptual process – selection, organisation, and interpretation-
Selection →
↓
Organisation
↓
Interpretation →
3.1.3.1 Perceptual Selection
Exposure ↓
Attention
Categorization
↓
Inference
Perceptual Process
The first component of perception, selection, requires consumers to be exposed to
marketing stimuli and to attend to these stimuli. Consumers will pick and choose marketing
stimuli based on their needs and attitudes. The car buyer will be more attentive to car ads; the
fashion conscious consumers will be more attentive to ads for clothing. In each case, the
consumer is processing stimuli selectively by picking and choosing them based on his or her
psychological set.
Processes Defining Perceptual Selection
For such perceptual selection to occur, the consumer must first see or hear the stimulus and then
respond to it. Therefore, three processes define selection which is:
1. Exposure: It occurs when consumers‘ senses (sight, hearing, touch, smell) are activated
by a stimulus. Exposure to a stimulus either occurs or it does not. Consumers interest in
and involvement with the stimulus is reflected in the level of attention they devote to it.
Consumers will pick and choose the stimuli they are exposed to.
2. Attention: It is the momentary focusing of a consumer‘s cognitive capacity on a specific
stimulus. When consumers notice a T.V. ad, a new product on a shelf, or a car in
showroom, attention has taken place.
3. Selective Perception: Consumers perceive marketing stimuli selectively because each
individual is unique in the combination of his or her needs, attitudes, experiences, and
personal characteristics. Selective perception means that two consumers may perceive
the identical advertisement, package, or product very differently. Selective perception
ensures that consumers will receive information most relevant to their needs.
49 | P a g e

3.1.3.2 Perceptual Organisation
It emphasis on the subsequent activities that take place in the perceptual process after a
stimulus is received. A person rarely perceives the extent of colour, light and sound associated
with objects. Instead he perceived organised patterns, stimuli and identifiable whole objects.
Factors affecting Perceptual Organisation
1. Figure and Ground: figure-ground principle is generally considered to be the most basic
form of perceptual organisation. Tis principle simply implies that the perceived object or
person or event stands out distinct from its background and occupies the cognitive space
of the individual. Eg: - as you read any book, you see white as the background and black
as the letters or words to be read. You do not try to understand what the white spaces in
the middle of black letters could mean.
2. Perceptual Grouping: grouping is the tendency to curb individual stimuli into
meaningful patterns. Eg:- if we perceive objects or people with similar characteristics, we
tend to group them together and this organising mechanism helps us to deal with
information in an efficient way rather than getting bogged down and confused with so
many details.
3. Perceptual Constancy: constancy is one of the more sophisticated forms of perceptual
organisation. This concept gives a person a sense of stability in this changing world. This
principle permits the individuals to have constancy or stability in a tremendously variable
and highly complex world.
4. Perceptual Context: the highest and most sophisticated form of organisation is
‗perceptual context‘. It gives meaningful and value to simple stimuli, objects, events,
situations and other persons in the environment. The organizational structure and culture
provide the primary context in which workers and managers do their perceiving.
5. Perceptual Defence: closely related to perceptual context is the perceptual defence. A
personal may build a defence against stimuli or situational events in a particular context
that are personally or culturally unacceptable or threatening. Most studies verify the
existence of a perceptual defence mechanism.
3.1.3.3 Perceptual Interpretation
People exercise selectivity as to which stimuli they perceive and they organise these
stimuli on the basis of certain psychological principles. The interpretation of stimuli is also
uniquely individual, because it is based on what individuals expect to see in light of their
previous experiences on the number of plausible explanations they can envision, and on their
motives and interests at the time of perception.
Perceptual Distortion
Individuals are subject to a number of influences that tend to distort their perceptions, such as:
50 | P a g e

1. Physical Appearances: people tend to attribute the qualities they associate with certain
people to others who may resemble them, whether or not they consciously recognise
the similarity. For this reason, the selection of models for print advertisements and for
television commercials can be a key element in their ultimate persuasiveness.
2. Stereotypes: individual tend to carry pictures in their minds of the meanings of various
kinds of stimuli. These stereotypes serve as expectations of what specific situations,
people or events will be like, and they are important determinants of how such stimuli
are subsequently perceived.
3. First impressions- first impressions tend to be lasting; yet, in forming such
impressions, the perceiver does not know which stimuli are relevant, important, or
predictive of later behavior. A shampoo commercial effectively used the line, ―You will
never have a second chance to make a first impression‖.
4. Jumping to Conclusions: many people tend to jump to conclusions before examining
all the relevant evidence. Eg: - the consumer may hear just the beginning of a
commercial message and draw conclusions regarding the product or service being
advertised. For this reason, many copywriters are careful to give their most persuasive
arguments first.
5. Halo effect: historically, the halo effect has been used to describe situations in which
evaluations of a single object or person on a multitude of dimensions is based on the
evualuion of just one or a few dimensions. Consumer behaviorists broaden the notion
of the halo effect to include the evolution of multiple objects on the basis of the
evolutions of just one dimension.
3.1.4 ELEMENTS OF PERECEPTION
3.1.4.1 Sensation
When a person is exposed to any of the marketing stimuli or an ad, the first reflect that is
initiated in him is known as sensation. Eg:- when a person comes across a beautiful ado f a
Mercedes Benz ‗E-class‘ on the center spread of a magazine, their first reaction will probably be
one of admiration. As person enter a bakery, may smell the mouthwatering aroma of freshly
baked cakes. We can feel the energy in pulsating music played at a disco.
3.1.4.2 Absolute Threshold
The absolute threshold is the minimum level of stimulus intensity needed for a situation
to be perceived. In other words, the absolute threshold is the amount of intensity needed to detect
a difference between something and nothing. Suppose you are driving in the highway and a
billboard is in the distance. A billboard might have the most entertaining copy ever written, but
his genius is wasted if the print is too small for passing motorists to see it from the highway. The
absolute threshold is that point at which you can first see the billboard. Before that point, the
billboard is below the absolute threshold and not sufficiently intense to be seen.
51 | P a g e

3.1.4.3 Differential threshold/Just noticeable difference
The minimal difference that can be detected between two similar stimuli is called the
differential threshold, or the Just Noticeable Difference (the JND).
A 19th century German scientist named Ernst Weber discovered the JND between two stimuli
was not an absolute amount, but an amount relative to the intensity of the first stimulus.
Weber‘s law, as it has come to be known, states that the stronger the initial stimulus, the greater
the additional intensity needed for the second stimulus to be perceived as different.
Applications of Just- Noticeable –Difference to Consumer Behaviour
Manufacturers and marketers endeavor to determine the relevant JND for their products for two
very different reasons:-
1. So that negatives changes (e.g., reductions in product size or quality, or increases in
product price) are not readily discernible to the public (i.e., remain below the JND).
2. So that product improvements (e.g., improved or updated packaging, larger size, or lower
price) are very apparent to consumers without being wastefully extravagant (i.e., they are
at or just above the JND).
3.1.4.4 Subliminal Perception
The concept of the perceptual threshold s important for another phenomenon – subliminal
perception. Suppose a person sitting at a movie and is exposed to messages like ―Eat popcorn‖
and ―Drink coke‖. However, each message is shown on the screen for only a fraction of a
second, so short a time that you are not consciously aware of them. Stimuli like these, presented
below the threshold level of awareness, are called subliminal perception.
3.1.5 SELF PERCEPTION
Self-perception theory attempts to explain how individuals develop an understanding of the
motivations behind their own behavior. Self-perception by consumers relates to values and
motivations that drive buying behavior which is also an important aspects of consumer
perception theory.
3.1.6 PRICE PERCEPTION
While mass merchandisers such as Wal-Mart emphasizes low prices as an inherent virtue,
upscale merchants attempts to emphasize quality and value for money to appeal to potential
customers. Two factors that shaped price perception were the perceived quality of merchandise
or service in question and price comparisons with merchants offering similar merchandise or
services.
52 | P a g e

3.1.7 BENEFIT PERCEPTION
―It‘s good and it‘s good for you‖. Many consumers are familiar with this phrase frequently
associated with food advertising. Researchers have surveyed consumers to determine how
nutrition claims associated with food affected their perception of that food‘s nutritional value.
The researchers also theorized that consumers would demonstrate a trend toward applying more
scrutiny to nutrition claims and would demand more specific information about foods they
purchase.
3.1.8 FACTORS INFLUENCING PERCEPTION
Individuals may look at the same thing, but perceive it differently. A number of factors
operate to shape and sometimes distort perception. These factors include:-
1. Factors in the Perceiver (Internal Factors)
(i) Needs and Motives: people‘s perception is determined by their inner needs. A
need is a feeling of tension or discomfort when one thinks he is missing
something or requires something. People with different needs usually experience
different stimuli. Similarly people with different needs select different items to
remember or respond to.
(ii) Self-concept: the way a person views the world depends a great deal on the self-
concept or image he has about himself. The self-concept plays an important role
in perceptual selectivity. It can be thought of as an internal form of attention
getting and is largely based on the individual‘s complex psychological makeup.
(iii) Beliefs: a person‘s beliefs have profound influence on his perception. Thus, a fact
is conceived not on what it is but what a person believes it to be. The individual
normally censors stimulus inputs to avoid disturbance of his existing beliefs.
(iv) Past experience: a person‘s past experience mould the way he perceives the
current situations. If a person has been betrayed by a couple of friends in the past,
he would tend to distrust any new friendship that he might be in the process of
developing.
(v) Expectations: expectation affect what a person perceives. Expectations are
related with the state of anticipation of particular behavior from a person. In the
organizational setting, expectations affect people‘s perception. Thus a technical
manager may expect ignorance about the technical feature of a product from the
non-technical people.
2. Factors in the Target or Perceived (External Factors)
(i) Size: the bigger the size of the perceived stimulus, the higher is the probability
that it is perceived. Size attracts the attention of an individual. It establishes
dominance and enhances perceptual selection.
53 | P a g e
(ii) Intensity: high intensity increases the chances of selection. If the message is
bright, if sentences are underlined, it gets more attention than in normal case. The
greater the intensity of stimulus, the more likely it will be noticed.
(iii) Frequency: repeated external stimulus is more attention attracting than a single
time. Repetition increases our sensitivity and alertness to the stimulus. Thus,
greater the frequency with which a sensory stimulus is presented, the greater the
chances we select it for attention.
(iv) Status: perception is also influenced by the status of the perceiver. High status
people can exert greater influence on perception of an employee than low status
people.
(v) Contrast: stimuli that contrast with the surrounding environment are more likely
to be attention catching than the stimuli that blend in. a contrasting effect can be
caused by colour/size or any other factor that is unusual. The contrast principle
states that external stimuli that stand out against the background or which are not
what are expected will receive better attention.
3. Factors in the Situation
The contest in which we see object or events is important. Elements in the
Surrounding environment influence our perception. The time at which an object
or event is seen can influence attention, as can location, light, heat, or any number
of situational factors.
3.1.9 INFLUENCE OF PERCEPTION ON CONSUMER BUYING BEHAVIOUR
Consumer Buying Behvaiour is influenced by perception also, which is psychological
influence. Marketer‘s strategies make use perceptual processes to gain and retain customers.
Partly determine people‘s general behavior and thus, influence their behavior as consumers.
Even though these perception processes operate internally, they are very much affected by social
forces outside the individual. An individual‘s current set of needs affects selective exposure.
Information inputs that relate to one‘s strongest needs at a given time are more likely to be
selected to reach awareness.
The selective nature of perception, the first step may result not only in selective exposure but
also in two other conditions:
1. Selective Distortion: it is changing or twisting currently received information; it occurs
when a person receives information inconsistent with personal feelings or beliefs. Eg;- on
seeing an advertisement promoting a disliked brand, a viewer may distort the information
to make it more consistent with prior views. This distortion substantially lessens the
effect of the advertisement on the individual.
2. Selective Retention: in selective retention, a person remembers information inputs that
support personal feelings and beliefs and forgets inputs that do not.
54 | P a g e

After hearing a sales presentation and leaving a store, a customer may forget many
selling points if they contradict personal beliefs.
Although marketers cannot control buyer‘s perceptions, they often try to influence them through
information. Several problems may arise from such attempts, however. First, a consumer‘s
perceptual process may operate such that a seller‘s information reaches that person. Eg: - a buyer
may block out a salesperson‘s presentation. Second, a buyer may receive a seller‘s information
but perceive if differently than was intended.
Eg: - when a toothpaste producer advertises that ―35% of the people who use this toothpaste have
fever cavities‖, a consumer might infer that 65% of users have more cavities. Third, a buyer who
perceives information inputs to be inconsistent with prior beliefs is likely to forget the
information quickly.
Thus, it can be said that perceptual process influences buying behavior of consumer which
should be intelligently used by marketers.
3.1.10 PERCEPTION AND MARKETING IMPLICATIONS
A study of perception is useful in the following areas:-
1. Retail Strategy: most retail environments contain a vast array of information. It
is a known fact that consumers cannot process all the information. Hence,
retailers, need to be concerned about information overload. Retailers must ensure
that consumers do not become frustrated and minimize their in-store information
processing. Retailers therefore, use exposure very effectively. The total mix of in-
store information cues (brands available, layout, point of purchase displays, etc.),
external building characteristics, and advertising combine to form the meaning of
store image assigned. The consumers forms a perception about the store, as a
result.
2. Brand Name and Logo Development: brand names are important for both
consumer and industrial products. A brand name which is difficult to pronounce
and does not convey much of a visual image is not likely to find appeal amongst
the target consumers. There are companies which use linguistics and computers to
create names that convey the appropriate meaning for the products. Eg- the brand
name of ―Compaq‖ for a computer was created in such as fashion. It was
originally to be called –―Gateway‖. But the focus on choosing this brand name
was on the total meaning conveyed by the interaction of the meaning of the
name‘s parts.
3. Media Strategy: the fact that the exposure process is selective rather than random
is the underlying basis for effective media strategies. Marketers determine the
media to which consumers in the target market are most frequently exposed and
then place their advertising messages in those media.
55 | P a g e

For some products and target markets, consumers are highly involved with the
product and will go to considerable lengths to secure product relevant
information. Consumers of these kinds of products will search for media where
relevant information is available.
4. Advertisement and Package Design: it must perform two critical task:-
i) Capture attention
ii) Convey meaning
A marketer should make effort to attract attention to a package or advertisement.
To a large extent, what he does depends on the target market, the product, and the
situation. If the target market is interested in the product category, and in that
particular brand, attention does not pose much of a problem.
Once consumers are exposed to the message, they will most likely attend to it
sometimes it is the other way round.
5. Advertising Evaluation: a successful advertisement (or any other form of
marketing message) must accomplish four tasks:-
i) Exposure: it must physically reach the consumer.
ii) Attention: it must be attended to by the consumer.
iii) Interpretation: it must be properly interpreted.
iv) Memory: it must be stored in memory in a manner that will allow
retrieval under the proper circumstances.
3.1.11 CASE STUDY
The effect of Consumer Perception on marketability of new products: - the case of
‘Kenya Commercial Banks’ ‘Bankika’ account
Consumer Perception is an important tool for evaluation of marketing strategies. The marketers
are keen on checking the Consumer Perception towards service, quality of products, pricing,
packaging and the sales promotion activities. Consumer Perception depends on the relationship
between a consumer and the business organization and various aspects of services provided by
company for example, quality and reliability.
It is therefore important for marketers to have a profound knowledge on various factors that
affect consumer‘s perception of their products and services. The main objective of the study is to
determine the effect of Consumer Perception on marketability of new product through a case
study of ‗Bankika account‘ offered by Kenya Commercial Banks. Semi structured questionnaires
were used to collect primary data from Bankika account holders.
The study findings revealed that Consumer Perception of ‗Bankika account‘ is affected by
factors such as flexibility of the account, friendly minimum balance, quality and reliability of
56 | P a g e

services provided to the account holders, marketing strategies example media advertisements and
brouchers, and corporate image of the bank.
The study recommended that Kenya Commercial Bank should make their services delivery more
attractive to customers by reducing the amount of transaction fee charged for ATM withdrawals,
hastening the release of the ATM cards, hastening the rate of processing loans, reducing the
minimum withdrawal amount, improving the speed of service delivery and intensifying its
marketing strategies. The study also recommends further studies on the impact of market
segmentation on the growth of bank accounts for youth and the technology as a tool to enhance
competitive advantage of commercial banks in Kenya.
3.2 CUSTOMER PERCEPTION OF SERVICES
Human Beings are constantly attacked by numerous sensory stimulations including noise,
sight, smell, taste etc., The critical question in the study of perception is why the same universe
is viewed differently by different persons? The answer is the Perception.
Different people perceive the universe differently. Perception is the process through
which the information from outside environment is selected, received, organised and interpreted
to make it meaningful to us. Perception is the process by which individuals organise and interpret
their sensory impressions in order to give meaning to their environment.
3.2.1 FACTORS THAT INFLUENCE CUSTOMER PERCEPTION OF SERVICES
Customer perception of value, quality and satisfaction are influenced by four important
factors. They are service encounter, service evidence, image and price.
1. Service Encounter: customer perception of service quality is primarily influenced by the
service encounter. A customer estimates the quality of service throughout his/her
interaction with a service provider.
2. Service Evidence: business services are intangible, customers are searching for evidence
of service in every interaction they have with an origination. The three major categories
of evidence as experienced by the customer are: people, process and physical evidence.
These categories together represent the service and provide the evidence that tangiblises
the offering.
i) People/ Service Personnel
Service personnel play an important role in defining the quality of a
service encounter in the mind of the consumers. The ability of the
personnel to be enthusiastic, friendly and spontaneous will make the
service experience a pleasant one for consumer.
ii) Process of Service Delivery
The second type of service evidence is the process of service delivery. It
involves various steps in the process of delivering a service and the flow
of operational activities.
57 | P a g e

iii) Physical Environment
This is the third type of service evidence that creates an impact on
consumer perceptions. The physical environment consists of the ambience
offered by a service provider and the design of the interiors or exteriors of
the service facility.
3. Organisational Image
Image of organisation has a profound effect on perception of consumers.
Consumer perceives quality of service on basis of image of organisation. An
organisation with a positive image is considered to be providing good quality
service, whereas on organisation with not favorable image is considered to be
providing bad quality service.
A favorable image, either at corporate or local levels, is an assest for any firm
because it has an impact on consumer perceptions relating to the operations and
communications of the firm. A positive image makes people more open to
favorable word of mouth communication.
4. Price
Perception of consumer is affected by the price of service. If a service company
prices a product low then consumer may perceive if of low quality whereas, if te
price is high, consumers expect high quality service. Consumers frequently rely
on prices as a surrogate indicator to develop expectations and perceptions of a
service because services are intangible.
3.3 STATICAL TOOLS USED
IBM SPSS
SPSS statistics is a software package used for statistical analysis. Long produced by
SPSS Inc., it was acquired by IBM in 2009. The current versions IBM SPSS Statistics.
Companion products in the same family are used for survey authoring and deployment (IBS
SPSS Data Collection), data mining (IBM SPSS Modeler), text analytics and collaboration and
deployment (batch and automated scoring services). The software name stands for Statistical
Package for Social Sciences (SPSS), reflecting the original market, although the software is now
popular in other fields as well including the health sciences and marketing. The latest version 20
is being used for the purpose of analysis of data for this project.
Excel 2013
Microsoft Office 2013 is a version of Microsoft Office, a productivity suite for Microsoft
Windows. It is the successor of Microsoft Office 2010 and includes extended file format support,
user interface updates and support for touch among its new features. Microsoft released Office
2013 to general availability on 29th January 2013.
58 | P a g e
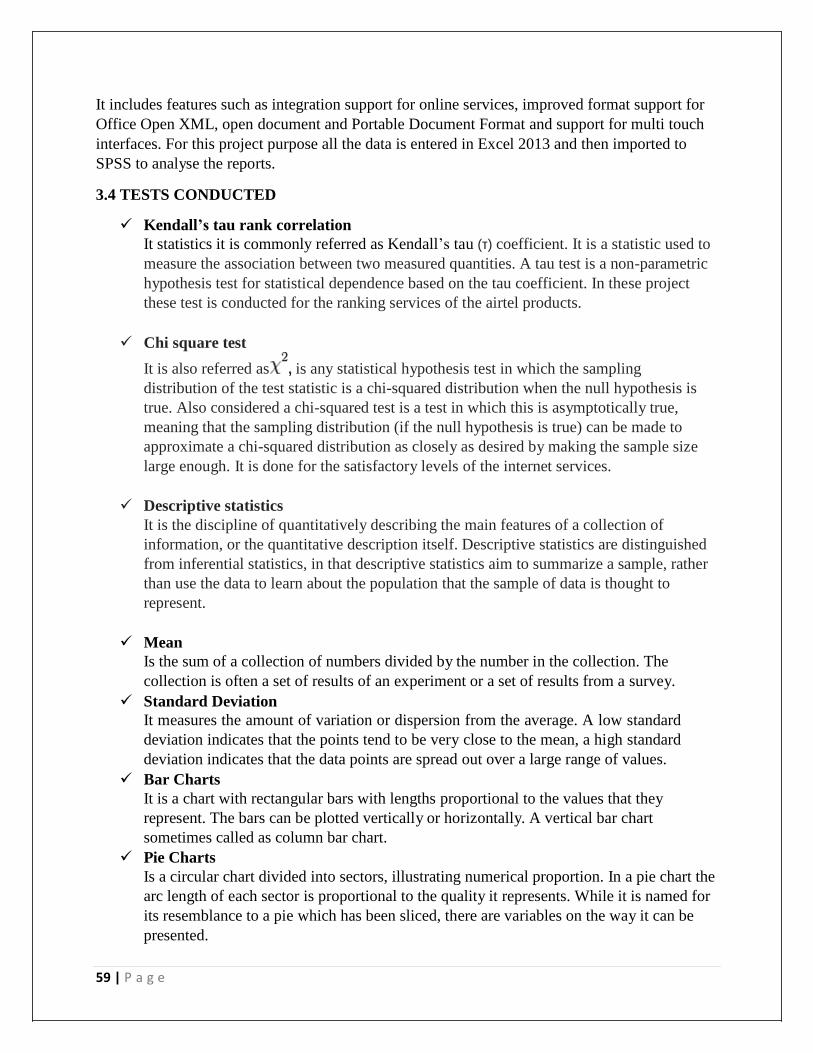
It includes features such as integration support for online services, improved format support for
Office Open XML, open document and Portable Document Format and support for multi touch
interfaces. For this project purpose all the data is entered in Excel 2013 and then imported to
SPSS to analyse the reports.
3.4 TESTS CONDUCTED
Kendall’s tau rank correlation
It statistics it is commonly referred as Kendall‘s tau (τ) coefficient. It is a statistic used to
measure the association between two measured quantities. A tau test is a non-parametric
hypothesis test for statistical dependence based on the tau coefficient. In these project
these test is conducted for the ranking services of the airtel products.
Chi square test
It is also referred as , is any statistical hypothesis test in which the sampling
distribution of the test statistic is a chi-squared distribution when the null hypothesis is
true. Also considered a chi-squared test is a test in which this is asymptotically true,
meaning that the sampling distribution (if the null hypothesis is true) can be made to
approximate a chi-squared distribution as closely as desired by making the sample size
large enough. It is done for the satisfactory levels of the internet services.
Descriptive statistics
It is the discipline of quantitatively describing the main features of a collection of
information, or the quantitative description itself. Descriptive statistics are distinguished
from inferential statistics, in that descriptive statistics aim to summarize a sample, rather
than use the data to learn about the population that the sample of data is thought to
represent.
Mean
Is the sum of a collection of numbers divided by the number in the collection. The
collection is often a set of results of an experiment or a set of results from a survey.
Standard Deviation
It measures the amount of variation or dispersion from the average. A low standard
deviation indicates that the points tend to be very close to the mean, a high standard
deviation indicates that the data points are spread out over a large range of values.
Bar Charts
It is a chart with rectangular bars with lengths proportional to the values that they
represent. The bars can be plotted vertically or horizontally. A vertical bar chart
sometimes called as column bar chart.
Pie Charts
Is a circular chart divided into sectors, illustrating numerical proportion. In a pie chart the
arc length of each sector is proportional to the quality it represents. While it is named for
its resemblance to a pie which has been sliced, there are variables on the way it can be
presented.
59 | P a g e
Chapter
4

4.1 ANALYSIS AND INTERPRETATION
The responses of the customers are analyzed in order to know the results of the objectives set for
the projects. It helps in proper analysis to know the further improvements to be made in order to
attract more number of consumers. Hence this this analysis and interpretation gives description
with the tables and graphs where ever necessary.
1. Gender descriptions:-
Table 4.1
Gender Number of Respondents
Male 114
Female 36
Total 150
Chart 4.1
NUMBER OF RESPONDENTS
120 114
100
80
60
40 36
20
0
Male Female
Interpretation
The survey which consisted of 150 respondents, has 114 of male and 36 of
female. Which states that male are of about 76% and female are about 24%. It can be
known that male counter parts have a greater part to be played in this survey done among
the various groups of people.

Education Level Number of Respondents
Upto SSLC 90
PUC 28
Graduation & Above 32
Total 150
2. Age group:-
Table 4.2
Age Group Number of Respondents
21-30 98
31-40 34
41-50 10
51-60 8
Above 60 -
Total 150
Chart 4.2
Number of Respondents
8 10
34
98
21-30 31-40 41-50 51-60
Interpretation
The age group of people are from 21 to 60, in which about 98 consumers where in
the age group of 21-30 followed by 31-40 and 41-50. The least number is seen in the age
group of 51-60. We can interpret that the lower age group of consumers are seen
participated in the survey for a bigger percentage of the total respondents.
3. Education qualification of the respondents:-
Table 4.3

Chart 4.3
Number of Respondents
Graduation & Above
PUC
Upto SSLC
0 20 40 60 80 100
Interpretation
The education qualification of the consumers is divided into 3 categories namely
up to SSLC, PUC, and Graduation & above. In this we can see that consumers with
education level up to SSLC constitute about 90 numbers followed by PUC with 28. It
consists of 32 respondents with education level graduation and above. The education
level is not considered as a parameter for the usage of airtel services by the consumers.
4. Occupation status :-
Table 4.4
Occupancy Status Number of Respondents
Business 33
Service 24
Professional 25
Self employed 14
Student 43
House Wife 11
Total 150
Interpretation
The occupation status of the respondents is considered to know the working status of the
consumers and the source of their money. We can see that about 33 of them are doing their own
business, followed by students, professionals, service, self-employed and house wife.

5. Income level of respondents:-
Table 4.5
Income Level Number of Respondents
Upto 25000 53
25000-50000 54
50000-100000 15
100000-200000 17
Above 200000 11
Total 150
Interpretation
The income level of the people is taken to know the family status of the consumers. We
can see that about 54 respondents are in the income level of 25000-50000, 53 are earning up to
25000. The least number of respondents have monthly income level above 200000.
6. Marital Status:-
Table 4.6
Marital Status Number of Respondents
Married 61
Unmarried 89
Total 150
Interpretation
The marital status of respondents can be seen as unmarried with 89 consumers as
they are the sole decision makers for the choice of airtel services. While the remaining 61 are
married and they depend upon their partners to take up decisions about choosing the mobile
network.
7. Source of information to consumers
Table 4.7
Information source Number of Respondents
Media advertisements 57
Print advertisements 22
Friends/ Relatives 55
Family members 14
Others 2
Total 150

Chart 4.4
Number of Respondents
2
14 57
55
22
Media advertisements Print advertisements Friends/ Relatives
Family members Others
Interpretation
The source of information is considered to know the medium by which the
consumers are more influenced. More number of respondents are influenced by the media
advertisements and less number are influenced by family members and while the respondents
consider other factors also.
8. Type of mobile payment:-
Table 4.8
Mobile payment Number of respondents
Post paid 29
Pre-paid 121
Total 150
Interpretation
The mobile payments are of 2 types namely postpaid and pre-paid. Where more
number of people prefer for prepaid connection due the amount of money to be paid is lesser in
prepaid compared to the postpaid which also comes with additional charges also.

9. Usage of mobile network:-
Table 4.9
Mobile network Number of respondents
CDMA 6
2G 69
3G 73
4G 2
Total 150
Interpretation
The CDMA is the mobile sets which was introduced when the mobile phones was
introduced newly in the market and it was used by only 6 respondents. The 2G
connection is the normal GSM mobile network which was used by respondents with
network connection, where 3G connection are more speeder then that of 2G services
while using the internet. While 4G is the latest services introduced by airtel which has
more advanced features then the 3G but it is used by very few respondents.
10. Mobile scheme:-
Table 4.10
Schemes Number of respondents
Lifetime 71
Normal monthly plan 56
Students pack 5
All India per seconds plan 14
Others 4
Total 150
Interpretation
The mobile scheme contains the various offers that are given to the airtel
consumers. In which the respondents are using more of lifetime connections which gives more
validity compared to the other offers.

11. Number of years associated:-
Table 4.11
Number of years Numbers of respondents
<1year 15
2years 27
3years 41
4years 22
More than 5years 45
Total 150
Chart 4.5
Numbers of respondents
50
45
40
35
30
25
20
15
10
5
0
<1year 2years 3years 4years More than 5years
Interpretation
The respondents are using airtel services for more than 5 years who are the loyal
consumers for using the services. Its followed by respondents who are using airtel services from
3years, some by 2years, 4years and new customers who are using it for less then 1year.
12. Problems faced by consumers:-
Table 4.12
Problems Number of respondents
Always 7
Sometimes 118
Never 25
Total 150

Interpretation
Most of the respondents who are using airtel services are faced with network
problems. Out of the total about 118 are faced with problems sometimes and while 25 of them
have not faced with network problems any time during their association with airtel. Only about 7
of them face network problems always. The problem is network connection can be due to less
availability of network towers nearby or due to bad weather at sometimes.
13. Suggest the services to others:-
Table 4.13
Suggestion Number of respondents
Yes 133
No 17
Total 150
Interpretation
The number of respondents associated with airtel from a longer period of time
would suggest others also to use the same. It can been seen that about 133 respondents are
willing to suggest others to use the airtel connection, but while only 17 of them do not want to
suggest it to the other due to the problems faced by them.
14. Ranking of the services
Table 4.14
Services Percentage
VAS 2
Brand name 1
Low price 3
Quality service 5
Network availability 4
Tariff plans 10
Retailers services 7
Customers services 8
Credit facility 9
Data usage (3G/4G) 6
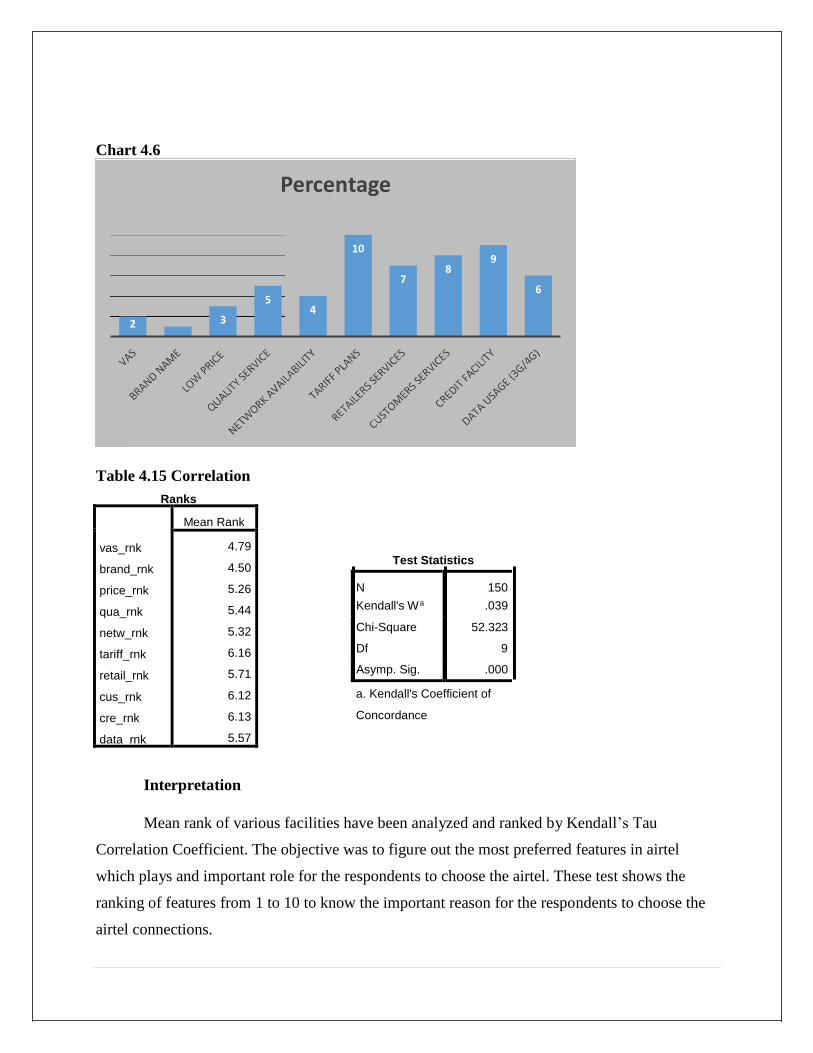
Mean Rank
vas_rnk
brand_rnk
price_rnk
qua_rnk
netw_rnk
tariff_rnk
retail_rnk
cus_rnk
cre_rnk
data_rnk
4.79
4.50
5.26
5.44
5.32
6.16
5.71
6.12
6.13
5.57
Chart 4.6
Percentage
10 9
8 7
6 5
4 2 3
Table 4.15 Correlation
Ranks
Test Statistics
N
150 Kendall's Wa .039
Chi-Square 52.323
Df 9
Asymp. Sig. .000
a. Kendall's Coefficient of
Concordance
Interpretation
Mean rank of various facilities have been analyzed and ranked by Kendall‘s Tau
Correlation Coefficient. The objective was to figure out the most preferred features in airtel
which plays and important role for the respondents to choose the airtel. These test shows the
ranking of features from 1 to 10 to know the important reason for the respondents to choose the
airtel connections.

With a mean rank of 4.50 the brand name of airtel is the main reason to choose these
service and it is ranked 1 among all the factors. It followed by Value Added Services with mean
rank of 4.79 and 2 rank.
The 3rd rank is given to low price followed by 4th rank to network availability, 5th to
quality service, 6th to data usage, 7th rank to retailers service, customers services with 8th rank, 9th
rank to credit facility and the last rank to tariff plans which is the least feature to choose the
services.
15. Areas of improvement
Table 4.16
Services Highly Required Required Not Required
VAS 28 66 56
Brand name 17 43 90
Low price 36 64 50
Quality service 24 76 50
Network availability 34 68 48
Tariff plans 46 70 34
Retailers services 36 65 49
Customers services 34 75 41
Credit facility 35 52 63
Data usage (3G/4G) 30 69 51
Total 150
Interpretation
The below table shows the features which requires improvements and which does
not require any improvements to be made. The tariff plans highly requires improvement
compared to all other features as they have the least mean of 1.92 compared to the others.
The tariff plans is an important requirement for the users to choose the airtel services.
The features which requires less improvements are retailers and customers
services, network availability and low price. Here we can see that all these features have
mean of about 2.0 by which it can be ascertained that does not require much
improvements to be made.
The features which does not require any improvements are VAS, brand name,
quality service, credit facility and data usage. They a mean of about 2.1 and above as it
shows that it does not require any improvements.
Among all the features it can be known that the brand name has the highest mean
of 2.4 and it does not require any improvement. The least mean is 1.92 for the tariff plans
which means that the customers feel it needs more improvements to be made.

Table 4.17 areas of improvement report
Services Mean Std. Deviation Mean – S D Mean + SD Results
VAS 2.186667 0.724676 1.46199 2.911343 NR
Brand name 2.486667 0.690282 1.796385 3.176948 NR
Low price 2.093333 0.751413 1.34192 2.844747 R
Quality service 2.173333 0.680653 1.49268 2.853987 NR
Network availability 2.093333 0.733455 1.359879 2.826788 R
Tariff plans 1.92 0.725902 1.194098 2.645902 HR
Retailers services 2.086667 0.747767 1.3389 2.834434 R
Customers services 2.046667 0.705565 1.341101 2.752232 R
Credit facility 2.186667 0.786441 1.400226 2.973107 NR
Data usage (3G/4G) 2.14 0.721388 1.418612 2.861388 NR
16. Rating of services
Table 4.18
Services Video
call
Internet
service
Live
TV
Video download Conference
calls
Poor 15 5 10 8 7
Average 29 18 34 21 20
Good 52 63 41 52 47
Very good 12 32 19 30 28
Excellent 4 18 5 16 15
Not applicable 38 14 41 23 33
Total 150
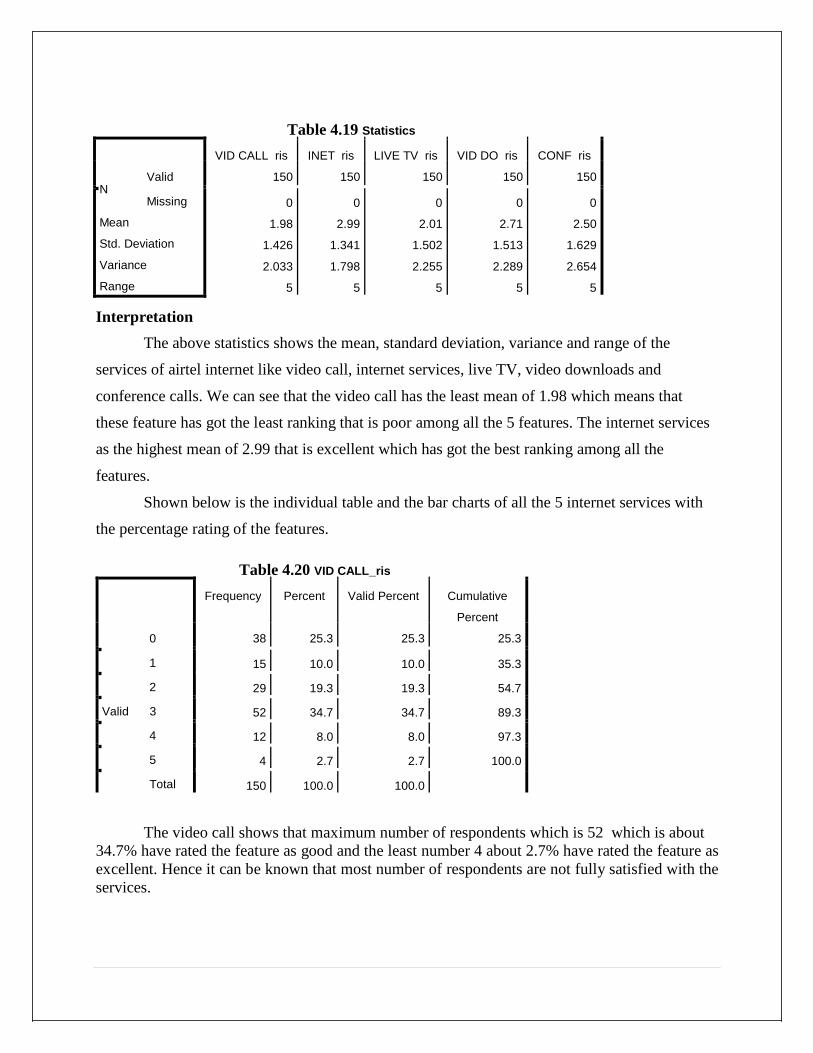
VID CALL_ris
INET_ris
LIVE TV_ris
VID DO_ris
CONF_ris
Valid N
Missing
Mean
Std. Deviation
Variance
Range
150
150
150
150
150
0
1.98
1.426
2.033
5
0
2.99
1.341
1.798
5
0
2.01
1.502
2.255
5
0
2.71
1.513
2.289
5
0
2.50
1.629
2.654
5
Frequency
Percent
Valid Percent
Cumulative
Percent
0
1
2
Valid 3
4
5
Total
38
25.3
25.3
25.3
15
10.0
10.0
35.3
29
19.3
19.3
54.7
52
34.7
34.7
89.3
12
8.0
8.0
97.3
4
2.7
2.7
100.0
150
100.0
100.0
Table 4.19 Statistics
Interpretation
The above statistics shows the mean, standard deviation, variance and range of the
services of airtel internet like video call, internet services, live TV, video downloads and
conference calls. We can see that the video call has the least mean of 1.98 which means that
these feature has got the least ranking that is poor among all the 5 features. The internet services
as the highest mean of 2.99 that is excellent which has got the best ranking among all the
features.
Shown below is the individual table and the bar charts of all the 5 internet services with
the percentage rating of the features.
Table 4.20 VID CALL_ris
The video call shows that maximum number of respondents which is 52 which is about
34.7% have rated the feature as good and the least number 4 about 2.7% have rated the feature as
excellent. Hence it can be known that most number of respondents are not fully satisfied with the
services.
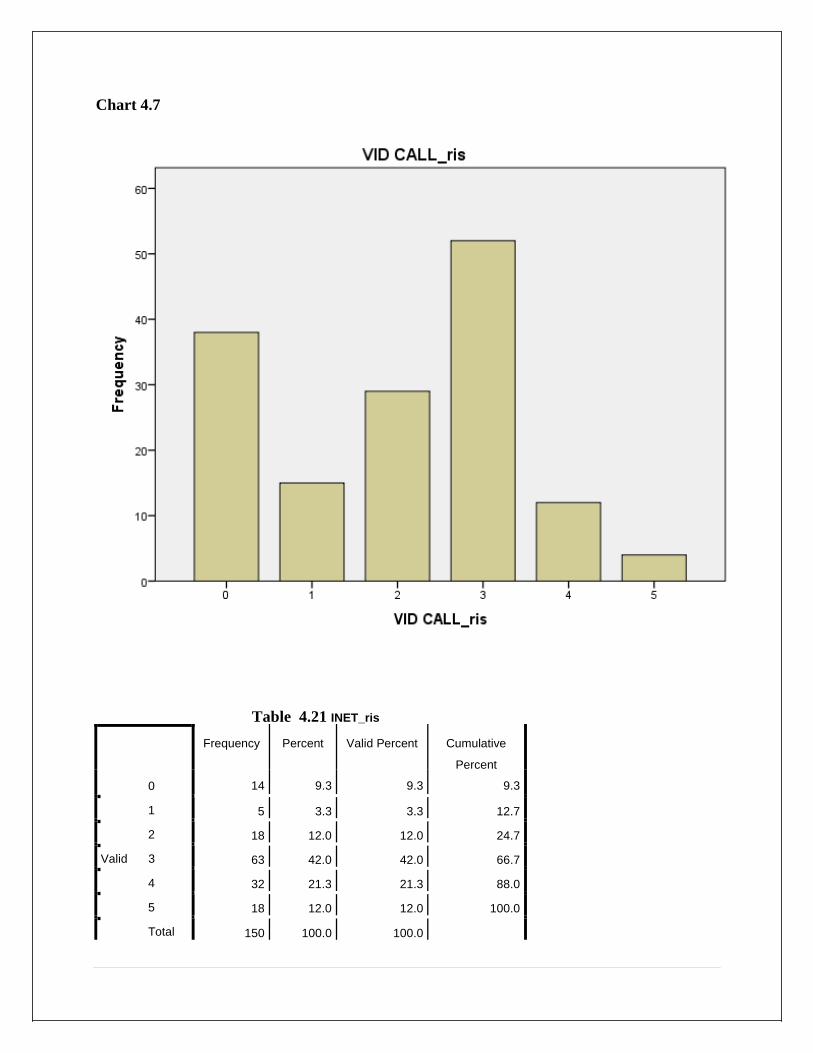
Frequency
Percent
Valid Percent
Cumulative
Percent
0
1
2
Valid 3
4
5
Total
14
9.3
9.3
9.3
5
3.3
3.3
12.7
18
12.0
12.0
24.7
63
42.0
42.0
66.7
32
21.3
21.3
88.0
18
12.0
12.0
100.0
150
100.0
100.0
Chart 4.7
Table 4.21 INET_ris
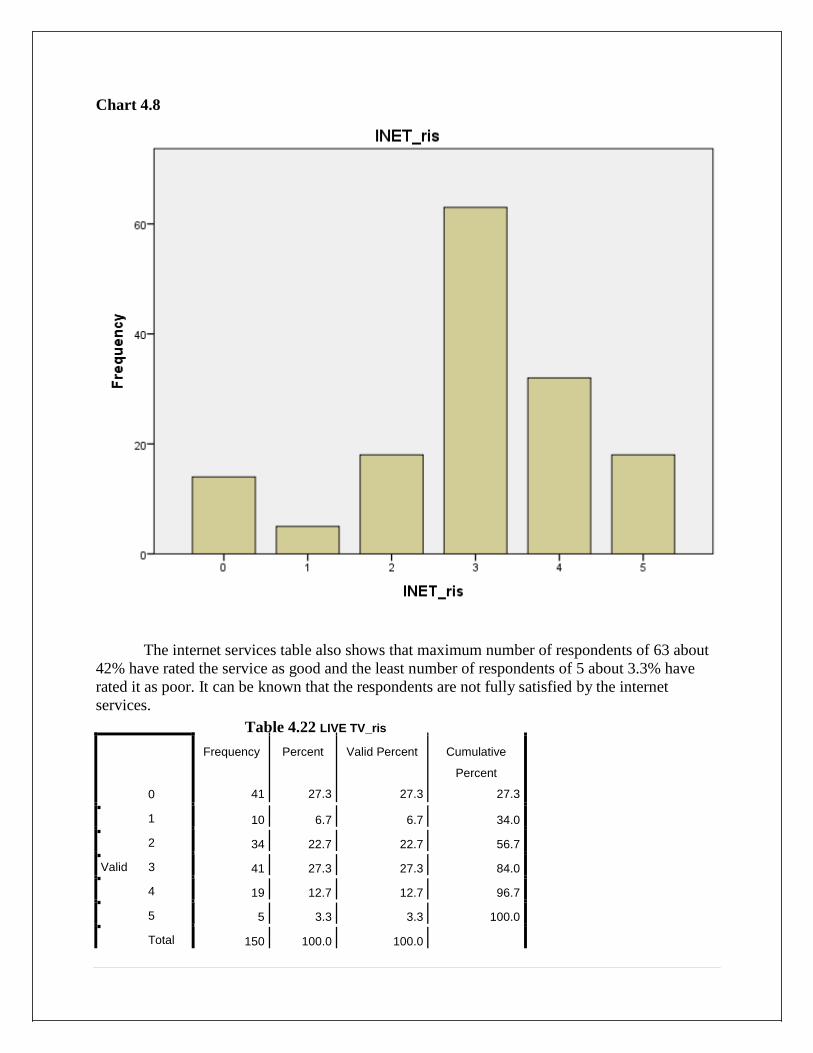
Frequency
Percent
Valid Percent
Cumulative
Percent
0
1
2
Valid 3
4
5
Total
41
27.3
27.3
27.3
10
6.7
6.7
34.0
34
22.7
22.7
56.7
41
27.3
27.3
84.0
19
12.7
12.7
96.7
5
3.3
3.3
100.0
150
100.0
100.0
Chart 4.8
The internet services table also shows that maximum number of respondents of 63 about
42% have rated the service as good and the least number of respondents of 5 about 3.3% have
rated it as poor. It can be known that the respondents are not fully satisfied by the internet
services.
Table 4.22 LIVE TV_ris

Frequency
Percent
Valid Percent
Cumulative
Percent
0
1
2
Valid 3
4
5
Total
23
15.3
15.3
15.3
8
5.3
5.3
20.7
21
14.0
14.0
34.7
52
34.7
34.7
69.3
30
20.0
20.0
89.3
16
10.7
10.7
100.0
150
100.0
100.0
Chart 4.9
The live TV table shows that a mix of the ratings between poor and not applicable, about 27.3%.
Which means that 41 respondents have not used these services and 41 have rated it as good. The
least number of 5 respondents have rated it as excellent.
Table 4.23 VID DO_ris

Frequency
Percent
Valid Percent
Cumulative
Percent
0
1
2
Valid 3
4
5
Total
33
22.0
22.0
22.0
7
4.7
4.7
26.7
20
13.3
13.3
40.0
47
31.3
31.3
71.3
28
18.7
18.7
90.0
15
10.0
10.0
100.0
150
100.0
100.0
Chart 4.10
Video download is not used regularly by all the respondents has maximum number of
respondents 52 about 34.7% have rated it as good and 8 respondents about 5.3% have rated it has
poor.
Table 4.24 CONF_ris

Chart 4.11
The conference calls are used in cases where the respondents want to talk with more
number of people at the same time. Among these we can see that about 47 respondents which
forms 31.3% have rated it has good and 7 respondents about 4.7% have rated it as poor. Hence
among the users of these feature we can see that the respondents need still more facilities to be
added.
17. Rating of 4G services
Table 4.25
Services High video
stream
Download
movies
Upload
photos
Connect
devices
1 6 9 5 8
2 11 15 19 12
3 16 15 16 16
4 22 12 9 11
5 1 4 6 8
Not applicable 94 95 95 95
Total 150

Table 4.26 4G services report
Services High video
stream
Download
movies
Upload
photos
Connect
devices
0 62.7% 63.3% 63.3% 63.3%
1 4% 6% 3.3% 5.3%
2 7.3% 10% 12.7% 8%
3 10.7% 10% 10.7% 10.7%
4 14.7% 8% 6% 7.3%
5 0.7% 2.7% 4% 5.3%
100%
Interpretation
The 4G services which was newly introduced by airtel and it had the advanced
features like high video stream, download 10 movies in 30 minutes, upload photos in just
5minutes and connect multiple devices. The above table is prepared is to know which feature is
more useful to the respondents and the least which does not have any usage.
We can see that most of the respondents are not using the 4G services as they are
not aware of these facility due to lack of promotions. It is seen that nearly 63% of the
respondents have not given any rating for all the above features of 4G. Among all the
respondents about 0.7% and 2.7% have given excellent for high video stream followed by
download of movies. About 3.3% & 5.3% of them have given poor rating for photo upload and
multiple device connection.
18. Future service providers
Table 4.27
Service providers Number of respondents
Vodafone 62
Aircel 24
Docomo 43
Idea 15
Reliance 6
Total 150

Frequency
Percent
Valid Percent
Cumulative
Percent
Vodafone
Aircel
Docomo Valid
Idea
Reliance
Total
62
41.3
41.3
41.3
24
16.0
16.0
57.3
43
28.7
28.7
86.0
15
10.0
10.0
96.0
6
4.0
4.0
100.0
150
100.0
100.0
Table 4.28 service providers
Interpretation
The service providers table shows the future telecom services that the consumers are
willing to shift from the existing airtel customer. Vodafone is more preferred by the respondents
which is about 62 forming of 57.3% in the overall percentage. These services is preferred due to
the tariff plans and the network availability is also good. Then it is followed by docomo, aircel,
idea and reliance. Then it can be known that people are more satisfied with the Vodafone
services than any other service providers.
19. Satisfactory level of services
Table 4.29
Services Credit
facility
Service
provider
3G
services
4G
services
Overall
performance
Highly Satisfactory (1) 26 23 25 13 29
Satisfactory (2) 78 72 77 59 80
Moderately Satisfied(3) 24 40 24 21 23
Indifferent (4) 13 12 15 37 10
Dissatisfactory (5) 4 1 5 6 5
Highly Dissatisfactory (6) 2 2 2 4 1
Moderately Dissatisfactory
(7)
2 - 2 10 2
Not applicable(8) 1 - - -
Total 150
In telecom industry, new schemes were introduced recently in the view of attracting and
retaining customers. In the series of various facilities ―Credit Facility‖ is the new and
contemporary service introduced only by ―Airtel‖ for the first time with the high credit limit.

OVERALL_sat
Total
1
2
3
4
5
6
7
0
1
2
3 CRE_sat
4
5
6
7
Total
0
1
0
0
0
0
0
1
8
10
2
3
2
0
1
26
17
47
6
5
1
1
1
78
3
11
8
0
2
0
0
24
1
8
2
2
0
0
0
13
0
2
2
0
0
0
0
4
0
1
1
0
0
0
0
2
0
29
0
80
2
23
0
10
0
5
0
1
0
2
2
150
Value
Df Asymp. Sig. (2-
sided)
Pearson Chi-Square
Likelihood Ratio
Linear-by-Linear Association
N of Valid Cases
44.540a
42.495
.864
150
42
42
1
.365
.450
.353
Table 4.30 credit facility
Investigators wanted to know the importance of credit facility towards satisfaction of
customers. The table shows most of the employees around 78 out of 150 fall under satisfied
category. This supports the assertion of the researcher. To validate this, chi Square test was
applied with the Hypothesis ―Satisfaction towards Airtel is not based on Credit Facility‖. The
result is displayed under the heading Table 4.31
Table 4.31 : Chi-Square Tests
a. 48 cells (85.7%) have expected count less than 5. The minimum
expected count is .01.
As the significant value of chi-square test is more than the level of significance, underlined
hypothesis is rejected. This leads to conclude that to have overall Satisfaction Credit facility is
one of the factor. That is, Credit facility plays major role in determination of customer
satisfaction.

OVERALL_sat
Total
1
2
3
4
5
6
7
1
2
3 SER_sat
4
5
6
Total
11
7
3
1
1
0
0
23
12
52
3
4
1
0
0
72
6
14
13
4
1
1
1
40
0
7
2
1
1
0
1
12
0
0
1
0
0
0
0
1
0
29
0
80
1
23
0
10
1
5
0
1
0
2
2
150
Value
Df Asymp. Sig. (2-
sided)
Pearson Chi-Square
Likelihood Ratio
Linear-by-Linear Association
N of Valid Cases
69.426a
58.045
19.685
150
30
30
1
.000
.002
.000
Table 4.32
The service provider is compared with the overall performance in order to know. Here also we
can see that maximum number of them are satisfied with the services. These facility helps in the faster
speed of internet. About 72 out of 150 are satisfied by Airtel Service provider. To validate this, chi
Square test was applied with the Hypothesis ―Satisfaction towards Airtel is not based on service
provider.‖. The result is displayed under the heading Table 4.33
Table 4.33 Chi-Square Tests
a. 34 cells (81.0%) have expected count less than 5. The minimum
expected count is .01.
As the significance value of chi square is lesser than the level of significance, the hypothesis has
been selected in this case. It can be known the service provider does not play much significant role in
order to make the service fully satisfied.

Value
Df Asymp. Sig. (2-
sided)
Pearson Chi-Square
Likelihood Ratio
Linear-by-Linear Association
N of Valid Cases
96.414a
77.232
15.804
150
36
36
1
.000
.000
.000
Table 4.34
OVERALL_sat
Total
1
2
3
4
5
6
7
1
2
3
3G _sat 4
5
6
7
Total
13
4
8
0
0
0
0
25
10
55
5
5
1
0
1
77
4
13
4
2
1
0
0
24
0
7
3
3
1
1
0
15
1
0
2
0
1
0
1
5
0
1
0
0
1
0
0
2
1
29
0
80
1
23
0
10
0
5
0
1
0
2
2
150
While investigating the importance of 3G services towards satisfaction of customers.
The table shows that 77 out of 150 are satisfied by these facility. To validate this, chi Square test was
applied with the Hypothesis ―Satisfaction towards Airtel is not based on 3G services‖. The result is
displayed under the heading Table No: 4.35
Table 4.35 Chi-Square Tests
a. 42 cells (85.7%) have expected count less than 5. The minimum
expected count is .01.
As the significance value of chi square is lesser than the level of significance, the hypothesis has
been selected in this case too. It can be known the 3G service play a small role in order to make the
service fully satisfied.

OVERALL_sat
Total
1
2
3
4
5
6
7
1
2
3
4G _sat 4
5
6
7
Total
10
2
0
0
1
0
0
13
12
44
2
1
0
0
0
59
3
11
6
0
1
0
0
21
3
19
6
7
2
0
0
37
0
1
2
1
1
1
0
6
1
1
0
0
0
0
2
4
0
29
2
80
7
23
1
10
0
5
0
1
0
2
10
150
Value
Df Asymp. Sig. (2-
sided)
Pearson Chi-Square
Likelihood Ratio
Linear-by-Linear Association
N of Valid Cases
190.282a
106.700
33.555
150
36
36
1
.000
.000
.000
Table 4.36
The 4G services which was introduced by airtel recently in India as being the 1st
telecom company to provide these services. The table shows that 59 out of 150 are satisfied by these
services. As major number of respondents are not aware of these facility being provided and they find it
not be much useful and the rates to be bit higher. To validate this, chi Square test was applied with the
Hypothesis ―Satisfaction towards Airtel is not based 4G services‖. The result is displayed under the
heading Table 4.37
Table 4.37 Chi-Square Tests
a. 40 cells (81.6%) have expected count less than 5. The minimum
expected count is .03.
As the significance value of chi square is lesser than the level of significance, the hypothesis has
been selected in this case too. It can be known the 4G service play a small role in order to make the
service fully satisfied.

Chapter
5

5.1 Findings
o The survey questionnaire consists of 150 respondents in Bangalore at some of the
selected outlets.
o From survey is was known that most of the decision makers are male compared to that of
female. It consisted of 114 male and 36 female.
o The age group consists of all from the age of 21 to 60 in which most of them are in the
age group of 21-30 and the least are in 41-50 followed by 51-60.
o The next factor considered in the income level of the respondent which is divided into
upto 25000 and from 25000 to above 200000. It is known that income level is not
considered to choose the airtel services as it‘s just a part of the monthly income levels of
the respondents.
o The education level of the respondents is also taken into consideration which shows that
most of the consumers have the education qualifications upto SSLC followed by
graduation and PUC.
o Among the 150 there where both married and unmarried people in which about 89 where
unmarried and the remaining where married.
o The next finding was related to the source of information the consumers get influenced it
order to choose the preferred mobile network. The consumers has been using various
mediums like media advertisements and print advertisements.
o The friends, relatives and family members also act as a source of information for the
consumers. Among all the media advertisements, friends and relatives play a greater role
in this situation.
o The airtel services have mobile payments options like postpaid and pre-paid among
which the pre-paid connections is being used by most of the consumers.
o The consumers are mostly using 3G connections due to the usage of internet connections
which is preferred by more number of consumers. The CDMA connection was the first
mobile network to be introduced but it‘s used by less number of consumers.
o Airtel was the 1st to start the 4G connections in India with more advanced features but it
was not well advertised due to which only a few number of consumers are using this
service.
o The consumers use lifetime services for their mobile connections due to the validity that
it provides.
o More number of Airtel consumers are using their services from more than 5 years and
still they have been facing problems in their network sometimes. Infact of this failure in
network services they are willing to suggest the Airtel connections to other consumers
also.
o The consumers where given the opportunity to choose their future mobile network among
Vodafone, Aircel, Docomo, Idea, and Reliance. In this more number of consumers
wanted to shift to Vodafone due to the services being provided by them and less number
of consumers would change to Reliance.
85 | P a g e
o The consumers where asked for the reason for choosing the Airtel connection and they
results was the Brand Name of Airtel which acts as a main reason to those these
connections. It was then followed by the Value Added Services, low price and the least
preferred feature is the credit facility and the tariff plans.
o The consumers said that they need some improvements to be made in various services
like the data usage, network availability, tariff plans, customers and retailers services.
o The rating of various internet services says that more number of customers are not using
these services
o When checked the various services, more number of consumers say that the video calls,
internet services, live TV, video downloads and conference calls are rated good and it
needs more improvements to be made.
o More consumers want changes to be made in the internet services and increase the speed
of the broadband.
o The various advancements in the 4G services is not being used by the consumers and
they are not much aware of the availability of such services. So due to this the company
has to give more information about this to them and make them use it.
o The satisfaction levels of consumers was considered to know the more preferred services
to the consumers. The credit facility is just satisfiable by the consumers even though they
have more amount of credit given to them.
o Only about 50% of the consumers are satisfied with the service provider and they want to
change to other network.
o The 3G & 4G services are just at the satisfaction level, and it needs more changes to be
made in order to increase the speed of internet.
o Finally the overall performance of the airtel services are not able to fully satisfy the
consumers and they need more improvements.
5.2 SUGGESTION/RECOMMENDATIONS
SUGGESTION
The main objective of every analysis is to find out whether the consumers are
satisfied with the services provided. Following are some of the suggestions provided for the
further improvements in the products and services:-
Regarding the internet connections the consumers prefer that the speed of the internet
should be more speeder compared to landline services and other service providers
The network service is well served in many areas of the city but still it‘s not able to get
network at sometimes and this need to be solved as soon as possible in order to attract
more number of consumers.
The consumers said to improve to customer care services and the response given by the
customer care employee should be improved.
The customer support must be given proper training to the executives to treat the
customer with courtesy.
86 | P a g e

Introduction of more services regarding the call rates and internet pack and the reduction
in the prices of these.
Educating the consumers about the usage and the improvements done in the latest 4G
services
RECOMMENDATIONS
To provide full fledge information to customers, who make calls to the customer support.
Better to improve network coverage to avoid sudden signal droppings.
Review the existing offers packages and inform consumers about the updating of
services.
5.3 CONCLUSION
The project work contained of visiting the Airtel outlets which helped to interact with the
consumers directly and know the thoughts and views about the services being offered by Airtel.
And it also helped to know the further suggestions that can be made in order to get more number
of customers. It also helped to know the marketing and sales team work by which they are able
to get more and more customers. The main motive of them was customer satisfaction which also
helps in the growth of the company.
To conclude I would say that I got a good opportunity to know about the company and
the consumers preference and their problems faced. Even though the sample size is 150 it helped
to ascertain the Consumer Perception to some extent. These project also helped me to know how
a research is conducted and the difficulties that is being to complete the project. It also helped to
know more about the statistical tools.
87 | P a g e

5.4 BIBLOGRAPHY
WEBSITE
www.wikipedia.com
http://www.consumer perction on airtel services
www.airtel.co.in
www.google.com
Slideshre
Management Paradise
Articles
Consumer perception on airtel
Articles on consumer perception
PROJECTS & BOOKS
Consumer Behaviour by Dr. M. Prasanna Kr. and N. Kiran Kumar published by
Thakur publishers, Bangalore
Services Marketing by Dr. K. S. Ramakrishna and Arun Chandra Mudhol
published by Thakur publishers, Bangalore
BBA project submitted Ms. Rasna Pathak GNA Institute of Management &
Technology (Affiliated from PTU)
Consumer Perception Theory by Chris Blank, Demand Media
Stages of Perception in Marketing by Vanessa Cross, Demand Media
88 | P a g e

5.5 ANNEXURE
QUESTIONNAIRE
I.Socio-Demographics
1. Name:
2. Gender : Male Female
3. Age (in yrs.)
21 - 30 31-40 41-50 51-60 Above 60 Years
4. Education qualification
Up to SSLC PUC Graduation and above
5. Occupation
Business Service Professional Self-employed
Student House wife
6. Family monthly income
Up to 25,000 25,000- 50,000 50,000-1, 00,000 1, 00,000 – 2, 00,000
Above 2, 00,000
7. Marital status
Married Unmarried
8. Kindly indicate your source of information about Airtel Services
Media Advertisements Print Advertisements Friends/ Relatives
Family Members Other
II. Mobile Services
9. What type of payment mobile connection are you using
Postpaid Pre-paid
10. Which kind of mobile network do you use?
CDMA 2G 3G 4G

11. Which scheme are you using?
Life time Normal monthly plan Students pack
All India pay per second plan Others
12. For how long have you been associated with airtel
<1 year 2 years 3 years 4 years More than 5 years
13. Have you ever faced problems related to Airtel networks?
Always Sometimes Never
14. Would you suggest your friends/family to go for Airtel services? Why?
Yes No
III. Value Added Services
15. Rank the following factors from 1 to 10
VAS
Brand Name
Low Price
Quality service
Network Availability
Tariff plans
Retailers services
Customer services
Credit facility
Data service (3G/4G)
16. Areas of improvements
Highly Required Required Not Required
VAS
Brand Name
Low Price
Quality service
Network Availability
Tariff plans
Retailers services
Customer services
Credit facility
Data service (3G/4G)

17. Rate the following internet services?
Services Poor Average Good Very good Excellent Not applicable
Video calling
Internet services
Live TV streaming
Video downloads
Conference calls
18. Rate the following 4G services on a scale of 1 to 5 if used the services?
High video streaming
Download 10 movies in 30 minutes
Upload photos in just 5 minutes
Connect multiple devices
Not Applicable
19. Rate of satisfactory level on the following services?
Highly Satisfactory (HS) Satisfactory (S) Moderately satisfied (MS) Indifferent (I)
Dissatisfactory (DS) Highly Dissatisfactory (HD) Moderately Dissatisfactory (MD)
Services HS S MS I DS HD MD
Credit facility
Service provider
3G Services
4G Services
Overall performance
20. In future if you are given chance which product/service would you prefer? Why?
Vodafone Aircel Docomo Idea Reliance