Customer Perception On Waiting Time In Super Markets
11
INTERNATIONAL JOURNAL OF SCIENTIFIC & TECHNOLOGY RESEARCH VOLUME 8, ISSUE 10, OCTOBER 2019 ISSN 2277-8616 2649 IJSTR©2019 www.ijstr.org Customer Perception On Waiting Time In Super Markets – An Exploratory Study Using One Way Anova Dr. V. Rengarajan, Dr. V. Vijay Anand, Dr. C. Vijayabanu & S. Thiyagarajan ABSTRACT: Management of consumer waiting experiences is critical for practitioners in that unpleasant waiting experiences may result in negative service evaluations. The intention of this study is to scrutinize factors influencing common man’s insight of waiting time in super markets in Chennai. Time is widely considered to be a scarce resource and a strong competitive device. Yet, consumers spend a tremendous amount of time waiting. Waiting time makes the consumers to get irritated. Consumers are ready to spend more time in shopping but they are not ready to spend time for waiting. However, if managers understand how customers perceive waiting time and how waiting time influences customer satisfaction and evaluation of service quality, they will be better able to control costs and improve customer satisfaction. Consequently, service managers should find ways to effectively manage waiting times. More specifically, the impact of gender, age, income, employment details, qualification, type of family, number of family members, on perception of waiting time, were examined. In addition to that, the relationship between perception of waiting time and factors such as parking slots, counter queues, weighing queues, responsiveness and grade of supermarket were investigated. 215 samples have been chosen by adopting stratified random sampling using statistical tools as such as descriptive statistics, correlation, regression, ANOVA for data analysis. As studied, the most of the customers felt depressed of waiting at delivery spot and billing. Finally, the results offered the suggestions to service managers on how to better manage the perception of the people on waiting time, and, consequently, influence perceived service quality. It is also suggested that the perspectives of the customers could be changed providing the resources that could minimise the time of waiting of the customers during the consumption. This will also increase the sales revenue as well as profitability in near future. Keywords: Waiting time, Super market, Service quality. ———————————————————— 1. INTRODUCTION The act of waiting has an excessively high impact on customers. In today’s environment, consumers are becoming more demanding than ever. As consumers work more and have even less leisure and spare time, they place a greater value on their free time. As a result, short waits seem longer to them than ever before. The lesson for service managers is that they have to respond to this dramatic change in consumers’ demands quickly if they wish to remain competitive or they will risk losing customers to potential competitors. Since waiting may imply significant adverse effects, firms should find appropriate ways to resolve it. 2. STATEMENT OF THE PROBLEM Every organization that interacts with customers deals with the issue of queues. In their everyday lives, customers wait for services in a variety of settings. The demand for services is rarely smoothed over time. Consequently, waiting becomes a common phenomenon in services. Ample evidence has shown that waiting for service has generally negative effects on customer satisfaction and service evaluations. This study focuses on the latter approach and implies that the perception of waiting often is more important that the actual waiting, suggesting that managers should find innovative ways to reduce it. 3. OBJECTIVES OF THE STUDY The following are the objectives of the present study based on the problem statement: It is to find out the factors that force the customers to wait in the super market and offer solutions to those problems. It is also to offer suggestions regarding those problems which influence the waiting time on which the supermarkets can improve to serve their customers. 4. SCOPE OF THE STUDY This study is conducted in Chennai which is measured principally as the population of the research work. 5. LIMITATIONS OF THE STUDY The present study was done to people in Chennai those who do shopping in major supermarkets like SPENCER'S, BIG BAZAAR, D-MART, SPAR of 215 trial respondents using simple random sampling technique. This work depends mostly on primary data. 6. PERIOD OF THE STUDY A questionnaire is given to the customers coming to the supermarkets to collect primary data for a period of 10 days. 7. METHODOLOGY A pilot study was conducted to grasp the variables implicated in the study. The study explores diverse factors such parking slots, counter queues, weighing queues, responsiveness and grade of supermarket. The questionnaire has six sections. The first part of the questionnaire includes demographic variables like Age, Gender, Income, employment details, qualification, type of family, number of family members, and the main reason for shopping and often visit to supermarkets. The second part deals with the questions related to parking slots factors like sufficient place for parking, comfortable to park, long time in _____________ Faculty Members, School of Management, SASTRA Deemed University, Thanjavur , TN – 613 401, India – [email protected]
-
Upload
khangminh22 -
Category
Documents
-
view
2 -
download
0
Transcript of Customer Perception On Waiting Time In Super Markets

INTERNATIONAL JOURNAL OF SCIENTIFIC & TECHNOLOGY RESEARCH VOLUME 8, ISSUE 10, OCTOBER 2019 ISSN 2277-8616
2649 IJSTR©2019 www.ijstr.org
Customer Perception On Waiting Time In Super Markets – An Exploratory Study Using One Way
Anova
Dr. V. Rengarajan, Dr. V. Vijay Anand, Dr. C. Vijayabanu & S. Thiyagarajan
ABSTRACT: Management of consumer waiting experiences is critical for practitioners in that unpleasant waiting experiences may result in negative service evaluations. The intention of this study is to scrutinize factors influencing common man’s insight of waiting time in super markets in Chennai. Time is widely considered to be a scarce resource and a strong competitive device. Yet, consumers spend a tremendous amount of time waiting. Waiting time makes the consumers to get irritated. Consumers are ready to spend more time in shopping but they are not ready to spend time for waiting. However, if managers understand how customers perceive waiting time and how waiting time influences customer satisfaction and evaluation of service quality, they will be better able to control costs and improve customer satisfaction. Consequently, service managers should find ways to effectively manage waiting times. More specifically, the impact of gender, age, income, employment details, qualification, type of family, number of family members, on perception of waiting time, were examined. In addition to that, the relationship between perception of waiting time and factors such as parking slots, counter queues, weighing queues, responsiveness and grade of supermarket were investigated. 215 samples have been chosen by adopting stratified random sampling using statistical tools as such as descriptive statistics, correlation, regression, ANOVA for data analysis. As studied, the most of the customers felt depressed of waiting at delivery spot and billing. Finally, the results offered the suggestions to service managers on how to better manage the perception of the people on waiting time, and, consequently, influence perceived service quality. It is also suggested that the perspectives of the customers could be changed providing the resources that could minimise the time of waiting of the customers during the consumption. This will also increase the sales revenue as well as profitability in near future. Keywords: Waiting time, Super market, Service quality.
————————————————————
1. INTRODUCTION The act of waiting has an excessively high impact on customers. In today’s environment, consumers are becoming more demanding than ever. As consumers work more and have even less leisure and spare time, they place a greater value on their free time. As a result, short waits seem longer to them than ever before. The lesson for service managers is that they have to respond to this dramatic change in consumers’ demands quickly if they wish to remain competitive or they will risk losing customers to potential competitors. Since waiting may imply significant adverse effects, firms should find appropriate ways to resolve it.
2. STATEMENT OF THE PROBLEM Every organization that interacts with customers deals with the issue of queues. In their everyday lives, customers wait for services in a variety of settings. The demand for services is rarely smoothed over time. Consequently, waiting becomes a common phenomenon in services. Ample evidence has shown that waiting for service has generally negative effects on customer satisfaction and service evaluations. This study focuses on the latter approach and implies that the perception of waiting often is more important that the actual waiting, suggesting that managers should find innovative ways to reduce it.
3. OBJECTIVES OF THE STUDY The following are the objectives of the present study based on the problem statement: It is to find out the factors that force the customers to wait in the super market and offer solutions to those problems. It is also to offer suggestions regarding those problems which influence the waiting time on which the supermarkets can improve to serve their customers.
4. SCOPE OF THE STUDY This study is conducted in Chennai which is measured principally as the population of the research work.
5. LIMITATIONS OF THE STUDY The present study was done to people in Chennai those who do shopping in major supermarkets like SPENCER'S, BIG BAZAAR, D-MART, SPAR of 215 trial respondents using simple random sampling technique. This work depends mostly on primary data.
6. PERIOD OF THE STUDY A questionnaire is given to the customers coming to the supermarkets to collect primary data for a period of 10 days.
7. METHODOLOGY A pilot study was conducted to grasp the variables implicated in the study. The study explores diverse factors such parking slots, counter queues, weighing queues, responsiveness and grade of supermarket. The questionnaire has six sections. The first part of the questionnaire includes demographic variables like Age, Gender, Income, employment details, qualification, type of family, number of family members, and the main reason for shopping and often visit to supermarkets. The second part deals with the questions related to parking slots factors like sufficient place for parking, comfortable to park, long time in
_____________ Faculty Members, School of Management, SASTRA Deemed
University, Thanjavur , TN – 613 401, India – [email protected]

INTERNATIONAL JOURNAL OF SCIENTIFIC & TECHNOLOGY RESEARCH VOLUME 8, ISSUE 10, OCTOBER 2019 ISSN 2277-8616
2650 IJSTR©2019 www.ijstr.org
parking, additional parking slots, and separate ways for entry and exit. Third part includes counter queues factors like long queue at the counters, irritation to standing in queues, spending more time for shopping, mentality to spend more time for shopping rather to stand in queues, more counters during weekends and peak hours, advanced system for billing. Fourth section is related with weighing queues factors like weighing machines must be available near the counters, more weighing counters, weighing counters should be near the billing counters, Improper weighing machine leads to stand in long queues, staffing error will lead to long queues. Fifth section relates to responsiveness which consists of Staffs in the super market
will respond properly, If there is any damage in the products after billing it will be replaced, Staffs will guide to various sections, Staffs will respond kindly, Staffs will suggest new products to the customers. Last section deals with grade of supermarket the ambience will attract more people, supermarkets will have all range of products, supermarkets are better than the department stores and the kirana stores, supermarkets will have more loyal customers. Respondents were interviewed to point out their extent of concurrence with every item on five point scale.
8. CONCEPTUAL FRAMEWORK
RESEARCH DESIGN Descriptive research design was adopted in the research work. Responses were collected through questionnaires from the customers of the above mentioned supermarkets. Research instrument used The primary data is collected by means of questionnaire which is distributed to the customers those who are coming for shopping in the supermarket.
SAMPLING METHOD This survey is based on simple random sampling method.
SOURCES OF DATA The source of data mainly for this study is primary data. The primary data is collected thorugh questionnaire.
DATA COLLECTION METHOD: Primary data resourcesThe primary data is collected from the customers those who are coming for shopping in the supermarkets by means of questionnaire. Secondary data resourcesSecondary data refers to sourcing of already processed information. Data is collected from journals, Pro-Quest, Google, and from company website. This study is done by using both the primary data as well the secondary data.
STATISTICAL ANALYSIS The researcher has used SPSS package to analyse the data using frequency analysis, one way ANOVA, and Regression and Chi-square. BROAD TESTING FOR HYPOTHESIS: Null hypothesis: There is no significant relationship between the perception of customers and the waiting time in supermarkets. The following are the extracts off the research results of the researchers previously undertaken the same study and also thee variables are taken out of them for the present study. Mehrabian and Russell (1974), have studied that the environmental psychology literature asserts that the physical environment influences the approach-avoidance behavior of individuals within it. Mehrabian and Russell’s S-O-R framework describes mechanisms for how environmental elements influence individuals’ internal states and in turn their approach-avoidance behavior.
Markin, Lillis and Narayana’s disagreement (1976) have studied that the shopper actions responses are either come
up to or averting within a shopping store. This observation is steady with those shopping store designers, planners, and sellers form a transaction space, that creates one’s temper, activates motives, and affects a buyer’s reactions Baker (1987) categorizes ecological apparatus into ambient, intend and societal factors. Ambient factors refer to the unseen basics of a room that is apt to collision the buyer’s hidden things (e.g. temperature, music, and lighting). Design factors are the motivators that symbolize the ocular rudiments of a space that lean to survive more at the vanguard of a buyers’ consciousness (e.g. color, layout, architectural elements). Brady and Cronin (2001) have examined that the societal factors engage the incidence of employees and buyers in the surroundings. An assessment of these two categorization schemas was considered by which found Baker’s typology to be further inclusive and economical in revealing the fundamental scope of service atmosphere. Given that selling involves a great service, constituent this work employ Baker’s typology of green cues. Contentment is not intrinsic in a high-quality service, somewhat it is a individual’s perceptions of a product’s or service's merits as they narrate to the individual. As such, the entire come across must be measured when demanding to know and forecast contentment. Stott (2006) has reviewed the assessment configuration task that is ingrained from risk choices and likelihood evaluation role structures Ozbay 2007, Engelbrecht-Wiggans, Zheng 2016 and Katok 2007 have studied that the quite a few research works in economics and management science creative writing used the feel sorry theory in the bidding background and in the selling situation. Maketal. (2014) considered the tactical actions of customers within the groups with a size of 20. Researchers evaluated the individual subjects' experiential actions by matching their purchase or hold decisions in the primary and subsequent periods to the estimated decisions plagiaristic from market symmetry with completely planned clients. Cesaret and Katok (2015) premeditated the best possible competence allotment difficulty under unsure customer arrivals with diverse buyer segments. They measured the collision of the framing vertical onto vendors' competence allotment decision. It was identified that disallowing decision makers to make frank decisions somewhat than flexible, human subjects do evenly, representing chronological

INTERNATIONAL JOURNAL OF SCIENTIFIC & TECHNOLOGY RESEARCH VOLUME 8, ISSUE 10, OCTOBER 2019 ISSN 2277-8616
2651 IJSTR©2019 www.ijstr.org
character decisions affect their routine harmfully, dissimilarity to the normative theory. Long (2017) did a study that the project managers' behaviours in multi-period setting using best limiting trouble design. Every time, managers can monitor the position of the project or prefer to reassess the position of the project, and as per the details they have, they can stop the project or go on with it until the end of the intended project sphere. Drolet and Luce (2004) engaged cognitive weight to make customers less disinclined to making feature trade-offs, e.g., enlarged cognitive weight can guide to more normative decision behavior, by unsettling buyers’ abilities to think pertinent character purpose information and the pessimistic expressive consequences of building trade-offs. Gneezy (2006), has make use of the Mann-Whitney test to scrutinize data in all three tests in this paper since it is more vigorous with the likely incidence of outliers. This work employed a between-subjects design and had five diverse situations, including two assured situations and three doubtful situations. Gneezy (2006) establish a well-built and extensive occurrence that people from time to time really value an doubtful scrutiny below its most horrible ending, which they called the insecurity result. Rydval (2009) create that participants appreciated a dual draw considerably higher than the draw most horrible ending when they were provided with physical draw (instead of verbal draws) and whole information about the commodities they were to appraise.
Voorhees 2009 has identified the mental assessment of coming up is imitative from buyers’ evaluations beached in their touching responses to coming up for check. The narrative has set up that coming up lowered service contentment and that the pre-process coming up stage was more determinants in service assessment than the in procedure and post-process coming up stages. Bougie et al., 2003; Zeelenberg & Pieters, 2004 have studied that the Recent social psychology and consumer research has suggested that specific emotions elicit different action tendencies toward and behavioral consequences for a service organization. For example, the negative emotion of anger can lead to violent or aggressive behavioral tendencies. At best, angry customers will not return to an offending service organization; at worst, they might consider harming people and/or institutions. Bonifield & Cole, 2007 have studied that the Disconfirmation increases the negative effect of goal attainment, and consumers retrospectively think about their forgone alternative choices. Consumers’ spontaneous counterfactual thinking about ―what might have been‖ might provoke intense regret during the in-process waiting stage. Gross & Thompson (2007) proposed five emotion regulation strategies that occur sequentially during the process of emotion generation: (1) situation selection, (2) situation modification, (3) attention deployment, (4) cognitive change (reappraisal), and (5) suppression. As described in Figure 2.1, the first four strategies are considered ―antecedent focused emotion regulation‖; they take place before appraisals give rise to full emotion response tendencies. Gross and Thompson (2007)
Consumer perception
on waiting time
Demographic variables
Age
Gender
Income
Employment details
Qualification
Type of family
Number of family members
The main reason for shopping
Often visit to supermarkets
Parking slots Counter queues Weighing
queues
Responsiveness Grade of
supermarkets
INTERNATIONAL JOURNAL OF SCIENTIFIC & TECHNOLOGY RESEARCH VOLUME 8, ISSUE 10, OCTOBER 2019 ISSN 2277-8616
2652 IJSTR©2019 www.ijstr.org
proposed distraction as a major attentional strategy in emotion regulation. Consumers systematically employ attentional cues within a situation based on the emotions triggered by stimulus events. For example, when consumers are confronted with adverse stimulating events, such as waiting for service, they consciously or unconsciously give attention to distractions that can help block their negative emotional cues. Gross & Thompson, 2007 studied In contrast to the suppression strategy, individuals who spontaneously regulate their emotions through reappraisal report more positive emotions, fewer negative emotions, and greater psychological well-being than others. Williams (2009) proposed the phenomenon of ―nonconscious reappraisal‖ toward a goal-attainment situation, which suggests that nonconscious reappraisal occurs when one pursues successful focal goal attainment. Egloff (2006) found that during a stressful speech individuals tend to motivate change in the perception of the speech experience. Johanson & Woods, 2008; Kim, 2008; Rafaeli & Sutton, 1987 have studied that, in the service industry, the concept of suppression through hiding true feelings or emotions has attracted scholarly interest. Employees in service sectors frequently interact with consumers while working in a service organization; interaction between the service provider and consumers is, in fact, a core element of the service experience. Baumeister 2005 studied that transversely both psychology and marketing research, self-worth is measured a significant make to recognize. It has been taken to as the ―Holy Grail: a mental mannerism that would pacify most of them and society’s woes‖. Baumeister 2013 studied that during conditions of how self-worth is distinct, it is possibly on the whole usually, theoretically as a person’s approach toward their nature. Self-worth is ―how persons assess themselves‖. Bandura 2012 studied, on the opposite, elevated self-efficacy persons obtain on challenges, set superior targets, and are more probable to attach to those targets. Norman, 2008 premeditated the plan ideology for coming up position that he believes give the most efficient queuing for winning big business. The ideologies are alike to Maister’s only Norman includes how the recollection of an event is more vital than the practice because ―your prospect behaviour will be forced by your recollections‖. Norman, 2008 considered the prospect actions of the clients will be forced by their recollections. ―Purchaser potential, emotions and reminiscences can be managed in the course of the submission of the suitable design ideology. In addition, these ideology do not only be relevant to how you delight your clients: They apply to workers just as much. Waits can be managed well: it’s all a matter of plan‖. Bigne 2005 study the client happiness grades in readiness to compensate more and more purchaser loyalty. Factors that pressure happiness were distinct as optimistic provocation, happiness, and optimistic disconfirmation. Bigne 2005 suggested the When visitors are aroused and delighted; they will disburse more and have devotion to the business. Crawley and Pring (2000) undertook an experiment where people of various ages were asked to recall the amount of time that passed since major public events. They reported that older people believed that events happened earlier than they actually did. Oprisan and Buhusi (2011) showed pharmacological manipulations affected the internal clock and memory process in the
perception of time. Both studies showed that drugs that stimulate dopamine production in the brain appeared to change the speed of the pacemaker of the internal clock. Brown and Boltz (2002) found that the role of attention and mental workload 7 has an effect on subjective time perception. Sackett, Meyvis, Nelson, Converse and Sackett (2010) Studied that people perceive that time has passed unexpectedly quickly when they rate tasks as more engaging, noises as less irritating, and songs as more enjoyable. Geoffard and Luchini (2010) reported that two different types of emotions affect time perception differently8. A positive emotion such as relief or joy is associated with time expansion (time seems to pass slowly). In contrast, a negative emotion such as grief or frustration induces time contraction (time seems to fly by). Bilgin and LeBoeuf (2010) suggested the individuals perceive intervals ending with losses as shorter than equivalent intervals ending with gains.
ANALYSIS AND INTERPRETATION
TABLE 1 DEMOGRAPHIC PROFILE OF THE RESPONDENTS
Variables Frequency Percentage
AGE
20-25 120 60.1
26-30 63 26.5
31-35 8 3.4
36-40 24 10.1
EMPLOYMENT DETAILS
PUBLIC SECTOR 75 41.2
PRIVATE SECTOR 60 25.2
BUSINESS 64 26.9
OTHERS 16 6.7
QUALIFICATIONS
UG 53 22.3
PG 77 42.1
DIPLOMA 64 26.9
OTHERS 21 8.8
TYPE OF FAMILY
JOINT FAMILY 36 15.1
NUCLEAR FAMILY 179 84.9
FAMILY MEMBERS
TWO 20 8.4
THREE 90 47.5
FOUR 69 29.0
MORE THAN FOUR 36 15.1
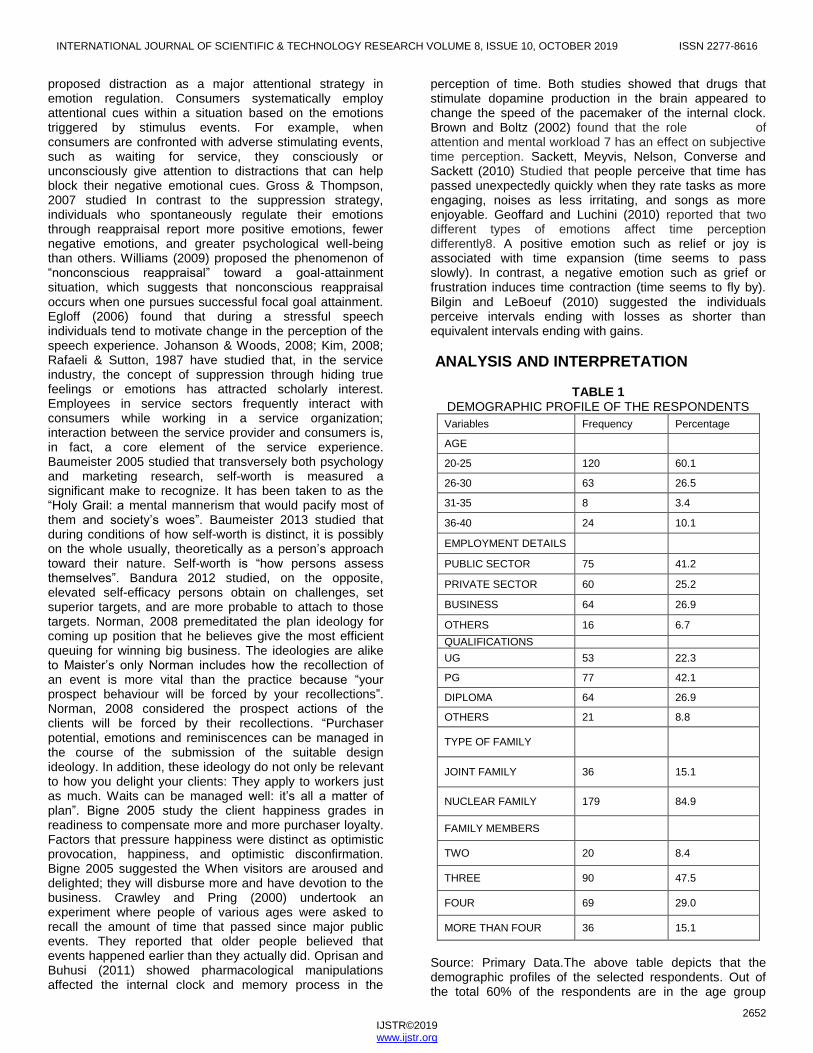
Source: Primary Data.The above table depicts that the demographic profiles of the selected respondents. Out of the total 60% of the respondents are in the age group

INTERNATIONAL JOURNAL OF SCIENTIFIC & TECHNOLOGY RESEARCH VOLUME 8, ISSUE 10, OCTOBER 2019 ISSN 2277-8616
2653 IJSTR©2019 www.ijstr.org
of 20-25 years. The table shows that 56.3% of respondents are male and the rest of respondents are female. It is shown that 51.7% of respondents are drawing a salary above 30000. 23.9% of respondents are drawing 15000-20000 salary. 13.9% of respondents are drawing 20001-25000 salary. Only 10.5% of respondents are drawing 25001-30000 salary.It is also interpreted that 41.2% of respondents are working in public sector, 25.2% of respondents are working in private sector, 26.9% of respondents are doing business and 6.7% of respondents are working in other sectors. It is found that 22.3% of the respondents have completed UG, 42.1% of the respondents have completed PG, 26.9% of the respondents have completed diploma and 8.8% of the respondents have completed other degrees. It is said that, 15.1% of respondents are in joint family and 84.9% of respondents are in nuclear family. It is said that 8.4% of respondents have two members in their family, 47.5% of respondents have three members in their family, 29% of respondents have four members in their family and only 15.1% of respondents have more than four members in their family.
TABLE 2 CLASSIFICATION BASED ON VISIT TO SUPERMARKET
VISIT FREQUENCY PRECENT
EVERYDAY 5 2.1
ONCE A WEEK 89 47.1
HALF A WEEK 33 13.9
ONCE A MONTH 88 37.0
TOTAL 215 100
Source: Primary Data. From the table it is predicted that 2.1% of respondents are visiting supermarkets everyday for shopping, 47.1% of respondents are visiting supermarkets once a week for shopping, 13.9% respondents are visiting supermarkets half a week for shopping and 37% of respondents are visiting supermarkets once a month for shopping.
TABLE 3 CLASSIFICATION BASED ON MAIN REASON TO VISIT
SUPERMARKETS
MAIN REASON FREQUENCY PERCENT
TO DO A WEEKLY SHOP 82 34.5
TO BUY SPECIFIC ITEMS 105 53.8
FOR A PARTY/GATHERING 10 4.2
OTHERS
18 7.6
TOTAL
215 100
Source: Primary Data.
From the table it is interpreted that 34.5% of respondents will go to supermarkets to do weekly shopping, 53.8% of respondents will go to supermarkets to buy specific items, 4.2% of respondents will go to supermarkets for party/gathering, and 7.6% of respondents will go to supermarkets for other reasons.
RELIABILITY STATISTICS Reliability Statistics
Cronbach's Alpha N of Items
0.764 41
Source: Primary dataIn this study method, reliability is operationalized as internal consistency, which is the degree of inter-correlations among the items that constitute a scale. Internal consistency is estimated using a reliability coefficient called Cronbach’s alpha. An alpha value of 0.70 and 0.80 or above is considered to be the criteria for demonstrating internal consistency of new scales respectively. The Cronbach’s alpha values (0.764) for the scales exceed the minimum requirements, thereby demonstrating that the scales are internally consistent and have acceptable reliability values in their original form in this study
TABLE 4 FRIEDMAN TEST FOR PARKING SLOTS
PARKING SLOTS MEAN RANK RANK
Sufficient place 3.64 4
Comfortable 3.91 1
Long time 3.72 3
Additional parking slots 2.77 6
Disturbances 3.15 5
Entry and exit 3.81 2
Source: Primary Data. From the table, it is interpreted that most of the respondents have felt comfortable with the parking slots in the supermarkets. So it has the highest ranking among all the other options under parking slots.
TABLE 5 FRIEDMAN TEST FOR COUNTER QUEUES
COUNTER QUEUES MEAN RANK RANK
Long queue 3.34 4
Standing in queue 3.70 3
Spending more time 2.64 6
Mentality 3.07 5
More counters during weekends and peak hours
3.95 2
Advanced system 4.30 1
Source: Primary data From the table, it is interpreted that most of the respondents have felt advanced system must be implemented in the counter queues of the supermarkets. So it has the highest mean rank among all the other options under counter queues.
TABLE 6 FRIEDMAN TEST FOR WEIGHING QUEUES
WEIGHING QUEUES MEAN RANK RANK
Near counter 3.08 2
More weighing counters
3.12 1
INTERNATIONAL JOURNAL OF SCIENTIFIC & TECHNOLOGY RESEARCH VOLUME 8, ISSUE 10, OCTOBER 2019 ISSN 2277-8616
2654 IJSTR©2019 www.ijstr.org
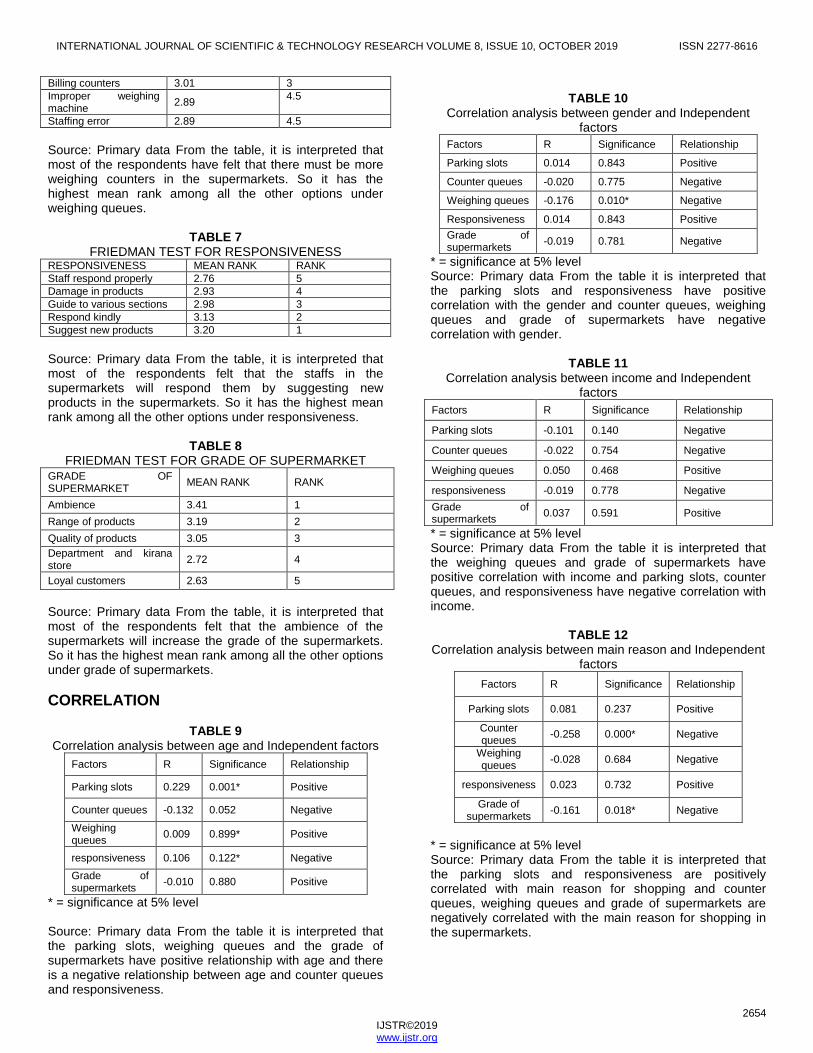
Billing counters 3.01 3
Improper weighing machine
2.89 4.5
Staffing error 2.89 4.5
Source: Primary data From the table, it is interpreted that most of the respondents have felt that there must be more weighing counters in the supermarkets. So it has the highest mean rank among all the other options under weighing queues.
TABLE 7 FRIEDMAN TEST FOR RESPONSIVENESS
RESPONSIVENESS MEAN RANK RANK
Staff respond properly 2.76 5
Damage in products 2.93 4
Guide to various sections 2.98 3
Respond kindly 3.13 2
Suggest new products 3.20 1
Source: Primary data From the table, it is interpreted that most of the respondents felt that the staffs in the supermarkets will respond them by suggesting new products in the supermarkets. So it has the highest mean rank among all the other options under responsiveness.
TABLE 8
FRIEDMAN TEST FOR GRADE OF SUPERMARKET
GRADE OF SUPERMARKET
MEAN RANK RANK
Ambience 3.41 1
Range of products 3.19 2
Quality of products 3.05 3
Department and kirana store
2.72 4
Loyal customers 2.63 5
Source: Primary data From the table, it is interpreted that most of the respondents felt that the ambience of the supermarkets will increase the grade of the supermarkets. So it has the highest mean rank among all the other options under grade of supermarkets.
CORRELATION
TABLE 9 Correlation analysis between age and Independent factors
Factors R Significance Relationship
Parking slots 0.229 0.001* Positive
Counter queues -0.132 0.052 Negative
Weighing queues
0.009 0.899* Positive
responsiveness 0.106 0.122* Negative
Grade of supermarkets
-0.010 0.880 Positive
* = significance at 5% level Source: Primary data From the table it is interpreted that the parking slots, weighing queues and the grade of supermarkets have positive relationship with age and there is a negative relationship between age and counter queues and responsiveness.
TABLE 10
Correlation analysis between gender and Independent factors
Factors R Significance Relationship
Parking slots 0.014 0.843 Positive
Counter queues -0.020 0.775 Negative
Weighing queues -0.176 0.010* Negative
Responsiveness 0.014 0.843 Positive
Grade of supermarkets
-0.019 0.781 Negative
* = significance at 5% level Source: Primary data From the table it is interpreted that the parking slots and responsiveness have positive correlation with the gender and counter queues, weighing queues and grade of supermarkets have negative correlation with gender.
TABLE 11
Correlation analysis between income and Independent factors
Factors R Significance Relationship
Parking slots -0.101 0.140 Negative
Counter queues -0.022 0.754 Negative
Weighing queues 0.050 0.468 Positive
responsiveness -0.019 0.778 Negative
Grade of supermarkets
0.037 0.591 Positive
* = significance at 5% level Source: Primary data From the table it is interpreted that the weighing queues and grade of supermarkets have positive correlation with income and parking slots, counter queues, and responsiveness have negative correlation with income.
TABLE 12
Correlation analysis between main reason and Independent factors
Factors R Significance Relationship
Parking slots 0.081 0.237 Positive
Counter queues
-0.258 0.000* Negative
Weighing queues
-0.028 0.684 Negative
responsiveness 0.023 0.732 Positive
Grade of supermarkets
-0.161 0.018* Negative
* = significance at 5% level Source: Primary data From the table it is interpreted that the parking slots and responsiveness are positively correlated with main reason for shopping and counter queues, weighing queues and grade of supermarkets are negatively correlated with the main reason for shopping in the supermarkets.

INTERNATIONAL JOURNAL OF SCIENTIFIC & TECHNOLOGY RESEARCH VOLUME 8, ISSUE 10, OCTOBER 2019 ISSN 2277-8616
2655 IJSTR©2019 www.ijstr.org
TABLE 13 Correlation analysis between visit to supermarkets and
Independent factors
Factors R Significance Relationship
Parking slots 0.014 0.842 Positive
Counter queues -0.111 0.104 Negative
Weighing queues -0.123 0.072 Negative
Responsiveness 0.116 0.089 Positive
Grade of supermarkets
-0.093 0.175 Negative
* = significance at 5% level Source: Primary data From the table it is interpreted that the parking slots and responsiveness are positively correlated with main reason for shopping and counter queues, weighing queues and grade of supermarkets are negatively correlated with the main reason for shopping in the supermarkets.
ONE WAY ANOVA
TABLE 14 ONE WAY ANOVA for Age and Independent factors
Factor F Significance Result
Parking slots 7.976 0.000* Rejected
Counter queues 3.952 0.000* Rejected
Weighing queues 2.683 0.001* Rejected
Responsiveness 2.335 0.006* Rejected
Grade of supermarkets 5.074 0.000* Rejected
Hypothesis (HO) – There is no significant difference between age and Independent factors of waiting time. *=HO rejected at 0.05 significance level Source: Primary dataFrom the table it is interpreted that null hypothesis HO is rejected. So there is significant difference between age and the independent factors of waiting time (parking slots, counter queues, weighing queues, responsiveness and grade of supermarkets).
TABLE 15 ONE WAY ANOVA for Gender and Independent factors Null Hypothesis (HO) – There is no significant difference between gender and Independent factors of waiting time.
Factor F Significance Result
Parking slots 3.503 0.000* Rejected
Counter queues 5.354 0.000* Rejected
Weighing queues 3.153 0.000* Rejected
Responsiveness 7.891 0.000* Rejected
Grade of supermarkets
4.097 0.000* Rejected
*=HO rejected at 0.05 significance level Source: Primary data From the table it is interpreted that null hypothesis HO is rejected. So there is significant difference between gender and the independent factors of waiting time (parking slots, counter queues, weighing queues, responsiveness and grade of supermarkets).
TABLE 16 ONE WAY ANOVA for Income and Independent factors
Factor F Significance Result
Parking slots 4.494 0.000* Rejected
Counter queues 2.998 0.000* Rejected
Weighing queues 2.888 0.000* Rejected
Responsiveness 7.348 0.000* Rejected
Grade of supermarkets
3.107 0.000* Rejected
Null Hypothesis (HO) – There is no significant difference between income and Independent factors of waiting time. *=HO rejected at 0.05 significance level Source: Primary data From the table it is interpreted that null hypothesis HO is rejected. So there is significant difference between income and the independent factors of waiting time (parking slots, counter queues, weighing queues, responsiveness and grade of supermarkets).
TABLE 17 ONE WAY ANOVA for Main reason and Independent
factors Null Hypothesis (HO) – There is no significant difference between main reason and Independent factors of waiting
time. *=HO rejected at 0.05 significance level
Source: Primary data From the table it is interpreted that null hypothesis HO is rejected. So there is significant difference between main reason and the independent factors of waiting time (parking slots, counter queues, weighing queues, responsiveness and grade of supermarkets).
TABLE 18 ONE WAY ANOVA for visit to supermarket and
Independent factors Null Hypothesis (HO) – There is no significant difference between visit to supermarket and Independent factors of
waiting time.
Factor F Significance Result
Parking slots 2.798 0.001* Rejected
Counter queues 2.365 0.001* Rejected
Weighing queues
2.720 0.000* Rejected
Responsiveness 4.709 0.000* Rejected
Grade of supermarkets
2.522 0.000* Rejected
*=HO rejected at 0.05 significance level
Factor F Significance Result
Parking slots 2.414 0.000* Rejected
Counter queues 5.463 0.000* Rejected
Weighing queues
3.324 0.000* Rejected
Responsiveness 2.013 0.000* Rejected
Grade of supermarkets
2.517 0.000* Rejected

INTERNATIONAL JOURNAL OF SCIENTIFIC & TECHNOLOGY RESEARCH VOLUME 8, ISSUE 10, OCTOBER 2019 ISSN 2277-8616
2656 IJSTR©2019 www.ijstr.org
Source: Primary data From the table it is interpreted that null hypothesis HO is rejected. So there is significant difference between visit to supermarket and the independent factors of waiting time (parking slots, counter queues, weighing queues, responsiveness and grade of supermarkets).
REGRESSION
TABLE 19 Unstandardized Coefficients of Regression Model – Age
and Independent factors
Factor B Standard Error
T Sig
Parking slots 0.229 0.110 3.435 0.001
Counter queues -0.132
0.121 -1.951
0.052
Weighing queues
0.009 0.124 0.127 0.899
Responsiveness 0.106 0.115 1.551 0.122
Grade of supermarkets
-0.010
0.133 -0.151
0.880
R= 0.245, R Square= 0.060, F= 3.367
Null Hypothesis (HO) – There is no significant relationship between age and parking slots, counter queues, weighing queues, responsiveness and grade of supermarket. Source: Primary data The above table reveals R, R2, beta and significance value of independent factors such as parking slots, counter queues, weighing queues, responsiveness and grade of supermarket. It is also understood that the Null Hypothesis is rejected at 5% significance level in the case of parking slots and accepted in case of counter queues, weighing queues, responsiveness and grade of supermarket. The R2 Value 0.060 refers the total variation in dependent. The regression equation can be formed as: 0.229 (Parking slots) + -0.132 (Counter queues) + 0.009 (Weighing counters) + 0.106 (Responsiveness) + -0.010 (Grade of supermarket). TABLE 20 Unstandardized Coefficients of Regression Model – Gender and Independent factors
Factor B Standard Error
T Significance
Parking slots -0.122 0.073 -1.793
0.074
Counter queues
-0.020 0.080 -0.286
0.775
Weighing queues
-0.176 0.080 -2.615
0.010
Responsiveness
0.014 0.076 0.198 0.843
Grade of supermarkets
-0.019 0.087 -0.278
0.781
R= 0.377, R Square= 0.142, F= 8.710
Null Hypothesis (HO) – There is no significant relationship between gender and parking slots, counter queues, weighing queues, responsiveness and grade of supermarket. Source: Primary data The above table reveals R, R2, beta and significance value of independent factors such as parking slots, counter queues, weighing queues,
responsiveness and grade of supermarket. It is also understood that the Null Hypothesis is rejected at 5% significance level in the case of weighing queues, and accepted in case of counter queues, parking slots, responsiveness and grade of supermarket. The R2 Value 0.142 refers the total variation in dependent. The regression equation can be formed as: -0.122 (Parking slots) + -0.020 (Counter queues) + -0.176 (Weighing counters) + 0.014 (Responsiveness) + -0.019 (Grade of supermarket) TABLE 21 Unstandardized Coefficients of Regression Model – Income and Independent factors Null Hypothesis (HO) – There is no significant relationship between income and parking slots, counter queues, weighing queues, responsiveness and grade of supermarket. Unstandardized Coefficients of Regression Model – Income and Independent factors Null Hypothesis (HO) – There is no significant relationship between Income and parking slots, counter queues, weighing queues, responsiveness and grade of supermarket.
Factor B Standard Error
T Significance
Parking slots -0.101
0.147 -1.482
0.140
Counter queues -0.022
0.160 -0.314
0.754
Weighing queues
0.050 0.162 0.727 0.468
Responsiveness -0.019
0.151 -0.283
0.778
Grade of supermarkets
0.037 0.173 0.539 0.591
R= 0.269, R Square= 0.072, F= 4.084
Source: Primary data The above table reveals R, R2, beta and significance value of independent factors such as parking slots, counter queues, weighing queues, responsiveness and grade of supermarket. It is also understood that the Null Hypothesis is accepted at 5% significance level in the case of counter queues, parking slots, weighing queues, responsiveness and grade of supermarket. The R2 Value 0.072 refers the total variation in dependent. The regression equation can be formed as: -0.101 (Parking slots) + -0.022 (Counter queues) + 0.050 (Weighing counters) -0.019 (Responsiveness) + 0.037 (Grade of supermarket). TABLE 22 Unstandardized Coefficients of Regression Model – Main reason and Independent factors Null Hypothesis (HO) – There is no significant relationship between Main reason and parking slots, counter queues, weighing queues, responsiveness and grade of supermarket.
Factor B Standard Error
T Significance
Parking slots 0.081 0.099 1.186 0.237
Counter queues -0.258
0.104 -3.891
0.000
Weighing queues
-0.028
0.109 -0.408
0.684
INTERNATIONAL JOURNAL OF SCIENTIFIC & TECHNOLOGY RESEARCH VOLUME 8, ISSUE 10, OCTOBER 2019 ISSN 2277-8616
2657 IJSTR©2019 www.ijstr.org
Responsiveness 0.023 0.101 0.342 0.732
Grade of supermarkets
-0.161
0.115 -2.383
0.018
R= 0.193, R Square= 0.037, F= 2.026
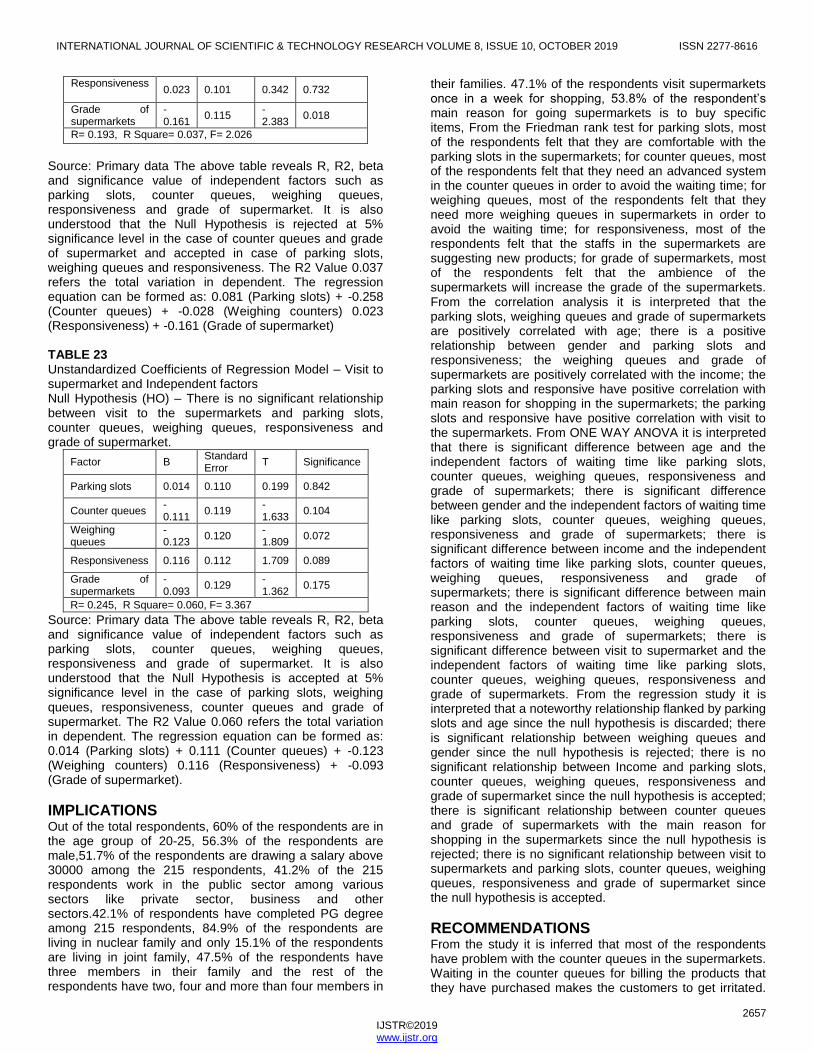
Source: Primary data The above table reveals R, R2, beta and significance value of independent factors such as parking slots, counter queues, weighing queues, responsiveness and grade of supermarket. It is also understood that the Null Hypothesis is rejected at 5% significance level in the case of counter queues and grade of supermarket and accepted in case of parking slots, weighing queues and responsiveness. The R2 Value 0.037 refers the total variation in dependent. The regression equation can be formed as: 0.081 (Parking slots) + -0.258 (Counter queues) + -0.028 (Weighing counters) 0.023 (Responsiveness) + -0.161 (Grade of supermarket) TABLE 23 Unstandardized Coefficients of Regression Model – Visit to supermarket and Independent factors Null Hypothesis (HO) – There is no significant relationship between visit to the supermarkets and parking slots, counter queues, weighing queues, responsiveness and grade of supermarket.
Factor B Standard Error
T Significance
Parking slots 0.014 0.110 0.199 0.842
Counter queues -0.111
0.119 -1.633
0.104
Weighing queues
-0.123
0.120 -1.809
0.072
Responsiveness 0.116 0.112 1.709 0.089
Grade of supermarkets
-0.093
0.129 -1.362
0.175
R= 0.245, R Square= 0.060, F= 3.367
Source: Primary data The above table reveals R, R2, beta and significance value of independent factors such as parking slots, counter queues, weighing queues, responsiveness and grade of supermarket. It is also understood that the Null Hypothesis is accepted at 5% significance level in the case of parking slots, weighing queues, responsiveness, counter queues and grade of supermarket. The R2 Value 0.060 refers the total variation in dependent. The regression equation can be formed as: 0.014 (Parking slots) + 0.111 (Counter queues) + -0.123 (Weighing counters) 0.116 (Responsiveness) + -0.093 (Grade of supermarket).
IMPLICATIONS Out of the total respondents, 60% of the respondents are in the age group of 20-25, 56.3% of the respondents are male,51.7% of the respondents are drawing a salary above 30000 among the 215 respondents, 41.2% of the 215 respondents work in the public sector among various sectors like private sector, business and other sectors.42.1% of respondents have completed PG degree among 215 respondents, 84.9% of the respondents are living in nuclear family and only 15.1% of the respondents are living in joint family, 47.5% of the respondents have three members in their family and the rest of the respondents have two, four and more than four members in
their families. 47.1% of the respondents visit supermarkets once in a week for shopping, 53.8% of the respondent’s main reason for going supermarkets is to buy specific items, From the Friedman rank test for parking slots, most of the respondents felt that they are comfortable with the parking slots in the supermarkets; for counter queues, most of the respondents felt that they need an advanced system in the counter queues in order to avoid the waiting time; for weighing queues, most of the respondents felt that they need more weighing queues in supermarkets in order to avoid the waiting time; for responsiveness, most of the respondents felt that the staffs in the supermarkets are suggesting new products; for grade of supermarkets, most of the respondents felt that the ambience of the supermarkets will increase the grade of the supermarkets. From the correlation analysis it is interpreted that the parking slots, weighing queues and grade of supermarkets are positively correlated with age; there is a positive relationship between gender and parking slots and responsiveness; the weighing queues and grade of supermarkets are positively correlated with the income; the parking slots and responsive have positive correlation with main reason for shopping in the supermarkets; the parking slots and responsive have positive correlation with visit to the supermarkets. From ONE WAY ANOVA it is interpreted that there is significant difference between age and the independent factors of waiting time like parking slots, counter queues, weighing queues, responsiveness and grade of supermarkets; there is significant difference between gender and the independent factors of waiting time like parking slots, counter queues, weighing queues, responsiveness and grade of supermarkets; there is significant difference between income and the independent factors of waiting time like parking slots, counter queues, weighing queues, responsiveness and grade of supermarkets; there is significant difference between main reason and the independent factors of waiting time like parking slots, counter queues, weighing queues, responsiveness and grade of supermarkets; there is significant difference between visit to supermarket and the independent factors of waiting time like parking slots, counter queues, weighing queues, responsiveness and grade of supermarkets. From the regression study it is interpreted that a noteworthy relationship flanked by parking slots and age since the null hypothesis is discarded; there is significant relationship between weighing queues and gender since the null hypothesis is rejected; there is no significant relationship between Income and parking slots, counter queues, weighing queues, responsiveness and grade of supermarket since the null hypothesis is accepted; there is significant relationship between counter queues and grade of supermarkets with the main reason for shopping in the supermarkets since the null hypothesis is rejected; there is no significant relationship between visit to supermarkets and parking slots, counter queues, weighing queues, responsiveness and grade of supermarket since the null hypothesis is accepted.
RECOMMENDATIONS From the study it is inferred that most of the respondents have problem with the counter queues in the supermarkets. Waiting in the counter queues for billing the products that they have purchased makes the customers to get irritated.
INTERNATIONAL JOURNAL OF SCIENTIFIC & TECHNOLOGY RESEARCH VOLUME 8, ISSUE 10, OCTOBER 2019 ISSN 2277-8616
2658 IJSTR©2019 www.ijstr.org
The young age people feel that they wait more time in parking slots, counter queues of the supermarkets. This shows that the young age people have no patience in waiting for billing their own purchased products. Many respondents felt that there must be advanced systems for billing the products in the counter. Thus, if the supermarkets implement advanced systems for billing the products in counters, the waiting of the customers can be reduced and customers will prefer to visit the supermarkets again and again. Many respondents felt that the ambience of the supermarkets will speak about the grade of supermarkets and increase the number of customers.
CONCLUSION The main of conducting the research is to find the perception of customers on waiting time n supermarkets. It is found that many respondents feel that they spend more time in waiting at the counters for billing their purchased products. The respondents felt that if any advanced system is implemented in the counters for billing then the waiting time will be reduced. Many supermarkets staffs respond to the customers by suggesting new products. As the supermarkets made the parking slots comfortable for the customers, they felt no problem. The supermarkets must also maintain a good ambience so that the customers will do shopping peacefully and they will visit again and again.
REFERENCES: [1] Bandura, 2012, "On the functional properties of
perceived self-efficacy revisited," Journal of Management, 38 (1), 9-44.
[2] Baumeister, (2005),The cultural animal: Human nature, meaning, and social life. New York: Oxford University Press, 2005.
[3] Baumeister, (2013), Self-esteem: The puzzle of low self-regard, New York ―Patients’and Parents’ Causal Attributions for Childhood Cancer,‖ Journal of Psychosocial Oncology, 11 (3), 47-61.
[4] Baker, (1987) ―The Role of Environment in Marketing Services: The Consumer
[5] Perspective,‖ in The Services Challenge: Integrating for Competitive Advantage, John A. Czepeil et al., eds. Chicago, IL: American Marketing Association, 79-84.
[6] Bell, David E. (1982), ―Regret in decision making under uncertainty,‖ Operations Research, 30 (5), 961-981.
[7] Bigne, (2005) Evaluating service encounters: The effects of physical surroundings and employee responses. Journal of Marketing, 54, 69-82.
[8] Bigne, (2005) Evaluating service encounters: The effects of physical surroundings and employee responses. Journal of Marketing, 54, 53-60.
[9] Bougie, R., Pieters, R., & Zeelenberg, M. (2003). Angry customers don't come back, they get back: The experience and behavioral implications of anger and dissatisfaction in services. Journal of the Academy of Marketing Science, 31(4), 377.
[10] Bonifield, C., & Cole, C. (2007). Affective responses to service failure: Anger, regret, and retaliatory versus conciliatory responses. Marketing Letters, 18(1), 85-99.
[11] Brady, Michael K. and J. Joseph Cronin Jr. (2001), ―Some New Thoughts on Conceptualizing Perceived Service Quality: A Hierarchical Approach,‖ Journal of Marketing, 65 (July), 34-49.
[12] Brown and Boltz (2002) ―Self-esteem and emotion: Some thoughts about feelings,‖ Personality and Social Psychology Bulletin, 27 (5), 575-584.
[13] Cesaret B., E. Katok. 2015. A behavioral study of capacity allocation in revenue management. Working Paper. The University of Texas at Dallas.
[14] Crawley and Pring (2000), "Distinctive human resources are a firm’s core competitive advantage," Organisational Dynamics: 7-23.
[15] Drolet and Luce (2004) The effects of imprecise probabilities and outcomes in evaluating investment options. Management Science. 51, 1791-1803.
[16] Dubois, David, Derek D. Rucker, and Adam D. Galinsky (2016), ―Dynamics of communicator and audience power: The persuasiveness of competence versus warmth,‖ Journal of Consumer Research, forthcoming.
[17] Egloff, (2006). Spontaneous emotion regulation during evaluated speaking tasks: Associations with negative effect, anxiety expression, memory, and physiological responding. Emotion, 6(3), 356.
[18] Geoffard and Luchini (2010) ―Parental behavior and dimensions of adolescent self-evaluation‖, Sociometry, 34 (4), 466-482.
[19] Gneezy (2006). Ambiguity made precise: A comparative foundation. Journal of Economic Theory, 102(2), 251.
[20] Gross, J. J., & Thompson, R. (2007). Emotion regulation: Conceptual foundations. Handbook of emotion regulation, 3, 24.
[21] Johanson, M. M., & Woods, R. H. (2008). Recognizing the emotional element in service excellence. Cornell Hospitality Quarterly, 49(3), 310.
[22] Long X. 2017. A behavioral study of abandonment decision in multi-stage projects. Working Paper. HKUST.
[23] Markin, Rom J., Charles M. Lillis and Chem L. Narayana (1976), ―Social Psychological Significance of Store Space,‖ Journal of Retailing, 52 (1), 43-54.
[24] Maketal 2014. Purchasing Scarce Products Under Dynamic Pricing: An Experimental Investigation. Manufacturing and Service Operations Management. 16(3), 425{438.
[25] Mehrabian, Russell (1974), An approach to Environmental Psychology, Cambridge, MA: MIT Press.
[26] Norman (2008). Waiting: Integrating social and psychological perspectives in operations management. Omega. 28. 611-629.
[27] Oprisan and Buhusi (2011) ―Self-monitoring of
expressive behavior,‖ Journal of Personality and Social Psychology, 30 (4), 526-537.
[28] Ozbay. 2007. Auctions with Anticipated Regret: Theory and Experiment. American Economic Review. 97(4), 1407{1418.

INTERNATIONAL JOURNAL OF SCIENTIFIC & TECHNOLOGY RESEARCH VOLUME 8, ISSUE 10, OCTOBER 2019 ISSN 2277-8616
2659 IJSTR©2019 www.ijstr.org
[29] Park, and Deborah Roedder John (2011), ―More than meets the eye: The influence of implicit and explicit self-esteem on materialism,‖ Journal of Consumer Psychology, 21, 73- 87.
[30] Rafaeli, A., & Sutton, R. I. (1987). Expression of emotion as part of the work role. The Academy of Management Review, 12(1), 23-37.
[31] Rydval 2009. Do ambiguity avoidance and the comparative ignorance hypothesis depend on people’s affective reactions? Journal of Risk and Uncertainty, 40(3), 243.
[32] Sackett, Meyvis, Nelson, Converse and Sackett (2010) "Dispelling the illusion of invulnerability: The motivations and mechanisms of resistance to persuasion," Journal of Personality and Social Psychology, 83 (3), 526-541.
[33] Stott H. 2006. Cumulative prospect theory's functional managerie. Journal of Risk and Uncertainty. 32(2), 101{130.
[34] Voorhees, (2009). It Depends: Moderating the Relationships Among Perceived Waiting Time, Anger, and Regret. Journal of Service Research, 12(2), 138.
[35] Williams, (2009). The unconscious regulation of emotion: Nonconscious reappraisal goals modulate emotional reactivity. Emotion, 9(6), 84