The Relationship between Emotional Stability, Psychological ...
Upload
khangminh22Category
view
4download
0
PIM 1st International Conference
June 21, 2018
N 1
A STUDY OF THE RELATIONSHIP BETWEEN ENTREPRENEURIAL ORIENTATIONAND ENTERPRISE PERFORMANCE WITH WOMEN’S EMPOWERMENTAS A MEDIATOR
Puja Singh
International MBA, International College, Panyapiwat Institute of Management *Corresponding author: [email protected]
ABSTRACT Entrepreneurship focused work has been at the heart of development for quite some
time now. Kiva, Acumen Fund and BRAC are some impact investors who focus on exploring the entrepreneurial aspects to improve economic opportunities. There is a need to understand the relationship between the measure of entrepreneurship and various social and environmental factors that influence it, with the objective of better performance. This study will explore the effect of women’s empowerment in the relationship between entrepreneurship and its performance, with the use of structural equation modeling. The results have wide spread implications for entrepreneurship based work and achieving better impact in the livelihoods of the individuals concerned.
Keywords: entrepreneurial orientation, women’s empowerment, enterprise performance Introduction Women’s entrepreneurship is recognized as a crucial way to fight poverty and gender based disempowerment in society. It also acts as a vehicle in the promotion of empowerment and leadership for women (UNIFEM, 2000). Neo-liberal ideas of market led growth also assist in the promotion and development of women’s entrepreneurship, mainly because they are seen as harder workers and better at meeting credit repayments then men (Rogaly, 1996). Microfinancing based social projects aligning with this concept work under the assumption that such group based activities will empower women. Some think that while women’s social and entrepreneurial ventures may enhance personal well-being and family security on temporary basis, the traditions and constraints might make a marginal increase in women’s independence and abilities to lead business (Bushell, 2008). Sara Noreen’s (2011) research into the role of microfinance in empowerment of female population of Bahawalpur District of Pakistan in 2011

PIM 1st International Conference
June 21, 2018
N 2
measured the relationship of different social and economic determinants on women empowerment. The results showed microfinance as a major explanatory variable for women empowerment and that ithad some positive role in empowerment but not as much as was expected. Various individuals and organizations have drawn conclusions in relation to the relationship between EntrepreneurialOrientation (EO), Women’s Empowerment (WE) and Enterprise Performance (EP) and understanding it’s importance. Some questions addressed by this research are: 1. Is there a significant relationship between EO and EP? 2. Is there a significant relationship between EO and WE? 3. Is there a significant relationship between WE and EP? 4. Is WE a mediator in the relationship between EO and EP? The objective of this research is to:
1. Determine if there is a significant relationship between EO and EP. 2. Determine if there is a significant relationship between EO and WE. 3. Determine if there is a significant relationship between WE and EP. 4. Determine WE is mediator in the relationship between EO an EP.
EO, the independent variable has three main dimensions as coined by Miller (1983); innovativeness, productiveness and risk taking. Covin & Slevin 1989; Lumpkin & Dess 1996; Moreno & Casillas 2008 have done extensive studies into these dimensions and concluded that they are the primary components of EO. EP, the dependent variable, in this study is based on the TOPP Model of measuring performance developed by Moseng and Bredrup (1993). It looks at performance as the relationship of three dimensions that measures efficiency, effectiveness and adaptability. The mediating variable, WE is measured in relation to EO and EP, to determine if there is a relationship and if it mediates this relationship. WE is measured in the context of intensive research done by Kabeer (1999) andHashemi and Schuler (1993) implemented by Nessa et. al. (2012). Jejeebhoy (1997) and Kishor (1997) have facilitated this and have presented concepts of access, control and decision making in relation to resources, sometimes referring to ownership of resources and sometimes to decision making about resources. These three theories have been combined into a unique conceptual framework that hypothesizes that the

PIM 1st International Conference
June 21, 2018
N 3
relationship between EO and EP is mediated by WE, based on the contingency variables as defined by Lumpkin and Dess (1996).
Literature Review
Wiklund and Shepherd (2005) have defined EO a firm’s strategic orientation to capture specific aspects of entrepreneurial decision-making methods, styles and practices. Lumpkin and Dess (1996) said that EO is ‘the process, practices and decision-making activities that lead to new entry’ (p. 771). Covin and Wales (2012) stated that EO, as a driving force behind organizational effort to succeed, is becoming a central focus of the entrepreneurship literature through more than 30 years of research. There has been growing research interest in the field of EO (Kreiser et al. 2002), particularly in small businesses or SMEs (Fairoz et al. 2010). Hult et al. (2004) concluded that EO is one of the strongest components of performance and plays a key role in the development and maintenance of innovation in both high and low market turbulence. A significant number of researchers have claimed that the understanding of EO for both managers at an individual level and their organizations as whole could be equally important (Carland et al. 1988; Gartner 1985). EO at individual level, analyzed as a variable, is receiving consideration from researchers (Davis et al. 2010). Kreiser et al. (2002) examined a total of 1067 firms from six different countries: Australia, Finland, Mexico, the Netherlands, Norway and Sweden. Results confirmed the cross cultural nature of the EO scale. Another large study done by Arbaugh et al. (2009), studied 1045 respondents from 17 different countries. Those results suggested that the current construct of EO is also applicable to developed countries. Runyan et al. (2012) have recently used samples of 250 US and China based SMEs and proved that EO analysis showed the same pattern across small and medium enterprises (SMEs) in both countries, proving that it is a cross cultural concept. Kreiser et al. (2002) discovered that the best model fit for EO was produced in the sample in six independent countries with three sub-factors consisting of innovativeness, proactiveness and risk taking.
Enterprise performance (EP), also known as firm performance, is a measure of financial and non-financial indicators. In measuring the financial indicators, it takes into consideration the financial efficiency measures like return on investment and return on equity, and profit measures such as return on sales and net profit margin (Tsai, 2010). In the real world and

PIM 1st International Conference
June 21, 2018
N 4
mostly with SMEs there is a limitation of human resource and technology and this posits a challenge in documenting financial performance indicators which can be used for decision making purposes (Heilbrunn, Rozenes, and Vitner, 2011). Therefore, subjective measures or non-financial measures of EP are more frequently used than objective measures or financial measures (Dess and Robinson, 1984). Sink and Tuttle model (Sink, 1985; Sink and Tuttle, 1989) is the most classical approach to performance measurement. The model shows the performance of an enterprise as a complex interrelationship between the following seven performance criteria: Effectiveness, Efficiency, Quality, Productivity, Quality of work life, Innovation, and Profitability/budgetability. Moseng and Bredrup (1993) developed a more applicable and recent work, the TOPP Model of measuring performance, which looks at performance as the relationship of three dimensions; efficiency, effectiveness and adaptability. TOPP, a research program in Norway (1992-1996), has developed two sets of methodologies for measuring productivity in a company (Moseng and Bredrup, 1993): self-audit based on a questionnaire answered by the companies and external audit performed by experts analyzing the companies. TOPP was used in EUREKA project TIME GUIDE which aims at developing software products for process assessment, process benchmarking, and gaming.
Studies have identified a direct and statistically significant relationship between EO and EP (Zahra 1991; Smart & Conan 1994; Hult et al. 2004; Ferreira & Azevedo 2007; Smart & Conant 2011). This has been constructed in an integrative framework by Lumpkin and Dess (1996) using contingent variables to effectively model the relationship between EO and EP. Fit of key variables presented: like environment, structure, strategy is suggested by contingency theory and is critical for performance. Venkatraman (1989b) and Boal and Bryson (1987) have suggested the moderating effects model, mediating effects model, independent effects model, and interaction effects model to analyze the relationship and has been used previously to analyze planning and performance (Boal & Bryson, 1987), generic strategies and performance (Dess & Rasheed 1992) and consensus and performance (Dess & Priem, 1995).
Empowerment is the control over material assets, economic resources and ideology (Baltiwala, 1995). In other words, empowerment is a process of change. Those who are never disempowered cannot be empowered. Hence empowerment is reserved only for people who could not exercise choice in their lives (Kabeer, 1999). The enhancement of assets and

PIM 1st International Conference
June 21, 2018
N 5
capabilities of diverse individuals and groups to engage, influence and hold accountable the institutions which affect them is called empowerment (Bennett, 2002). Mbwewe and Keller (1991) have described women empowerment as “a process whereby women become able to organize themselves to increase their own self-reliance, to assert their independent right to make choices and to control resources which will assist in challenging and eliminating their own subordination”. Hashemi and Schuler (1993) have specified the dimensions of WE that is most similar to and applicable for the context of this study. Nessa et al. (2012) discussed the different aspects of micro credit and analyzed that micro finance contributed in not only improving the earnings sources of rural and poor women but also in better abilities, choices and self-determination in decision making. These impacts were categorized into five dimensions in decision making, such as; household, economic, movement, property, political and social, every dimension had significantly increased due to micro finance effects.In the last few decades, the importance of women’s entrepreneurship has been recognized as a prerequisite for household poverty alleviation and national economic development and empowerment of women (Mayoux, 2001).However there are concerns that women’s entrepreneurship may have an insignificant impact on generating sustainable employment opportunities for women, and even lesser impact on the country’s economic advancement (Mayoux, 2001b). Some think that while women’s social and entrepreneurial ventures may enhance personal well-being and family security on temporary basis, the traditions and constraints might make a marginal increase in women’s independence and abilities to lead business (Bushell, 2008).
This research was conducted to bring more light into the relationship between EO and EP and to determine if WE plays a mediation role in this relationship. Taking the context of Venkatraman (1989b) and Boal and Bryson (1987) research where they have suggested the moderating effects model, mediating effects model, independent effects model, and interaction effects model to analyze the relationship, this research focuses on the mediation role played by the factor WE in the contingency model framework introduced by Lumpkin and Dess (1996). The researcher developed a conceptual framework based in the EO model presented by Miller (1983), EP model persented by Moseng and Bredrup (1993) and the WE model presented by Nessa et. al. (2012).

PIM 1st International Conference
June 21, 2018
N 6
Figure 1: Conceptual framework Source: Author, 2016 Methodology
The research uses a descriptive approach, defined as the type of research that converts data collected by the researcher into inferential data useful in answering questions of dependency and relationship (Zikmund, 2003). The relationships in the data was analyzed through inferential statistics (Lyons & Douek, 2010). The target population of this study are female entrepreneurs from rural microfinance enterprise in Nawalparasi District of Nepal. They have little to no education, are married early in life, live with their husband’s families and have children. This study is done in one organization with 438 members. Hence the size of the population can be considered to be 438 and the ideal sample size would be 120. But since the minimum sample size for the type of statistical test used in the survey requires at least 400 data points, 400 us taken as a sample size in this survey. For primary data, both qualitative (semi-structured interview schedule) and quantitative data were collected as a part of the study, making it a mixed method research. Qualitative information collected was translated, transcribed, coded, analyzed and informed the assumptions made from qualitative analysis. For quantitative data, the respondents reported to 5 point Likert Scale questionnaires on EO, WE and EP. The Cronbach’s Alpha (α) ranged from 0.420 to 0.865. Structural Equation Modeling (SEM), a statistical tool used to test hypotheses about variables and relationships was used to test if the theory fits the data. Exploratory Factor Analysis (EFA) was run on SPSS 20, to determine the data fit and to develop a measurement model. It resulted in a three factor matrix and indicated one indicator from the WE factor should be dropped from the

PIM 1st International Conference
June 21, 2018
N 7
measurement model for ideal model fit. Confirmatory Factor Analysis (CFA) was conducted, on SPSS AMOS 20 to access model fit of the measurement model to the data collected. The analysis showed the following indices needed to ensure model fit:
Figure 2: Path diagram of measurement model Source: Author,2016Table 1: Model fit indices from CFA analysis of the measurement model Acceptable fit indices Fit indices
The Normed Fit Index (NFI) exceeds .90 (Byrne, 1994) or .95 (Schumacker & Lomax, 2004).
NFI = 0.90
The Goodness of Fit Index (GFI) exceeds .90 (Byrne, 1994). GFI = 0.94
The Comparative Fit Index (CFI) exceeds .93 (Byrne, 1994). CFI = 0.94
Root Mean Squared (RMS) is less than .08 (Browne & Cudeck, 1993) and ideally less than .05 (Stieger, 1990). Alternatively, the upper confidence interval of the RMS should not exceed .08 (Hu & Bentler, 1998).
RMS = 0.07
The relative Chi-square (CMIN) should be less than 2 or 3 (Kline, 1998& Ullman, 2001).
CMIN = 2.06
Source: Author,2016

PIM 1st International Conference
June 21, 2018
N 8
Table 1 shows the acceptable fit indicators needed to determine model fit for a CFA and the acquired fit indicators from the CFA performed by the researcher. The Normed Fit Indicator (NFI) was at good level of 0.904. The Good Fit Index (GFI) was also at a good level of 0.942. The Comparative Fit Index (CFI) was also seen to be at a good fit level of 0.947. The Root Mean Squared (RMS) is seen to be less than the upper bracket of 0.08. And the Chi-squared (CMIN) is also less than the upper bracket of 3. These five fit indicators and their values determine this measurement model to be of good model fit in the CFA. After the model was determined to be of good fit, the researchers needed to prove that WE had mediator effect in the relationship between EO and EP. To establish mediation, the researcher followed the four steps for determination of mediation as illustrated by Baron and Kenny (1986). The first step, considered hypothesis one, was to determine that there was a significant relationship between independent and dependent variable without the mediator variable. The second step, considered hypothesis two, was to determine that there was a significant
PIM 1st International Conference
June 21, 2018
N 9
relationship between EO and WE, the mediator. The third step, considered hypothesis three, was to determine that there was a significant relationship between WE and EP with the effect of EO as a predicator variable. The final and fourth step, considered hypothesis four, was to determine if the mediator variable WE did actually effect the relationship between EO and EP. The estimates for the model are presented in the table 2. Table 2: Summary of Hypothesis Testing
Hypothesis Beta Estimate S.E. C.R. P Results
H1o 0.789 0.085 4.098 *** Rejected
H2o 0.525 0.046 5.926 *** Rejected
H3o 0.312 0.100 2.324 0.020 Rejected
H4o 0.622 0.122 3.752 *** Rejected
Source: Author, 2016 Table 2 shows thatnull hypothesis one is rejected because there is a significant relationship between EO and EP.Null hypothesis two is rejected because there is a significant relationship between the EO and WE.Null hypothesis three is rejected because there is a significant relationship between WE and EP. And null hypothesis four was also rejected because the relationship between EO and EP remained significant with the mediation of WE although the level of significance dropped from 0.789 to 0.622 proving that WE is a partial mediator between EO and EP. Conclusions The research outcomes can be concluded with regards to the objectives of the research determined in the beginning of the research process. The objective of this research is to: 1. Determine if there is a significant relationship between EO and EP.
The results of the statistical analysis shows a significant relationship between EO and EP with a p value of 000 (Table 2). Since the p value is more than 0.05, it was determined that there is a significant relationship between EO and EP. This means that when EO is increased by one standard deviation, EP will increase by 0.789 standard deviations. This

PIM 1st International Conference
June 21, 2018
N 10
result is consistent with the results produced by Zahra 1991, Smart & Conan 1994, Hult et al. 2004, Ferreira & Azevedo 2007 and Smart & Conant 2011 in their individual research on the significance of relationship between EO and EP. 2. Determine if there is a significant relationship between EO and WE.
There is also a significant relationship between EO and WE with a p value of 000 (Table 2). This also means that when EO is increased by one standard deviation, WE will increase by 0.525 standard deviations. This result is similar to the results obtained by Goetz and Sen Gupta (1996). The results also showed a significant relationship between WE and EP with a p value of 0.020 with is < 0.05 and is hence significant (Table 2). The results are similar to Sarumathi & Mohon (2011) research on the impact of micro credit on women empowerment on the women of Pondicherry, India which summed up that micro finance was one of the essential elements to remove the poverty and the improvement of rural women capacity. It is also similar to the work done by Noreen (2011) which explored the positive impacts of micro finance on the enlargement of women empowerment in Bahawalpur, Pakistan, by using five indicators related to child health, education, selection of spouse of children, purchase of basic goods and decision. 3. Determine if there is a significant relationship between WE and EP.
There is also a significant relationship between WE and EP with a p value of 000 (Table 2). This also means that when WEis increased by one standard deviation, WE will increase by 0.312 standard deviations. The results also showed a significant relationship between WE and EP with a p value of 0.020 with is < 0.05 and is hence significant (Table 2).
4. Determine WE is mediator in the relationship between EO an EP. The results also showed that there was a significant relationship between the EO and
EP with WE as a mediator model. In the mediator measurement model the significance was 0.622 which means that when EO was increased by one standard deviation, EP increased by 0.622 standard deviations from 0.789. In comparison with the measurement of significance without mediator variable, this is lower. Since the change in effect of EO on EP controlling for WE was not zero, it was concluded that WE has a mediating role in the relationship between EO and EP according to the test by Baron and Kenny (1986). Recommendations
The conclusion that WE plays a mediating role in the relationship between EO and EP is just the beginning into the work that needs to be done to statistically analyze the

PIM 1st International Conference
June 21, 2018
N 11
various contingency variables that may exsist in an entrepreneurial framework in various situations. Such analysis will make the entrepreneurial process more specific, understandable and effective. There are various ways this knowledge could impact the massive amount of work being done around the world.
With regards to the scope of this research it recommended that the outcomes of the research be considered as the outcomes for this particular case of organization in this particular context. Entrepreneurial ventures implemented in the organization understudy with the level of WE has statistically resulted in a significant relationship. This does not prove that other organizations has the same effect in similar conditions. An extensive study of multiple organizations and cases have to be conducted to ensure that there is a statistical trend occurring in the EO, EP and WE dynamics in the women led cooperatives in Nepal. With regards to the outcomes of the research, it is natural to be positive for such a statistical significance to occur in studies done in other organizations. It is recommended that the methodology used in this study be tested and tried by using it in other studies but also revised by adding other factors for the role of mediators. Such a research can also be scaled to involve multiple countries and cultures. References Arbaugh, JB, Cox, LW & Camp, SM 2009, 'Is entrepreneurial orientation a global construct?
multi-country study of entrepreneurial orientation, growth strategy, and performance',The Journal of Business Inquiry, vol. 8, no. 1, pp.12-25.
Batliwala, Srilatha. 1994. “The meaning of women’s empowerment: New concepts from action.” Population Policies Reconsidered: Health, Empowerment and Rights. G. Sen, A. Germain and L.C. Chen, eds. Cambridge: Harvard University Press, Pp. 127-138 .
Baron, R. M., & Kenny, D. A. (1986). The moderator-mediator variable distinction in social psychological research: Conceptual, strategic and statistical considerations. Journal of Personality and Social Psychology, 51, 1173-1182.
Bennett, L. (2002).Using Empowerment and Social Inclusion for Pro-poor Growth: A Theory of Social Change, Working Draft of Background Paper for the Social Development Strategy Paper, Washington, DC: World Bank.
Boal, K., & Bryson, J. 1987. Representation, testing and policy implications of planning processes. Strategic Management Journal, 8: 211-231.
Browne, M. W., & Cudeck, R. (1993). Alternative ways of assessing model fit. In K. A. Bollen & J. S. Long (Eds.), Testing structural equation models (pp. 136-162). Newsbury Park, CA: Sage.

PIM 1st International Conference
June 21, 2018
N 12
Bushell, B. (2008) “Women Entrepreneurs in Nepal: what prevents them from leading the sector?”, Gender and Development 16(3)
Byrne, B. M. (1994). Structural equation modeling with EQS and EQS/Windows. Thousand Oaks, CA: Sage Publications. Carland, JW, Hoy, F & Carland, JAC 1988, '"Who is an entrepreneur?" Is a question worth
asking', American Journal of Small Business, vol. 12, no. 4, pp. 33-9. Covin J & Wales, W 2012, 'The measurement of entrepreneurial orientation’,
EntrepreneurshipTheory and Practice, vol. 36, no. 4, pp. 677-702. Covin, JG & Slevin, DP 1989, 'Strategic management of small firms in hostile and benign
environments', Strategic Management Journal, vol. 10, no. 1, pp. 75- 87 Davis, JLB, R. Greg, Payne, GT & Kreiser, P 2010, 'Entrepreneurial Orientation and Firm
Performance: The Moderating Role of Managerial Power', American Journal of Business, vol. 25, no. 2, pp. 41-54.
Dess, G. G., & Priem, R. L. 1995. Consensus-performance research: Theoretical and empir- icalextensions. Journal of Management Studies, 32: 401-417.
Dess, G. G., & Rasheed, A. 1992. Commentary: Generic strategies. In P. Shrivastava, A. Huff, &J. Dutton (Eds.), Advances in strategic management: 409-416. Greenwich, CT: JAI Press.
Dess, G., Robinson, R., 1984. Measuring Organizational Performance in the Absence of Objective Measures: The Case of the Privately- Held Firm and Conglomerate Business Units. Strategic Management Journal 5(3), July-September, p. 265-273.
Fairoz, FM, Hirobumi, T & Tanaka, Y 2010, 'Entrepreneurial orientation and business performance of small and medium scale enterprises of Hambantota District Sri Lanka', Asian Social Science, vol. 6, no. 3, pp. 34-46.
Ferreira, JJ & Azevedo, S 2007, 'The impact of entrepreneurial orientation and resource-based view on growth of small firms’. Social Science Research Network. Retrieved on October 12, 2016 from http://ssrn.com/abstract=1029985.
Gartner, WB 1985, 'A conceptual framework for describing the phenomenon of new venture creation', Academy of Management Review, vol. 10, no. 4, pp. 696- 706.
Goetz, A. M. and R. Sen Gupta (1996) ‘Who Takes the Credit? Gender, Power and Control over Loan Use in Rural Credit Programs in Bangladesh’, World Development 24(1): 45 - 63
Hamid, Shamim. 1996. Why Women Count: Essays on Women in Development inBangladesh. Dhaka: University Press Limited.
Hashemi, S.M., S.R. Schuler, and A.P. Riley(1996).Rural Credit Programs and Women's
Empowerment in Bangladesh." World Development, 24(4).635-653. Retrieved on October 16, 2016 from http://dx.doi.org/10.1016/0305-750X(95)00159-A.

PIM 1st International Conference
June 21, 2018
N 13
Heilbrunn, S., Rozenes, S., Vitner, G., 2011. A "DEA" Based Taxonomy to Map Successful SMEs. International Journal of Business and Social Science 2, February, p. 232-24
Hofstede, G 1980, Culture’s Consequences: International Differences in Work Related Values, Sage Publications, Thousand Oaks, CA.
Hu, L. T., & Bentler, P. M. (1995). Evaluating model fit. In R. H. Hoyle (Ed.), Structural equation modeling: Concepts, issues, and applications (pp. 76-99). Thousand Oaks, CA: Sage.
Hult, GTM, Hurley, RF & Knight, GA 2004, 'Innovativeness: Its antecedents and impact on business performance', Industrial Marketing Management, vol. 33, pp. 429-38.
Jejeebhoy, S. (1997), ‘Operationalising Women’s Empowerment: the Case of Rural India’, paper presented the Seminar on Female Empowerment and Demographic Processes, Lund (20-24 April)
Kabeer N. (1999). Resources, Agency, Achievement; Reflections on the Measurement of Women’s Empowerment. Development and Change 30(3), 435–464.
Kishor, S. (1997) ‘Empowerment of Women in Egypt and Links to the Survival and Health of their Infants’, paper presented at the Seminar on Female Empowerment and Demographic Processes, Lund (20 - 24 April).
Kline, R. B. (1998). Principles and practice of structural equation modeling. NY: Guilford Press.
Kreiser, PM, Marino, LD & Weaver, KM 2002, 'Assessing the psychometric properties of the entrepreneurial orientation scale: A multi-country analysis', Entrepreneurship Theory and
Practice, vol. Summer, pp. 71-94. Lumpkin, GT & Dess, GG 1996, 'Clarifying the entrepreneurial orientation Construct and
linking it to performance', The Academy of Management Review, vol. 21, no. 1, pp. 135-72.
Mayoux, L. (2001) Beyond Rhetoric: Women’s Empowerment and Micro-enterprise Development, London and New York: Zed Press (2001b) Women's empowerment and poverty reduction: Implications for impact assessment. London, UK: Enterprise Development Impact Assessment Information Service (EDIAIS), Department for International Development (DFID)
Mbwewe. D. C. and Keller, B. (1991) .Policy and Planning for the Empowerment of Zambia’s Women Farmers, Canadian Journal of Development Studies, 12(1):75-88.
Miller, D 1983, 'The correlates of entrepreneurship in three types of firms', Management Science, vol. 29, no. 7, pp. 770-91.
Moreno, AM & Casillas, JC 2008, 'Entrepreneurial orientation and growth of SMEs: A causal model', Entrepreneurship Theory and Practice, vol. 32, no. 3, pp. 507-28.

PIM 1st International Conference
June 21, 2018
N 14
Moseng, B. and Bredrup, H. (1993), “A methodology for industrial studies of productivity performance”, Production Planning and Control, Vol. 4 No. 3.
Nessa, T. 2012, “Approach of Measuring and Studying Women Empowerment”. OIDA International Journal of Sustainable Development, Vol. 03, No. 12, pp. 117-124.
Noreen, S. (2011). Role of Microfinance in Empowerment of Female Population of Bahawalpur District, International Conference on Economics and Finance Research, 4(20).65 –71.
Rogaly, B. (1996) Micro-inance evangelism, ‘destitute women’, and the hard selling of a new anti-poverty formula. Development in Practice, Vol. 6, No. 2, 100-112.
Runyan, RC, Ge, B, Dong, B & Swinney, JL 2012, 'Entrepreneurial orientation in cross-cultural research: Assessing measurement invariance in the construct', Entrepreneurship Theory and Practice, vol. July, pp. 819-36.
Sarumathi,S&Mohon ,D.K.( 2011).Role of Micro Finance in Women’s Empowerment (An Empirical study in Pondicherry region rural SHG’s), Journal of Management and Science,1(1): 1-10
Sathar, Z A. and S. Kazi (1997) Women’s Autonomy, Livelihood and Fertility. A Study of Rural Puanjab. Islamabad: Pakistan Institute of Development Studies.
Schumacker, R. E., & Lomax, R. G. (2004). A beginner's guide to structural equation modeling, Second edition. Mahwah, NJ: Lawrence Erlbaum Associates.
Sink, D.S. (1985), Productivity Management: Planning, Measurement, and Evaluation, Control, and Improvement, John Wiley & Sons, New York, NY.
Sink, S. and Tuttle, T. (1989), Planning and Measurement in your Organization of the Future, Industrial Engineering and Management Press, Norcross, GA.
Smart, DT & Conant, JS 1994, 'Entrepreneurial orientation, distinctive marketing', journal of Applied Business Research, vol. 10, no. 3, pp. 28-38.
Smart, DT & Conant, JS 2011, 'Entrepreneurial orientation, distinctive marketing competencies and organizational performance', Journal of Applied Business Research, vol. 10, no. 3,pp. 28-38.
Steiger, J. H. (1990). Structural model evaluation and modification: An interval estimation approach. Multivariate Behavioural Research, 25, 173-180.
Tsai, C-W 2008, 'Leadership style and employee's job satisfaction in international tourist hotels', in AG Woodside (ed.), Advances in Culture, Tourism and Hospitality Research, Emerald Group Publishing Limited, vol. 2, pp. 293- 332. UNIFEM (2000) ‘Statement on Progress of the World’s Women’, New York
Ullman, J. B. (2001). Structural equation modeling Using Multivariate Statistics (4th ed& pp 653- 771). Needham Heights, MA: Allyn & Bacon.

PIM 1st International Conference
June 21, 2018
N 15
Venkatraman, N. 1989b. The concept of fit in strategy research: Toward verbal and statisticalcorrespondence. Academy of Management Review, 14: 423-444.
Wiklund, J & Shepherd, D 2005, 'Entrepreneurial orientation and small business performance:A configurational approach', Journal of Business Venturing, vol. 20, no. 1, pp. 71-91.
Zahra, SA 1991, 'Predictors and financial outcomes of corporate entrepreneurship: Anexploratory study', Journal of Business Venturing, vol. 6, no. 4, pp. 259- 85. Zikmund, W 2003, Business Research Methods, 7th edition, Thomson/SouthWestern,Cincinnati, OH.

Pim1st International Conference
June, 2018
N 16
COMPARISION OF WORKING MEMORY CAPACITY AMONG THE ELDERLY WITH DIFFERENT LEISURE ACTIVITIES IN CHONBURI
Jakkarin Chinsuwan, AwasdaKitsoun, KakadasBoun, BounchanVhongtongkham, ThanareeKrajangjaeng, Pattrawadee Makmee and AutaipohnKaikaew
College of Research Methodology and Cognitive Science, Burapha University
*Corresponding author, E-mail: [email protected] ABSTRACT
Physical and mental exercising are essential to prolonging the elderly cognitive ability. This research objectives are1) to find the correlation of the ages and the working memory capacity of the elderly2) to compare the working memory capacity between the elderly who usually do leisure activities and the elderly with non-leisure activities and 3) to compare the working memory capacity between the elderly who usually do physical leisure activities and the elderly who usually do mental leisure activities. This study was performed in Chonburi elderly. The 68 elderly aged over 50 were randomized and divided into 2 groups with 34 people in each group. The control group contained 34 elderly with non-leisure activity. Whilst the experimental group contained 34elderlywho usually do leisure activities, divided into two subgroups each group contains 17 randomized elderly who did leisure emphasized on physical and mental activities, respectively. The test uses four psychological tools including 1) corsiblock forward 2) corsiblock backward 3) digit span forward and 4) digit span backward.
The results showed that the elderly who performed leisure activities exhibited significantly higher score on both spatial working memory and phonological working memoryspan than those of the elderly with non-leisure activities. Elderly who performed physical leisure activities exhibited higher spatial working memory span than those who performed mental activities. On the other hand, the elderly who performed mental activities displayed higher phonological working memory span than those who performed physical activities.
Keywords: Working memory capacity, Elderly, Leisure activities
Introduction At present, population aging becomes one of the most emerging challenges in
Thailand as the number of elderly is going up. The World Health Organization (WHO, 2001) has defined the elderly is the age from 50 years above. Interestingly the statistical survey of

Pim1st International Conference
June, 2018
N 17
the National Statistical Office in 2016 found that Thailand has a population aged of 50 years old of 29,15% of the Thai population. Over the next 35 years, it is predicted more than 35.8% of the Thai population will be aged 50 years or over. The question is how Thailand gets ready to deal with this upcoming elderly society.
Chonburi is one of the most populated provinces and has a huge number of elderly. Chonburi is very important in Thailand, the leading commercial and industrial of Thailand. In the future, Chonburi Province will be developed as one of the Eastern Economic Corridor - EEC, a strategic plan for the country under Thailand 4.0, and will play an important role in driving the country forward. Doing Research and development in Chonburi could be the role model for other provinces.
To cope with the aging society in the future. Thailand necessary to awake with infrastructure development, important to raise the elderly provide a good quality of life. Whether it is the quality of life of physical factors and quality of life in 4 intelligence or cognitive performance Which is an important factor that affects the happy life together of a group of elderly people and groups of various people in society. (Allerhand, 2014)
Working Memory is considered one of the most important intellectual elements from the literature review found that the factors related to memory loss in seniors with dementia includes physical factors and cerebral Physiology and social factors, the study found that in older people who live alone or in isolation rarely social activity and reduced social roles (Havighurst, 1971), and the result of the brain deterioration from a drop of blood to treat frontal and temporal lobe together with the elderly use fewer ideas caused the memory while thinking decreased the elderly have the ability to solve the problem. Decide, reasoning, planning, including the daily routine is the decline. The resulting decision in the employment of the employer declined in the older ages. But research suggests that we can extend working memory of the brain from leisure activities in various forms to promote the work of the brain and reduce the decline of brain physiology. (Hinrichs, 2017)
According to the importance of the problem, the researchers studied in deep in the elderly with lifestyle of physical leisure activity and mental leisure activity which significantly affect the development and maintenance of cognitive process. The researcher is interested in seeking elderly lifestyle for guiding the building of the EEC elderly community zone and promoting activities which contribute elderly a good life.So that to conclude the guiding policy stimulating leisure activities among elderly society in EEC and Thailand.
Literature Review Working memory capacity: A data collection in mind for a short amount of time. To
focus on making the workload and remember in mind. Plan to do more complex activities in a short time by practicing working memory. We have more talent. Focusing on the task, to avoid what would make the distractions. Planning the next step. Remember the command and start working and practice task has
Pim1st International Conference
June, 2018
N 18
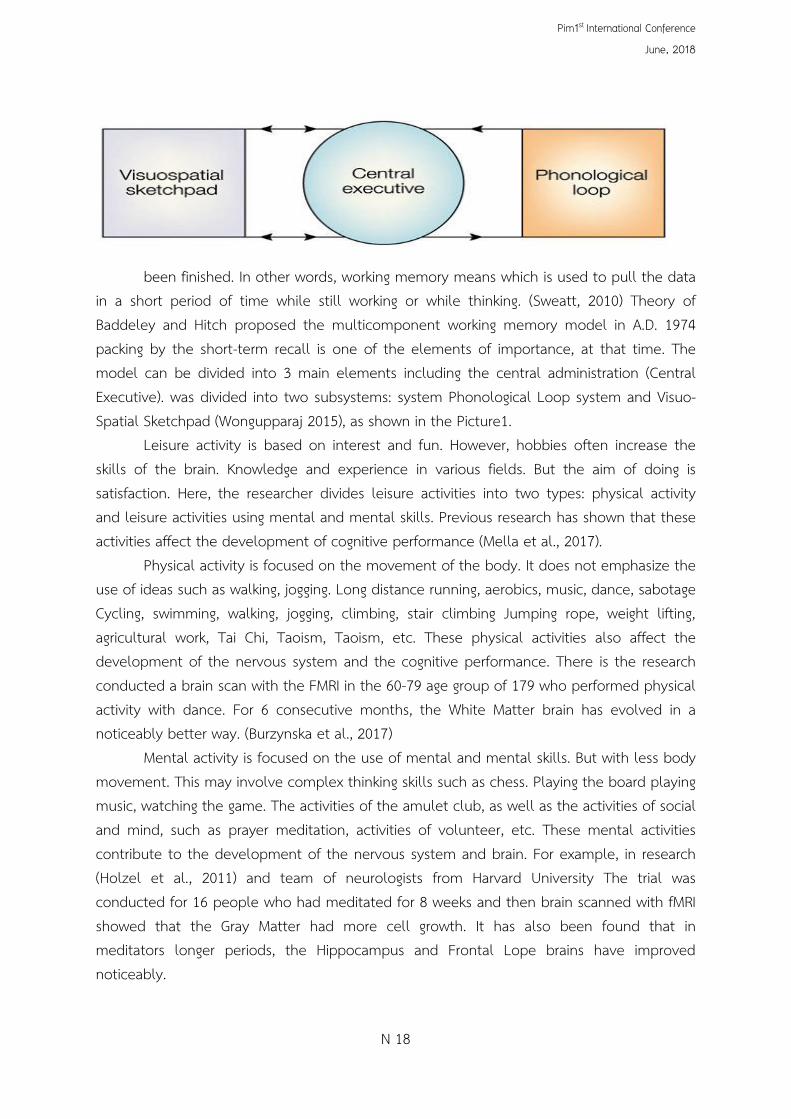
been finished. In other words, working memory means which is used to pull the data in a short period of time while still working or while thinking. (Sweatt, 2010) Theory of Baddeley and Hitch proposed the multicomponent working memory model in A.D. 1974 packing by the short-term recall is one of the elements of importance, at that time. The model can be divided into 3 main elements including the central administration (Central Executive). was divided into two subsystems: system Phonological Loop system and Visuo-Spatial Sketchpad (Wongupparaj 2015), as shown in the Picture1.
Leisure activity is based on interest and fun. However, hobbies often increase the skills of the brain. Knowledge and experience in various fields. But the aim of doing is satisfaction. Here, the researcher divides leisure activities into two types: physical activity and leisure activities using mental and mental skills. Previous research has shown that these activities affect the development of cognitive performance (Mella et al., 2017).
Physical activity is focused on the movement of the body. It does not emphasize the use of ideas such as walking, jogging. Long distance running, aerobics, music, dance, sabotage Cycling, swimming, walking, jogging, climbing, stair climbing Jumping rope, weight lifting, agricultural work, Tai Chi, Taoism, Taoism, etc. These physical activities also affect the development of the nervous system and the cognitive performance. There is the research conducted a brain scan with the FMRI in the 60-79 age group of 179 who performed physical activity with dance. For 6 consecutive months, the White Matter brain has evolved in a noticeably better way. (Burzynska et al., 2017)
Mental activity is focused on the use of mental and mental skills. But with less body movement. This may involve complex thinking skills such as chess. Playing the board playing music, watching the game. The activities of the amulet club, as well as the activities of social and mind, such as prayer meditation, activities of volunteer, etc. These mental activities contribute to the development of the nervous system and brain. For example, in research (Holzel et al., 2011) and team of neurologists from Harvard University The trial was conducted for 16 people who had meditated for 8 weeks and then brain scanned with fMRI showed that the Gray Matter had more cell growth. It has also been found that in meditators longer periods, the Hippocampus and Frontal Lope brains have improved noticeably.

Pim1st International Conference
June, 2018
N 19
Objectives
1. To find the correlation of the ages and the working memory capacity of the elderly. 2. To compare the working memory capacity of elderly between who usually do leisure
activities with elderly who do not usually do leisure activities. 3. To compare the working memory capacity of elderly between who usually do physical
leisure activities with and who usually do mental leisure activities.
Methods
1. Populations in this research are the elderly in Chonburi province 343,350 people (Chonburi Statistical Office, 2016) 1.1 Samples are 68 elderly in Chonburi province who have age 50 years or above.
1.1.1 34 of samples are the elderly who did not perform leisure activities or have frequency of performing leisure activities less than 1 time per month.
1.1.2 34 of samples are the elderly who performed leisure activities or have frequency of performing leisure activities one or more than one time per week and each time must longer than 1 hour. This group is divided into 2 subgroups. 1.1.2.1 Elderly17 people who performed physical leisure activities 1.1.2.2 Elderly17 people who performed mental leisure activities
2. Research tools included the survey and the programs as follows: 2.1 Participant health criteria survey which including eyes test and hand muscle test. 2.2 The Psychology Experimental Building Language (PEBL) program with score scale
from 1-9 points. 2.2.1 Short-Term Memory Test "Corsi Block Forward Test" The test method is to
let the participants remember the yellow boxes that appears and response by answer the sequence of yellow boxes . In order to measure spatial short-term memory spans (Toepper et al., 2014)as show in Picture2.
2.2.2 Spatial Working Memory Test "Corsi Block Backward Test" The test method is to let the participants remember the yellow boxes that appears and response by answer the backword sequence of yellow boxes . In order to measure spatial working memory spans (Toepper et al., 2014) The experiments showed that while human do the test Corsi Block, Hippocampus brain region is activated. (van Asselen et al., 2006)

Pim1st International Conference
June, 2018
N 20
Picture2: Corsi Block Testing
2.2.3 Short-term memory, audio and language testing The Phonological Short-Term Memory "Digit Span Forward Test". Participants recognize the numbers heard in sequence. From the numbers 1-9 units, the participants were asked to correct the numbers in sequence to measure phonological short-term memory capacity (Mueller & Piper, 2012).as shown in Picture3.
2.2.4 The Phonological Working Memory "Digit Span Backward Test". The test method is to let the participants recognize the numbers heard in sequence. From the numbers 1-9 units, the participants were asked to correct the numbers in backward sequence to measure phonological working memory capacity (Mueller & Piper, 2012).The experiment of Li (2012) revealed the correlation between Digit Span scores and brain size. Gray Matter had a significant positive correlation.
Picture3: Digit Span Testing

Pim1st International Conference
June, 2018
N 21
3. Data Analysis Statistical data was analyzed by using the program R.
3.1 Analyze cognitive performances of samples using basic statistics, percentage, mean, standard deviation. Analyze correlation coefficient between age and cognitive performances in elderly.
3.2 Analyzes to compare the cognitive performances of the elderly who performed leisure activities and non-leisure activities using the Independent T-Test.
3.3 Analyzes to compare the cognitive performances of the elderly who performed physical leisure activities and mental leisure activities using the Independent T-Test.
Results
The mean age of the 68 participants is 60.82 years, and standard deviation of age is 7.316, with 57.4% male and 42.6% male. “Spatial Short-Term Memory” Corsi Block Forward Test score = 5.50 ± 1.058 points “Spatial Working Memory” Corsi Block Backward Test" score = 3.29 ± 0.793 points “Phonological Short-Term Memory” Digit Span Forward Test score = 5.71 ± 1.120 points “Phonological Working Memory” Digit Span Backward Test score = 3.56 ± 0.835 points
Statistical correlation between age and cognitive performances.
Table 1: shows the correlation between age and the four test scores.
Corsi Block Forward
Corsi Block Backward
Digit Span Forward
Digit Span Backward
Age Pearson Correlation -.679** -.663** -.642** -.599** Sig. (2-tailed) .000 .000 .000 .000 N 68 68 68 68
** The age and scores of the four tests had a significant negative correlation at the 0.01 level (2-tailed) Picture 4: The Negative correlation between age and the four test scores.

Pim1st International Conference
June, 2018
N 22
CORSI BLOCK FORWARD CORSI BLOCK BACKWARD DIGIT SPAN FORWARD DIGIT SPAN BACKWARD
Do Leisure Activities Non-Leisure Activities
Correlation of working memory capacity and age of the elderly (as shown in Picture4) consistent with past researches. The test of working memory in humans with different age. The elderly has a lower cognitive performance than younger adults (Rhodes, 2017), and have found that age is negatively correlated with the working memory capacity (Federmeier, Kutas & Schul, 2010).
Comparison of cognitive performances, spatial short-term memory and spatial working memory among the elderly who performed leisure and non-leisure activities using the Independent T-Test (Program R). The results of the Corsi Block Forward score of those who perform leisure activities (M = 6.12) were significantly higher than those who did not
Picture5: The PEBL scores of the elderly who performed leisure activities and who did not perform leisure activities.
perform leisure activities (M = 4.88). The t (68) = 5.908 p <.05 Significant. The results of the Corsi Block Backward score of those who perform leisure activities (M = 3.62) score were significantly higher than those who did not practice leisure activities (M = 2.97) using t (68) = 3.664 p <.05. Significant. Comparison of cognitive performances, phonological short-term memory and phonological working memory among the elderly who performed leisure and non-leisure activities. The results of the Digit span forward score of those who perform leisure activities (M = 6.35) were significantly higher than those who did not perform leisure activities (M = 5.06) using t (68) = 5.811 p <.05. Significant. The results of the Digit span backward of those who perform leisure activities (M = 3.97) were higher than those who did not practice leisure activities (M = 3.15). The t (68) = 4.647 p <.05 Significant As shown in Picture5.
The result consistent with researches in the past. Physical activities and mental activities all affect better cognitive performance of man (Scott McGinnis 2013), some
Spatial short-term memory Spatial working memory Phonological short-term memory Phonological working memory

Pim1st International Conference
June, 2018
N 23
CORSI BLOCK FORWARD CORSI BLOCK BACKWARD DIGIT SPAN FORWARD DIGIT SPAN BACKWARD
Physical Leisure Activities Mental Leisure Activities
research had found that running 45 minutes 4 times per week could help reduce the symptoms of Alzheimer and improves cognitive performance in memory (Alzheimer 's Association International Conference 2015) elderly people who exercise regularly help better mental. Reduce the illness about the disease of the blood vessels. The blood circulation is improved. The performance and brain better (Harvard, Health 2013).
Comparison of spatial short-term memory and spatial working memory of those who performed physical leisure activities and those who performed mental leisure activities using the Independent T-Test (Program R).The results of the Corsi Block Forward score of those who performed physical leisure activities (M = 6.12) were significantly higher than those who performed mental leisure activities (M = 6.12) using t (34) = 0.00 p> .05. The results of the Corsi Block Backward score of those who performed physical leisure activities (M = 3.88) were significantly higher than those who performed mental leisure activities (M = 3.35). 2.078 p <.05 significantly. Comparison of phonological short-term memory and phonological working memory of those who performed physical leisure activities and those who performed mental leisure activities. The results of the Digit span score of those who performed mental leisure activities (M = 6.29) were significantly higher than those who performed physical leisure activities (M = 6.41). = -0.438 p> .05. The results of the Digit span backward score of those who performed mental leisure activities (M = 3.65) were higher than those who performed physical leisure activities (M = 4.29). = -2.306 p <.05. As shown in Picture6.
The results of the comparison of working memory capacity of the elderly who
Picture 6: The PEBL scores of the elderly performed physical leisure activities and performed mental leisure activities.
performed various leisure activities in a manner consistent with past researches. Physical activity such as running on a regular basis will increase the performance.
Spatial short-term memory Spatial working memory Phonological short-term memory Phonological working memory

Pim1st International Conference
June, 2018
N 24
Hippocampus (Nokia et al., 2016). Research has shown that exercise improves the neurotropic factor, which in turn diverts the dendrites. The working memory system works better (Sleiman et. al., 2016). Research has confirmed that exercising will increase the amount of Acetyl Coline that will increase the working memory (Eckart et al., 2016). Exercise reduces glutamate. Working Memory Better (Timofeeva & Levin, 2011). Mental skill for example, meditation will increase the efficiency. And Brainstem Gray Matter (Singleton et al., 2014). Gray matter plays an important role in phonological memory which affects the memory of speech and language (Nouwens, Groen & Verhoeven, 2017). Digit Span Backward scores were positively correlated with grey matter brain size. (Li et al., 2012). Meditation routinely improves working memory (Mrazek et al., 2013). Meditation routinely improves mental retardation (Luders et al., 2015). Research has shown that playing brain games such as board games on a regular basis for 100 consecutive days improves critical thinking skills. (Schmiedek, Lovden&Lindenberger, 2010)
Conclusion
Age of elderly and short-term memory and working memory are negatively correlated. The elderly who usually perform leisure activities at least 1 hour per week have significantly higher spatial and phonological working memory capacity than the elderly who perform leisure activities less than 1 hour per week. The elderly who usually perform leisure activities emphasize on physical, at least 1 hour per week have significantly higher spatial working memory capacity than elderly who perform leisure activities emphasize on mental. The elderly who usually perform leisure activities emphasize on mental at least 1 hour per week have significantly higher phonological working memory capacity than the elderly who perform leisure activities emphasize on physical.
References
Allerhand, M., Gale, C. R., & Deary, I. J. (2014). The dynamic relationship between cognitive function and positive well-being in older people: A prospective study using the English Longitudinal Study of Aging. Psychology and aging, 29(2), 306.
Burzynska, A. Z., Jiao, Y., Knecht, A. M., Fanning, J., Awick, E. A., Chen, T., ... & Kramer, A. F. (2017). White matter integrity declined over 6-months, but dance intervention improved integrity of the fornix of older adults. Frontiers in aging neuroscience, 9.
Eckart, C., Woźniak-Kwaśniewska, A., Herweg, N. A., Fuentemilla, L., & Bunzeck, N. (2016). Acetylcholine modulates human working memory and subsequent familiarity based recognition via alpha oscillations. Neuroimage, 137, 61-69.
Federmeier, K. D., Kutas, M., &Schul, R. (2010). Age-related and individual differences in the use of prediction during language comprehension. Brain and language, 115(3), 149-161.

Pim1st International Conference
June, 2018
N 25
Hölzel, B. K., Lazar, S. W., Gard, T., Schuman-Olivier, Z., Vago, D. R., & Ott, U. (2011). How does mindfulness meditation work? Proposing mechanisms of action from a conceptual and neural perspective. Perspectives on psychological science, 6(6), 537-559.
Li, R., Qin, W., Zhang, Y., Jiang, T., & Yu, C. (2012). The neuronal correlates of digits backward are revealed by voxel-based morphometry and resting-state functional connectivity analyses. PLoS One, 7(2), e31877.
Luders, E., Cherbuin, N., Kurth, F., &Lauche, R. (2015). Forever Young (er): potential age-defying effects of long-term meditation on gray matter atrophy. Deutsche Zeitschriftfür Akupunktur, 58(4), 30-31.
Mella, N., Grob, E., Döll, S., Ghisletta, P., & de Ribaupierre, A. (2017). Leisure Activities and Change in Cognitive Stability: A Multivariate Approach. Brain sciences, 7(3), 27.
Mrazek, M. D., Franklin, M. S., Phillips, D. T., Baird, B., & Schooler, J. W. (2013). Mindfulness training improves working memory capacity and GRE performance while reducing mind wandering. Psychological science, 24(5), 776-781.
Mueller, S. T., & Piper, B. J. (2014). The psychology experiment building language (PEBL) and PEBL test battery. Journal of neuroscience methods, 222, 250-259.
Nokia, M. S., Lensu, S., Ahtiainen, J. P., Johansson, P. P., Koch, L. G., Britton, S. L., &Kainulainen, H. (2016). Physical exercise increases adult hippocampal neurogenesis in male rats provided it is aerobic and sustained. The Journal of physiology, 594(7), 1855-1873.
Nouwens, S., Groen, M. A., & Verhoeven, L. (2017). How working memory relates to children’s reading comprehension: the importance of domain-specificity in storage and processing. Reading and Writing, 30(1), 105-120.
Schmiedek, F., Lövdén, M., &Lindenberger, U. (2010). Hundred days of cognitive training enhance broad cognitive abilities in adulthood: Findings from the COGITO study. Frontiers in aging neuroscience, 2.
Singleton, O., Hölzel, B. K., Vangel, M., Brach, N., Carmody, J., & Lazar, S. W. (2014). Change in brainstem gray matter concentration following a mindfulness-based intervention is correlated with improvement in psychological well-being. Frontiers in human neuroscience, 8.
Sleiman, S. F., Henry, J., Al-Haddad, R., El Hayek, L., Haidar, E. A., Stringer, T., &Ninan, I. (2016). Exercise promotes the expression of brain derived neurotrophic factor (BDNF) through the action of the ketone body β-hydroxybutyrate. Elife, 5, e15092.
Sweatt, J. D. (2010). Epigenetics and cognitive aging. Science, 328(5979), 701-702. Timofeeva, O. A., & Levin, E. D. (2011). Glutamate and nicotinic receptor interactions in
working memory: importance for the cognitive impairment of schizophrenia. Neuroscience, 195, 21-36.

Pim1st International Conference
June, 2018
N 26
Toepper, M., Markowitsch, H. J., Gebhardt, H., Beblo, T., Bauer, E., Woermann, F. G., &Sammer, G. (2014). The impact of age on prefrontal cortex integrity during spatial working memory retrieval. Neuropsychologia, 59, 157-168.
Wongupparaj, P., Kumari, V., & Morris, R. G. (2015). The relation between a multicomponent working memory and intelligence: The roles of central executive and short-term storage functions. Intelligence, 53, 166-180.
วงศ ์ อุปราช, พีร, วงศ ์ อุปราช, &รังสิ ร ัศ ม์. (2015). 39 ปี ของ แบบ จ าลอง ความ จ า ขณะ ปฏิบัติการ: งาน วิจัย และ การ ประยุกต์. วารสาร วิทยาการ วิจัย และ วิทยาการ ปัญญา, 10(2), 1.

PIM 1st International Conference
June 21, 2018
N 27
CULTURAL AND SOCIAL FACTORS AFFECTING THE DECISION TO PURCHASE WEIGHT-LOSS SUPPLEMENTS AMONG WORKING-AGE GROUP IN MUEANG DISTRICT, SAMUT SAKHON PROVINCE
SantipapHanpakdee1, Palida Srisornkompon2, Wannapa Naburana3
and Sorachat Rangkaputi4
1234Faculty of Business Administration, Panyapiwat Institute of Management, Bangkok, Thailand
*Corresponding author, E-mail: [email protected] ABSTRACT The objective of this study was to investigate non-marketing factors including social and cultural factors affecting the decision to purchase weight-loss supplements among working-age group in Mueang District, SamutSakhon Province. Stratified sampling and purposive sampling were used to select the sample according to the selection criteria of participants of 15-60 years. The total sample size was 400 samples from 18 districts. 400 copies of questionnaires were distributed according to the proportion of population in each sub-district. Data were analyzed by statistical methods including frequency distribution, percentage and mean, standard deviation and the multiple regression analysis (MRA). The results of this study showed that 57.75% of respondents were females, while 42.25% were male. The majority of respondents were age 15-25 years old and workedas an employee in private companies. Almost of respondents graduated with a bachelor’s degree with monthly income of 15,001 - 30,000 baht. The research identified that the differences of demographic factors did not influence the decision to purchase weight-loss supplements among working-age group in Mueang district, SamutSakhon province. However, cultural factors such as culture in the work place and lifestyle influenced the decision to purchase weight-loss supplements at the significant level of 0.05 (p=0.000), (beta=0.412). Social factors including influence of word of mouth and social values affected the need of good shape and good personal appearance among working-age group in Mueang district, SamutSakhon province at the significant level of 0.05 (p=0.041), (beta=0.097).
Keywords: Purchase decision, working-age group, social factors, cultural factors, weight-loss supplements Introduction Food is a fundamental basis for human survival needs. It is necessary to consume food that provides adequate energy and nutrients for the body in order to be healthy and strong. Nowadays, human lifestyle is changing. People are living hastily. Eating healthy food and proper exercise has been overlooked. They increasingly consume processed food that

PIM 1st International Conference
June 21, 2018
N 28
contains useless-protein and high-fat. If they are continuously consuming this type of food, it can cause illness and medications cannot be treated. As a result, consumers start to think about their eating habits and taking more care of health. Several food and beverage supplements add nutrients such as calcium and vitamininto their products. This leads to the consumption of supplementary food and drinks are becoming more popular. This is because healthy and wellness trend become more popular in the market World today. According to Kasikorn Research Center (2017) noted that the market value of dietary supplements product in 2016 was around 53 Billion baht and would expect to reach 60 Billion in 2017. The target group was consumers between 15-45 years age group with a population of 32.2 Million. This target group wouldgrow continuouslyin 2018. This was because consumers between aged 15-45 years have a large-scale of purchase volume by 50 percent of the entire country. Moreover, dietary supplements for weight loss were 50 percent of the total dietary supplements’ consumption. Based on market analysis in 2017, dietary supplements business tended to expand cumulatively. People of all ages had become more health conscious and more aware of healthier eating habits as well as taking more dietary supplements. This trend assisted weight-loss supplements businesses to reach customers in other regions rapidly. Over the past few years, there were several new brands of weight-loss products existed in the market. People had more interest and respond to dietary supplements including a person who wanted to lose weight and wanted to have healthy skin (Kasikorn Research Center, 2017). Based on the above, researcher has realized the importance of non-marketing factors affecting the decision to purchase weight-loss supplements among working-age population. The working-age group paid more attention to health conscious and focused on increasing the beauty continuously by consuming dietary supplements for better health and nutrient adequacy. Therefore, researcher was interested to study the population of working-age group in Mueang District, SamutSakhon Province. It was anticipated that results and research findings could be useful in developing marketing plan and guiding entrepreneur about weight-loss supplements. It was also expected that this study could help consumer to select weight-loss supplements products responding to their needs. Research Objectives 1. To study the demographic factors affecting the decision to purchase weight-loss supplements among working-age group in Mueang Distric, SamutSakhon Province. 2. To investigate non-marketing factors including cultural and social factors affecting the decision to purchase weight-loss supplements among working-age group in Mueang District, SamutSakhon Province. Literature Review 1. Definition and Categories of weight-loss supplements

PIM 1st International Conference
June 21, 2018
N 29
Weight-loss supplements refer to a dietary supplements affecting body shape. Weight-loss supplements contain Hydroxycitric acid (HCA) that is found in Garcinia cambogia. HCA is a competitive inhibitor of ATP citrate lyase, which convert citrate into acetyl Coenzyme A. Some weight-loss supplements also contain chromium, which is an essential nutrient in trace amounts in human for insulin, sugar and lipid metabolism. In addition, categories of weight-loss supplements are fat burning supplements, metabolism boosters and chitosan supplements (Sitthiphiwboon, 2010).
There are several kinds of weight-loss products on the market today. An effective supplementsmeet the consumer needs differently. Hence, to provide various weight-loss supplements for consumer will divided into 6 categories as follows (Sitthiphiwboon, 2010): 1.1 Carbohydrates Blocker: This supplement can support weight loss goals by blocking the digestion of some of the sugars from carbohydrate rich foods. Carbohydrates blocking supplements contain white kidney bean extract that is proven to delay the digestion and absorption of carbohydrates. 1.2 Metabolism Booster: This weight-loss supplement will help to boost metabolism more efficiently. They can enhance fat burning, boosting digestion and using stored fat for energy. 1.3 Appetite Suppressant: This type of supplement classified as medications. They act upon the brain to help lower a person’s appetite and tricking the body into believing that it is not hungry. 1.4 Cortisol Control: Cortisol is a stress hormone released by the adrenal glands. High levels of cortisol lead to weight gain. Hence, this supplement will assist to lower cortisol levels. 1.5 Fat Burners: Fat burning supplements can reduce fat absorption. They are described as thermogenic supplements that can help burning fat in the body by producing heat through metabolic stimulation. 1.6 Vitamin: Some vitamin supplements such as vitamin C, is recognized to be extremely effective in helping to reduce weight as well as do no harm with the body. 2. Purchasing decision Theory (Punyapapassorn, 2008): 2.1 Attention: Consumers must know product and service before which happens when consumers intend to receive. 2.2 Interest: Knowing the product is not enough. Consumers need to be motivated until able to distinguish the product from others that available in the market. 2.3 Desire: Interest is stimulated until it becomes a desire to obtain the product. Usually, the desire arises from the benefits that product offers. 2.4 Action: When desire occurred, the final stage of buying process will be completed after consumers buy the product.

PIM 1st International Conference
June 21, 2018
N 30
2.5 Purchase Decision: Consumers use evaluation of alternatives to determine the preference between various products. Consumers will decide to purchase the most appropriate and favorite products. According to the concept of purchasing decision, it can be concluded that purchasing decision is the decision-making process used by consumers to decide upon what products or services to purchase. The relevant factors are product information, social group, customer attitude, time and opportunity as well as intention, interest, desire and action. 3. Cultural Factors Cultural factors are the binding of a group of people. They will learn their own culture under the social process. The needs and behavior of individual are determinate by culture. Sub-culture or tradition is also the characteristics of a particular group of people and related to social class in their society. Cultural factors can be divided into 2 categories (Kornblum, 1988): 3.1 Cultural background is the determination of individual needs and behavior. Since a child, culture is transmitted through surrounding society and is contributed to the values as well as the need in various products differently in each culture. 3.2 Sub-cultures or traditions are based on factors such as race, nationality, religion, urban and rural identification. Sub-culture are affected the behavior patterns of people in a group that differentiates itself from the parent culture to which it belongs. This affects purchasing and consuming behavior of individual differently. Therefore, when marketer want to sell product in local market, it is important to consider whether the local people need it or not. 4. Social Factors Social factors are influenced by the formal and informal relationship that affects consumer behavior. Belief and action are determined by the social influence toward buying decision process. The components are as follow: (Iamlaorpakdee, 2008) 4.1 Personal influence: Consumers buy is often influenced by attitude, opinion or personality-linked characteristic. This results in personal buying decision from market rules. 4.2 Thought leadership: The personal influence of thought leadership points out the importance of buying new product or changing location to purchase products or services. Marketers are often used a thought leadership as a symbol of new products too. 4.3 Word of mouth: It is actively influenced by talking from person to person. Word of mouth is considered to be the most powerful source for consumers because it links with acquaintances, trust, friend, relatives and etc. Word of mount has been acknowledged as a major influence on people opinion. However, the influence of negative word of mouth can cause the company to experience a decline in sale or even damage the company brand.

PIM 1st International Conference
June 21, 2018
N 31
Methodology Population and sampling 1. The population of the study were male and female age between 15 – 60 yearslived in Mueang District, SamutSakhon Province who have bought weight-loss supplement product at least once in the past year. 2. The research sampling were people who have bought weight-loss supplement product at least once in the past year. The target were included both male and female among working group age between 15 – 60 years who lived in Mueang District, SamutSakhon Province. The sample size was calculated by using W.G. Cochran formula with a 95% level of confidence and p-value of 0.05 (Wanichbancha, 2006). The total samples were 400 respondents. The selected multi-state random sampling were steps as follow. Step 1: Stratified random sampling was used by dividing population according to population proportion of each district. Township of Mueang District, SamutSakhon Province were comprised of 18 sub-districts. Step 2: Purposive sampling was used to select participant among working group aged 15 – 60 years who have bought weight-loss supplement product at least once in the past year both male and female that lived in Mueang District, SamutSakhon Province. Table 1: The number of population aged 15-60 years and the number of questionnaires distributed in each sub-district in Mueang district SamutSakhon province.
No. Sub-district in Mueang district SamutSakhon province
The number of population aged 15-60 years(%)
The number of questionnaires distributed
1 Maha Chai 12 51 2 ThaChalom 3 13 3 Krokkrak 2 8 4 Ban Bo 3 13 5 Bang Tho Rat 3 11 6 Kalong 2 7 7 Na Khok 1 6 8 Tha Chin 4 15 9 Na Di 10 41 10 Tha Sai 12 46 11 KhokKrabue 4 15 12 Bang Nam Chuet 5 21 13 PhanthaiNorasing 11 44 14 Khok Kham 9 35 15 Ban Ko 4 15 16 Bang Krachao 4 16 17 Bang YaPhraek 9 37 18 Chai Mongkhon 2 6

PIM 1st International Conference
June 21, 2018
N 32
Total 100 400 Source: The Bureau of Registration Administration, 2016, http://stat.dopa.go.th/stat/statnew/upstat_age.php Research Instrument
Questionnaire was used for data collection. The stage of questionnaire design was detailed as followed:
1. Secondary data such as marketing theory, books, documents and relevant research about factors affecting the purchasing decision of weight-loss supplements among working group in Mueang District, SamutSakhon Province were collected.
2. Questionnaires were designed from the concept framework of cultural factor, social factor, and influenced factor affecting the decision to buy weight-loss supplements among working group in Mueang District, SamutSakhon Province.
3. Questionnaires were submitted to supervisor for modification. 4. Modified questionnaires were submitted to expert for review (IOC=0.911). 5. Questionnaires were adjusted and submitted to supervisor. 6. 40 questionnaires were pre-tested to measure confidence rate in each part of
questionnaires. The measurement of confidence were 0.887 (cultural factor), 0.825 (social factor), and 0.883 (purchase decision).
7. 400 questionnaires were distributed. Questionnaires
In this research, the design of the questionnaire was divided into 2 sections. Section 1: The questionnaires were personal information of participant with close-ended response 5 questions included gender, age, occupation, salary and education. Section 2: The questionnaires with 15 questions were based on cultural factors, social factors and buying decision affecting the decision to purchase weight-loss supplements among working-aged in Mueang District, SamutSakhon Province by using rating scale method of Likert’s scale.
Data Collection and Analysis
The research was conducted by the following steps: 1. Calculating the number of questionnaires distributed to each sub-district according to the population proportion of 18 sub-district. 2. Distributing questionnaires to selected multi-state samples randomly and collecting answered questionnaires for further statistical analysis.
3. After collected data, researcher verified the accuracy and completeness of the questionnaires. 4. Responded questionnaires were coded and recorded in SPSS for analyzing data and testing hypothesis.

PIM 1st International Conference
June 21, 2018
N 33
Statistical Method
1. Descriptive statistics were used to describe personal information of respondents including gender, age, education, occupation and salary. These information will be shown in tables, percentage, mean and standard deviation (SD).
2. Inferential statistic were used to analyze Multiple Regression Analysis (MRA), T-test and ANOVA. Results
The aim of this study was to investigate cultural and social factors affecting the decision to purchase weight-loss supplements among working-age group in Mueang Distric, SamutSakhon Province. 400 questionnaires were distributed in 18 sub-district in Mueang district, SamutSakhon province. Respondents were 57.75% female and 42.25% male. The majority of respondents was age 15-25 years and worked as an employee at private company. Almost of respondents were graduated with a bachelor’s degree with monthly income of 15,001 - 30,000 baht (see Table 2). Table 2: Demographic profile of respondents
Variable Number = 400 Percentage Gender Male Female
169 231
42.25 57.75
Age 15-25 26-35 36-45 46-60
150 145 48 57
37.5 36.25
12 14.25
Occupation Employee Labour Officer Business owner Maid
125 101 93 93 36
31.25 25.25 23.25 23.25
9 Salary Less than 15,000 15,001-30,000 30,001-45,000 More than 45,001
21 210 160 9
5.25 52.5 40
2.25 Education Lower than bachelor Bachelor degree Higher than bachelor
17 320 63
4.25 81
15.75

PIM 1st International Conference
June 21, 2018
N 34
The analyzing of cultural factors indicated that the overall scale of cultural factors were mostly significant (mean = 4.80).To considering variable individually, the highest mean scale was culture in the workplace (mean = 4.83), second was the values of most residential community (mean = 3.81) which was equal to the residential lifestyle (mean = 3.81), third was other national cultures’ such as Korean or Western culture (mean = 3.79), and the lowest scale was the difference of race and language (mean = 3.75) The analyzing of social factors showed that the overall scale of social factors were mostly significant (mean = 4.75). To considering each variable individually, the highest mean scale was the influence of word-of-mount (mean = 4.79), second was the influence of family members (mean = 4.77) which was equal to the popularity of good personal appearance, third was the decision to buy weight-loss supplements because of celebrities, actors, actress and net idols (mean = 4.76), and the lowest scale was the social popularity of beauty and healthcare (mean = 4.64). The analyzing of levels of purchase decision in buying weight-loss supplements demonstrated that the overall scale of purchase decision were mostly significant (mean = 4.86). To considering each variable individually, the highest mean scale were time period and payment procedure (mean = 4.90), second was favorite seller (mean = 4.89), third was favorite brand (mean = 4.84), and the lowest scale was quantity of product (mean = 4.75).
In order to test the study’s hypotheses, a series of regressions were used to analyze the relationship between the predictors and the dependent variables. The results of analyzing demographic factors could be stated that the differences in gender, age, occupation, monthly income, and education were not affected the decision to purchase weight-loss supplements. However, there were significant differences among cultural and social factors on the decision to purchase weight-loss supplements (p<0.05)(see Table 3).The value of beta Coefficient in cultural factors was equal 0.412 and social factors was equal 0.097. Table 3: Regressions of determinants of decision to purchase weight-loss supplements
Predictors B Beta t Sig
Cultural factors .227 .412 8.30 .000
Social factors .079 .097 1.90 .041
Adjust R 2 = .641, F = 35.201, p <0.05 Discussion The research results showed that cultural and social factors including culture in the workplace and influenced of word of mount have positive influenced on the needs of good shape and personal appearance. This finding was compatible with findings of Siriwan Lertsuchartwanitand MonthaKengkarnpanich (2007) studied food supplement consumption

PIM 1st International Conference
June 21, 2018
N 35
behavior for weight control of public health personnel in Ratchaburi province. The resultsal so indicated that the popularity of social factors such as beauty and healthcare have influenced the decision to purchase weight-loss supplements of consumers. This finding was correspond to the study of SukanyaReangklau (2011) noted that the decision to purchase weight-loss supplements will more likely influence consumers on the needs of good shape and good personal appearance as well as good quality of the product. The effect of culture at the work place was also influenced working-age group to look after their shape and personal appearance. The results was also related to the finding of Wilailuk Thongpun (2003) studied satisfaction and behavior toward beauty aids dietary supplement products consumption of consumers in Bangkok metropolitan area. The author stated that even quality and price were affected the decision to purchase weight-loss supplements, workplace culture was also affected. Conclusion Based on the results of analysis and the interpretation, it can be concluded that there were no significant differences in demographic factors on the decision to purchase weight-loss supplements among working-age group in Mueang Distric, SamutSakhon Province. The effect of cultural factors were significant on the decision to purchase weight-loss supplements among working-age group in Mueang Distric, SamutSakhon Province (p=0.000), (beta=0.412). The effect of social factors were significant onthe decision to purchase weight-loss supplements among working-age group in Mueang Distric, SamutSakhon Province (p=0.041), (beta=0.097). Recommendations
This study has investigated the cultural and social factors affecting the decision to purchase weight-loss supplements among working-age group in Mueang Distric, SamutSakhon Province. This has demonstrated the relationship between demographics and non-marketing factors in purchasing decision of weight-loss supplements. Therefore, it could be recommended that entrepreneurs and food supplements businesses could be able to use this information for planning and marketing strategies in order to offer appropriate promotion and price for target customers. Knowing customer insights such as behavior, culture and values will assist businesses to reach and attract target customers. Moreover, from the results of this study, entrepreneurs should emphasis their communication strategy by trying to create word of mouth which directly preferred by respondents in this study. In terms of word of mouth strategy, entrepreneurs may need to set up company’s presenter who is representative of taking their weight-loss supplementswhich is able to motivate consumers purchase decision in terms of quality, safety as well as affordable price. For future studies, authors suggest that: (1) In this research, two factors have only been tested

PIM 1st International Conference
June 21, 2018
N 36
on purchasing decision. Researchers can examine other factors affecting the decision to purchase weight-loss supplements. (2) By extending this study to other areas, we can reach to better results and understanding about the decision to purchase weight-loss supplements of people. (3) Including online shopping behavior in conceptual framework could show better dimension of the decision to purchase weight-loss supplements. References Iamlaorpakdee, P. (2008). Marketing management. Bangkok: Tanapress Kornblum, W.(1988).
Social roles. Accessed online 20/10/2017, https://royercenter.cwc.psu.edu/ Faculty/blended.aspx
Kasikorn Research Center. (2017). Healthy Product: create a business opportunity. K SME Analysis. Accessed online 12/09/2017, https://www.kasikornbank.com/th/business/ sme/KSMEKnowledge/article/KSMEAnalysis/Documents/HealthyProduct.pdf Lertsuchartwanit, S. & Kengkarnpanich, M. (2007). Food supplement consumption behavior for weight control of public health personnel in Ratchaburi province. Journal of Health Education, 30(105), 31-44. Punyapapassorn, N. (2008). AIDA model. Accessed online 15/10/2017,
http://www.punyapapassorn.blogspot.com Reangklau, S. (2011). Factors influencing purchase decision of the wealthy slimming diet product of consumers in Pathum Thani. (Master dissertation). Faculty of Management, Rajamangala University of Technology Thanyaburi, Retrievedfrom
http://www.repository.rmutt.ac.th/bitstream/handle/123456789/1138/132458.pdf Sitthiphiwboon, P. (2010).Brain foods. Bangkok: AksornNguen Dee Publisher.
The Bureau of Registration Administration. (2016). Official statistics registration systems. Accessed online 15/10/2017, http://stat.dopa.go.th/stat/statnew/upstat_age.php
Thongpun, W. (2003). Satisfaction and behavior toward beauty aids dietary supplement products consumption of consumers in Bangkok metropolitan area. (Master dissertation). Graduate school. Srinakharinwirot University, Retrieved from http://thesis.swu.ac.th/swuthesis/Mark/Wilailuk_T.pdf Wanichbancha, K. (2006). Statistic for research. 2nd Edition: Chulalongkorn University Press.

PIM 1st International Conference
June, 2018
N 37
CUSTOMER SATISFACTION EVALUATION AND IMPROVEMENT: A CASE STUDY OF ZTO EXPRESS COMPANY
XIAO QIANGUO1, Dr. Zhongwu Li2
1CMBA,Chinese Graduate School,Panyapiwat Institute of Management 2Finance , Panypiwat Institute of Management
*Corresponding author, E-mail:[email protected], [email protected]
ABSTRACT In recent years, the logistic express delivery industry in China has developed rapidly. In
addition to the Chinese Post Company, there are many private and local express delivery enterprises. At same time, the international express delivery giants have also tightened their paces to occupy Chinese express delivery market, making the competitiveness in logistic express delivery industry intensively. Therefore, if a logistic express delivery company wants to gain more economic benefits in the market and makes itself be able to develop sustainably, it is very important to understand its own needs and expectations of customers.
This study takes the customer satisfaction evaluation system of ZTO express company as the research case, and uses factor analysis to investigate the main factors affect the customer satisfaction evaluation system of ZTO express company. The innovation in this study is to use 7-dimensional factors and further divided into 20 indicators at the Third-level dimension to measure the scores of customers’ satisfaction levels for each indicator. Finally, this study suggest related improvement strategies on customer’s satisfaction.
Keywords: Factor Analysis, ZTO express Customer satisfaction, Customer satisfaction
evaluation

PIM 1st International Conference
June, 2018
N 38
Introduction
Under opening up of Chinese economy and further reform of the economic globalization, along with the development of international trade and information technology, the global economics and international trade have been inseparable and the dependent on each other increased more. As the result, the logistic express industry has gradually become one of the most important industries in China. In order to meet the needs of logistics and courier of network under the consumptions via B2C and C2C business model associated with advanced network technology, more and more Express Courier and Logistics Technology Services enterprise have been established. So, under the demand for the expansion of trade in services industry and the global economic integration, the logistic industry occupies the important position in the world economic arena, and has strong vitality and good prospects for market development. In China, the express couriers continue to grow and achieve remarkable results. These express couriers has made important contributions to the growth of the national economy in terms of accelerating the circulation of commodities, promoting foreign trade and service in all walks of life, satisfying the consumption of consumers, upgrading the tertiary industry and expanding the employment of the population. However, how should the logistic industry could catch up with these new opportunities and meet new challenges has become the focus of widespread concern in the society. Express Couriers’ service has developed into one important service industry indispensable to the world economy (2014, Fan Xin). In recent years, under the rapid development of China's private logistic express enterprises, there have been many powerful and evenly matched up with the stated-owned postal delivery companies, such as SF Express Limited (hereinafter referred as SF Express), ZTO Express Limited (below Referred as ZTO), Yun Da Cargo Co., Ltd., Every Day Express Co., Ltd., STO Express Limited and so on. In this rapid development process, the logistic express industry also has the problems existed, such as slow arrival time, defected goods, safety of delivery, customer complaints, dissatisfaction of buyers. All these problems have become the common concern of the private logistic express industry (2010, Sarula). Recently, the survey shows that in China's private logistics express industry, the problems of lack of awareness of management quality, low awareness of staff service and low overall customer satisfaction have been emerged (China Association of Warehousing, 2007). Therefore, the current study try to research on that how private logistic express companies can improve their service levels, enhance their customer satisfaction and improve their competitiveness. In this study, the ZTO has been used as the case of current research and the research questions are the ZTO’s customer satisfaction rating levels.

PIM 1st International Conference
June, 2018
N 39
There are two research questions: First, how about customer of ZTO to assess the customers’ satisfaction? Second, how to improve the levels of customer satisfaction of ZTO? Literature Review 1. The Concept of Customer Satisfaction
The customer satisfaction as defined by Kotler and Keller (2011) is: the perceived satisfaction or disappointment of the customer's perception of the product or service outcome compared between what he or expects and what he or she really received or recognized. The difference of perceived satisfaction or disappointment focus on the post-consumer process. Customer satisfaction theory studies the relationship between customer perceived value and customer expectation value. When the perceived value is less than the expected value, the customer will feel dissatisfied and conversely will be satisfied (Huo Yingbao, 2010). 2. Customer Satisfaction Index Model
2.1 Sweden Customer Satisfaction Barometer (SCSB) model Sweden (SCSB) model is the earliest established national customer satisfaction index
model. There are two leading indicators in this model: the customer's expectations of the product or service; and the customer's perception of the value of the product or service. The dependent variables of customers’ satisfaction in this model are customer complaints and customer loyalty. Loyalty is the final dependent variable in the model as it can serve as a retention factor for customers so as to effect corporate profits (Xue Yun, 2016). However, when the model is applied, which leading indicators is the most important and how to measure them is the main problem under this model.
2.2 The United States ACSI customer satisfaction index model (ACSI) Based on the Swedish Customer Satisfaction Index Model (SCSB), ACSI model has a total
of six structural variables, customer satisfaction is the ultimate dependent variable, customer complaints and customer loyalty are independent variables. Meanwhile, the expected quality, perceived quality and perceived value of customer satisfaction are independent variables (Lin, 2005). Even in this model, the Perceived quality is added into the model, this model is only useful for the macroeconomic situation.
2.3 European Customer Satisfaction Index (ECSI) model The ECSI model inherits the basic structure of the ACSI model and some core concepts
such as customer expectation, perceived quality, perceived value, customer satisfaction and customer loyalty with some amendments. The main features of the ECSI model are: the customer complaint variable is eliminated in the ACSI model and adds another independent

PIM 1st International Conference
June, 2018
N 40
variable: the corporate image. In terms of the differences of measurement between the models, the ACSI model only measures the product quality and service quality for the durable goods after 1996. But, in the ECSI model, the difference on perceptual quality is used to judge satisfaction of customers on the quality of products and service (Zhao 2003). As the addition of model variables and the relationship between variables, these variables have different strengths in different countries and different industries
2.4 SERVQUAL model The SERVQUAL model (Parasuraman. A, Zeithaml V.A and Berry L.L., 1985) breaks down
the quality of service into five dimensions: Tangibles, Reliability, Responsiveness, Assurance, and Empathy. Each dimension is broken down into Questionnaire approach by allowing customers to rate the expected, actual, and lowest acceptable values for each question. The model uses five different scales to evaluate the quality of service of different services accepted by consumers. (Sara, 2010).
2.5 China Customer Satisfaction Index CCSI model Tsinghua University takes Chinese market features into consideration and presented a
model of customer satisfaction index in China. This model is the model of causality and composed of 6 structural variables and 11 causal relationships. Among them, perceived quality, perceived value, expected quality, brand image are the independent variables of customer satisfaction and customer loyalty is the dependent variable on customer satisfaction. CCSI model is basically a combination of ACSI and ECSI models, but the structural variables in CCSI model are different to the corresponding dependent variables in other two models, so, CCSI model combines the corporate image, the hardware and software quality into the perceived quality, remove the customer complain as one structural variable. The dependent variable of Customer Satisfaction are based on four independent variables (Liu Xin Yan, Liu Yan Ni, 2003). Research Objectives
In recent years, the development of the private logistic industry has been gradually accelerated in China, especially with the advancement of e-commerce B2B, B2C, and C2C businesses, the express delivery service in private logistic industry has been booming and the existing problems have gradually emerged. The current study try to research on that how private logistic express companies can improve their service levels, enhance their customer satisfaction and improve their competitiveness. In this study, the ZTO has been used as the case of current research and the research questions are the ZTO’s customer satisfaction rating levels. Research Methodology

PIM 1st International Conference
June, 2018
N 41
1. Factor Analysis Factor analysis is the procedure in which some internal dependencies of the research
variables with complex relationships are summarized into a few and multivariate statistical factors. The basic idea is to classify the observed variables and related variables into the same class. The different correlation levels between variables are classified into different classes: variables with high correlations are categorized into same class. So, each class of variables is actually a public factor, which represents a basic structure. So, for the research problems, Factor analysis method is used to describe common factors by using the least numbers of variables observed but cannot be measured and predictable via linear functions (Zhang Zhen, 2016). 2. Research Design
Quantitative research is a measurement of things that can be quantified part of the analysis. This study selected samples, used standardized tools and procedures that have been tested to capture the data. It summarizes the previous literature based on the ACSI model, combined with the SERVQUAL model to improve and establish ZTO’s own evaluation aspects of customer satisfaction so as to design the questionnaire to solve the first research question. Through the quantitative analysis of the data of the questionnaire, current study also found out the existing problems existing in ZTO’s customers, as well as analyzes the causes of problems and present possible remedy to solve the second research question.
2.1 Customer Satisfaction Evaluation Indicators of ZTO Based on the prior studies, this study follows the principles of controllability, testability,
timeliness, and systematicity. The customer satisfaction evaluation indicators of ZTO are built based on the six structural variables of the Chinese Customer Satisfaction Index CCIS model (expected quality, brand image, perceived quality, perceived value, customer satisfaction and customer loyalty), also, according to the dimensions of SERVQUAL model of reliability, security, responsiveness, tangibility, empathy, this customer satisfaction evaluation indicators of ZTO combined with the characteristics of the private logistic express companies' service with the characteristics of the customer groups. This model includes seven dimensions of service content, service method, service quality, service price, service remedy, employee quality, and brand image. All are defined as following:
(1) Service content. Including ordinary express delivery services and additional value-added services. Ordinary express delivery services refer to the same-city express delivery in China and international express delivery. Additional value-added services include pay-to-order

PIM 1st International Conference
June, 2018
N 42
services, pick-up services, warehousing services, return of orders, payment collection, warehouse with electronic order and insured services.
(2) Service mode. Including order receipt, cargo tracking and inquiries, take goods at doors, fixed-point self-services.
(3) Quality of service. Including delivery in time, punctuality of arrival, the length of transit time of goods , the integrity of the goods (no loss of quantity, no damage of quality), security of delivery (identity confirmation, unpacking inspection, etc.).
(4) Service price. Including the fair and reasonable delivery prices, reasonable additional prices (such as bills, packaging and other value-added service fees), prices and competitive prices compared with competitors.
(5) Service remediation. Refers to the processing speed and results of customer complaint and remedy.
(6) Staff quality. Including whether or not the staff's attitude to the customers is enthusiasm, the communication is good, the personal business skills and operations are standardized.
(7) The brand image includes the environment of company's business sites, company employees' dress, advertising and easy to use the corporate website, and company promotions. IV.2.2 Customer Satisfaction Evaluation System of ZTO According to Customer Satisfaction Evaluation Indicators of ZTO, The Customer Satisfaction Evaluation System with a three-level index was constructed. The First-level indicator of this evaluation system is the ZTO’s customer satisfaction index, which is the overall customer satisfaction evaluation result. The second-level indicators are divided into 7 dimensions: service content, service method, service quality, service price, service remediation, employee quality, and brand image. The 7-dimensional factors are further divided into 20 dimensions which serves as the Third-level indicators. As shown in Table 4.1 below. In the questionnaire design, the 20 third-level indicators were properly described and converted to easily understandable questionnaire questions. After the questionnaire was released, the data for calculating customer satisfaction was obtained. Result and Discussion 1. research statistics
Based on the ACSI model and the SERVQUAL model, some indicators are integrated and improved under the actual situation of Chinese logistic express courier companies. 418 samples were surveyed and a quantitative analysis of 392 valid questionnaires led to a solution to the first research question. Among these 392 samples, there were 66.58% female customers and

PIM 1st International Conference
June, 2018
N 43
33.42% male customers; according to customers ‘jobs, 41.07% were office workers; 30.10% were students; 10.71% were Teachers; classified by their ages, 57.91% were among 18 years to 30 years old and 32.14% among 31 years to 50 years old)
The result of the analysis shows that ZTO’s customer satisfaction Index CSD equals to Σ iWiXi, which is 3.58 in current study, and if it is converted to percentile, the percentage of customer satisfaction of ZTO is 71.6%, belonging to the category of "General Satisfaction" to "Satisfaction". So, ZTO’s service basically satisfy its customers, only part of the weak aspects still be needed to be recognized, and continuous improved. These results were presented in Table 1. 2 . Recommendations ZTO’s Customer Satisfaction Levels Improvement
The seven dimensions of evaluation for ZTO’s customers’ satisfaction are service content, service mode, service quality, service price, service recovery, staff quality, brand image, and 20 specific evaluation indexes. Through the results of 20 indicators, the scores for factors of employee quality, brand image, service remedy are slightly lower. Therefore, this study summarizes the following aspects and presents suggestions for improvement measures for ZTO’s customers’ satisfaction evaluation system.
Table 1: Customer Satisfaction Evaluation System of ZTO First-level
indicators
Second-level
indicators Third-level indicators
Customer
Satisfaction
Degree Indexes
Service Content
General Courier Service
Additional value-added services (such as payment service, night delivery, packaging service, etc.)
Service method
Order acceptance (such as business order orders, 400 hotline orders, network orders, etc.)
Cargo tracking inquiry
Take delivery of goods at doors
Fixed point self-service
Quality of service
Delivery on time, arrival on time
The length of transit time of the goods
The integrity of the goods (no loss of quantity, no damage to quality)
Delivery security (identity confirmation, unpacking inspection, etc.)

PIM 1st International Conference
June, 2018
N 44
Service price
Fair and reasonable delivery prices
Reasonable additional costs (such as bills, packaging and other value-added service fees)
Prices and competitive prices compared with competitors
Table 1: Customer Satisfaction Evaluation System of ZTO (continued)
Service Remedy
The processing speed and results of customer complaint
The processing speed and results of customer remedy
Staff quality
Employees' enthusiasm and good communication
Personal business and operations skills,
Brand Image
The environment of company's business sites
Company employees dress
Advertising and easy to use the corporate website
Source: Fan Yi (2014). Yuantong Express Customer Satisfaction Evaluation and Improvement Research. Fuzhou University
2.1 Staff and Brand image First, it is necessary to strengthen staff training and improve the recruitment standards for
new employee, as well as to carry out training examinations for trainees, so, those employees with relevant qualifications can be recruited. Through regular training courses, employees are continuously energized again and acquire new skills, thereby, to improve their overall quality.
Second, ZTO should reinforce the enthusiasm of staff attitude. Staff attitude has a direct impact on customer satisfaction. Employees have not only the spirit of hard-working and courageous dedication, but also can endure hardworking and tiredness. At the same time, ZTO will also get the appropriate return. In order to have a breakthrough in the business, ZTO must take courageous dedication, customer recognition, and proactive sense of service awareness and good attitude of service into consideration. As a result, customer trust can be obtained, and ZTO finally be rewarded by profits from these loyal customers.

PIM 1st International Conference
June, 2018
N 45
As a good staff of ZTO, he or she must have corresponding ability and quality, but and can be verified by his or her performance from customers’ evaluation system to enhance the essential ability and qualify.
2.2 Build Brand Image ZTO need to standardize the external image for the frontline workers. Dress of workers
must be uniform and clean. These workers also should have professional norms, polite civilizations, and strong sense of time. These measures will give customers a good experience of consumption or post-service feelings, leaving a good impression to customers, as the result, it will be a good the brand experience for consumers.
ZTO also must pay attention to the image of environment of the business’s outlets. These outlets must always be kept in the beauty and clean, especially when customers use fixed point self-service, they may unwittingly notice the overall business environment, which also affect the brand image.
2.3 Service remedy The score of service remedy in the ZTO’s customer satisfaction indicators also is low.
Therefore, ZTO should pay attention to this aspect and improve it. If ZTO can properly handle customer complaints in time, then this process would leave a responsible image to customers, and increase customer satisfaction. ZTO has to do a good job in the process of service remedy which involves in the complaint of the customers, the responsible direct leaders and front-line staff. ZTO needs to link these three elements together to solve the customers’ complaints. It is not unusual for these three elements to have some conflicts with each other. For example, even if customers are compensated, they still feel that the company does not seriously address their service complaints, also, even if the customers point out that where or which the service procedure needed to be improved, the customer service staff sometimes interpret these opinions as the negative responses, finally, even if there are negative comments from customers, the direct leaders may act to cover these complaints indirectly. However, the complaint customers mostly concerned about whether or not their feedbacks are treated fairly, so, the service remedies should be effective so as to enable these customers feel not being disrespected. These customers also want to know that whether or not their problems can be solved in time. Meanwhile, they may want to know the reason why these mistakes happened and what measures the ZTO will take to prevent the recurrence of these mistakes. All remedy or compensations must be made according to the law claims. In the newly revised "Postal Law of the People's Republic of China" in October 2012, it was mentioned that when there is an insured mail, and the mail is lost or destroyed fully, the express courier service

PIM 1st International Conference
June, 2018
N 46
provider needs to pay the insured in full; and when customers' mails are partially damaged, the courier service provider will be compensated according to the insured amount and the actual loss. In the case of not insured mail, when customers' mails are lost, missing or damaged, the express courier service providers only compensate customers according to the actual loss, but the compensations will not exceed three times on the courier freight charges (Postal Law of the People's Republic of China, 2012). As customer complaint always derivate from the difference between customers’ expectation and their real experiences (Richard Oliver, 1981), therefore, the express delivery companies needs to develop a clear and specific service standards to effectively eliminate the customer's fuzzy expectations, so that express delivery service has a strong measurability. Paying the claim according to the law and tracking the whole process through the service remediation, the service manager can summarize a series of problems that need to be solved in the service system. Both problems can be corrected in time, try to avoid later. But also make the loss of customers get reasonable compensation, improve customer satisfaction.
2.4 Integrated Managerial Aspects ZTO must identify the real customers, and treat the relationships between business and
customers correctly. To realize this point, ZTO should establish a database of customers’ information. This is the basis for maintaining long-term and stable relationships with ZTO’s customers. Customers’ data can not only help ZTO to understand the needs of customers, preferences and some other important information, but also to provide ZTO with the right products or services. At the same time, these customers’ information in the database, which included related products and services information, mail address, telephone numbers, etc., can be used to improve the communications with customers, and gradually establish long-term and stable relationship with customers. In order to meet various needs from different types of customer, ZTO should classify its customers into different classes and manage these classes strategically. From the evaluation process of customer satisfaction, ZTO knows that most of the clients are women, and most of them are office workers and students. According to each customer’s consumption of service value, compared with the total profits of ZTO, which is the proportion of profit contributed to ZTO, ZTO can divide its customers into three categories A, B, C, and select prominent personalities of the customers, then, design different programs of services corresponding different customers in the three categories. Eventually, customers are satisfied, and then they will continue to use ZTO’s services, so, these “repeat customers” can bring the corresponding profits to ZTO.

PIM 1st International Conference
June, 2018
N 47
Beside the database and classification of customers, ZTO must the implement the concept “customer coming first”. ZTO should strengthen “customer coming first” concept among employees to establish the concept of the supremacy of customers from the beginning points. ZTO’s staff must fulfil their duties sincerely for customer service, customer-centric, and always do their best in the sake of the guests. These staff must establish honest attitude, and treat customers with the intention, especially for special customers. Also, ZTO’s services must meet the requirements of the guests maximally so as to establish a sense of service, to grasp the guest’s information, and ensure customer satisfaction, improve and cultivate long-term customer loyalty. In addition to the concept of “centric customers”, ZTO also must meet the potential needs of customers. By analyzing problems, solve the problems, then analyze the causes of these problems, ZTO can provide services higher than that customers’ expectations. Only the "customer satisfaction" can reflect the value of the services. The first-class service is "one more step for the customer to meet and surpass the expectation of the customer". To keep in touch with customers is the most effective way to win customer loyalty and also a “magic weapon” to enhance service values. A sustainable business and profitable business model is to provide customers with two products which will never be eliminated: First, meet the customers’ needs humanely, the second is to give the customer's sincere respect and cares. As long as customers receive the sincere care and respect, these customers will find ways to payback to this business.
Further, ZTO also should investigate customer satisfaction continuously. The survey of customer satisfaction is an important part of helping enterprises to understand customer needs, the company's products or services, management, marketing and some other aspects. So, ZTO can better know the relationships between customer satisfaction Index, customer satisfaction factors and customer spending behavior, and then achieve the goal to minimize costs and improve customer repeat buying rates and corporate profitability (Yuan Quan, 2012). No matter what companies, these companies will have customer-oriented strategies and with different customer groups. To gain the trust of customers, and get consumers’ approval, these companies need to strengthen their management on the products and services according to the customers’ needs, improve some of the quality of the products and services, as well as solve the problems. Therefore, the customer satisfaction survey will become a very important task.
Through surveys of customer satisfaction, companies can find out the key factors affecting customer satisfaction, and improve the quality of business services, to enhance customer purchasing power, competitiveness and profitability. Occasional customer satisfaction

PIM 1st International Conference
June, 2018
N 48
surveys do not adequately address corporate issues and improve the company's service levels. The improvement of service levels must be continuous, regular and targeted. Conclusions
From the survey of satisfaction evaluation indicators, brand image satisfaction score is the lowest, lack of staff quality and non-standardized services affect the company's image and brand building, which hinder the development of enterprises to some extent. At same time, the service price in the survey of satisfaction evaluation is relatively high, it shows that the service price is an advantage of ZTO. Other aspects score in the "general satisfaction" to "satisfaction". The service complaints and claims are processed inefficiently and ineffectively for ZTO. ZTO also received more complaints from customers, but in most cases, ZTO did not response and solve these complaints immediately. Therefore, ZTO must reinforce its measures on customer complaints, cust omer claims and strengthen its efforts to improve customer satisfaction. References Fan Xin (2014). Yuantong Courier Company Customer Satisfaction Evaluation and Improvement Research (Master's thesis). Fuzhou University Huo Yingbao. (2010). Customer Satisfaction Evaluation Theory and Applied Research. Nanjing: Southeast University Press. Lin Hui. (2005). Causal and causal test of ACSI model. Statistics and Decision, 2, 22-33. Liu Xin-yan, Liu Yan-ni. (2000). Customer Satisfaction Index CSI Model Review, Economic Management, 21 (8), 11-17. Saralah (2010). Customer Satisfaction Research on Private Courier Services - A Case Study of Express Service Provided by Taobao Merchants (Master's Thesis). Beijing Jiao tong University XUE Yun. (2016). Research on Customer Satisfaction of ZL Corporation. University of Electronic Science and Technology (Master's thesis). University of Electronic Science and Technology of China Xie Meihua. (2005). A Brief Discussion on Quantitative Research Methods and Its Application in Educational Research in China. Jiangxi Normal University Kotler, Philip, Keller, Kevin Lane 2011. Marketing Management. 14th Edition. Pearson Education. Yuan Quan (2012). Research on the Third Party Logistics Customer Relationship Management. Logistics Business Theory, 3, 10-22. Zhang Zhen. (2016). Construction and Application of Customer Satisfaction Measurement Model in Online Shopping Courier Service. Guangdong University of Foreign Studies Zhao Ping. (2003). China Customer Satisfaction Index Guide. Beijing. Beijing Standard Press.

PIM 1st International Conference
June, 2018
N 49
China Warehousing Association (2007). The 6th China Logistics Market Survey Report [EB / OL]. Retrieved from: http://www.caws.org.cn/. Richard Oliver. (1981). Effect of Satisfaction and Its Antecedents on Consumer Preference and Intention. Advances in Consumer Research, 8, 88-93. State Post Bureau of the People's Republic of China. "Postal Law of the People's Republic of China" [BE / OL].

PIM 1st International Conference
June 21, 2018
N 50
FACTORS AFFECTING CONSUMER ADOPTION OF MOBILE BANKING SERVICE: A CASE STUDY IN KATHMANDU, NEPAL
Sabina Bade1, Pithoon Thanabordeekij2, Thammawich Siripahanupong3
International College, Panyapiwat Institute of Management *Corresponding author, E-mail: [email protected]
ABSTRACT
This study aims to understand the factors affecting consumer adoption of mobile banking services in Kathmandu, Nepal. It also intends to find out the relationship of social and psychological factors in adoption process. Widely used TAM model was integrated with social capital theory and social cognitive theory to develop the research model. Required data was collected using the questionnaire from 450 (94.44% response rate) Nepalese banking customers. Multiple linear regression was conducted to test and validate the proposed model. Almost all the variables (institutional trust, social participation, self-efficacy, perceived usefulness, perceived ease of use) have significant impact on mobile banking adoption except for social trust. Both practical and theoretical implications for the bankers, practitioners and researchers are discussed in the concluding section.
Keywords: Mobile Banking, Consumer Adoption, Kathmandu, Nepal
Introduction
Given the fact that 53% of the world population is on internet which is more than half of the world, it is normal for business entities to reach out to them through various online channels (Statista, 2018). Banking industry has also been one of the industries which have been affected by the internet revolution. Popularly known as e-banking, it refers to the banking where a customer can access his or her bank account via the internet using personal computer (PC) or mobile phone and web-browser. It has allowed the bank customers to perform transactions such as writing checks, transferring funds, paying bills, printing statements and inquiring about account balances. Today, internet banking has evolved into a “one stop service and information unit” that promises great benefits to both banks and consumers (Tan, Margaret and Teo. Thompson S.H., 2000). With the increase in the use of various electronic channels for providing banking services to the consumers, the importance of traditional brick-and-mortar branch networks is rapidly diminishing (Suoranta and Mattila, 2004).
The number of mobile banking users worldwide reached 1.8 billion in 2017, and more than 2 billion mobile phone users will have made used of their mobile devices for

PIM 1st International Conference
June 21, 2018
N 51
banking purposes in 2018 representing 40% world adult population (Juniper Research, 2018). This growth in mobile banking has been said to be triggered by the consumer adoption of banking apps. According to (Global Financial Inclusion Database, 2014, Bostwana dominates the list of top users of mobile banking accounting 45% of account holders making a transaction using mobile phone.
In the context of Nepal, there is tremendous increase in the use of internet over the past years. According to (MIS Report, Dec 2017), 63.17% of the total population is connected to the internet. Cell phones are said to have been the main cause of Nepal’s internet adoption with 95.62% of the population living within the range of a mobile tower. Similarly, availability of browsers and data connection even on inexpensive phones has also contributed in this internet revolution. Knowing the potential benefits of mobile banking, today around 46 commercial and development banks provide mobile banking service in Nepal. According (Banking & Financial Statistics, Mid-Dec 2017) of Nepal Rastra Bank the number of mobile banking users has reached to 2.9 million.
Because of the immense advantage in terms of customer satisfaction and loyalty and cost reduction, banks seem to embrace this new technological innovation. However, the growth of mobile banking has declined below the expectation level and numerous researches have been conducted to investigate the factors that explore the adoption and use of mobile banking. (Sullivan, D. and Bauerschmidt, A., 1989) argued that testing concepts in different economic, political, cultural, and institutional settings creates the contextual meaning for evaluating the robustness of prevailing theories. Therefore, the objective of this study is to examine the factors that differentiate individuals in Nepal with strong intentions to adopt mobile banking from others.
Literature Review
By integrating three theoretical frameworks: Technology Acceptance Model (TAM), Social Capital Theory and Social Cognitive Theory, the proposed conceptual framework was derived.
Social capital theory
Coleman explains social capital as direct and indirect resources that are a by-product of social networks and social support systems amongst family, friends or community members. (Coleman. J. , 1990). To simply put, social capital means social networks, and it has been proven fact that social networks have value. The social bond with family, friends, neighbors, colleagues, and acquaintances all falls under social capital. Moreover, networks in virtual communities are also a form of social capital. Social capital not only includes the structure of networks and social relations but also behavioral dispositions of individual such as trust, reciprocity, social skills. (Glaeser, E., D. Laibson, and B. Sacerdote., 2000).

PIM 1st International Conference
June 21, 2018
N 52
For this study, three factors social trust, institutional trust and social participation has been integrated with TAM model to explore adoption intention of mobile banking users.
Social trust: Trust is defined by (Mayer et al.,, 1995) as “the willingness of a party to be vulnerable to the actions of another party based on the expectations that the other party will perform a particular action important to the trustor, irrespective of the ability to monitor or control that other party”. In the online context, trust has been identified as a key driver for adoption (Gefen et al., 2003) due to its relevance to deal with two critical conditions of digital means: uncertainty and risk of vulnerability (Doney, P. M., and Cannon, J. P., 1997); (Gambetta D. , 2000). That is why, studies of online behavior emphasize the importance of including trust in adoption models to better comprehend the user acceptance of electronic services (Carter, 2008).
H1: Social trust will positively effect on perceived usefulness of using mobile banking.
H5: Social trust will positively effect on perceived ease of use of using mobile banking.
Institutional trust: In the banking industry, trust is considered as an important factor in determining customer- bank relationship. Most of the BFIs are driven by the trust from their customers as they believe that their savings and other financial products (mortgages, insurance policies) they purchase are being well taken care by such institutions. Previous studies have testified the positive impact of trust on Perceived (Gefen, D.; Karahanna, E.; Struab, D.W., 2003); (Weiquan Wang, Izak Benbasat, 2005).Trust should increase the perceived usefulness and PU is determined by PEOU and the benefits that users expect.
H2: Institution (bank) trust will positively effect on perceived usefulness of using mobile banking.
H6: Institution (bank) trust will positively effect on perceived ease of use of using mobile banking.
Social participation: Social participation is an observable feature of social capital that can be measured according to the density of an organization in a geographical area or by the level of participation by respondents in formal or informal social activities within a society (Tsai, 2014). It also includes ideas, thoughts, feelings, technology knowledge and resources about mobile banking services; ultimately providing the individual’s an idea about its usefulness and ease of use. Several previous empirical studies have supported integrating social capital with the TAM.
H3: Social participation will positively effect on perceived usefulness of using mobile banking.
H7: Social participation will positively effect on perceived ease of use of using mobile

PIM 1st International Conference
June 21, 2018
N 53
banking.
Social cognitive theory
Self-efficacy is a key element in SCT and refers to the judgments of people regarding their capabilities to organize and execute courses of action required to perform a task (Tsai, 2014). From ICTs context, (Venkatesh, V.; Davis, F.D, 1996) stated self-efficacy to be important determinant of the perceptions of users about such technologies. Several studies (Rahimpour M., Lovell N.H., Celler B.G., McCormick J., 2008) suggest self-efficacy to be crucial in determining user’s adoption intention and recommend incorporating self-efficacy into TAM to develop an extended model for future studies. It can be concluded that the stronger a person’s self-efficacy, the more likely that they try to achieve the required outcomes (Al-Somali, S.A., Gholami, R., and Clegg, B., 2009).
H4: The greater a customer’s self- efficacy regarding to mobile banking, the higher the perceived usefulness of using mobile banking. H8: The greater a customer’s self-efficacy regarding to mobile banking, the higher the perceived ease of use of using mobile banking Technology acceptance model (TAM)
It is widely used and accepted theoretical model to study individual’s behavioral intention to use new technologies and systems. It believes that individuals are motivated to make use of new technologies mainly because of two beliefs; perceived usefulness and perceived ease of use. It is derived from the Theory of Reasoned Action (TRA) put forward by (Fishbein, M., and Ajzen, I., 1975) which explains individual’s behavioral intention and actual behavior as products of attitude and subjective norm. It is widely used and accepted theoretical model to study individual’s behavioral intention to use new technologies and systems. It believes that individuals are motivated to make use of new technologies mainly because of two beliefs; perceived usefulness and perceived ease of use.
H9: Perceived ease of use will positively effect on perceived usefulness of using mobile banking.
Perceived usefulness:
Perceived usefulness (PU) is defined as the extent to which an individual believes that using a particular system will enhance his or her job performance (Wang et al, 2003). It is considered as the strongest indicator of adoption of mobile banking. People are motivated to use an application if they believe that it will help them perform better. In our study, PU refers to the extent to which an individual believes that using mobile banking will bring convenience (time-saving, etc.) for him/her.
H10: Perceived usefulness will positively influence Nepali customer intention to use

PIM 1st International Conference
June 21, 2018
N 54
mobile banking.
Perceived ease of use:
(Wang et al, 2003) has defined perceived ease of use (PEU) as an extent to which an individual believes that using a particular system will be free of effort. People do not want to spend their time and effort to perform the activities which are difficult to perform. In case of technology, people are more likely to accept it if it is easy to use. In this study, PEOU refers to the extent to which an individual believes that using mobile banking services is free of effort.
H11: Perceived ease of use will positively influence Nepali customer intention towards mobile banking.
Objectives
a) To explore the factors which influence the adoption of mobile banking services b) To find out the relationship of social trust, institutional trust, social participation
and self-efficacy in determining the consumer adoption intention of mobile banking services
Methods
Quantitative research method was used to collect the data. Questionnaires were distributed in the capital city: Kathmandu among the Nepalese banking customers of three major banks; SCB, Nabil, NIC Asia. The questionnaire consisted of a total of 35 items representing the constructs included in the conceptual model. The items were measured using 5- point Likert scale ranging from strongly disagree (1) to strongly agree (5). A total of 450 questionnaires were distributed; 150 for each bank. The total response rate was 94.44% with total of 425 responses. Data were collected directly from the participants and it took two weeks to collect the responses from all banks.
Results
Reliability test
Prior to the questionnaire distribution, Pilot test was conducted among 30 respondents through online for the reliability test. For 30 respondents, Cronbach’s Alpha was in between 0.585 to 0.920. The actual Cronbach alpha value for all the variables ranged from 0.650 to 0.839 which is generally accepted as indicating a moderately reliable scale according (Hinton, 2004).
Descriptive analysis

PIM 1st International Conference
June 21, 2018
N 55
After collecting the data through questionnaire from the three major banks, data were analyzed. Description statistics were used to analyze the demographic information of the respondents.
Out of 425 respondents, 43.5% were female and 56.5% were male. Majority of the respondents (44%) fall into the age-group of 26 to 35. 45.9% of the respondents have the education level up to bachelor’s followed by 34.8% above bachelor’s. About 42.6% respondents were private sector employee. Similarly, majority of the respondents fell into the income level of Rs. 10,001 to 25,000 and Rs. 25,001 to 40,000 with 31.5% and 33.2% respectively.
Furthermore, it is found out that 38.1% of the respondents use the mobile banking service of Nabil bank. The other 31.5% and 30.4% used the service of NIC ASIA and Standard Chartered bank respectively. The service was used more than once in a week by 33.4% of the respondents. Lastly, about 38.4% used mobile banking service to check for account information.
Hypothesis Testing
Multiple linear regression was used to test the research hypothesis. Statistical outcomes highly support the proposed model. All the research hypotheses were supported except H5. The path social trust to perceived ease of use turned to be insignificant (p=0.145) rejecting H5. All the other paths were significant in explaining the variation in dependent variable.
Table 1: Hypothesis Testing
No.
Hypothesis Path Β t-value
p-value Hypothesis
supported
H1 Social trust Perceived Usefulness 0.248** 5.416 0.000 Accepted
H2 Institutional trust Perceived Usefulness 0.094* 2.053 0.041 Accepted
H3 Social Participation Perceived Usefulness 0.210** 4.361 0.000 Accepted
H4 Self-efficacy Perceived Usefulness 0.283** 6.338 0.000 Accepted
H5 Social trust Perceived Ease of Use 0.073 1.460 0.145 Rejected
H6 Institutional trust Perceived Ease of Use 0.181** 3.597 0.000 Accepted
H7 Social Participation Perceived Ease of Use 0.274** 5.180 0.000 Accepted
H8 Self-efficacy Perceived Ease of Use 0.140** 2.870 0.004 Accepted
H9 Perceived ease of use Perceived Usefulness 0.512** 12.255 0.000 Accepted
H10 Perceived usefulness User Intention 0.303** 6.942 0.000 Accepted

PIM 1st International Conference
June 21, 2018
N 56
H11 Perceived ease of use User Intention 0.429** 9.835 0.000 Accepted
**Significant at 0.01 *Significant at 0.05
Source: Author’s Calculation Discussion
The results of the study provide interesting insights about the consumer adoption of mobile banking services in Kathmandu, Nepal. Self-efficacy made significant contribution in explaining perceived usefulness whereas social participation has strongest influence on perceived ease of use. The analysis also showed positive effect of perceived ease of use on perceived usefulness. Finally, both PU and PEU showed positive impact on user intention. However PEU was much more significant than PU. Therefore, it is found out that both social (social trust, institutional trust, social participation) and psychological factors (self-efficacy) have significant effect on user intention of mobile banking services coupled with TAM model.
Conclusions
This study integrated three theories; social capital theory, social cognitive theory and Technology Acceptance model (TAM) to understand the factors affecting consumer adoption of mobile banking service in Kathmandu, Nepal. The framework was extended version of TAM (perceived ease of use and perceived usefulness) by incorporating variables from social capital theory (social trust, Institutional trust, and Social participation) and social cognitive theory (self-efficacy) to understand the behavioral intention to use the mobile banking service.
Based on the results from multiple- linear regression analysis, the hypotheses validate the fit of empirical data and the proposed model. Moreover, the results of the analysis show that all the relationships proposed in the model are supported. All the hypotheses are supported except H5.
This study helps banks and financial institution, system developers and marketing practitioners to understand the factors which influence users to accept mobile banking. By knowing the influencers and motivators for the adoption, it guides them in terms of developing and marketing the mobile banking services. Moreover, this study also contributes theoretically by contributing to the body of literature in the field of IS adoption. By adding other theoretical model to TAM, this study proves that social and psychological factors also play a significant role in influencing adoption. This study contributes to the mobile banking literature by concentrating on socio-psychological factors such as social trust, institutional trust, social participation and self-efficacy.

PIM 1st International Conference
June 21, 2018
N 57
Recommendations
Even though, 3 million Nepalese are said to have been mobile banking users, many of them have just applied but have not actually made proper use of it. Some of them are not even aware of the functions and benefits of mobile banking. And most of them limit themselves to just checking their account balances. As self-efficacy, social participation, PU and PEU plays an important role in user intention; marketers should focus on developing better marketing plans to attract users. Effective marketing and tutorials to aware uses about the benefits of mobile banking will definitely help to grow the mobile banking services in Nepal.
Limitations and Future Research Directions
This study focused on the mobile banking services, future research should consider other online banking platforms such as internet banking, e-banking, telebanking. Comparative study between these platforms will help to understand the factors affecting the intention and adoption from one technology to another.
The study was conducted in the capital city Kathmandu, Nepal. The adoption towards these technologies varies across countries, cultures, economies and many more. Therefore, further research should be conducted focusing on different population to get better understanding for that particular sample. Several other variables environmental, social, psychological, cultural should be integrated with TAM model to test its significance on IS adoption.
References ( Dec 2017). MIS Report. Kathmandu: Nepal Telecommunications Authority. Global Financial Inclusion Database. (2014). Retrieved from World Bank. Juniper Research. (2018). Retrieved from DIGITAL BANKING USERS TO REACH 2 BILLION THIS
YEAR, REPRESENTING NEARLY 40% OF GLOBAL ADULT POPULATION. Al-Somali, S.A., Gholami, R., and Clegg, B. (2009). An investigation into the acceptance of
online banking in Saudi Arabia. Technovation, 130-141. Carter, L. a. (2008). E-Government Adoption: A cultural comparison. Information Systems
Frontiers, 473-482. Coleman. J. . (1990). Foundations of Social Theory. Doney, P. M., and Cannon, J. P. (1997). An Examination of the Nature of Trust in Buyer-Seller
Relationships. Journal of Marketing , 35-51. Fishbein, M., and Ajzen, I. (1975). Belief, Attitude, intention and behavior: An introduction to
theory and research.

PIM 1st International Conference
June 21, 2018
N 58
Gambetta, D. (2000). "Can we trust trust? Chapter 13", in Gambetta, D. (Ed.), Trust: Making and Breaking Cooperative Relations. 213-237.
Gefen et al. (2003, March). Trust and TAM in Online Shopping: An Integrated Model. Management Informatiion Systems Research Center, University of Minnesota, 27, 51-90.
Gefen, D.; Karahanna, E.; Struab, D.W. (2003). Trust and TAM in online shopping; An integrated model. MIS Quart, 51-90.
Glaeser, E., D. Laibson, and B. Sacerdote. (2000). The Economic Approach to Social Captial. National Bureau of Economic Research.
Hinton, P. R. (2004). SPSS explained. London, Routledge. Mayer et al.,. (1995). An integrative model of organizational trust. The Academy of
Management Review, 709-734. (Mid-Dec 2017). Banking & Financial Statistics. Kathmandu: Nepal Rastra Bank; Banks &
Financial Institution Regulation Department Statistics Division. Rahimpour M., Lovell N.H., Celler B.G., McCormick J. (2008). Patients' perceptions of a home
telecare system. Int. J. Med. Inform, 486-498. Statista. (2018). Global digital population as of January 2018 (in millions). Sullivan, D. and Bauerschmidt, A. (1989). Common factors underlying barriers to export: A
comparative study in the European and US paper industry. Management International Review, 29(2), 17-32.
Suoranta and Mattila. (2004). Mobile banking and consumer behaviour: New insights into the diffusion pattern. Journal of Financial Services Marketing, 8(4), 354-366.
Tan, Margaret and Teo. Thompson S.H. (2000). Factors Influencing the Adoption of Internet Banking. Journal of the Association for Information Systems, 1(1).
Tsai, C.-H. (2014). Integrating Social Capital Theory, Social Cogitive Theory and the Technology Acceptance Model to Explore a Behavioral Model of Telehealth Systems. Internatonal Journal of Environmental Research and Public Health, 4905-4925.
Venkatesh, V.; Davis, F.D. (1996). A model of the antecedents of perceived ease of use:Development and test. Decis. Sci. J., 451-481.
Wang et al. (2003). Determinants of user acceptance of Internet banking: an empirical study. International Journal of Service Industry Management, 14(5), 501-519.
Weiquan Wang, Izak Benbasat. (2005). Trust in and Adoption of Online Recommendation Agents. Journal of the Association for Information Systems, 6(3).

PIM 1st International Conference
June 21, 2018
N 59
FACTORS EFFECTED ON HI-END BRAND WATCH PURCHASING DECISION OF CONSUMERS FROM UNAUTHORIZED DEALERS
Pitchapa Ratchanan
Master of Business Administration, Stamford International University, Bangkok, Thailand
*Corresponding author: [email protected] ABSTRACT
This research aims to study 1) Influential level of product factors, social factors and psychological factors that effect on consumers’ hi-end brand watch purchasing decision from unauthorized dealers. 2) Consumers’ demographic factors and difference of demographic factors which have an effect on consumers’ hi-end brand watch purchasing decision from unauthorized dealers. 3) Product factors, social factors and psychological factors that influence consumers’ decisions to purchase hi-end brand watches from unauthorized dealers.
This is a survey research with non-probability sampling method (purposive sampling). The questionnaire was used as a tool to collect data from the sampling group of 400 people. The results were analyzed through statistical software (SPSS). Descriptive statistics as frequency, percentage, mean and Standard Deviation were used to describe sampling group’s demographic factors. Inferential statistics were used to prove the hypothesis which are Independent sample t-test, F-test (One-way ANOVA) by comparing the average difference in the LSD pairwise test and Multiple Regression Analysis by direct method (Enter).
The study indicates 1) product factors ( =4.69), social factors ( =4.68) and psychological factors ( =4.85) are the highest influential factors on sampling group’s hi-end brand watch purchasing decisions 2) The consumers’ different demographic factors such as gender, age, salary, educational level and occupation generate diverse effects on consumers’ hi-end brand watch purchasing decisions 3) Product factors including product feature, product benefit, and product innovation influence the consumers’ hi-end brand watch purchasing decisions. Social factors as reference group plus social role and status influence the consumers’ decisions to purchase hi-end brand watches. Psychological factors which are consumers’ attitudes on hi-end brand watches influence the consumers’ decisions to purchase hi-end brand watches.
Keywords: Purchasing decision, hi-end brand watch
Introduction

PIM 1st International Conference
June 21, 2018
N 60
For the watch market in Thailand, the decrease of hi-end brand watch import duty from 30% to 5% causes the growth of Thailand watch market as the Thailand watch market value is over 45,000 million baht per year (Prachachat, 2012: online). Moreover, the purchasing powers of middle-class and upper-class consumers tend to increase. They are seeking for luxurious products to fulfill their esteem in capitalist society. On the other hand, the hi-end brand watch fans value the hi-end brand watches as masterpieces of high quality craftsmanship. (L’Optimum Thailand, 2016: online). According to large hi-end brand watch market and high potential of consumers, this research aims to study the factors which affect consumers’ hi-end brand watch purchasing decision from unauthorized dealers.
Literature Review
Demographic Factors: the marketers usually use demographic factors to segment the target market because people in each demographic groups as gender, age, and occupation tend to have the same psychological characteristics and favor the same things. (Siriwan Sereerat, 2007: 41)
Product Factors: product factors consist of 1) Product concept: product characteristic in overall which affects on the guideline of product appearance, packaging, selling point and product quality to satisfy the consumers’ needs (Etzel Walker and Stanton, 2007). 2) Product attribute: the abilities of the products which dedicate to consumers to satisfy their needs. (Robin Simon, 2014: online). 3) Product feature: the physical appearances of products that consumers can touch and sense. For competitiveness, the products need to have unique and outstanding appearances. (Armstrong & Kotler, 2009). 4) Product benefit: the benefit that consumers can gain from the product. (Armstrong & Kotler, 2007). 5) Product innovation: The things that are newly invented or developed for the economical and social benefits. (Somnuek Uerjirapongpan, 2010)
Social Factors: social factors influence people’s thoughts, beliefs and actions. (Pranee Eimla-orpakdee, 2008: 100) 1) Reference group: families, friends, and celebrities have influences on people’s perceptions and behaviors because they need social recognitions. (Dusadee Sangkam, 2009). 2) Social role and status: consumers from the same group of social role and status tend to have the same thoughts and behaviors. (Pranee Uemlaopakdee, 2008: 99).
Psychological Factors: Psychological factors influences the consumers’ behaviors (Vichit Au-On, 2014). 1) Attitude: an evaluation of individual’s satisfaction on cases which is difficult to be changed so, marketers usually create the products to match with consumers’ perceptions for lower marketing cost (Jeerawat Kaewjaidee, 2007: 21). 2) Subjective norm: people set their subjective norms from their experiences and believes which affect on their daily behaviors. (Umpika Homchit, 2013).
Purchasing Decision: Decision making process is people’s solution to select one

PIM 1st International Conference
June 21, 2018
N 61
choice from all given choices including need recognition, information search, alternative evaluation, purchasing decision and post purchase stage. Consumers normally decide to purchase a product or service from information and situation limitation. (Chatayaporn Sa-meurjai, 2007: 46)
Objectives
This research aims to study 1) Influential level of product factors, social factors and psychological factors that effect on consumers’ hi-end brand watch purchasing decision from unauthorized dealers. 2) Consumers’ demographic factors and difference of demographic factors which have an effect on consumers’ hi-end brand watch purchasing decision from unauthorized dealers. 3) Product factors, social factors and psychological factors that influence consumers’ decisions to purchase hi-end brand watches from unauthorized dealers.
Methodology
This is a survey research with non-probability sampling method (purposive sampling). The sampling group are 400 consumers who have purchased hi-end brand watches from unauthorized watch dealers in Thailand.
The questionnaire was used as a tool to collect data from famous unauthorized dealers those are Papaya shop, 9Naliga shop, Big Banana shop, Cherry Naliga shop, Well Time shop, At Time 168 shop and About Time shop.
The results were analyzed through statistical software (SPSS). Descriptive statistics as frequency, percentage, mean and Standard Deviation were used to describe sampling group’s demographic factors. Inferential statistics were used to prove the hypothesis which are Independent sample t-test, F-test (One-way ANOVA) by comparing the average difference in the LSD pairwise test and Multiple Regression Analysis by direct method (Enter). (Nongluck Viratchai, 2010: 156)
Results
About demographic data, 295 samples or 73.8% of 400 samples are men and 105 samples or 26.3% of 400 samples are women. 214 samples or 53.5% of the sampling group aged 36-45 year-old. 211 samples or 52.8% are single. 215 samples or 53.8% of the sampling group get the salary in 40,001-80,000THB range. 175 samples or 43% of the sampling group graduated Master’s. 259 samples or 64.8% are business owners. 217 samples or 54.3% are working in operation level.
For influential level of product factors, social factors and psychological factors, the sampling group has the opinion on product factors at highest level ( =4.69) including product features, product innovation, product benefit, product concept and product

PIM 1st International Conference
June 21, 2018
N 62
attribute orderly. Social factors have the highest level in sampling group’s opinion ( =4.68) those are social role and status, and reference group orderly. The sampling group also has the opinion on psychological factors at highest level ( =4.85) including subjective norm and attitude on hi-end brand watch orderly.
Table 1: Demographic factors effect on hi-end brand watch purchasing decision of consumers from unauthorized dealers
Demographic factors Sig (2-tailed)
Accept Refuse
- Gender 0.025
- Age 0.000
- Salary 0.000
- Educational level 0.000
- Status 0.052
- Occupation 0.000
- Job level 0.065
This can be summarized that the different demographic factors as gender, age, salary and educational level influence consumers to have different hi-end brand watch purchasing decision but, different status and job level do not influence consumers to have different hi-end brand watch purchasing decision.
Table 2: Product factors have an effect on hi-end brand watch purchasing decision of consumers from unauthorized dealers
Product factors (Y) b S.E. Beta t-test Sig t (2-tailed)
Constant 2.504 0.382 6.546 0.000 Product concept (P1) 0.038 0.035 0.078 1.084 0.279 Product attribute (P2) 0.007 0.048 0.010 0.142 0.887 Product feature (P3) 0.469 0.056 0.415 8.438* 0.000 Product benefit (P4) 0.210 0.063 0.158 3.349* 0.001 Product innovation (P5) 0.222 0.048 0.220 4.590* 0.000 R= 0.465, R2= 0.216, F-test =21.721*, Sig F(2-tailed) = 0.000 * Acceptable error 5%

PIM 1st International Conference
June 21, 2018
N 63
From the table, at 0.05 statistical significance, product factors including product feature, product benefit and product innovation influence on hi-end brand watch purchasing decision of consumers but, product concept and product attribute do not influence consumers’ hi-end brand watch purchasing decision.
Table 3: Social factors effect on hi-end brand watch purchasing decision of consumers from unauthorized dealers
Social factors (Y) b S.E. Beta t-test Sig t(2-tailed) Constant 0.306 0.244 1.258 0.209
Reference group (S1) 0.785 0.032 0.786 24.737* 0.000
Social role and status (S2) 0.131 0.037 0.111 3.510* 0.000
R= 0.779, R2= 0.607, F-test =305.997, Sig F(2-tailed) = 0.000
* Acceptable error 5% It is concluded that social factors including reference group and social role and
status effect on hi-end brand watch purchasing decision of consumers from unauthorized dealers.
Table 4: Psychological factors effect on hi-end brand watch purchasing decision of consumers from unauthorized dealers
Psychological factors (Y) b S.E. Beta t-test Sig t(2-tailed) Constant 3.065 0.375 8.182 0.000
Attitude on hi-end brand watch (Ps1) 0.295 0.055 0.259 5.332* 0.000
Subjective norm (Ps2) 0.019 0.051 0.018 0.365 0.715
R= 0.259, R2= 0.067, F-test =14.223*, Sig F(2-tailed) = 0.000
* Acceptable error 5% It can be clearly seen from the table that psychological factor which is the
consumers’ attitudes on hi-end brand watches, excluding subjective norm, influence on consumers’ hi-end brand watch purchasing decisions.
Conclusion
For influential level of product factors, social factors and psychological factors, the sampling group has the opinion on product factors at highest level ( =4.69) including product features, product innovation, product benefit, product concept and product attribute orderly. Social factors have the highest level in sampling group’s opinion ( =4.68) those are social role and status, and reference group orderly. The sampling group also has

PIM 1st International Conference
June 21, 2018
N 64
the opinion on psychological factors at highest level ( =4.85) including subjective norm and attitude on hi-end brand watch orderly.
The different demographic factors as gender, age, salary and educational level influence consumers to have different hi-end brand watch purchasing decision but, different status and job level do not influence consumers to have different hi-end brand watch purchasing decision.
Product factors including product feature, product benefit and product innovation influence on hi-end brand watch purchasing decision of consumers but, product concept and product attribute do not influence consumers’ hi-end brand watch purchasing decision.
Social factors including reference group and social role and status effect on hi-end brand watch purchasing decision of consumers from unauthorized dealers.
Psychological factor which is the consumers’ attitudes on hi-end brand watches, excluding subjective norm, influence on consumers’ hi-end brand watch purchasing decisions. Discussion/recommendation
As the consumers from different demographic groups as gender, age, salary and educational level have different interests, focuses and purchasing decisions, excluding status and job level, unauthorized dealers should supply hi-end brand watches with various features to enhance sale opportunities.
Product factors including product feature, product benefit and product innovation except product concept and product attribute affect on consumers’ hi-end brand watch purchasing decisions from unauthorized dealers. From this point, unauthorized dealers should continuously present product feature, product benefit and product innovation of hi-end brand watches as running VDO clips, setting outstanding displays and explaining the reasons why cool persons have to own items and showing fantastic parts, mechanics, innovations, benefits and stories of hi-end brand watches through media channels and shop displays to gain the consumers’ interests. In addition, unauthorized dealers should allow the consumers to touch and try the product to stimulate their needs.
Social factors including reference group and social role and status influence on consumers’ hi-end brand watch purchasing decisions so, unauthorized dealers should promote hi-end brand watches and shops through celebrities. This is because celebrities’ product/shop reviews can gain consumers’ interests because consumers tend to purchase hi-end brand watches follow their favorite celebs and customer reviews can increase the credibility. In addition, unauthorized dealers can stimulate consumers’ demand via online and offline communities when they talk about hi-end brand watches which are available at the shop.
Psychological factor which is the attitude on hi-end brand watch, excluding the subjective norm, affects on consumers’ hi-end brand watch purchasing decisions from

PIM 1st International Conference
June 21, 2018
N 65
unauthorized dealers. The unauthorized dealers should emphasize the consumers’ believes about precious hi-end brand watches which can fulfill their esteem and encourage them to be hi-end brand watch fans and long term customers.
References
Armstrong, G., & Kotler, P. (2007). Marketing an introduction (8th ed.). New Jersey: Pearson Education.
Armstrong, G. & Kotler. (2009). Marketing, an introduction (9th ed.). New Jersey: Pearson Prentice Hall.
Boone, E. L., & Kurtz, L. D. (1998). Contemporary marketing. Wired fort worth: Dryden. Chatayaporn Sa-muerjai. (2007). Consumer Behaviors. Krungthep Expernet. Consumers and Loyalty to Brands. (2017). Retrieved June 5, 2017, from
http://economicsthai.blogspot.com/2013/03/ Cronbach, L. J. (1974). Essentials of Psychological Testing (3rd ed). New York: McGraw-Hill.
Dusadee Sangkam. (2009). Factors effected on teenagers’ alcohol consumption. Graduate
School, Surindra Rajabhat University. Etzel, M. J; Walker, B. J. and Stanton, W. J. (2007). Marketing (12th ed). Boston: McGraw-Hill. Kriengsak Tantipiphop. (2013). Prachachart Turakit Online. Retrieved July 19, 2015, from
http://www.prachachat.net/news_detail.php?newsid=1374205105 L’Optimum Thailand. (2016). Luxury watch. Retrieved November 13, 2016, from
http://loptimumthailand.com/category/watch Pranee Eimla-orpakdee. (2008). Marketing Management. (3rd ed). Bangkok: Thana Press. Robin Simonmarch 17. (2014). Product Attribute. Retrieved June 15, 2017, from
http://www.cpgdatainsights.com/understand-your-database/product-attributes/ Shawn Grimsley. (2013). Product Attribute Definition Lesson. Retrieved June 15, 2017, from
http://study.com/academy/lesson/product-attribute-definition-lesson-quiz.html Siriwan Sereerat. (2009). Basic Consumer Behaviors. (1st ed). Bangkok: Duangkamol Samai Siriwan Sereerat, Parin Luxitanon and Suporn Sereerat. (2009). New Era of Marketing
Management. Bangkok: Petchjarat saengturakit. Solomon, M. R., Marshall, G. W., and Stuart, E.W. (2006). Marketing Real People, Real Choices
(4th ed). New Jersey: Pearson Education. Somnuek Uejirapongpan. (2010). Innovation: meaning, category and the importance for
business owner. Faculty of Commerce, Thammasat University. Theerin Sukrasanthi. (2012). Prachachat Turakit Online. Retrieved August 13, 2017, from
http://www.prachachat.net/news_detail.php?newsid=1344835038 Umpika Homchit. (2013). Factors Affecting Purchasing Behaviors and Drinking Habits of
Working Women in Bangkok. Graduate School, Srinakarinwirot University

PIM 1st International Conference
June 21, 2018
N 67
FACTORS IN FLUENCING INTERNATIONAL TOURISTS’ REVISIT INTENTION TO YANGON, A CASE STUDY IN YANGON, MYANMAR
Thin Su Su Htwe1, Pithoon Thanabordeekij2
(12)International College, Panyapiwat Institute of Management
*Corresponding author, E-mail: [email protected] ABSTRACT
Since the tourists’ arrival gradually increased 17.4% from 2011 to 2015 in Myanmar, it is important to detect the facts for sustaining tourist industry because of the development of the visited tourists yearly by researching the influence factors of revisit intention. The main objective of this study is to analyze the seven factors (external, introjection, identification, intrinsic, attitude, subjective norms, perceived behavioral control) affecting tourists revisit intention to Yangon, Myanmar based on the Self-Determination Theory(SDT) and Theory of Planned Behavior (TPB) model.
The quantitative questionnaires were conducted to examine the relation seven factors with travel revisit intention by applying linear regression analysis to confirm the results. The respondents in this study were 400 international tourists who visited Yangon, Myanmar. Results of the combination of these two theories demonstrated that intrinsic motivation, attitude and perceived behavioral control factors are significant influences tourists’ revisit intention in the proposed model of SDT and TPB.
Keywords: Self-Determination Theory, Theory of Planned Behavior, Revisit Intention, Yangon
Introduction
Tourism is already a vital sector for development across all Continents. According to the World Travel & Tourism Council (WTTC), such famous tourism destination countries like UK, Greece, and Thailand make income from tourism sector between 3.4% to 9.2% of GDP (WTTC, 2016). In 2016, Travel & Tourism directly contributed US$2.3 trillion and 109 million jobs worldwide. Taking it’s wider indirect and induced impacts into account, the sector contributed US$7.6 trillion to the global economy and supported 292 million jobs in 2016. This was equal to 10.2% of the world’s GDP, and approximately 1 in 10 of all jobs. Based on The World Travel & Tourism Council (WTTC) research, in 2015, the direct contribution of Travel & Tourism to GDP was USD 2, 229.8bn (3.0% of GDP). In addition, in 2016, it focuses on becoming 3.3% to USD 2,304.0bn in this total contribution include the related business sectors such as airlines, hotels, travel agencies and other transportation services and entry fees etc. This WTTC assumes the total distribution of Tourism to GDP can reach up to USD3,

PIM 1st International Conference
June 21, 2018
N 68
469.1bn (3.4% of GDP) in 2026 growth by 4.2% from now. This calculation will include the activities the restaurant and leisure industries directly supported to tourism sector (WTTC, 2016).
Tourism growth in Myanmar is indeed remarkable and interesting increasing number within South East Asia. Based on the results of 2014, Myanmar’s exceptional tourism growth became 4.6% for the first six months, resulting in some 517 million arrivals (Tourism, 2016). If Myanmar achieved an ambitious 2 million international visitors, arrivals by mid-2014 that translates into approximately 0.0035% of global market share. In 2014, Myanmar received about 3 million tourist arrivals, and two-thirds are from East Asia source markets (Tourism, 2016). By seeing the experiences of Greater Mekong Sub-region (GMS) destinations, international visitors’ arrivals range is conservative, mid-range and high growth scenarios in the current Myanmar Tourism Master Plan. Longer range forecasts to 2020 give a low scenario of 2.8 million arrivals, a medium estimates of towards 4 million and a high forecast of over 7.4 million international arrivals. Currently, the trend is towards the high forecast (Tourism, 2016). Research Objectives
The aims of this study are to examine the key factors that dominate the possibility of international tourist to revisit Myanmar and to develop an extension of the theory of planned behavior by including motivational theory to analyze and predict tourists’ revisit intention. Literature Review
Self-determination theory, established in 1989, demonstrates the influential human motivation that describes a difference experience, such as motivation and psychological well-being (Deci & Ryan, 2000). In earlier studies “Intrinsic motivation and self-determination in human behavior” generates Self-determination theory to evaluate the human motivation (Deci & Ryan, 2008). Chang (2013) revealed that each person has inborn tendency to learn, to face the challenges, to explore the new things around their environment, to grow and develop social connections while living. In self-determination theory, motivation is multidimensional. Specifically, the behavior is controlled by three types of motivation: intrinsic, extrinsic, and amotivation. According to Deci & Ryan (2000), the third kind of motivation is the state of lacking the intention to act. So this research will focus on the extrinsic motivation and intrinsic motivation to evaluate the tourist’s revisit intention.
Theory of planned behavior (TPB), the relationship between attitude, perceived behavioral control and subjective norms, the additional factor, that impact individual behavioral intentions (Ajzen, 1991). Choo , Ahn , & Petrick, (2016) stated that TPB was applied in many studies, including social psychology (Ajzen 2002; Armitage & Conner, 2001), tourism (Hsu, 2012; Yamada & Fu, 2012) and festival & event (Homgetal, 2013; Kimetal, 2011;

PIM 1st International Conference
June 21, 2018
N 69
Shen, 2014), have extensively referred and successfully applied the TPB to evaluate motivational influences on behavioral intentions and behaviors. Ajzen & Fishbein (1980) specify that extent to which individuals view a particular behavior positively (attitude), think that significant others want them to engage in the behavior(subjective norms) and perceive the ease or difficulty of performing the behavior of (perceived behavioral control), serves as direct antecedents of the strength of their intention to carry out the behavior (Ajzen,1991).
Proposed Framework
Figure 1. Proposed framework Adopted from: (Ryan & Connell’s, 1989; Chang et al, 2014; Ajzen, 1991; Choo , Ahn , & Petrick, 2016) SDT= Self-Determination Theory, TPB= Theory of Planned Behavior
Hypothesis H1. External extrinsic motivation will be positively related to Revisit Intention to Yangon,
Myanmar. H2. Introjection extrinsic motivation will be positively related to Revisit Intention to
Yangon, Myanmar. H3. Identification extrinsic motivation will be positively related to Revisit Intention to
Yangon, Myanmar. H4. Intrinsic motivation will be positively related to Revisit Intention to Yangon, Myanmar. H5. Attitude will be positively related to Revisit Intention to Yangon, Myanmar. H6. Subjective Norms will be positively related to Revisit Intention to Yangon, Myanmar. H7. Perceived behavioral control will be positively related to Revisit Intention to Yangon,
Myanmar. Research Methodology
The design of questionnaire was derived from available literature review. In order to fit Myanmar Tourism Industry, necessary modification are conducted. According to 5 point

PIM 1st International Conference
June 21, 2018
N 70
Likert scale Respondents were questioned to indicate their perceptions of extrinsic motivation, intrinsic motivation, attitude, subjective norm, perceived behavioral control and revisit intention in a range of 1 (strongly disagree) to 5(strongly agree) and attitude in a scale of 1 (very low) to 5 (very high).
To achieve the study objective, 400 questionnaires according to the Yamane (1973) formula was manipulated to spread the international tourists in Yangon from (4,680,000) population (Yamane, 1973). The pilot study was conducted with 30 samples before distributing to the public in order to confirm that questionnaire are reliable or not. After that, 400 samples were chosen in a random and convenient manner, including all tourists who visit Myanmar across by the Yangon International Airport, regardless of gender, age, nationalities. Non-Probability random sampling method in the form of convenience sampling like as the existing previous research. For the testing the data, the analysis such as reliability test, descriptive statistical analysis, frequency analysis and others are the percentage, average (Mean) and standard deviation (SD) and multiple regression analysis will be performed.
Results of the study The study sample was made of 400 tourists who visited Myanmar during October
and November 2017. Among 400 respondents, 193 respondents (48.3%) were male, 207 respondents (51.7) were female. The majority of the respondents were between 26 and 35 years old and indicated their occupation as the private organization. For the education level, maximum respondents had bachelor education. Most of the respondents (40.3%) expressed their monthly income as between $2001 to $3000. The majority of respondents showed their purpose for the visit to be traveling and the percentage is 50.2%, but 45.5% were in the country for holiday/pleasure. Most of the respondents stayed for 2-4 days in Myanmar. Among the respondents, almost 61% settled at some kind of Hotels. Most of the respondents got the source of information about Myanmar from Internet (31.6%) followed by Brochures/travel guidebooks (19.8%). Majority of respondents visited Shwedagon Pagoda (35.4%), Bogyoke Aung San Market (16.7%).
In this study, a pilot test was tested by using Cronbach’s alpha test and pilot test questionnaires was conducted by 30 respondents. The Cronbach’s alpha was from 0.687 to 0.954. Therefore, all constructs of this research were accepted according to Cronbach(1951).
Table 1. Reliability of Sample (400) and Pilot test (30)
Scales Items Cronbach’s
alpha (N=30) Cronbach’s
alpha (N=400) Self-determination Theory External
4
0.687
0.863

PIM 1st International Conference
June 21, 2018
N 71
Introjection 5 0.900 0.904 Identification 5 0.870 0.812 Intrinsic 5 0.878 0.871 Theory of Planned Behavior Attitude
5
0.952
0.954
Subjective norm 5 0.952 0.805 Perceived behavioral control 5 0.923 0.857 Revisit Intention 5 0.923 0.880 Hypothesis Testing Table 2: Summary of Testing Hypotheses
No. Hypothesis Path β t-value p-value Hypothesis Supported
H1 EX RI 0.137** 2.806 0.005 Accepted H2 INX RI 0.001 0.014 0.989 Rejected H3 ID RI 0.073 1.442 0.150 Rejected H4 IN RI 0.181** 3.649 0.000 Accepted H5 AT RI 0.212** 5.893 0.000 Accepted H6 SN RI 0.074 1.840 0.066 Rejected H7 PBC RI 0.535** 12.987 0.000 Accepted ** significant at 0.01, EX=External , INX= Introjection, ID=Identification, IN=Intrinsic motivation, AT=Attitude, SN=Subjective Norm, PBC=Perceived behavioral control, RI=Revisit Intention Hypothesis Testing
Hypothesis 1: External extrinsic motivation and revisit intention The relationship is statically significant (Sig=0.005) at significant level p<0.01.
Therefore, “External extrinsic motivation will be positively related to Revisit Intention to Yangon, Myanmar” is supported.
Hypothesis 2: Introjection extrinsic motivation and revisit intention The relationship is not significant (Sig=0.989) and p value was p>0.05. Thus
“Introjection extrinsic motivation will be positively related to Revisit Intention to Yangon, Myanmar.” is rejected by this study.
Hypothesis 3: Identification extrinsic motivation and revisit intention The identification extrinsic motivation had no impact on travel revisit intention
(Sig=0.150). Thus this study did not support “Identification extrinsic motivation will be

PIM 1st International Conference
June 21, 2018
N 72
positively related to Revisit Intention to Yangon, Myanmar.”. Hypothesis 4: Intrinsic motivation and revisit intention The relationship between the intrinsic motivation and revisit intention had the high
correlation at (Sig=0.000). Thus “Intrinsic motivation will be positively related to Revisit Intention to Yangon, Myanmar.” is supported by this study.
Hypothesis 5: Attitude and revisit intention The findings that attitude had the significant effect on revisit intention thus “Attitude
will be positively related to Revisit Intention to Yangon, Myanmar.” is statically supported by the result of this study.
Hypothesis 6: Subjective and revisit intention As for Hypothesis 6, the results showed insignificant impact on the relation between
the subjective norms and revisit intention. Therefore, “Subjective Norms will be positively related to Revisit Intention to Yangon, Myanmar.” is not supported by the result of this study.
Hypothesis 7: Perceived behavioral control and revisit intention “Perceived behavioral control will be related to revisit intention to Yangon,
Myanmar.” is strongly supported by the result as perceived behavior control was found to be related with travel intention in both original and proposed extended model of TPB.
Figure 1.1 Testing the Proposed model, Source: Author’s calculation

PIM 1st International Conference
June 21, 2018
N 73
Conclusion The study applied the extended model of TPB with the addition of SDT motivation
to visit as the new antecedent to behavior intention as supported by the discussed literature. In the findings, determinants like attitude, perceived behavioral control, external extrinsic motivation and intrinsic motivation were able to explain tourists travel intentions while subjective norm, introjection extrinsic motivation, identification extrinsic motivation were seen to have no effect illustrating to the intention.
By identifying the influenced factors for tourists’ revisit intention, the study was found that PBC was a more crucial construct among motivation factors and TPB constructs. Thus, the tourist agencies or tourist attraction owners would like to attract tourists’ repeat visiting, perceived behavioral control is the certainly critical for developing service blueprints to fulfill the satisfaction of customers to meet his/her needs and want.
This study not only revealed the demographics of the target market, which was middle-class, between 26 and 35 years old, higher education degree but also indicated several ways and marketing suggestions for the government and tourism owners to attract tourists to visit their attractions from the results of tourists’ travel behavior.
Implication Theoretical Implications
This study analyzed the relationship between motivation and revisit intention applying the self-determination theory. The results showed that the original theory framework is practical for measuring the revisit intention. The main findings of this study revealed that theory of planned behavior provided a useful research framework for understanding tourists’ intention to revisit intention. The new model estimated by this study can be applied to future studies to increase understanding and predictive power with regard to tourists’ revisit intentions. Management Implications
The Government should consider providing smooth visit by transportation for tourists. Tourist agencies or tourist attraction owners should more imply on the internet advertisement to gain more attention because most of the respondents receive information from the internet. Other marketers should declare the information for accommodation at the popular websites such as Airbnb, travel advisor to reach more explorers’ notification. Media was the critical marketing tool for the tourism industry in Myanmar.
Recommendation
This study has provided some crucial insights into travel behavior of international tourists to Yangon, Myanmar. According to the result, external extrinsic motivation and intrinsic motivation are significantly influenced to predict the revisit intention. It reveals that

PIM 1st International Conference
June 21, 2018
N 74
the travel decision depends on both external force and internal force. Moreover, the intrinsic motivation is the most powerful among the influenced motivation factors. Thus, the tourist comes to Yangon, Myanmar for relaxation, escaping from the daily routine, gaining knowledge, exciting, enjoying. So preservation and restoration of natural and cultural settings must be the primary objective for concerned tourism bodies. They should plan to create the better positive image of these destination products while promoting Myanmar. The perceived behavioral control is the more powerful factors than attitude in this study so the ease of traveling for tourists is the critical thing. The ease of transportation and the reasonable accommodations are the most important of tourists’ perception in Yangon, Myanmar.
Myanmar is a developing country, so major infrastructures like proper transportation system, accommodations, communication facility and accessibility need to improve. There are many options to get into the country but quite expensive compared to other destinations. Though in recent years, major investments have been made in the tourism industry like in airlines, hotels, much of effort has been from private sector. The Government should put tourism industry in high priority and come up with policies to help improve standard of service sector. Limitation and Future Research
The questionnaire was administered to the respondents who can use the English language; this was restraint in Yangon, Myanmar particularly. A dependent variable could be a limitation because other motivation items, which were not applied in the current study, may have affected the behavioral intention of the tourists to revisit. References Ajzen, I. (1991). The Theory of Planned Behavior. University of Massachusetts at Amherst,
50(2), 179-211. Ajzen, I. (2002). Perceived Behavioral Control, Self-Efficacy, Locus of Control, and the Theory
of Planned Behavior. Journal of Applied Social Psychology, 32(4), 665-683. doi:10.1111/j.1559-1816.2002.tb00236.x
Armitage, C., & Conner, M. (2001). Efficacy of the Theory of Planned Behaviour: A meta-analytic review. British Journal of Social Psychology, 40(4), 471-499.
Chang, L.-L. (2013). "INFLUENCING FACTORS ON CREATIVE TOURISTS' REVISITING INTENTIONS: THE ROLES OF MOTIVATION, EXPERIENCE AND PERCEIVED VALUE. All Dissertations, Paper 1084.
Cronbach, L. J. (1951). Coefficient alpha and the internal structure of tests. Psychometrika, 16(3), 297-334.
Deci, E., & Ryan, R. (2000). The “what” and the “why” of goal pursuits: Human needs and

PIM 1st International Conference
June 21, 2018
N 75
the self-determination of behavior. Psychological Inquiry, 11, 227-268. Deci, E., & Ryan, R. (2008). Self-determination theory: A macrotheory of human motivation,
development, and health. Canadian Psychology/Psychologie canadienne, 49(3), 182-185.
Tourism, B. B. (2016). Market Analysis and Strategy. (B. I. Facility, Ed.) Myanmar. WTTC. (2016). The Economic Impact of Travel & Tourism. London: World Travel and Tourism
Council. Yamane, T. (1973). Statistics: An Introductory Analysis. 3rd Edition, New York: Harper and
Row.

PIM 1st International Conference
June, 2018
N 76
IDENTIFYING THE CRITICAL DETERMINANTS FOR THE PRICE OF ASEAN’S HOSTEL
Meng-Hsuan Wu1, Chin-Yi Fang2
1Graduate Institute of Sport, Leisure and Hospitality Management, Master Student of National Taiwan Normal University
2Graduate Institute of Sport, Leisure and Hospitality Management, Professor of National Taiwan Normal University
*Corresponding author, E-mail: [email protected]
ABSTRACT For many backpackers, South Asia is a popular destination to travel destinations because
of the cheap travel expenses. And there is also a Association of Southeast Asian Nations (ASEAN) composed of 10 countries in South Asia. Every year, visitors to ASEAN have a growing trend. So, pricing strategy in the hostel industry has become very important because of the rapid growth of hostels over the past few years. Extant hotel research using objective secondary data, such as the number of rooms and the different facilities, investigated the impact factors of room price. However, the extant studies in the hotel industry ignored customer comments. In this study, the Subjective data from customer were be collected form
HOSTERLWORLD, and used the hedonic price theory to identify the characteristics of hostel price. The hedonic price theory was previously used to assess the price determinants in the hotel segment, but there is a paucity of research in the hostel industry especially focus at Asia. The regression model using independent variables, which include customer comments on: (1) atmosphere, (2) cleanliness, (3) facilities, (4) location, (5) staff, (6) security, (7) number of ratings and type of accommodation to analyze the impact of these factors on the hostel room price. Empirical data containing all hostels in 10 countries of ASEAN are collected from HOSTELWORLD, which is the most popular website to book hostels. The regression results indicated that the dormitory and the rating of staff had significantly negative effects on the hostel price; the private room and the rating of cleanliness, location and security had significantly positive effects on the hostel price. The managerial implication of the paper is also discussed.
Keywords: Hostel, ASEAN, Hedonic Price Theory, Regression model Introduction
Southeast Asia is one of the major tourist destinations in the world (World Travel & Tourism Council, 2015),There is also a Association of Southeast Asian Nations (ASEAN) composed of 10 countries. It contains different cultures, languages and people, each destination is unique (Koh & Kwok, 2016). Therefore, for backpackers, Southeast Asia is the preferred area for travel (Fitzgerald, 2000). And these backpackers are also the main customers of the hostels (Musa & Thirumoorthi, 2011). Youth hostels have experienced rapid growth in recent years because of the popularity of backpacker markets (Brochado, Rita, and Gameiro, 2015).
In view of the important position of Southeast Asia in the current world economy, there had been no studies of hostels that are based on ASEAN as far as the authors know.

PIM 1st International Conference
June, 2018
N 77
Since the prices of hostels in the same location are very different, the “hedonic price theory” can be used to analyze the overall price of different features.
Extant research using the hedonic price theory were always collecting the objective secondary data, such as the number of rooms and the different facilities, investigated the impact factors of room price. However, the accommodation is a service rather than a product, so what really explains the difference in customer behavior is not based on any objective characteristics, but on the customer’s own perception of the characteristics (de Oliveira Santos, 2016).
However, the past studies that used hedonic price theory did not focus on the subjective suggestions of customers. In this study, the Subjective data from customer were be collected form HOSTERLWORLD.
Based on the above discussion, this study used the feature price theory to explore the characteristics of factors that affect the prices of hostels. The research aims are as follows:
(1) Analysis of the status of ASEAN hostel at HOSTELWORLD. (2) Applying the hedonic price theory to explore the factors that affecting the price of
hostels in the ASEAN. (3) Provide the pricing reference for ASEAN hostel manager.
Literature Review 1.Hostel The main customers of hostel are backpackers (Musa and Thirumoorthi, 2011). In
addition, the most different between hotel and hostel are hostel includes shared bed and private room (Brochado et al., 2015), and have a spacious public space for backpackers communicate with each other (Brochado et al., 2015).
Using the online booking agent is one of the most popular ways to book a hostel (Oliveira-Brochado & Gameiro, 2013). The HOSTELWORLD is the largest hostel booking site (de Oliveira Santos, 2016). This study used the sampled data in the HOSTELWORLD website as the basis for research data collection
2.The hedonic price theory The hedonic price theory decomposed the market price into different characteristics,
because it tends to know the effect of each feature of the product or service on the market price (de Oliveira Santos, 2016).
The hedonic price theory was used in real estate market, but there have been many empirical studies that have applied the hedonic price theory to the hotel industry (Chen & Rothschild, 2010; Lee & Jang, 2010; Rigall-I-Torrent & Fluvià, 2011).
For hotels, the applicable features are not only the objective features such as star rating, hotel facilities, and room service, but also the subjective reviews and ratings of customers (Schamel, 2012). However, many past researches on the hedonic price theory of accommodation facilities are based on objective characteristics (de Oliveira Santos, 2016).
But what really explains the difference in customer behavior is not based on any objective characteristics, but on the customer’s own perception of the characteristics, because accommodation is a service rather than a product (de Oliveira Santos, 2016).
Based on the above-mentioned literature, this study aims to evaluate the subjective characteristics of the hostels by the customers and explore the factors that influence the prices of the hostels.

PIM 1st International Conference
June, 2018
N 78
accommodation types
number of reviews
Methods The observed samples of this study are all ASEAN Hostels on HOSTELWORLD
excluded the data without customer review comments. The numbers of valid data are 1,986 hostels. And the Subjective characteristics include atmosphere, cleanliness, facilities, location, staff and security was collected from the customer who give the rating to the Hostel that customer stay in HOSTELWORLD, value for money was not be included because of the price factors were already contained.
The descriptive statistics and multiple regressions are used. The independent variables (IV) include the natural log of the number of reviews, accommodation types and ratings for safety, location, staff, atmosphere, cleanliness, facilities; the dependent variable (DV) is the natural log of the average price of the hostel in order to fulfill the assumption of normal distribution for the DV.
Figure 1. The research framework. Results and Discussion The results of descriptive statistics showed that the minimum price of dorms is USD $0.58, the highest one is USD $164, and the average price is USD $15.2. Compare to the West Country, this price is more affordable to backpacker to stay in a long time.
Table 1 showed that among the six hostel characteristics, number of reviews and accommodation types, only security, cleanliness and private’s room have significantly positive effects on hostel's room price.
Table 1: The result for the hedonic price’s estimation
dependent variable:
ln (average price)
coefficient VIF
safety
location
staff
atmosphere
cleanliness
facilities
private room price
Room price
shared bed room price
subje
ctive
chara
cteris
tics

PIM 1st International Conference
June, 2018
N 79
Dorms -.148*** 1.033
Privates .543*** 2.905
Number of reviews (ln) .023 1.471
Security .081** 2.907
Location .028 2.738
Staff -.131*** 4.126
Atmosphere -.065* 5.006
Cleanliness .181*** 1.108
Facilities .067 1.104
*p<.05 **p<.01 ***p<.001 Cleanliness is the most important factor for consumers when they choosing a hostel
(Oliveira-Brochado & Gameiro, 2013), especially for backpacker (Musa & Thirumoorthi, 2011). Hostels with higher security ratings, customers are also willing to pay higher prices (Rigall-I-Torrent & Fluvià, 2011). Cró and Martins (2017) exposing the strong link between cleanliness of a hostel and perceptions of security and suggested that hostels should put a strong emphasis on cleanliness in order to make their guests feel more secure.
The ratings of staff, atmosphere, and dorm-type of room had significantly negative effects on price.
Number of reviews, location and facilities had non- significant effects on price. Thus, managers of hostels in ASEAN should not be willing to spend considerable time and resources to improve the latter three characteristics.
Conclusions It is important to understand the pricing factors of hostels, because the rapid
development of hostels and one of the main reasons why backpackers choose hostels is to provide cheap beds (Thyne et al., 2005).
These results are guidelines for operational management about price decision strategy for hostel managers who are facing fierce competition in the hostel market. Through the subjective review ratings, hostel managers could identify the most influential determinants of the hostel room price. And the results showed hostels with higher ratings on cleanliness and security lead to higher room price, so these two factors are most important if hostel managers want increase the room price.
The results are limited to the hostel who only registered on HOSTELWORLD and had user reviews. So if the hostel did not register on the official website or have any reviews could not be incloud.

PIM 1st International Conference
June, 2018
N 80
Future studies could include other types of online booking websites and have more comprehensive explanations. The factors between different countries in ASEAN could also be discussed in the future studies.
References
Brochado, A., Rita, P., & Gameiro, C. (2015). Exploring backpackers’ perceptions of the hostel service quality. International Journal of Contemporary Hospitality Management, 27(8), 1839-1855.
Chen, C.-F., & Rothschild, R. (2010). An application of hedonic pricing analysis to the case of hotel rooms in Taipei. Tourism Economics, 16(3), 685-694.
Cró, S., & Martins, A. M. (2017). The importance of security for hostel price premiums: European empirical evidence. Tourism management, 60, 159-165.
de Oliveira Santos, G. E. (2016). Worldwide hedonic prices of subjective characteristics of hostels. Tourism Management, 52, 451-454.
Fitzgerald, M. (2000). Fear, loathing, and banana pancakes on the traveller trail: Adventures in backpacking. The Austin Chronicle, 24(3), 2000.
Koh, S. G., & Kwok, A. O. (2016). ASEAN beyond talk shop: a rejoinder to regional tourism. Current Issues in Tourism, 1-6.
Lee, S. K., & Jang, S. S. (2010). Room rates of US airport hotels: examining the dual effects of proximities. Journal of Travel Research. , 50(2), 186-197.
Musa, G., & Thirumoorthi, T. (2011). Red Palm: exploring service quality and servicescape of the best backpacker hostel in Asia. Current Issues in Tourism, 14(2), 103-120.
Oliveira-Brochado, A., & Gameiro, C. (2013). Toward a better understanding of backpackers’ motivations. Tekhne, 11(2), 92-99.
Rigall-I-Torrent, R., & Fluvià, M. (2011). Managing tourism products and destinations embedding public good components: a hedonic approach. Tourism Management, 32(2), 244-255.
Schamel, G. (2012). Weekend vs. midweek stays: Modelling hotel room rates in a small market. International Journal of Hospitality Management, 31(4), 1113-1118.
Thrane, C. (2005). Hedonic price models and sun-and-beach package tours: the Norwegian case. Journal of Travel Research, 43(3), 302-308.
World Travel & Tourism Council. (2015). Global Talent Trends and Issues for the Travel & Tourism Sector. Retrived September 10, 2017 from https://www.wttc.org/-/media/382bb1e90c374262bc951226a6618201.ashx

PIM The 1st International Conference
June 21, 2018
N 82
INFLUENCE OF SERVICE QUALITY, BRAND IMAGE AND CUSTOMER SATISFACTION ON CUSTOMER LOYALTY: CASE STUDY OF DINING RESTAURANT IN YANGON, MYANMAR
Kyaw Aung Htike1, Pithoon Thanabordeekij2
1,2International Program, Panyapiwat Institute of Management ABSTRACT
This research study was capitalized to find out the most influencing factors which are moving the affiliation between five dimensions of perceived service quality, brand image and customer satisfaction on customer loyalty toward of dining restaurant business in Yangon, Myanmar. The model of this research study adopted the five dimensions of Reliability, Responsiveness, Assurance, and Empathy and tangible from the SERVQUAL model with customer loyalty, brand image, customer satisfaction to test how these variable affect the customer decision on choosing their dining restaurant. The quantitative questionnaires were approached and collected from 600 customers who experienced the service of Dining restaurant for data collection with paper survey and an online survey in Yangon.The survey was conducted among dining restaurant users of top three dining restaurants in Yangon: YanKin - Kyay Oh (YKKO), and CP Five Star Extra (CP), and Thai Kitchen (TK). Regression analysis was used to examine the results. The findings show that users’ perceived ease of use is the primary predictor of usage intention and also perceived usefulness and perceived ease of use are strongly affected by social participation and self-efficacy of using dining restaurant. This research study was analyzed using linear regression analysis to confirm the results and the study results of suggested that the “Tangibility” dimension heavily influences customer loyalty. Moreover, there is also a demonstration that brand image is a secondary positively influence factor over customer satisfaction and loyalty.
Keywords: Perceived service quality, Brand image, Customer satisfaction, Customer
loyalty, Dining restaurant Introduction
The dining restaurant industry has been growing in Yangon recently since Myanmar has been opened up the country for foreign investors to come to invest. A lot of the people in Yangon are changing their lifestyle patterns as well as their living standards. (Sonny Aung Khin: a pioneer of Myanmar cuisine, Myanmar Times, 2014). (Khin,

PIM The 1st International Conference
June 21, 2018
N 83
(Dictionary)2014) Therefore, there is also a significant changing in Yangon people’s behavior of purchasing food. The current opening of Myanmar's economy has led to an invasion of foreign investments and a rising middle class. The dining restaurant industry has been growing up (French, Story, Fulkerson, & Hannan, 2001)(Richardson & Aguir, 2003) It can be found in most of the shopping malls and downtown area. People enjoy eating out and shopping. The development of the social, cultural and economic is influencing the eating habits of local consumers. Myanmar citizens tend to make their choice based on a social factor, demographic factors, and marketing factors. However, the driving forces behind the growth of the change in consumer’s preference is still a question mark for the most marketer to find out and prioritize their business strategy for generating a high profit to sustain their organization. Nowadays, all vendors are focusing on trying so hard to understand the consumers and their buying behaviors. However, marketers can only study about their consumer demographics such as age, gender, and income to understand consumer behavior in the dining restaurant. To gain a better understanding of consumers, research study of this topic are crucial for organtiion, brand, and industry because it will be learning the effects of the consumer’s perceptions in beyond the bare eye of marketers. The dining restaurants such as Pizza Company, KFC, YKKO Kyay-Oh & BBQ, CP Five Star Friend Chicken Franchise shop and Thai Kitchen are fighting a severe business competition in most of Myanmar as well as in many cities of Yangon. Although these brand keeps expanding their outlets to be convenience brand of choice, it never is enough if the company does not know what the actual service perceptions of the customers are. Apparently, customer satisfaction is also a significant element to be considered for every organization; either they are service sector or the private sector.
In this competitive market, the dining restaurants have to keep up with their competitors in term of products and services offer to satisfy customers. Delivering an excellent quality is essential to the success of the dining restaurant business. Despite increasing in competition or customer demand, the owner of the dining restaurant only can wish that their organization could continuously provide a reasonable standard of their service to the customer. Therefore, the need of research paper about the understanding the factors that impact customer loyalty must be beneficial for the service provider to design and attribute the right offer to the customer in Yangon.
So, that is a good reason for capitalizing the main objective of this study is to investigate the critical success factors customer satisfaction on customer loyalty towards dining restaurants in Yangon and to identify the relationship between five dimensions (SERVQUAL), brand image and customer satisfaction towards customer loyalty in the dining restaurant industry. Dining Restaurant is a style of eating that usually takes place inexpensive restaurants,

PIM The 1st International Conference
June 21, 2018
N 84
where especially good food is served to people, often in a formal way (Cambridge Dictionary, 2018)
Literature review, Service Quality
In the business competition environment, several factors drive restaurants business to success. Among them, service quality is always one of the important key success factors which lead the growth of the restaurant business and differentiate itself from their competitors. Providing high-quality service with the various performance is the best opportunity to influence customers' satisfaction and loyalty. (Feick, Lee, & & Lee, 2001)Many restaurants are trying to provide high-quality service which is beyond customer's expectation to maintain their customer and survive in a competitive (Dabholkar, Shepherd, & & Thorpe, 2000). Cronin & Taylor (1992) suggested that one of the most important strategies to improve service quality and place itself more effectively in the marketplace. The SERVQUAL Model
The SERVQUAL approach was designed by (Parasuraman, Zeithaml, & Berry, A Conceptual Model of Service Quality and Its Implications for Future Research, 1985), in response to the lack of conclusive published research to the lack of specific published research material relating to the management of service quality. Since service quality has been described as intangible, desperate and indivisible, it is tough to measure it objectively by (Zhao, Bai, & Hui, 2002).Past researchers have indicated, reconstructed and proposed that various versions of the SERVQUAL model to take into consideration which is mainly related to different service sectors (Pizam et al., 2016). The SERVQUAL is one of the instruments which is widely used and purposes to help service providers determine and improve the service quality under their management. SERVQUAL model is based on customers' evaluation of the quality of service across five distinct dimensions for service sectors: tangibility, reliability, assurance, responsiveness, and empathy.
1) Tangibility is the future of the restaurant, which the customer will experience once they are in, which is defined by (Ramseook-Munhurrun, 2012) The tangible factors related to restaurant include comfortable store designs, well-dressed service employee, clean dining area, seating, hygienic equipment for customer use and enough service employee to provide professional services.
2) According to (Zeithaml, 1988) reliability is the ability to provide a promised service attentively and precisely. For the restaurant industry, reliability means providing dining and

PIM The 1st International Conference
June 21, 2018
N 85
food with the right temperature and serving error-free orders to the customers which means providing quality products and services.
3) Responsiveness means helping customers willingly and provides prompt service. To be a helpful and responsive service provider, the service employees have to contribute prompt service, timely service, and nice change, dependability, prepared and willing to attend to the customer. It is a crucial factor for dining restaurant to focus on service efficiency by providing quick and prompt service to deliver quality service.
4) Assurance is knowledge and politeness of service provider and their skill to express trust and confidence to the customers Zeithaml (1988). Employees who are knowledgeable to solve customer problems and able to answer customer's questions are a success factor for the service industry.
5) Empathy can be defined as individualized attention and care that restaurants staff provide to its customers (Gorla, 2011) (Ball & Millen, 2003). The customer will be happier and feel comfortable by providing individual attention to the customer and personal service. The employees of the excellent restaurant field provide the best and specific need of their customer.
Customer Satisfaction: Customer satisfaction can be defined as an individual’s feeling such as enjoyment or disappointment that can be resulted by comparing a product’s perceived performance due to a particular expectation (Oliver, 1981) (Robertson & Brady). Customer satisfaction is the leading indicator of a company’s past, current, and future performance to determine retention of the customers by (2004). As customer service is critical importance in the restaurant industry, restaurant owner and manager need to ensure that customer satisfaction is reached (Harrington, Ottenbacher, Staggs, & Powell, 2011). (Jones & Sasser (1995) expressed that customer loyalty is “a feeling of attachment to or affection for a company’s people, products, or services.” (Basu & Dick, 1994) Proposed that true loyalty only exist when repeat consumer coincides with a higher relative perspective. Customer satisfaction and loyalty can be built by offering different services to the customers. Consequently, the core value of a loyal customer will be retaining a sustainable relationship with customers. A higher level of customer loyalty can be seen from a satisfied customer. According to (Evanschitzky et al., 2012) loyal customers are pleased to pay more with strong purchase intentions and hardly change.
Brand Image: Brand image is the perception of a customer of the band or the way they view it. According to Keller (1993) brand image is a sign or symbolic picture that

PIM The 1st International Conference
June 21, 2018
N 86
consists all the information and expectation related to product and service, created with the mindset of people. Aaker (1997) also defines the brand image that the ability to identify and remember a brand as a member of a certain product category of potential customer. The most important part of the brand image is awareness of the brand which customer can recall a certain product before buying. The basic attribute of a dining restaurant is important for the restaurant growth because the brand has a strength to provide basic steps to differentiate among competitors. To meet long-term competitive advantages and successful customer loyalty plays a vital role in the global competitive market (Aksoy, 2013,2014). Moreover, (Dominici & Guzzo (2010), define that managers must create and accomplish strategies to achieve the trust and loyalty of their current customers. Berezan et al. (2013) also define that a loyal customer is a regular contributor to the shop revenue. Besides, they are a free worth of mouth providers who can make the new customers’ transport ((Garnefeld et al., 2011,2014) Framework:
The conceptual framework of this research appears below:
Adapted from: (Cronin & Taylor, S. (1992); (Aydin & Ozer, G. (2005), Parasuraman, A.,
Zeithaml, V., & Berry, L. (1985), (Szymanski & & Henard, D. (2001), (Ryu, Han, , & & Jang, (2010), (Kivela, Inbakaran, , & & Reece, (1999); Kim, (Hertzman & & Hwang, (2010); (Namkung & Jang, 2007)

PIM The 1st International Conference
June 21, 2018
N 87
Research objectives
The purpose of this study is to examine the relationship between five dimensions of SERVQUAL model, brand image and customer satisfaction towards customer loyalty. Hypothesis, Perceived Service Quality and Customer satisfaction
Restaurants are facing an increasingly competitive pressure to survive, and significant efforts are being devoted to better understanding customers’ needs and to provide the services that meet their expectations. The perceived service quality is critical to the success of organizations. It is a direct link to customer satisfaction and behavioral intentions ((Parasuraman, 1995)Service quality has a direct impact on customer loyalty, although indirectly, which helps customer dictate their satisfaction with a provided service by the restaurant (Orel & and Kara, 2014).Therefore, the following hypotheses were proposed:
H1a: Tangibility is positively related to customer satisfaction. H1b: Responsiveness is positively related to customer satisfaction. H1c: Reliability is positively related to customer satisfaction. H1d: Assurance is positively related to customer satisfaction. H1e: Empathy is positively related to customer satisfaction. Perceived Service Quality and Customer Loyalty (Cronin & Taylor (1992), Measuring Service Quality: A Reexamination and Extension
before hypothesized that the perceived service quality has a positive effect when it comes to consumer loyalty. The researcher conducted previously point out that there is a definite relationship between perceived quality and customer loyalty ((Aydin & & Ozer, 2005).It also originated that customer purchase decision and brand loyalty has a direct relationship with perceived quality, especially when customers have very little information about the harvests ((Aaker, 1991) ( (Armstrong & & Kotler, 2003). Thus, we can now develop the hypothesis as follow:
H2a: Tangibility is positively related to Customer Loyalty. H2b: Responsiveness is positively related to Customer Loyalty. H2c: Reliability is positively related to Customer Loyalty. H2d: Assurance is positively related to Customer Loyalty. H2e: Empathy is positively related to Customer Loyalty. Brand Image, Customer Satisfaction, and Customer Loyalty

PIM The 1st International Conference
June 21, 2018
N 88
Customer satisfaction depends upon the users’ perception of past events or evokes (1980)., A positive relationship between brand attitude, the degree of intensity and also consumer repurchase pattern. Studies in the field of relationship between satisfaction and brand loyalty have implied that the consumer opts for their preferred brand (Szymanski & & Henard, 2001). However, the researchers have shown the image of the restaurant, was more influential. When it comes to customer satisfaction and significance which is also a byproduct of customer loyalty (Ryu, Han, & & Jang, 2010) ( Kivela, Inbakaran, & & Reece, 1999) (Kim, Hertzman, & & Hwang, 2010) (Namkung & & Jang, 2007). Marzocchi et al. (2013) stated that customer creates a healthy relationship with the brand to convey their identity and create a positive emotion towards the brand. A brand loyal customer is a person who has a positive attitude towards the brand identification. Customers purchase brands related to their own opinion (Sirgy, 1982), and it can be obtained by retaining supportive attitude to particular brands (Ekinci et al., 2013) So, in respect of the facts mentioned above we now extend this hypothesis as:
H3: Brand Image is positively influenced by Customer satisfaction. H4: Brand Image is positively influenced by customer loyalty. H5: Customer satisfaction is positively influenced by customer loyalty Customer satisfaction and customer loyalty It was also found that a higher number of customers who declare themselves that
they are loyal customer did shift to another brand although they are pleased with their regular brand. Therefore, to become loyal and profitable for the company, a customer must be highly satisfied. The decline of customer satisfaction will lead to a significant decline in customer loyalty (Jones & & Sasser, 1995
Research Methodology The quantitative method is applied for analyzing the survey of this study, and the
target population of the study is customers who had experienced in the international dining restaurant in Yangon namely YKKO, CP Five Star extra. Moreover, the data collection process had been taken as a sample through simple random sampling technique. Proportion sampling was used in this method to the targeted customer with the total of 600 customers, which is 34% (200 persons) from YKKO, 33% (200 persons) from CP Five Star Extra and 33% (200 persons) from Thai Kitchen. Five-point Likers scales with the range of “strongly disagree” (1) and “strongly agree” (5) will be used in quantity in this study based on customer involvements and observations.

PIM The 1st International Conference
June 21, 2018
N 89
Table 1: Cronbach’s Alpha Scale Reliability Results
Variables I
tem no Cronbach's
Alpha (n=30) Cronbach's
Alpha (n=600)
Perceived Quality
Tangible 4 0.704 0.856 Reliability 5 0.734 0.727 Responsiv
eness 4 0.904 0.829 Assurance 4 0.883 0.844 Empathy 5 0.927 0.860
Brand Image 1
6 0.953 0.948 Customer Satisfaction 5 0.934 0.915
Customer loyalty 7 0.929 0.886 Table 1 shows that Cronbach’s alpha is used to test the questionnaires are reliability
before the distribution. The pre-test was tested by using Cronbach’s alpha test, and it involves 30 respondents for pre-test questionnaires. Table 1 shows that Cronbach’s alpha of the pre-test for 30 respondents are from 0.704 to 0.929. The actual Cronbach’s alpha of variables is from 0.856 to 0.886. The Cronbach’s alpha value must be above 0.7 that proves the questionnaires of scales have consistency (Cronbach, 1951)Therefore, all of the constructs of this research are accepted.( (Zikmund W., Babin, Carr, & & Griff, 2010,). In this study, a pre-test was tested by using Cronbach’s alpha test, and it involves 30 respondents for pre-test questionnaires.
Results of the Study From the respondents’ demographics the personal details are classified as
gender, age, occupation, education, and monthly income level. Based on the results, the majority of the respondents are male, which consist of 56% of the sample size and aged between 26-35 years old represent the most significant age group consists of 36%. Besides that, 76% of the respondents are holding a bachelor degree, and the majority are working for a private organization. Moreover, 33% of respondent monthly incomes are 300,001 Ks - 500,000 Ks. As for general information of the respondents, it was found that most of the respondents preferred CP Five Star Extra dining restaurant which consists of 40%. Besides, 44% of the respondents visit dining restaurant during dinner time. Also, 38% respondents visit dining restaurant once a week. 37% of the respondents spend about 5,000 MMK - 10,000 MMK for a meal when they visit to dine restaurant. However, most of the respondents will dine restaurant due to entertainment purposes which consist of 45%.

PIM The 1st International Conference
June 21, 2018
N 90
Lastly, 36% of respondents to visit dining restaurant with colleague group. Relationship of relevant variables and the research hypotheses N
o. Hypothesis Path β
t-test
p-value
Hypothesis Supported
H1a
Tangible – Satisfaction 0
.301** 6
.913 0
.000 YES
H1b
Reliability – Satisfaction 0
.147** 3
.456 0
.001 YES
H1c
Responsiveness – Satisfaction
0.181**
3.579
0.000
YES
H1d
Assurance – Satisfaction 0
.115** 2
.493 0
.013 YES
H1e
Empathy – Satisfaction
0.080 1
.503 0
.133 NO
H2a
Tangible – Loyalty 0
.104* 2
.154 0
.032 YES
H2b
Reliability – Loyalty 0
.180* 3
.826 0
.000 YES
H2c
Responsiveness – Loyalty
0.144**
2.571
0.010
YES
H2d
Assurance – Loyalty 0
.102* 1
.998 0
.046 YES
H2e
Empathy – Loyalty 0
.193** 3
.270 0
.001 YES
H3
Brand Image - Satisfaction
0.765**
29.030
0.000
YES
H4
Brand Image – Loyalty 0
.650** 2
0.894 0
.000 YES
H5
Satisfaction – Loyalty 0
.697** 2
3.793 0
.000 YES
*significant at 0.05, ** significant at 0.01
Based on the finding of Table 2, the results showed that tangible, responsiveness, assurance and reliability had positively impacted on customer satisfaction. Only empathy was insignificant. Among all the five independent variables, Tangible had the strongest
influence on customer satisfaction (β = 0.301), followed by Responsibility (β = 0.181),
PIM The 1st International Conference
June 21, 2018
N 91
Reliability (β = 0.147), assurance (β = 0.115) and Empathy (β = 0.080). As for the customer loyalty, the five dimensions had a significant relationship with loyalty. Empathy had the
strongest influence on customer loyalty (β= 0.193). Moreover, the Brand image shows positively influence both customer satisfaction and loyalty. Recommendation
The implication as a reminding note, the primary goal of the study was to investigate service quality, brand image and customer satisfaction toward customer loyalty in the dining restaurant service dimension. After the finding, customer satisfaction is found that it played an essential role in determining the success of the dining restaurant business. Customers always love to taste unique and impressive things that favor them. By the time, the customer is not satisfied with the restaurant service or attribution; they may change to the other restaurants. Therefore, the managers could also determine the impact of the restaurant images on the level of customer satisfaction.
The result of the study also showed that tangibility was the most substantial positive significant impact than other dimensions towards customer satisfaction and loyalty. Dining restaurant services should be paying attention to the appearance of physical facilities, modern equipment, the appearance of staff and attractive service materials. YKKO, CP Five Star, and Thai Kitchen must prioritize their strategies to taking care their physical factors to their customers such as kind grooming staffs, eyes catching store decoration and beautiful menu board, etc.
The dining restaurant should improve assurance by becoming more courteous, knowledgeable and trustworthiness during the service encounter, the period customer serving, and after the customer leaves the restaurant too. It is always essential to improve employee performance through increased employee motivation, improved service skills, training course and awareness of company policies.
Moreover, dining restaurants also need to focus on service providing such as fresh food with the right temperature and no serving error. It means providing quality products and services which can maintain customer high valued perceptions and improve employing those services. Managers should take time to listen to their customers for complaint and useful feedback to make a better future improvement. This result supports the need for the owner and manager of dining restaurant to highlight on service; a quality especially on assures reliability and responsiveness. The direct effect of customer satisfaction on loyalty

PIM The 1st International Conference
June 21, 2018
N 92
should support the need to monitor the feedback and service quality important continually. Conclusion
This study was conducted to have the better understanding of customers towards dining restaurant by clarifying the factors of five dimension and brand image. This research project has fulfilled its objectives to identify the relationship of the six variables towards customer satisfaction and customer loyalty. After testing the Regression Analysis, and Internal Reliability Analysis Test, the result showed that almost all the independent variables include tangible, responsiveness, assurance and empathy and brand image have the significant positive relationship with the customer satisfaction except reliability. However, security, confidence, and responsiveness were not the positively substantial relationship with the customer loyalty.
In conclusion, the outcome of the research indicates that service quality and brand image are the most critical factors that were influencing dining restaurant. Thus, this study provides information for the local investor who may want to investigate more on essential elements of success in customer loyalty towards international dining restaurant in Myanmar. Limitation
In this study, there are some limitations during the progress of the research. Boundaries are essential for the future researchers to learn and acknowledge as a way to improve the quality of the study. Regarding questionnaire, distribution was selected only three shopping centers such as Junction City, Junction Square and Myanmar Plaza. Most of the shoppers were young Myanmar peoples, and so receiving gender and age status was challenging to be the equal ratio. Finally, this survey questionnaire. Would not perfectly cover for the entire Myanmar population. Future study should expand the scope to conduct at a nationwide to become more generalized.
Acknowledgments My sincere thankfulness is extended to my advisor, the Dean and my all anonymous respondents that giving their valuable time for answering the questionnaires. References Aaker, 1. (1991). Managing Brand Equity: Capitalizing on the Value of a Brand Name. Aksoy, 2. (2013,2014).Linking satisfaction to share of deposits: an application of the Wallet
Allocation Rule, http://filene.org/research/reports.Lerzan Aksoy, (2014) "Linking

PIM The 1st International Conference
June 21, 2018
N 93
satisfaction to share of deposits: an application of the Wallet Allocation Rule," Vol. 32 Issue: 1, pp.28-42, https://doi.org/10.1108/IJBM-03-2013-0025.
A. (1993). Conceptualizing, Measuring, and Managing Customer-Based Brand Equity. Journal of Marketing, Vol. 57, No. 1 (Jan. 1993), pp. 1-22.
Aydin, & & Ozer, 2005. Customer loyalty and the effect of switching costs as a moderator variable: A case in the Turkish mobile phone market. Marketing Intelligence & Planning,, Vol. 23 Issue: 1, pp.89-103, https://doi.org/10.1108/02634500510577492.
A Cognitive Model of the Antecedents and Consequences of Satisfaction Decisions. Journal of Marketing Research, Vol. 17, No. 4 (Nov. 1980), pp. 460-469.
Armstrong, & & Kotler, 2003. (2003). Fundamentos de marketing. Aydin, S., & Ozer, G. (2005). (2005). An Empirical Investigation of Customer Loyalty in
Telecommunication Industry in Albania. Mediterranean Journal of Social Sciences, Vol 6 No 1 S1 January 2015.
Al, P. e. (2016). Customer satisfaction and its measurement in hospitality enterprises: a revisit and update. An article in International Journal of Contemporary Hospitality Management.
B. e. (2013). Sustainable hotel practices and nationality: The impact on guest satisfaction and guest intention to return. International Journal of Hospitality Management (Int J Hospital Manag), 34(1):227–233 · September 2013.
Ball, & Millen. (2003). Applying SERVQUAL to Web sites: an exploratory study Vol. 20 Issue: 8, pp.919-935, https://doi.org/ 10.1108/02656710310493634. Downloads: The full text of this document has, INTERNATIONAL JOURNAL OF QUALITY & RELIABILITY MANAGEMENT.
Basu, & Dick (1994) Customer Loyalty: Toward an Integrated Conceptual Framework. Journal
of the Academy of Marketing Science, 22(2): 99-113. Brady. (2001)., The Mediating Role of Perceived Value on the Relationship between Service
Quality and Customer Satisfaction: Evidence from Indonesian Airline Passengers. Procedia Economics and Finance,https://www.sciencedirect.com/science/article/pii/S2212567116000484, 35 ( 2016 ) 388 – 395.
Cronbach, 1. (1951). Coefficient alpha and the internal structure of tests. Psychometrika, September 1951, Volume 16, Issue 3, pp 297–334.
Cambridge. (2018)., Definition of “fine dining” - English Dictionary. Cambridge Advanced, Learner's Dictionary & Thesaurus © Cambridge University Press,)https://dictionary.cambridge.org/us/dictionary/.
Cambridge. (Dictionary,2018). Cronin, & &Taylor. (1992). Customer Satisfaction.

PIM The 1st International Conference
June 21, 2018
N 94
Cronin, & Taylor (1992) Measuring Service Quality: A Reexamination and Extension. Journal of Marketing, Vol. 56, No. 3 (Jul. 1992), pp. 55-68.
Cronin, J., & Taylor, S. (1992); Measuring Service Quality: A Reexamination and Extension. Journal of Marketing, Vol. 56, No. 3,
Dabholkar, Shepherd, & & Thorpe. (2000). A Comprehensive Framework for Service Quality: An Investigation of Critical Conceptual and Measurement Issues through a Longitudinal Study.
Dictionary, C. (n.d.). Dominici, & Guzzo (2010) Customer Satisfaction in the Hotel Industry: A Case Study from
Sicily. International Journal of Marketing Studies, Vol. 2, No. 2, pp. 3-12, 2010. Evanschitzky et al., (. (2012). Customer–company identification and the effectiveness of
loyalty programs. Journal of Business Research, Volume 68, Issue 2. Ekinci et al., 2. (2013)., Differences in service quality perceptions of stakeholders in the hotel
industry. International Journal of Contemporary Hospitality Management, Vol. 27 Issue: 1, pp.130-146, https://doi.org/10.1108/IJCHM-08-2013-0350.
Feick, Lee, & & lee. (2001). The impact of switching costs on the customer satisfaction‐loyalty link: mobile phone service in France.
French, Story, Fulkerson, & Hannan. (2001). Fast food restaurant use among adolescents: associations with nutrient intake, food choices and behavioral and psychosocial variables.
Garnefeld et al., 2. (2011,2014). Turning dissatisfied into satisfied customers: How referral reward. Journal of Retailing and Consumer Services, Journal of Retailing and Consumer Services 21 (2014) 897–904.
Gorla. (2011). Mixed convective boundary layer flow over a vertical wedge embedded in a porous medium saturated with a nanofluid: Natural Convection Dominated Regime. Nanoscale Research Letters, 6(1): 207.
Hertzman, & & Hwang, (2010); College Students and Quick-Service Restaurants: How Students Perceive Restaurant Food and Services. Food Service Business Research, Pages 346-359 | Published online: 20 Nov 2010.
Jones, & Sasser (1995) Why Satisfied Customers Defect,https://www.hbs.edu/faculty/Pages/item.aspx?num=3955. Market research.
J. L. (n.d.)., Dimensions of brand personality. MR, Journal of Marketing Research; Aug 1997; 34, 3; ABI/INFORM Global.
Jones, & & Sasser, 1995.Why Satisfied Customers Defect. An article in Harvard business review, 73(6) · January 1995.
Khin, S. A. (2014). Myanmar cuisine. Myanmar Time.

PIM The 1st International Conference
June 21, 2018
N 95
Kim, Hertzman, & & Hwang, 2. (2010). College Students and Quick-Service Restaurants: How Students Perceive Restaurant Food and Services. Journal of food service business research, Pages 346-359 | Published online: 20 Nov 2010.
Kivela, Inbakaran, & & Reece, 1999 Consumer research in the restaurant environment, Part 1: A conceptual model of dining satisfaction and return patronage. International Journal of Contemporary Hospitality Management, Vol. 11 Issue: 5, pp.205-222, https://doi.org/10.1108/09596119910272739.
K. (1993). Conceptualizing, Measuring, and Managing Customer-Based Brand Equity. Marketing,http://www.jstor.org/stable/i253424, Vol. 57, No. 1, Jan. 1993.
Kivela, Inbakaran, & & Reece, (1999); Consumer research in the restaurant environment, Part 1: A conceptual model of dining satisfaction and return patronage. International Journal of Contemporary Hospitality Management, Vol. 11 Issue: 5, pp.205-222, https://doi.org/10.1108/09596119910272739.
M. e. (2013). Brand communities: loyal to the community or the brand. European Journal of Marketing, Vol. 47 Issue: 1/2, pp.93-114, https://doi.org/10.1108/03090561311285475.
Namkung & Jang, (. (2007). Does Food Quality Matter in Restaurants? It is Impact On Customer Satisfaction and Behavioral Intentions. Journal of Hospitality & Tourism Research, 31(3):387-409 · August 2007.
Namkung, & & Jang, 2007). Does Food Quality Matter in Restaurants? It is Impact On Customer Satisfaction and Behavioral Intentions. Journal of Hospitality & Tourism Research, Vol 31, Issue 3, 2007.
L. (2004). Presence, Explicated.Communication Theory. Communication Theory, Volume 14, Issue 1, 1 February 2004, Pages 27–50, https://doi.org/10.1111/j.1468-2885.2004.tb00302.x. Oliver. (1981). Developing Better Measures of Consumer Satisfaction: Some Preliminary
Results. , Advances in Consumer Research, Volume 08, Pages: 94-99. Orel, (., & and Kara, 2014).Supermarket self-checkout service quality, customer satisfaction,
and loyalty: Empirical evidence from an emerging market. Journal of Retailing and Consumer Services (J Retailing Consum Serv), 21(2) · January 2013.
Ottenbacher, Staggs, & Powell, 2. (2011). College students and fast food - How students perceive restaurant brands. Cornell University. School of Hotel Administration, SAGE Publications, 41(3):68-74.
Parasuraman, e. a. (1995). The determinants of service quality: satisfiers and dissatisfiers. International Journal of Service Industry Management, Vol. 6 No. 5,1995, pp. 53-71.
Parasuraman. (1985). A Conceptual Model of Service Quality and Its Implications for Future Research. Marketing, Vol. 49, No. 4 (Autumn, 1985), pp. 41-50.
Parasuraman. (n.d.). A Conceptual Model of Service Quality and Its Implications for Future Research. Marketing.

PIM The 1st International Conference
June 21, 2018
N 96
Parasuraman, A., Zeithaml, V., & & Berry, L. (1985),. (1985). A Conceptual Model of Service Quality and Its Implications for Future Research. Journal of Marketing, Vol. 49, No. 4 (Autumn, 1985), pp. 41-50.
Parasuraman, Zeithaml, & Berry. (1985). A Conceptual Model of Service Quality and Its Implications for Future Research. Marketing, Vol. 49, No. 4 (Autumn, 1985), pp. 41-50.
Ryu, Han, & & Jang, 2010 Relationships among hedonic and utilitarian values, satisfaction and behavioral intentions in the fast‐casual restaurant industry. International Journal of Contemporary Hospitality Management, Vol. 22 Issue: 3, pp.416-432, https://doi.org/10.1108/09596111011035981.
Ramseook-Munhurrun. (2012). PERCEIVED SERVICE QUALITY IN RESTAURANT. INTERNATIONAL JOURNAL OF MANAGEMENT AND MARKETING RESEARCH , VOLUME 5 NUMBER 3 2012.
Richardson, & Aguir. (2003). CONSUMER CHANGE IN FAST FOOD PREFERENCE. Robertson, & Brady. (n.d.)., The Mediating Role of Perceived Value on the Relationship
between Service Quality and Customer Satisfaction: Evidence from Indonesian Airline Passengers. Procedia Economics and Finance, 35 ( 2016 ) 388 – 395.
Ryu, Han, & & Jang, (2010)., Relationships among hedonic and utilitarian values, satisfaction and behavioral intentions in the fast‐casual restaurant industry. International Journal of Contemporary Hospitality Management, Vol. 22 Issue: 3, pp.416-432, https://doi.org/10.1108/09596111011035981.
Szymanski, D., & & Henard, D. (2001), Customer satisfaction: A Meta-Analysis of the Empirical Evidence. Journal of the Academy of Marketing Science, Volume 29, No.1. Page 16-35.
Sirgy, 1. (1982). Self-Concept in Consumer Behavior: A Critical Review. Journal of Consumer Research, Vol. 9, No. 3 (Dec. 1982), pp. 287-300.
Szymanski, & & Henard, 2001, Customer Satisfaction: A Meta-Analysis of the Empirical Evidence. Journal of the Academy of Marketing Science, Vol 29, Issue 1, 2001.
Zeithaml. (1988). Consumer Perceptions of Price, Quality, and Value: A Means-End Model and Synthesis of Evidence. Journal of Marketing, Vol. 52, No. 3 (Jul. 1988), pp. 2-22.
Zhao, Bai, & Hui, 2002. Service Quality 2 Main conceptualizations and critique. https://www.mtk.ut.ee/sites/default/files/mtk/toimetised/febawb23, order no.742.
Zikmund W., Babin, Carr, & & Griff, 2010. (2010). Business Research Methods.

PIM 1st International Conference
June 21, 2018
N 97
INVESTIGATION OF MARKETING MIX ON CUSTOMERS’ SATISFACTION TOWARDS CUSTOMERS’ LOYALTY IN TELECOMMUNICATION SERVICES: A CASE STUDY OF TELECOMMUNICATION SERVICES IN MYANMAR
Susandi Thein1, Pithoon Thanabordeekij2
International Program, Faculty of, Panyapiwatt Institute of Management, Bangkok, Thailand
*Corresponding author, E-mail: [email protected], [email protected] ABSTRACT
This study mainly focuses on the analysis of marketing mix 7ps to customer satisfaction towards customer loyalty in the mobile network services which offered by the Myanmar Post and Telecommunications (MPT). In this research, the marketing mix 7Ps was used to determine the customer satisfaction and customer loyalty. The quantitative questionnaires were employed and five-point scale survey questions were used to collect the data from the sample size of 399 respondents who currently using or have ever used MPT. The collected data were analyzed with SPSS one-way ANOVA. The results indicated that the four factors from 7Ps, namely, product, people, process and physical evidence had significantly influencing on the customer satisfaction and customer loyalty of the MPT mobile network users and the enhancement of the customer satisfaction level was directly proportional to the customers loyalty.
Keywords: Marketing Mix 7ps, Customer satisfaction, Customer loyalty, Service business Introduction
Until 2014, Myanmar Post and Telecommunication (MPT) played as the former monopoly operator. (MPT official website, 2017) When the government began to allow the foreign investment, two foreign operators; Ooredoo (Qatar) and Telenor (Norway) has entered the Myanmar’s Telecom sector with 51% hold joint venture while 49% is for foreign partner. Telecommunication service is a kind of service provided via mobile IM cards and data by the service provider. According to the 2017 January record, 33 million out of 53 million (official population) are active mobile subscriptions. (MPT offical website, 2017)In more detail for current, Myanmar three main telecommunication service providers; Myanmar Post and Telecommunication (MPT), Telenor and Ooredoo have 23 million, 19 million and 8 million subscribers respectively. (The Myanmar Times, 2017).Therefore, MPT which used to be only one Telecommunication service provider of Myanmar is still running at first place.MPT which is fully named as Myanmar Post and Telecommunication is the oldest and renowned telecom service provider in Myanmar. MPT is pioneer operator in Myanmar and has been leading Myanmar telecom industry. With more than 23 million subscribers, MPT is

PIM 1st International Conference
June 21, 2018
N 98
providing fixed and mobile telecommunication service all over Myanmar.(MPT official website, 2017) In this competitive world, things are changed in very quickly according to the higher and higher technology. Even though today MPT is still running the first position of Telecom Business in Myanmar with the 23 million subscribers, MPT may need to plan its marketing strategies and business plan with fine research data to be sustainable in its market. Literature Review
Basically, it is used three main concepts to conduct this research. Those are the marketing mix (7Ps), customer satisfaction and customer loyalty. The marketing mix (7Ps) will be used to testify which factors of 7Ps and how they influence on customer satisfaction towards the customer loyalty of Telecom Service in Myanmar.
There was an argument between Kotler and Armstrong (2012) that 4P’s marketing mix is to analyze the product but for the service it is needed to be used the 7P’s marketing mix. That additional three dimensions; people, process and physical evidence are important for the service marketing. (Kotler & Armstrong, Principle of Marketing, 2012). Marketing mix is a business tool used by organizations to remain in the global competitive environment. To make decisions in marketing process, there are seven major sectors in marketing mix (7ps) which are mixed and blended in order to reach the best result to satisfy the needs and wants of customers. It is a set of tactical marketing tools including product, price, promotion, process, people, and physical evidence (7ps). (SouarYoucef, MahiKeltouma, AmeurImane, 2015).According to the (Kotler & Armstrong, Principle of Marketing, 2012), marketing has been suggested as the managing process of creating, producing, distribution and trading to make the demand based on the consumer’s need. That process is success or failure is related with the customer’s satisfaction on the product or service. The customer’s evaluation after a specific satisfaction is called transaction-specific satisfaction and the rating by the customers on the brand according to their experience is general overall satisfaction (Johnson, Michael,& Claes, 1991). In the other hand, customer satisfaction is the kind of emotional statement which happens when their expectation on the product or service is same or nearly matches with its perceived performance. Customer loyalty gives impact on the organization as an essential role to provide the long-term benefits. The loyal customers are willing to pay more to gain the qualities and advantages of their favorite brand. (Clottey, Collier, & Stodnick, 2008). Service Business
It can be categorized in four major service types termed as (1) intangibility, (2) heterogeneity, (3) inseparability and (4) perishability. (Kotler & Armstrong, 2010). Service which cannot be felt in objective sense as rather mere performances is known as intangibility. Heterogeneity is defined as service with the level of nuances and differences of offering service quality in detail even it is offering in same market. Inseparability is known as

PIM 1st International Conference
June 21, 2018
N 99
the service’s characteristics in consumption and production also defined the simultaneity of consumption and production; and perishability which is the attribution that cannot be kept as the product once service was offered. (Gronroos C. , 2000). Objectives
To investigate how marketing mix factors are related with the customer’s satisfaction on using MPT mobile network service.
To investigate how marketing mix factors are related to the customer’s loyalty on using MPT mobile network service.
To investigate how customer’s satisfaction are related to the customer’s loyalty on using MPT mobile network service.
Hypothesis Hypotheses in this research are as follows: H 1a: Product (7ps) has significant relationship with customer satisfaction. H 1b: Price (7ps) has significant relationship with customer satisfaction. H 1c: Place (7ps) has significant relationship with customer satisfaction. H 1d: Promotion (7ps) has significant relationship with customer satisfaction. H 1e: People (7ps) has significant relationship with customer satisfaction. H 1f: Process (7ps) has significant relationship with customer satisfaction. H 1g: Physical Evidence (7ps) has significant relationship with customer satisfaction. H 2a: Product (7ps) has significant relationship with customer loyalty. H 2b: Price (7ps) has significant relationship with customer loyalty. H 2c: Place (7ps) has significant relationship with customer loyalty. H 2d: Promotion (7ps) has significant relationship with customer loyalty. H 2e: People (7ps) has significant relationship with customer loyalty. H 2f: Process (7ps) has significant relationship with customer loyalty. H 2g: Physical evidence (7ps) has significant relationship with customer loyalty. H 3 : Customer satisfaction has significant relationship with customer loyalty.
Proposed Framework
Figure: 1 Conceptual Framework

PIM 1st International Conference
June 21, 2018
N 100
Source: Conceptual framework adopted from(Abu-ELSamen, Amjad, & et al., 2011) Research Methodology
The questionnaire is divided into 5 sections: Section (1) is put to select the respondents who have experiences in using MPT
mobile network. The variables which are only measured nominally are known as categorical variables. The demographic variables are measured at a nominal level in section (2) which consists of demographic information such as gender, age, highest education level, marital status, occupation, preferred mobile billing types, income and weekly recharge balance on mobile network. In Section (3), five-point scale survey questions are used in a forced choice method where the middle option is “Neither agree nor disagree”. The questions designed based on marketing mix 7Ps to measure the customer satisfaction. Section (4) is to evaluate overall customer satisfaction in order to analysis the relationship towards customer loyalty. Section (5) is to investigate the overall customer loyalty on using MPT mobile network. The questionnaires are distributed by online.
While there are 23 million subscribers for MPT, the minimum sample size 399 is selected(Yamane, 1967).Four hundred and thirty questionnaires are distributed to cover the 399 valid questionnaires.Thirty data samples were tested reliability result before the collected data were analyzed with SPSS one-way ANOVA to compare average (Mean), standard deviation (SD) and multiple regression analysis. Results and Discussion Table 1: Cronbach’s Alpha Scale Reliability Results Variables Questions No of
questions
Item no
Pre-test Cronbach’s Alpha (n=30)
Cronbach’s Alpha (n=399)
Product 9-13 5 5 0.788 0.818 Price 14-18 5 5 0.837 0.781 Place 19-23 5 5 0.737 0.713 Promotion 24-28 5 5 0.896 0.821 People 29-33 5 5 0.863 0.871 Process 34-38 5 5 0.889 0.887 PE 39-43 5 5 0.922 0.887 CS 44-50 7 7 0.913 0.903 CL 51-57 7 7 0.964 0.936
Source: Author’s calculation
Table 1 shows the reliability testing by using the Cronbach’s alpha to examine the reliability of the questions before the questionnaires are distributed. For the questionnaires pre-test, the answers from the 30 respondents was tested by using Cronbach’s alpha test and the results are from 0.737 to 0.964 as shown in table 1. Moreover, the actual

PIM 1st International Conference
June 21, 2018
N 101
Cronbach’s alpha of all variables is from 0.713 to 0.936. To prove that the questionnaires have good consistency, the Cronbach’s alpha value must be above 0.7 (Cronbach, 1951). Therefore, all variables’ alpha values are above 0.7 and are accepted. Table 2. Descriptive Statistics of Demographic Characteristics
Particulars Variables Frequency Percentage (%) Gender Female 250 62.7
Male 147 36.8 Other 2 0.5
Age (years) Under 20 32 8 20 to 30 295 73.9 31 to 40 62 15.5 41 to 50 10 2.5 51 and over 0 0 Education High School Diploma 3 0.8
College Certificate 43 10.8 Bachelor’s Degree 242 60.7 Master’s Degree 82 21.8 Doctorate Degree 15 3.8
Other 9 2.3 Marital status Single 351 88 Married 42 10.5 Other 6 1.5 Occupation Student 106 26.6
Employee in private company
135 33.8
Employee in government office
84 21.1
Owner of business 43 10.8 Table 2. Descriptive Statistics of Demographic Characteristics (cont.)
Particulars Variables Frequency Percentage (%) Housewife 3 0.8
Unemployed or retired 2 0.5 Other 26 6.5 Income Less than 100,000 Ks 50 12.5 100,001 Ks to 200,000 Ks 74 18.5 200,001 Ks to 500,000 Ks 157 39.3 500,001 Ks to 10,000,000 Ks 70 17.5 More than 10,000,000 Ks 48 12

PIM 1st International Conference
June 21, 2018
N 102
Weekly recharge
Less than 1,000 Ks
32
8.0 1,000 Ks to 2,500 Ks 76 19.0 2,501Ks to 3,500 Ks 59 14.8 3,501 Ks to 5,000 Ks 70 17.5 5,001 Ks to 10,000 Ks 94 23.6 More than 10,000 Ks 68 17.0
Source: Author’s calculation According to the demographic information, the major findings of the present research
are as follow, it was found that the dominant age range of most active MPT users is 20 to 30 years old. It suggests that the MPT Company should formulate its promotional advertisement campaign in order to persuade its dominant age group of customers. In educationally, it was found that people who has bachelor degree use more than the people who have other degrees. In devising its marketing mix strategies, MPT Company should manage to be capable the requirements and needs of those customers to be equivalent to the majority of the customer group. According to the marital status, single people were most likely users of mobile network. It can be concluded that single people have more budget and time than those who are married and they are more available and eager to use mobile network. It is good for MPT as it offers the promote packages such as night free calls, 3 days voice package and data packages are not only being perfect promotional strategies but also can improve the customer satisfaction level. In occupationally, the employees who work for the private company are the majority of mobile network users as they have mostly similar time frame of free time to use mobile network for social purpose. It was found that people who have middle income are the highest user. Table 3.Summary of Testing Hypotheses
Hypotheses Beta t-test p
Value Accepted/Rejected
H 1a Product Satisfaction 0.147* 3.715 0.000 Accepted H 1b Price Satisfaction. 0.041 0.976 0.330 Rejected H 1c Place Satisfaction. -0.035 -0.839 0.402 Rejected H 1d Promotion
Satisfaction. 0.026 0.643 0.521 Rejected
H 1e People Satisfaction. 0.203* 4.733 0.000 Accepted H 1f Process Satisfaction. 0.361* 7.608 0.000 Accepted H 1g Physical Evidence
Satisfaction. 0.224* 4.638 0.000 Accepted
H 2a Productloyalty. 0.243* 5.246 0.000 Accepted H 2b Price loyalty. 0.085 1.722 0.086 Rejected
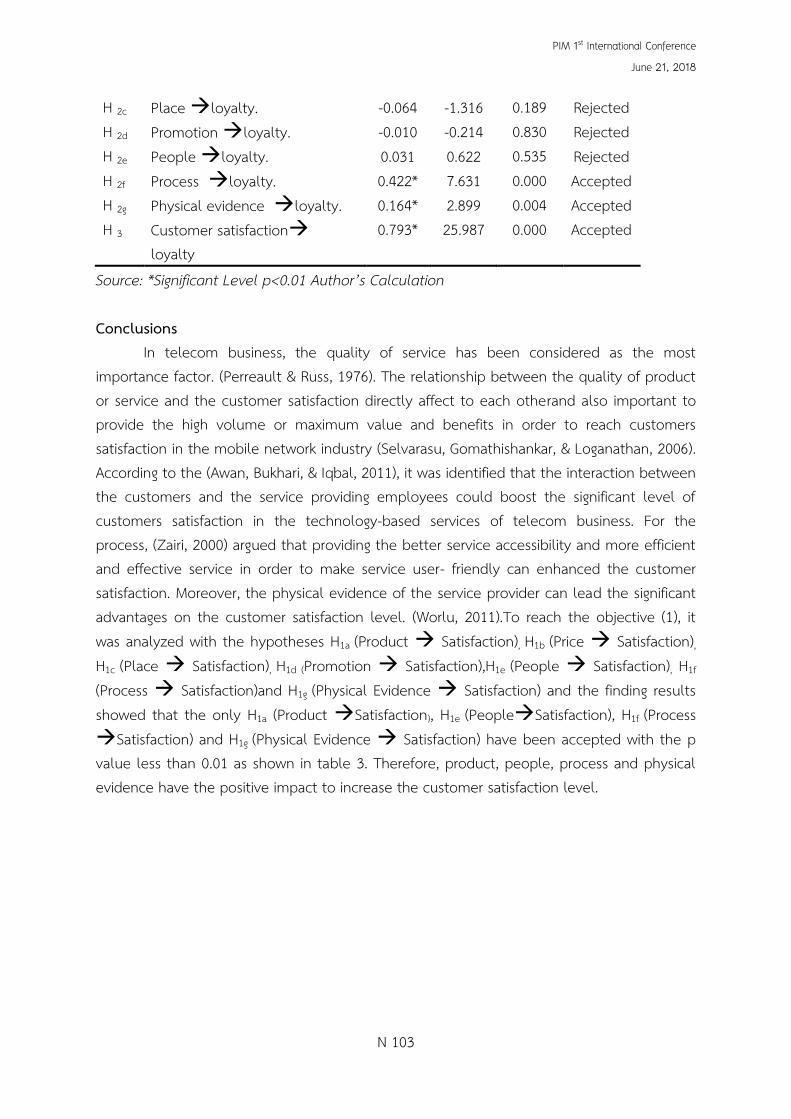
PIM 1st International Conference
June 21, 2018
N 103
H 2c Place loyalty. -0.064 -1.316 0.189 Rejected H 2d Promotion loyalty. -0.010 -0.214 0.830 Rejected H 2e People loyalty. 0.031 0.622 0.535 Rejected H 2f Process loyalty. 0.422* 7.631 0.000 Accepted H 2g Physical evidence loyalty. 0.164* 2.899 0.004 Accepted H 3 Customer satisfaction
loyalty 0.793* 25.987 0.000 Accepted
Source: *Significant Level p<0.01 Author’s Calculation Conclusions
In telecom business, the quality of service has been considered as the most importance factor. (Perreault & Russ, 1976). The relationship between the quality of product or service and the customer satisfaction directly affect to each otherand also important to provide the high volume or maximum value and benefits in order to reach customers satisfaction in the mobile network industry (Selvarasu, Gomathishankar, & Loganathan, 2006). According to the (Awan, Bukhari, & Iqbal, 2011), it was identified that the interaction between the customers and the service providing employees could boost the significant level of customers satisfaction in the technology-based services of telecom business. For the process, (Zairi, 2000) argued that providing the better service accessibility and more efficient and effective service in order to make service user- friendly can enhanced the customer satisfaction. Moreover, the physical evidence of the service provider can lead the significant advantages on the customer satisfaction level. (Worlu, 2011).To reach the objective (1), it was analyzed with the hypotheses H1a (Product Satisfaction), H1b (Price Satisfaction), H1c (Place Satisfaction), H1d (Promotion Satisfaction),H1e (People Satisfaction), H1f
(Process Satisfaction)and H1g (Physical Evidence Satisfaction) and the finding results showed that the only H1a (Product Satisfaction), H1e (PeopleSatisfaction), H1f (Process Satisfaction) and H1g (Physical Evidence Satisfaction) have been accepted with the p value less than 0.01 as shown in table 3. Therefore, product, people, process and physical evidence have the positive impact to increase the customer satisfaction level.

PIM 1st International Conference
June 21, 2018
N 104
Figure: 2 Modified Model of 7Ps to customer satisfaction for the Myanmar Post and Telecommunication (MPT) Source: Author’s research According to (Mohammed I. , 2018, ), it is argued that the business people in telecom industry give attention on the marketing mix factors in order to achieve the higher customer loyalty level and it is examined that the practices of marketing mix elements and its impact on the customer loyalty towards Palestine Telecom Company (Paltel) and the result pointed out that product, price, promotion and place have significant impact on customer loyalty. (Souar Youcef, Mahi Keltouma, Ameur Imane, 2015) argued that the marketing mix factors approached from Algeria Telecom Corporation’s subscribers have the positive impact on the level of loyalty in terms of its service, process and promotion. This research’s objective (2) was analyzed with hypotheses H2a (Product Loyalty), H2b (Price Loyalty), H2c (Place Loyalty), H2d (Promotion Loyalty),H2e (People Loyalty), H2f
(Process Loyalty)and H2g (Physical Evidence Loyalty) and the result solutioned that H2a (Productloyalty), H2f (Process loyalty) and H2g (Physical evidence loyalty) have been accepted with the p values which are less than 0.01 as shown in table 3. Thus, product, process and physical evidence have the positive relationship to enhance the customer loyalty level.
Product
Process
Physical
Evidence
Customer
Loyalty

PIM 1st International Conference
June 21, 2018
N 105
Figure: 3 Modified Model of 7Ps to customer satisfaction for the Myanmar Post and Telecommunication (MPT) Source: Author’s research It is argued by (Kotler & Armstrong, Principle of Marketing, 2012), marketing has been indicated that managing to the process of creating, producing, distribution and trading to make the demand based on the consumer’s need. In the other hand, customer satisfaction is defined that it is such an emotional statement which occurs when the customer expectation on the product or service reach to level of same or nearly matches with its perceived performance. Additionally, the loyalty of the satisfied customers can drop the investment risks of a business by increasing the bargaining power with the shareholders and other beneficiaries. (Yoo, 2008). For objective 3 of this research, the hypotheses H3 (customer satisfaction towards customer loyalty)was analyzed and the result was found that the customer satisfaction has the positive relationship with the customer loyalty with the significant level p value of 0.00 as shown in table 3.
Figure: 4 Modified Model of customer satisfaction to Customer Loyalty for the Myanmar Post and Telecommunication (MPT) Source: Author’s research Recommendations for Further Research
The previous research (Zin, 2016) focused on the importance factors of marketing mix on the quality of MPT mobile network service offer to the customers who were living in the Yangon, Myanmar. Moreover, this research also collected the data from the respondents living in Yangon use the MPT mobile network service, in order to investigate the relationship of the Marketing Mix 7Ps on the customer satisfaction towards customer loyalty by using the MPT mobile network service. Therefore, further researchers may need to focus in the suburb areas or the representative samples which can cover the whole Myanmar to acknowledge the other mobile network providers in Myanmar inclusion with the customer behavioral factors. Moreover, it may also can approach with the loyalty framework theoretically. References Abu-ELSamen, Amjad, A., & et al. (2011). Toward an Intergrated Model of Customer Service
Skills and Customer Loyalty: the Mediating Role of Customer Satisfaction. International Jounal of Commerce and Mangement, vol. 21, No. 4, pp 349+.

PIM 1st International Conference
June 21, 2018
N 106
Awan, H. M., Bukhari, K. S., & Iqbal, A. (2011). service Quality and Customer Satisfaction in the banking sector: A Comparative Study of Conventional and islamic banks in Pakistan . Journal of Islamic Marketing, 2(3), 203-224.
Clottey, T. A., Collier, D. A., & Stodnick, M. (2008). Drivers of Customer Loyalty in a Retail Store Environment. journal of Service Science, Vol (1), 35-48.
Cronbach, L. (1951). Coefficient alpha and internal structure of tests. Psychometrika, Vol. 16 Bi.3, pp. 297-334.
Digital in Asia. (2017, January 9). Retrieved from Digital in Asia: https://digitalinasia.com Gronroos, C. (2000). Service Management and Marketing: A Customer Relationship
Management Approach. Second edition. West Sussex: Wiley. Johnson, Michael , D., & Claes , F. (1991). A Framework for Comparing Customer Satisfaction
Across Individuals and Product Categories. Journal of Economic Psychology 12 (2) (Fall), 267-286.
Kotler, P., & Armstrong, G. (2010). Principles of Marketing, 14th edition,. Edinburgh Gate Harlow Essex, England: Pearson Education.
Kotler, P., & Armstrong, G. (2012). Principle of Marketing. In P. Kotler, & G. Amstrong, Global 14th edition. New Jersey: Prentice.
Mohammed, I. (2018, ). Actual practices of Marketing Mix and its impact on Customer Loyalty. Gaza, Palestine: Master thesis, Islamic University.
MPT offical website. (2017, August). Retrieved from MPT offical website: http://mpt.com.mm Perreault, W. J., & Russ, F. A. (1976). Physical Distribution Service in Industrial Purchase
Decisions . Journal of Marketing, 40(4), 3-10. Selvarasu, A., Gomathishankar, K., & Loganathan, M. G. (2006). GSM Mobile Service in
Telecom Sector: An Ontology of Quality of Service. The ICFAI Journal of Service Marketing,, Vol. 4(4).
Souar Youcef, Mahi Keltouma, Ameur Imane. (2015). The Impact of Marketing Mix Element on Customer Loyalty for an Algerian telecommunica5tion Company. Expret Jourmal of Marketing, 3(1), 1-10.
The Myanmar Times. (2017, March 27). Retrieved from PRESSREADER: https://www.pressreader.com/myanmar/the-myanmar-times-weekend/20170324/281509341011655
Worlu, R. E. (2011). Consumer-Purchasing motives in Negerian Cellular Phone Market: An Empirical Investigation . Jouranlof Research in National Development, Vol.9, No 1B.
Yamane, T. (1967). Statistics, An Introductory Analysis, 2nd Ed.,. New York: Harper and Row. Yoo, B. (2008). Cross-national invariance of the effect of personal collectivistic orientation on
brand loyalty and equity:The United States versus South Korean consumers. Asia Pacific Journal of Marketing and Logistics, Vol 21 (1), pp 41-57.

PIM 1st International Conference
June 21, 2018
N 107
Zairi, M. (2000). Managing customer satisfaction: a best perspective . The TQM Magazine, Vol. 12 (6), pp.389-494.
Zin, M. S. (2016). An Analysis on the Marketing Strategies for the Mobile Network Service Of Myanmr Post and Telecommunication.

PIM 1st International Conference
June 21, 2018
N 108
MOBILE BANKING USAGE INTENTION IN MYANMAR: A CASE STUDY IN YANGON AND NAY PYI TAW, MYANMAR
Saw Thar Phyo Wai 1, Pithoon Thanabordeekij 2
1,2International Program, Panyapiwat Institute of Management
ABSTRACT
The purpose of this study is to investigate the key factors influencing the Myanmar customers’ intention to use mobile banking by analyzing the relationship between three social capital theory factors (social trust, institutional trust, and social participation), one social cognitive theory item (self-efficacy), users’ perceived usefulness, and users’ perceived ease of use. The integrated model explored was based on Technology Acceptance Model (TAM), theory of Technology Readiness and Acceptance Model (TRAM), social capital theory, and social cognitive theory. The survey was conducted among the mobile banking users of top three banks in Myanmar: Kanbawza bank (KBZ), and Ayeyarwaddy bank (AYA), and Co-operative Bank (CB). This is a quantitative analysis which studied on 600 respondents who live in Yangon and Nay Pyi Taw. Regression analysis was used to examine the results. The findings show that users’ perceived ease of use is the main predictor of usage intention and also perceived usefulness and perceived ease of use are strongly affected by social participation and self-efficacy of using mobile banking.
Keywords: mobile banking, perceived usefulness, perceived ease of use, usage intention.
Introduction
With the enormous technology advancement nowadays, people are extensively using banking services through their mobile phone in order to perform any banking transactions with high competency. Mobile banking system is technology innovation of banking system leading to enhance mobile commerce (Mallat et al, 2004). Among the banking services using innovated technologies, mobile banking is one of the new mobile technological innovations to provide consumers’ conveniences of using banking services (Shaikh & Karjaluoto, 2015). It is available at 24/7 and also can be performed any financial transactions immediately through any mobile devices. Due to the power of globalization, the usage mobile banking is spreading out to the low income countries too (Wonglimpiyarat, 2014; Boor et al, 2014; Anderson, 2010). Thus, it becomes popular in both developed and emerging countries. However, upgrading and customers’ adoption of mobile banking systems are still running slowly (Alalwan et al, 2016; Hanafizadeh et al, 2014; Lin, 2011; Püschel et al, 2010).

PIM 1st International Conference
June 21, 2018
N 109
After Myanmar’s opening foreign direct investment (FDI), many international banks are interested to invest in Myanmar. Speaking of that flows of FDI, it created a competitive environment for local commercial banks. Therefore, local banks were forced themselves to upgrade the banking systems, especially, mobile banking, to meet with customers’ conveniences and perceptions and to compete with others.
As the Report of Myanmar’s Financial Sector; A Challenging Environment for Banks (2016), top three private banks in Myanmar: Kanbawza (KBZ), Co-operative Bank (CB), and Ayeyarwaddy Bank (AYA), are holding two-thirds of the market shares in term of total assets of private banking sector in 2016. According to Asiamoney website, KBZ Bank which was established in 1994 is the best commercial and investment bank among the domestic banks in Myanmar. On the other hand, CB Bank was recognized as the best digital bank and the first to launch mobile and internet banking in 1992. Whereas, AYA Bank which was started in 2010 has become the best bank for CSR by performing social activities and campaigns. In the view of encouraging growth of Myanmar mobile banking system, it leads this research study to explore consumer attitudes towards mobile banking in these three banks by understanding of their current situations.
Literature Review Technology Acceptance Model (TAM)
Davis (1989) introduced TAM to explain and estimate the behavior of technology users. Users’ perceptions can be examined by TAM based on their experiences. Many researchers use TAM to analyze the individuals’ adoption of information technologies and intention to use (Waleed, 2015). According to this model, perceived usefulness and perceived ease of use are influence on users’ intention to use technology and are the main predictors of usage intention. Usefulness of innovation can lead to usage intention (Chau & Hu, 2001). Perceived usefulness is the expectation of performance on specific task (Venkatesh et al, 2003). Perceived ease of use means the level of a person’s belief to be free of effort by using a particular system (Dholakia, 2004). It depends on how to handle the difficulty of using mobile banking services (Knutsen et al, 2005). Usage intention is behavioral intention to adopt to use a specific system (Akturan & Nuray Tezcan, 2012). In this study, It means the behavioral intention to adopt to use mobile banking system. Theory of technology readiness and acceptance model (TRAM)
Parasuraman (2000) stated that technology readiness is a person’s knowledge and belief on technology. And also, the skills of employees based on earlier experience can launch a technology lead to meet users’ perceptions of usefulness and ease of use (Parasuraman, 2000). It states the situation of that the consumers are willing to use technology innovations (Sophonthummapharn & Tesar, 2007). Social Capital Theory

PIM 1st International Conference
June 21, 2018
N 110
L. J. Hanifan used firstly social capital theory in 1916 to study social organizations. Social advantages are affected by coordination and cooperation (Jones & Taylor , 2012). Organization for Economic Co-operation Development (OECD) said that “the links, shared values and understanding in society that enable individuals and groups to trust each other and so work together.”
The relationship among strength, relational embeddedness, closeness, trust and commitment designated in social capital can influence on mobile users’ usage intention (Granovetter, 1985; Adler & Kwon, 2000; Watson & Papamarcos, 2002). The study focuses three variables, namely social trust, institutional trust and social participation regarded as variables for better understanding of usage intention through perceived usefulness and perceived ease of use.
Social trust is related to the technology awareness provided and means interpersonal relationship (Mohseni & Lindstrom, 2007). User adoption of various services can be affected because of trust (Flavian et al, 2005; Chen & Corkindale, 2008; Lu & Su, 2009).
Institutional trust means the users’ expectation on keeping promises of a specific organization (Gambetta, 2000). It is the trust in the commitments offered by organizations (Pauline & W. Fred, 2017). Therefore, customers’ intention and trust on banks are related.
Geographical organizational features and respondents’ participation level in a society can conclude the level of social participation (Mohseni & Lindstrom, 2007). In this research, social participation discusses the mobile banking users’ participation. Social Cognitive Theory
Self-efficacy is an important factor in social cognitive theory. It means the competencies of people to accomplish the specific task (Hasan, 2007). Mobile banking usage intention can be affected by self-efficacy through usefulness and ease of use of technology innovation (Püschel et al, 2010). Framework:
The framework was adopted as below:

PIM 1st International Conference
June 21, 2018
N 111
Research Objective
This study is to examine the key factors influencing Myanmar customers' intention to use mobile banking. Hypotheses Social capital theory items and the mediators
H1: Social trust positively affects perceived usefulness of using mobile banking. H2: Social trust positively affects perceived ease of use of using mobile banking. H3: Institution (bank) trust positively affects perceived usefulness of using mobile
banking. H4: Institution (bank) trust positively affects perceived ease of use of using mobile
banking. H5: Social participation positively affects perceived usefulness of using mobile
banking. H6: Social participation positively affects perceived ease of use of using mobile
banking. Social capital theory item and the mediators
H7: The greater a customer’s self-efficacy regarding to mobile banking are, the higher the perceived usefulness of using mobile banking become.

PIM 1st International Conference
June 21, 2018
N 112
H8: The greater a customer’s self-efficacy regarding to mobile banking are, the higher the perceived ease of use of using mobile banking become. Between two mediators
H9: Perceived ease of use has a positive effect on perceived usefulness of using mobile banking. The mediators and usage intention
H10: Perceived usefulness positively influences on usage intention of Myanmar mobile banking users.
H11: Perceived ease of use positively influences on usage intention of Myanmar mobile banking users. Methodology
Myanmar Times News expressed on 27 March 2017 that Myanmar had 50 million mobile subscribers. Among them, a closed-ended questionnaire was developed and disseminated to the people who living in Yangon and Nay Pyi Taw by asking them whether they have ever experienced or are currently using mobile banking systems of top three banks in Myanmar: Kanbawza bank (KBZ), and Ayeyarwaddy bank (AYA), and Co-operative Bank (CB). Therefore, this research study is a quantitative research which was conducted on 600 participants by distribution the questionnaires to 200 each of the three banks. Five-point Likert scales with the range of “strongly disagree” (1) up to “strongly agree” (5) was used in the questionnaire to measure the mobile banking usage intention, and the study was using the convenience sampling method to collect data from mobile banking users.
Table 1: Cronbach’s Alpha Scale Reliability Results
Variables Sub-variables No. of Item
Pilot Test Cronbach’s
Alpha (n=30)
Actual Cronbach’s
Alpha (n=600)
Social Capital Theory Items
Social Trust 3 0.640 0.689 Institutional Trust 4 0.454 0.871 Social Participation 6 0.774 0.810
Social Cognitive Theory Item
Self-efficacy 5 0.744 0.780
Perceived Usefulness 6 0.838 0.893 Perceived Ease of Use 6 0.905 0.773
Usage Intention 5 0.821 0.886 As Table 1, Cronbach’s alpha was used in pilot test to see whether the
questionnaires are consistency reliability or not before the distribution. The pilot test involved 30 respondents and its Cronbach’s alpha score were from 0.454 to 0.905. The

PIM 1st International Conference
June 21, 2018
N 113
Cronbach’s alpha score of Institutional Trust variable was 0.454, which below the thresholds value of 0.7. Therefore, questions in this construct had been adjusted and retested for reliability. Then, its actual Cronbach’s alpha score became acceptable with value of 0.871. Moreover, the actual Cronbach’s alpha score of all variables were from 0.689 to 0.893. Nunnally (1978) said that a Cronbach’s alpha value can be regarded reliability if it is greater than 0.7 and Yong, Hua, and Mei (2007) stated that it is also acceptable if its value is greater than 0.6. Therefore, all of hypotheses of this research was accepted. Results of the Study
The demographic factor was classified on respondents’ gender, age, education, occupation, and monthly income. As the results, more males responded to this survey than females because there were 54% males and 46% females participated in this survey. People in the 26-35 years old age group were the main group to use mobile banking with 45% of respondents. The major groups of mobile banking users were educated people with 83.5% bachelor degree holders and 14.3% people who graduated more than bachelor degree. The focal users were business people (42%) and government officers (40%). Then, 39% of respondents earned between 100,001 Ks and 300,000 Ks, 21% of respondents between 500,0001 Ks and 1,000,000 Ks, 21% of respondents more than 1,000,000 Ks, 18% of respondents between 300,000 Ks and 500,000 Ks and only 1% of respondents less than 100,000 Ks respectively. Moreover, the majority respondents 38% were using mobile banking more than once a month as usual, and there were 31% of respondents using once a month. Relationship of relevant variables and the research hypothesis Table 2: Summary of Testing Hypotheses
No. Hypothesis Path β t-value p-value
Hypothesis Supported (Accepted/ Rejected)
H1 ST PU 0.189** 4.137 0.000 Accepted H2 ST PEOU 0.211** 4.951 0.000 Accepted H3 IT PU 0.194** 3.765 0.000 Accepted H4 IT PEOU 0.294** 6.129 0.000 Accepted H5 SP PU 0.392** 8.985 0.000 Accepted H6 SP PEOU 0.323** 7.947 0.000 Accepted H7 SE PU 0.735** 26.539 0.000 Accepted H8 SE PEOU 0.740** 26.875 0.000 Accepted H9 PEOU PU 0.836** 37.208 0.000 Accepted H10 PU UI 0.330** 8.843 0.000 Accepted H11 PEOU UI 0.570** 15.272 0.000 Accepted

PIM 1st International Conference
June 21, 2018
N 114
** significant at 0.01, p<0.01 Social Trust (ST), Institutional Trust (IT), Social Participation (SP), Self-efficacy (SE), Perceived Usefulness (PU), Perceived Ease of Use (PEOU), Usage Intention (UI)
Table 2 indicates that Social Participation had the strongest influence perceived usefulness with (β=0.392) and followed by Institutional Trust (β=0.194), and Social Trust (β=0.189). And also, Social Participation had the strongest influence perceived ease of use with (β=0.323) and followed by Institutional Trust (β=0.294), and Social Trust (β=0.211). Next, the greater a customer’s self-efficacy of using mobile banking was, the higher the perceived usefulness with (β=0.735) and the perceived ease of use with (β=0.740) became.
Perceived ease of use had a positive effect on a consumer's perceived usefulness (β=0.836) of mobile banking. Perceived ease of use had the strongest influence on mobile banking usage intention (β=0.570) while the standardized beta was (β=0.330) for perceived usefulness. Discussion
In demographic factor review, banks can survey the life style of their customers because life style is also a key point to meet the customers’ demand in mobile banking services (Vellido et al, 2000; Ratchford et al, 2001; Vijayasarathy, 2004). In this research, more males use mobile banking than females, which supported the previous researcher (Singh, 2004). Young Myanmar people could easily handle and accept new technologies and applications because they are the main consumer group to attempt to use these technologies. In addition, the focal users are normally well educated and they can learn new technologies easily and are willing to use mobile banking services. It would be necessary for them to have more opportunities to become familiar with the functions and services of mobile banking. Moreover, the current mobile banking users like to continue to use mobile banking services. One possible reason is that the main consumer groups are government officers and businesspersons as their necessities on business. They like to use the technology to assist their business for saving time, productivity, and any other business reasons.
In variable factor review, the important factors affecting Myanmar mobile banking users’ usage intention can also be examined. Social trust, institutional trust, and social participation were positively effect on perceived usefulness and perceived ease of use in this research, as supported by (Flavian et. al, 2005; Chen & Corkindale, 2008; Lu & Su, 2009). Among all the Social Capital Theory Items, social participation is the strongest influence on perceived usefulness and on perceived ease of use as well. Self-efficacy of Myanmar mobile banking users strongly influenced on perceived usefulness and perceived ease of use towards usage intention. It proved the findings of previous researchers (Venkatesh V., 2000; Pape & Wang, 2003; Daniel K., 2014). Then, the main two predictors, perceived usefulness and perceived ease of use were significantly influence usage intention. In using technology

PIM 1st International Conference
June 21, 2018
N 115
innovations, users’ perceived usefulness and perceived ease of use can positively affect their adoption and intention to use (Venkatesh V., 1999; Venkatesh & Davis, 2000; Shallone K. & Simon, 2013; Ali et al, 2016). Moreover, perceived ease of use is the most important predictor of usage intention in this research, as supported by (Venkatesh, 2000). However, Ifeonu and Ward (2015) said that perceived usefulness is a more influence on mobile banking usage intention than perceived ease of use. Recommendation
Implementation alternative services and providing enough information of services and offers can persuade Myanmar mobile banking users’ usage intention through their participation.
The banks and mobile banking service providers in Myanmar still need to offer the better performance to their customers in terms of instruction and education on how to use mobile banking. The customers must be provided with quality service, trustworthiness, and responsibility by upgrading services, attitude of staff and technology system. When customers trusted on that the bank and their staff are helpful, honest, not opportunistic, and trustworthy, customers will definitely extend their intention to use services from them. The management of employees’ aptitude and good attitude on their services are really the essential tool to gain customers’ trust. It is the simplest way that organization can satisfy their customers if they have enough ability to serve both technological and social services. Training programs on using technology and offering services should be provided for employees in order that their ability can be used effectively and efficiently in the workplace.
Banks and service providers should focus on listening to customers’ feedbacks, exploring how to handle the problems, and upgrading their services by organizing the regular meetings, emergency meetings, and any other ways to get the feedbacks and find out the solutions in order to enhance customers’ social participation.
The bank managers should organize the demonstration of using mobile banking and explain the advantages to enhance the customers’ self-efficacy. Self-efficacy of mobile banking users in Myanmar is strongly influence on perceived usefulness and perceived ease of use to affect usage intention positively.
The service providers should emphasize to design the systems and applications to be useful and ease of use. As the result, perceived ease of use of using mobile banking is more strongly effect on usage intention than perceived usefulness. Customers who find mobile banking easy to use become more willing to use them in order to conduct banking transactions.
Moreover, trust on banks and staffs influences perceived usefulness and perceived ease of use less than social participation. Thus, policy makers must emphasize to protect risks of using technology and to regulate the policies on threats that users experienced on banking transactions by focusing mobile banking users’ trust towards usage intention.

PIM 1st International Conference
June 21, 2018
N 116
The central bank of Myanmar should be trying to improve the mobile financial services to be more modernized. They should well understand the mobile banking users’ perceptions and awareness of using technology. They should implement the programs to educate the users with the purposes of improving social participation and self-efficacy so that the users can meet with perceived ease of use. Myanmar mobile banking users’ perceived ease of use is the main predictor of usage intention. Conclusion
This study aimed to examine the key factors influencing Myanmar mobile banking users’ usage intention. This was analyzed by TAM factors, Social Capital Theory factors, and Social Cognitive Theory factor. All hypothesis paths in this research were found to be positively significant. Users’ perceived ease of use of mobile banking services was to be more important predictor of usage intention than perceived usefulness. In addition, social participation and self-efficacy are the most significantly influence on perceived usefulness and perceived ease of use towards mobile banking users’ usage intention. Myanmar mobile banking users are using the services based on their own perceptions of perceived usefulness and perceived ease of use. It is a good point for banks and service providers to offer their services with ease of use in order to be higher usage intention on mobile banking. In Myanmar, users’ awareness and aptitudes to use technology are significantly effect on intention to use mobile banking services through perceived usefulness and perceived ease of use. Although there are some limitations, the information provided in this study is expected to be useful in banking sectors by being aware of current situations about mobile banking acceptance and use of Myanmar users. Limitation
As the research limitation, this research focused on mobile banking but not to other kinds of online banking channels. The questionnaires were only distributed to the users of top three mobile banking service providers: Kanbawza bank (KBZ), and Ayeyarwaddy bank (AYA), and Co-operative Bank (CB) in Yangon and Nay Pyi Taw, Myanmar. So, this research had absence of the users’ perceptions, and experiences of the other providers and areas. Therefore, future research can consider based on these narrow spectrums and uncontrollable external variables. References (OECD), O. f.-o. (n.d.). https://www.oecd.org/insights/37966934.pdf (access 31 August, 2017). Adler, P., & Kwon, S. (2000). Social capital: The good, the bad, and the ugly. In E. Lesser
(Ed.), Knowledge and the social capital: Foundations and applications: 89-115. Boston: Butterworth-Heinemann.
Akturan, U., & Nuray Tezcan. (2012). Mobile banking adoption of the youth market: Perceptions and intentions. Marketing Intelligence & Planning, 30 (4), 444-459.

PIM 1st International Conference
June 21, 2018
N 117
Alalwan, A., Dwivedi, Y., Rana, N., & Williams, M. (2016). Consumer adoption of mobile banking in Jordan: Examining the role of usefulness, ease of use, perceived risk and self-efficacy. Journal of Enterprise Information Management, 29 (1), 118-139.
Al-Ghaith, W. (2015). Applying the technology acceptance model to understand social networking sites (SNS) usage: Impact of perceived social capital. International journal of computer science & informational technology (IJCSIT), 7 (4), 105-117.
Ali, A., Yogesh K., D., Nripendra, P., & Michael, D. (2016). Consumer adoption of mobile banking in Jordan: Examining the role of usefulness, ease of use, perceived risk and self-efficacy. Journal of Enterprise Information Management, 29 (1), 118-139.
Anderson, J. (2010). M-banking in developing markets: Competitive and regulatory implications. Info, 12 (1), 18–25.
Asiamoney. (n.d.). Asiamoney Best Bank Awards 2017: Myanmar. https://www.euromoney.com/article/b12khpgp76yhtc/asiamoney-best-bank-awards2017-myanmar (access 31 August, 2017).
Bandura, A. (1998). Health promotion from the perspective of social cognitive theory. Psychology and Health, (13), 623-649.
Boor, P. v., Oliveira, P., & Veloso, F. (2014). Users as innovators in developing countries: The global sources of innovation and diffusion in mobile banking services. Research Policy, 43 (9), 1594–1607.
Chau, P., & Hu, P.-H. (2001). Information technology acceptance by individual professionals: a model comparison approach. Decision Sciences 32 (4), 699–719.
Chen, Y.‐H., & Corkindale, D. (2008). Towards an understanding of the behavioral intention to use online news services: An exploratory study. Internet Research, 18 (3), 286-312.
Daniel K., M. (2014). Behavioural intention towards mobile banking usage by South African retail banking clients. Investment Management and Financial Innovations , 11 (3), 58-72.
Davis, F. (1989). Perceived usefulness, perceived ease of use, and user acceptance of information technology. MIS Quarterly, 13 (3), 319-340.
Dholakia, U. M. (2004). How social influence affects consumption trends in emerging markets: An empirical investigation of the consumption convergence hypothesis. Psychology marketing, 21 (10), 775–797.
Flavian, C., Guinaliu, M., & Torres, E. (2005). The influence of corporate image on consumer trust: a comparative analysis in traditional versus internet banking. Internet Research, 15(4), 447-470.
Gambetta, D. (2000). ‘Can We Trust Trust?’, in Gambetta, Diego (ed.), Trust: Making and Breaking Cooperative Relations, electronic edition. Department of Sociology, University of Oxford, chapter 13, 213-237.

PIM 1st International Conference
June 21, 2018
N 118
Granovetter, M. (1985). Economic action and social structure: The problem of embeddedness. American journal of sociology, 91 (3), 481-510.
Hanafizadeh, P., Keating, B., & Khedmatgozar, H. (2014). A systematic review of Internet banking adoption. Telematics and Informatics 31 (2014), 492–510.
Hanifan, L. J. (1916). The Rural School Community Centre. Annals of the American Academy of Political and Social Sciences, 67, 130-138.
Hasan, B. (2007). Examining the effects of computer self-efficacy and system complexity on technology acceptance. Information Resource Management, 20, 76-88.
Ifeonu, R., & Ward, R. (2015). The Impact Of Technology Trust On The Acceptance Of Mobile Banking Technology Within Nigeria. IEEE African Journal of Computing & ICTs, 8 (4). ISSN 2006-17811.
Jones, T., & Taylor , S. (2012). Service loyalty: accounting for social capital. Journal of Services Marketing, 26 (1), 60-75.
Knutsen, L., Constantio, D., & Damsgaard, J. (2005). Acceptance and perceptions of advanced mobile services: Alterations during a field study. International Conference on Mobile Business (pp. 326-331). Sydney: Australia.
Lin, H. (2011). An empirical investigation of mobile banking adoption: the effect of innovation attributes and knowledge-based trust. International Journal of Information Management, 31 (3), 252-260.
Lu, H.‐P., & Su, Y.‐J. (2009). Factors affecting purchase intention on mobile shopping web sites. Internet Research, 19 (4), 442-458.
Mallat, N., Rossi , M., & Tuunainen , V. (2004). Mobile banking services. Communications of the ACM, 47(5), 42-46.
Mohseni, M., & Lindstrom, M. (2007). Social capital, trust in the health-care system and self-rated health: the role of access to health care in a population-based study. Soc Sci Med, 64 (7), 1373-1383.
Mohseni, M., & Lindstrom, M. (2007, 64). Social capital, trust in the health-care system and self-rated health: The role of access to health care in a population-based study. Social science medicine, 1373-1383.
Nunnally, J. C. (1978). Psychometric theory (2nd ed.). New York: NY: McGraw-Hill. Pape, S., & Wang, C. (2003). Middle school children’s strategic behavior: Classification and
relation to academic achievement and mathematical problem-solving. Instructional Science, 31, 419-449.
Parasuraman, A. (2000). Technology Readiness Index (Tri): A Multiple-Item Scale to Measure Readiness to Embrace New Technologies. Journal of service research, 2 (4), 307-320 .
Pauline, W.-P., & W. Fred, v. (2017). Banking system trust, bank trust, and bank loyalty. International Journal of Bank Marketing, 35 (1), 97-111.

PIM 1st International Conference
June 21, 2018
N 119
Püschel, J., Mazzon, J., & Hernandez, J. (2010). Mobile banking: proposition of an integrated adoption intention framework. International Journal of Bank Marketing, 28 (5), 389-409.
Putnam, R. (1993). Making Democracy Work—Civic Traditions in Modern Italy. Englewood Cliffs, NJ, USA:: Princeton University Press.
Putnam, R. B. (1995a). Bowling alone: America’s Declining social capital. Journal of demoracy, 6 (1), 65-78.
Putnam, R. B. (1995b). Turning in, turning out: The strange disappearance of social capital in America. PS: political science and politics, 28 (4), 664-683.
Ratchford, B., Talukdar, D., & Lee, M. (2001). A model of consumer choice of the internet as an information source. International Journal of Electronic Commerce, 5(3), 7-22.
(2016). Report of Myanmar’s Financial Sector; A Challenging Environment for banks, 2016,(3rd Edition, 2016). Bonn and Eschborn, Germany: Deutsche Gesellschaft für, Internationale Zusammenarbeit (GIZ) GmbH.
Shaikh, A., & Karjaluoto, H. (2015). Mobile banking adoption: A literature review. Telematics and Informatics, 32 (1), ISSN: 0736-5853.
Shallone K., C., & Simon, M. (2013). Extending the Technology Acceptance Model to Mobile Banking Adoption in Rural Zimbabwe. Journal of Business Administration and Education ISSN 2201-2958, 3 (1), 51-79.
Sophonthummapharn, K., & Tesar, G. (2007). Technology readiness and propensity of cell phone users to subscribe to commercial messaging services. Marketing Management Journal, 17 (2), 81-95.
Vellido, A., Lisboa, P., & Meeham, K. (2000). Quantitative characterization and prediction of on-line purchasing behaviour: a latent variable approach. Internet Journal of Electronic Commerce, (4), 83-104.
Venkatesh, V. (1999). Creating favorable user perceptions: Exploring the role of intrinsic motivation. MIS Quart. 23 (2), 239–260.
Venkatesh, V. (2000). Determinants of Perceived Ease of Use: Integrating Control, Intrinsic Motivation, and Emotion into the Technology Acceptance Model. Information Systems Research, 11 (4), 342–365.
Venkatesh, V., & Davis, F. (2000). A theoretical extension of the technology acceptance model: Four longitudinal field studies. Management Science, 46(2), 186–204.
Venkatesh, V., Morris, M., Davis, G., & Davis. (2003). User acceptance of information technology: Toward a unified view. MIS Quarterly, 27 (3), 425-478.
Vijayasarathy, L. R. (2004). Predicting consumer intentions to use online shopping: the case for an augmented technology acceptance model. Information and Management, 41(6), 747-762.

PIM 1st International Conference
June 21, 2018
N 120
Watson, G., & Papamarcos, S. (2002). Social capital and organizational commitment. Journal of business and psychology, 16 (4), 537-552.
Wonglimpiyarat, J. (2014). Competition and challenges of mobile banking: A systematic review of major bank models in the Thai banking industry. Journal of High Technology Management Research, 25 (2), 123–131.
Yoh, E., Damhorst, M., Sapp, S., & Lazniak, R. (2003). Consumer adoption of the Internet: The case of apparel shopping. Psychology & Marketing, 20, 1095–1118.
Yong, T., Shi-hua, M., & Feng-mei, G. (2007). Empirical study on impact of logistics operations capability on supply chain performance. The 3rd International Conference on Wireless Communications, Networking, and Mobile Computing (WiCOM) 2007. Shanghai: P.R. China.

PIM 1st International Conference
June 21, 2018
N 121
RESEARCH ON THE INFLUENCE OF DEGREE OF INVOLVEMENT ON CUSTOMER FORGIVENESS IN CATERING INDUSTRY UNDER THE PRODUCT-HARM CRISIS
Peng Gao1, Guihua Lu2
12Chinese Graduate School, Panyapiwat Institute of Management * Corresponding author,E-mail: [email protected]
ABSTRACT
Product harm crisis is an important factor affecting the development of catering enterprises. The product’s involvement degree of the food and beverage has important influence on whether the consumer forgives the enterprise after the product injury crisis occurs. Through the experimental questionnaire, this paper studies the consumer's consumption habits and the different degree of food products involvement in the severe mild two crises. Through the correlation analysis of the questionnaire and regression analysis, it is concluded that under the background of severe product harm crisis, advertisements in product involvement and willing to read articles on consumer reports are positively related to forgiveness. Under the background of mild product harm crisis, being interested in product description in product involvement, willing to read articles on consumer reports and willing to compare the different characteristics of food and beverage brands are positively related to forgiveness. The research results enrich the theories of related industries.
Keywords: Product harm crisis; catering enterprises; involvement degree; forgiveness
Introduction
According to the released data of National Bureau of Statistics of China, the catering revenue was increased by 10.8% in 2016 compared with the previous year. But under the general trend of recovery of the catering industry, there are still frequent adverse catering events. For instance, KFC’s “instant chicken” event in 2012. Once such events occur, customers will lose their trust in the catering enterprises, resulting in loss of customers, decrease of market shares, decline of profits and damage of brand image and other negative effects, which will seriously affect the entire industry and even the entire region. In the context of product crisis, the product involvement of consumers can directly affect consumers' forgiveness of enterprises, change their attitudes and choices whether to make the purchase. The product harm crisis of the catering industry is divided into two categories, one category is the product harm crisis events related to product quality, such as illegal cooking oil, etc., and the other category is the product harm crisis events irrelevant with

PIM 1st International Conference
June 21, 2018
N 122
product quality. The research scope of this paper only includes the product harm crisis events related to product quality. Literature Review
The event of Tylenol poisonous capsules in Johnson & Johnson in the United States has caused concerns about crisis management in academia. The research on the issue of crisis management in the marketing field initially proceeds from the product harm crisis. Siomkos and Malliaris (1992) points out that among all crisis types, product harm crisis has the most to do with marketers and advertisers. Siomkos and Kurzbard (1994) considers that product harm crisis refers to those events that occasionally occur and are widely publicized about a product has defects or is dangerous to consumers. Dawar (2000) points out that product harm crisis means that products are found to be defective, unsafe or even dangerous. Some scholars regard product product harm crisis as brand crisis, but the two are different actually. Product harm crisis can easily lead to brand crisis when there exists spillover effects. Wang Xiaoyu, Chao Gangling and Wu Jiyuan (2006) believe that a product harm crisis event is the crisis that occurs in the process of enterprise marketing and is about enterprise products that are harmful to consumers. It not merely exerts an adverse impact on the enterprise, but also affects consumers’ purchase decision behavior. In general, a consensus has been basically reached on the definition of product harm. There are two aspects, one is that products or other aspects have defects, the other is that the defects are adverse for consumers and enterprises. Based on the consensus within the industry, this paper adopts the definition of Siomkos and Kurzbard (1994).
The degree of product involvement is measured mainly from theinterest and performance of consumers, which belongs to the antecedents of consumption. In market research, the degree of involvement is defined as “the relevance to the object as perceived by a person based on intrinsic needs, values and interests” (Zaiehkowskyy et al, 1985).
Scholars’ research on forgiveness has a long history and interdisciplinary characteristics. There is no consensus on the definition of forgiveness in academia. There is no consensus on the definition of forgiveness in academia. By gathering the definitions of previous scholars, this study defines the forgiveness of product harm crisis as follows: after consumers are offended or harmed by the crisis event, they give up the resistant or retaliatory behaviors and show their understanding of the enterprises that have suffered the product harm crisis. The willingness of consumers to forgive is the key to rebuilding trust after a product harm crisis. Scholars have carried out relevant theoretical research and empirical analysis on product harm crisis and consumers’ willingness to forgive. Klein and Dawar (2004) drew a conclusion through empirical research that brand reputation is an important factor affecting consumers’ forgiveness and willingness to buy after the product harm crisis. The empirical research results of Ren Jinzhong and Jing Fengjie (2015) indicate that corporate crisis response after product harm crisis positively affects consumers’

PIM 1st International Conference
June 21, 2018
N 123
willingness to forgive. Qing Ping, et al. (2014) explored the formation mechanism of consumers’ reverse communication behavior in the background of harm crisis of agricultural products, and found that the inherent brand cognition of consumers before the harm crisis is closely related to the consumer's reverse behavior, and brand prejudice and consumers’ anger feelings exert a significant influence on consumers’ reverse behaviors. The above scholars mainly focus on the negative events related to the direct interests of customers and they seldom pay attention to the characteristics of customers themselves, such as the impact of consumers’ involvement on their forgiveness to enterprises after product harm crises. Objective
This study will present the analysis of the impact of corporate communication in the catering industry on consumers, which will be conducive for enterprises suffering the product harm crisis to carry out communication from a multiple of perspectives and get through the product harm crisis as soon as possible. Methods
1. Research Methods Design a questionnaire. The target group of this paper is the consumers of the catering
industry. The questionnaires are distributed in two ways, issuing questionnaires online and questionnaires on the spot. Verify the hypothesis by analyzing the consumers of different ages, backgrounds and regions, and the respondents are from China, Thailand, the UK and Malaysia. After the questionnaire design is completed, conduct a pre-test of the questionnaire, and revise and perfect the questionnaire. In terms of the pre-test of the questionnaire, conduct an online survey on the “SO JUMP” commercial survey platform and recover valid questionnaires. Then revise and perfect the questionnaire based on the pre-test results of the questionnaire, and form the final questionnaire. Based on the theoretical framework of Zaieh kowsky (1994), the relevant literature was summed up. Combined with the characteristics of the catering industry itself, some factors that may affect the degree of involvement of consumers were extracted. Acquire data by issuing and recovering questionnaires on the spot as well as distributing questionnaires online, and verify and correct the hypothesis by using SPSS22.0 processing data.
2. Research Hypothesis According to the definition of degree of involvement, it is adoptable to define the
“relevance” in the definition of involvement from the perspectives of consumers’ subjective awakening degree or attention level, the potential value of products, etc., and thus determine the degree of involvement. With the behavioral expressions of consumers while dealing with the involved objects as the classification basis, involvement can be divided into product involvement, advertising involvement and purchase decision involvement. This study mainly deals with consumers’ product involvement. Generally speaking, the degree of

PIM 1st International Conference
June 21, 2018
N 124
consumers’ product involvement is high, which is manifested as follows: they like reading the instructions of related products, for example. They like reading the menu as in the catering industry well as the detailed description of a restaurant or enterprise websites; they are willing and fond of reading consumer reports, such as the annual consumers’ catering reports, as well as micro-blog websites and other information about catering; in respect of the characteristics of similar brands or similar products, they are willing to make a comparison; and besides, they pay attention to the ads of related products; when choosing a product, they are willing to spend time researching instead of randomly choosing. This paper puts forward the following hypotheses: the degree of involvement of catering products exerts a positive influence on consumers' forgiveness of enterprises.
H1 Frequently and spontaneously reading the product instructions exerts a positive impact on forgiveness.
H2 Frequently and spontaneously reading consumers' reports exerts a positive impact on forgiveness.
H3 Frequently comparing product characteristics while choosing products exerts a positive impact on forgiveness.
H4 Comparing and paying attention to catering ads exerts a positive impact on forgiveness.
H5Consuming plenty of time while choosing a product exerts a positive impact on forgiveness. Results and Discussion
1. Questionnaire Contents The questionnaire designed in this study is divided into three parts. In the
preconditions of the questionnaire, the purpose and significance of this study are elucidated first. In addition, this part highlights that the survey data of this questionnaire is only used for research and analysis, and no personal information will be disclosed so as to reduce the respondents’ fears and concerns when answering the questions and improve the quality of filling in the questionnaire, laying a fairly good foundation for further data analysis. The main body of the questionnaire consists of the following three parts: the first part is the consumer's basic information, mainly including (1) basic elements such as gender, age and income level and the like of consumers; (2) consumers’ consumption habits and status quo; (3) consumers’ attitudes towards catering products. As for the second part and the third part of the questionnaire, first of all, it is the background description. The questions are divided into two groups, one group is concerned with a catering brand (severely negative word-of-mouth group) while the other group is related to a well-known chain catering brand (mildly negative word-of-mouth group). The two parts introduce the ins and outs of harm events of this catering brand respectively, including the media coverage, the communication between the enterprises and the consumer and the handling method in this incident. The main
PIM 1st International Conference
June 21, 2018
N 125
content is adapted based on the real event reported by well-known media such as Sina and Net ease. Then it comes to the questionnaire scale. The questions of the questionnaire scale all refer to the mature scale of authoritative literature, and then the author makes some changes according to the current research, and the content validity is fairly good.
2. Sample Statistics Among the surveyed respondents, there are 242 males, accounting for 45.7% of the
total, and 285 women, accounting for 54.3% of the total. Therefore, this study has basically achieved a gender balance.
Among the surveyed respondents, 31 persons are under 18 years old, taking up 5.9% of the total population; 225 persons are aged between 18 and 25 years old, taking up 42.9% of the total population; 237 persons are between 26 and 45 years old, taking up 45.1% of the total; and 32 persons are over 45 years old, taking up 6.1% of the total. Relatively, the respondents aged between 18 to 45 years old occupies the largest proportion among all the investigated persons, reaching 88% of the total.
Among the surveyed respondents, 18 persons have no income, making up 3.4% of the surveyed; 143 persons have earned a monthly income of less than 3000 yuan (RMB), making up 27.2% of the surveyed; 239 persons have earned a monthly income of between 3000 and 6000 yuan, making up 45.5% of the surveyed; 104 persons have earned a monthly income of between 6001 and 12000 yuan, making up 19.8% of the surveyed; 21 persons have earned a monthly income of over 12000 yuan, making up 4% of the surveyed.
Among the surveyed respondents, 89.1% persons have the behavior of having meals outside within the last three months, 10.9% respondents do not have such a behavior. In terms of the frequency of eating out, the number of people eating out every day is 47, accounting for 9.0% of the surveyed; the number of people eating out for three times or above every week is 175, accounting for 33.3% of the surveyed; the number of people eating out once or twice every week is 167, accounting for 31.8% of the surveyed; the number of people eating out twice or three times every month is 101, accounting for 19.2%, and 35 people eat out only once or less, making us 6.7% of the total. In respect of the selection of restaurants, 55 persons basically select only one restaurant, making up 10.5% of the surveyed; 288 persons select two or three restaurants in a relatively fixed manner, making up 54.9% of the total, and 182 persons basically choose various restaurants for dining, making up 34.7% of the total.

PIM 1st International Conference
June 21, 2018
N 126
3. Correlation Analysis
Table 1:Correlation analysis table between the degree of involvement and forgiveness
Degree of involvement Forgiveness (Severe) Forgiveness (Mild)
Degree of involvement
Pearson correlation 1 .374** .469**
Significance (Two-
tailed) .000 .000
Forgiveness (Severe)
Pearson correlation .374** 1 .483**
Significance (Two-
tailed) .000 .000
Forgiveness (Mild)
Pearson correlation .469** .483** 1
Significance (Two-
tailed) .000 .000
As shown in Table 1, the degree of involvement of products takes on a positive correlation with whether consumers forgive the enterprise. In the contexts of severe product harm crisis and mild product harm crisis, such a relationship is displayed remarkably, and both present a positive correlation.
In the previous paper, it has been analyzed and verified that the degree of involvement has a significant positive correlation with consumers’ forgiveness of the enterprise after the occurrence of product harm crisis. Since this paper is to analyze the factors after factor analysis, the linear regression analyst is method will be adopted to analyze independent variables and dependent variables.
Table 2: Analysis table of the degree of involvement and forgiveness (severe) coefficient
Model
Unstandardized Coefficient Standard Coefficient
t Significance
B Standard errors Beta
1
(Constant) 1.953 .106 18.457 .000
Degree of
involvement .341 .037 .374 9.236 .000
Table 3: Analysis table of the degree of involvement and forgiveness (mild) coefficienta
Model
Unstandardized Coefficient Standard Coefficient
t Significance
B Standard Errors Beta
1
(Constant) 1.649 .098 16.783 .000
Degree of
involvement .416 .034 .469 12.129 .000
After the product harm crisis occurs, the author takes the regression analysis method to analyze the influence of the degree of consumers’ involvement in catering products on their forgiveness of the enterprise. There are two cases of severe adverse event and mild adverse event. From the analysis table of various means of the degree of involvement and forgiveness (as shown in Table 2 and Table 3), the significance of the degree of involvement and forgiveness is <0.05, and thus the two take on a positive correlation. It is the same in

PIM 1st International Conference
June 21, 2018
N 127
both mild and severe cases.
Table4: Analysis table of sub-item of degree of involvement and forgiveness (severe) coefficienta
Model
Unstandardized Coefficient Standard Coefficient
t Significance
B Standard Errors Beta
1
(Constant) 1.887 .105 17.921 .000
Q10(1) .041 .034 .061 1.218 .224
Q10(2) .106 .032 .159 3.359 .001
Q10(3) .006 .033 .009 .172 .863
Q10(4) .195 .033 .280 5.980 .000
Q10(5) .012 .029 .020 .434 .665
According to Table 4, simply observe the title item of consumers’ degree of involvement, the significance of Q10(2), Q10(4) is <0.05, there exists a significance, and thus the two take on a positive correlation. The significance of Q10(1), Q10(3), Q10(5) is all >0.05, so it is insignificant. That is to say, in the context of severe product harm crisis, consumers are willing to read consumers' reports and the like in terms of ads in product involvement, which is positively related to forgiveness. While in respect of product description, it is not positively related to forgiveness by comparing with different brand characteristics and time investment.
Table5: Analysis table of sub-item of degree of involvement and forgiveness (mild) coefficienta
Model
Unstandardized Coefficient Standard Coefficient
t Significance
B Standard Errors Beta
1
(Constant) 1.665 .100 16.721 .000
Q10(1) .115 .032 .177 3.622 .000
Q10(2) .102 .030 .156 3.396 .001
Q10(3) .091 .031 .146 2.958 .003
Q10(4) .057 .031 .085 1.863 .063
Q10(5) .048 .027 .079 1.769 .077
As shown above, simply observe the title item of consumers’ degree of involvement,
the significance of Q10(1),Q10(2), Q10(3) is all <0.05,there exists a significance, and thus the two take on a positive correlation. The significance of Q10(4), Q10(5) is both >0.05, so it is insignificant. That is to say, in the context of mild product harm crisis, consumers take interest in product description in product involvement, are willing to read consumers'
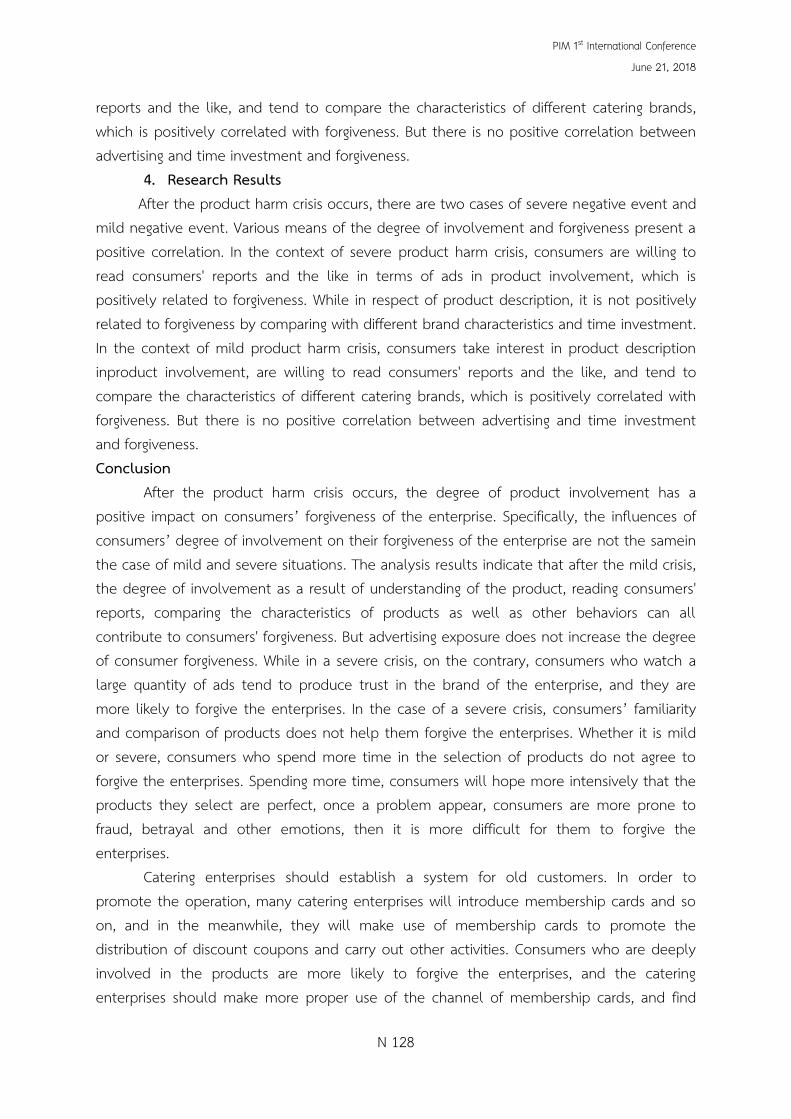
PIM 1st International Conference
June 21, 2018
N 128
reports and the like, and tend to compare the characteristics of different catering brands, which is positively correlated with forgiveness. But there is no positive correlation between advertising and time investment and forgiveness.
4. Research Results After the product harm crisis occurs, there are two cases of severe negative event and
mild negative event. Various means of the degree of involvement and forgiveness present a positive correlation. In the context of severe product harm crisis, consumers are willing to read consumers' reports and the like in terms of ads in product involvement, which is positively related to forgiveness. While in respect of product description, it is not positively related to forgiveness by comparing with different brand characteristics and time investment. In the context of mild product harm crisis, consumers take interest in product description inproduct involvement, are willing to read consumers' reports and the like, and tend to compare the characteristics of different catering brands, which is positively correlated with forgiveness. But there is no positive correlation between advertising and time investment and forgiveness. Conclusion
After the product harm crisis occurs, the degree of product involvement has a positive impact on consumers’ forgiveness of the enterprise. Specifically, the influences of consumers’ degree of involvement on their forgiveness of the enterprise are not the samein the case of mild and severe situations. The analysis results indicate that after the mild crisis, the degree of involvement as a result of understanding of the product, reading consumers' reports, comparing the characteristics of products as well as other behaviors can all contribute to consumers' forgiveness. But advertising exposure does not increase the degree of consumer forgiveness. While in a severe crisis, on the contrary, consumers who watch a large quantity of ads tend to produce trust in the brand of the enterprise, and they are more likely to forgive the enterprises. In the case of a severe crisis, consumers’ familiarity and comparison of products does not help them forgive the enterprises. Whether it is mild or severe, consumers who spend more time in the selection of products do not agree to forgive the enterprises. Spending more time, consumers will hope more intensively that the products they select are perfect, once a problem appear, consumers are more prone to fraud, betrayal and other emotions, then it is more difficult for them to forgive the enterprises.
Catering enterprises should establish a system for old customers. In order to promote the operation, many catering enterprises will introduce membership cards and so on, and in the meanwhile, they will make use of membership cards to promote the distribution of discount coupons and carry out other activities. Consumers who are deeply involved in the products are more likely to forgive the enterprises, and the catering enterprises should make more proper use of the channel of membership cards, and find

PIM 1st International Conference
June 21, 2018
N 129
more customers with deep involvement in the products. At the same time, it is wise to promote the knowledge of products, release consumer reports and other knowledge that seems to have little relevance to product promotion by taking advantage of We Chat Official Account, microblog and other tools, which can prevent crises before they emerge.
First of all, when studying the impact of product involvement on customers’ forgiveness, this paper only discusses the regulating effect of variables of product involvement on consumers’ forgiveness, but actually there are also some other variables that may interfere with the psychological mood of customers, such as the orientation of the media; other regulatory factors may be considered in the future, such as communication platform, etc. In fact, the psychological change of customers’ forgiveness is a very complex psychological process, customers will show a lot of negative emotions after being hurt, and the transformation of these negative emotions may be a long-term process and will not disappear after several repair actions of enterprises, so it is also required to consider the effect of time length on forgiveness in the future. References Dawar N., Pillutla M. (2000) Impact of product-harm crises on brand equity: The moderating
role of consumer expectations .Journal of Marketing Research,37(2): 215-226. D laufer, WT Coombs. (2006) How should a company respond to a product harm crisis? The
role of corporate reputation and consumer-based cues. Business Horizons, 49(5):379-385.
E Chung, MB Beverland. (2006) An Exploration of Consumer Forgiveness Following Marketer Transgressions. Advances in Consumer Research, 33:98-99.
E Chung, MB Beverland, M Gabbott. (2004) An Exploration of Consumer Forgiveness Following Marketer Failure. Advances in Consumer Research, 1:98.
Eastetal. (2008) The making of the USA Patriot Act II: Public sentiment, legislative climate, political games man ship , media patriotism. International journal of the Sociology of Law, 34(2) : 105-140.
Finkel, E. J., & Rusbult, C. E. (2008). Pro relationship motivation: An interdependence theory analysis of situations with conflicting interests. Handbook of motivation science, 547–560.
Finkel E J, Rusbult C E, Kumashir O M, et al.(2002)Dealing with betrayal in close relationships: Does commitment promote forgiveness? Journal of Personality and Social Psychology , 82(6) : 956-974.
Fang Zheng.(2007).Research of Consumers Purchase Intent in Defensible Product Harm Crises. Doctoral dissertation of Sichuan University, Chengdu City.

PIM 1st International Conference
June 21, 2018
N 130
Fang Zheng, Yang Yang, Li Wei and Cai Jing. (2013). The Spillover Effect of Product Harm Crisis: How to Resolve Product Harm Crisis Triggered by Others. Nankai Business Review, 06, 19-27+58.
Niraj Dawar, Madan M. Piilutla. (2000). Impact of Product-harm Crisis on Brand Equity: the Moderating Role of Consumer Expectations. Journal of Marketing. NO.2,215-226.
Siomkos, George J, Kurzbard, Gary. (1994).The Hidden Crisis in Product-harm Crisis management. European Journal of Marketing. 2, 30-41.
Wang Xiaoyu, Chao Gangling, Wu Jiyuan. (2006) The Effect of Product-harm Crises and the Process of Tiding over them on Consumer Consideration Set. Management World, 05, 86-95+172.
Wang Xiaoyu, Chao Gangling, Wu Jiyuan. (2008). Responses to Product-harm Crisis and Variation of Consumer Consideration Set - A Cross-category Contrast.Chinese Industrial Economy, 07, 36-46.
ZAIEHKOWSKYY J L (1985). Measuring the involvement construct. Journal of Consumer Research. 12, 341- 352.
Zhang Meng, Xu Xing'an, Fu Xiaorong. (2014). Impact of Negative Events on Brand Relationship in Restaurant Services: Experimental Study from the Perspective of Hierarchy of Customers’ Interests.Tourism Tribune. 04:69-78.

PIM 1st International Conference
June 21, 2018
N 131
STRATEGY OF BUILDING NINGXIA YINCHUAN FREE TRADE ZONE THROUGH THE BELT AND ROAD GLOBAL STRATEGIC LAYOUT
Shirong Zhang
Panyapiwat Institute of Management * Corresponding author, E-mail: [email protected]
ABSTRACT The implementation of “the Belt and Road initiative” brings significant historical
opportunity for the development of Free Trade Zone in Ningxia, China. Ningxia Province has been positioned by nation as “Inland Opening-up Pilot-economic Zone to mainly promote communication and cooperation with Arab countries and world Muslim regions” and Yinchuan city has been positioned as main node city on Silk Road Economic Belt (People's Government of Ningxia Hui Autonomous Region,2015). Yinchuan Free Trade Zone joined WTO in 2015, which is the second special supervision area of China customs who join in WTO. Ningxia applied for building “China-Arab Free Trade Zone” at the same year.
This article concludes advantages and characteristics of developing Free Trade Zone in Yinchuan and investigates Yinchuan Free Trade Zone administrative measures through investigation method and literature research method.
Specific transformation strategy for Yinchuan to be a “China-Arab” Free Trade Zone has been concluded in this article. This article also provides decision-making suggestions for Yinchuan Free Trade Zone, to build a directly communication “Ningxia Channel” on economy and culture between China and Arab countries.
Keywords: The Belt and Road, Ningxia Yinchuan Free Trade Zone, building Strategy, China
Introduction
This article is based on theories including deregulation, incentive mechanism and other modern regulation as well as background of the Belt and Road Global Strategic Layout to provide quality suggestions for building Ningxia Yinchuan Free Trade Zone. It presents that advantages of Ningxia regional characteristic is the foundation to build Free Trade Zone. To build a China-Arab Free Trade Zone with facilitation, perfection of law, investment facilitation and efficient supervision are crucial as well. To conclude, The key of the transformation of Ningxia Yinchuan Comprehensive Free Trade Zone is to accelerate management mode reform.

PIM 1st International Conference
June 21, 2018
N 132
Literature Review
Mature Free Trade Zone in China are mainly in four developed areas, such as Shanghai, Fujian, Guangdong and Tianjin. Reform experience are formed at these places. Most academic journals and literature have done many researches on southeast coastal Free Trade Zone. The research topics include government regulation mode, inland opening, admin istrative approval system reform and so on. The research of building Ningxia Yinchuan Free Trade Zone Through the Belt and Road Global Strategic Layout should learn experience of coastal areas. Ningxia has 674, 9000 pululation, “Hui nationality accounts for 36%, so that Ningxia is the most biggist “Hui nationality” area in China. In addition, economic development environment of Yinchuan and adjustment of government administrative mode should be paid more attention during the process of building Free Trade Zone in Yinchuan. This article refers to both document literature and public information of the government to study the countermeasure of building Free Trade Zone in inland area. Objective
To study the possibility of how to build a China-Arab Free Trade Zone with perfection of law, investment facilitation and efficient supervision in Yinchuan through improving governmental service system and forming adaptive administrative measures with the development of Free Trade Zone industry. Methods
1. Investigation Method It is a research method to know more about the investigation object through many
ways. This method provides the writer with primary source and data about the research topic.
2. Literature Research Method Literature research method helps writer know more about truth by using a scientific
method through searching, identifying, and clearing up literature. 3. Interview and Conference
Staffs of Committee of Free Trade Zone are interviewed to obtain more information. Video-conferences and Face-to-face conferences are also used to obtain more information. Results and Discussion
1. Analysis of building Free Trade Zone in Yinchuan 1.1 Prominent Characteristics on China-Arabic Cooperation.
The Hui nationality pupulation in Ningxia accounts for 20% of population of Hui in China. As the biggest Hui area in China, Ningxia has the same religious faith, similar living habits and national culture with Arab countries, which gives a built-in advantage on economic and trade contact between Ningxia and muslim countries. It is benefited from the built-in advantage, Ningxia has been to a key “Ningxia Channel” to connect China-Arab economic and trade contact (People's Government of Ningxia Hui Autonomous Region, 2015).

PIM 1st International Conference
June 21, 2018
N 133
1.2 Airport-type Inland Areas Free Trade Zone. Yinchuan Free Trade Zone is an airport-type free trade zone which is about
1km from Yinchuan Hedong Airport. In addition, located in the optimal international airline to connect China with the Middle East, the Middle Asia, Africa and Europe, Yinchuan has quality airspace resource.
1.3 Extravert Type Platform of “Opening-up Ningxia”. Yinchuan Free Trade Zone is the main platform of the “Opening-up Ningxia”
strategy. Yinchuan Free Trade Zone has improved its function advantages through applying some functions successfully, for example, cross-border electronic commerce, imported meat ports and fruits and germchit ports. It enhanced regional clearance and expanded cross-regional cooperation actively with land route ports and coastal ports which formed a convenient channel to exit westwardly and eastwardly.
2. Administrative Areas and Measures of Yinchuan comprehensive Free Trade
Zone 2.1 Integrated Management Field
Integrated management field of Yinchuan Comprehensive Free Trade Zone mainly includes zone management, enterprise management, zone risk management, zone applicant review and so on. Executors mainly consist of Yinchuan free trade zone administration committee and administrative approval departments including Industry and Commerce Department, Tax Department, Development and Reform Commission, Land and Resources Bureau, Fire Department and so on. Yinchuan free trade zone is mainly responsible for administration, plan and enterprise registration and other approval process, investment project review and application for approval, and statistical monitoring and analysis of operation of the zone and other work (The State Council of China, 2015).
2.2 Foreign Investment Administration Measures. Ningxia Business Development and Reform Department and Yinchuan FTZ
Economic and Trade Development & Investment Attraction Bureau are jointly responsible for Yinchuan FTZ Foreign Investment Administration Implementation Department. Yinchuan FTZ economic and trade development & investment attraction bureau is mainly responsible for approval process of foreign investment projects according to functional requirements and industry policy of FTZ. Business Department is mainly responsible for approval and annual inspection of foreign investment projects.
2.3 Trade Management Measures. Yinchuan customs and Ningxia inspection and quarantine bureau are jointly
responsible for Yinchuan FTZ trade management measure implementation department. One of main trade management measures of Yinchuan FTZ is managing enterprises in the zone with account book management to supervise situations of cargo input and export effectively.

PIM 1st International Conference
June 21, 2018
N 134
Another measure is to adopt record management to first-tier frontier China Customs on import and export goods. The third measure is to adopt approval institution to special cargoes who enter and exit FTZ (Qingyou Meng & Shiyuan Xu, 2014:47-52).
2.4 Gap and Problems of Yinchuan Comprehensive Free Trade Zone compared with other FTZ in China and other countries.
Yinchuan Comprehensive Free Trade Zone has incomplete legal safeguard system compared with FTZ of Shanghai, Tianjin, Fujian and Guangdong. Yinchuan Comprehensive Free Trade Zone also has unreasonable management organization setup. For example, Dubai Free Trade Zone adopts the mode of combining company with governmental management. For the aspect of management, Yinchuan has gap on informationalized administrative tool compared with other countries’ FTZ. 3. Research Results
Simplify the approval process, implement a policy that enterprise has to set up a single window of international trade to build an high-efficiency and convenient administrative service system. Simplify registering and approval process and trade import and export process, build one-stop administrative service. To achieve finishing application process with one form and enjoy service at one office uniformly and finish process in the short term based on information management (Bin Liu & Hehe Li, 2014:1-18). Cooperate with social institutions and bring professional institution’s superiority into full play to provide a platform on zone supervision for the participation of market forces (Guangguo Xu, 2013).
It should establish an adaptive management measures with the development of Free Trade Zone industry as below.
Firstly, third-party testing organizations should be brought in industry management. From the aspect of halal products export, third-party testing organizations should be introduced to build an access system of halal products which are authenticated by both Gulf Cooperation Council countries and free trade zone. In the development of halal food industry, the most important thing is halal certification (Xianglin Xu, 2002). Laying down a halal products certification standard system and the system should be acceptable for GCC countries. Public third-party testing organizations should be brought in. It is to monitor the process of halal products’ raw materials, production and packaging to build an access system of products.
The second measure is cross-border electronic commerce industry. An electronic port platform should be established to improve clearance efficiency. It is worth mentioning that to establish the standard operation of cross-border electronic commerce enterprise in FTZ should be on basis of administrative order related to cross-border electronic commerce industry. The government should improve cost of violation and reduce corporate illegal act. Then, the government should enhance service for cross-border electronic commerce enterprise, reduce government administration in terms of customs clearance process.

PIM 1st International Conference
June 21, 2018
N 135
Enhancing cooperation with port departments on customs clearance through integrating customs, inspection and quarantine, port and other e-government platforms are also necessary. It is recommended to improve work efficiency by technical measures to achieve the goal that finish customs clearance of cross-border electronic commerce at aspect of customs clearance and settlement of exchange more conveniently. At last, regular inspection should be adopted to improve the supervision of enterprise operation at different stages (Yuansheng Xiao, 2003:68-69).
Thirdly, cultural creative industry based on incentive management. It is on the basis of slack management to design policies and measures of industrial development promotion. Cultural creative industry is the leading industry of Yinchuan FTZ, it is also a main industry carrier for local government to carry out China-Arab cooperation. Supervision should be creative and provided the quality service. In order to achieve the goal about convenient trade and provide a good operation environment for this industry, customs clearance process should be simplified, customs clearance cooperation with other ports should be reinforced. In addition, for cultural creative industry, especially for import and export of artwork exhibition, cultural and creative products, books and image products, administrative office of FTZ should make customs clearance more conveniently and communicate with cultural supervision department to enhance the monitoring of cultural creative products and prevent the export of illegal products.
Conclusion Simplifying the approval process, implementing a policy that enterprise has to set up
a single window of international trade to build an high-efficiency and convenient administrative service system play a crucial role in the transformation of Ningxia Yinchuan Comprehensive Free Trade Zone. The reform should be aimed to realize the facilitation of investment trade. Free Trade Zone should be based on incentive administrative theory to adopt some government administrative measures to promote the development of industry.
References Bin Liu & Hehe Li. (2014). China (Shanghai) Free Trade Zone Innovation Government
Regulation Model Meeting. Journal of Shanghai Business School, 15(1), 1-18. Guangguo Xu. (2013). New opportunity of Inland Opening Free Trade Zone. Yinchuan Daily,
First Edition. People's Government of Ningxia Hui Autonomous Region, (2015). Division Plan of Important
Policy about implementing “Strategic Planning of Building Silk Road Economic Belt and 21st-Century Maritime Silk Road”. http://www.nx.gov.cn/zwgk/gtwj/zcgwj/nzbf/113381.htm.
Qingyou Meng& Shiyuan Xu. (2014). Enlightenment for China of Management System of

PIM 1st International Conference
June 21, 2018
N 136
Foreign Free Trade Zone. Journal of Beijing Electronic Science and Technology Institute, 22(1), 47-52.
The State Council of China. (2015). Opinions of speeding the implementation of Free Trade Zone Strategy. http://www.gov.cn/zhengce/content/2015-12/17/content_10424.htm, 2015(69).
Xianglin Xu. (2002). Restrictions in Systems and Institutional Innovation of Administrative Approval System Reform. Journal of national school of administration, 20(6).
Yuansheng Xiao. (2003). Analysis of Transformation of Bonded Area to Free Trade Zone. China's Foreign Trade, (5). 68-69.

PIM 1st International Conference
June 21, 2018
N 137
THE ANALYSIS OF ENVIRONMENTAL FACTORS BOTH INTERNAL AND EXTERNAL FACTORS OF MEDICAL TOURISM BUSINESS IN THAILAND AFTER STEPPING TOWARDS THE ASEAN ECONOMIC COMMUNITY
Kornthika Parnkird1*, Palida Srisornkompon2
Patamaporn Pongpaibool3
1,2Faculty of Business Administration, Panyapiwat Institute of Management
3International College, Panyapiwat Institute of Management *Corresponding author, E-mail: [email protected]
ABSTRACT
The purpose of this research was to study the environment factors both Internal and External Factors of Medical Tourism Business in Thailand after Stepping towards the ASEAN Economic Community (AEC). In-depth Interviewing method were 10 Executives from 5 leading hospitals in both genders, 8 male and 2 female, and aged over 41 years old. Most of them graduated Bachelor Degree and receive more than 60,001 baht salary per month. The result showed the quality of medical service being the main factor that affected the for eigners decision making along with hospital reputation, compatible treatment cost and the communication skill of staffs. The majority of foreign patients came to have heart disease treatment because of the presence of many specialists, medical technology equipment, the medical services and reducing time by one stop service provided. Focused on JCI quality and international standards would improve the reliability and thee reputation of the foreigner towards hospital. Most of foreigners received hospital news from agency in their countries. Comprehending service mind “Thailand as the “Land of Smiles” impressed foreigners and influenced their return intention for the treatment. The ledge period of staying on 90-day visa approvals for medical services during the medical treatment strongly supported. However instability in economy affected the decision to travel for medical treatment. Also found that cultural and social class differences were not relevant to decision making on having medical treatment as long as the staffs were knowledgeable and understandable in term of culture differences.
Keywords: ASEAN Economic Community, Medical Tourism, One stop services Introduction
AEC knowledge center (2012, p.1) stated that ASEAN Economic Community (AEC) was first established with 5 countries members, Indonesia, Malaysia, Philippines, Singapore and Thailand before 5 more countries have become members including Brunei Darussalam,

PIM 1st International Conference
June 21, 2018
N 138
Vietnam, Laos, Myanmar and Cambodia . During the 9th ASEAN summit on October 7th, 2003 in Indonesia, the leader of the 10 ASEAN member countries agreed to establishment of the AEC, which consists of 3 pillars. (Ramkhamhaeng University Central Library, 2012)
1. ASEAN Political-Security Community (ASC) promotes political stability, democracy and good governance among the member countries and also contains the promotion and protection of human rights and fundamental freedoms to enhance political development along with peaceful and resilient region with shared responsibility for comprehensive security involves important human rights issues relating to human trafficking and counterterrorism.
2. ASEAN Socio-Cultural Community (ASCC) enhances the well-being and provide equitable access to human resource, advancing and prioritizing education, investing in human resource development and promotion of decent work with the view of achieving as well as building a sharing and caring society to make people in the region understand as part of the ASEAN community.
3. ASEAN Economic Community (AEC) fosters equitable and stable economic development on a global level which includes establishment of a single market, production base and regional competitiveness.
According to AEC, it was considered as an important pillar to build the cooperation of ASEAN community in order to share its economic benefits, negotiation power in with partners, and free trade import-export in ASEAN countries. An important change when stepping toward the AEC is language, especially English which was used for communication and for being tourist and transportation center (AEC Knowledge Center, 2012, p.1). The Ministry of tourism and sports (2015, p.6) mentioned that the number of tourists coming from neighboring countries of Thailand tends to increase rapidly, making them core visitors of Thailand. In the year 2006, the visitors from East Asia (ASEAN countries) were 57.46% of all foreign tourists. The European visitors were 24.03 %. These data showed that the tourists from short-distance traveling countries were increasing while the number of European tourists were reducing to 23.19 % of foreign tourists because EU economic growth rate has decreased.
Santipot Klabdi (2016, p. 10) mentioned that Thailand is the 3rd of the ASEAN member countries on ability to compete in travel and tourism comparing to Singapore and Malaysia, information on The Travel & Tourism Competitiveness Report 2015. Thailand has received 5.70 points from 7.0 in infrastructure services and traveling service 5.06 for price competitiveness along with 4.98 points for human resources and labor market, The overall score reached 4.26 points.
Pichai Cholviharnpun and Dr. Prapaporn Chunhachatcarachai (2015) stated in a column named “Chuykankid” (Think together) that nowadays, travel industry is a major industry and a significant service of income to the country. Thailand also considered as

PIM 1st International Conference
June 21, 2018
N 139
Medical Hub or Medical Center which made Medical Health Tourism become interesting and attractive investment (Nation 2016, p. 1). Health Tourism can be divided into 2 parts:
1. Medical Tourism is a trip for the medical treatment with standardized medical services with similar quality to Singapore, including Nursing care, and Modern medical technology, certified by international standards at the low medical costs as in India.
2. Wellness Tourism is a health-oriented service for rehabilitation such as health spa services, wellness service of Thailand. At present, there are 1609 certified health centers including 1,070 health massage centers and 509 spa massage centers and 30 beauty massage centers.
Medical tourism in Thailand is 4 times larger than Wellness, and it differs to the world market which Wellness tourism is 7.3 times larger. Along with the huge investment premium service quality ,private hospital are in good position for making profit comparing to the wellness centers that are small and very limited in expanding business. According to the Government strategic development plan to make Thailand as Asia medical center in the year 2004. Bangkok, Chiangmai, Phuket and Samui Island (Surat Thani) were chosen to start the project along with the plan to give 80 % investment for private hospitals located in the main tourist areas and 20 % investment for hospitals located in the secondary tourist area.
From the information as mentioned, the researcher found interesting to conduct a study about the analysis of environmental factors of medical tourism business in Thailand after stepping towards the ASEAN Economic Community to support the moving of tourism and economic development which generate huge revenues to the country in the same direction in order to expand and promote Thailand to become ASEAN medical center. Literature review Definition of medical tourism
Heung, Kucukusta and Song (2010, p. 238) stated that the medical tourism is when people travel across the border to another country to get medical services that are equivalent to or better than their countries.
Lunt et al (2011) had discussed about the medical tourism that foreign tourists travelling to receive treatment in another country or outside their country which included dentistry, Orthopedics Surgery, and Plastic surgery and medical care of doctors in hospitals.
Lalida Khuntong (2007, p.19) stated that Thailand is the interesting and willing destination for tourists coming to receive treatment services according to full medical services , high technology and the expertise of the medical staff together with lower medical cost. Medical tourism and health tourism in Thailand has become more attractive and made tremendous income to the country.
From above mentioned, Medical tourism refers to individuals or foreign tourists that travel from their countries to receive medical services in another country or outside their

PIM 1st International Conference
June 21, 2018
N 140
country, which has the potential to offer equivalent or better medical service including dentistry, Orthopedics Surgery, and plastic surgery and medical care of doctors in hospitals with the advance medical services technology of private hospitals, the professionalism of the medical staff and lower cost medical treatment. These reason have made Thailand become an attractive place and appointed destination for tourists coming to receive treatment services. Medical services offered to medical tourists in Thailand Medical services can be mainly divided into 3 groups: Cosmetic surgery, Dental care and other medical treatment (Kansinee Kantawongwan et al, 2015, p. 34-35.) as follows:
1. Cosmetic surgery is the most popular and famous medical service among tourists who will get the treatment in the hospital located in the main tourist areas and famous province such as Pattaya or Phuket.
2. Dental care is also one of the popular treatment due to the low expense and high quality treatment comparing Australia and New Zealand in Root canal, Dental implant and Cosmetic dental.
3. Other medical services which are divided into 2 groups: 3.1 Health check-up, most tourists who come for health check-up will also travel
along with recreation. 3.2 Complex disease, majorities of these tourists come from neighboring countries
of Thailand and Middle East groups. This special treatment requires a doctor or specialist and high technology to treat specific diseases. Most of places are located in Bangkok area for travelling convenience Trend of private hospital business in Thailand is growing significantly after the establishment of ASEAN Economic Community. It also shown that in order to survive in the business, private hospital will have to adapt and improve the strategy to meet the demand of today's customers. (Tewan Tawongsri, 2016, p. 2-3) SWOT analysis Supani Saridvinij. (2010, p. 28) explained the 4 elements of SWOT as following:
S (Strengths) is a highlight or advantage to analyze the environment within the organization, including field, manufacturing, finance, human resources, marketing, etc. W (weaknesses) is a disadvantage or vulnerability to analyze environment within the organization to understand the problem and find the solution O (Opportunities) is an opportunity to analyze the external environment organizations, including competitors, law, politics, money, fuel, etc. T (Threats) is a restriction or impediment to analyze the external environment organization that causing difficulty for the operation of the organization.

PIM 1st International Conference
June 21, 2018
N 141
SWOT analysis is the analytical of medical tourism under strength, weakness in production, Marketing, Organizational Management, Human resources and finance along with opportunity and threat in marketing, Competition, society, culture, law, technology and economic, which are internal and external factors (Nattapat Maneerot and Narasri Waiwanichkul, 2015, p. 207-210).
Ekamon Eiamsri (nd. p. 1) also mentioned that the PEST Analysis is a tool used to analyze and understand the overall external environment affecting business by considering the opportunities and threats (Tassani, 2012, p. 1) which consists of P – Political, policies of the government in both politics and Law. E - Economic for both economic factors in the short and long term. S – Sociocultural to monitor and analyze about cultures and livings in different societies. T – Technological, is an analysis of technology or innovation to create competitive advantage.
The Five Force Model is also playing an important tool for analyzing competitors in strategic business plan. (Passorn, 2012, p. 1) 1. The entry of new competitors will reduce the market share of the business that may lead to need of sustainability by improved practices. 2. Bargaining power of customer will effect the company to create value to meet customer demand and build up a strong brand.
3. Threat of substitution, the company will have to focus on avoiding the replacement by preparing the compatible in price and quality product. 4. Bargaining power of suppliers will drive the company to consider closely in the business environment to have highly negotiate with distributors. 5. Competitive Rivalry, by looking closely at the number and strength of the competitors before invest in the business. Objectives This research aimed to study the environmental factors after stepping towards ASEAN Economic Community (AEC) business of medical tourism in Thailand by using SWOT Analysis. Research Method
This research was a Qualitative Research using an In-depth Interview, Structured interviews using Purposive Selection by considering the key informants in hospital business based on private hospital structure including the administrator of private hospital 5 most famous treatment from foreigner in ASEAN and accreditation from JCI standards.
In this research, the key informants could be divided into five executives from leading hospitals; 2 persons per hospital, a total of 10 members. These numbers included: 2 executives from hospital affiliated with Bangkok Dusit Vejakarn Co. Ltd., 2 executives from

PIM 1st International Conference
June 21, 2018
N 142
Bumrungraj Hospital, 2 executives from Samitivej Hospital, 2 executives from Ramkhamhaeng Hospital and 2 executives from Vibhavadi hospital.
Data collecting In-depth interview as structured interviews were used in this study by open-ended questions determining question by having 5 parts of interview as Face-to-Face Interview by using Purposive Selection which was a way to get information and answers exactly as intended (Office of National Statistics, p. 1). The process was; First-off, by Phone-call and sending emails to each selected hospitals, Bangkok Dusit medical service Hospital, Bunrugrad International Hospital, Samitivej Hospital, Ramkhamhaeng Hospital and Vibhavadi Hospital by clarifying the purpose of the research to the interviewees. All recorded and noted will be taken during the interviews. After the interviews. All answers will be sent back to be confirmed with the interviewees. Data Triangulation will be used before analyzing (Sumit Suwan, nd, p. 4). Research Result
Part 1: ‘Overview of 10 key informants’ general information’, there were 8-male and 2-female all aged more than 41 years old; 5 Bachelor’s Degree graduates, 2 Master’s Degree graduates, 2 Doctoral Degree graduates and, 1 of other education. All of them are Executives of the hospitals who have 60,001 baht and up salary.
Part 2: Based on the review of ‘Strengths’, it has shown that most of the comments emphasized on the quality of service being the main factor allowing foreigners to having medical service along with the communication skill of staffs, quality of services with the fait cost were also very important that effected the decision. However, hospital location was not relevant due to the reputation of the hospital by word of mouth.
Part 3: Receiving better services and higher potential treatment were the factors that allowed the patient-decision to get services in different countries rather than in their own countries. International standard JCI and communication without interpreter could help reduce errors and correct understanding. The majority of foreign patient came to have heart disease treatment because of the presence of many specialists and high technology medical equipment.
Part 4: Based on reviewing ‘Opportunities’, it had seen that most of foreigners received hospital news from the communication channels such as an agency in their countries. Thailand is referred to as the “Land of Smiles” comprehending service mind that impressed foreigners with its developed treatment methods and influenced their return intention for the treatment. Also, 90-day visa approvals for medical services in Thailand strongly supported the medical tourism. Furthermore, during the medical treatment and

PIM 1st International Conference
June 21, 2018
N 143
recovery, patients could enjoy traveling to tourist attractions such as., Bangkok, Phuket, Chiang Mai, and Pattaya, which will generate income into the country.
Part 5: Based on reviewing ‘threat’, foreigners in ASEAN countries would not travel to get medical treatment if their economy was unstable. The development of medical technology equipment and the ability on complex disease treatment were very important along with the medical services and reducing time of treatment. In regards to having medical equipment and services reliable, decision of the foreign patients would be effected. Similarly, One-Stop Services and compatible treatment price must be provided. However, cultural and social class differences between the foreign patients and staffs were not relevant to decision making on having medical treatment as long as the staffs were knowledgeable and understandable in term of culture differences.
Discussion
Examined to the factor analysis of the business environment for medical tourism in Thailand after stepping towards the ASEAN Economic Community (AEC) by the in-depth interviews, Medical tourism will be growing rapidly in terms of generating income for more than 50-60 billion USD within 2012. And, Thailand as Medical hub of Asia will be focused and promoted according to the data analyzed as follows:
The ‘strength after stepping towards the AEC’ of medical tourism in Thailand found that the quality of service affected foreigners decision to use the service in a hospital/organization. The word of mouth was a form of marketing promotion that gave foreigners more confidence in their service-taking-decisions which was accordant with Aunchisa Chusri (2014, p.4) who studied The service innovation, corporate social responsibility, and word-of-mouth marketing affecting decision to use the private hospital’s inpatient ward (IPD) in Bangkok. The outcome also indicated that language communication skills in English and ASEAN languages, as the support from government to make Thailand as a Medical Hub, has reduced the risk of lack of medical equipment which was consistent with the research of the Waraporn Chulapanand (p. 24), development of the ASEAN Economic Community: the impact on Thailand, who found that the establishment of the ASEAN Economic Community was effected the improvement in both English and ASEAN language skills, to develop the quality of human resources. In the verge to build Thailand as a Medical Hub, the primary role of government was to support the state hospitals by having private sector help improving the quality services in order to attract investors and foreign patients to come for medical treatment in Thailand. However, price and higher service quality would still remain significant factor for ASEAN foreigner to come for treatment. This finding was correspondent to the study of Sasiwimol Ngamjaras (2012, p. 69) in Marketing mix factors affecting the decision of receiving the heart disease treatment in Thailand: a case study of European and middle east patients, the result revealed that most patients considered

PIM 1st International Conference
June 21, 2018
N 144
medical treatment and services expense as important factor which affected their decision of receiving the treatment in Thailand.
Based on ‘The points to be developed after participating the AEC’ of medical tourism in Thailand’, it was found that patients decided to use medical services in other countries because it could provide more service with better quality. This showed consistency with the research of Kamonrat Sakdisomboon Turner and Supalpich Maneesakhon Phone Baumann (2014, p. 12) who studied Health Service Utilization Behaviors and Quality of Care Perceived by Foreigners Living In Thailand. The medical services were likely to face increasing competition. Service providers needed to improve the quality difference and service with JCI quality and international standards and also focused on the complex treatment which would affect patient-decision to select services. If there are agencies to support Thailand Medical Hub policy, the private sector will play a role in the administration which will lead the organization to the right direction. This finding is compatible with the research of Impact of Free Trade Area on nursing workforce in Thailand ,Rachanee Sujijantararat, Vilaivan Thongchareon, Wimolrat Puwarawuttipanit and Det Kedicham (2013, p. 2), who found that the government should setup an organization that was responsible for policy support in healthcare service to balance the benefits and quality life of citizens. Hence, the organization should also provide language training, especially English for staffs to have better communication skills. This was again consistent with the research of Wilasinee Yonwikai (2013, p. 159) who stated that improving the English language communication skills of nurses and physicians would increase the satisfaction and reliability of foreign patient about having medical treatment in Thailand.
Based on ‘the Opportunities after joining the AEC of medical tourism in Thailand’, foreigners were impressed by the unique culture of Thailand, good manner, friendly behavior, and sincerely smile, as referred to the “Land of Smiles”, and comprehending service mind which would influence their return intention for the treatment which related to with the research of Jareeya Na Bangchang and Paiboon Asharungroj (2015, p. 129). Their study examined the Factors affecting behavior of public health services in Somdechprapinkloa Hospital Thonburi, Bangkok and showed that service with empathy and willingness affected significantly the choice of services. Furthermore, specialized and complex medical treatment with high technology would be costly and impacted hospital selection which related to the research of Wilasinee Yonwikai (2013, p. 159), who configured the development of English skills of Thai nurses to support Thailand as a center of medical sustainably and mentioned that hospitals should focus on foreigner medical treatment service-experience along with specialization in specific field of treatment to have a strong unique reputation. Based on ‘The threat after entering AEC of medical tourism in Thailand’, organizations should focus on the same direction toward one stop services information in

PIM 1st International Conference
June 21, 2018
N 145
practicing and communication which related to the research of Wapee Crongwiriyapap, and Suchada Ratchukul (2015, p. 104), who studied about Nursing Service Quality at Out-Patient Units Private Hospitals, Bangkok Metropolis discovered that private hospital should focus on strategic planning toward service competitive ness . One-Stop Services should be provided to reduce processing document time and enhance coordination and communication to improve the reliability in service quality. Specialize in specific treatment could be strong unique reputation. This finding corresponded to the study of Pornchai Deepaisalsakul (2013, p. 578), Expectation and Perception of the clients about the service quality of the hospital. The result revealed that different business strategies, such as specialize in specific treatment and understanding culture differences, would increase the competitiveness in business which is consistent with research of Laddawan Puttaruksa, Areerut Khumyu and Jinjutha Chaisena Dallas(2015, p. 71), who studied on Standards for Transcultural Nursing Services in expert views. The study mentioned that focusing on of human resource development with knowledge, skills, abilities and behaviors would help understanding between cultural differences in order to improve services. This finding was consistent with the research of Saisamorn Chaloeikitti, Pornnapa Kampround and Sompit Bhromdej (2013, p. 578), who instructed about Patient Safety and Quality of Nursing Service stated that medical technology rapidly developed and impact throughout the medical treatment would affect medical services. This result related to the research of Wapee Crongwiriyapap and Suchada Ratchukul (2015, p. 104), who studied the Nursing Service Quality at Out-Patient Units Private Hospitals, Bangkok Metropolis, and found that high technology in medical equipment had a big impact throughout medical services. Conclusions
Analyzing the environment factors on both Internal and External Factors of Medical Tourism Business in Thailand after Stepping towards the ASEAN Economic Community (AEC) found that the quality of service were the most affected foreigners decision to use the service in a hospital. However, medical service providers should emphasize on the service with JCI quality and international standards and focused on the complex treatment and specialized and complex medical treatment toward the foreigner along with improving on One-Stop Services to reduce processing document time and enhance coordination and communication to improve the reliability and sustainability in service quality. Recommendations
1. The researcher must be well prepared on the information and understand the medical service to receive the right objective result. 2. Cooperation between government and private sector will help improving and
developing Thailand to be the sustainable Asia medical center.

PIM 1st International Conference
June 21, 2018
N 146
Recommendations for future research 1. The future research should focus on the consumer behavior of patients medical service provider in ASEAN countries. 2. This research result will be benefit to the private hospital in Bangkok to improve the service quality standard and the satisfaction toward decision making on both Thais and foreigners patient.
References Turner, K. & Von Bormann, S. (2014) Health Service Utilization Behaviors and Quality of Care
Perceived by Foreigners Living In Thailand. Retrieved September 17, 2017, from https://www.tci-thaijo.org/index.php/tnaph/article/view/9816
Ministry of Tourism and Sports. (2015). ASEAN Tourism Strategic Plan 2015 - 2016. Retrieved October 18, 2016, from http://www.mots.go.th/ewt_dl_link.php?nid=7114
Kantawongwarn, K. & Team. (2015). Competitiveness of Thailand's health tourism industry. Retrieved from Chiang Mai University
Bangchang, J., & Asharungroj, P. (2015). Factors affecting behavior of public health services in Somdechprapinkloa Hospital Thonburi, Bangkok. Retrieved September 17, 2017, from http://ejournals.swu.ac.th/index.php/MBASBJ/article/view/6275
T. (2016). Trend of traveling in Thailand. Retrieved October 18, 2016, from http://www.thansettakij.com/content/55393
Maneerot, N., & Waiwanichkul, N. (2016). Competitive abilities of Thailand medical tourism. Retrieved from Dissertation, University of Phayao
Tawongsri, T. (2016). Report in business and industrial trend on private hospital / 2nd quarter 2016 (p.2-3). Retrieved from Goverment Saving Bank
Deepaisalsakul, P. (2016). Expectation and Perception of the clients about the service quality of the hospital. Retrieved September 17, 2017, from https://www.tci-thaijo.org/index.php/Veridian-E-Journal/article/viewFile/28400/24424
Cholviharnpun, P., & Chunhachatcarachai, D. (2015). stated in a column named “Chuykankid” (Think together). Retrieved October 18, 2016, from
https://www.prachachat.net/news_detail. php?newsid=1455178017 Passorn. (2012). Five Force Model. Retrieved October 6, 2016, from http://inc.karmins.com/
ปัจจัยกดดันทั้ง-5-five-force-model/ Sujijantararat, R., Thongchareon, V., Puwarawuttipanit, W., & Kedicham, D. (2013). Impact of
Free Trade Area on nursing workforce in Thailand (2013, p. 2). Retrieved September 17, 2017, from http://kb.hsri.or.th/dspace/handle/11228/3853?locale-attribute=th
Khoonthong, L. (2007). An approach of planning for medical tourism development in Phuket province. Master of Science Degree in Ecotourism Planning and Management, Srinakharinwirot University

PIM 1st International Conference
June 21, 2018
N 147
Puttaruksa L., Khumyu A., Dallas J. (2015) . The Development of Performance Criteria and Standards for Transcultural Nursing Services. Nursing Journal of the Ministry of Public Health 169. Retrived 17 September 2017, from https://www.tci-thaijo.org/index.php/tnaph/article/view/85297
Julpanont W. Development of ASEAN economic community and effect to Thailand. Retrieved 17 September 2017, from http://www.pol.ru.ac.th/attachments/article/175/research0001 _56.pdf
Crongwiriyapap W., Ratchukul S. (2014). Nursing Servlce Quality at Out-Patient Units, Private Hospitals, Bangkok Metropolis. Retrieved 17 September 2017, from https://www.tci-thaijo.org/index.php/JRTAN/article/viewFile/39765/32856
Ngamjarus S. (2012). Marketing mix factors affecting the decision of receiving the heart disease treatment in Thailand: A case study of European and Middle East patents. Retrived 17 September 2017, from www.repository.rmutt.ac.th/bitstream/handle/123456789/2299/136545.pdf
Chaleoykitti S., Kamprow P., Promdet S. (2014). Patient Safety and Quality of Nursing Service. Retrieved 17 September 2017, from http://www.kmutt.ac.th/jif/public_html/article_detail.php?ArticleID=138401
Saritwanich S. (2004) . Strategic management: Concept and theory (3rd edition) . Bangkok: Thammassat University Press.
Sumit Suwan S. Qualitative research design. Retrived 21 August 2017, from http://www.priv.nrct.go.th/ewt_dl.php?nid=900
National Statistical Office. Data collection. Retrived 26 August 2017, from http://service.nso.go.th/nso/nsopublish/know/estat1_9.html
Ramkhamhaeng University Library (2012). ASEAN Community. Retrieved 3 July 2015, from http://www.lib.ru.ac.th/journal2/?p=3290
Klubdee S. (2016). Competitive advantage of Thai Tourism in ASEAN. Retrieved 18 October 2016, from http://www.aseanthai.net/ewt_news.php?nid=5651&filename =index
Choosri A., (2014). The Service Innovation, Corporate Social Responsibility, and Word-of Mouth Marketing Affecting Decision to Use the Private Hospital’s Inpatient Ward (IPD) in Bangkok. Retrived 17 September 2017, from http://dspace.bu.ac.th/bitstream/123456789/1915/1/ anshisa_choo.pdf
Eiamsri E., Business analysis tools: PEST Analysis. Retrived 6 December 2017, from http://www.pisit.in.th/kheruxng-mux-wikheraah-thurkic
AEC information center ASEAN economic community (2012). ASEAN history and AEC. Retrived 17 October 2015, from http://www.thai-aec.com/ประวัติความเป็นมาประชา
Heung, V.C.S., Kucukusta, D. & Song, H. (2010). A Conceptual Model of Medical Tourism: Implications for Future Research. Journal of Travel & Tourism Marketing, 27(3), pp. 236- 251.

PIM 1st International Conference
June 21, 2018
N 148
Lunt, N., Smith, R., Exworthy, M., Green, S. T., Horsfall, D., & Mannion, R. (2011). Medical Tourism: Treatments, Markets and Health System Implications: A scoping review. OECD.
Yonwikai W. (2556) Development of English language skill for hospital nurses in Thailand to support medical facilities. Retrived 17 September 2017, from http://journal.stamford.edu/cgi-sys/suspendedpage.
PIM 1st International Conference
June 21, 2018
149
THE INFLUENCE OF CHINESE KUNG FU FILM ON HOLLYWOOD FILM
Tianyu Cao
Department of Communication of Arts, Faculty of International College of Social Sciences and Communication, Dhurakij Pundit University Corresponding
*Corresponding author, E-mail: [email protected]
ABSTRACT The motion picture can be broadly categorized as “Hollywood movies”, made in the
USA and for the global market, and in the world after the USA and produces films with distinctive genres such as Kung Fu. Hollywood films are influenced by genres of world cinema, including Chinese Kung Fu, because of perceived mystique and uniqueness.
This paper discusses Chinese Kung Fu films and their influence on Hollywood. Movies made in China and the USA were sampled and compared with each other, to find Kung Fu elements in Hollywood films. This paper is divided into two parts. The first one is analysis of three Chinese Kung Fu films which have an influence on Hollywood. The second part is using data from specific movies to analyze how these three movies can bring influence Hollywood and how Hollywood movies can relate to Chinese culture and the Kung Fu film genre. All of movies that the paper analyses contain Chinese martial arts elements or Hollywood action elements. Keywords: Chinese Kung Fu, Hollywood, Movie, Film Introduction
The film industry is an important part of the global economy, and watching films from the industry is a leisure collecting for millions of people in every country. That is why films can be extremely popular. The film industry of the USA, or Hollywood is the most well-known film manufacture in the World, which produces movies for the global market. In addition to Hollywood film, other countries around the world have large film industries, although these films are typically, marketed only in the country where they are produced. China is in the top 31of film-produced countries of the world. Our Chinese films are hardly known outside of China. Although Hollywood only occupies 6%2 of the whole film output in the world, its global influence is stronger than China’s. According to the data, people know that these 6%3 of the films occupied 80%4 of the film market of the whole world. Each 1 Data taken from http://news.xinhuanet.com/newmedia/2010-05/19/c_12118313.htm
2 Data taken from http://www.mofangge.com/html/qDetail/08/g0/201408/nfqdg008169790.html
3 Data taken from http://www.mofangge.com/html/qDetail/08/g0/201408/nfqdg008169790.html
4 Data taken from http://www.mofangge.com/html/qDetail/08/g0/201408/nfqdg008169790.html

PIM 1st International Conference
June 21, 2018
149
country’s films have their own genres, some of which may be unique to that country. Among Chinese films, the most visually impressive film genre is Kung Fu film, which includes many factors of Chinese culture. The action scenes of Kung Fu film are different from other kinds of fight actions scenes in Hollywood film, since it focuses on the skills of the combatants, shored through extensive training. Kung Fu also highlight “spirit”, not only for actions, which is different from other. The art of Chinese Kung Fu the emphasizes practiced self-defense actions genres. Like digging eyes from the Wing Chun style or Grabbing Hands which are not aesthetic. However, the skilled artistic were representation of the martial arts in. But they were always showed in Chinese Kung fu films is globally expecting doing to the mystique of oriental culture portrayed in these films. The topic is interesting, because oriental martial arts are widely portrayed in some of the most successful films made by Hollywood. Literature Review
Jerome. J. V said that “Thus, while those reviews correctly rejected the film's misleading thesis of "no different", they also tended to overlook the significance of the fact that a Hollywood film had been compelled to raise, however inadequately, the question of negro equality. It means that movie industry also can relates to the culture, and African American can be an element for Hollywood” (1950:45). Battison. H. J said that “For the creation of many special effects, simple inversion of the camera is all that is required. This operation is used chiefly to cause titles to appear suddenly and built up gradually to completion and for effects where it is necessary for the last scene recorded by the camera to be the first seen by the audience” (1950:215).
Bordwell said that “Thus the use of editing, though important, is wholly at the discretion of the filmmaker. still, one can see why editing has exercised such an enormous fascination for film aestheticians, for as a technique it is very powerful” (1997:201). Editing is thus an important part of a film. It can be a decisive element of the style of the movie.
Blumer. H said that “Meanwhile children clamor to attend the movies as often as they are allowed to go. Moving pictures make a profound appeal to children of all ages. Whatever the audience is, they still can get information from motion pictures”(1933:10). Kawin. F. B said that “But a photograph is not a simple thing, and once several photographs are arranged into a structure, that structure reveals mystery of its own, for it begins to display some of the attributions of a language: a signifying system” (1987:55). Film scenes are thus vital aspects of understanding the story or the plots.
Michael. R said that “I have stressed an immediate, instinctual response to the organization of an image, because this is how an audience must read a film. Ulike responding to a photograph or painting, which can be leisurely and thoughtful.” (1997:73).

PIM 1st International Conference
June 21, 2018
149
Boughey. D said that “The meteoric rise of the cinematograph industry from scientific experiment to world-wide industrial and commercial importance is of such recent occurrence that it will be more or less familiar even to the younger generation”(1921:19). Bolen. M said that “It goes without saying that director is the man of all work. TV workmen become teams--units who function at their best together. A director is only as good as his team---no matter how talented he may be” (1950:215).
Ozer. S. J said that “In a movie the story is given in a brief time--at one sitting” (971:89). Objectives
The study is divided into two parts. The first one is the analysis of fighting scenes in three Chinese Kung Fu movies that have influenced Hollywood, especially the fight scenes in these movies. The second part assesses how Hollywood movies incorporate of Chinese culture and Kung Fu, for determining the influence of Chinese Kung Fu on Hollywood. Methods
Three Chinese Kung Fu films were studied in this research, is “Enter the Dragon”, which was made in 1973 and released in Hong Kong on July 26, 1973. The director was Robert Clouse. The main character was Bruce Lee. He brought the Chinese Kung Fu genre into Hollywood. He was awarded the “Martial arts movie star award” on November 1998, and he also got “Lifetime Achievement Award” in 19935. Bruce Lee made American audiences know what is Chinese Kung Fu.
The second Chinese Kung Fu film is “Rumble in the Bronx”6, which was made in 1994 and released on January 25, 1995. The director was Stanley Tong, who was a famous director in Hong Kong. The lead actor was Jackie Chan, who is an internationally recognized Kung Fu star. The Kung Fu style of Jackie Chan is different from Bruce Lee. Lee’s actions areharder and stronger, and Jackie Chan added more comedy elements into action scenes. Chan’s films are popular because they blend different elements and Jackie appear to a broader audience.
The last selected Chinese Kung Fu movie is “Crouching Tiger, Hidden Dragon”7, which was made in 2000, released on May 16, 2000 in France and released on July 8, 2000 in China. The director was Ang Lee, who won the 78th and 85th Oscar award of best director8
5 Data taken from http://baike.baidu.com/subview/3091/8045178.htm
6<Rumble in the Bronx>,StanleyTong,Jiahe Entertainment Limited,1994
7<Crouching Tiger, Hidden Dragon> ,AngLee, China Film Co-Production Corporation,2000
8 Data taken from http://baike.baidu.com/subview/25290/6326835.htm

PIM 1st International Conference
June 21, 2018
149
for “Brokeback Mountain”9 in 2006 and “Life of Pi”10 in 2013. “Crouching tiger, hidden dragon” is a popular Kung Fu movie that won 4 Oscar awards at the 73rd Oscar awards ceremony, including the best foreign language film at that time. It was also nominated for another 6 awards11. People can say that it was the first time that western people in touch with Chinese mysterious and beautiful Kung Fu, which people fight with each other in the sky or on the water.
Hollywood learned a lot from the Chinese Kung Fu genre and added elements of the genre into their later films. Such a sa series of films named “The Matrix”12 brought many Chinese martial arts elements in to the movie. The director of “The Matrix” was Andy Wachowski, who is a fan of Chinese Kung Fu. When he made this film, he invited famous Chinese martial art consultants for designing action scenes.
Results and discussion
The Hollywood industry has realized the potential of the Chinese market and added more Chinese Kung Fu factors in the movie to attract a greater Chinese audience. For example, the series of movies called “Kung Fu Panda”, which was directed by Mark Osborne and John Steffens en and released in 2008. The movie was nominated as the best cartoon and the best director of the cartoon of Golden Globe Awards in 200913.
The Hollywood film industry started making films with a Kung Fu element by hiring famous Kung Fu stars, such as Bruce Lee and Jackie Chan, to be the main character in the film. Bruce Lee’s movies can make people feel cheerful and nervous, because of the rhythm of the movie. For Jackie Chan, not only that audience can feel cheerful, but also can feel humorous and dramatic. The global influence of Chinese Kung Fu actors also has increased. This phenomenon makes Hollywood invite more Chinese actor and actress to join Hollywood films, which attracts a greater Chinese audience.
From three Chinese Kung Fu films, people can find difference between them. Three Kung Fu films represent three styles of Kung Fu. That means, for Chinese Kung Fu, there are different styles. In “Enter the Dragon”, people can discover something about Bruce Lee’ Kung Fu. His actions were powerful and people can find this from each punch. When enemies get close to him, he uses his punch to fight with people and his enemies were defeated by single strikes. This visual shock makes the audience feel very excited. This type of scene can be said to be the first impression of Chinese Kung Fu in western countries. The
9<Brokeback Mountain>, AngLee, Focus Features,2005
10<Life of Pi>, Ang Lee, 20th Century Fox Film Corporation,2012
11 Data taken from http://baike.baidu.com/subview/27115/5421772.htm
12<The Matrix>, AndyWachowski, LarryWachowski, Warner Bros. Entertainment, 1999
13 Data taken from http://baike.baidu.com/subview/779189/7820657.htm

PIM 1st International Conference
June 21, 2018
149
personality of the character of Bruce Lee also is recognizable in American’s culture, as the character portrayed by Bruce Lee is strong and muscular. As for Jackie Chan, his acrobatic style of Kung Fu mixed with usual human is very different from Bruce Lee’s style. Jackie Chan’s films appeal to a broader audience as there is less emphasis on violence in the making for action scenes, and more emphasis on humor and acrobatic skill. Conclusion
With the comparison between Chinese and Hollywood action films, readers can find that they are linked to each other tightly, and there are many examples of films showing that each kind of film can exhibits the other kind. This trend will likely continue as both countries also have collaboration in the film industry such as the summit meeting of Chinese and American movie industries of 2016 in China. China insists the strategy of the country called “Go Out”, which means let their own applies to the movie industry as well. From this paper, people can find that both of two countries want to expect their culture to the world. Different kinds of movies have different styles. The series of “Rush Hour” movies, which was a series of Hollywood films released in 1998 and made by Brett Ratner, who is a well-known director in the USA. The main characters were Chief Inspector Lee, who was played by Jackie Chan, and Detective James Carter, who was played by Chris Tucker. These two people represent two different cultures and styles, Lee is Chinese and his gentle personality contracts with James Carter’s frank character. From the movie, people of different cultures can relate to different characters.
The choice of Chinese Kung Fu films to analyze is important, as these movies are considered representative films that show the influence on Hollywood, the chosen films are well-known and influential. The success of these films at the box office together with their Chinese cultured elements left a deep impression on the audience. Films of the Kung Fu genre can make China and USA to have more chances to collaborate with each other, and lead to corporation of other Chinese cultured elements in Hollywood movies of other genres, such as action films. Furthermore, benefits can arise from other aspects of cross-cultured films such as merchandise products. When an audience watches a heroism film of Hollywood, some of them may buy some merchandise products, such as hero models. The paper discusses the influence of Chinese Kung Fu films on Hollywood films, and vice-versa, Hollywood got new elements when they know about Kung Fu, and the Chinese used Hollywood as a platform to show itself to the world.
References
Jerome, V. J. (1950). The negro in Hollywood films. Masses & mainstream. P. 45 Blumer, H. (1933). Movies and conduct (Vol. 4). The Macmillan Company. P. 10 Bolen, M. O. (1950). Fundamentals of Television. Hollywood Radio Publishers. P. 215

PIM 1st International Conference
June 21, 2018
149
Battison, J. H. (1950). Movies for TV. Macmillan. P. 215 Ozer, S. J. (1971). Children and movies. University of Chicago Press. P. 89 Bordwell, D., Thompson, K., & Ashton, J. (1997). Film art: An introduction(Vol. 7). New York: McGraw-Hill. Michael, R. (1997). Directing the documentary. p. 73 Kawin, B. F. (1987). How movies work. Univ of California Press. <The Matrix>,Andy Wachowski, Larry Wachowski, Warner Bros. Entertainment,1999 <Crouching Tiger, Hidden Dragon>, Ang Lee, China Film Co-Production Corporation, 2000 <Enter The Dragon>,Gao Leshi, Jiahe Entertainment Limited, 1973 <Rumble in the Bronx>,Stanley Tong, Jiahe Entertainment Limited, 1994 <Kung Fu Panda>,Mark Osborne, Paramount Pictures, 2008

PIM 1st International Conference
June 21, 2018
N 155
THE SERVICE QUALITY AND BRAND IMAGE EFFECT ON THE CUSTOMER LOYALTY: THE CASE OF THE TELENOR TELECOMMUNICATION IN MYANMAR
Yan Myo Aung1, Pithoon Thanabordeekij2
1,2International program, Panyapiwatt Institute of Management
Bangkok, 11120 ABSTRACT
The purpose of this study is to examine the relationship between five dimensions of perceived service quality, brand image and customer satisfaction towards customer loyalty of Telenor telecommunication in Mandalay, Myanmar. The quantitative questionnaires were approached by using linear regression analysis to confirm the results. Survey data were collected from 400 customers who experienced the service of international mobile operator namely Telenor Myanmar. Survey data were collected from customers who are using Telenor mobile subscribers in Mandalay. The Results of the study suggest customer loyalty is most influenced by the “Empathy” dimension. The finding also shows that brand image is also positively influenced customer satisfaction and loyalty.
Keywords: Service quality, Brand image, Customer loyalty,Telenor Telecommunication in Myanmar.
Introduction
Nowadays, telecommunication service is the most popular business in a social environment and also an important tool for business. Myanmar remains one of the last underdeveloped telecommunication markets in Asia (Harpur, 2017). Until 2012, a SIM card in Myanmar could cost as much as US$1500. After the government awarded licenses to foreign operators, the cost decreased up to US$ 1.50, which everyone could afford. Up till 2014, Myanmar Post and Telecommunication (MPT) was played the only operator in the market. When the government began to allow the foreign investment, two foreign operators entered Myanmar’s Telecom market namely Ooredoo (Qatar) and Telenor (Norway).
The Telenor mobile operator got licenses in Myanmar in February 2014. This operator has been offering mobile voice and internet services using the GSM 2G and 3G systems since 2014. They are rapidly building up a network and have already surpassed Ooredoo in coverage and become a major competitor in this industry. According to the Telenor mission, their plan is to cover 80% of Myanmar by the end of the decade. They are so successful right now that their network is already congested in downtown Yangon and Mandalay. The Telenor 2G and 3G network are the biggest in Myanmar telecommunication. In early 2016,

PIM 1st International Conference
June 21, 2018
N 156
Telenor 4G/LTE has launched in the commercial cities such as Yangon, Mandalay, Nay Pyi Taw, Myawady and Muse by the rather unusual frequency band of 2100 MHz (Telenor, 2018).
With this market competition, the telecommunication industries have to keep up with their competitors in term of products and services offered to customers. Delivering high-quality service is important to the businesses’ success. Despite increasing competition and customer demand, the telecommunication industry has to provide a high standard of service continuously. A good brand image can also enhance customer experience and satisfaction of returning business. Therefore, understanding the factors that impact customer loyalty might be useful for the service provider to design and attribute the right offer to the customer.
Therefore, the main objective of this study is to investigate the critical success factors in customer loyalty towards Telenor telecommunication in Myanmar and to identify the relationship between five dimensions (SERVQUAL), brand image and customer satisfaction towards customer loyalty in the telecommunication industry.
Literature Review Service Quality
There are several factors that drive telecom industries to success. Service quality is one of the key success factors which lead to the growth of the telecom industries in differentiating itself from competitors. Providing high-quality service is an opportunity to influence customers' satisfaction and loyalty. Service can be distinguished three main characteristics by intangibility, heterogeneity, and inseparability. Intangibility: Zeithaml, (1981) concluded that the intangible nature of service definition, enterprises may find it hard to understand how consumers perceive their services. Heterogeneous: Booms and Bitner, (1981) proposed that it is considerable difficulty in keeping stability whenever it is delivered as a consequence of this difference. Inseparability: Carmen and Langeard, (1980) confirmed that the operation and consumption of many services are immediate and separation between them is almost impossible. The SERVQUAL Model
The SERVQUAL approach was designed by (Parasuraman, Zeithaml, & Berry, 1985) in response to the lack of conclusive published research material link with service quality management. Since service quality has been described as intangible, desperate and indivisible, it is very difficult to be measured objectively (Zhao, Bai, & Hui, 2002). Past researchers have indicated, reconstructed, and proposed various versions of the SERVQUAL model to bring about specific aspects in the numerous service sectors (Pizam et al., 2016). SERVQUAL model is based on customers' evaluation of the quality of service across five

PIM 1st International Conference
June 21, 2018
N 157
distinct dimensions for service sectors: tangibility, reliability, assurance, responsiveness, and empathy.
1) Tangible means the business of physical facilities. It is very important for the service providers. According to the Zeithamal et al., (2006), the businesses used the tangible to carry the image and indicator quality.
2) Reliability refers that the ability to offer the service as promised before in a dependable and accurate way (Zeithamal et al., 2006). For telecommunication industry, reliability means provide the truthfulness of billing, proper record keeping and performance the service.
3) Responsiveness means helping customers willingly and providing prompt service. The responsiveness is concerned with production with the customers' requirements, demands, and problems solved quickly and attentively.
4) Assurance requires employees’ knowledge, politeness and ability to establish trust and to have confidence. It also consists of skills, hospitality, dependability, and safety.
5) Empathy involves caring and providing individualized responsiveness to customers by the staffs of the business (Zeithaml et al., 2006). The customer will be better-off and feel comfortable if provided individual attention. Brand Image
Brand image is the subordinate brand perception. Brand image influences customer purchase decisions while marketing undertakings and personal customer characteristics also influence brand image and customers’ decision for purchasing. Aaker (1991) also favors that brand image can create value concerning helping the customer to process data, separating the brand, generating reasons to buy, give progressive feelings, and providing a basis for extensions. Customer satisfaction
Customer satisfaction is the level of customers’ happiness with the goods and services operated by a company. Customer satisfaction is compared with a product perceived performance to individual expectation, (Gerpott, Rams, & Schindler, 2001). Customer satisfaction is the main indicator of the company’s performance in order to determine the customer retention. Any number of benefits are connected with customer satisfaction; the customers with great satisfaction at a stable rate, who do not use supplementary products, are less influenced by market challenges and stay more loyal with the firm, (Zineldin, 2000). Customer loyalty
Customer loyalty can be defined in two different ways by customer attitude and loyalty behavior. Customer attitude means that different customer feelings and individual's attitude base-on overall attachment to an association of product and service. Loyalty

PIM 1st International Conference
June 21, 2018
N 158
behavior refers to a behavior that is continuously buying services from the same business, enabling to increase the area of relationship or the way of recommendation to others. These results define the individual’s (purely cognitive) level of customer loyalty, (Yi, 1990). A greater level of customer loyalty can be gained from a satisfied customer. Loyalty is measured based on both attitudinal and behavioral approaches in an attempt to get a holistic view of customers’ loyalty to the telecommunication industry.
Proposed Framework
Research objectives
The purpose of this study is to examine the relationship between five dimensions of SERVQUAL model, brand image and customer satisfaction towards customer loyalty on telecommunication industry in Myanmar.
Hypothesis Perceived Service Quality and Customer Satisfaction
Telecommunication industries are facing an increasingly competitive pressure to survive, and great efforts are being devoted to better understanding customers’ needs and to provide the services that meet their expectations. The perceived service quality is vital to be a successful organization because this factor has a definite link with encouraging customer satisfaction and enabling behavioral intentions (Parasuraman, Zeithaml, & Berry, 1985). Customers’ perceived service quality has a significant influence on the telecommunication industry. Therefore, the following hypothesis was proposed; H1a : Tangible has a positive effect on customer satisfaction. H2a : Reliability has a positive effect on customer satisfaction. H3a : Responsiveness has a positive effect on customer satisfaction.
Adapted from : Cronin, J., & Taylor, S. (1992); Aydin, S., & Ozer, G. (2005), Parasuraman, A., Zeithaml, V., & Berry, L. (1985), Szymanski, D., & Henard, D. (2001), Ryu, Han, & Jang, (2010); Kivela, Inbakaran, & Reece, (1999); Kim, Hertzman, & Hwang, (2010); Namkung & Jang, (2007)

PIM 1st International Conference
June 21, 2018
N 159
H4a : Assurance has a positive effect on customer satisfaction. H5a : Empathy will have a positive effect on customer satisfaction. Perceived Quality and Customer Loyalty
Cronin & Taylor, (1992) hypothesized that perceived service quality positively affects consumers’ loyalty. Perceived quality refers to the thought of the customer concerning with the superior value or excellent condition of either a product or service. Perceived quality has a directly considerable impact on customer purchase decision and brand loyalty; particularly, customers do not have much information that is related to products that they are going to purchase (Aaker D. , 1991) (Armstrong & Kolter, 2003)
Thus, we can now develop the hypothesis as follows: H1b : Tangible has a positive effect on customer loyalty. H2b : Reliability has a positive effect on customer loyalty. H3b : Responsiveness has a positive effect on customer loyalty. H4b : Assurance has a positive effect on customer loyalty. H5b : Empathy has a positive effect on customer loyalty. Brand Image, Customer Satisfaction, Customer Loyalty
Brand image is a key factor for determining the level of customer satisfaction that leads to customer loyalty (Ryu, Han, & Janng, 2010), (Kivela, Inbakaran, & Reece, 1999), (Kim, Hertzman, & Hwang, 2010), (Namkung & Jang, 2007). An operational and human factor was found to have a strong attractive influence on image and loyalty (Kandampully & Hu, 2002). The consumers who obtain their preferred service brand are likely to have higher levels of loyalty as well as a more positive attitude towards service augmentation elements of the obtained (i.e., preferred) brand. So, in respect of the above-mentioned facts, we now extend this hypothesis as: H6a : Brand image has a positive effect on customer satisfaction. H6b : Brand image has a positive effect on customer loyalty. Customer Satisfaction and Customer Loyalty
It was also confirmed that it was a common condition which customers who state to have brand loyalty changed brand recently even though they were satisfied with their the brand. Therefore, to become loyal and profitable for the industry, a customer must be highly satisfied. A reduction in overall satisfaction causes a considerable decrease in loyalty (Jones & Sasser, 1995). H7 : High customer satisfaction has a positive effect on customer loyalty.
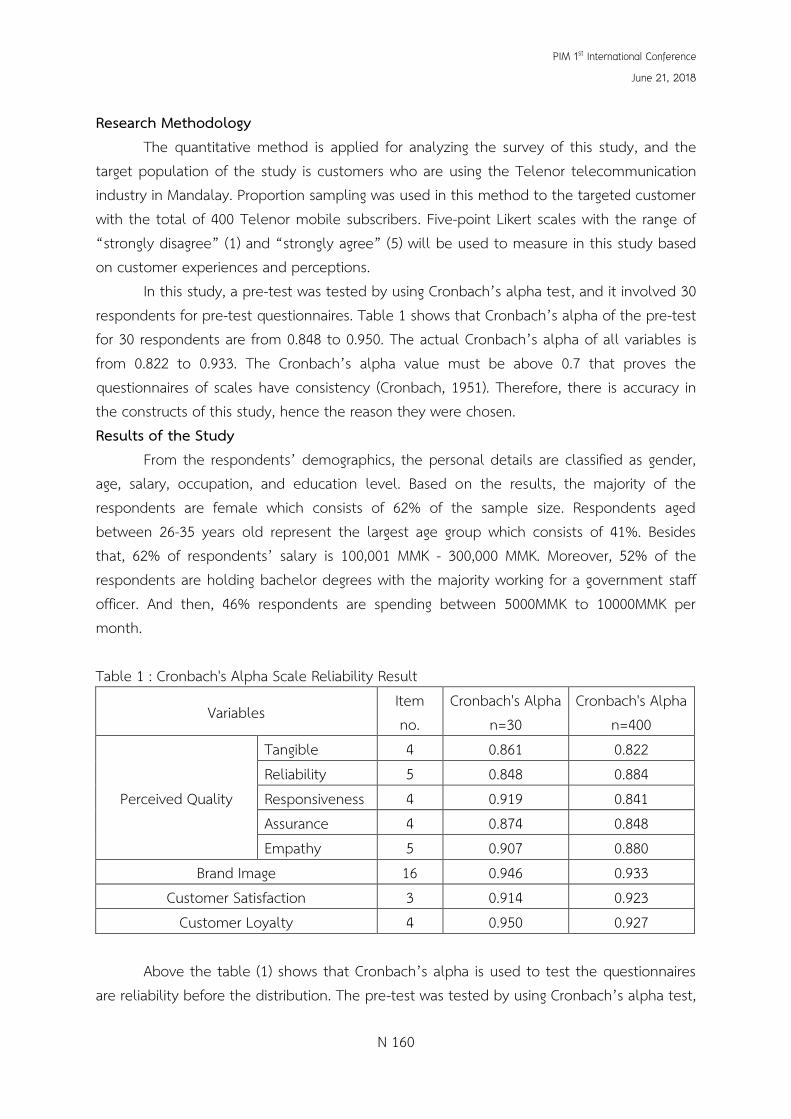
PIM 1st International Conference
June 21, 2018
N 160
Research Methodology The quantitative method is applied for analyzing the survey of this study, and the
target population of the study is customers who are using the Telenor telecommunication industry in Mandalay. Proportion sampling was used in this method to the targeted customer with the total of 400 Telenor mobile subscribers. Five-point Likert scales with the range of “strongly disagree” (1) and “strongly agree” (5) will be used to measure in this study based on customer experiences and perceptions.
In this study, a pre-test was tested by using Cronbach’s alpha test, and it involved 30 respondents for pre-test questionnaires. Table 1 shows that Cronbach’s alpha of the pre-test for 30 respondents are from 0.848 to 0.950. The actual Cronbach’s alpha of all variables is from 0.822 to 0.933. The Cronbach’s alpha value must be above 0.7 that proves the questionnaires of scales have consistency (Cronbach, 1951). Therefore, there is accuracy in the constructs of this study, hence the reason they were chosen. Results of the Study
From the respondents’ demographics, the personal details are classified as gender, age, salary, occupation, and education level. Based on the results, the majority of the respondents are female which consists of 62% of the sample size. Respondents aged between 26-35 years old represent the largest age group which consists of 41%. Besides that, 62% of respondents’ salary is 100,001 MMK - 300,000 MMK. Moreover, 52% of the respondents are holding bachelor degrees with the majority working for a government staff officer. And then, 46% respondents are spending between 5000MMK to 10000MMK per month.
Table 1 : Cronbach's Alpha Scale Reliability Result
Variables Item no.
Cronbach's Alpha n=30
Cronbach's Alpha n=400
Perceived Quality
Tangible 4 0.861 0.822 Reliability 5 0.848 0.884 Responsiveness 4 0.919 0.841 Assurance 4 0.874 0.848 Empathy 5 0.907 0.880
Brand Image 16 0.946 0.933 Customer Satisfaction 3 0.914 0.923
Customer Loyalty 4 0.950 0.927
Above the table (1) shows that Cronbach’s alpha is used to test the questionnaires are reliability before the distribution. The pre-test was tested by using Cronbach’s alpha test,

PIM 1st International Conference
June 21, 2018
N 161
and it involves 30 respondents for pre-test questionnaires. Table (1) shows that Cronbach’s alpha of the pre-test for 30 respondents are from 0.848 to 0.950. The actual Cronbach’s alpha of all variables is from 0.822 to 0.933. The Cronbach’s alpha value must be above 0.7 that proves the questionnaires of scales have consistency (Cronbach, 1951). Therefore, all constructs of this research are accepted. Relationship of relevant variables and the research hypothesis
Table 2: Summary of Testing Hypotheses
No. Hypothesis Path β t-
value p-
value Hypothesis Supported
H1a Tangible Satisfaction 0.138* 2.356 0.019 Yes H2a Reliability Satisfaction 0.061 0.843 0.400 No H3a Responsiveness Satisfaction 0.103 1.567 0.118 N0 H4a Assurance Satisfaction 0.227** 3.303 0.001 Yes H5a Empathy Satisfaction 0.196** 2.940 0.003 Yes H1b Tangible Loyalty 0.153** 2.573 0.010 Yes H2b Reliability Loyalty 0.135 1.839 0.067 No H3b Responsiveness Loyalty 0.087 1.309 0.191 No H4b Assurance Loyalty 0.132 1.881 0.061 No H5b Empathy Loyalty 0.202** 2.983 0.003 Yes H6a Brand Image Satisfaction 0.760** 23.352 0.000 Yes H6b Brand Image Loyalty 0.776** 24.579 0.000 Yes H7 Satisfaction Loyalty 0.874** 35.908 0.000 Yes *significant at 0.05, ** significant at 0.01
Based on the finding of Table 2, the results show that tangible, responsiveness,
assurance, reliability and empathy have positively impacted on customer satisfaction. Among all the five independent variables, Assurance has the strongest influence on customer satisfaction (β = 0.227), followed by Empathy (β = 0.196), Tangible (β = 0.138), Responsibility (β = 0.103), and Reliability (β = 0.061). As for the customer loyalty, only Tangible and empathy shows a significant relationship with loyalty. Empathy has the strongest influence on customer loyalty (β = 0.202). Moreover, the Brand image positively influences both customer satisfaction and loyalty.
The result of this study showed tangible, and empathy dimensions positively influence both customer satisfaction and customer loyalty. The dimension of assurance positively related the customer satisfaction. The previous research indicated that perceived service quality is critical for the success of business because of its direct relationship with customer satisfaction and behavioral intentions (Parasuraman, et al, 1985).

PIM 1st International Conference
June 21, 2018
N 162
In this study, brand image is positively related to customer satisfaction and loyalty. The previous researcher, Dib & Al-Msallam (2015) showed that brand image is fundamental and also important to build up customer satisfaction and loyalty. Implication and Conclusion
The main objective of the study is to investigate service quality, brand image and customer satisfaction toward customer loyalty in the telecommunication industry. Customer satisfaction plays an important role in determining the success of the Telenor telecommunication industry. Customer satisfaction plays an important role in determining the success of the telecommunication industry. If the customers are not satisfied with the telecom operator, they may move to another service that fulfills their expectations. Therefore, the managers could also determine the impact of the company image on the level of customer satisfaction. Thus, it can help them to understand more detail information and fully know how to meet the customers’ expectation and their needs.
The findings indicated that empathy was the strongest positive significant impact than other dimensions (tangible, reliability, assurance, and responsiveness) towards customer satisfaction and loyalty. Telenor telecommunication industry should focus on the empathy factors which are necessary to provide the service such as conveying personalized or customized service to make customers feel that they are special.
Moreover, manager of Telenor telecommunication industry should emphasize on tangible by the appearance of physical facilities, modern equipment, the appearance of staff, and attractive service materials. In addition, they should improve assurance by becoming more courteous, knowledgeable and trustworthy during the service encounter to attract customers. High level of assurance can be developed by providing knowledgeable information of products and serving the products accurately in a timely manner. Service providers also need to focus on providing quality products and services which can maintain customer highly-valued perceptions. This finding reinforces the need for the telecommunication industry to improve service quality, especially reliability, assurance, and responsiveness by improving the skill of the staff to deliver trust and confidence to the customers.
Additionally, loyalty has a direct influence on customer satisfaction, which is mainly influenced by what service was provided. Indeed, the staffs' attitude greatly impacts the customers’ experiences. Happy customers come from happy staffs. The improvement of the mobile subscriber satisfaction level leads to a reduction of operation costs, which creates an opportunity to expand the existing or new products and services. In order to strengthen the performance of the staff, they should be valued and treated as an investor, who invest their skill, talent, and energy in the telecommunication industry to build up a good rapport with the customers. Therefore, employees will willingly work harder to assist the success of the

PIM 1st International Conference
June 21, 2018
N 163
industry. The Telenor telecommunication industry needs to ensure that the employees are able to provide excellent service. Employee performance can be improved by increasing employee motivation, improved service skills, training and awareness of company policies. Customer satisfaction level can be increased by monitoring feedback and responses to customer complaints. Service improvement programs (plan, implement, evaluate and improve) are the other tools which can enhance customer satisfaction and loyalty and lead the customer to recommend the others. In order to cause the potential customer to use for the mobile operator and to continue to have the current customers, managing service quality levels are an important strategy for the telecommunication industry. Furthermore, Telenor telecommunication industry managers always need to make a focus on how well or how poorly the industry is performing and take action to achieve customers' expectation. Acknowledgments
I sincerely thank my advisor, the dean and all the anonymous respondents that gave their valuable time to answer the questionnaires.
References Aaker, D. (1991). Managing Brand Equity: Capitalizing on Value of a Brand Name. New York:
The Free Press. Aaker, D. (1991). Managing Brand Euity: Capitalizing on Value of a Brand Name. New York:
The Free Press. Aaker, D. (1997). Harvard Business Review, Vol. 75(No. 5), 135-43. Armstrong, G., & Kolter, P. (2003). Marketing: An Introduction. Pearson Prentice Hall, New
Jersey. Booms, B. H., & Bitner, M. J. (1981). "Marketing Strategies and Organnization Structures for
Services Firms",in Marketing of services. J. Donnelly and W. George, eds, Chicago: American Marketing, 47-51.
Cronbach, L. (1951). Coefficient alpha and the interanal structure of tests. Vol. 16 (Bi. 3), 297-334.
Cronin, J. J., & Taylor, S. A. (1992). Measuring service quality: A reexamination and extension. Journal of Marketing, Vol. 56, 55-68.
Dib, H., & Al-Msallam, S. (2015). The Effects of the Determinants of Customer Satisfaction on Brand Loyalty. Journal of Research in Business and Management, 01-12.
Gerpott, T. J., Rams, W., & Schindler, A. (2001). Customer retention, loyalty, and satisfaction in the German mobile cellular telecommunication market. Telecommunications Policy, 25, 4, 249-269.
Harpur, P. (2017, August 3). Myanmar (Burma) - Telecoms, Mobile, Broadband and Digital Media - Statistics and Analyses. Retrieved from budde:

PIM 1st International Conference
June 21, 2018
N 164
https://www.budde.com.au/Research/Myanmar-Burma-Telecoms-Mobile-Broadband-and-Digital-Media-Statistics-and-Analyses
Izogo, E. E., & Ogba, I.-E. (2015). Service quality, customer satisfaction and loyalty in. International Journal of Quality & Reliability Management, Vol. 32, 250-269.
Jones, T., & Sasser, W. (1995). Harvard Business Review, Why satisfied customers defect. 88-99.
Kandampully, J., & Hu, H. (2002). Do hoteliers need to manage image to retain loyal customers? International Journal of Contemporary Hospitality Management, Vol.19, (No. 6), 435-443.
Kim, Y., Hertzman, J., & Hwang, J. (2010). College student and quick-service restaurants, How student perceive restaurant food and service. Journal of Foodservice Business Research, Vol.16, (No.4), 346-359.
Kivela, J., Inbakaran, R., & Reece, J. (1999). Consumer research in the restaurant environment. Part 1: a conceptual model of dining satisfaction and return patronage. International Journal of Contemporary Hospitality Management, Vol. 11, (No. 5), 205-222.
Namkung, Y., & Jang, S. (2007). Does food quality really matter in restaurant? Its impact on customer satisfaction and behavioral intentions. Journal of Hospitality & Tourism Research, Vol. 31(No. 3), 387-410.
Parasuraman, A., Zeithaml, V., & Berry, L. (1985). A conceptual model of service quality and its implications for future research. Journal of Marketing, Vol49, No.4, Vol. 49 (autumn), 41-50.
Ryu, K., Han, H., & Jang, S. (2010). The effect of hedonic and utilitarian values on customers’ satisfaction and behavioral intention in the fast-casual restaurant industry. International Journal of Contemporary Hospitality Management, Vol. 22(No. 3), 416-32.
Telenor. (2018). Telenor at a glance . Retrieved from https://www.telenor.com.mm/en/about/telenor-glance
Yi, Y. (1990). Critical Review of Consumer satisfaction. Review of marketing Vol.1990, 68-123. Zeithaml, V. A. (1981). How Consumer Evaluation processes Differ between Goods and
services, in Marketing of service. J. Donnelly and W. George, eds, Chicago American marketing, 186-190.
Zhao, X., Bai, C., & Hui, Y. (2002). An empirical assessment and application of SERQUAL in a Mainland Chinese department store. Total Quality Management, Vol.13 (N0. 2), 241-254.
Zineldin, M. (2000). TRM Total Relationship Management, Student literatur. Lund.

PIM 1st International Conference
June 21, 2018
N 166
THE IMPACT OF MICROFINANCE ON BUSINESS GROWTH OF BENEFICIARIES OF MICROFINANCE SERVICES.
Aaron Alfred Sackey
Faculty of Business, SMC University *Corresponding author, E-mail: E-mail: [email protected]
ABSTRACT
The quantitative study sought to investigate the relationship microfinance has on business growth with respect to its beneficiaries. A correlational study was used to better investigate the relationship between the variables under study. The study brought out the fact that access to microfinance plays a crucial role in business growth and access to microfinance is a function of business growth. This study recommends that the microfinance institutions should educate and train their clientele on basic book keeping among other sound business and financial practices.
Keywords: microfinance, poverty, business growth
Introduction
Microfinance can possibly make a change in reducing the impact of abject poverty and economically saving life by helping to create and grow family enterprises (Bell, 2017). Microfinance commonly refers to the provision of a wide array of services such as micro-savings, micro-loans, money transfers, payment services and micro-insurance to the poor, low-income earners and their micro-enterprises (Kanyurhi & Bugandwa Mungu Akonkwa, 2016). Addae-Korankye (2012), posited that despite the existence of microfinance in some form, the implementation of microfinance as a strategy to deal with the problem of poverty and growing micro businesses deliberately started in the 1990s by the government of Ghana. Based on this, research questions were raised to assess the impact of microfinance programs on the business growth of beneficiaries. The significance of the study will help drive the needed regulation and investment to support the microfinance industry towards business growth. Furthermore the study results will add to the body of knowledge of recent microfinance studies to enhance financial literacy and ensure that microcredit and savings interventions lead to business growth.
Operational Definitions
Access to Microfinance: It is the provision of financial services to low-income poor, self-employed people (Jain & Thakur, 2012). Other definitions suggests microfinance as the

PIM 1st International Conference
June 21, 2018
N 167
delivery of loans, savings and other essential financial services to the deprived (Abdulkadir, Umar, Garba, & Ibrahim, 2012; Farida, Siregar, Nuryartono & Intan, 2015).
Business Growth: The process of increasing, improving the enterprise’s success by boosting revenue or the profit of the business, product sale or service income by minimizing the cost of operation (Fosu, 2015; Ganle, Afriyie & Segbefia, 2015).
Theoretical Orientation Theories of capability approach and poverty reduction approach were the fundamental frameworks that underpinned this study. (Ahmad, 2015; Bell, 2017; Pranjal, 2015; World Bank, 2016). The Concept of Microfinance
The concept of microfinance was born within the 19th century and this was conceptualized by the scholar Lysander Spooner who wrote on the benefits of small credit as a way of reducing poverty (Alnaa, 2013; Pranjal, 2015). Microfinance has been indicated by the United Nations (UN) as a very important strategy for achieving the goal of reducing extreme poverty by half by the year 2015 (Alnaa, 2017; Bell, 2017;Lu, 2012 Turuc, 2013). There is no general standard for the definition of microfinance (Alnaa, 2013). The term micro however means small, it is for this reason that microfinance approaches the poor with the supply of small loans with the aim of reducing poverty and by that, encouraging the entrepreneurial capacity of the beneficiaries to enhance the total progression of the economy (Akpalu, Alnaa & Aglobitse, 2012; Alnaa, 2013; Pranjal, 2015). Ogola (2012) indicated that microfinance has three characteristics that set it apart from the traditional money deposit banks. These include the small amount of loans advanced as well as the amount of savings collected. The second is the absence of asset-based collateral and thirdly the simplicity of procedures of operations (Johnson, Rotimi & Yinusa, 2015).
Microfinance is not the same as microcredit (Alnaa & Ahiakpor, 2015). For microcredit, small amounts of monies are given as loans to the borrower, however for microfinance, apart from loans provided; many other financial services are also provided including savings accounts and insurance. Microfinance therefore has wider concept than microcredit (Annim, 2012; Kannan & Panneerselvam, 2013). Poverty Reduction Approach
The poverty lending approach contends that poverty alleviation could be achieved through microfinance institutions or NGO’s that accept funding from governments and donor agencies hence alleviating poverty at a non-profit basis (Ledgerwood, Earne & Nelson, 2013; Milana & Ashta, 2012). The notion is that the poor should be seen and treated as beneficiaries instead of clients where the provision of subsidized credit is followed by services such as family planning and good nutrition (Kabir, Kim, Lee, Nam & Maeng, 2013). Under this approach, government sponsored and donor credits are disbursed to the poor borrowers usually at interest below market rates. The objective is to reach the very poor

PIM 1st International Conference
June 21, 2018
N 168
with subsidized credit (Ledgerwood, et al., 2013). Hence the delivery of all-inclusive developmental intervention such as
entrepreneurship development to health care, financial literacy, basic book keeping and women empowerment along with the delivery of microcredit as one package has been encouraged by Turuc (2013) and termed as credit-plus. Empirical Evidence
In a survey performed by the European microfinance network (2006) amongst European Union member nation, the result of the review uncovers that microcredit is favorable as far as employment created, increase in incomes, lucrativeness of business is concerned (Rika, Zainalabidin & Jarir, 2015).
Ledgerwood, et al (2013) conducted a study to review the impact of microfinance institutions in Cameroon. He inferred that microfinance was a vital resource for developing countries as it is able to cater for the financial needs of the very poor and micro businesses in society. Microfinance permits poor individuals and microenterprises to grow, shield and expand their income as well as add assets, reducing their defenselessness to income and spending shocks (Sujatha & Malyadri, 2015). Review of Research on the Capability Approach The capability approach is based on a person’s ability, power or will in attaining a specific aim. Capability can be linked to the ability of a person to acquire something or accomplish an objective largely centered on the prevailing opportunities around him or her (Roelen, Gassmann & de Neubourg, 2012). Capabilities are defined as what society is capable of doing or able to be, the opportunity to appreciate numerous lifestyles and for that matter the capacity to live a decent life (Hollywood, Egdell, McQuaid & Michel-Schertges, 2012). This approach supports the assertion that poverty is to be measured in relation to human development which means a focus on the expansion of individual capabilities instead of the maximization of utility or income (Hollywood, et al., 2012). This implies that financial incomes are not a measurement of an end in itself but purely measured as a means to an end. This is because every individual faces variances in converting obtainable resources into appreciated accomplishment. Population and Sampling Strategy
The population of interest comprised of beneficiaries of microfinance products and services from five major microfinance institutions. Hence, the total numbers of the customers of these five institutions that had accessed the savings and credit products will be considered in this study as the sample frame. The MFIs have branches strategically located at business districts, market places and densely populated areas with majority of clients being economically not sufficient considering their average income flow. The target sample size from a population of beneficiaries of the microfinance services was selected using the Yamane (1967) and Bourley (1964, sample size determination methods and

PIM 1st International Conference
June 21, 2018
N 169
sampling technique. This helped guarantee actual coverage and cut down on time spent and cost. Data Collection Procedures
APA’s ethical principles of psychologists and code of conduct (American Psychological Association, 2012) and the three basic principles of respect for beneficence, persons and justice as explained by the Belmont report was used to guide this study (Ation, 2012). Critically a straight forward and brief informed consent that enlightened the participants of the likely concerns of their participation was contained in the study. Data Analysis This chapter presents the analyses of data collected from the 210 respondents using a quantitative approach. It encompasses the results of the study in relation to the theoretical framework and the research questions that were raised. These findings were related to the 210 questionnaires answered by participants. Test of Hypotheses and Research Question In answering the main research question, the hypothesis was tested using the Pearson correlation. The study sought to statistically evaluate whether or not, there is a relationship between business growth and access to microfinance on beneficiaries of microfinance programs in Ghana?
R1: Is there a statistical relationship between business growth and access to microfinance on beneficiaries of microfinance programs in Ghana.
H1o: There is no statistical relationship between business growth and access to microfinance on beneficiaries of microfinance programs in Ghana. H1a: There is a statistical relationship between business growth and access to microfinance on beneficiaries of microfinance programs in Ghana. Conclusions The study indicates that there is a significant positive relationship between business growth and access to microfinance. The correlation coefficient was 0.210; significant at an alpha level of 0.01 (r=0.210, p < 0.01). Therefore, the null hypothesis which claimed that there was no relationship between business growth and access to microfinance; is rejected. The study therefore concludes that there is weak positive relationship between business growth and access to microfinance. The study further concluded that access to microfinance is a function of business growth. The following conclusions were also wrapped up from this research. The study used a quantitative study. A closed ended questionnaire was used to collect data from 210 respondents who were clients of microfinance products and services from five major microfinance institutions. The research instrument used in this study was considered credible and valid. Suggestion Entrepreneurs and micro-businesses should embrace microfinance in order to improve

PIM 1st International Conference
June 21, 2018
N 170
their cash flow and grow their businesses. Operators of microfinance institutions should create awareness for beneficiaries and customers on the right uses of microfinance loans at all times (Hollywood et al., 2012). The result reveal that young people between the ages of 21 and 25 shy away from applying for microfinance loans, hence, young folks with entrepreneurial ability or business mindedness who are below the age of 25 years but above 21 years could be made aware and encouraged to access loans to better their lives and their communities. Also, the study recommends that training by MFIs for clients on basic book keeping, basic accounting etc., should be undertaken twice, before disbursing of loans and one month after the disbursement of loans. The training should be done in the premises of MFIs and records of attendants kept for internal use. This should be encouraged to ensure efficient use of funds and creation of wealth. References
Abdulkadir, F.I., Umar, S., Garba, B.I. & Ibrahim, S.H. (2012). The impact of microfinance banks on women entrepreneurial development in Kaduna metropolis. Microeconomics Macroeconomics, 1(3), 28-38.
Addae-Korankye, A. (2012). Microfinance: a tool for poverty reduction in developing countries. Journal of Business and Retail Management Research, 7(1).
Akpalu, W., Alnaa, S. E., & Aglobitse, P. B. (2012). Access to microfinance and intra household business decision making: Implication for efficiency of female owned enterprises in Ghana. The Journal of Socio-Economics, 41(5), 513-518.
Alnaa, S. E. (2013). Do multiple loans from microfinance institutions help the rural poor women? Empirical evidence from Ghana. Research in Applied Economics, 5(3), 78-95.
Alnaa, S. E., & Ahiakpor, F. (2015). Synthesis of Microfinance and Technical Efficiency: Implications for Poverty Reduction in Ghana. Research in Applied Economics, 7(1), 13-25.
Annim, S. K. (2012). Targeting the Poor versus financial sustainability and external funding: Evidence of microfinance institutions in Ghana. Journal of Developmental Entrepreneurship, 17(03), 1250016.
Ation, A. A. P. A. A. (2012). APA style guide to electronic references. American Psychological Association.
Bell, A. C. (2017). Investigative Challenges of Fraud in Microfinance Institutions (Doctoral dissertation, Utica College).
Farida, F., Siregar, H., Nuryartono, N., & Intan, E. K. (2015). Micro Enterprises' Access to People Business Credit Program in Indonesia: Credit Rationed or Non-Credit Rationed? International Journal of Economic Perspectives, 9(2), 57.
Fosu, A. K. (2015). Growth, inequality and poverty in Sub-Saharan Africa: recent progress in a global context. Oxford Development Studies, 43(1), 44-59.

PIM 1st International Conference
June 21, 2018
N 171
Ganle, J. K., Afriyie, K., & Segbefia, A. Y. (2015). Microcredit: Empowerment and disempowerment of rural women in Ghana. World Development, 66, 335-345.
Hollywood, E., Egdell, V., McQuaid, R., & Michel-Schertges, D. (2012). Methodological issues in operationalising the capability approach in empirical research: An example of cross-country research on youth unemployment in the EU. Social Work & Society, 10(1).
Kabir, H. E., Kim, E. M., Lee, H. Y., Nam, B., & Maeng, J. H. (2013). Human development report 2013 (Doctoral dissertation, Ewha Womans University).
Kahnyuy, R. L. (2016). The contribution of the Catholic Church to the development of Cameroon, and why they are engaged in development works (Master's thesis).
Ledgerwood, J., Earne, J., & Nelson, C. (Eds.). (2013). The new microfinance handbook: A financial market system perspective. World Bank Publications.
Lu, C. (2012). Who is poor? One Question, Many Answers and Their Implications: A Comparison of Alternatives to the Monetary Approach of Poverty Assessment in Rural Yunnan, China. China. Q-Squared Working Paper, (54).
Milana, C., & Ashta, A. (2012). Developing microfinance: A survey of the literature. Strategic Change, 21(7‐ 8), 299-330.
Ogola, F. O. (2012). Financial institutions' social responsibility in developing countries: A framework of analysis. African Journal of Economic and Management Studies, 3(1), 116-136.
Roelen, K., Gassmann, F., & de Neubourg, C. (2012). False positives or hidden dimensions: what can monetary and multidimensional measurement tell us about child poverty in Vietnam? International Journal of Social Welfare, 21(4), 393-407.
Turuc, C. (2013). Re-thinking sustainability indicators: local perspectives of urban sustainability. Journal of Environmental Planning and Management, 56(5), 695-719.
World Bank (2016). Poverty and Inequality Analysis. http://web.worldbank.org/wbsite/external/topics/extpoverty/0, contentmdk: 22569747~pagePK: 148956~piPK: 216618~theSitePK: 336992, 00.html [Accessed online July 4, 2016].

PIM 1st International Conference
June, 2018
N 172
USING THE HEDONIC PRICE THEORY TO INVESTIGATE THE ROOM PRICING DETERMINANTS ON TAIPEI AIRBNB PLATFORM IN METROPOLITAN AREA
Kai-Chi Hsu1, Chin-Yi Fang2
1 Graduate Institute of Sport, Leisure and Hospitality Management,
Master of National Taiwan Normal University 2 Graduate Institute of Sport, Leisure and Hospitality Management,
Professor of National Taiwan Normal University *Corresponding author, E-mail: [email protected]
ABSTRACT
With the in flourishing of the sharing economy, the online renting platform Airbnb has started a global trend. Short-term rentals in Taiwan are also gradually increasing, so the price of Airbnb listings has become very important. Many studies have applied the hedonic pricing theory to the hotel industry, but seldom addressed the Asian residential market. The purpose of this study is to investigate the impact of a variety of characteristics including location, communication, accuracy, occupancy, cleanliness, room type, the number of ratings on the room price of Airbnb. This research well-known the factors for which travelers choose Airbnb by applying hedonic price method and literature review. Data was collected 11,619 room listings from March 1st, 2017 to March 1st, 2018 in Taipei, Taiwan. The descriptive statistics and regression analysis are used in this paper. The empirical results indicated that the star-rating had significantly positive effects on the room price. This result could be provided to the accommodation hosts on Airbnb in order to understand the customers' needs and as future benchmarking price. This hedonic prices model of Airbnb in Taiwan could also be the reference model for ASEAN .Metropolitan and future research are also discuss.
Keywords: Airbnb, Hedonic Price Theory, Regression model, Taipei, Taiwan Introduction
With the in flourishing of the sharing economy, the online renting platform Airbnb has started a global trend. Short-term rentals in Taiwan are also gradually increasing (Airbnb, 2015), so the room price of Airbnb listings has become very important. Many studies have applied the hedonic pricing theory to the hotel industry, but seldom addressed the Asian residential market. In addition, the sharing economy is booming. Airbnb is threatening the hotel industry. As more backpackers are searching for accommodation through the Airbnb platform. They also entered Taiwan in 2013 (Airbnb, 2017), Un like traditional hotels, Airbnb now offers unique room listings such as tree houses, castles, and private islands (Airbnb, 2017). Due to the ease of the Internet, it

PIM 1st International Conference
June, 2018
N 173
has become the ideal platform for many people to travel and stay. In the past, de Oliveira Santos (2016) used the hedonic price method to explore tenants' evaluation of the subjective features of hostel to explain prices, but Airbnb's prices influence factor was limited to western countries. This study is the first to explore the impact of Taiwan cities on Airbnb prices. As the same time, use the hedonic price theory to help the hosts find out the factors that affect the price of online housing prices. Literature Review
This study explored the impact of a variety of characteristics on the rates published for Airbnb listings in six metropolitan areas in Taiwan. Since beginning in 2008, Airbnb has grown to become one of the major single tourism accommodation supply platforms in the world, with 2 million listings and 6 million guests (Airbnb, 2017). Airbnb provide hosts with information on available rooms and accommodations to earn extra income; they also provide guest with a satisfying accommodation trip (Fang, Ye, & Law, 2016).Santos (2016) was the first to use hedonic price theory to analyze the characteristics of the price of hostels. The study found that the prices of hostels determined by customer evaluation of the characteristics including atmosphere, cleanliness, facilities, location, staff and safety. As a result, it was found that the most important factor affecting prices was cleanliness, location, and facilities. Rosen (1974) developed a common theory of hedonic prices that links consumer penchants for product features and market prices. He believes that the market price is a combination of consumer preferences and the willingness to pay for the product. When consumers purchase a product, they will be based on the quantity and characteristics of the product and get the most effective combination of features within a reasonable budget. The Hedonic pricing theory assumes that all products can be broken down into a number of different features and that each product feature has a corresponding market (de la Peña, Núñez-Serrano, Turrión & Velázquez, 2016). Recently, the hedonic price theory has also been applied to all walks of life. In the hotel-catering industry, foreign scholars first analyzed the relationship between hotel characteristics and house prices using the characteristic price theory (Espinet et al., 2003; White & Mulligan, 2002; Monty & Skidmore, 2003).
Methods
Data about room listings, prices and ratings of Airbnb were collected from the Airbnb platform. To conduct this research, we used python programming language to get data about room listings, prices and ratings in metropolitan areas on Airbnb platform. In total, 11,619 room listings located in Taiwan‘s metropolitan was collected for March 1st, 2017 to March 1st, 2018.
This research used the multiple regression model to explore the impact of a variety of independent variables ratings on the prices published for Airbnb room listings in six metropolitan areas in Taiwan. The general hedonic prices model takes on the following form:

PIM 1st International Conference
June, 2018
N 174
1 1 2 2
1 1k ki
K N
i n ni i
k n
P b x c D D
Where iP is the price, kix is the star ratings for accuracy, communication, cleanliness,
location, check-in and number of ratings a hedonic prices, k is the coefficient to be estimated
for the factor(K=7) in the regression, (D1,D2) is a dummy variable indicating that the price refers to accommodation in (0,1) private rooms, (1,0)is about share rooms, (1,1) is about entire rooms, λ
individual coefficients of control variables(N=3), i is a random error term.
Results and Discussion Results The Descriptive statistics for each of the variables are presented in Table1 ,the average
number of star ratings for entire room is 4.735,the average number of accuracy ratings for entire rooms is 4.811, the average number of communication ratings for entire rooms is 4.887, the average number of cleanliness ratings for entire rooms is 4.715, the average number of location ratings for entire rooms is 4.740, the average number of check-in ratings for entire rooms is 4.878, the average number of review ratings for entire rooms is 45.829. Table1. The Descriptive statistic
The results in Table 2 showed that star ratings, the check-in and accuracy ratings had significantly positive influence on room price of entire. The star ratings, cleanliness, location and check-in had significantly positive influence on room price of private.The star ratings and accuracy had significantly influence on room price of share.
Entire (N=2874)
Private (N=4239)
share (N=2874)
Variable Mean S.D Min Mean S.D. Min Mean S.D. Min Star 4.735 0.324 2 4.713 0.347 2 4.707 0.328 2 Accuracy 4.811 0.313 2 4.779 0.340 2 4.773 0.306 2
Communication 4.887 0.267 2 4.864 0.297 2 4.842 0.284 2 Cleanliness 4.715 0.357 2 2 4.72
6 0.368 2 4.733 0.331 2
Location 4.740 0.331 2 4.702
0.353 2 4.734 0.342 2
Check-in 4.878 0.270 2 4.84
8
0.302 2 4.817 0.298 2
Review 45.829 48.555 3 34.681 48.185 3 26.150 31.884 3

PIM 1st International Conference
June, 2018
N 175
Table 2. Estimated results from the hedonic price model
Note:*p<.05, **p<.01, ***p<.001
Theoretical implications This study found that hedonic price theory needs to be revised for different room type.
Future research can using this result for consequent study Managerial implications
Priorstudies found that high star ratings are associate with higher prices, although given the preponderance of high ratings it is unclear just how significant a competitive advantage hosts receive from high ratings (Gibbs et al., 2018). Hosts needs to particular attention to room listings accuracy, communication, cleanliness, and online review.If hosts could improve online reviews before arrived,it will help increase room prices. Conclusions and future research
This result could be provided to the accommodation hosts on Airbnb in order to understand the customers' needs and as future benchmarking price. This hedonic prices model of Airbnb in Taiwan could also be the reference model for ASEAN.
The research has several limitations. To begin with, we only focusing on Taiwan’s cities cannot represent other country. Further, the research only considered one price point in time and therefore was not able to capture seasonal differences in the certain attributes or periodic changes in guest markets taken into account by hosts.
The future research could be extended to other countries (e.g. Association of Southeast Asian Nations, ASEAN), let more hosts in different countries how to list price.
References Airbnb, (2015). retrieved: https://www.slideshare.net/vtaiwan/airbnb-1001 Airbnb, (2017). retrieved: http://www.airbnb.com/ about/about-us de Oliveira Santos, G. E. (2016). Worldwide hedonic prices of subjective characteristics of
Entire (N=2874)
Private (N=4239)
share (N=2874)
Ln Coef. S.E. Coef. S.E. Coef. S.E. Star 0.372** 0.050 0.031*** 0.033 0.133*** 0.063 Accuracy 0.115*** 0.058 -0.070*** 0.040 0.000*** 0.070
Communication -0.084*** 0.069 -0.154 0.045 -0.029*** 0.077 Cleanliness -0.078*** 0.047 0.228*** 0.033 -0.168*** 0.063 Location -0.180*** 0.037 0.082*** 0.027 -0.076*** 0.049 Check-in 0.020** 0.070 0.012*** 0.000 -0.135 0.080 Review -0.005*** 0.000 -0.009*** 0.142 -0.009*** 0.000
PIM 1st International Conference
June, 2018
N 176
hostels. Tourism Management, 52, 451-454. de la Peña, M. R., Núñez-Serrano, J. A., Turrión, J., & Velázquez, F. J. (2016). Are innovations
relevant for consumers in the hospitality industry? A hedonic approach for Cuban hotels. Tourism Management, 55, 184-196.
Gibbs, C., Guttentag, D., Gretzel, U., Morton, J., & Goodwill, A. (2018). Pricing in the sharing economy: a hedonic pricing model applied to Airbnb listings. Journal of Travel & Tourism Marketing, 35(1), 46-56.
Espinet, J. M., Saez, M., Coenders, G., &Fluiva, M. (2003). Effect on prices of the attributes of holiday hotels: A hedonic price approach. Tourism Economics, 9, 165-177.
Fang, B., Ye, Q., & Law, R. (2016). Effect of sharing economy on tourism industry employment. Annals of Tourism Research, 57, 264-267.
Rosen, S. (1974). Hedonic prices and implicit markets: product differentiation in pure competition. Journal of Political Economy, 82 (1), 34-55
Monty, B., & Skidmore, M. (2003). Hedonic pricing and willingness to pay for bed and breakfast amenities in Southeast Wisconsin. Journal of Travel Research, 42 (2), 195-199.
White, P. J., & Mulligan, G. F. (2002). Hedonic estimates of lodging rates in the four corners region. The Professional Geographer, 54 (4), 533-543.

PIM 1st International Conference
June 21, 2018
N 177
UNDERSTANDING CONSUMER ADOPTION OF CARD PAYMENT SERVICE THROUGH THE APPROACH OF TRAM MODEL: EMPIRICAL STUDY IN YANGON, MYANMAR
Nay Chi Oo1, Pithoon Thanabordeekij2
1,2International Program, Panyapiwat Institute of Management *Corresponding author, E-mail: [email protected]
ABSTRACT
The objective of this study is to explore customer intention of reusing card payment system at the supermarket. Base on the theoretical framework of the technology readiness acceptance model, eight factors of technology readiness index such as “optimism, innovativeness, discomfort, insecurity” and perception of usefulness and ease of use, usage intention were examined. The questionnaire was quantified by using regression analysis to determine the outcome. Survey data was collected from 401 users from five supermarkets in Yangon, Myanmar, namely; Ocean supermarket, Junction 8 supermarket, Market palace supermarket, Myanigone supermarket and Hledan center supermarket. Results of the study suggested that perceived usefulness is most influenced by the “perceived ease of use” dimension. The results also suggested that customer satisfaction is positively related to usage intention.
Keyword: Technology readiness, technology acceptance, debit card, ATM card, satisfaction, Usage intention
Introduction
In recent years, card payment services have become a popular choice for purchasing goods and services. Most businesses and supermarkets accept Myanmar Payment Union (MPU) cards as an alternative to promoting a "cashless society." Myanmar's banking sector is developing advanced information technologies that enable banks and financial institutions to focus on a card service. According to the 2016 banking and financial data, the bank issued 1.8 million MPU card as cited in Frontier Myanmar (2016). According to data from the Myanmar Payments Union, there are already issued one million debit cards by umbrella organizations of 21 domestic banks. Nevertheless, from the Asian carrier billing data in 2016, the usage rate of card payment is still very low, because of 2% debit card penetration rate and 0% credit card penetration rate. There are many limitations and issues in the technical problem in the use of card payment services. For examples, break down internet

PIM 1st International Conference
June 21, 2018
N 178
connection, POS machines error and cash transaction deduct two times for the bills. Banks and retailers are trying to promote card payment service (debit/ credit) because traditionally people still tend to pay in cash. To achieve this goal, the purpose of this study is to explore the customers’ intention to use card payment services based on the concept of TRAM (Technology Readiness Acceptance Model). Literature Review Technology Acceptance Model (TAM) Davis (1989) postulated that Technology Acceptance Model (TAM) is a conceptual model of information systems theory. TAM describes as a new technology that explains and predicts users' intention to use and technological innovations, especially in organizations. There are two key components of Technology acceptance model (TAM) as perceived usefulness (PU) and perceived ease of use (PEOU). Perceived ease of use refers to "the user thinks it is free to use the technology" (Davis, 1989). Perceived usefulness definition "User perception and performance will increase if using this technology" (Davis, 1989). Technology Readiness Index (TRI) TR defines that “people tend to accept and use new technologies to achieve their goals in home life and work" (Parasuraman, 2000, p 308). Parasuraman(2000) suggests technology readiness (TR), that includes four user groups based on personality dimensions, namely "optimist, innovation, discomfort, insecurity" as follows: Optimists as “a positive view about technology”, Innovativeness as “innovate to be a technology pioneer and though leader”, Discomfort as “a feeling of being overwhelmed by the technology”, Insecurity as “disbelief of the technology”. In general, optimism and innovativeness are positive incentives accepted by new technologies, while discomfort and insecurity prevent the new technology from being accepted. Technology Readiness Acceptance Model (TRAM) Technology Readiness and Acceptance Model (TRAM) is an augmented model with TAM and TR (Parasurman, 2000). The TAM and TR models are combined and the first attempt is to integrate both tests, and the technology readiness is used as the TAM prediction (Lin et al., 2007). However, in the newest research structure by Walczuch et al., (2007), the technology readiness is directly related to the dimensions of TAM (Perceived Usefulness and Perceived Ease of Use). TRAM can help explain how personality dimensions affect how people interact with experiences and acquire new technologies and Technology

PIM 1st International Conference
June 21, 2018
N 179
readiness acceptance model (TRAM) dimensions have also been developed (Walczuch et al., 2007; Gadoe et al., 2012; Larasati N et al., 2017). Research Model and Related Hypotheses
In this study, the theoretical framework for acceptance and intent of card payment service users is based on "TRAM." The conceptual framework for this study is as follows:
Figure 1: adopted from (Lin et al., 2007; Walczuch et al., 2007; Larasati N et al., 2017)
Research Objective
The main purpose of this study was to explore customer usage intention of using card payment system. The relationship between the eight dimensions of the TRAM model (Technology acceptance model) and to include trust and satisfaction of additional ideas for the intended use. Hypothesis development Perceived Usefulness and TRI (Technology Readiness index) It was found in previous studies Davis et.al (2000) that the TRI (Technology Readiness Index) had a positive effect on the perception of usefulness. Gode & Johanse (2012) studied the relationship between the four factors of the technical readiness index and the specific dimensions of TAM as perceived usefulness. Shin & Lee (2014) confirmed that TRI has a significant impact on the perceived usefulness of NFC mobile payments. Larasati .N et.al (2017) revealed that the technical readiness index (TRI) affects perceived usefulness as a perceived usefulness of technology. Thus, the following hypotheses were proposed:
H1a: Optimism is positively related to Perceived usefulness. H1b: Innovativeness is positively related to Perceived usefulness.
TRAM

PIM 1st International Conference
June 21, 2018
N 180
H1c: Discomfort is negatively related to perceived usefulness. H1d: Insecurity is positively related to perceived usefulness.
Perceived ease of use and TR (Technology Readiness)
Previous studies confirmed that the Technology Readiness Index (TRI) influenced perceived ease of use. Guhr et.al (2013) found that TR is positively correlated with all TAM construct (i.e. perceived ease of use) in m-payments. Lubis & Mirzanti (2016) found that four constructs of technology readiness significantly affected perceived ease of use in the smart city project. Larasati et al. (2017) explored the effect of different structures for technology readiness that have differently perceived ease of use. Thus, the following hypotheses were proposed:
H2a: Optimism is positively related to perceived ease of use.
H2b: Innovativeness is positively related to perceived ease of use.
H2c: Discomfort is negatively related to perceived ease of use.
H2d: Insecurity is positively related to perceived ease of use.
Effect of Perceived Trust and Perceived ease of use and usefulness
Shin & Lee (2014) argued that perceived trust has a positive influence on user perception of ease of use in NFC mobile payments. Similar results were also supported by previous studies such as the mobile reminder system Abu-Dalbouh et al. (2017). Kaouther (2016) revealed that perceived trust has a direct impact on perceived usefulness and perceptual ease of use in online banking. In addition, Shin & Lee (2014) argued that perceived trust has a significant impact on perceived ease of use in NFC mobile payments. Thus, the following hypotheses were proposed:
H3: Perceived trust is positively related to perceived usefulness.
H4: Perceived trust is positively related to perceived ease of use.
Perceived Ease of use and Usefulness perception
In the past decade, many studies have suggested that PEOU and PU are important factors in TAM model (Kou et al., 2013; Alsamydi, 2014; Amin et al., 2014). Bousnina & Ettis (2016) found that PEOU has a positive impact on PU in the credit cards payment process. Consistent with the TAM view, Eyuboglu & Sevim (2017) suggested that PEOU has a direct impact on PU in contactless cards. Thus, the following hypotheses were proposed: H5: Perceived ease of use is positively related to perceived usefulness.
Effect of Perceived Ease of use (PU) & Perceived Usefulness (PEOU) and Satisfaction
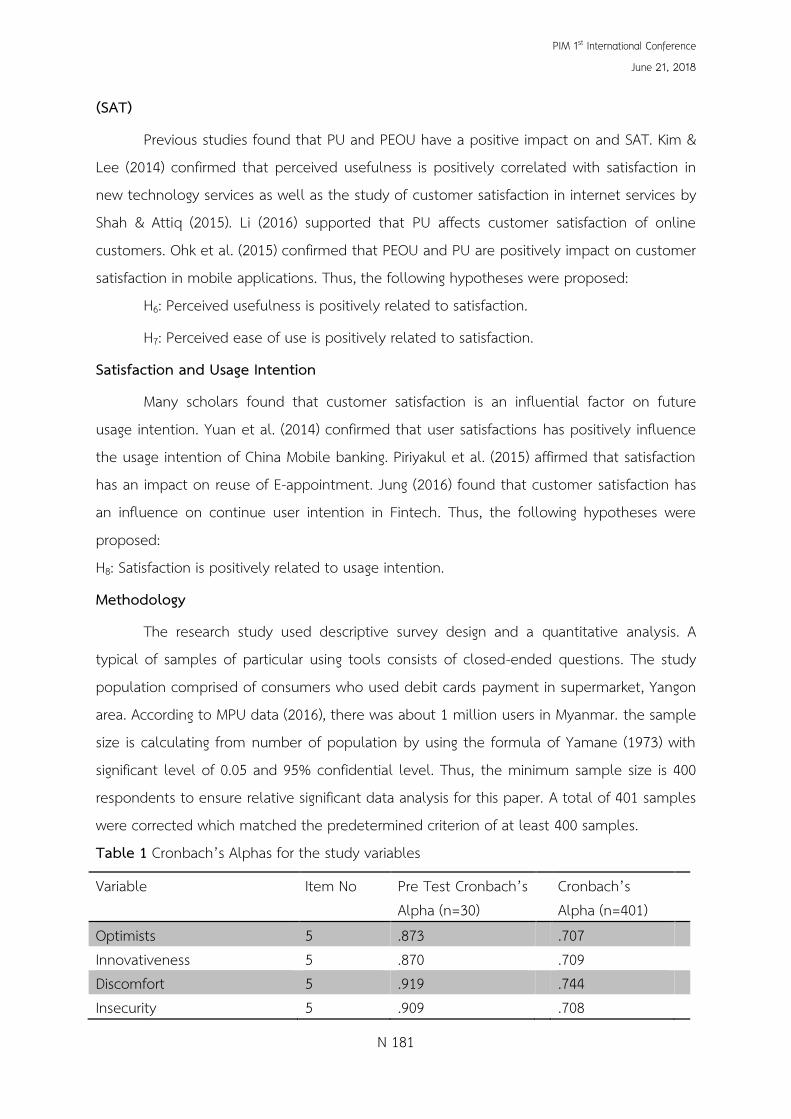
PIM 1st International Conference
June 21, 2018
N 181
(SAT)
Previous studies found that PU and PEOU have a positive impact on and SAT. Kim & Lee (2014) confirmed that perceived usefulness is positively correlated with satisfaction in new technology services as well as the study of customer satisfaction in internet services by Shah & Attiq (2015). Li (2016) supported that PU affects customer satisfaction of online customers. Ohk et al. (2015) confirmed that PEOU and PU are positively impact on customer satisfaction in mobile applications. Thus, the following hypotheses were proposed:
H6: Perceived usefulness is positively related to satisfaction.
H7: Perceived ease of use is positively related to satisfaction.
Satisfaction and Usage Intention
Many scholars found that customer satisfaction is an influential factor on future usage intention. Yuan et al. (2014) confirmed that user satisfactions has positively influence the usage intention of China Mobile banking. Piriyakul et al. (2015) affirmed that satisfaction has an impact on reuse of E-appointment. Jung (2016) found that customer satisfaction has an influence on continue user intention in Fintech. Thus, the following hypotheses were proposed: H8: Satisfaction is positively related to usage intention.
Methodology
The research study used descriptive survey design and a quantitative analysis. A typical of samples of particular using tools consists of closed-ended questions. The study population comprised of consumers who used debit cards payment in supermarket, Yangon area. According to MPU data (2016), there was about 1 million users in Myanmar. the sample size is calculating from number of population by using the formula of Yamane (1973) with significant level of 0.05 and 95% confidential level. Thus, the minimum sample size is 400 respondents to ensure relative significant data analysis for this paper. A total of 401 samples were corrected which matched the predetermined criterion of at least 400 samples. Table 1 Cronbach’s Alphas for the study variables
Variable Item No Pre Test Cronbach’s Alpha (n=30)
Cronbach’s Alpha (n=401)
Optimists 5 .873 .707 Innovativeness 5 .870 .709 Discomfort 5 .919 .744 Insecurity 5 .909 .708

PIM 1st International Conference
June 21, 2018
N 182
Perceive Trust 5 .875 .834 Perceive Usefulness 5 .869 .879 Perceive ease of use 5 .874 .872 Satisfaction 5 .875 .830 Usage intention 5 .878 .785 Source: Author’s calculation
Table 1 showed that the Cronbach’s Alpha coefficients ranged from 0.707 and 0.919 that described the good internal consistency of reliability (Cronbach, 1951). Cronbach’s alpha value must be above 0.7 that proves the questionnaires consistency. Therefore, all constructs of this research are accepted. Results of the study
The demographic information of respondents is divided into sex, age, occupation, education level and monthly income level. Sample demographics show that 50% of respondents are female and 49% are male. The age of participants analyzed showed that the main respondents were between the ages of 26 and 35, accounting for about 51% of the sample. The highest percentage of household income is kyat (Ks) 101,000-301,000 per month/ or about 38%. Since then, an analysis of educational data shows that about 79% are bachelor's degrees and 84% work in private organizations. As a result, 76% of people use AYA bankcards, while 68% use debit cards (ATMs) to buy goods and services. Relationship of relevant variables and the research hypothesis
Table 2 shows that the results of optimism, innovation and perceived trust have a positive impact on PU and PEOU. Discomfort has a negative impact on the usefulness and ease of perception. Among all variables, PEOU has the strongest influence on perceived ease of use (β=.700), followed by SAT (β =.582) and PT (β =.497). As for the perceived ease of use, optimism (β= .129), Innovativeness (β=.152), and Perceived trust (β=.532).And also Perceived ease of use (β=.700). As for the satisfaction, perceived usefulness (β=.386), and perceived ease of use (β=.392).As for the usage intention, satisfaction (β=.582) respectively. On the other hands, discomfort and insecurity had no impact on both perceived usefulness and ease of use.
Table 2 summary of testing Hypothesis Hypothesis Specification t-value P-value β result Results
H1a Opt
PU 6.295 0.000 .246 ** Accepted
H1b INN
PU 4.474 0.000 .173 ** Accepted
H1c DIS
PU -1.402 0.16 -0.051 Rejected

PIM 1st International Conference
June 21, 2018
N 183
H1d INS
PU 1.544 0.12 .057 Rejected
H2a Opt
PEOU 2.957 0.003 .129** Accepted
H2b INN
PEOU 3.505 0.003 .152** Accepted
H2c DIS
PEOU -0.077 0939 -0.003 Rejected
H2d INS
PEOU 0.998 0.319 .041 Rejected
H3 PT
PU 11.873 0.000 .497** Accepted
H4 PT
PEOU 11.355 0.000 .532** Accepted
H5 PEOU
PU 19.577 0.000 .700** Accepted
H6 PU
SAT 7.900 0.000 .386** Accepted
H7 PEOU
SAT 8.012 0.000 .392** Accepted
H8 SAT UI 14.283 0.000 .582** Accepted
Note: cut-off t-value is 1.96 (* p < 0.05, ** p < 0.001)
Source: Author’s calculation
Discussion
According to the results, the consumer perception was very important factor. Users perceived that technology was very useful and easy to use for their daily life. In addition, the consumer satisfaction affected the intention to use the MPU card. The study confirmed that users are intended to use the card payment services because it is useful, easy to use, and innovative. According to the variables reviews, the optimism and innovativeness were positively effect on Perceived usefulness and ease of use which aligned with Guhr et.al, 2013; shin & lee, 2014; Basgoze, 2015; Larasati N et.al, 2017. Furthermore, card user’s perceived trust shown the positive impact on the perceived usefulness and ease of use which similar to previous researchers (Gefen et.al, 2003; Wan et.al; 2011; Nguye et.al, 2016). As this regard, the perceived usefulness and ease of use were also significantly influenced consumer satisfaction as supported by the previous studies of; Kim & Lee, 2014; Shah & Attiq, 2015; Ohk et al, 2015; Li Y., 2016). Last but not least, the consumer satisfaction indicated a positively influence on card usage intention as aligned with Chen et al, 2014; Han & Wang, 2015; Piriyakul et al, 2015.
Conclusion
The purpose of this study is to identify the factors which influence users’ intentions for the readiness to adopt card payment system. This study analyzed by TAM factors, Technology readiness index factors, and additional factors such as perceived trust and satisfaction. The result indicated that perceived ease of use has the most significant impact on user-perceived usefulness factors. It should be emphasized that user-perceived ease of use is very important for using card payment services. In addition, perceived trust is effect of

PIM 1st International Conference
June 21, 2018
N 184
perceived ease of use that indicated the user believes that technology solutions are safe and secure, familiar and confident with the technology to build trust and make its payment service easy to use. Furthermore, the key components of TAM factors, perceived usefulness and ease of use the significant effect on user satisfaction that results show that consumer satisfaction reflects the perception of technology how usefulness and easy to use. Moreover, customer satisfaction is the most important predictor of intention to use, the consumer confidence and reusability of card payment services.
Recommendation
In this work, to enhance the use of card payment systems, governments, banks, and businesses should place greater emphasis on supporting users' trust, security, convenience, mobility, and disability. Therefore, to increase users' acceptance, governments, banks, and business should be able to identify the preferences, intentions, and purposes of a wide range of users for adopting card payment service systems. According to the research, users are willing to use a card payment system if users can complete tasks faster and give them more job control. In addition, if a user's day-to-day work is easier to complete and provides more convenience and security, the user sees card payment as a useful system. The results of the Myanmar sample make sense for businesses and government in the Myanmar market with the aim of promoting payment for card system technology (i.e debit card / ATM). The findings of this study are of crucial importance to researchers and governments, banks, retailers and customers in today's cashless society and dynamic environment.
Limitations and Perspectives for further research
The results and their impact come from five supermarkets; therefore, the results may not be generalizable to other businesses. Future studies can address the limitations by conducting similar studies in many other areas to assess the degree to which current findings are expressed in other environments. Therefore, research should include consideration of other factors such as social impact, perceived liquidity, consumer attitudes, and other factors to improve the predictive power of the card payment system service environment.
References: Abu-Dalbouh.H.M, M. ..-B.-M. (2017). “Applied the Technology Acceptance Model in
Designing a Questionnaire for Mobile Reminder System”. Computer and Information Science , Vol. 10 ( No. 2).

PIM 1st International Conference
June 21, 2018
N 185
Alsamydi.M. (2014). Adaptation of the technology Acceptance Model(TAM)to the use of Mobile banking service. International Review of Management and business research , 3 (No.4).
Amin.M, S. R. (2014). "User satisfaction with mobile websites: the impact of perceived usefulness (PU), perceived ease of use (PEOU) and trust". Nankai Business Review International , Vol. 5 (No.3), pp. 258 - 274.
BAŞGÖZE Pınar, (. (2015). Integration of Technology readiness(TR) into the Technology Acceptance Model(TAM) For M-Shooping. International Journal of Scientific Research and Innovative Technology , Vol.2 (No.3), pp.26-35.
Bousnina .Z, E. (. (2016). “ Credit card use for payment purpose: An Exploration of influence factors among Tunisian”. Proceedings of the Marketing Spring Colloquy (URAM) , vol.5, pp.120-136.
Chen.S.C, J. L. (2014). “Assessing the Relationship between Technology Readiness and Continuance Intention in an E-Appointment System:Relationship Quality as a Mediator”. Springer Science+Business Media .
Cronbach, L. J. Coefficient alpha and the internal structure of tests. Psychometrika. . Psychometrika, 16(3), 297-334.doi:10.1007/BF02310555 , Vol.16 (No.3), pp. 297-334.
Davis, F. D. (1989). “Perceived Usefulness, Perceived Ease of Use, and User Acceptance of Information Technology”. MIS Quarterly , Vol.13, pp. 319-340.
Eyuboglu.K & Sevim.U, (. (2017). “ Determinants of contactless credit cards acceptance in Turkey”. Int. Journal of Management Economics and Business , Vol. 13 (No. 2).
Frontier Mynmar (2015). As banks grow, cash is still king in Myanmar. Retrived May 2018, from https://frontiermyanmar.net/en/as-banks-grow-cash-is-still-king-in-myanmar Godoe P. and Johansen, T. (2012). “Understanding Adoption of New Technologies:
Technology Readiness and Technology Acceptance as an Integrated Concept”. Journal of European Psychology Students , Vol.3, pp.38-52.
Guhr, N. T. (2013). “Technology readiness in customers’ perception and acceptance of mobile-payment : An empirical study in Finland, Germany, the USA and Japan". in Proc. Int. Conf. Wirtschaftsinformatik, (pp. pp.119-133).
Han, Y. J. (2015). “Modeling and Empirical Study of Users’ Continuance ntention Toward Location Based Service”. International Business and Management , Vol.11 ( No.2), pp. 8-15.
Myanmar Times (2015). Myanmar card payments on the rise as MPU widens network. Retrieved May 2018, from https://www.mmtimes.com/business/17725-myanmar-card-payments-on-the-rise-as-mpu-widens-network.html
Jung, L. (2016). “The relationship between attitude and satisfaction for improving Continue user intention in Fintech”. International Journal of IT-based Business Strategy Management , Vol.2 (No.1), pp. 33-38 .
PIM 1st International Conference
June 21, 2018
N 186
Kaouther Ben Mansour, (. (2016). "An analysis of business' acceptance of internet banking: an integration of e-trust to the TAM". Journal of Business & Industrial Marketing , Vol.3 (No.8), pp.982-994.
Kim, Y. &. (2016). Quality, perceived usefulness, user satisfaction and intention to use: an empirical study of ubiquitous personal robot service. Asian Social Science , Vol.10 (No.11), pp.1-16.
Kuo . K, L. .. (2013). “An investigation of the effect of nurses’ technology readiness on the acceptance of mobile electronic medical record systems” . BMC Medical Informatics and Decision Making .
Larasati Niken, L. W. (2017). " Technology Readiness and Technology Acceptance Model in New Technology Implementation Process in Low Technology SMEs”. International Journal of Innovation, Management and Technology , Vol. 8 (No. 2).
Li, Y. (. (2016). "Empirical Study of Influential Factors of Online Customers’ Repurchase Intention". iBusiness , Vol.8, pp.48-60.
Lin, C.-H. S.-Y. (2007). "Integrating Technology Readiness into Technology Acceptance: The TRAM model". Psychology & Marketing , Vol.24 (No.7), pp. 641-657.
Mirzanti.L.R(2016), L. .. (2016). "The effects of Technology readiness and technology acceptance toward Citzen’ participant in Bandung smart city project". Journal of business and management , Vol.5, (No.2), pp. 277-282.
Nguyen.N, C. D. (2016). Predicting Consumer Intention to Use Mobile Payment Services: Empirical Evidence from Vietnam. International Journal of Marketing Studies , Vol. 8 ( No. 1).
Ohk, K. ,. (2015). " The Influence of Perceived Usefulness, Perceived Ease of Use, Interactivity, and Ease of Navigation on Satisfaction in Mobile Application". Advanced Science and Technology Letters , Vol.84 , pp.88-92.
Parasuraman, A. (. (2000). " Technology-Readiness Index (TRI) A Multiple-Item Scale to Measure Readiness to Embrace New Technologies". Journal of Service Research , Vol.2 (No.4), pp. 307-320.
Piriyakul.M, P. O. (2015). “Effects of Trust, Satisfaction and Factors Corresponding to TAM on Intention to Reuse Internet Business Transaction”. International review of Management and Business research , Vol.4 (No.3).
Shah.H.J & Attiq.S, (. “Impact of technology quality, perceived ease of use and perceived usefulness in the formation of consumer’s satisfaction in the context of E-learning". Abasyn Journal of Social Science , Vol.9 (No.1), pp.124-140.
Shin Seungjae & Won-Jun, L. ,. (2014). “ The effects of technology readiness and technology acceptance on NFC mobile payment service in Korea”. The Journal of Applied Business Research , Vol. 30 ( No.6 ).

PIM 1st International Conference
June 21, 2018
N 187
Shunbo Yuan, Y. L. (2016). “An investigation of users’ continuance intention towards mobile banking in china”. Information Development , Vol. 32 (No.1), pp. 20–34.
Venkatesh, V. a. (2000). "A Theoretical Extension of the Technology Acceptance Model: Four Longitudinal Field Studies". " Management Science , Vol.46 (No.2), pp. 186.
Walczuch, R. L. (2007). “The effect of service employees’ technology readiness on technology acceptance”. Information & Management , Vol. 44, pp.206-215.
Yuan.S, L. Y. (2016). " An investigation of users’ continuance intention towards mobile banking in China". Information Development , Vol. 32 (No.1), pp.20–34.
Copyright © 2022 FDOKUMEN