Tactical Implementation Of Strategic Guidance During The ...
Upload
khangminh22Category
view
0download
0
RELATIONSHIP BETWEEN TACTICAL ATHLETE BODY MORPHOLOGY
COMPOSITION AND LOADED CIRCUIT PERFORMANCE
By
CHRISTOPHER KOCSIS
Thesis submitted to the University of Ottawa
in partial Fulfillment of the requirements for the
masters of science degree
Department of Health Sciences
Faculty of Human Kinetics
University of Ottawa
© Christopher Kocsis, Ottawa, Canada, 2021

ii
ABSTRACT
This thesis examines the relationship between characteristics of body morphology,
composition, and tactical athlete loaded circuit time to identify Key Performance Indicators
(KPI) for physical fitness development. Thirty-six healthy adults (17 male CAF members, 12
CAF females, and 7 civilian females) performed Dual Energy X-Ray Absorptiometry (DEXA)
scans, and were analyzed for total mass, fat mass, lean body mass, height, length of the humerus,
length of the femur, lean mass arm and lean mass leg. Participants then performed a loaded
circuit simulating job demands, and total time to completion was recorded. Correlation
coefficients for body morphology and composition characteristics were used to measure the
relationship with circuit time, and backwards stepwise multiple linear regression analyses were
used to determine predictive factors. Overall, we found high variability in body morphology and
composition, and that males outperform females on the loaded circuit. In addition, lean body
mass showed the strongest relationship with performance time and of the variables measured, fat
mass, lean mass arm and lean mass leg were the only variables included as predictors of circuit
time from the results of the regression analyses. Therefore, we concluded that developing muscle
mass, especially in the arms for females and in the legs for males is key to improving tactical
athlete loaded circuit performance.

iii
RESUME
Cette thèse examine la relation entre les caractéristiques de la morphologie corporelle, la
composition et le temps de circuit chargé par l'athlète tactique pour identifier les Indicateurs Clés
de Performance (ICP) pour le développement de la condition physique. Trente-six adultes en
bonne santé (17 hommes membres des FAC, 12 femmes des FAC et 7 femmes civiles) ont
effectué des scans par absorption à rayons X à double énergie (DEXA) et ont été analysés pour
déterminer la masse totale, la masse grasse, la masse corporelle maigre, la taille, la longueur de
l'humérus, la longueur du fémur, la masse maigre des bras et la masse maigre des jambes. Les
participants ont ensuite exécuté un circuit chargé simulant les exigences du travail, et le temps
total jusqu'à l'achèvement a été enregistré. Des coefficients de corrélation pour la morphologie
corporelle et les caractéristiques de composition ont été utilisés pour mesurer la relation avec le
temps du circuit, et des analyses de régression linéaire multiple ont été utilisées pour déterminer
les facteurs prédictifs. Dans l'ensemble, nous avons trouvé une grande variabilité dans la
morphologie et la composition corporelles, et que les mâles surpassent les femelles sur le circuit
chargé. En outre, la masse corporelle maigre a montré la relation la plus forte avec le temps de
performance et des variables mesurées, la masse grasse, la masse maigre des bras et la masse
maigre des jambes étaient les seules variables incluses comme prédicteurs du temps de circuit à
partir des résultats des analyses de régression. Par conséquent, nous avons conclu que le
développement de la masse musculaire, en particulier dans les bras pour les femmes et dans les
jambes pour les hommes, est essentiel pour améliorer les performances du circuit chargé pour les
athlètes tactiques.

iv
GRATITUDE
First of all, I want to thank my thesis supervisor Dr. Francois Haman for taking me on as
a student and directing me during this process. I have learned a lot from you over the years and I
am most thankful to now know that the dark layer on the bottom of a salmon fillet is actually
type one muscle fibre, used primarily for long distance low intensity swimming. I also want to
thank my friend/ councillor/ career advisor/ motivator, Marie Mitsou, for wearing all the hats and
being such a positive influence for me during the ups and downs. All the coaches and athletes I
had the pleasure of learning from at Gee-Gee Performance, thank you for inspiring me to become
a better professional. I also want to thank the members of the Nutrition Metabolism Research
Unit who were a part of collecting the original data for this study, as well as for their support in
the development of the current manuscript. A vital member of both of those support groups was
my buddy coach Yanths, I appreciate your patience and our discussions related to all thing’s high
performance. A whole-hearted thank you to all of my family, back home in Welland and here in
Ottawa for supporting and empowering me to become the man I am today. Finally, I want to
recognize me for continually showing up for myself in the darkness and in the light and a shout-
up to the mason, we did it big guy.

v
TABLE OF CONTENTS
ABSTRACT……………………………………………………………………………………...ii
RESUME………………………………………………………………………………………..iii
ACKNOWLEDGMENTS…………………………………………………………………...…iv
LIST OF TABLES…………………………………………………………………………...…vii
LIST OF FIGURES……………………………………………………………….………..….viii
LIST OF ABBREVIATIONS……………………………………………………..………...….ix
CHAPTER 1 – INTRODUCTION………………………………………..……………..….…..1
Canadian Armed Forces Physical Fitness Evaluation and Development...………….……3
The Effects of Body Morphology and Composition on Tactical Athlete Performance…..8
Canadian Armed Forces Tactical Athlete Fitness Program Design…………………...…12
Specific Aims………………………………………………………………………….....15
Hypotheses…………………………………………………………………………….…16
CHAPTER 2 – METHODOLOGY………………………………………………………...….17
Secondary Data Analysis and My Role………………………………………………….18
Participants………………………………………………………………………..……..18
Preliminary Session………………………………………………………………...……20
Experimental Session………………………………………………………………...….20
Measurements of Morphology and Composition ...……………………………………..21
Measurements of Performance…………………………………………………….….…23
Statistical Analysis……………………………………………………………….…..….27
CHAPTER 3 – RESULTS………………………………………………………………..……28
Relationship Between Body Morphology, Composition and Circuit Performance…......29
Relationship Between Body Morphology, Composition and Sandbag
Lift Performance…………………………………………………………….………...…35
Multiple Regression Analysis……………………………………………….………..….38
CHAPTER 4 – DISCUSSION…………………………………………………………………39
Key Performance Indicators of Body Morphology Related to Performance…...………..40

vi
Key Performance Indicators of Body Composition Related to Performance………..…..41
Loaded Circuit Training for Tactical Athletes…………………………………………...42
Limitations…………………………………………………………………………….…43
CHAPTER 5 – GENERAL CONCLUSIONS AND PRACTICAL APPLICATIONS….....45
KPI’s for Tactical Athlete Exercise Prescription……………………………………..….46
Practical Applications to Improve Tactical Athlete Participation…………………..…...47
CHAPTER 6 – REFERENCES………………………………………………………………..50
CHAPTER 7 – APPENDICIES…………………………………………………………….….57
APPENDIX A: Schematic Representation of My Thesis………………………….…….58
APPENDIX B: DEXA Body Composition and Anthropometrics Protocol……………..59
APPENDIX C: Detailed Description of Loaded Circuit Procedures………………...…..64
APPENDIX D: Sandbag Filling and Sandbag Drag Calibration Process………………..69
APPENDIX E: Factors Related to Improving Tactical Athlete Physical Performance
Elements that Influence the Expression of Technical and Tactical Execution…………..72
APPENDIX F: Ethics Approval Notice for Thesis Project………………………..….…73

vii
LIST OF TABLES
Chapter 1
Table 1: Canadian Standardized Test of Fitness (CF EXPRES) Components Used by
The CAF As A Predictor of Successful Task Completion From 1987 To 2010……………….....5
Chapter 2
Table 2.1: Participant Demographics………………………………………………………...….19
Table 2.2: Brief Description of the Four Military Specific Tasks Constituting the Gym-Based
Loaded Circuit………………………………………………………………………………..….23
Table 2.3: Evaluating the Loaded Circuit: Breaking Down Movement and Highlighting Key
Performance Indicators (KPI)……………………………………………………………………26
Chapter 3
Table 3.1: Participant Characteristics for All Participants and Female and Male Groups….…...30
Table 3.2: Relationship of Body Morphology, Composition Characteristics and Total Circuit
Time of Completion (s)……………………………………………………………………….….31
Table 3.3: Relationship of Body Morphology, Composition Characteristics and Sandbag Lift
Time of Completion (s)…………………………………………………………………………..35
Table 3.4: Regression Model of Predictors for Total Circuit Time for All Participants, Females
Only and Males Only………………………………………………………………….…………38

viii
LIST OF FIGURES
Chapter 1
Figure 1.1: Physical Fitness Profile……………………………………………………………….6
Figure 1.2 Total Work (J) Against Gravity and Loaded Distance Covered for the 6 CMTFE
Tasks.………………………………………………………………………………..….………..10
Figure 1.3: Guiding Principles for CAF Tactical Athlete Physical Fitness Development………13
Chapter 2
Figure 2.1 Imaging Sample of Whole-Body DEXA Scan……………………………..………..21
Chapter 3
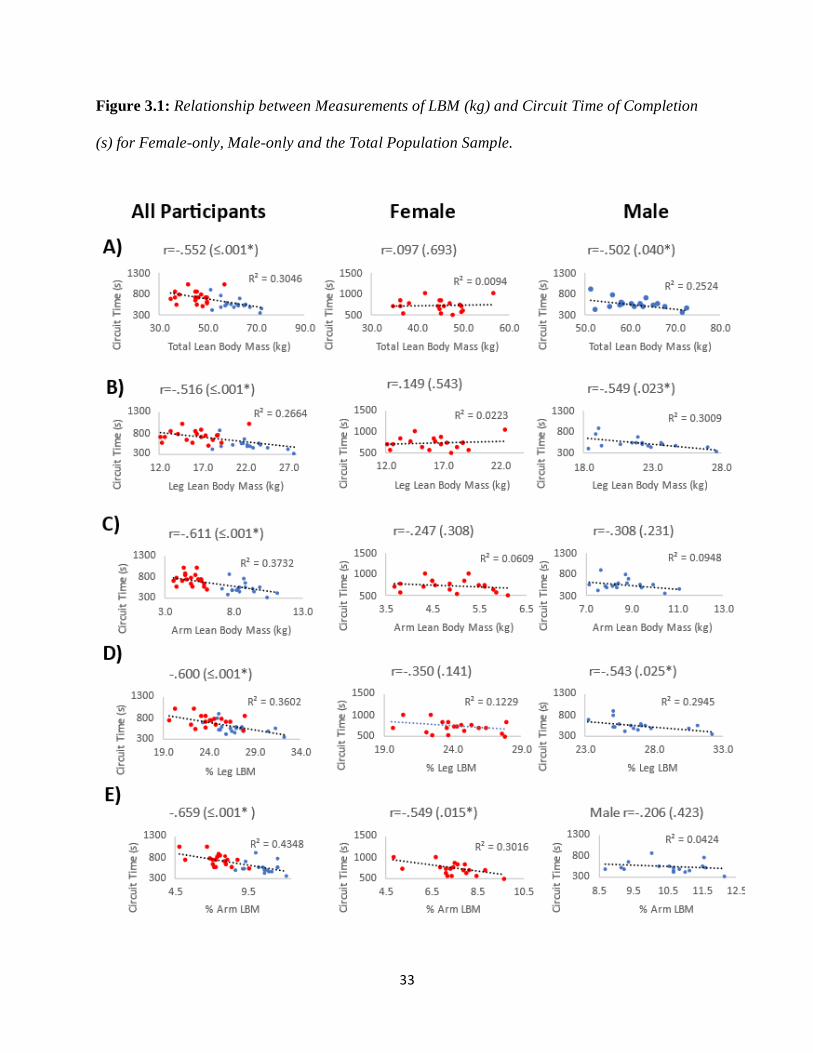
Figure 3.1: Relationship between Measurements of LBM (kg) and Circuit Time of Completion
(s) for Female-Only, Male-Only and the Total Population Sample……………………….….…33
Figure 3.2: Circuit Completion Time (s) as a Function of Lean Body Mass (kg) of Top and
Bottom Performers: A All Participants, B Females Only, C Males Only……………………….34
Figure 3.3: Relationship between Measurements of LBM (kg) and Sandbag Lift Time (s) for
Female-Only, Male-Only and the Total Population Sample …………..……………..................37
Chapter 5
Figure 5: Cyclical Approach to Improving the Tactical Athlete Physical Training Dynamic…..49

ix
LIST OF ABBREVIATIONS AND SYMBOLS
CAF- Canadian Armed Forces
CADPAT- Canadian Disruptive Pattern
CTemp- Core Temperature
DEXA- Dual Energy X-Ray Absorptiometry
FL- Femur Length
FO25- Fighting Order 25
HL- Humerus Length
IBTS- Individual Battle Tasks Standards
KPI- Key Performance Indicator
LBM- Lean Body Mass
LMA- Lean Mass Arm
LML- Lean Mass Leg
NATO- North Atlantic Treaty Organization
PAR-Q- Physical Activity and Readiness Questionnaire
PES- Physical Employment Standard
PSP- Personal Support Programs
RPE- Rating of Perceived Exertion
ROI- Region of Interest
SBL- Sandbag Lift
VO 2 - Maximal Oxygen Consumption

1
CHAPTER 1—INTRODUCTION

2
There is a growing emphasis on physical training for occupational professionals. For the
same reason parents might hire a personal trainer for their aspiring young athletes and
professional sport organizations invest big dollars into strength and conditioning facilities and
staffing, they hope that increasing physical fitness will result in improved performance. When it
comes to training to improve physical fitness for both traditional athletes and occupational
professionals, there are many pathways proven to induce physiological acclimation and a
plethora of modalities available to practice. Although attempts have been made to evaluate the
outcome of specific physical training programs on occupational fitness test performance, an all-
encompassing assessment of body morphology and its relationship with occupational task results
have yet to be conducted. The experiment of my thesis sought to examine how physical
characteristics of a specific population related to physical performance. Even if these findings
could be applied to physical fitness development of any occupational profession, the purpose of
this project was to contribute specifically to the growth of Canadian Armed Forces (CAF)
strength and conditioning by providing the Personal Support Programs (PSP), a non-publicly
funded organization closely related to the Department of National Defense Canada with Key
Performance Indicators (KPI’s) to improve physical fitness training programs for tactical
athletes.
When developing physical fitness programs, strength and conditioning specialists often
begin by determining KPI’s related to the population and their activities. The population at study
in this research is the tactical athlete. Like athletes who participate in regular sports, tactical
athletes must be strong, fast, and agile but also have the endurance to perform repeatedly. The
tactical athlete must also be equipped with the mental fortitude to make decisions in a fast-paced,
high stress environment where the outcome of their performance can be far more impactful than

3
numbers on a scoreboard. To be noted, this experiment only tests KPI’s related to physiology
and their impact on performance. While in the manuscript I also recognized the human
intangibles related to physical fitness development by including suggestions for exercise
evaluation, prescription, and participation. In effect, the intention of this experiment was to
investigate the relationship between inter-individual variations in body morphology (height and
segmental length) and composition (lean/fat mass, regional distribution of lean mass) and
performance time in a task-oriented circuit. This first chapter will focus on introducing the
knowledge related to physical testing protocols for CAF tactical athletes and briefly discuss
factors that can affect physical performance. Also, this chapter will identify gaps in the literature,
and present the ways through which this thesis fills these gaps.
Canadian Armed Forces Physical Fitness Evaluation and Development
Physical fitness development for tactical professionals working in the military, law
enforcement, firefighting, and rescue professions consists of injury prevention methods and
performance optimization aimed to counter unintentional musculoskeletal injuries and maximize
physical performance capabilities. Despite differences in the methods of evaluation, most Armed
Forces organizations are moving towards designing protocols to test the physical fitness of their
tactical athletes (Fadum et al., 2020; Gangon et al., 2015; Jones et al., 2015) that simulate
movement and metabolic requirements related to occupational performance. In 2009, a review
conducted by a North Atlantic Treaty Organization (NATO) panel identified the physically
demanding tasks of digging, marching and manual materials handling as key tasks performed
during army missions (NATO Research and Technology Organization, 2009).

4
In the CAF, physical fitness programs are developed and facilitated by PSP staff in
conjunction with strength and conditioning specialists to assess the individual (body
characteristics, standing/dynamic postures, physiological capacity, etc.) and identify their
intentions (“why’s”, goals, perceived limitations, etc.). In the beginning of formalized
programming, the Canadian Standardized Test of Fitness, 3rd edition (Canada, 1987) was used to
assure CAF members had the minimum fitness required for employment. The evaluation named
“CF EXPRES”, predicted VO2max, measured sit-ups, push-ups, and hand grip strength (Table 1)
and generated a numerical representation of physical fitness (CF EXPRES score). Based on their
age, sex, and score, individuals were split into one of two groups: improve or maintain. At this
point, the individual was given a 12-week exercise program with the intent of either improving
or maintaining their current level of fitness. PSP staff were encouraged to push the ideology of
long-term development to their athletes, promoting a consistent effort to induce lasting change.
At this point, hands-on coaching and athlete monitoring were non-existent. Yet, this process of
evaluation showed that the CAF was interested in investing resources and time into physical
fitness development for their employees.

5
Table 1 Canadian Standardized Fitness Test (CF EXPRES) Components Used By The CAF As A
Predictor Of Successful Task Completion From 1987 To 2010.
CR EXPRES
components
Physical capacity
component tested
Minimum criteria to pass
Male Female
≤ 34 yo* ≥ 35 yo ≤ 34 yo ≥ 35 yo
20 Metre Shuttle Run Maximum oxygen
uptake (VO2max) Stage 6.0 Stage 5.0 Stage 4.0 Stage 3.0
Handgrip protocol Overall muscular
strength 75 kg 73 kg 50 kg 48 kg
Push-up Protocol Upper-body muscle
endurance 9 reps 4 reps 9 reps 7 reps
Sit-up Protocol Abdominal muscle
endurance 9 reps 7 reps 5 reps 2 reps
2010 retireved from:
https://www.cfmws.com/en/AboutUs/PSP/DFIT/Fitness/Correspondence/Documents/CF%20EX
PRES/CF%20Expres%20Manual_Eng_July_FINAL_2012.pdf
In an effort to adapt to the changing face of modern warfare and shift from body weight-
based evaluations to a series of tasks mimicking occupational demands, the CAF began
developing a new evaluation to measure physical fitness based on essential components of the
military occupation (Spivock et al., 2011). Thus, creating the Common Military Task Fitness
Evaluation (CMTFE). This evaluation was derived from real operational scenarios which have
been identified and described by military subject matter experts and have been scientifically
validated by the PSP Directorate of Fitness (CFMWS, 2018). This evaluation replaced the CF
EXPRES and is still used as the Minimum Physical Fitness Standard for all military personnel,
regardless of trade classification, age, or sex.

6
In April 2014, the PSP created a field expedient test, for the purpose of assessing the
individual’s ability to meet the requirements of the CMTFE (Gagnon, Spivock, Reilly et al.,
2015). This evaluation, called FORCE, was designed to capture the movement patterns, energy
systems, and muscle groups recruited in the performance of the CMTFE to be reflected in a gym-
based circuit (website). Furthermore, the PSP enhanced their physical fitness development
procedure by creating a “Fitness Profile” for each tactical athlete. This profile (Figure 1.1) logs
their operational fitness (FORCE evaluation results) and health-related fitness (estimation of
cardiorespiratory capacity and waist circumference) and was designed to be used as an indicator
of health and occupational fitness level and recognize Canadian Armed Forces (CAF) personnel
who achieve high levels of health-related fitness and operational readiness.
Figure 1.1 Physical Fitness Profile (Retrieved From
https://www.cfmws.com/en/AboutUs/PSP/DFIT/Fitness/FORCEprogram/Pages/About-Fitness-
Profile.aspx#:~:text=About%20the%20FORCE%20Fitness%20Profile%20The%20Fitness%20
Profile,Armed%20Forces%20%28CAF%29%20members.%20It%20combines%20two%20meas
ures%3A)

7
Moreover, in addition to annually completing the FORCE evaluation, those aspiring to be
deployed for combat must successfully fulfil Individual Battle Task Standards (IBTS). The IBTS
evaluation named FORCE Combat™ includes:
i. a 60 min loaded march (35 kg) followed by five-minute rest
ii. a loaded (25 kg) gym-based circuit simulating the demands of performing urban
operations casualty rescue recorded for time (average circuit time of completion is
between 7 and 12 minutes).
Although participants will have completed the pre-fatigue element of loaded marching
before attempting the circuit, this thesis will be solely investigating the circuit portion of
the evaluation and how body morphology and composition affect physical performance
(time of completion). Therefore, deepening the understanding of how the individual’s
morphology and composition relate to performance of the FORCE Combat™. This
information can be used as a reference point for optimizing physical training program
development and suggest strategies to optimize CAF tactical athlete performance.
As discussed in this section, the CAF uses physical fitness evaluations to determine
occupational readiness and general fitness of their employees. The PSP works closely with
subject matter experts and follows deliberate and meticulous protocols to develop high quality
fitness evaluations that are reflective of job demands. Many studies have evaluated how bodily
characteristics affect sport/athletic performance and more data is becoming available related to
how body morphology and composition is related to tactical athlete performance. In this next
section, we will discuss some of those studies, their findings and how my study will contribute to
this expanding body of knowledge.

8
The Effects of Body Morphology and Composition on Tactical Athlete Performance
Determining the most effective training modalities to meet physical fitness training goals
requires a research-based approach that is population-specific and based on the tasks and
demands of the tactical athlete (Sell, 2010). Traditionally, studies have compared physiological
capabilities and their association with physical performance. For example, it is known for
primarily aerobic endeavours, such as cross-country skiing and long-distance running; in
addition to movement efficiency, individuals with higher maximal oxygen consumption (VO 2
max) are more likely to better tolerate prolonged high intensity effort than those with lower
maximal oxygen consumption (Ingjer, 1991; Sandbakk & Holmerg 2014; Thompson 2017).
Also, maximal leg strength, and? the ability to generate and decelerate force quickly are good
predictors of sprinting and jumping performance (Bissas & Havenetidis, 2008; McBride, 2009).
Also, maximal leg strength, the ability to generate and decelerate force quickly are good
predictors of sprinting and jumping performance (Bissas & Havenetidis, 2008; McBride, 2009).
Moreover, the performance of tasks while under load has been well studied by military
organizations (Rayson, 1998; Beckett and Hodgson, 1987; Mello et al., 1995; Nottrodt and
Celentano, 1987). Although, an accurate and effective assessment of how body morphology and
composition predict multiple-task (circuit) completion is limited. Recent attempts have been
made to explain how physiological and morphological factors affect CAF military-specific tasks
but to our knowledge little has been done to translate these data into training practices. In 2016,
Tingelstad et al. investigated the relationship between performance of common military tasks
simulations (sandbag fortification, escape to cover, picking and digging, pickets and wire carry,
stretcher carry and vehicle extractions), physiological capacity and morphological profiles. A
sample of female (n=127) and male (n=294) CAF members were tested, both on the task

9
simulation and a battery of physical fitness tests (shuttle run, grip strength test, plank time).
Measures of morphology [e.g., height, body mass, percent body fat (%BF) and lean body mass
(LBM)] were also recorded. Multiple linear regression analysis showed that although a large
difference in morphology exists between the top and bottom performance quintile in both the
male and female group, variability in total performance could be explained by measures of
aerobic capacity and muscular strength. Apart from height having a small effect on performance
in the female group, morphology did not seem to have an implication on performance outcomes.
Again, Tingelstad et al. (2016) tallied height, body mass and abdominal circumferences (hip and
waist) and estimated composition through bioelectrical impedance analysis. Based on these
methods, we expanded the criteria of morphology (collecting segmental length and regional
distribution of lean body mass) and used the gold standard for measuring body composition
(DEXA) in effort to illustrate a holistic shape of the human body and yield a stronger platform
for individualized physical training prescription. The aforementioned study also found that
height had a small effect on performance of the sandbag fortification task. These findings
inspired us to further explore the relationship between segmental length (humerus and femur) on
total circuit time and the Sandbag Lift (SBL) portion of the circuit.
The SBL portion of the loaded circuit was chosen for dependent analysis because of its
high work quantification and perceived difficulty. In discussions with CAF members, the thirty
sandbag lifts completed resonated as the most challenging and taxing bout of the loaded circuit.
A meta-analysis investigating the factors affecting lifting performance in military occupations
(Hydren et al., 2017) support these remarks. In this study, performance is evaluated as maximal
lifting capacity (single repetition) and or as repetitive lifting (number of repetitions within a time
limit). Although the weight of the object, target height and qualitative standards (i.e., knee

10
flexion, hip hinging, etc.) for lifting performance varies, all tests require the athlete to perform a
compound movement that uses whole-body musculature to displace an object from the ground.
Fortunately, total work done against gravity and loaded distance covered for a similar set of tasks
has been calculated (Tingelstad et al., 2016) and Figure 1 shows that of the six tasks, the sandbag
fortification presents the highest physiological strain on the participants during the CFMTE.
Therefore, because of the high work rate and perceived difficulty we chose to extract SBL times
as a second independent variable. In addition, rather than using synthetic, uniplanar exercises
with a high injury risk as dependent variables, such as a deadlift or mid-thigh pull (Bengtsson &
Berglund, 2018), we chose to examine characteristics of body morphology and composition and
their effect on SBL performance.
Figure 1.2
Total Work (J)Against Gravity and Loaded Distance Covered for the 6 CMTFE Tasks. Borrowed
from: Explaining Performance on Military Tasks in the Canadian Armed Forces: The
Importance of Morphological and Physical Fitness Characteristics (Tingelstad et al., 2016)
Note: Work performed was calculated by multiplying the external load with the displacement
against gravity, while loaded distance was defined as horizontal distance covered walking or
running with an external load.

11
Similarly to Tingelstad et al. (2016), Chassé et al. (2019) investigated the physical and
physiological characteristics contributing to the performance of an urban operation casualty
evacuation (UO) and its predictive test, FORCE Combat™. A total of 17 CAF members (9
males, 8 females) were assessed for body morphology (height, body weight and estimation of
body composition (using bioelectrical impedance analysis, InBody, 520), and maximal aerobic
capacity. To determine lower and upper body strength and power, the participants performed
three trials of a maximal isometric mid-thigh pull (IMTP) and three trials of a seated medicine
ball chest throw (MBCT). The four circuit tasks (20 m rushes, sandbag lifts, intermittent loaded
shuttle, and sandbag drag) were performed continuously while wearing FO25 (Fighting Order 25
kg). Results showed that neither age, sex nor height were confounding factors and concluded that
only VO 2 max was included as a predictor of FORCE Combat™ performance.
Of the studies that have examined loaded circuit performance and other military task
simulations for tactical athletes, we can conclude that individual variations in body morphology
and composition can be related to CAF performance (Chassé et al. 2019, Tingelstad et al. 2016).
Thus, investigating more precise aspects of body morphology and composition (segmental length
and regional distribution of LBM) and its relationship with physical performance could lead to
the identification of common thresholds that separate top and lower performers, and extrapolate
KPI’s related to performance.

12
Canadian Armed Forces Tactical Athlete Fitness Program Design
As mentioned in the previous sections, tactical athlete performance hinges on
characteristics like morphology, composition, aerobic capacity, and strength rather than
anthropometric measures, age, and sex. Furthermore, measuring technical and tactical output is
challenging and relying on collected data and the distribution of percentiles to predict
performance is not absolute. The human interaction element is vital for sustained progress on a
fitness development journey. Receiving guidance and feedback from a strength and conditioning
specialist enables the athlete to grow and consider their professional and personal responsibilities
(Radcliffie et al., 2018). Therefore, imposing a traditional scientific method on its own may not
be ideal for long-term development of physical fitness (Donnelly, 2016). Rather than feeding
numbers into an algorithm and sending the individual off with a standardized program, a
collaborative engagement between coach and athlete increases motivation and substantially
increases the odds of meeting set goals (Mageau & Vallerand, 2003). In this light, the PSP has
relied on three guiding principles to help CAF members improve their levels of physical fitness:
evaluation, prescription, and participation (Figure 1.2).

13
Figure 1.3 Guiding Principles for CAF Tactical Athlete Development (Retrieved From Canadian
Forces EXPRES Operations Manual)

14
Although these guidelines were written over 30 years ago, the process for physical fitness
improvement remains the same. The evaluation allows the strength and conditioning specialists
to situate the individual as a function of data collection (performance on mandatory evaluations,
medical conditions, training history, body morphology, metabolic conditioning, etc.) (Gagnon et
al., 2013). Next, based on their results CAF tactical athletes are given a training program. It is
then up to the athlete to participate by completing the exercise program. This final portion of the
triad (participation) is implemented differently based on the expectations from their chain of
command, coaching resources, and facility availability. Over the years, efforts have been made
to develop and enhance the evaluation and prescription process (Chassé et al., 2018; Reilly et al.,
2018; Tingelstad et al., 2016), but little has been done to improve and promote participation. In
response, the objective of my thesis was not only to determine bodily characteristics related to
performance, but also draw on over 5 years of working in athletic high-performance and a
lifetime love affair with the process of training for high performance to suggest actionable
practices to teach, guide, and influence holistic and lasting physical fitness acclimations for CAF
tactical athletes.

15
Specific Aims
The purpose of this study was to evaluate the effects of inter-individual variations in body
morphology (height and segmental length) and composition (total mass, fat mass, lean body
mass and regional distribution of lean body mass) on performance times of a loaded gym-based
non-combative urban operation/casualty rescue simulation. Our research objectives (schematic
representation in APPENDIX A) are:
1. To evaluate the effects of inter-individual variations in sex, height, and segmental length of the
humerus and femur on time to completion of the loaded circuit and the sandbag lift.
2. To evaluate the effects of inter-individual variations in body composition (lean and fat mass)
and distribution (upper vs. lower body) on loaded circuit total time and sandbag completion time.
3. To suggest Key Performance Indicators (KPI’s) to improve loaded circuit performance based
on a regression model of predictors for Total Circuit Time.

16
Hypotheses
Based on previous research investigating factors influencing tactical athlete performance
of job simulation tasks, we hypothesize that during a loaded, gym-based non-combative urban
operation/casualty rescue simulation that:
1) The males-only group will outperform the females-only group on both measurements of
performance and those with longer segments and above average height will produce faster
sandbag lift times.
2) According to the findings of Tingelstad et al. (2016), participants with more body mass
perform comparably to those with less and that higher LBM is a predictor of faster performance
times, we anticipate similar results. With the addition of a regional distribution analysis, we
hypothesize that for the entire population, participants with above average leg LBM will have
above average performance times.
3) Key Performance Indicators of height and lean body mass will be significant predictors of
total circuit and SBL time.

17
CHAPTER 2—METHODOLOGY

18
Secondary Data Analysis and My Role
The primary objective of this data set was to investigate the validity and relevance of the
current heat stress guidelines with the potential of developing a heat stress advisory for the
Canadian Army specific to conducting FORCE Combat™. Although I was a part of the primary
research team, my focus has been on the relationship between athlete body morphology,
composition, and physical ability. The original protocol designed to evaluate the effects of heat
on military job performance allowed me to perform secondary analysis contributing to the
scientific body of knowledge regarding tactical athlete body morphology and physical
performance.
During data collection sessions, a Certified Densitometry Technologist administered the
scans while I conducted the software analysis. I was also responsible for preparing equipment
(metabolic calibration, set-up of equipment, charting skin temp tools, etc.) and recording manual
data (core temperature intervals, tracking rate of perceived exertion, recording performance
times, etc.) as well as overseeing the general flow of the session. Data collection began in
January 2018 and finished in December 2019.
Participants
Thirty-six physically active adults volunteered to participate in this study and their
demographics are presented in Table 2.1. All 17 men were currently active CAF members while
nine females were CAF members but due to recruitment challenges, 10 were civilians.
All participants provided written informed consent, stating possible risks involved with
participating in this study, all meeting the Helsinki Declaration's standards and the Ethics Board
at the University of Ottawa (REB #H05-16-13). The exclusion criteria for participant recruitment

19
were: aged outside the range of 18 to 55 years, having any history of chronic back pain,
cardiovascular or respiratory disease, have restrictions in physical activity due to disease (e.g.,
intermittent claudication, active proliferative retinopathy, unstable cardiac lesions, pulmonary or
metabolic disease, disabling stroke, severe arthritis, etc.), currently using medication judged by
the participant or investigators to make participation in the study inadvisable, and pregnancy.
Participants were asked to abstain from smoking, consuming caffeine and/or alcohol at
least 6 hours before the experimental sessions, and refrain from heavy physical activity 48 hours
before the experimental sessions. Participants were also asked to refrain from eating large meals
3 hours before the experimental session and consume any type of food 2 hours prior to the
experimental session. The participants were also encouraged to drink one litre of water the
evening before the trials to ensure they were fully hydrated.
Table 2.1 Participant Demographics
Male (17) Female (19)
n % n %
Age
18-24 years old
25-34 years old
35 years old or
older
2
9
6
5.6
25
16.7
5
12
2
13.9
33.3
5.6
Status CAF member
Civilian
17
0
47.2
0
12
7
33.3
19.4

20
Preliminary Session
During the preliminary session, background information — confirming each participant’s
eligibility based on inclusion and exclusion criteria listed above and through completion of the
PAR-Q (Physical Activity Readiness Questionnaire) — was covered and an informed consent
form was signed. Measurements of height and weight were recorded before body composition
and morphology was determined using Dual Energy X-ray Absorptiometry (DEXA) scan.
Participants then performed a progressive treadmill test to volitional fatigue to determine
maximal oxygen consumption (VO 2 max), in a room with a temperature of ~21°C. Finally,
participants were provided with a review of the loaded circuit evaluation, and detailed
instructions on how to perform the four tasks: 20-metre rushes, sandbag lifts, intermittent loaded
shuttles, and sandbag drag. Participants were advised that their participation was voluntary, and
at any point during the study, they could choose to withdraw themselves and/or their results with
absolutely no repercussions. As an incentive, they were also provided with their VO 2 max and
body composition results even if they chose to withdraw from the experimental sessions.
Experimental Session
Prior to completing the loaded circuit, participants performed a 60-minute pre-fatigue
march on a treadmill (1% incline and 5 km/h) within an environmental chamber held at ~21°C
room temperature. Participants were dressed in standard Canadian Disruptive Pattern (CADPAT)
uniforms, with the addition of training plates, tactical vest, frag vest, helmet, and a training Colt
7 replica weapon and carried a 10 kg backpack resulting in a total external load of 35 kg that was
carried throughout the pre-fatigue march. Following the pre-fatigue march, participants were
given a 5-minute rest period before beginning the loaded circuit. Participants were asked to

21
refrain from consuming fluids during this rest period because of pre and post activity weighing.
After the rest period, participants were asked to provide their best effort throughout the loaded
circuit activities (intermittent loaded shuttle, sandbag lift, sandbag drag, and 20-meter rushes)
where the total time, time per stand and transition times between stands was recorded. As a way
of confirming that participants provided their best effort, we consulted post FORCE Combat™
heart rate and perceived exertion data.
Measurements of Body Morphology and Composition
Measurements of height, body mass, body composition and segmental length of the
humerus and femur were collected during this study. Height was measured using a Seca 213
Portable stadiometer (Seca Industries, Hanover, Maryland, USA), while body mass was
measured using a standardized and calibrated professional-grade digital weighing scale (Health-
o-meter, Alsip, Illinois, USA). Whole-body, regional body composition and segmental length
were estimated by using DEXA (software version 3.6; Lunar DPX, Madison, WI). For detailed
explanation and step by step body composition and anthropometric measures protocol see annexe
C.
The DEXA system software provided the mass of lean soft tissue, fat, and bone mineral
mass and density for both the whole body and specific regions. Lean Mass Arm (LMA) and Lean
Mass Leg (LML) was considered equivalent to the sum of lean soft tissue in both the right and
left arms and legs. Appendages were isolated from the trunk and head by using DEXA regional
computer-generated default lines (Figure 2.1), with manual adjustment, on the anterior view
planogram. With the use of specific anatomic landmarks, the legs and arms were defined by this
method as the soft tissue extending from a line drawn through and perpendicular to the axis of
the femoral neck and angled with the pelvic brim to the phalange tips and the soft tissue

22
extending from the centre of the arm socket to the phalange tips, respectively (Kim, 2002).
Humerus length (HL) was detected visually by identifying the shaft and head of the humerus. At
the distal end, a straight line was drawn across the joint space from medial to lateral epicondyle,
with the head of the ulna included within the humeral Region of Interest (ROI). When arm
positioning was not ideal (such as palms not flat on the bed), the ROI was fitted as accurately as
possible (Clark, Ness & Tobias, 2007). A similar procedure was used for Femur length (FL)
estimation, where a straight line was drawn across the femur, considering the starting point the
head of the femur and the ending point the joint space from medial to the lateral condyle
(Chinappen-Horsley et al., 2007).
Figure 2.1 Imaging Sample of DEXA Scan Results
Note: The Whole-Body DEXA Scans (Border Line in Blue) Represented by Soft Tissue Map on
the Right and Bone Map on the Left, Show the Correct Alignment of the Lines Defining ROIs.
The Enlargements of the Different Anatomic Sections (Border Line in Red) Are Examples of
Wrong Alignment of the Lines (Bazzochi et al., 2016).

23
Measurements of Physical Performance
Participants were expected to provide their best effort and could rest at any time
throughout the circuit. The four task simulations of the loaded circuit were derived via subject
matter expert consultation and detailed physiological analysis (Forces, T. C. A. 2014). Brief
descriptions of each of the four tasks included in the loaded circuit evaluation are found in Table
2.2, and a more detailed description can be found in Appendix C. In addition, further details
regarding sandbag filling and sandbag drag calibration process can be found in Appendix D.
Table 2.2
Brief Description of the Four Military Specific Tasks Constituting the Loaded Circuit.
Task Description Performance Measure
20 m rushes (20mR)
With the weapon at a low ready position, the participant began in a prone position before rising
to sprint 10 m, touch a line with one foot and lowering to aim down range. This process was
repeated 7 times.
Time to completion (s)

24
Sandbag lift (SBL)
With the weapon slung, participants were required to lift 30 (20 kg) sandbags to a horizontal marker on the wall at a height of 99 cm from the
floor.
Time to completion (s)
Intermittent loaded shuttle (ILS)
The weapon is slung, and using the 20 m course, the participant completes repeated shuttles out and back, first loaded (carrying a 20 kg sandbag), then unloaded (no sandbag), for a total distance
of 40 m each shuttle. This cycle is repeated 5 times for a total distance covered of 400 m.
Time to completion (s)

25
Sandbag drag (SBD)
The participant performs this test walking backward, dragging the calibrated arrangement of 20 kg sandbags on the floor to the opposite end of
the 20 m course.
Time to completion (s)
The goal of this study was to extrapolate Key Performance Indicators (KPI) related to loaded
circuit performance. As mentioned in the introduction, KPI’s are determined by breaking down
the overall movements required to perform the task and extracting trainable elements to be
developed during physical fitness development. The loaded circuit at study requires a range of
movements and integrates layers of physical attributes that move through a variety of planes.
This experiment was conducted to focus on bodily characteristics relating to performance while
Table 2.3 lists examples of movement KPI’s related to the four task simulations that make-up the
loaded circuit to be considered in adjunct with the results of this project.

26
Table 2.3
Evaluating the Loaded Circuit: Breaking Down Movement and Highlighting Key Performance
Indicators (KPI)
Circuit Components Purpose of
Assessment Examples of Movement KPI’s
20-m rushes
Can the individual
move quickly over
short distances while
changing body
positions?
- Upper body horizontal pushing
- Straight line acceleration
- 1-foot deceleration
- Maintaining core positioning throughout
centre of mass displacement
Sandbag lift
Does the individual
posses the physical
capability with
military materials
handling tasks?
- Scapular stability
- Squat
- Spinal integrity
- Bent arm Isometric resilience
Intermittent loaded
shuttle
Can the individual
repeatedly carry
loads?
- Grip strength
- Movement efficiency
Sandbag drag
Can the individual
drag a load over a
distance of 20
meters?
- Hamstring recruitment
- Pulling in the transverse plane
- Straight arm pulling
- Acceleration from legs at 90 degrees

27
Statistical Analysis
All the body morphology, composition and circuit performance measures were analyzed for
normality before any statistical analyses were performed. An analysis of covariance among
measurements of morphology and composition was performed, and covariates with the lowest
association with the measurements of performance variables were excluded from further
analysis. Once covariance was standardized, correlation coefficients were used to examine the
relationship between morphology, composition, and circuit completion time. The same action
was repeated for morphology, composition and SBL completion time. Lastly, a backwards
stepwise multiple regression analysis was performed to determine which characteristics of
morphology and composition best predict circuit performance time for the entire population,
females-only and males-only groups. Results were presented as mean SD and the 95%
confidence interval, and significance level was set to p≤0.05. All statistical analyses were
conducted using SPSS Statistics 17.0 and Microsoft Excel 365 16.0.

28
CHAPTER 3—RESULTS

29
Relationship Between Body Morphology, Composition and Circuit Time
Firstly, it is important to note that three of the thirty-six participants did not complete the
60 min pre-fatigue march prior to the loaded circuit. In this instance, the participant signaled to
the researcher to stop the treadmill and at that point were given the allocated 5-minute rest period
before commencing the loaded circuit (all three were part of the females-only group and were of
civilian status). Participant characteristics for the total population and female and male groups
are found in Table 3.1. We did observe certain differences in demographics, morphology, and
composition with men (32.5±7.9) being slightly older than women (27.9±4.4) and also taller
(177.3±6.5 compared to 166.6±6.2). Results for measurements of performance showed that
males outperformed females on both the loaded circuit (Male 546±132 Female 734±145) and
SBL (Male 158±40.3 Female 103±23.3).

30
Table 3.1:
Participant Characteristics for All Participants and Female and Male Groups.
All Participants Female Male
N 36 19 17
Age 30.1 ±6.6 27.9±4.4 32.5±7.9
Height (cm) 171.7±8.2 166.6±6.5 177.3±6.2
Femur Length
(cm) 43.1±2.7 41.9±2.4 44.5±2.6
Humerus
Length (cm) 28±3.1 28±4 28±1.9
Total Mass (kg) 74.9±14 67.8±14.7 82.8±8.7
Fat Mass (kg) 19.6±8.1 20.8±10 18.2±5.6
Lean Body
Mass (kg) 52.4±10.2 44.4±5.8 61.3±6.2
Leg Lean Body
Mass (kg) 19±4 16.2±2.7 22.2±2.6
Arm Lean Body
Mass (kg) 6.7±2.1 4.9±0.7 8.7±1.1
Circuit Time (s) 645.6±165.3 734.6±145.7 546.1±132.8
Sandbag Lift
Time (s) 132.4±42.7 158.6±40.3 103.1±23.3

31
Table 3.2 shows correlation and p-values to present the relationship between bodily
characteristics and circuit completion time. Circuit completion time was associated with height
r=-0.337 (0.045), FL r=-0.370 (0.026), fat mass r=0.394 (0.017), total LBM r=-0.552 (≤0.001),
LML r=-.516 (≤0.001) and LMA -.611 (≤0.001) for the overall sample. When analyzing total
circuit time in females-only, we found that relative LMA r=-.549 (0.015) was the only bodily
characteristics related to circuit time. Conversely, length of humerus r=-.507 (0.038), total LBM
r=.402 (0.040) and relative leg LML r=-.543 (0.025) were related to circuit time of the male-only
group.
Table 3.2
Relationship of Body Morphology, Composition Characteristics and Total Circuit Time of
Completion (s).
Bodily Characteristics All Participants
(n=36) Females Only
(n=19) Females Only
(n=19)
r p-value r p-value r p-value
Height (cm) -.337 .045* .058 .814 .063 .81
Femur Length (cm) -.370 .026* .069 .779 -.389 .124
Humerus Length (cm) -.123 .476 -.036 .884 -.507 .038*
Total Mass (kg) -0.193 .260 .312 .192 -.162 .534
Fat Mass (kg) .394 .017* .402 .087 .339 .183
LBM (kg) -.552 ≤.001* .097 .693 -.502 .040*
LML (kg) -.516 ≤.001* .149 .543 -.549 .023*
LMA (kg) -.611 ≤.001* -.247 .308 -.308 .231
LML of Total Mass (%) -.600 ≤.001* -.350 .141 -.543 .025*
LMA of Total Mass (%) -.659 ≤.001* -.549 .015* -.206 .423
LML of Total LBM (%) .034 .844 .229 .346 -.340 .183
LMA of Total LBM (%) -.562 ≤.001* -.470 .042* .264 .306
*Significant difference (p≤0.05)

32
Figure 3.1 illustrates the relationship between measurements of LBM and circuit time of
completion for female-only, male-only and the total population sample. Figure 3.1A highlights a
negative relationship between total LBM and circuit completion time for all participants and
males only group. While Figure 3.1B also shows a negative relationship for absolute LML and
circuit completion time for all participants and the male-only group. Figure 3.1C shows a
negative relationship between absolute LMA for all participants. Finally, Figure 3.1D shows a
negative relationship between relative LML and circuit time of completion for all and the male-
only group while Figure 3.1E shows a negative relationship between relative LMA and circuit
time of completion for all and the female-only group.
Figure 3.2 shows top (6) and bottom (6) performers for circuit time of completion as a
function of LBM. For all participants (A) and total LBM r=-.718 (≤0.001), female-only (B) and
relative LMA r=-.665 (≤0.001) and males-only (C) and relative LML r=-.676 (≤0.001).
33
Figure 3.1: Relationship between Measurements of LBM (kg) and Circuit Time of Completion
(s) for Female-only, Male-only and the Total Population Sample.

34
Figure 3.2: Circuit Completion Time (s) as a Function of Lean Body Mass (kg) of Top and
Bottom Performers: A All Participants, B Females Only, C Males Only.

35
Relationship Between Body Morphology and Composition and Sandbag Lift
Table 3.3 shows correlation and p-values to present the relationship between bodily
characteristics and sandbag lift completion time. Sandbag lift completion time was related to
height r=-.417 (0.011), FL r=-.378 (0.023), total LBM r=-.583 (≤0.001), LML r=-.568 (≤0.001)
and LMA r=-.650 (≤0.001) for the overall group. When analyzing the males and females
independently, no significant relationships between sandbag lift completion time and any
morphological or body composition factors were found.
Table 3.3
Relationship of Body Morphology, Composition Characteristics and Sandbag Lift Time of
Completion (s).
Bodily Characteristics All Participants
(n=36) Females Only
(n=19) Females Only
(n=19)
r p-value r p-value r p-value
Height (cm) -.417 .011* -.016 .951 .086 .744
Femur Length (cm) -.378 .023* -.038 .88 -.182 .484
Humerus Length (cm) -.173 .313 -.229 .348 -.293 .255
Total Mass (kg) -.321 .057 .059 .81 -.038 .885
Fat Mass (kg) .207 .226 .113 .647 .219 .398
LBM (kg) -.583 ≤.001* -.046 .855 -.251 .333
LML (kg) -.568 ≤.001* -.064 .797 -.350 .168
LMA (kg) -.650 ≤.001* -.276 .253 -.120 .649
LML of Total Mass (%) -.522 ≤.001* -.232 .34 -.431 .085
LMA of Total Mass (%) -.651 ≤.001* -.336 .161 -.089 .737
LML of Total LBM (%) -.100 .566 -.085 .731 -.410 .103
LMA of Total LBM (%) -.630 ≤.001* -.358 .132 .222 .393
*Significant difference (p≤0.05)

36
Similar results are displayed in Figure 3.3 showing a negative relationship between total
LBM (A), absolute (B and C), relative (D and E) and Sandbag lift time of completion. While no
relationships were significant when analyzing measurements of LBM and females, males
independently.

37
Figure 3.3: Relationship between Measurements of LBM (kg) and Sandbag Lift Time (s) of
Completion for Female-only, Male-only and the Total Population Sample.

38
Multiple Regression Analysis
Stepwise multiple regression analysis was used to determine Key Performance Indicators
best predicting loaded gym-based non-combative urban operation/casualty rescue simulation
(Table 3.4). The results from the analyses showed that a model, containing LMA and fat mass
explained 49.1% of the variance in loaded circuit performance time in the overall population
(Table 3.4A). In the female group, a stepwise multiple regression showed that LMA explained
22.2% of the variance in circuit time (Table 3.4B). In the male group, LML explained 30.3% of
the variance in circuit time (Table 3.4C).
Table 3.4
Regression Model of Predictors for Total Circuit Time for All Participants, Females Only and
Males Only.

39
CHAPTER 4—DISCUSSION
40
My thesis examined the relationship between characteristics of body morphology,
composition, and tactical athlete loaded circuit time to identify Key Performance Indicators
(KPI) for physical fitness development. The objectives of the experiment were to evaluate the
effects of inter-individual variations in body morphology (height, length of humerus and length
of femur) and composition (total mass, fat mass, lean body mass, distribution of lean mass in the
arms and legs) on performance. Overall, we found high variability in body morphology and
composition, and that males outperform females on the loaded circuit. In addition, lean body
mass showed the strongest relationship with performance time and the outcome of the stepwise
multiple linear regression showed that of the variables measured, fat mass, LML and LMA were
the only variables included as predictors of circuit time. This assessment of body morphology
and composition in tactical athletes, and their relationship with occupational task performance
can be used for future research into how different training modalities influence the development
of KPIs whereby improving these bodily characteristics can affect the performance of CAF and
other tactical athletes worldwide.
Key Performance Indicators of Body Morphology Related Performance
Although CAF members are held to a universal standard regardless of sex, it is important
to consider the physiological and morphological differences between men and women when
designing an exercise program. Research on the association between sex and physical
performance has found that males are more likely to outperform females for strength, endurance,
and balance (Devries, 2016; Tangen & Robinson, 2019; Lee & Hwang, 2019; Lewis et al., 1986)
and since loaded circuit performance variability is dependant on factors like manual handling
(Drain, 2019), strength and aerobic capacity (Chasse et al., 2019; Tingelstad et al., 2016), it is no
surprise to confirm our primary hypothesis that males outperformed females on both

41
measurements of performance (Table 3.1). In a systematic review and meta-analysis of factors
predicting military task performance (Hydren, 2017), anthropometric measurements (height,
body mass, body composition) explained 24-54% of maximal lifting task performance. Here, we
found that height and femur length were moderately related to SBL performance (Table 3.3) and
that height did not factor into the multiple regression models (Table 3.4). Interestingly, there was
an absence of collinearity between height and femur length leaving us to reason that individuals
with longer legs and shorter torsos may be at a slight advantage during the SBL portion of the
circuit but not enough to explain overall circuit time.
Key Performance Indicators of Body Composition Related to Performance
In both sport and occupational fitness, it is firmly accepted that improving body
composition, specifically increasing LBM is one of the best ways to improve performance
(Charlton, 2015, Ina Garthe et al., 2013). Foundational research on body composition and
tactical athlete performance focused primarily on single task performance and it was not until
recently that its effects were observed on a battery of complex military physical performance
tests (Tingelstad et al., 2016). The authors concluded that performance outcome is dependent on
trainable factors of physiological capacity rather than characteristics of body morphology.
Evaluating a different set of factors, my study found that total LBM was negatively correlated to
total circuit time (Table 3.2) and sandbag lift time (Table 3.3). These results confirm our
secondary hypothesis and are supported by the conclusions of previous studies (Horvat et al.,
2003; Maughan et al., 1983) that lean body mass is correlated with strength and lifting capacity.
Even with high variability in body morphology, composition and performance results when
analyzing the entire group, the outcome of the stepwise multiple linear regression analysis
showed that performance of the loaded circuit is largely dependent on individual fat mass and

42
LMA. These results highlight an important element of the physical training reality and that is the
importance of self-care practices (Hopkins & Blundell, 2016). Physical activity is only a small
contributor to body composition management, it is imperative to at least discuss with the athletes
how nutrition (Matvienko et al., 2001; Garthe et al., 2012), sleep (Simpson et al., 2015; Halson et
al., 2014) and even mindfulness (Olson et al., 2015) play a role in energy balance and other
elements of overall health.
We hypothesized that regional distribution of lean mass would not have a significant
impact on circuit performance time. However, LMA and LML were responsible for a certain part
of the variability in performance in the female and male group, respectively. In the female group,
~22% of loaded circuit performance could be explained by differences in arm LBM. This was
likely attributed to the standardized height objects had to be lifted to and since females generally
have a shorter stature than males (supported by results in Table 3.1), more of the lifting phase
was spent using upper body (arm) strength to accomplish the tasks. In the male group, ~30% of
the loaded circuit variability could be explained by differences in LML. We observed notable
differences in sandbag lift time of top and bottom performers within overall circuit completion
time (data not presented) leading us to reason that LBM had an impact in distinguishing high and
low-level male performers. Therefore, we are inclined to reason that overall fitness and
performance ability explained the separation in the male group rather than specific KPIs related
to bodily characteristics.
Loaded Circuit Training for Tactical Athletes
The use of loaded circuit training is effective for tactical athlete fitness development
(Marcos-Pardo et al., 2019; Pawlak et al., 2015). In the CAF, the FORCE Combat™ evaluation
is used to prepare soldiers for combat deployment and as a training tool for general fitness

43
development. It was found that for best results, tactical athletes should slowly attempt FORCE
Combat™ combat 2-3 times to learn their best strategy (Reilly et al, 2019). In the experiment of
my thesis, not all participants had prior experience with the circuit, and this may have had an
impact on the performance times. For this reason, we suggest planning to practice the circuit
throughout training cycles and prescribing modalities and movements proven to increase overall
and regional LBM and decrease fat mass since those were the KPI’s responsible for the most
variability of performance time.
Limitations
There are many limitations to physical performance studies and a few that should be
addressed particular to this protocol. Firstly, not all participants were CAF members. Thirty-
seven percent of the female population we studied where civilians thus had little to no prior
experience moving under Fighting Order and Battle Order (loaded configuration). This is
noteworthy because previous experience is an undervalued factor that impacts movement
efficiency and overall performance time (Knecttle, 2012, Mauger et al., 2009). Secondly, our
DEXA scans lacked reliability and consistency. For this protocol, all participants were scanned
in their underwear, laying in the supine position with feet strapped together. However, hand
positioning changed from subject to subject (depending on the technician administering the
scan), this could have influenced composition assessments, particularly arm lean body mass.
Also, we did not establish guidelines for fluid and food intake on the day of the preliminary
session. Studies have shown that large amounts of water (0.8-2.4 L) (Horber et al., 1992), meal
consumption (1039 g) (Thomsen et al., 1998), or dehydration-rehydration protocols (Going et al.,
1993) influence variation in body composition results. For future studies we suggest having the

44
same technician administrating scans and encouraging participants to arrive in a fasted or near to
fasted state therefore minimizing biological variations.

45
CHAPTER 5—GENERAL CONCLUSIONS AND PRACTICAL
APPLICATIONS

46
The experiments of my thesis sought to test how body morphology and composition
relate to tactical athlete physical performance. With these findings we have highlighted Key
Performance Indicators (KPI) related to body morphology and composition to be used by
strength and conditioning specialists for physical fitness development. In addition, based on
peer-reviewed research and strength and condition coaching experience I have suggested
practical applications to improve participation in the tactical athlete training environment.
KPI’S to Improve Tactical Athlete Fitness Development
After exploring the effects of inter-individual variations in body morphology and
composition on performance times of a loaded gym-based circuit, we have gained insight on key
performance indicators to enhance exercise program prescription. It was found that:
• Lean body mass correlated with all performance variables thus increasing lean
body mass should be a high priority for tactical athlete physical training.
• Especially arm lean mass development for females and leg lean mass
development for males ̧due to the results of the stepwise multiple regression
analysis.
Although body morphology and composition prove to be related to better performance, we
acknowledge they do not explain it entirely. Many elements influence the outcome of technical
and tactical execution and for that reason this thesis also suggests actionable practices to educate
athletes and increase their participation with the goal of creating a strong fitness community
within the organization.

47
Practical Applications to Improve Tactical Athlete Participation
In Chapter 1, a brief review of CAF tactical athlete training history was presented. We first
discussed the evolution of the evaluation process. A process that originated with the CF
EXPRES method used from 1987 to 2010 (predicted VO2max, sit-ups, push-ups, and hand grip
strength), then transitioning to the Fitness for Operational Requirements of CAF Employment
(FORCE) evaluation. While these evaluations were used to predict occupational performance, it
was not until the FORCE test that the evaluation was accurately representative of tasks that a
CAF tactical athlete may encounter on a day-to-day basis. Next, we discussed the prescription
process and the experiments of Chapter 2 sought to contribute KPIs related to individual body
morphology and composition to help determine specific attributes the athlete may need to
develop. With this information, we expect physical fitness specialists to create a program that is
structured around improving weakness’ adhering to a limitations-based approach and the use of a
variety of stimuli and modalities. Finally, drawing on over five years of experience working with
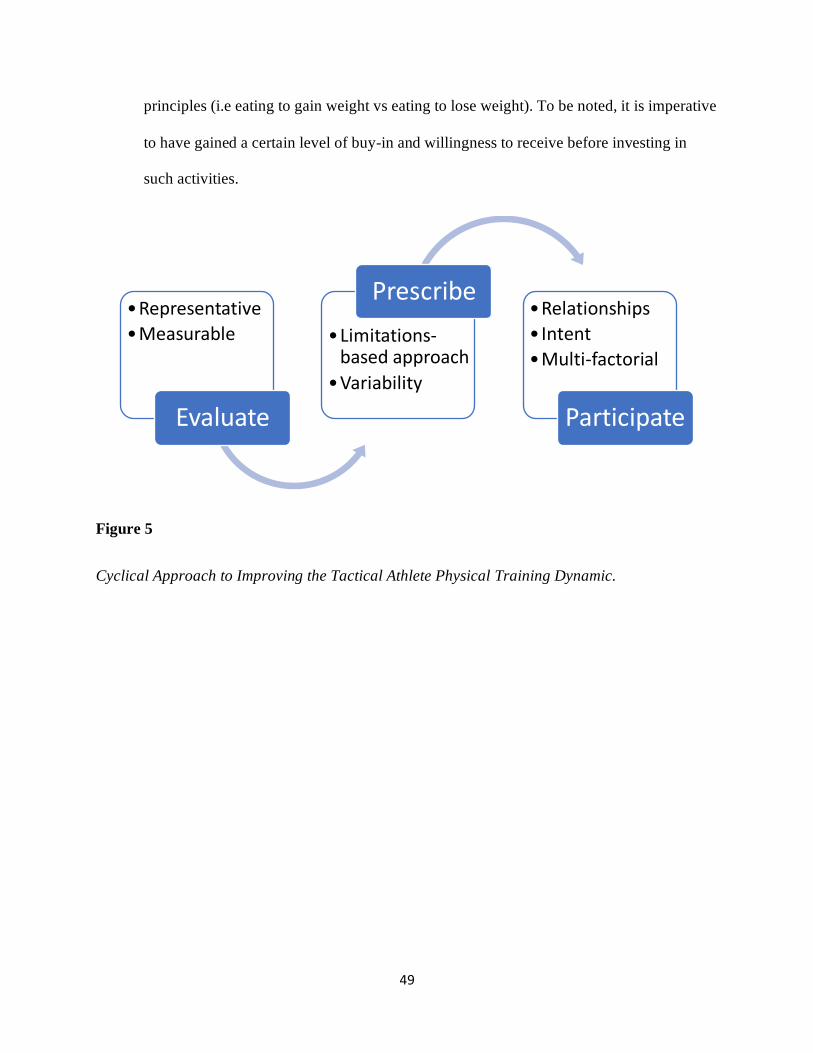
high-performance athletes and peer-reviewed research, here are three strategies to improve
participation specific to the CAF tactical athletes training reality (the entire cycle is represented
in Figure 5):
• Build relationships. A positive coach–athlete relationship is acknowledged to promote
participation, athlete satisfaction, self-esteem, and improved performance (Jowett, &
Poczwardowski, 2007 & Sanchez et al., 2009). Arriving to all relationships (with athletes,
ranking officers, support staff, etc.) with an open heart and open mind, will improve the
chances of being well received, and lay the foundation for communication (Jowett, 2007).
Communication should flow in both directions, where the leader’s responsibility is to
deliver the “why’s” and “how’s” and the athlete is accountable for giving feedback

48
(examples of athlete feedback are: internal sensations, level of motivation on that day,
asking questions, etc.).
• Train with intent. In 2018, the University of Ottawa’s men’s basketball strength and
conditioning system used a stop light system to encourage purposeful practice. The
purpose of such activities was to optimize acquisition (Ericsson, 2020). It was understood
that when the training session was labelled “green” the athletes were expected to produce
maximal effort and problem solve independently. On a “yellow” training day, the
intention was to solicit a strong enough training stimulus to invite acclimation while also
teaching and correcting movement. The purpose of a “yellow” session was to have the
athlete learning under stress. While a “red” session was understood to be an active
recovery day where they would intentionally practice things like breath work, guided
meditations, static stretching, etc. (Kellmann, 2018). Although the activities can be
modified according to the current mesocycle, equipment availability, staffing resources,
etc. the takeaway message from training with intent is to have the entire group aware of
the training sessions purpose and where to direct their focus.
• Using a Multi-factorial approach. There is no one size fits all blueprint to improving
physical fitness and sustainable change requires a conscious investment of energy to
continually evolve within and harden physical resilience (Goodale, 2016). APPENDIX C
shows factors related to improving tactical athlete physical performance and the elements
that influence the expression of technical and tactical execution. Based on Dr. Goodales
recommendations, the suggested actions for delivering this message to CAF athletes is to
offer educational pieces on topics like the variety of movement modalities available
(Olympic lifting, bodybuilding, yoga, crossfit, etc.) or highlighting key nutrition
49
principles (i.e eating to gain weight vs eating to lose weight). To be noted, it is imperative
to have gained a certain level of buy-in and willingness to receive before investing in
such activities.
Figure 5
Cyclical Approach to Improving the Tactical Athlete Physical Training Dynamic.
•Representative
•Measurable
Evaluate
•Limitations-based approach
•Variability
Prescribe•Relationships
• Intent
•Multi-factorial
Participate

50
CHAPTER 6—REFERENCES

51
Bale, P., Rowell, S., & Colley, E. (1985). Anthropometric and training characteristics of female
marathon runners as determinants of distance running performance. Journal of Sports
Sciences, 3(2), 115-126. doi:10.1080/02640418508729741
Bazzocchi A, Ponti F, Albisinni U, Battista G, Guglielmi G. DXA: Technical aspects and
application. Eur J Radiol. 2016 Aug;85(8):1481-92.
Beckett, M. B., & Hodgdon, J. A. (1987). Lifting and Carrying Capacities Relative to Physical
Fitness Measures. Retrieved from
http://oai.dtic.mil/oai/oai?verb=getRecord&metadataPrefix=html&identifier=ADA18930
5
Bengtsson V, Berglund L, Aasa U. (2018). Narrative review of injuries in powerlifting with
special reference to their association to the squat, bench press and deadlift. BMJ Open
Sport & Exercise Medicine, 4(1): 1-8. Retrieved from: e000382. doi:10.1136/ bmjsem-
2018-000382.
Bissas, A. I., & Havenetidis, K. (2008). The use of various strength-power tests as predictors of
sprint running performance. J Sports Med Phys Fitness, 48(1), 49-54.
CFMWS (2018). Common Military Task Fitness Evaluation, Personnel Support Programs.
Retrieved from:
https://www.cfmws.com/en/AboutUs/PSP/DFIT/Fitness/FORCEprogram/Pages/CMTFE.
aspx
Charlton, K. (2015). Lean body mass associated with upper body strength in healthy older adults
while higher body fat limits lower extremity performance and endurance. Nutrients, 7,
7126-7142. doi:10.3390/nu7095327
Chinappen-Horsley U1, Blake GM, Fogelman I, Spector TD (2007) A method for determining
skeletal lengths from DXA images. BMC Musculoskelet Disord. 16;8:113.
Clark EM1, Ness AR, Tobias JH. Gender differences in the ratio between humerus width
and length are established prior to puberty. Osteoporos Int. 2007 Apr;18(4):463-70.
Devries MC. (2016) Sex-based differences in endurance exercise muscle metabolism: impact on
exercise and nutritional strategies to optimize health and performance in women. Exp
Physiol. 101(2), 243-9. doi: 10.1113/EP085369
Director General Personal Family Support Services (DGPFSS) & Directorate of Fitness (DFIT).
(2012) Canadian Forces EXPRES Operations Manual (ed. 5). Personal Support Program.
Donnelly JE, Hillman CH, Castelli D, Etnier JL, Lee S, Tomporowski P, Lambourne K, Szabo-
Reed AN. (2016) Physical Activity, Fitness, Cognitive Function, and Academic
Achievement in Children: A Systematic Review. Med Sci Sports Exerc. 48(6),1197-222.
doi: 10.1249/MSS.0000000000000901. PMID: 27182986; PMCID: PMC4874515.

52
Drain JR, Reilly TJ. (2019) Physical employment standards, physical training and
musculoskeletal injury in physically demanding occupations. Work. 63(4), 495-508. doi:
10.3233/WOR-192963
Ericsson, A. (2020) Towards a Science of the Acquisition of Expert Performance in Sports:
Clarifying the Differences Between Deliberate Practice and Other Types of Practice.
Journal of Sports Sciences 38(2), 159-176 DOI: 10.1080/02640414.2019.1688618
Fadum EA, Strand LA, Rudvin I, Hæreid ML, Borud EK. (2020) The Norwegian Armed Forces
Health Registry conscription board health examinations 1968-2018. Scand J Public
Health. 28:1403494820920412. doi: 10.1177/1403494820920412. Epub ahead of print.
PMID: 32466714.
Forces, T. C. A. (2014). Fitness for Operational Requirements of CAF Employment (1st ed.).
Online: The Canadian Armed Force.
Gagnon P, Spivock M, Reilly T et al. (2015). The FORCE fitness profile — adding a measure of
health-related fitness to the Canadian armed forces operational fitness evaluation. J
Strength Cond Res; 29(Suppl. 11):S192–S198. http://dx.doi.org/10.
1519/JSC.0000000000001163
Gagnon, P., MSc, Reilly, T., PhD, & Stockbrugger, B., MSc. (2015). Bridging the Gap between
Universality of Service and the Physical Demands of Combat Operations –
FORCEcombat. Paper presented at the Canadian Institute Military Veterans Heath
Research Forum, Vancouver, Canada.
Going, S. B., Massett, M. P., Hall, M. C., Bare, L. A., Root, P. A., Williams, D. P., et al. (1993).
Detection of Small Changes in Body Composition by Dual-Energy X-Ray
Absorptiometry. Am J Clin Nutr, 57, 845-850.
Goodale, T. (2018, May 21). Key Performance Indicators for Tactical Athlete Performance:
Understanding KPI’s for military athletes [Conference presentation]. OUA AGM,
Toronto, On, Canada.
Halson, S.L. (2014) Sleep in Elite Athletes and Nutritional Interventions to Enhance Sleep.
Sports Medicine, 44, 13-23.
Hintze, L.J. (2019). NRMU- Body Composition and Anthropometric Measures Protocol.
University of Ottawa, School of Human Kinetics, p:1-8.
Hydren, J. R., Borges, A. S., Sharp, M. A. (2017). Systematic Review and Meta-Analysis of
Predictors of Military Task Performance: Maximal Lift Capacity. J Strength Cond Res,
31(4), 1142-1164.
Hopkins, M., Blundell, J.E. (2016). Energy balance, body composition, sedentariness and
appetite regulation: pathways to obesity. Clinical Sciences London 130(18),1615–1628.
doi: https://doi.org/10.1042/CS20160006

53
Hopkins, W. G. (2000). Measures of reliability in sports medicine and science. Sports Med, 30,
1-15.
Horber, F. F., Thomi, F., Casez, J. P., Fonteille, J., & Jaeger, P. (1992). Impact of hydration
status on body composition as measured by dual energy X-ray absorptiometry in normal
volunteers and patients on haemodialysis. Br J Radiol, 65, 895-900.
Horvat, M., Ramsey, V., Franklin, C., Gavin, C., Palumbo, T., & Glass, L. A. (2003). A method
for predicting maximal strength in collegiate women athletes. J Strength Cond Res, 17(2),
324-328.
Ina Garthe, Truls Raastad, Per Egil Refsnes & Jorunn Sundgot-Borgen (2013) Effect of
nutritional intervention on body composition and performance in elite athletes, European
Journal of Sport Science 13 (3), p. 295-303, doi: 10.1080/17461391.2011.643923
Ingjer, F. (1991). Maximal oxygen uptake as a predictor of performance ability in women and
men elite cross-country skiers. Scandinavian Journal of Medicine & Science in Sports,
1(1), 25-30. doi:10.1111/j.1600-0838.1991.tb00267.x
Jones GH, Murphy R, Agrawal S, Isles MG. (2015) ENT entry requirements for UK armed
forces. J Laryngol Otol. 129(9):831-4. doi: 10.1017/S0022215115001875. PMID:
26314318.7
Jowett, S., Poczwardowski, A. (2007) Understanding the coach-athlete relationship. Social
Psychology in Sport 17(3), 3-12.
Jowett, S. (2007). Interdependence Analysis and the 3+1Cs in the Coach-Athlete
Relationship. In S. Jowette & D. Lavallee (Eds.), Social Psychology in Sport (p. 15–27).
Human Kinetics.
Lee KS, Hwang J. (2019) Investigation of grip strength by various body postures and gender in
Korean adults. Work. 62(1),117-123. doi: 10.3233/WOR-182846. PMID: 30689595
Kim J, Wang Z, Heymsfield SB, Baumgartner RN, Gallagher D. Total-body skeletal
muscle mass: estimation by a new dual-energy X-ray absorptiometry method. Am J Clin
Nutr. 2:378-83.
Knechtle, B., Knechtle, P., Rust, C. A., Rosemann, T., & Lepers, R. (2012). Age, training, and
previous experience predict race performance in long-distance inline skaters, not
anthropometry. Percept Mot Skills, 114(1), 141-156. doi:10.2466/05.pms.114.1.141-156
Kuta, I. (1970). Muscle strength and lean body mass in old men of different physical activity.
Journal of Applied Physiology, 29(2), 168-171. Retrieved from
www.physiology.org/journal/jappl at Univ of Ottawa (137.122.064.157)
Lewis DA, Kamon E, Hodgson JL. (1986) Physiological differences between genders.
Implications for sports conditioning. Sports Med. 3(5), 357-69. doi: 10.2165/00007256-
198603050-00005

54
Nottrodt, J. W., & Celentano, E.J. (1987). Development of predictive selection and placement
tests for personnel evaluation. Applied Ergonomics. 18(4), 279-288. doi:
http://dx.doi.org/10.1016/0003-6870(87)90135-9
Mageau, G.A., Vallerand, R.J. (2003) The Coach–Athlete Relationship: A Motivational Model,
Journal Sports Sciences, 21(11), 883-904, DOI: 10.1080/0264041031000140374
Marcos-Pardo, P.J., Orquin-Castrillón, F.J., Gea-García, G.M. et al. (2019). Effects of a
moderate-to-high intensity resistance circuit training on fat mass, functional capacity,
muscular strength, and quality of life in elderly: A randomized controlled trial. Sci
Rep 9(7830) https://doi.org/10.1038/s41598-019-44329-6
Mauger, A. R., Jones, A. M., & Williams, C. A. (2009). Influence of Feedback and Prior
Experience on Pacing during a 4-km Cycle Time Trial. Medicine & Science in Sports &
Exercise, 41(2), 451-458. doi:10.1249/MSS.0b013e3181854957
Maughan, R. J., Watson, J. S., & Weir, J. (1983). Strength and cross-sectional area of human
skeletal muscle. The Journal of Physiology, 338(1), 37-49.
doi:10.1113/jphysiol.1983.sp014658
Marriot, B.M., & Grumstrump-Scott, J. (1992) Committee on military nutrition research: body
composition and physical performance (Special Report DAMDl7-92-J-2003). U.S. Army
Medical Research & Development Command
McBride, Jeffrey M; Blow, Daniel; Kirby, Tyler J; Haines, Tracie L; Dayne, Andrea M; Triplett,
N Travis Relationship Between Maximal Squat Strength and Five, Ten, and Forty-Yard
Sprint Times (2019), Journal of Strength and Conditioning Research, 23(6) 1633-1636.
doi: 10.1519/JSC.0b013e3181b2b8aa
Mello, R., Nindl, B., Sharp, M., Rice, V., Bills, R., & Patton J. (1995). Predicting Lift and Carry
Performances from Muscular Strength, Anaerobic Power and Body Composition
Variables. Medicine & Science in Sports in Sports & Exercise, 27(5), S152.
Muyor JM, Arrabal-Campos FM. (2016) Effects of Acute Fatigue of the Hip Flexor Muscles on
Hamstring Muscle Extensibility. Journal of Human Kinetics. 14(53), 23-31. doi:
10.1515/hukin-2016-0007. PMID: 28149407
Oksana Matvienko, Douglas S. Lewis, Elisabeth Schafer, A College Nutrition Science Course As
An Intervention To Prevent Weight Gain In Female College Freshmen (2001). Journal of
Nutrition Education 33 (2), p. 95-101, https://doi.org/10.1016/S1499-4046(06)60172-3
Olson, KayLoni L. MA; Emery, Charles F. PhD (2015). Mindfulness and Weight Loss.
Psychosomatic Medicine, 77 (1) p 59-67 doi: 10.1097/PSY.0000000000000127
Pawlak, R., Clasey, J., Palmer, T., Symons H., Thorburn B., Abel, Mark G. (2015) The Effect of
a Novel Tactical Training Program on Physical Fitness and Occupational Performance in
Firefighters, Journal of Strength and Conditioning Research, 18(3), 578-588 doi:
10.1519/JSC.0000000000000663

55
Pisciottano, M.V.C. (2014). The relationship between lean mass, muscle strength and physical
ability in independent healthy elderly women from the community. The Journal of
Nutrition, Health and Aging, 18(5), 554-558.
Radcliffe JN, Comfort P, Fawcett T. (2018) The Perceived Psychological Responsibilities of a
Strength and Conditioning Coach. J Strength Cond Res 32(10), 2853-2862. doi:
10.1519/JSC.0000000000001656. PMID: 27669186.
Reilly, T., Blacklock, R., Newton, P., Olinek, S., O'Hearn, K., & Spivock, M. (2013). Project
FORCE Phase II Report: Physical Demands of common, essential, physically demanding
tasks in the CF. Ottawa.
Reilly T, Walsh E, Stockbrugger B. (2019) Reliability of FORCE COMBAT™: A Canadian
army fitness objective. J Sci Med Sport 22(5) 591-595.
Reilly, T., Spivock, M., Newton, P., Blacklock, R., & Olinek, S. (2012). Project FORCE Phase 2
Report: Characterisation of demands of common essential physically demanding tasks in
the CF. Retrieved from
https://www.cfmws.com/en/AboutUs/PSP/DFIT/Fitness/Documents/Phase%20II%20Fin
al%20Report%20Jun%207%202013.pdf?Mobile=1&Source=%2Fen%2FAboutUs%2FP
SP%2FDFIT%2FFitness%2F_layouts%2Fmobile%2Fview.aspx%3FList%3Df2f67371-
9d24-4d91-b191-625c38a5d35b%26View%3D6b3b4aca-5a55-4957-ab26-
e7280f986908%26CurrentPage%3D1
Research and Technology Organisation North Atlantic Treaty Organisation (2009). Optimizing
Operational Physical Fitness, BP 25, F-92201 Neuilly-sur-Seine Cedex, France.
Roberts D., Gebhardt D., Gaskill S., et al. (2016). Current considerations related to physiological
differences between the sexes and physical employment standards. Journal of Applied
Physiology Nutrition Metabolism, 2(S) p.108–S120. doi: 10.1139/apnm-2015-0540.
Sanchez, J.M., Borras, P.J., Lorenzo, A., Leite, N. (2009). The coach-athlete relationship in
basketball: Analysis of the Antecedents Componemts and Outcomes. Revista de
Psicología del Deporte, 18(3), 349-352.
Sánchez-Muñoz, C., Sanz, D., & Zabala, M. (2007). Anthropometric characteristics, bod
composition and somatotype of elite junior tennis players. British Journal of Sports
Medicine, 41(11), 793-799. doi:10.1136/bjsm.2007.037119
Sandbakk, O., & Holmberg, H. C. (2014). A reappraisal of success factors for Olympic cross-
country skiing. Int J Sports Physiol Perform, 9(1), 117-121. doi:10.1123/ijspp.2013-0373
Simpson, N.S., Gibbs, E.L, Matheson, G.O. (2017). Optimizing sleep to maximize performance:
implications and recommendations for elite athletes. Scandanavian Journal of Medicine
and Sport, 27(3) p266-274. https://doi.org/10.1111/sms.12703
Sell, TC. (2010). Warrior model for human performance and injury prevention: eagle tactical
athlete program. Journal of Special Operations Medicine, 10(4), 22-33.

56
Spivock, M., Reilly, T., Newton, P., Blacklock, R., & Jaenen, S. (2011). Project FORCE Phase I
Report: Identification of common, essential, physically demanding tasks in the CF.
Tanda, G., & Knechtle, B. (2015). Effects of training and anthropometric factors on marathon
and 100 km ultramarathon race performance. Open Access Journal of Sports Medicine, 6,
129-136. doi:10.2147/OAJSM.S80637.
Tangen GG, Robinson HS. (2019) Measuring physical performance in highly active older adults:
associations with age and gender? Aging Clin Exp Res. 2(2), 229-237.
Thompson, M. A. (2017). Physiological and Biomechanical Mechanisms of Distance Specific
Human Running Performance. Integr Comp Biol, 57(2), 293-300. doi:10.1093/icb/icx069
Thomsen, T. K., Jensen, V. J., & Henriksen, M. G. (1998). In vivo measurement of human body
composition by dual-energy X-ray absorptiometry (DXA). Eur J Surg, 164, 133- 137.
Tingelstad, H. (2016). Explaining performance on military tasks in the Canadian armed forces:
the importance of morphological and physical fitness characteristics. Military Medicine,
181(11-12), 1623-1629. Retrieved from https://doi.org/10.7205/MILMED-D-15-00458

57
CHAPTER 7—APPENDICIES

58
APPENDIX A: Schematic Representation of Research Objectives

59
APPENDIX B: DEXA Body Composition and Anthropometrics Protocol
30 min before the subject arrives
DXA calibration – QA
Click on: Prodigy > Directory > QA > Start > Place the QA block> Press Ok> once you get a green
light, you can close the page > select the data set > click on new participant if the participant is
new. If it is a retest find the participant info, click on ‘edit’
Set up InBody
Participant arrives
Screening questions – make sure the participant followed the instructions for testing
Ask for participant empty their bladder, if needed
Ask for participant get changed (Hospital gowns)
Measures of height, weight, waist circumference
Measure Body Composition – In Body
Check participant hydration levels
Measure Body composition – DXA
Procedures for DEXA scan: Following the NHANES procedures (2013)
During the scan
Follow the usual positioning for a DEXA scan including:
• Body down midline of scanner
• Head re-aligned (as close as possible to the top of the scan for taller individuals

60
(≥175cm)
• Shoulders Square
• Ankles pulled to straighten spine
• Stacked fingers with hands creating a straight line (no curved hands for hand & finger length
measurements)
• Palms hand down do not touch the hips or trunk, straight fingers inside the scan area
• Make sure the hands are not and the shoulders are not hunched • Strap around ankles with legs
together
• Arms away from body (as much as possible)
• Feet together and relaxed condition (ensure toes are within scan)
Save
Anthropometric measures following ISAK procedures:
Circumferences: waist, arm relaxed, arm flexed and tensed, calf
Skin Folds: triceps, subscapular, medial calf, supraspinale
Width measures: humerus and femur
See figures in the end of the doc for procedures for each measure

61
Post-processing and ROIs - follow Bazzochi et al (2016):
Regarding post-processing manipulation the exact positioning of the ROIs is defined as follows:
(1) Head line (one horizontal line) has to be placed just below the lower boundary of the chin bone.
(2) Pelvis line (one horizontal line) has to be placed just above the upper boundaries of the iliac
crests.
(3) Trunk lines (two vertical upper lines, each for side) have to be placed around
the chest/abdomen and have to separate the arm ROIs from the trunk and android ROIs: the
upper portion of each line is called shoulder cut lines and have to bisect the humeral-scapula joint.
Avoid including any arm soft tissue in the body ROIs. (4) Hip lines (two vertical lower lines, each for
side) have to be placed around the hip/lower limb and have to separate the arm ROIs from the leg
and gynoid ROIs. Avoid including any arm soft tissue in the body ROIs.
(4) Spine lines (two vertical lines, each for side) have to be placed just lateral the vertebral bone
profile, in order to include all spine.
(5) Leg line (one vertical line) has to evenly divide the legs and the feet. (6) Groin lines (two angled
lines, each for side) have to pass through the femoral neck.
See figure in the end of the doc to check the placement of the ROIs. Print DXA results
POST ASSESSMENT CALCULATIONS:
Muscle Mass Estimation:
Total Skeletal Mass = (1.13 * ALST) - (0.02 * age) + (0.61 * sex) + 0.97
ALST: appendicular lean soft tissue (Arm lean body mass + Leg lean body mass (g)) Age: years
Sex: 0 = Female, 1 = male
(Kim et al., 2002)
Body Volume: (FM in grams/ 0.84) + (LBM/1.03) + (BMC/11.63)-3.12 (Smith-Ryan et al., 2017)
Surface Area: 0.20247 * (Height in m 0.725) x (Weight in Kg 0.425) (Dubois & Dubois, 1916)

62
Analyze DXA ROI’s for length: click on
Custom ROIs
1. Immediately after printing the results, click Analyze > Custom
• Standard will be checked by default
• Click on ‘custom’
• The template should show up (4 lines to measure humerus and femur length) • If the template
does not show up, click on ‘open’>ok>Ideas>Select ‘Length IDEaS’ • Click on ‘results’ > ROIs >
choose the 4th icon ‘Move/Size ROI
• Move the ROIs to measure humerus and femur lengths – results in cm will show up at the left
side of the screen in height (cm) write down the results as they are not saved when printed.
ROIs positioning is defined as follows:
1) HUMERUS: Bone edges will be detected visually (after enlargement of the image). Draw a
straight line across the humerus, considering the starting point the head of the humerus and the
ending point the joint space from medial to lateral epicondyle (Clark, Ness & Tobias, 2007)
2) FEMUR: Draw a straight line across the femur, considering the starting point the head of the
femur and the ending point the joint space from medial to lateral condyle (Chinappen-Horsley et
al., 2007)
Print 2 copies BIA (one for the participant)
Print 2 copies DXA
Enclose body composition results to the participant binder

63
REFERENCES:
Bazzocchi A, Ponti F, Albisinni U, Battista G, Guglielmi G. DXA: Technical aspects and
application. Eur J Radiol. 2016 Aug;85(8):1481-92.
Chinappen-Horsley U1, Blake GM, Fogelman I, Spector TD. A method for determining skeletal
lengths from DXA images. BMC Musculoskelet Disord. 2007 Nov 16;8:113.
Clark EM1, Ness AR, Tobias JH. Gender differences in the ratio between humerus width and length are established prior to puberty. Osteoporos Int. 2007 Apr;18(4):463-70.
Dubois D, Dubois EF. A formula to estimate the approximate surface area if height and weight
be known. Arch Intern Med (Chic) 17: 863–871, 1916.
Kim J, Wang Z, Heymsfield SB, Baumgartner RN, Gallagher D. Total-body skeletal muscle
mass: estimation by a new dual-energy X-ray absorptiometry method. Am J Clin Nutr. 2002
Aug;76(2):378-83.
Norton K, Olds T, eds. Anthropometrica. Sydney:University of New South Wales Press,
1996:147–70
Shiel F, Persson C, Simas V, Furness J, Climstein M, Schram B. Investigating the level of
agreement of two positioning protocols when using dual energy X-ray absorptiometry in the
assessment of body composition. PeerJ. 2017 Oct 16;5:e3880.
Smith-Ryan AE, Mock MG, Ryan ED, Gerstner GR, Trexler ET, Hirsch KR. Validity and reliability of a 4-
compartment body composition model using dual energy x-ray absorptiometry-
derived body volume. Clin Nutr. 2017 Jun;36(3):825-830.

64
APPENDIX C: Detailed Descriptions of FORCEcombat Procedures
DETAILED DESCRIPTION OF FORCEcombat PROCEDURES
The FORCE combat circuit consists of four military tasks, performed in a continuous manner,
The four tasks are 20 meter rushes, sandbag lifts, intermittent loaded shuttles and a sandbag
drag. The course is constructed so that the participant can easy and quickly transition between
the tasks. A timer is started at the commencement of the 20 metre rushes and stopped once the
sandbag drag is completed, and the performance measures is total time to complete the four
tasks. Participants will be wearing battle order minus the day pack (military boots and uniform
(including cotton undershirt and socks), fragmentation vest, tactical vest, helmet and a Colt 7
replica rubber rifle, for a total external load of ~25 kg) when performing the FORCEcombat test.
Prior to starting the FORCEcombat circuit, each participants is given a detailed walkthrough of
how to perform each component of the circuit. The measurement of maximal performance on the
FORCEcombat will start within 5 min of completion of the loaded march.
20-meter rushes
The participant starts by lying face down on the floor in the prone position, holding the replica
rifle in their hands. The participant lies facing the opposite end, with their shoulders and hands
behind the start line. The evaluator counts down from three to one, before giving the “GO”
signal. On the “GO” signal the participants will get up off the floor and run the 10 meters to the
first marked line on the floor, 10 meters away. The participant will have to touch the line with
their foot, step back, and get down into a prone position, with both hands on the replica rifle. As
the evaluator confirms that both hands are on the replica refile, the “UP” signal is given, and the
participants gets up and runs to the next red line on the floor, 10 meters away. Here the
participant again touches the line, steps back, and gets into the prone position, with two hands on
rifle. Once this position is confirmed by the evaluator, the participant again gets the “UP” signal,
gets up, turns around and runs back toward the starting line. As the participant reaches the red
line 10 meters away, they will again touch the line with their foot, get into the prone position and
follow the same procedure as previously described. The 20-meter rushes task continues until the
participant has covered 80 meters, 4x20 meter rushes (Figure S1).

65
Sandbag Lifts
Immediately following the completion of the 20 meter rushes, the participant will sling the
replica rifle onto their back, and move over to sandbag lift station. When setting up the
FORCEcomabt test, using marking tape, a shape equal to what seen in Figure S2, is drawn on a
wall. Two sandbags are place on the floor, 125 cm apart, right on top of the red lines marked on
the floor. Each sandbag weighs 20 kg each, and the participant has to use two hands, one on each
side of the sandbag when they are lifting. The participant is informed not to use the handle on top
of the sandbag prior to starting the FORCEcomabt course. The participant must immediately
start the sandbag lifts, lifting the first sandbag 100 cm, to touch the horizontal line drawn on the
wall. Once the participants taps the redline with the sandbag, the evaluator counts the sandbag,
and the participant can drop the sandbag, and shuttle to the side and pick up the next sand bag.
The participant keep shuttling side to side, each time picking up a sandbag, and lifting it to tap
the red line, before dropping it. This motion is repeated until 30 sandbags have been lifted. The
evaluator is counting each sandbag, and monitoring that each sandbag touches the red line. In
cases where the participants loses control of the sandbag with one hand, and the bag ends up
vertically, the whole bag needs to be lifted above the red line. Touching the red line with a bag
hanging vertically will not be approved.

66
Intermittent Loaded Shuttle
Following the completion of the 30 sandbag lifts, the participants return to the same course used
for the 20 meter shuttle. At the starting line, the participant will pick up a sandbag (20 kg), and
carry it around the marked course (40 meters). The participant will walk the 20 meter course, red
line to red line, carrying the sandbag in their hands, on their shoulder, or using the handle on top
of the sandbag. At the end of the course (20 meters) the participant will turn around a pylon
placed on the red line, and walk the 20 meters back to the starting line. The participants is
prohibited from running while carrying the sandbag. Once the participants crosses the starting
line, the participant drops the sandbag, turns around, and completes the same course without the
sandbag (unloaded). During the unloaded part the participant is allowed to run. After completing
the course unloaded, the participant crosses the starting line (on the way back), picks up the
sandbag, and starts another loaded shuttle. The participants completes 5 loaded shuttles,
intermitted by 5 unloaded shuttles, for a total of 400 meters. A depiction of the intermittent
loaded shuttle task can be seen in Figure S3.

67
Sandbag Drag Protocol
Following the completion of the last unloaded shuttle, the participant must immediately start the
sandbag drag. The sandbag drag will be setup according to what is depicted in Figure S4A and
B. The total force required to drag the sandbags on the floor should be equal to 330 newton
(~100 kg). The total weight of the drag must be adjusted depending on friction of the floor
surface to match 330 newton. The participant starts by picking up the “carry” sandbag, with an
underhand grip, cradling the sandbag. The participant precedes to start pulling the sandbags as
fast as the can down the 20 meter course, walking backwards. The evaluator are required to
guide the participant, to make sure they stay on straight course and don’t walk into anything. The
participants continue the drag until the front tip of the sandbag drag (not the participant holding
the sandbag, or the sandbag held by the participant) crosses the finish line, as seen in Figure
S4B. This marks the spot where the evaluator stops his timer, and the total time to complete the
FORCEcombat course is recorded.

68
References:
Forces, T. C. A. (2014). Fitness for Operational Requirements of CAF Employment (1st ed.).
Online: The Canadian Armed Force.

69
APPENDIX D: Sandbag Filling and Sandbag Drag Calibration Process
TOOL 1 – SANDBAG FILLING PROCESS
NOTE: As recommended by Preventative Medicine, please avoid the use of sand containing silica (silicon
dioxide). Workplace Hazardous Materials Information System (WHMIS) classifies silica as D2A – Very
Toxic (Carcinogenicity). The health hazards associated with this product include cancer through chronic
inhalation, respiratory irritation, damage to lungs through prolonged or repeated inhalation, and eye
irritation.
Please ensure that the sand you purchase and use to fill the sandbags is “playground” sand, and free of
silica. Request a Safety Data Sheet (SDS) or Material Safety Data Sheet (MSDS). We recommend that you
take time to inform yourself and your staff on the implications of silica by using the following links:
About Silica: http://www.ccohs.ca/oshanswers/chemicals/chem_profiles/quartz_silica.html
WHMIS 2015 – Safety Data Sheet: https://www.ccohs.ca/oshanswers/chemicals/whmis_ghs/sds.html
Globally Harmonized System (GHS): http://www.ccohs.ca/oshanswers/chemicals/ghs.html
Should you have any questions or concerns on this topic, please contact your local Preventative
Medicine Advisor.
Complete the following steps to properly fill the FORCE sandbags (photo below):
1. Insert the plastic inner sleeve into the black outer sleeve
2. Place 20 kg of playground sand (see note above) inside the plastic inner sleeve
3. Weigh the sandbag with a calibrated floor scale. The weight must be 20 kg, plus or minus 0.2 kg; 4.
Remove the air from the plastic inner bag
5. Twist the top of the plastic inner bag and seal it with duct tape; and 6. Feed the rope through the
loops and tie off the sleeve tightly.

70
TOOL 2 – SANDBAG DRAG SURFACE CALIBRATION
SANDBAG DRAG
1. This component of the FORCE Evaluation has a strong predictive relationship with the common
operational task of extricating a casualty from a vehicle. The performance standard is based on this
predictive relationship and equates to safely removing a CAF personnel of average weight.
Research
2. Dragging four sandbags across a foam mat surface requires a minimal force of 330N (33.6 kg / 75 lbs)
and is linked with the performance standard for the Vehicle Extrication task of an 86 kg (~190 lb)
casualty rescue. Various sandbag configurations have been tested to ensure 330N is maintained across
the most common indoor testing surfaces.
Approved Surfaces
3. To be appropriate for a valid FORCE Evaluation, the chosen surface should be clean, dry, hard, flat,
smooth, and uniform across a 25 m section. Hardwood gym floors, polished concrete floors, rubber
cushioned flooring, vinyl tile, taut vinyl mats and rubberized tracks have all been tested and approved
for use with minor weight modifications to ensure a consistent drag force.

71
Adjustments
4. Additional weight may need to be added to achieve the required drag force. The force required to
move the sandbags is much less than the weight added and therefore adding full sandbags and / or 10
kg Olympic plates should be sufficient for all approved surfaces.
Surfaces to Avoid
5. Carpets, rough concrete, asphalt, grass, and ceramic tile have not been approved because the force is
too variable or causes significant damage to the sandbag’s fabric.
6. Alternative options are being researched and additional suggestions will be considered.
Additional Variables
7. In addition to selecting an appropriate testing surface, Evaluators need to be aware of the other
factors that could significantly influence the physical demand of the drag. a. Temperature / humidity b.
Degradation in the sandbag or floor surface c. Peeling floor tape d. Water leaks or spills e. Uneven floor
surface
Scale
8. The Heys xScale Luggage Scale is the approved calibration tool for the FORCE evaluation sandbag
drag.
Calibration
9. Prior to each FORCE evaluation session, the sandbag drag task must be calibrated. Complete the
following steps to ensure proper calibration:
a. A visual check of the evaluation area
b. Verify that the Heys xScale Luggage Scale is in good working order and accurately measures
the weight of a 20 kg sandbag (compare values with calibrated sandbag weighing scale)
c. Ensure the sandbags used for the drag have been calibrated to a weight of 20 kg (+/- 0.2 kg)
and are properly connected to one another, as outlined in Chapter 3: FORCE combat Set-Up; d. Hook the
Heys xScale to the red straps that connect the sandbags; NOTE: The carrying sandbag is not attached
during the calibration of the sandbag drag.
e. Drag the sandbags SLOWLY (i.e., the bags should barely move) while holding the Heys xScale 1
metre from the ground until you obtain a stable reading
f. Ideally, the Heys xScale will beep once a stable signal has been detected
g. To accurately replicate the minimum drag force required for a valid FORCE Evaluation, the
Heys xScale screen should read 33.6 kg (+/- 1 kg); and h. Record the measurement on Tool 3 –
Calibration Log.
References: Forces, T. C. A. (2014). Fitness for Operational Requirements of CAF Employment (1st ed.).
Online: The Canadian Armed Force.

72
APPENDIX E: Factors Related to Improving Tactical Athlete Physical
Performance. Elements That Influence the Expression of Technical and
Tactical Execution

73
APPENDIX F: Ethics Approval Notice for Thesis Project

74
File Number: H05-16-13 Date (mm/dd/yyyy): 09/19/2018
Université d’Ottawa University of Ottawa Bureau d’éthique et d’intégrité de la recherche Office
of Research Ethics and Integrity
Ethics Approval Notice
Health Sciences and Science REB
Principal Investigator / Supervisor / Co-investigator(s) / Student(s)
First Name Last Name Affiliation Role François Haman Health Sciences / Human Kinetics Principal Investigator Ryan
Graham Health Sciences / Human Kinetics Co-investigator Jessica Fortin-Lacombe Health Sciences / Human Kinetics
Research Assistant Brian Keho Health Sciences / Human Kinetics Research Assistant Chris Kocsis Health Sciences / Human
Kinetics Research Assistant Matthew Mavor Health Sciences / Human Kinetics Research Assistant Kevin M. Semeniuk
Health Sciences / Physiotherapy Project Coordinator
File Number: H05-16-13
Type of Project: PhD Thesis
Title: Long Duration Loaded March: The Effects of Previous Experience and Heat Exposure on Mechanical Efficiency
Renewal Date (mm/dd/yyyy) Expiry Date (mm/dd/yyyy) Approval Type 09/19/2018 09/18/2019
Renewal
Special Conditions / Comments: N/A
1
550, rue Cumberland, pièce 154 550 Cumberland Street, room 154
Ottawa (Ontario) K1N 6N5 Canada Ottawa, Ontario K1N 6N5 Canada
(613) 562-5387 • Téléc./Fax (613) 562-5338
www.recherche.uottawa.ca/deontologie/ www.research.uottawa.ca/ethics/ File Number: H05-16-13 Date (mm/dd/yyyy): 09/19/2018

75
Université d’Ottawa University of Ottawa Bureau d’éthique et d’intégrité de la recherche Office of Research Ethics and Integrity
This is to confirm that the University of Ottawa Research Ethics Board identified above, which operates in accordance with the Tri - Council Policy Statement (2010) and other applicable laws and regulations in Ontario, has examined and approved the ethics application for the above named research project. Ethics approval is valid for the period indicated above and subject to the conditions listed in the section entitled “Special Conditions / Comments”.
During the course of the project, the protocol may no t be modified without prior written approval from the REB except when necessary to remove participants from immediate endangerment or when the modification(s) pertain to only administrative or logistical components of the project (e.g., change of telepho ne number). Investigators must also promptly alert the REB of any changes which increase the risk to participant(s), any changes which considerably affect the conduct of the project, all unanticipated and harmful events that occur, and new information t hat may negatively affect the conduct of the project and safety of the participant(s). Modifications to the project, including consent and recruitment documentation, should be submitted to the Ethics Office for approval using the “Modification to researc h project” form available at: https://research.uottawa.ca/ethics/forms .
Please submit an annual report to the Ethics Office four weeks before the above - referenced expiry date to request a renewal of this ethics approval. To close the file, a final report must be submitted. These documents can be found at: https://research.uo ttawa.ca/ethics/forms .
If you have any questions, please do not hesitate to contact the Ethics Office at extension 5387 or by e - mail at: [email protected] .
Signature:
Marc Alain Bonenfant Research Ethics Coordinator For Catherine Paquet, Director of the Office of Research Ethics and Integrity
2
550, rue Cumberland, pièce 154 550 Cumberland Street, room 154 Ottawa (Ontario) K1N 6N5 Canada Ottawa, Ontario K1N 6N5 Canada
(613) 562 - 5387 • Téléc./Fax (613) 562 - 5338 www.recherche.uottawa.ca/deontologie/ www.research.uottawa.ca/ethics/
Copyright © 2022 FDOKUMEN