The syntheses of a few curare-like bis-ammonium derivatives ...
Upload
independentCategory
view
5download
0
ACPD4, 2949–2971, 2004
Ammonium sulfate –malonic acid
aerosols
C. F. Braban andJ. P. D. Abbatt
Title Page
Abstract Introduction
Conclusions References
Tables Figures
J I
J I
Back Close
Full Screen / Esc
Print Version
Interactive Discussion
© EGU 2004
Atmos. Chem. Phys. Discuss., 4, 2949–2971, 2004www.atmos-chem-phys.org/acpd/4/2949/SRef-ID: 1680-7375/acpd/2004-4-2949© European Geosciences Union 2004
AtmosphericChemistry
and PhysicsDiscussions
A study of the phase transition behaviorof mixed ammonium sulfate – malonicacid aerosolsC. F. Braban1 and J. P. D. Abbatt2
1Centre for Atmospheric Sciences, Department of Chemistry, Lensfield Road, University ofCambridge, Cambridge, CB2 1EW, UK2Department of Chemistry, University of Toronto, Toronto, ON, M5S 3H6, Canada
Received: 22 March 2004 – Accepted: 3 May 2004 – Published: 2 June 2004
Correspondence to: J. P. D. Abbatt ([email protected])
2949

ACPD4, 2949–2971, 2004
Ammonium sulfate –malonic acid
aerosols
C. F. Braban andJ. P. D. Abbatt
Title Page
Abstract Introduction
Conclusions References
Tables Figures
J I
J I
Back Close
Full Screen / Esc
Print Version
Interactive Discussion
© EGU 2004
Abstract
This is a study into the phase transitions of aerosol composed of the ternary systemammonium sulfate (AS) – malonic acid (MA) – water using infrared extinction spec-troscopy. Twelve compositions were studied in both deliquescence and efflorescencemode experiments. The presence of a MA fraction, by dry mass, (fMA) of 0.1 in an5
AS aerosol altered the relative humidity at which the phase transitions occur in an at-mospherically significant manner. For compositions with 0.25<fMA<0.90, no distinct“deliquescence” was observed, contrary to the observed behavior in the binary sys-tems. The crystallization of both the MA and AS components is suppressed by thepresence of the other component in the aerosol. At fMA=0.9, the crystallization rela-10
tive humidity of MA was lowered from RH=6% to less than 1%. Similarly, at fMA=0.4,the AS component did not crystallize. The atmospheric implications of the results arediscussed.
1. Introduction
The phase of atmospheric aerosol particles is important when trying to determine the15
radiative balance of the atmosphere (IPCC, 2001) as well as for chemical reactionsoccurring heterogeneously in the atmosphere (e.g. Ravishankara, 1997). For exam-ple, N2O5 hydrolysis occurs heterogeneously on aerosol surfaces. This reaction hasbeen shown to be a significant nighttime NOx sink and proceeds much more slowlyon dry solid particles than on aqueous solution droplets, even if highly supersaturated20
(Mozurekewich and Calvert, 1988; Hu and Abbatt, 1997; Kane et al., 2001; Thorn-ton et al., 2003). Hence, it is of great importance to understand phase transitions ofatmospherically relevant aerosol under atmospheric conditions.
Ammonium sulfate (AS) is frequently used as a model tropospheric aerosol due tothe widespread prevalence of ammonium and sulfate species in the troposphere. How-25
ever, it has become evident that atmospheric aerosol is chemically more complex, with
2950
ACPD4, 2949–2971, 2004
Ammonium sulfate –malonic acid
aerosols
C. F. Braban andJ. P. D. Abbatt
Title Page
Abstract Introduction
Conclusions References
Tables Figures
J I
J I
Back Close
Full Screen / Esc
Print Version
Interactive Discussion
© EGU 2004
both organic and mixed inorganic-organic aerosols widely present in the troposphere.Several initial studies have focused on the properties of water-soluble organic com-pounds (WSOC) that are found in the atmosphere. Dicarboxylic acids, which havebeen identified globally in atmospheric aerosol (Yao et al., 2002; Rohrl and Lammel,2001; Narukawa et al., 1999; Narukawa et al., 2002), have been considered by several5
recent phase transition studies (Prenni et al., 2001; Parsons et al., 2004; Braban et al.,2003; Brooks et al., 2002).
Given the chemically mixed nature of aerosol, it is important to understand and quan-tify the effect of organic chemicals on the phase transition behavior of model inorganictropospheric aerosols. To date several studies have considered mixtures of dicarboxylic10
acids and inorganic salts with respect to phase transitions or water uptake. Brooks etal. (2002) completed a study of the deliquescence relative humidities of ternary bulk so-lutions. Choi and Chan (2002) studied the water cycles of dicarboxylic acids with bothsodium chloride and AS using an electrodynamic balance (EDB) technique. Threetandem differential mobility analyzer (DMA) studies have been performed. Cruz and15
Pandis (2000) studied mixtures of glutaric acid and AS. Prenni et al. (2003) studiedthe water uptake of binary AS-dicarboxylic acid mixtures at 3 compositions and Hameriet al. (2002) studied AS with several dicarboxylic acids. Using EDB, Lightstone etal. (2000) focused on the potential heterogeneous effect of succinic acid (SA) cores onthe efflorescence RH (ERH) of mixed ammonium nitrate – SA particles.20
Though several studies have been performed, this work constitutes one of the de-tailed case studies of a three-component aerosol. The first was of the AS-maleic acidaerosol system (Brooks et al., 2002, 2003). Analysis of the results presented hereand comparison with the literature noted above are used to more clearly understandthe possible effects of WSOC on the phase transitions of atmospheric aerosol. In par-25
ticular we focus on the effect of each species in solution on the phase transitions onthe other. In our previous study (Braban et al., 2003) both MA and oxalic acid wereobserved to be stable as highly supersaturated solutions, therefore one immediatequestion was whether the presence of AS would inhibit or promote the crystallization
2951
ACPD4, 2949–2971, 2004
Ammonium sulfate –malonic acid
aerosols
C. F. Braban andJ. P. D. Abbatt
Title Page
Abstract Introduction
Conclusions References
Tables Figures
J I
J I
Back Close
Full Screen / Esc
Print Version
Interactive Discussion
© EGU 2004
of dicarboxylic acid particles. Conversely, would MA suppress the crystallization of AS?This is the first study to consider these processes in terms of the phase transitions ofthe individual components lending insight into the physical processes occurring andtheir relevance for atmospheric aerosol.
2. Experimental5
The Aerosol Flow Tube – Fourier Transform-Infrared spectrometer system (AFT) usedin this work has been previously described (Braban et al., 2003). Aerosol is producedusing a commercial atomizer (TSI Model 3076). A fraction of the aerosol flow is dis-carded while the remainder either passes through a silica gel dryer (TSI 3062) or by-passes the dryer for the deliquescence and efflorescence experimental modes, re-10
spectively. The aerosol flow is mixed with a nitrogen flow, a variable fraction of which issaturated with water vapor. In most experiments the total N2 flow was 2 l.min−1 thoughin some of the efflorescence mode experiments an additional 1 l.min−1 was added tostudy the low RH range in more detail. The total flow (2.3–3.3 l.min−1) then passesthrough a precooler-mixing volume before entering the main aerosol flow tube.15
Experiments are carried out by incrementally increasing or decreasing the RH fordeliquescence-mode or efflorescence-mode experiments, respectively. Both the flowtube and the pre-cooler/mixer are temperature jacketed and controlled using a circula-tor (Julabo FP88-MW). The temperature in the flow tube is measured using two T-typethermocouples. The thermal gradient over the observation region is less than 0.2 K in20
all the experiments performed and generally less than 0.1 K.A length of 60 cm in the flow tube is monitored with the FTIR spectrometer (Bomem
MB104). IR spectra are recorded over the wavenumber range 4000–500 cm−1 with aresolution of 4 cm−1. The RH in the flow tube is measured using a gas-phase waterline calibration, integrating the area under 1710 cm−1–1690 cm−1 (Braban et al., 2003).25
The calibration was carried out in two ways: (i) by mixing of known flows of dry andwater-saturated N2 at constant temperature; (ii) calibration using ice-saturated condi-
2952

ACPD4, 2949–2971, 2004
Ammonium sulfate –malonic acid
aerosols
C. F. Braban andJ. P. D. Abbatt
Title Page
Abstract Introduction
Conclusions References
Tables Figures
J I
J I
Back Close
Full Screen / Esc
Print Version
Interactive Discussion
© EGU 2004
tions between 213 K and 270 K. In general, the confidence level of reported relativehumidities is ±1%.
99.9% assay AS (Fisher) and 99% purity MA (Sigma-Aldrich Chemical Co.) wereused to make the solutions. The percent dry mass composition of the solution wasknown. Compositions are described herein as the dry mass fraction of MA, fMA, i.e.5
fMA=0.1 represents 90% AS/10% MA. Infrared (IR) spectra were recorded as an aver-age of 50 scans. From the IR spectrum the RH is measured using the gas phase waterline calibration, as described above. The condensed-phase features of the aerosol IRspectrum are used to determine the phase state of the aerosol, and in particular thepoint at which phase transitions of the components occur.10
3. Results
3.1. Ammonium sulfate + malonic acid infrared spectra
In this study 12 solutions containing compositions between 100% AS and 100% MAwere studied. In Figs. 1 and 2, IR spectra for 5 compositions (A–E) of AS and MA arepresented at RH<1% and RH>80%, respectively. Gas phase water lines have been15
subtracted for clarity from the high RH spectra. Compositions A–E shown in each figureare fMA=0.10, 0.25, 0.49, 0.75 and 0.90. The AS component of the aerosol will beconsidered first. In Figs. 1 and 2, spectrum A, absorption features are seen between2800–3300 cm−1, 1420–1450 cm−1, 1115 cm−1 and 620 cm−1 corresponding to N-Hstretch modes, NH+
4 deformation mode and two sulfate bands, respectively (Cziczo20
and Abbatt, 1999). These features are present as the fraction of MA is increaseduntil fMA=0.90, where the AS features are not discernable. The NH+
4 mode in Fig. 1Apresent at 1420 cm−1 is indicative of AS in the crystalline phase. The correspondingmode in Fig. 2A at 1455 cm−1 is indicative of the salt being in solution.
As the fraction of MA is increased changes are observed in the AS modes in the25
IR spectrum, specifically under the driest conditions (i.e. the spectra shown in Fig. 1,
2953

ACPD4, 2949–2971, 2004
Ammonium sulfate –malonic acid
aerosols
C. F. Braban andJ. P. D. Abbatt
Title Page
Abstract Introduction
Conclusions References
Tables Figures
J I
J I
Back Close
Full Screen / Esc
Print Version
Interactive Discussion
© EGU 2004
RH<1%) the AS modes are different from when fMA>0.25. In fact the changes occurwhen fMA>0.20 (spectrum not shown). When fMA>0.20, the AS modes are broaderand the NH+
4 mode at 1420 cm−1 is shifted to higher wavenumbers (seen in Fig. 1Cand D) and there is also a side peak evident (∼1050 cm−1) on the broadened modeat 1105 cm−1. This is thought to be indicative of the AS component or a significant5
fraction of it, being aqueous rather than crystalline, i.e. at RH<1% the AS componentdoes not fully crystallize out. This will be more fully discussed in Sect. 3.2. In Fig. 2, theAS is clearly in the aqueous phase and the AS modes are broadened and decreasedin intensity, with the AS mode shifted to ∼1450 cm−1. Condensed phase H2O featurescan be seen between 2500–3500 cm−1, ∼1600 cm−1 and <1000 cm−1, being the OH10
stretch, the H-O-H bending mode and the H-bonding librations, respectively.In considering the MA component of the aerosol, in Fig. 1A, the carbonyl stretch at
∼1720 cm−1 due to the MA is just observable. As the fraction of MA is increased, thismode increases in intensity and other IR features due to MA become apparent in the IRspectrum between 2000 and 1000 cm−1. In our previous aerosol studies, the carbonyl15
resolves into the two peaks at 1749 cm−1 and 1686 cm−1 when the MA is dry andcrystalline (Braban et al., 2003). Also, features between 1500 and 1000 cm−1 are sharpand well resolved, and the modes at 912 and 630 cm−1 are present. The MA does notappear to be fully crystalline from the spectra at RH<1%, except at fMA=0.90 (Fig. 1E).It is thought that this is not due to the low intensity of the MA features in the spectra20
because in other experiments, not presented here, the two peaks of the carbonyl andthe lower wavenumber modes were clearly resolvable if the MA was effloresced evenat very low extinctions.
In a solution containing AS and MA it is possible other salts including ammoniumbisulfate, letovicite and ammonium hydrogen malonate could form if partial dissociation25
of aqueous MA occurs (Note that in a 6 M aqueous solution of MA, 1.5% of the MAis in the form of the singly de-protonated malonate ion MA−; this fraction increasesas the solution becomes more dilute. In 0.1 M, 10% of the MA is dissociated). Theside-peak at 1050 cm−1 in Fig. 1C and D is at the same position as a bisulfate mode
2954

ACPD4, 2949–2971, 2004
Ammonium sulfate –malonic acid
aerosols
C. F. Braban andJ. P. D. Abbatt
Title Page
Abstract Introduction
Conclusions References
Tables Figures
J I
J I
Back Close
Full Screen / Esc
Print Version
Interactive Discussion
© EGU 2004
(Cziczo and Abbatt, 2000), however the most intense peak indicative of bisulfate at1300 cm−1 is notably absent. It is thought that this shoulder is a broadening of the ASmode due to dissolution alone. There is also no evidence of a mode at 1550 cm−1
seen in ammonium malonate and bimalonate IR spectra (Charbonnier and Arnaud,1973; Braban and Abbatt, in preparation, 20041). Therefore, IR observations imply5
that ammonium bisulfate, letovicite or ammoniated malonate species if present, are atvery low levels below our detection limit of a few weight percent.
3.2. Analysis of phase transitions
For each composition, both an efflorescence mode and a deliquescence mode experi-ment were performed at 283 K and 293 K, respectively. In binary solutions, if a particle10
is dry, deliquescence is generally observed at the thermodynamically predicted deli-quescence RH. Similarly for a ternary solution the lowest RH at which the solution isin equilibrium with solid components A and B (in this case AS and MA) can be calcu-lated and measured. This invariant point of the ternary system is called the eutonicdeliquescence RH (EDRH). Brooks et al. (2002) measured the EDRH for the AS-MA15
ternary system with bulk solutions as a function of temperature. Deliquescence modeexperiments presented here were performed at 283 K to differentiate between the bi-nary deliquescence processes, which occur at 283 K at RH∼81%, and the predictedEDRH at RH=73%.
To understand the phase of both the AS and MA components of the aerosol parti-20
cles, the IR spectra were analyzed as a function of RH. In aerosol IR spectra there are2 main types of features that may be analyzed to understand the phase of that com-ponent: the presence of condensed phase H2O and the IR features of the salt/acid.In previous studies the integrated area due to the OH stretch of condensed phase wa-ter has been used for this purpose. For example, in our previous study (Braban et25
1Braban, C. F. and Abbatt, J. P. D.: Phase transitions of multicomponent aerosols, Atmos.Chem. Phys., in preparation, 2004.
2955
ACPD4, 2949–2971, 2004
Ammonium sulfate –malonic acid
aerosols
C. F. Braban andJ. P. D. Abbatt
Title Page
Abstract Introduction
Conclusions References
Tables Figures
J I
J I
Back Close
Full Screen / Esc
Print Version
Interactive Discussion
© EGU 2004
al., 2003) the area under 3500–3000 cm−1 (AH2O), after the subtraction of the lowestRH spectrum, was used to analyze for the presence of condensed phase water. Toaccount for differences in the aerosol populations used in different experiments the in-tegrated area AH2O was normalized to the integrated area at RH=83%, at which pointall aerosols were aqueous. This process did not alter any of the major features, but5
allowed greater clarity in observing the differences in the experimental results.Brooks et al. (2003) used a ratio method to study phase transitions in the AS-maleic
acid system, using both the condensed phase water and acid modes. In the presentwork, in addition to the condensed phase water, we have analyzed the phase transi-tions of AS and MA IR features. The AS mode at 1420/1455 cm−1 shifts upon disso-10
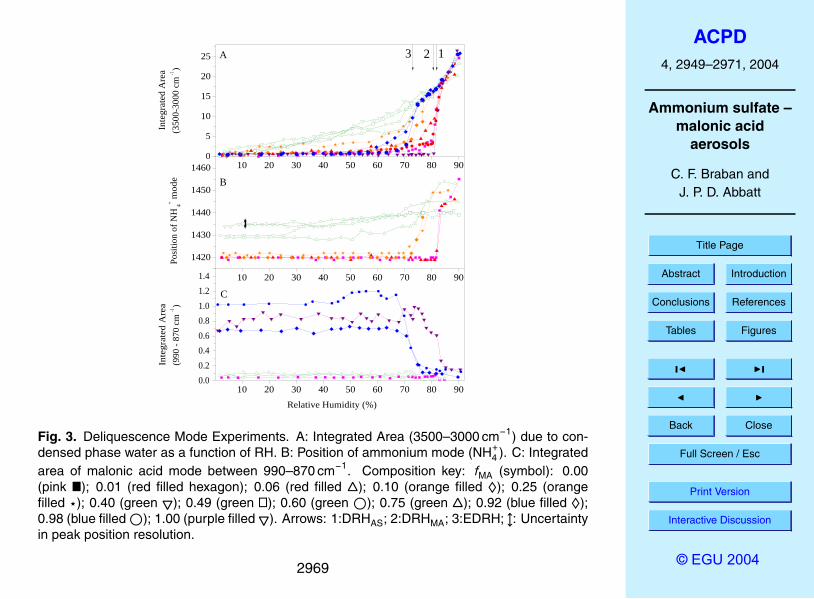
lution as discussed in Sect. 3.1. The results from the condensed phase water and ASmode analyses of deliquescence and efflorescence mode experiments are presentedin Figs. 3 and 4, respectively. For clarity not all compositions are shown in every figure.In Figs. 3A and 4A, the normalized AH2O is plotted as a function of RH. In Figs. 3B and4B, the position of the NH+
4 mode is plotted as a function of RH. The vertical arrows15
in Fig. 3 represent the DRH of MA (DRHMA, Arrow 1), AS (DRHAS, Arrow 2) and theEDRH for an AS-MA solution (Arrow 3; Brooks et al., 2002). To quantify the phasetransitions of MA, it can be seen that the mode at 665 cm−1 changes intensity and thebroad mode at 918 cm−1 decreases greatly in intensity when MA becomes aqueous.Both of these features were used to analyze the phase of the MA. The results from the20
latter analysis for deliquescence mode experiments are shown in Fig. 3C.The results presented in Figs. 3–5 are discussed below using composition classifi-
cation based on the observed behavior. In particular, results have been color codedwith respect to the phase transition behavior of AS. In Fig. 3B, the blue double-endedarrow indicated the ±4 cm−1 resolution used in these experiments. The results and25
observations are summarized in Table 1.
2956

ACPD4, 2949–2971, 2004
Ammonium sulfate –malonic acid
aerosols
C. F. Braban andJ. P. D. Abbatt
Title Page
Abstract Introduction
Conclusions References
Tables Figures
J I
J I
Back Close
Full Screen / Esc
Print Version
Interactive Discussion
© EGU 2004
3.2.1. Results: 0≤fMA<0.10 (pink and red symbols)
Pure AS aerosol (Fig. 3, pink �), take up very little H2O, AH2O∼0, as RH increases untilthe DRH is reached, measured here as RH=81±2%. This value is in agreement withpreviously measured values (Braban et al., 2001; Cziczo and Abbatt, 1999; Xu et al.,1998; Onasch et al., 1999). Similarly, in the efflorescence experiment (Fig. 4, pink �),5
AH2O decreases as RH is lowered. At RH=33±2%, AH2O decreases to a small andapproximately constant value when efflorescence occurs. This RH is also consistentwith other studies (Cziczo and Abbatt, 1999). Deliquescence and efflorescence arealso seen clearly in the shift of the NH+
4 mode in Figs. 3B and 4B.In deliquescence mode when there is a very minor fraction of MA present in the10
aerosol, fMA=0.01 and 0.06, there is an increase in AH2O with RH even when theRH<DRHAS, though the amount of condensed phase water is small. From the anal-ysis of the ammonium mode, the AS component is crystalline at all RH<DRHAS andat DRHAS the ammonium mode shifts to ∼1450 cm−1, indication deliquescence of theammonium sulfate. It is not possible to analyze the MA mode at 912 cm−1 due to15
the minor fractions of MA. Qualitatively, from the observation of the carbonyl modediscussed in Sect. 3.1 and the observation of a small increase of condensed phasewater as a function of RH we believe that the MA does not appear to be crystalline atRH<DRHAS. However we also note that this increase may be due to the presence ofadsorbed water at higher RHs, given that a small amount of water uptake is observed20
before deliquescence in the single component AS aerosol. These results will be furtherdiscussed in Sect. 4. In efflorescence experiments aerosol crystallized at the ERH ofpure AS, to within the error of the experiments.
3.2.2. Results: 0.10≤fMA≤ 0.25 (orange symbols)
The deliquescence-mode experiments for the composition range 0.10≤fMA≤0.25 are25
presented as orange symbols in Fig. 3. Water uptake occurs over the complete RHrange. However the major increase in AH2O occurs close to the EDRH for the AS-MA
2957

ACPD4, 2949–2971, 2004
Ammonium sulfate –malonic acid
aerosols
C. F. Braban andJ. P. D. Abbatt
Title Page
Abstract Introduction
Conclusions References
Tables Figures
J I
J I
Back Close
Full Screen / Esc
Print Version
Interactive Discussion
© EGU 2004
system at this temperature (Brooks et al., 2002). This observation is consistent withthe shift in the NH+
4 mode which also occurs at approximately 73% RH for both thefMA=0.10 and 0.25. There is insufficient MA to analyze the phase of the MA quanti-tatively, however there is water uptake at all relative humidities and, qualitatively, fromthe IR spectra the MA does not appear to be fully dry. Thus, it is thought that the “dry”5
aerosol (RH<1%) used in the deliquescence mode experiments consists of solid ASwith some supersaturated solution of MA.
In efflorescence mode experiments, it can be seen from both the AH2O and the NH+4
plot (Fig. 4A and B) that the crystallization of AS in these aerosols is significantly low-ered compared to that of pure AS. This process is not full efflorescence as there is still10
condensed phase water associated with the aerosol, therefore the term crystallizationis used to describe the phase transition of the AS component of the aerosol.
3.2.3. Results: 0.25<fMA≤0.90 (green symbols)
For compositions 0.25<fMA≤0.90 water uptake occurs at all relative humidities indeliquescence-mode experiments and there is no hysteresis in the AH2O plots between15
the efflorescence and deliquescence mode experiments (Figs. 3A and 4A). This is con-sistent with the IR spectra in Fig. 1B, C and D being similar to the equivalent spectra inFig. 2 and also with neither component of the aerosol having crystallized. This observa-tion is confirmed by virtually no abrupt shift in the NH+
4 mode (Fig. 3B) for compositionsfMA=0.40 and 0.50. It is thought that this is not due to any masking of the shift by the20
presence of the MA mode at 1444 cm−1, as one would still see a significant shift at theDRH or EDRH particularly when AS is the major fraction. For these compositions how-ever it is noted that there is a gradual shift in this mode to slightly higher wavenumbersas RH increases. Possible reasons why this might occur will be discussed in Sect. 4. Itcould be argued that fMA=0.75 has a considerable shift in wavenumber at the EDRH,25
however this shift initiates at about 50% RH, quite unlike the behavior of particles witha lower fMA (e.g. fMA=0.25).
2958
ACPD4, 2949–2971, 2004
Ammonium sulfate –malonic acid
aerosols
C. F. Braban andJ. P. D. Abbatt
Title Page
Abstract Introduction
Conclusions References
Tables Figures
J I
J I
Back Close
Full Screen / Esc
Print Version
Interactive Discussion
© EGU 2004
3.2.4. Compositions: 0.90<fMA≤1.00 (blue and purple symbols)
Deliquescence mode experiments for both fMA=0.92 and 0.98 show a small amountof water uptake prior to deliquescence at the EDRH. Although there is too little ASpresent to study the position of the NH+
4 mode, in Fig. 3C the MA mode at 923 cm−1 isplotted as a function of RH. In deliquescence-mode experiments, after the aerosol is5
exposed to the silica dryer and mixed with 2 l.min−1 N2, the initial RH is less than 1%.The MA appears crystalline until the major water uptake and deliquescence occurs atthe EDRH, however there still seems to be some water uptake at RH<EDRH. Also,there is some loss of peak area before the water is seen in the condensed phase in thepure MA aerosol.10
The similar analyses of the MA mode described above and shown in Fig. 3C wereperformed for the efflorescence mode experiments presented in Fig. 4. Only in thecase of pure MA was efflorescence observed at 6% RH (Braban et al., 2003). Forclarity the data are not shown in a third panel in Fig. 4. However to emphasize, nochanges in the IR were observed in any of the MA modes during efflorescence mode15
experiments. The minimum RH attainable in efflorescence-mode is approximately 3%,thus this implies that MA efflorescence has been lowered to below this value.
In summary, for compositions fMA=0.92 and 0.98, aerosols were observed to deli-quesce at the EDRH, with some H2O uptake prior to it. Efflorescence was not quan-titatively observed for either component in these experiments as it was not possible20
to observe the AS modes. In efflorescence experiments MA clearly did not crystallizeimplying the addition of even low levels of AS suppresses the efflorescence of MA to<3% RH.
2959

ACPD4, 2949–2971, 2004
Ammonium sulfate –malonic acid
aerosols
C. F. Braban andJ. P. D. Abbatt
Title Page
Abstract Introduction
Conclusions References
Tables Figures
J I
J I
Back Close
Full Screen / Esc
Print Version
Interactive Discussion
© EGU 2004
4. Discussion and atmospheric implications
4.1. Summary of results
Experiments have been performed with the AFT to identify phase transitions of aerosolcomposed of ammonium sulfate (AS) and malonic acid (MA). When fMA<0.1, phasetransitions occurred at the DRHAS and ERHAS. However between 0.1<fMA<0.25 deli-5
quescence occurred at the eutonic DRH for the AS-MA system and the crystallizationRH of AS was lowered. Between 0.25<fMA<0.90, no distinct deliquescence or efflo-rescence was observed, with particles taking up water at all relative humidities. Thusthe crystallization of both MA and AS is suppressed by the presence of the other com-ponent. The crystallization RH of MA was <3% when any AS was present. When10
fMA>0.25, AS did not crystallize even when RH <1%. Thus, the presence of eithersecond component increased the range of conditions under which the particles werein the solution phase. In particular it only requires a very low level of AS or MA to shiftdeliquescence to the EDRH, and if there is a significant AS and MA fraction, wateruptake occurs at all relative humidities. This behavior, should it be widely applicable,15
will have a large impact on the phase of chemically mixed aerosol in the atmosphere.The results for the AS phase transitions (as distinct from total aerosol particle phase
transitions) are summarized in Fig. 5. To follow the processes occurring in the aerosol,in Fig. 5 the RH at which the NH+
4 mode is observed to start to shift as a function ofRH has been plotted for the different aerosol compositions. That MA suppresses the20
crystallization of the AS is clearly seen, implying that in the atmosphere this wouldallow the particles to remain as a metastable supersaturated solution to low relativehumidities. The lowering of the deliquescence RH of AS, initially to the eutonic RH,is also clear. We have included in Fig. 5 the points at which the NH+
4 mode begins toshift in deliquescence mode experiments where it is thought that full efflorescence of25
the AS has not occurred. Two hypotheses are suggested as to why the NH+4 mode
should shift in such a way. First, it is possible a fraction of the AS has crystallized (asthe aerosol is taken to a lower RH in deliquescence mode experiments compared to
2960

ACPD4, 2949–2971, 2004
Ammonium sulfate –malonic acid
aerosols
C. F. Braban andJ. P. D. Abbatt
Title Page
Abstract Introduction
Conclusions References
Tables Figures
J I
J I
Back Close
Full Screen / Esc
Print Version
Interactive Discussion
© EGU 2004
the efflorescence mode experiments). If so, the shift may be due to a solubility of AS insupersaturated MA solution. The second hypothesis is that the AS/MA supersaturatedsolution chemical environment changes as a function of RH, such that the NH+
4 modeshifts. At this stage it is not possible to verify either hypothesis.
4.2. Comparison with other literature and atmospheric implications5
AS-MA mixtures have been studied by three other groups (Hameri et al., 2002; Choiand Chan, 2002; Prenni et al., 2003). In the first two of the studies a 1:1 mixture (bymass and by mole, respectively) was studied and water uptake at all relative humiditieswas observed, which is supported by the results presented herein. Of these, Hameriet al. (2002) noted that the deliquescence of AS was not visible indicating that the del-10
iquescence properties of the AS-MA particles are completely different to that of pureAS. Choi and Chan (2002), whose experiments were performed with an EDB, reporteda crystallization RH of 45.9–46.9% and a deliquescence RH range of 57.8–73.7% (at298 K), noting that the particles absorb a significant amount of water before the DRH.However, it is not clear that the entire particle crystallizes at the reported ERH, as water15
is still present below RH=45% even to very low relative humidities. If the observationsof this study are taken into account, it seems likely that the particle may have partiallycrystallized. Differences in efflorescence relative humidities between EDB and AFT ex-periments have been noted, as the particles in EBD studies are significantly larger thanthose in tandem DMA and AFT experiments. EDB results can give a higher ERH than20
AFT experiments, which can possibly be attributed to the larger size of the particles,the volume based probability of a crystal embryo and longer residence time allowingmass transfer limited processes to occur. However, in order to systematically comparethe results from the different experimental techniques it has been suggested that itwould be relevant to calculate the relative nucleation rates and the supersaturation of25
the solutions at crystallization (A. Bertram, personnal communication).Prenni et al. (2003) studied the deliquescence and hygroscopic growth of AS-
dicarboxylic acid ternary mixtures. For the AS-MA system at 100:1 and 10:1 ratios2961

ACPD4, 2949–2971, 2004
Ammonium sulfate –malonic acid
aerosols
C. F. Braban andJ. P. D. Abbatt
Title Page
Abstract Introduction
Conclusions References
Tables Figures
J I
J I
Back Close
Full Screen / Esc
Print Version
Interactive Discussion
© EGU 2004
they saw no effect on the AS phase transition. This is to be expected as at the tem-perature of their experiment, 303 K, the EDRH≈DRHAS. At 2.3:1 AS:MA continuouswater absorption at all relative humidities was observed, which is in agreement withthis study.
As mentioned previously, Brooks et al. (2003) investigated the AS-maleic acid5
ternary aerosol system in a study analogous to this. Similar to MA, maleic acid ishighly soluble. They report that maleic acid aerosols start taking up water at RH=20%and continue taking up water until the DRH at 89% at 273 K, at which water uptake ac-celerates. The internally mixed AS-maleic acid particles were observed to deliquesceat a lower RH than either of the single component systems, which is consistent with10
the results of this study. Brooks et al. (2003) attribute the uptake of water below thedeliquescence point to water associated with the surface. However, this may also bedue to partial crystallization of the ammonium sulfate leaving the maleic acid in a su-persaturated solution, which would be more consistent with the results we report here.In efflorescence studies they observed maleic acid ERH of 17% at 273 K and mixed15
aerosols effloresced at 27±3% RH, which implied the maleic acid was heterogeneouslycrystallized by the AS, in contrast to the suppression of the ERH that we observe. Bothof our studies conclude that the presence of water-soluble organics internally mixedwith AS aerosol could increase the range of conditions under which aerosol is in asolution phase.20
The behaviour observed in this study may have significant atmospheric relevance. Itis clear from this work and other studies that MA can inhibit the crystallization of AS.Other chemical systems have been observed to behave similarly (Prenni et al., 2003).It can be seen that the AS also does not promote the heterogeneous nucleation of MA,even when present as a major fraction of the aerosol. This behavior is in contrast to25
several studies that have investigated heterogeneous nucleation in aerosol particles,including Lightstone et al. (2000) and Martin et al. (2001). If sufficiently large nuclei of asolid are present, that solid has the potential to act as a heterogeneous nucleus. How-ever, whether the process will occur frequently is dependant on the chemical nature of
2962
ACPD4, 2949–2971, 2004
Ammonium sulfate –malonic acid
aerosols
C. F. Braban andJ. P. D. Abbatt
Title Page
Abstract Introduction
Conclusions References
Tables Figures
J I
J I
Back Close
Full Screen / Esc
Print Version
Interactive Discussion
© EGU 2004
the system and the size of the inclusion. Lightstone et al. (2000) studied deliquescence,efflorescence and water activity in mixed ammonium nitrate – succinic acid particles inwhich both the presence of solid inclusions of succinic acid and fully dissolved succinicacid were investigated. Ammonium nitrate particles do not effloresce down to ∼0% RHwhereas Lightstone et al. found that the presence of an SA core increased the ERH of5
AN. Similarly, it has been shown in studies of particles with inorganic “refractory” inclu-sions that efflorescence may be catalyzed, i.e. heterogeneous nucleation occurs (Hanand Martin, 1999; Martin et al., 2001). In the experiments presented here AS does notact as a heterogeneous crystallization site for the MA, when the AS crystallizes. Thisis possibly due to the barrier to nucleation of MA crystals or the presence of residual10
AS in the supersaturated solution fraction of the droplet adds an extra barrier to theformation of critical embryonic crystals of MA.
In summary, this study has shown that in order to gain understanding of phase tran-sitions in mixed phase systems it is necessary to identify the individual species thatcrystallize and those that remain in solution, as it is somewhat ambiguous to refer to15
deliquescence and efflorescence. The AS-MA mixed system shows a range of behav-iors, as summarized in Table 1, most of which include significant water uptake at allatmospheric relative humidities and lack of complete crystallization. Therefore, in theabsence of heterogeneous nuclei, it is likely the particles would exist as either saturatedor supersaturated droplets under most conditions.20
Acknowledgements. The authors would like to acknowledge NSERC and CFCAS for partialfinancial support and A. Bertram for highly constructive comments on this work.
References
Braban, C. F., Carroll, M. F., Styler, S. A., and Abbatt, J. P. D.: Phase transitions of malonic andoxalic acid aerosols, J. Phys. Chem. A, 107, 6594–6602, 2003.25
Braban, C. F., Cziczo, D. J., and Abbatt, J. P. D.: Deliquescence of ammonium sulfate particlesat sub-eutectic temperatures, Geophys. Res. Lett., 28, 3879–3882, 2001.
2963

ACPD4, 2949–2971, 2004
Ammonium sulfate –malonic acid
aerosols
C. F. Braban andJ. P. D. Abbatt
Title Page
Abstract Introduction
Conclusions References
Tables Figures
J I
J I
Back Close
Full Screen / Esc
Print Version
Interactive Discussion
© EGU 2004
Brooks, S. D., Garland, R. M., Wise, M. E., Prenni, A. J., Cushing, M., Hewitt, E., and Tolbert, M.A.: Phase changes in internally mixed maleic acid/ammonium sulfate aerosols, J. Geophys.Res., 108, 4487, doi:10.1029/2002JD003204, 2003.
Brooks, S. D., Wise, M. E., Cushing, M., and Tolbert, M. A.: Deliquescencebehavior of organic/ammonium sulfate aerosol, Geophys. Res. Lett., 29, 1917,5
doi:10.1029/2002GL014733, 2002.Charbonnier, F. and Arnaud, Y.: Etude par diffraction X et analyse thermique du malonate
neutre d’ammonium, Comptes Rendus Academie des Science de Paris – Serie C, 276,947–950, 1973.
Choi, M. Y. and Chan, C. K.: The effects of organic species on the hygroscopic behaviors of10
inorganic aerosols, Environ. Sci. Technol., 36, 2422–2428, 2002.Cruz, C. N. and Pandis, S. N.: Deliquescence and hygroscopic growth of mixed inorganic-
organic atmospheric aerosol, Environ. Sci. Technol., 34, 4313–4319, 2000.Cziczo, D. J. and Abbatt, J. P. D.: Deliquescence, efflorescence and supercooling of ammonium
sulfate aerosols at low temperature: implications for cirrus cloud formation and aerosol phase15
in the atmosphere, J. Geophys. Res., 104, 13 781–13 790, 1999.Cziczo, D. J. and Abbatt, J. P. D.: Infrared observations of the response of NaCl, MgCl2,
NH4HSO4 and NH4NO3 aerosols to changes in relative humidity from 298 to 238 K, J. Phys.Chem. A, 104, 2038–2047, 2000.
Hameri, K., Charlson, R. J., and Hansson, H.-C.: Hygroscopic properties of mixed ammonium20
sulfate and carboxylic acid particles, Am. Inst. Chem. Eng. J., 48, 1309–1316, 2002.Hu, J. H. and Abbatt, J. P. D.: Reaction probabilities for N2O5 hydrolysis on sulfuric acid and
ammonium sulfate aerosols at room temperature, J. Phys. Chem. A, 101, 871–878, 1997.IPCC (2001): Climate Change 2001: The Science of Climate Change, Intergovernmental Panel
on Climate Change, edited by Houghton, J. T., Meira Filho, L. G., Callander, B. A., et al.,25
Cambridge, Cambridge University Press, 2001.Kane, S. M., Claoz, F., and Leu, M.-T.: Heterogeneous uptake of gaseous N2O5 by (NH4)2SO4,
NH4HSO4 and H2SO4 aerosols, J. Phys. Chem. A, 105, 6465–6470, 2001.Lightstone, J. M., Onasch, T. B., and Imre, D.: Deliquescence, efflorescence and water activ-
ity in ammonium nitrate and mixed ammonium nitrate/succinic acid microparticles, J. Phys.30
Chem. A, 104, 9337–9346, 2000.Martin, S. T., Schlenker, J., Chelf, J. H., and Duckworth, O. W.: Structure-activity relationships
of mineral dusts as heterogeneous nuclei for ammonium sulfate crystallization from super-
2964
ACPD4, 2949–2971, 2004
Ammonium sulfate –malonic acid
aerosols
C. F. Braban andJ. P. D. Abbatt
Title Page
Abstract Introduction
Conclusions References
Tables Figures
J I
J I
Back Close
Full Screen / Esc
Print Version
Interactive Discussion
© EGU 2004
saturated aqueous solutions, Environ. Sci. Technol., 35, 1624–1629, 2001.Mozurekewich, M. and Calvert, J. G.: Reaction probability of N2O5 on aqueous aerosols, J.
Geophys. Res. (Atmos.), 93, 15 889–15 896, 1988.Narukawa, M., Kawamura, K., Li, S.-M., and Botttenheim, J. W.: Dicarboxylic acids in the arctic
aerosols and snowpacks collected during ALERT 2000, Atmos. Environ., 36, 2491–2499,5
2002.Narukawa, M., Kawamura, K., Takeuchi, N., and Nakajima, T.: Distribution of dicarboxylic acids
and carbon isotopic compositions in aerosols from 1997 Indonesian forest fires, Geophys.Res. Lett., 26, 3101–3104, 1999.
Onasch, T. B., Siefert, R. L., Brooks, S. D., Prenni, A. J., Murray, B., Wilson, M. A., and Tolbert,10
M. A.: Infrared spectroscopic study of the deliquescence and efflorescence of ammoniumsulfate aerosol as a function of temperature, J. Geophys. Res., 104, 21 317–21 326, 1999.
Parsons, M. T., Mak, J., Lipetz, S. J., and Bertram, A. K.: Deliquescence of mal-onic, succinic, glutaric and adipic acid particles, J. Geophys. Res., 109, D06212,doi:10.1029/2003JD004075, 2004.15
Prenni, A. J., DeMott, P. J., and Kreidenweis, D. C.: Water uptake of internally mixed parti-cles containing ammonium sulfate and dicarboxylic acids, Atmos. Environ., 37, 4243–4251,2003.
Prenni, A. J., DeMott, P. J., Kreidenweis, S. M., Sherman, D. E., Russell, L. M., and Ming, Y.:The effects of low molecular weight dicarboxylic acids on cloud formation, J. Phys. Chem. A,20
105, 11 240–11 248, 2001.Ravishankara, A. R.: Heterogeneous and multiphase chemistry in the troposphere, Science,
276, 1058–1065, 1997.Rohrl, A. and Lammel, G.: Low molecular weight dicarboxylic acids: seasonal and air mass
characteristics, Environ. Sci. Technol., 35, 95–101, 2001.25
Thornton, J., Braban, C. F., and Abbatt, J. P. D.: N2O5 hydrolysis on sub-micron organicaerosols: The effect of relative humidity, particle phase, and particle size, Phys. Chem.Chem. Phys., 5, 4593–4603, 2003.
Xu, J., Imre, D., McGraw, R., and Tang, I.: Ammonium sulfate: equilibrium and metastabilityphase diagrams from 40 to −50◦C, J. Phys. Chem. B, 102, 7462–7469, 1998.30
Yao, X., Fang, M., and Chan, C. K.: Size distributions and formation of dicarboxylic acids inatmospheric particles, Atmos. Environ., 36, 2099–2109, 2002.
2965

ACPD4, 2949–2971, 2004
Ammonium sulfate –malonic acid
aerosols
C. F. Braban andJ. P. D. Abbatt
Title Page
Abstract Introduction
Conclusions References
Tables Figures
J I
J I
Back Close
Full Screen / Esc
Print Version
Interactive Discussion
© EGU 2004
Table 1. Summary of Observations.
AS MA SignificantfMA Deliquescence Crystallization Deliquescence Crystallization H2O Uptake
0 Yes Yes – – RH>81%0.02–0.1 Yes Yes – – RH>81%0.1 Yes Yes No No RH>73%0.25 Yes Yes No No RH>73%0.40 Dissolution Partial No No All RH0.5 No No No No All RH0.60 Dissolution Partial No No All RH0.75 Dissolution Partial No No All RH>0.90 – – No No RH>73%1 – – Yes Yes RH>81%
2966

ACPD4, 2949–2971, 2004
Ammonium sulfate –malonic acid
aerosols
C. F. Braban andJ. P. D. Abbatt
Title Page
Abstract Introduction
Conclusions References
Tables Figures
J I
J I
Back Close
Full Screen / Esc
Print Version
Interactive Discussion
© EGU 2004
4000 3500 3000 2500 2000 1500 1000
Extin
ction
Wavenumber (cm -1 )
D
C
E
B
A
Fig. 1. Infrared spectra of five compositions of ammonium sulfate (AS) – malonic acid (MA)solutions at <1% RH. Compositions as dry fraction of MA (fMA): A: 0.10; B: 0.25; C: 0.49; D:0.75; E: 0.90.
2967

ACPD4, 2949–2971, 2004
Ammonium sulfate –malonic acid
aerosols
C. F. Braban andJ. P. D. Abbatt
Title Page
Abstract Introduction
Conclusions References
Tables Figures
J I
J I
Back Close
Full Screen / Esc
Print Version
Interactive Discussion
© EGU 2004
4000 3500 3000 2500 2000 1500 1000
Extin
ction
Wavenumber (cm -1 )
E
D
C
B
A
Fig. 2. Infrared spectra of five compositions of ammonium sulfate (AS) – malonic acid (MA)solutions at >80% RH. Compositions as dry fraction of MA (fMA): A: 0.10; B: 0.25; C: 0.49; D:0.75; E: 0.90.
2968
ACPD4, 2949–2971, 2004
Ammonium sulfate –malonic acid
aerosols
C. F. Braban andJ. P. D. Abbatt
Title Page
Abstract Introduction
Conclusions References
Tables Figures
J I
J I
Back Close
Full Screen / Esc
Print Version
Interactive Discussion
© EGU 2004
10 20 30 40 50 60 70 80 9005
10152025
10 20 30 40 50 60 70 80 901420
1430
1440
1450
1460
10 20 30 40 50 60 70 80 900.00.20.40.60.81.01.21.4
A 23 1
Integ
rated
Area
(3500
-3000
cm-1 )
B
Po
sition
of N
H 4+ mod
e
C
Relative Humidity (%)
Integ
rated
Area
(99
0 - 87
0 cm
-1 )
Fig. 3. Deliquescence Mode Experiments. A: Integrated Area (3500–3000 cm−1) due to con-densed phase water as a function of RH. B: Position of ammonium mode (NH+
4 ). C: Integratedarea of malonic acid mode between 990–870 cm−1. Composition key: fMA (symbol): 0.00(pink �); 0.01 (red filled hexagon); 0.06 (red filled 4); 0.10 (orange filled ♦); 0.25 (orangefilled ?); 0.40 (green 5); 0.49 (green �); 0.60 (green ©); 0.75 (green 4); 0.92 (blue filled ♦);0.98 (blue filled ©); 1.00 (purple filled 5). Arrows: 1:DRHAS; 2:DRHMA; 3:EDRH; l: Uncertaintyin peak position resolution.
2969

ACPD4, 2949–2971, 2004
Ammonium sulfate –malonic acid
aerosols
C. F. Braban andJ. P. D. Abbatt
Title Page
Abstract Introduction
Conclusions References
Tables Figures
J I
J I
Back Close
Full Screen / Esc
Print Version
Interactive Discussion
© EGU 2004
15 20 25 30 35 40 45
5
10
15 20 25 30 35 40 451415142014251430143514401445145014551460
B
Integ
rated
Area
(35
00 - 3
000 c
m-1 )
Relative Humidity (%)
A
Posit
ion of
NH
4+ mod
e (cm
-1 )
Fig. 4. Efflorescence mode experiments. A: Integrated area (3500–3000 cm−1) due to con-densed phase water as a function of RH. B: Position of ammonium mode (NH+
4 ). Compositionkey: fMA (symbol): 0.00 (pink �); 0.01 (red filled hexagon); 0.06 (red filled 4); 0.10 (orangefilled ♦); 0.25 (orange filled ?); 0.40 (green 5); 0.49 (green �); 0.60 (green ©); 0.75 (green 4);0.92 (blue filled ♦); Arrow: ↓:ERHAS.
2970

ACPD4, 2949–2971, 2004
Ammonium sulfate –malonic acid
aerosols
C. F. Braban andJ. P. D. Abbatt
Title Page
Abstract Introduction
Conclusions References
Tables Figures
J I
J I
Back Close
Full Screen / Esc
Print Version
Interactive Discussion
© EGU 2004
0 20 40 60 80 1000
102030405060708090
100
Relat
ive H
umidi
ty (%
)
Dry Weight Percent Malonic AcidFig. 5. Phase transition points of ammonium sulfate in ammonium sulfate-malonic acid mixturesas determined by shift in NH+
4 mode: Ammonium sulfate observed to go into solution, 283 K(♦); Crystallization of ammonium sulfate, 293 K (black filled ?). Eutonic composition and EDRHfor ammonium sulfate – malonic acid – H2O ternary system at 283 K is shown with the dashedline (Brooks et al., 2002). See text for details.
2971
Copyright © 2022 FDOKUMEN