A Study of the Natural Rubber Industry, with Special ... - CORE
167
Utah State University Utah State University DigitalCommons@USU DigitalCommons@USU All Graduate Theses and Dissertations Graduate Studies 5-1967 A Study of the Natural Rubber Industry, with Special Reference to A Study of the Natural Rubber Industry, with Special Reference to Thailand Thailand Suratana Vayagool Follow this and additional works at: https://digitalcommons.usu.edu/etd Part of the Economics Commons Recommended Citation Recommended Citation Vayagool, Suratana, "A Study of the Natural Rubber Industry, with Special Reference to Thailand" (1967). All Graduate Theses and Dissertations. 2892. https://digitalcommons.usu.edu/etd/2892 This Thesis is brought to you for free and open access by the Graduate Studies at DigitalCommons@USU. It has been accepted for inclusion in All Graduate Theses and Dissertations by an authorized administrator of DigitalCommons@USU. For more information, please contact [email protected].
-
Upload
khangminh22 -
Category
Documents
-
view
0 -
download
0
Transcript of A Study of the Natural Rubber Industry, with Special ... - CORE
Utah State University Utah State University
DigitalCommons@USU DigitalCommons@USU
All Graduate Theses and Dissertations Graduate Studies
5-1967
A Study of the Natural Rubber Industry, with Special Reference to A Study of the Natural Rubber Industry, with Special Reference to
Thailand Thailand
Suratana Vayagool
Follow this and additional works at: https://digitalcommons.usu.edu/etd
Part of the Economics Commons
Recommended Citation Recommended Citation Vayagool, Suratana, "A Study of the Natural Rubber Industry, with Special Reference to Thailand" (1967). All Graduate Theses and Dissertations. 2892. https://digitalcommons.usu.edu/etd/2892
This Thesis is brought to you for free and open access by the Graduate Studies at DigitalCommons@USU. It has been accepted for inclusion in All Graduate Theses and Dissertations by an authorized administrator of DigitalCommons@USU. For more information, please contact [email protected].
A STUDY OF THE NATURAL RUBBER INDUSTRY,
WITH SPECIAL REFERENCE TO THAILAND
by
Suratana Vayagool
A thesis submi tted in partial fulfillment of the requirements for the degree
of
~~STER OF SCIENCE
in
Economics
UTAH STATE UNIVERSITY Logan, Utah
1967
ACKNOWLEDGMENTS
The author wishes t o express his sincere gratitude to Professor
Leonard J. Arrington who gave very generously of his time and effort
including valuable suggestions and comments on this thesis, and who
has helped the author in many ways during the entire period of the
author ' s study at Utah State University.
The author is also greatly indebted t o Professor Reed R. Durtschi
for his helpful directions and criticisms which have improved the thes is
considerably fr om its earlier draft . The author a l so expresses appre
ciation to Professo r Evan B. Murray and Professor Vernon L. Israelsen
for their participation on the thesis committee .
Specia l thanks are due to Mr . Chup Muniganonta and Mr. Suwan
Wichaidit of Rep lanting Aid Fund Office and Rubber Plantat ion Organiza
tion and Mr. Prapat Puthisuwan who provided valuable materials and data
from Thailand .
He also wishes to acknowledge the help and constant encouragement
of his wife, Charunee Vayagoo l, in the long process of his preparing
this thesis. An yhow, he can no t forget his successful motivation which
was conducted by his daughter, Barnlulap Vayagool, during his writing
of the thesis .
Scholarship in support of the author's academi c career at Utah
State University was provided by the Thai Government. Without this
support theM. S. Program would not have been possible.
Suratana Vayagool
ii
TABLE OF CONTENTS
ACKNOWLEDGMENTS ii
LIST OF TABLES v
LIST OF FIGURES .viii
ABSTRACT ix
Chapter
I. INTRODUCTION
Origin and the Nature of the Problem Purpose and Scope
II. A HISTORICAL SKETCH OF THE NATURAL RUBBER INDUSTRY
1 3
5
General Background 5 The Physical and Chemical Material 6
Natural rubber . 6 Synthetic rubber 8
Technological Change and Development of the Rubber Industry . . . . . . . . . . . . 10
The discovery of rubber-bearing plants and the uses for rubber . . . . . . . . 10 The development of rubber processing technology. 13 Technological base for a large - scale industrial use of rubber . . . . . . . . 16 Plantation rubber in Southeast Asia and the parallel development of the mass - produced automobile . . • . . . . . . . . • . . . . • 19 lo/orld War II and the development of synthetic substitutes for natural rubber . • . . . . . . 26 Cold polymerization, new compounding materials, and the stereo-regular synthetics 28
III. ECONOMIC STRUCTURE OF THE NATURAL RUBBER INDUSTRY
Demand and Supply • . . Consumption by Regions Consumption by Uses .• Production . . . . . Production of Synthetic Rubber
32
34 38 43 48 53

IV. THE NATURAL RUBBER INDUSTRY IN THAILAND
Structure of the Economy . . ... Deve lopment of Rubber Plantations Rubber Holding . . . . . Process ing and Marketing Export of Natural Rubber Role of the Government .
Varietal and quality improvement Improvement on c ultural practice Soil fertility improvement Pests and siseas control
56
56 59 65 67 69 76
80 82 83 83
V. COMPETITIVE POSITION OF NATURAL AND SYNTHETIC RUBBER 84
Structure of the Rubber Market Technical Advantages and Di sadvantages • The Re lative Price of Natural and Synthe tic Rubber . . . . • . . . . . . . . • . . . . . The Relative Production Cost of Natural and Synthe tic Rubber .... . .
VI. THE PRESENT AND FUTURE SITUATION OF THE NATURAL RUBBER INDUSTRY . . . . . . . . .
Genera l View of Natural Rubber Producers Thailand' s Rubber Replanting Scheme Outlook for the Future of Natural Rubbe r Estimate of Natural Rubber Consumption . Estimate of Natural Rubber Production The Estimated Supply and Demand Posit i on Proposed Solutions t o the Problem
VII. SUMMARY AND CONCLUSION
BIBLIOGRAPHY
APPENDIX
VITA . .
iv
85 87
93
98
105
lOS 112 116 119 123 125 126
130
136
144
156
Table
l.
2 .
LIST OF TABLES
Rubber consumption in the United States and England and rubber supply from producing centers before 1900 . . . . • . . • . . . . . • . ... . .
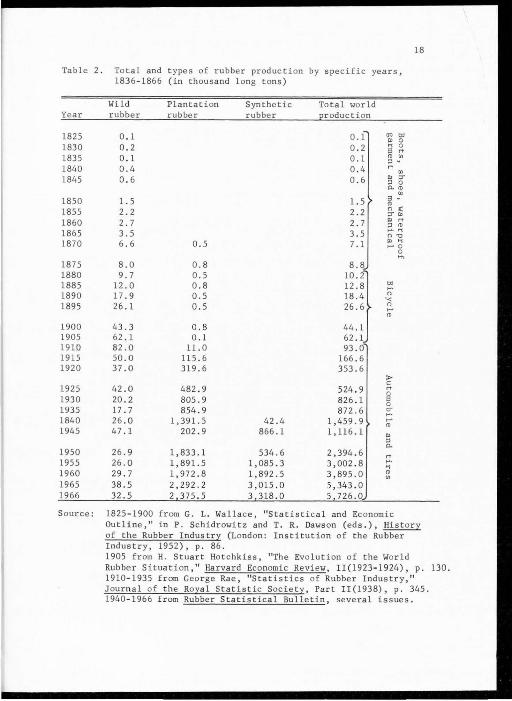
Total and t ypes of rubber production by specific years, 1836-1866 (in thousand l ong t ons ) .. •.
3. Derived demand for rubbe r from the United States automobile industry
4.
5.
6 .
7.
8.
9.
10.
11.
12.
13.
14 .
Estimated new and cumu lative t otal acreage planted to rubber in South and Southeast Asia, 1904-1951 .
Production of synthetic rubber in U. S. A. (in thousand long tons) . . . . . . . . . . . . . . • . . ...
Production of synthetic rubber in Germany (Me tric tons) .
Exports of synthetic rubber from the United St ates in long tons, 1950- 1960 .... . .
Relative importanc e of natural rubber exports to the economy in 1965 . . . . . .
World consumption of rubber and percen tage shares of natural rubber , average 1959-1961 (in million long tons) .. . . . . ... .. ... .
Natural rubber imports in centrally planned economics; also as a percentage of world national rubber consumption (in thousand long tons) . . . . . . . . .
Production, consumption, and price of natural rubber in selected years , 1900-1966 •... .. •
Average consumption and regional share of new rubber consumption since 1900 ( in thousand long tons) . .
Average consump tion and r egional share of natural rubber consumption since 1900 (in thousand l ong tons).
Estimated imports of natural rubber and domestic production of Sovie t Union and Easter Europe (in thousand long tons) . . . . . . . . . . ....
v
Page
15
18
21
24
27
27
30
33
35
35
36
39
39
42
15 o
l6o
l7o
l8 o
19.
20.
21 .
Consumption of natural and synthetic rubber in Japan (in thousand long tons) o 0
Consumption of rubber in transportation and nontransportation and percentage of natural rubber to the total consumption (in thousand long tons)
Production of natural rubber in the principle producing countries (in thousand l ong tons) o o o o 0 o 0
Structure of natural rubber industry, percentage acreage of smallholdings o 0 0 0 • • ••• • •
World production of synthetic rubber 1940-1966 (in thousand long t ons) . • • . . .
Gross national product of Thailand (in thousand dollars) 0 • • 0 0 •
Percentage shares of the value of major types of agricultural produc tion in Thailand . 0 • • • •
22 . Rubber plantation areas in Thailand (in thousand
23.
24o
25o
260
270
28 ,
29.
30.
31 .
32 .
33.
acres)
Rubber holdings in Thailand, 1944 and 1945
Ownership of rubber holdings in 1949 . 0 0
Quantity and value of principal exports of Thailand from 1957- 1966 o o 0 o o o • o • 0
Annual Volume and value of Thailand's rubber exports (in se lected periods) . . 0 0 0
Principle rubbe r importing countries from Thailand (in metric tons)
Trend in the share of Thailand's export of natural rubber in total world exports (in thousand long tons)
Price of rubber, 1946 -1 965 (cents per pound) : 0 ••
Compos ition of rubber acreage in Malaya, 1966 (in 1,000 acres ) 0 o 0 0 ••• • • ••• •
Thailand's replanting area, 1961-1964
Rubber consumption per caput in 1964, for various countries (in pounds) . . . . . .
Natural and synthetic rubber consumption and percentage consump t ion of natural rubber in 1970 and 1975 (in long tons) .. .... •... 0 • • • • • • • • • •••
43
46
51
52
54
57
59
61
66
66
71
72
73
75
97
107
115
118
122
34.
35.
36.
37 .
38 .
39 .
40 .
41.
42.
Natural rubber actual supply 1962-1965 and potential supply in 1970 and 1975 (in thousand long tons) ..
l<orld consumption of natural rubber, 1900-1937 (in thousand long tons) . . . . . . . . . . . . . . ..
World consumption of natural rubber, 1938-1966 (in thousand long tons) . . . . . . . . . . . . . . ..
World consumption of synthetic rubber, 1940-1966 (in thousand long tons) . . . . . . . . . . . . . . . • .
World natural rubber production (net export) 1910- 1937 (in thousand long tons) . . . ....
World production of natural rubber, 1938 -1 966 (in thousand l ong t ons)
World production of synthetic rubber, 1940-1966 (in thousand long tons) • . . . .
Yearly average price of crude rubber (ribbed smokes sheet plantation rubber) in New York (in cent per pounds) . . . . . . . . • . . . .. . .
Synthetic rubber prices (in cent per pound)
vii
124
145
146
148
151
151
153
154
155
Figure
1.
LIST OF FIGURES
Thailand ' s rubber production and price, 1910- 1966 . . .
viii
Page
63
ABSTRACT
A Study of the Natural Rubber Industry,
With Special Reference to Thailand
by
Sur a tana Vayagool, Master of Science
Utah Sta t e University , 1967
Major Professor: Professor Leonard J. Arrington Department: Economics
The relative sha r e of natural rubber in the world's total rubber
consumption had been decreasing from 75 percent in 1948- 1949 to 44.4
percent in 1965. Since the production of natural rubber has been rising
over the same period , some pr edicti ons have been mad e indicating that
there will be a surp lus of production over consump tion of natural rubber
in th e near fut ure.
In the world output of natural rubber industry, Thailand ranks
third, being surpassed only by Malaysia and Indonesia . Of all the ex-
ports of Thailand, rubber ranks second in value and is exceeded onl y
by rice. Almost al l of the rubber plantations are less than 8 acres
in size and the prewar stock will give a low yie ld.
The purpose of this study is to evalua t e such predictions. An
attempt is als o made t o show that the rising relative share of synt hetic
rubber i n the world ' s t o tal r ubber consumpt i on has been primarily due
to the inability of the producers of natural rubber t o increase supply
in pace with the increasing demand for rubber and wi th the technological
advances in the syn thetic r ubber industry.
The study revealed that the United States and Wes t ern Europe can
be expec t ed to continue t o exercise a great influence in th e f utur e rubbe r
market as the industrial consumers absorb nearly 50 percent of the
world ' s total rubber consumption. In addition, the United States is
expected to pla y a vital r o l e as the major producer of synthetic rubber,
whic h appears t o be a critica lly important fac t or in determining the
future prospects r egarding the demand fo r natural rubber.
I t is concluded that th e t echniques of r e planting and new planting
or both, using the best available high yie lding clones would e nable
natural rubber producers to r educe the cos t of pr oduct i on enough t o
meet the keen price compe tition f r om synthe tic rubber . In the face
of the threa t ening compet ition from syn thetic rubber, the success of
the natural rubber indu s try may be measured by the extent of r ea lization
of effec tive and unremitting e fforts by the natural rubber industry.
The f uture of the natural rubbe r indu s try in Thailand, th en , de pend s
fi rst on how f ast production could be s t epped up; secondly how fas t the
cos t of production could be r ed uced by replanting with high yi e lding
clone; and thirdly on the wor ld price of natural rubbe r .
The pro j ec ti on of natural rubbe r production during the year 1970
indicates that all rubbe r produced will be sold. Synthe tic rubber
wi ll be used t o meet excess demand for new rubber during this pe ri od.
But some surpl u s of the natural rubber will occur during the year 1975.
The fu ture of the natural rubber indu s try de pends to a large degree on
lowered costs o f produc tion with r eplanting and planting with high
yielding trees , and improving the quality and marketing.
In conclusion, the p lant ing scheme now being undertaken in the
natural r ubber producing countries , wi ll be of advantage not only at
th e present but also in the f uture .
(] oh O~PPS)
CHAPTER I
INTRODUCTION
Origin and the Nature of the Problem
One of the most i mportant raw materials in the world, rub ber, is
important because of the large number of final products--Industrial,
transportational, medical, and household --which are made ou t of rubber.
It is indispensable in a modern economy, both in time of war and in
time of peace . The importance of this commodity as a raw material has
made it an object of imitation and synthetization. The wild fluctua
tions in its price have accelerated efforts to discover substitutes.
The production of synthetic rubber took place for the first time
in Germany during World War I. This production, however, was terminated
at the end of the war, indicating that the cost of production as to
quality was not competitive with natural rubber. World War II once
again stimulated the production of synthetic rubber when the rubber
consuming countries were deprived of supplies . However, the e nd of
World War II did not bring an end to the production of synthetic rubber.
The Korean Conflict and subsequent crises have caused increases in th e
consumption of synthe tic rubber. The share of synthetic rubber in the
world ' s total rubber consumption has risen from 25 percent in 1948-
1949 to 55.6 percent in 1965.
The producers of natural rubber have watched their relative share
decline from about 75 percent in 1948- 1949 to 44.4 percent in 1965 .
This decline is a concern not only because of t he importance of rubber
as a raw material for so many products; but because rubber is o ne of
the most important, if not the most important, source of foreign currency
which the natural rubber producing countries need in developing their
economies.
Of all the exports of Thailand, rubber ranks second in value and is
exceeded on l y by rice. In the wor ld ou tput of natural rubber, Thailand
stands third, being surpassed by Malaysia and Indonesia. Thailand's
rubber industry, which centers in the south, consi s t s of some 1,800,000
acres of plantation, producing annually some 200,000 long tons of
rubber worth at present approximately $100,000,000 . This is roughly 10
percent by weight of the t o tal world natural rubber supply and 9
percent by value.
Only 5 percent of the rubber plantations in Thailand exceed 8
acres in size, and only half a dozen are in the 400-acre range . In
general, the big producers are more eff icient than the small producers.
Almost all rubber trees are of the prewar stock, irregular ly planted,
uneven in growth, and scarred in tapping. Many have been badly tilted
by the winds, and many more are badly ove rgrown with fungi and parasites.
Although the plantations are owned by relatively small producers, they
have not developed any type of cooperative arrangement for marketing
their production. This leaves th em at the mercy of the numerous layers
of middlemen who function as buyers and sellers for the rubber industry.
Because of th e above problems, rehabilitation of the rubber indus
try has now become a matter of serious concern to t he Thai governmen t.
Beginning in 1960, it undertook a replanting scheme modeled upon the one
now being successfully completed in Malays ia. The government levies
a tax up on all rubber export s and uses the proceed -about $6 , 000,000
per year --to s ubsidize producers who are wi lling t o cut down o ld
rubber trees and plant the new high- yielding vari e ties. At the s ame
time, the Thai government has also taken o the r steps t o promote and
improve the production of rubber .
Purpose and Scope
3
The pu rpose of this thes is is to stud y the natural rubber industry
with spec ia l r efer ence t o Thailand. The competitive po t ential of
synthe tic r ubber is als o analyzed because s ynthe tic rubber ha s been
and will r emain in strong compe titi on with natural rubber.
Chapters II and II wi ll dea l with the development and c haracteris
tics of the natural rubber industr y . Fluctuations in price , output,
volume of trade, and expor t earn i ng of natural rubber in both the
s hort-te rm and long- t erm period will be analyzed. In view of adverse
economic r epercussions of marked fluctuations of natural rubber prices
and expor t income on th e primar y producing countries, the vario us
s tabilization schemes will be considered .
Chapter IV is concerned with the role of the rubber industry in
Thailand and the relative importance of rubber t o it s future foreign
exchange . The balance of payments and economic development wi ll also
be studied. The chapter also consid er s the var i ous steps take n by the
Thai government t o promo t e and improve the production of natural rubber
in competition with synthetic rubber.
Chapters V and VI discuss the problems and the future of the natural
rubber indu s try. The r ecent discove r y of stereo synthetic rubber, the
4
replanting of high-yield trees, and chemical stimulation are evaluated .
In brief, the various economic policies affecting both the primary
natural rubber - producing countries and the wester n industrial countries
and their consequences are discussed and analyzed.
CHAPTER II
A HISTORICAL SKETCH OF THE NATURAL RUBBER INDUSTRY
General Backg ro und
Little more than a century ago , the name "rubber" was a c uri os ity.
Today, it is v ital to our exis t ence. Unlike iron , c opper, and cotton,
which have been important commodities f or centuries , the development of
the rubber industry with the consequent demand fo r the raw material
has all taken place within the last cen tury. The great growth, however,
has been in the past 60 years, the period during which the automobile
has come into so much promine nce .
The first re fe r ence t o thi s substance \'185 mentioned in Dr.
Priestley's book, Theory and Practice of Perspective, printed in 1770,
in which he s tated that there was "a s ubs tanc e excellently adapted fo r
era sing black-lead pencil marks from paper." 1 Because thi s substance
came from the land of the Indian , from that time i t appears to have
taken the name of India rubber. 2
The history of rubber is unique . No other major commodity in
\Wrld trade has experienced such dramatic and r a pid shifts in sources,
fac t or composition, and magnitudes of s upply. Few have undergone such
1H. Stuart Hotchkiss, "The Evaluation of the World Rubber Situation," Harvard Business Revi ew , II(l923-1924), 130-131.
2 Harvey S. Firestone, Jr., The Romance and Drama of the Rubber Indus -
!!Y (Akron, Ohio: The Firestone Tire and Rubber Company , 1936), p. 24.
6
significant changes in levels, technical characteristics, and industrial
derivation of demand. Shifts in world supply and demand for rubber
are invariably related to technical developments in producing, processing,
or utilizing rubber. The historic influence of technology and the
development of rubber industry to the present are an indication of the
technical and economic forces now s haping the industry's fut ure.
The Physical and Chemical Mater ial
The term "rubber" is used as a generic term encompassing not
only the "natural" product of the Heavea Braziliensis tree and other
vegetative sources, but also the ever-increasing variety of synthetic
polymers which gave properties similar in greater or lesser degree to
natural rubber. While the term "elastomer " is a far more appropriate
generic term from a technical point of view, it ha s rarely been used
outside of the industry, and not universally with in it. 3 In this study,
therefore, "rubber" will be used in its wider meaning to encompass
both the natural pr oduct and synthetic materials commonly identified
as "synthetic rubber."
Natural rubber
Chemically described, natural rubber is a high molecular weight,
terpene hydroc arbon polymer. The bas i c moecule (or monomer) of rubber,
called isoprene, is a deceptively simple-appear ing combination of five
atoms of carbon and e i ght of hydrogen . In rubber's natural or polymer
3L. R. G. Treloar, The Physics of Rubber Elasticity (London:
Oxford University Press, 1949), pp . l-2.
state, isoprene molecules are repetitively linked together in symmetri-
cal linear chains approximately 750,000 molecules in length. The
e xtent, the strength, and the symmetry of molecule chain linkages,
rather than the basic molecu lar composition, are primarily responsible
for rubber's physical properties. Until recent years, nei ther the
molecular structure nor th e resulting properties of natural rubber
4 could be duplicated in any synthesis.
Emulsion found in the roots, stumps, branches, and fruits of a
wide variety of plants contain rubber. Moyle listed 554 plants as
known rubber producers of some significance in 1942.5 Included were
numerous species of the Hevea , several species of the Castilloa of
the Mulberry family, many Euphorbiaceous plants in South and Central
America, the Fucus elastica of Asia, the Funtomia and Landolphi s members
of the Apocymaceae genera in Africa, the Panthenium (Guayule) bush of
Mexico, the Milk Weed (Asclepiadacea) and the Golden Rod of North
America, as well as the Russian dandelion, Kok-sagyz . 6 All these plants
and many others have been used or seriously considered as rubber sources ,
although their yi elds and their r elative proportions of rubber to
ex traneous matter range widely . For reason of high yield, low impurities,
4Ibid., pp . 3-4 ; and P. W. All en and G. F. Bloomfield, "Natural Rubber Hydrocarbon," and B. L. Archer and Others, "Structure, Composition and Bio-Chemistry of Hevea Latex ," in L. Bateman, The Chemistry and Physic of Rubber - like Substance (London : Maclaren & Sons LTD : , 1963), pp. 1-8 and 43-45 .
5Alton Moyle, Bibliography and Collected Abstracts on Rubber Producing Plants (College Station, Texas: Texas Experimental Station, 1942), p. 8 .
6Loven G. Polhamus, Rubber: Botany, Production, and Utilization
(London: Leonard Hill (Books) Limited, 1962), pp. 31-61.
and other factors discussed below, Hevea Braziliensis is now under
cultivation on some 11,210,000 acres of land 7 and account for almost
all of the natural rubber coming on the market. 8
Synthetic rubber
8
Unlike natural rubber, " synthetic rubbe r" has no specific chemical
or t echnical connotation. In common us age it usually encompasses a
group of high molecular weight polymers which have physical prope rties
s imilar to natural rubbe r. For economic rather than technical r easons,
nearly a ll synthetic rubbe r is now manufactured from petroleum-derived
chemica l inter mediar i es. Alternative sources of the chemica l " building
blocks " requir ed for the synthes i zing of various synthetic rubbers, how-
ev er, are nume rous. Po tatoes, coal, tar, and molasses, for example,
are adequate technical substitutes and all have been used at various
times.
The variet i es and sub-varieties of synthetic rubbers have undergone
subs tantial changes over the past two decades and the t o tal numbe r of
t echnically differentiated types ha s continued t o expand . Until 1960,
much of the t echnical differ entiations could be subsumed in three
broad categories of synthetics which dominated the supply picture .
These were: (1) co - polymerized s t yrene and budadiene, a general purpos e
syn thetic which is usually considered the main technical substitute for
natural rubber; (2) the co-polymer of isobutylene and budadiene cal l ed
7Ibid., pp. 31-32. Asia 10,508,000 ac r es , America 50,000 acres, Africa 622 , 000 acres, and Oc eania 30,000 acres.
8J ean Le Bras, Introduction t o Rubber (London: Maclaren and Sons LTD . , 1963), p. 9 .
9
Bytyl or IIR; and ( 3) the polymer of chloroprene cal l ed Neo prene or CR. 9
From 1961, a new family of synthetic ca lle d "stereo-regu lar'' ha s
emerged on the scene. 10 Wi t hin this new f ami ly, three maj or types of
rubber are of gr eates t current interest: c is 1, 4 po l yisoprene , re ferred
t o as IR; cis 1,4 po l ybudadiene , cal l ed BR; and e thylene -propylene, or
EPR. These s t er eo -regular rubber s are signi f icantly different from
other earlie r synthe tics from both chemical structural and physical
ll property point of view . Thei r emergence has introduced a comp l e t ely
new economic and technical dimens i on to the wor ld rubber picture, as
wil l be discuss ed in Chapter VI.
9rn additi on to the three major synthetic rubbers, a number of more specialized synthetics should be mentioned . These incl ude Buna - N, a copolymer of budadiene and acrylonitrile; Thiokol a polysulphide co-polymer made fro m ethylene dichlorid e and sod i um tetrasulphide s ; Vnyl ite made from ei ther vnylchloride or vnylace tate or a combination of these; Bulylite, a po l ymer of butylene dic hloride; the polyurethanes, semi poltmer s that have other molecular gr oup configura t i on s in addition to polymer grouping , and a number of o ther synthes ized products which are more adequately labe lle d plastics . SeeM . E. Lerner, "Rubbe r,'' in Encyclopaedia Americana, 1965, 23:745- 745f .
10ouring the Second World War, most of these synthe tics found highly specia lize d us e a s r ep l acement for natura l rubber, particularly under circumstances where cost was only a minor consideration. In the post-war period, where cos t as well a s technical qualities have been important de terminants of the ir use s , they have mai·nt a ine d, and in many circumstances expanded their level of use but on a more limited range of applications .
Natural and Synthetic Rubb er Terminology Origin Trade Names Government Classification ASTM Terminology
Buna-N GR-A or Nitrile NBR Buna-S GR- S SBR Butyl GR-I IIR He vea (natural) NR Neoprene GR-M CR Thiokol GR-P Pol ysulfide
11charles F. Phillips, Jr., Competition in the Synthetic Rubber
Industry (Chapel Hill, Nor th Carolina: The University of North Carolina Press, 1963), pp . 13-15 and Encyclopaedia Britannica, "Rubber," 1965, 19:610.

10
Technological Change and Development
of the Rubber Industry
Shifts in th e world supply of and demand for rubber have been
invariably related to technical developments in producing, processing,
and utilizing rubber. In broad ou tline, we can identify six phases in
the development of rubber industry. Each of these phases is characterized
by a particular technological change or a combination of developments.
In historic sequence, these phases are:
l. The discovery of rubber-bearing plants and the us es fo r rubber.
2. The development or rubber processing technology; solvents,
mas ticator s , and the solution spreader.
3 . A t echnological base for a large-scale industrial use of rubber
and vulcanization.
4. Systematic plantation-grown rubber in South and Southeast Asia
and the paralleling development of mass-produced automobiles.
5. World War II and the deve lopment of synthetic substitutes for
natural rubber.
6. Cold polymerization, new compounding material, synthetic
natural rubber, and the movement of synthetic from substituting to
supplanting .
The discovery of rubber - bearing plants
and the uses for rubber
Although the widespread use and development of natural rubbe r is
comparat i vely modern, rubber was known in very early times.12
There is
l2o. W. Huke, Introduction t o Natural and Synthetic Rubber s (London: Hutchinson Scientific & Technical, 1961), pp. 13 - 16; J ean Le Bras, op.cit . ,
11
some evidence, for example , that rubbe r was used for playing ball in
Ethiopia, and from there the game spread to Egypt. The use of rubber
never became widespread in Europe, however, until the nineteenth century,
and this may be connected with the distribution of rubber-bearing plants.
Natural rubber is a product of many trees and plants, but it can
only be obtained easily and in large enough quantities to make its
use worth while from a few types of trees. These trees were not very
common in the Old World, but they occurred much more frequently in the
New. It is not very surprising, therefore, that rubber has been known
and used by the natives of South America for a very long time.
Columbus is usually given credit for having been the first modern
European t o see natural rubber, and it is said that he brought back
rubber play balls which he obtained f rom the natives of Haiti on his
second voyages in 1493-1496 . The ball game had, in fac t, been known
to the Indians for centuries, as revealed by Aztec wall paintings
from the 6th Century.
It was only in 1615, however, that certain useful applications of
rubber were r evea led by Juan de Torquemada in the book Monarguia Indiana,
where an accoun t is given of the manufacture of the substance known to
the natives of Mexico as "Ulei 11 for the purpose of waterproofing
articles of clothing.
However, the interest later to be shown in Europe in this substance
and its many practical applications, and the part it was destined to play
pp. 7-9; T. R. Dawson, "Chronology of Rubber History," in P . S. Schidrowitz and T. R. Dawson (eds . ), History of the Rubber Industry (London: Institution of the Rubber Industry, 1952), pp . ix-xxi i i; Hubert L. Terry, India Rubber and Its Manufacture (London: Archibald Constable & Co . Ltd., 1907), pp. 1-63 .
in the economy , was only aroused much later by two French scienti s ts,
Charles de la Condamine and Francis Fresneau.
12
La Condamine, the naturalist and mathematic ian, had been sent in
1736 t o South America by the Pari s Academy of Sciences to measur e a
meridian in the neighborhood of the equator. He and his coll eagues
collected sampl es of rubber from seve ral species of the Hevea tree and
sent them to the Paris Academy f or s tudy . He also reported the various
uses made of the substance by the natives , and observed that the same
tree was t o be found gr owing on the banks of the Amazon River. The
material was known t o the Maina Indians as "caoutchouc," a word de
rived f r om caa (wood) and o-chu (to flow or weep) .
Fresneau, an engineer employed by King Louis XV of France at Guiana,
spent fo urteen years l ooking for the source of natural rubber. Fresneau
described the rubber tree in detail, and gave an account of his effor ts
to discover where the tree was gr owing and how to obtain the rubber
from it. He made another very important contribution t o the knowledge
of the properties of rubber and thereby assisted in the birth of the
rubber industry.
In 1762 the name Hevea Guianensis was given t o the tree de scribed
by Fresneau . It was then quickly r ealized that rubber trees were no t
exclusively American plants and that ot he rs capable of producing the
same material existed in Africa and Asia.
Before attracting the attention of European science, both the use
and knowledge of rubber wa s large ly limited to the localized areas within
whi ch wild rubbe r-producing plants were found. Practical us es included
crude foot coverings and water - proof ing for rain caps. But little trade
and no evidenc e of organized production in the America before the eighteenth
13
century was known. The consumption of rubber in Europe, limited by the
lack of knowledge and of interest, was undoubtedly measurable in pounds
per year until the latter part of the eighteenth century .
The initial movement of rubber into interna ti ona l trade channels
stemmed from the European discovery i n the la tter decades of the
eighteen th century of an i nc r easing number of pra c tical uses for this
unique mate r ial. Among the first applications of rubber were those
in medicine (syringes, small tubes, and surgical pr obes). In all such
earl y uses of rubbe r, the shape of the manufactured product was depen
dent on the original shape or form of rubber as it came out of the
jungle . While such limitation seve r e ly limited the range of products
that cou ld be made, demand gr ew s l owly but steadily a s a result of
rubber ' s physical properties which could not be duplicated by anot her
material .
The development of rubber
processing technology
With the discovery of a solvent for rubber befor e the turn into
the nineteenth century the way was opened for rubber manufacturing .
In conjunction wi th the deve lopment of a rubber so lution spreader,
the a bi lity t o d iss olve rubbe r and apply it to fabrics opened a whol e
new range of app lication s for rubber as a raw ma t erial . At abou t the
same time a mechanical rubber masticator was developed which not only
permitted the continuous r eworking of rubber into a plastic state without
destroying its ultimate phys i cal qualities, bu t also established the
t echnical base by which othe r material could be "compounded" with
14
rubber. l3
The new technological base for working rubber, and the increasing
variety of products which could be made , generated an increasing demand
for rubber as an industrial material. Shoes, waterproof garments (in-
e luding the famous Mackintosh raincoat), and a growing number of commonly
used rubber products began to enter the market in significant quantities.
Whereas the demand for rubber in the late eighteenth century probably
never exceeded several thousand pounds a year, by 1820 consumption in
Europe and the Uni t ed States was at the rate of 100 t ons annually . 14
By the late 1830's international trade in rubber was sufficiently im-
portant t o warrant the development of secondary rubber markets in both
New York and London (see Table 1).
Despite the growth in demand r es ulting from new processing and fab -
ricating t echniques, rubber still presented both the fabricators and th e
end users with serious problems . On hot days, it became sticky and
adhesive as well as malodorous. Direct sunlight resulted in rapid
deterioration . And when rubber was exposed t o low temperature it became
stiff and non-elastic. Users soon discovered that rubber retained its
most useful and desirable physical properties within narrow t emperature
ranges, a severe limitation on its us e in either hot or cold weather.
While the demand for rubber continued to grow , consumers of the increasing
l3French chemis ts Louis Antoine Prosper Herissant and Pierre Joseph Macquer found " turpentine and ether" could be used as solvent s in 1763 and later in 1819 Charles Mackintosh used "naphtha" as a solvent. Thomas Hancock's 1819 machine for a modern internal mixer was called the "pickle. "
14 No pre -1 825 rubber trade statistics are available.
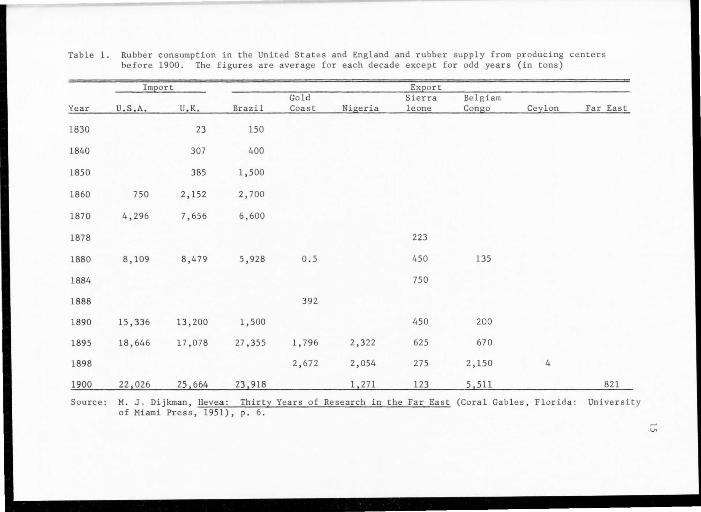
Table l. Rubber consumption in the United States and England and rubber supply from pr oducing centers before 1900. The figures are average for each decade except for odd years (in tons)
Im2ort Ex ort Gold Sierra Belgiam
Year u.s .A. U. K. Brazil Coast Nigeria leone Congo Ceylon Far East
1830 23 150
1840 307 400
1850 385 1,500
1860 750 2,152 2,700
1870 4,296 7,656 6,600
1878 223
1880 8,109 8,479 5,928 0 . 5 450 135
1884 750
1888 392
1890 15,336 13,200 1,500 450 200
1895 18,646 17 , 078 27,355 l, 796 2,322 625 670
1898 2,672 2,054 275 2,150 4
1900 22 026 25 664 23 918 l 271 123 5 511 821
Source: M. J. Dijkman, Hevea : Thirty Years of Research in the Far East (Coral Gab l es, Florida: University of Miami Press, 1951), p. 6.
~
V>
16
number of r ubber goods , particularly in the United States, were l os ing
enthusiasm for products that were usable onl y under certain temperature
condi ti ons .15
Technologica l base for a large - sca l e
industrial use of rubber
The basi s fo r the modern rubber manufacturing industry was e stabl-
l i shed in 1839 when Charles Goodyear discovered a means of permanently
altering the physical proper ties of rubber by heating it in combinati on
wi th su lphur. 16 The pr ocess , called vulcanizati on, transformed rubber
in t o a far more useful material. It became far s tr onger and durable;
it maintained its elasticity and pliability within a wide -temperature
range; and it lost its odor and surface adhes iveness. The discovery
of the vul canization process stands out as one of the major developments
in nineteenth century t echnology. It also marks the beg inning of a
stage of rapid and sus tained growth for the rubber industr y that contin-
ued wi th on l y minor interruption for the rest of the century.
Demand fo r raw material a s a r esu lt of this rapid proliferation of
new rubber products and expansion o f manufac turing activ ities gr ew
tremendou sly in bo th the United States and Europe. By the end of the
15A number o f American rubber goods manufac turing companies e stablished in the first decades of the 19th Century went into bankruptcy largely as a r esult of consumers 1 r eactions t o their products under "ho t" and "co ldu weather conditions.
16Although some chemist s were on the track of vulcanization prior
to 1839, including Fr ederic Lude rsdorff (German), J. van Geuns {Dutch) and Nathaniel Hayward (American) it r ema ined for Good year t o make it a reality. But Hancock secured the English patent right t o it in 1843. See Lerner,~ .• p. 740.
17
century, annual world consumption of raw rubber had increased ove r
five hundred - fold over 1820 l eve l s to a r ate of approximately 50,000
t ons (see Table 2).
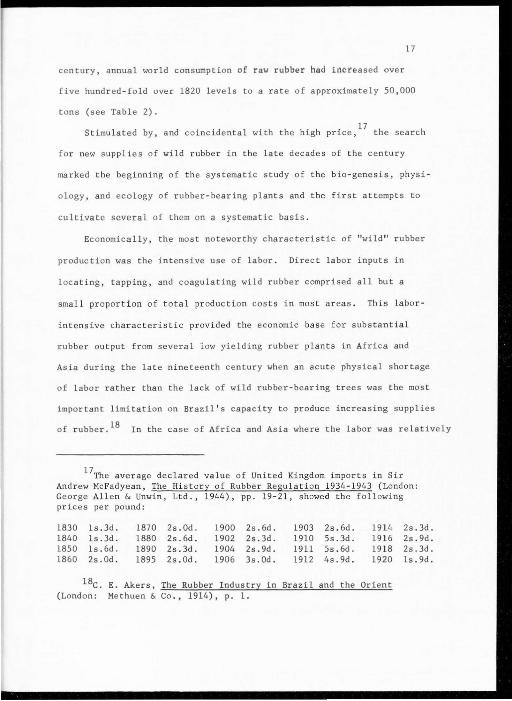
Stimulated by, and coincident al with the high price,17
the sea r ch
fo r new supplies of wild rubber i n the la t e decades of the century
marked the beginning of the systema tic s tud y of the bio-genesis, physi-
o l ogy , and eco l ogy of rubber - bearing plants and the first attempts to
cu ltivate sever al of them on a systematic basis .
Ec onomically , the most no t eworthy c haracteristic of "wild " rubber
production was the intensive use of labor. Direc t labor inputs in
loca ting , tapping, and coagu lating wild rubber comprised all but a
smal l proportion of t otal production cos t s in mos t areas. This labor -
intensive characteristic provided the economic base for substantial
rubber output fr om several low yielding r ubber plants in Af rica and
Asia during the late nineteenth century when an acute physical shortage
of labor rathe r than the lack of wild rubber-bearing trees was the mo s t
important limitation on Brazil's capacity to produce increas ing supplies
of rubber . 18 In the case of Africa and Asia where the labor was r e latively
17The average declared value of United Kingdom import s in Sir Andrew McFadyean, The History of Rubber Regulation 1934-1943 (Lond on: George Allen & Unwin, Ltd., 1944), pp . 19-21 , showed the following pric es per pound:
1830 ls .3d. 1870 2s.Od. 1900 2s. 6d . 1903 2s.6d. 19 14 1840 ls.3d. 1880 2s.6d . 1902 2s.3d. 1910 5s.3d. 19 16 1850 ls.6d. 1890 2s.3d. 1904 2s .9d. 1911 5s.6d . 1918 1860 2s .Od. 1895 2s.Od. 1906 3s.Od. 1912 4s .9d. 1920
18c. E. Akers, The Rubber Industry in Brazil and the Orient (London: Methuen & Co., 1914), p. 1.
2s . 3d. 2s . 9d. 2s.3d. ls .9d.
18
Table 2 . Total and types of rubber production by specific years, 1836-1866 (in thousand long tons)
Year
1825 1830 1835 1840 1845
1850 1855 1860 1865 1870
1875 1880 1885 1890 1895
1900 1905 19HJ 1915 1920
1925 1930 1935 1840 1945
1950 1955 1960 1965 1966
Wild rubber
0.1 0.2 0 . 1 0.4 0.6
1.5 2.2 2.7 3.5 6.6
8.0 9.7
12.0 17.9 26.1
43.3 62.1 82.0 50.0 37.0
42.0 20.2 17.7 26.0 47.1
26.9 26.0 29.7 38.5 32.5
Plantation rubber
0.5
0.8 0.5 0.8 0.5 0 . 5
0.8 0.1
11.0 115.6 319.6
482.9 805 . 9 854.9
1,391.5 202.9
1 , 833.1 1,891.5 1,972.8 2,292.2 2 375.5
Synthetic rubber
42.4 866.1
534.6 1,085 . 3 1,892.5 3,015.0 3 318.0
Total world production
0.1 0.2 0.1 0.4 0.6
1.5 2.2 2.7 3.5 7.1
8.8
10.2} 12.8 18.4 26.6
44.1 62.1 93.0
166.6 353.6
524 . 9 826.1 872.6
1,459.9 1,116.1
2,394.6 3,002 . 8 3,895.0 5,343.0 5 726.0
()Q"'
" 0 " 0 3 " 11> "' " -"' "' " :r " 0 0.11>
"' 3 • 11> 0 .: ::l'O>
" " " 11> .... " 0'0
"" ... o
"' .... 0 '< 0 .... 11>
> " "' 0 3 0 cr .... .... 11>
" " a.
" .... " 11>
"'
0 H>
Source: 1825-1900 from G. L. Wallace, "Statistical and Economic Outline," in P. Schidrowitz and T. R. Dawson (eds.), History of the Rubber Industry (London: Institution of the Rubber Industry, 1952), p . 86. 1905 from H. Stuart Hotchkiss, "The Evolution of the World Rubber Situation, " Harvard Economic Review, II(l923-l924), p. 130. 1910-1935 from George Rae, "Statistics of Rubber Industry, " Journal of the Royal Statistic Socie ty, Part II(l938), p. 345. 1940- 1966 from Rubber Statistical Bulle tin, several issues .
19
plentiful and cheap it became economically feasib l e to utilize higher
physical labor inputs in securing a given we ight of rubber from many
low-yielding rubber plants. The wild fig (Ficus elastic) and the Urceola
elastica vines in Asia, the Clitandra vines found throughout most of
tropical Africa, and after 1883 the Funtumia e lastica (Kickseia) were
examples of relatively poor yields which became commerical sources of
rubber in the 1890's. The economic advantages of low cost labor19
appeared to have been so s ub s tant ial that s hipment s of African and Asian
wild rubber to wo rld markets expand ed rapidly after 1880. By 1900
Africa alone was producing more than a third of world supplies, as Table
2 indicates .
Planta tion rubber in Southeast Asia and
the parallel development of the mass-
produced automobile
Rapidl y increasing demand in the face of the short-run upward
inelasticity of wild rubber supplies had already led to record price
levels when new technical developments in both the supply and the demand
side of the industry formed the basis of the fourth phase of rubber's
history. On the demand side, the f ir st facto r was the development in
the initial decades of the twentieth century of t he automobile industry,
primarily in the United States, with its needs for rubber tires, gaskets,
tubing, and other items. The derived demand for rubber s t emming from
the expansion of the automobile industry for overshadowed anything
that had ever been known in the industry before. Automobile manufactures
19Ibid . , p. 25.
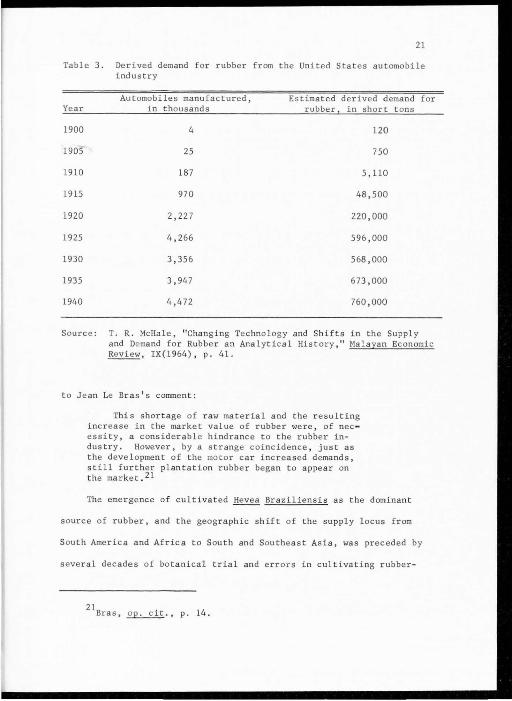
20
which had used practically no rubber in the 1880's and only a few t ons
in 1900, consumed 5, 110 t ons, r epresenting 70 t o 80 percent of all
rubber produced in the world, by 1910 .
Rubber has always been a minor material in an automobile (usually
amoun ting to less than 4 t o 5 percent of the total weight and r are l y
exceeding the same percentage of total cost. 20 The absolute quantit y
of rubber consumed in the i ndus t r y gr ew large because the production of
cars grew large . To apprec iat e the r ela tionship of the automobile in-
dustry to the incr eas ing demand for r ubbe r in the f i rst fou r decades
of the twen t ie t y century, Table 3 provides a r ecord of the production
of mot or vehicl es in the Unit ed States from 1900 t o 1940 and es timated
demand for rubbe r derived f rom the i ndu s try alone . The derived 1915
demand for rubber in the American automobile alone was grea t e r than the
t otal aggregate supply for rubber in the world in 1900.
The rapid esca lation of derived demand fo r rubber s t emming from
the gr owth of the automob ile industry began at a time when high prices
and sever e shortage s had already led t o wor ld-wide searches fo r new
sources of rubbe r . Only the development of a substantial plantation
industry in South and Southea s t Asia enabl ed supply t o expand rapidly
enough t o f ill demand. Demand deve l s exceeded 100,000 t ons by 1912 ;
200,000 by 1916; 300,000 by 1919; and 1,000 ,000 t ons by 1930 . According
20In addition t o tire s the r e are numerous other uses for rubber in the modern automobi l e. In the average Ameri can passenger car, this adds up t o 175 pounds or mo r e per car , including tires, for 1967 models . Fr ed Olmsted, " Rubber in the 1967 Automobile ," Rubber Age , XCVIII(l966), p. 68 . The f irst models at the turn of the century used less, but 60 pound s i s pe rhaps the l owes t amount ever used in the standard automobile, and the amount t ends t o increas e steadily over the years . The 1942 mode ls used approximatel y 171 pounds of rubber . W. S. Woyt insky and S. E. Woytin sky, 1-lorld Population and Production (New York: 20th Century Fund, 1953) , p . 1168.
21
Table 3 . Derived demand for rubber from the United States automobile industry
Aut omobi les manufactured, Estimated derived demand for Year in thousands rubber in short t ons
1900 4 120
1905 25 750
1910 187 5,110
1915 970 48,500
1920 2,227 220,000
1925 4,266 596,000
1930 3,356 568,000
1935 3,947 673,000
1940 4,472 760,000
Source: T. R. McHale, "Changing Technology and Shifts in the Supply and Demand fo r Rubber a:1 Analytical History," Malayan Economic Review, IX(l964), p. 41.
to Jean Le Bras's comment:
This shortage of raw material and the resulting increase in the market value of rubber were, of nee• essity , a considerable hindra nce to the rubber industry. However, by a strange coincidence, just as the development of the motor car increased demands, still further plantation rubber began to appear on the marke t . 21
The emergence of cultivated Hevea Braziliens i s as the dominant
source of rubber, and the geographic shift of the supply locus from
South America and Africa to South and Southeast Asia, was preceded by
several decades of botanical trial and errors in cultivating rubber -
21sras, £E..:......£i£ . , p. 14 .
22
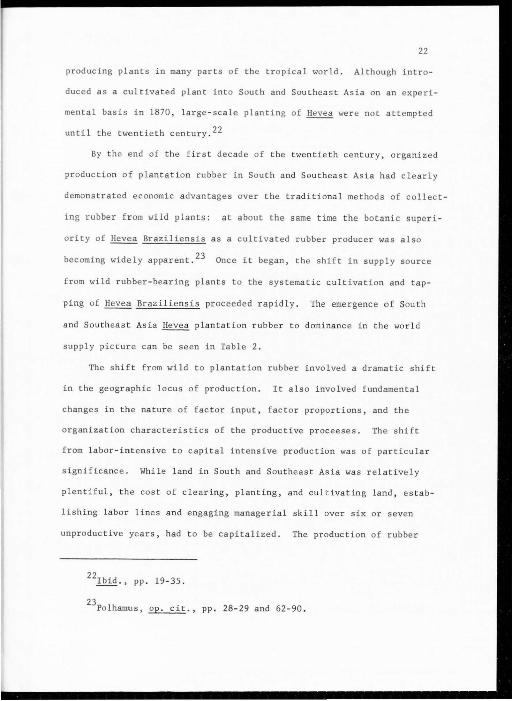
producing plants in many parts of the tropical world. Although intro
duced as a cultivated plant into South and Southeast Asia on an experi
mental basis in 1870, large-scale planting of Hevea were not attempted
until the twentieth century.22
By t he end of the f irst decade of the twentieth century, organized
production of plantation rubber in South and Southeast Asia had clearly
demons trated economic advantages over the traditional methods of collect -
ing rubber f r om wild plants: at about the same time the botanic superi-
ority of Hevea Braziliensis as a cultivated rubber producer was also
becoming widely apparent . 23 Once it began, the shift in supply source
from wild rubber -bearing plants to the systema tic cultivation and tap
ping of Hevea Braziliensis proceeded rapidly . The emergence of South
and Southeast Asia Hevea plantat ion r ubber to dominance in the world
supply picture can be seen in Table 2.
The shift from wild to plantation rubber involved a dramatic shift
in the geographic locus of production. It also involved fundamental
changes in the nature of factor input, fac tor proportions, and the
organization characteristics of the productive proceeses. The shift
from labor-intensive to capital intensive production was of particular
significance . While land in South and Southeast Asia was relatively
plentiful, the cos t of c l earing , plant ing, and cultivating land, es t ab
lishing labor lines and engaging managerial ski ll over six or seven
unproductive years, had t o be capitalized. The production of rubber
22Ibid., pp. 19- 35.
23Polhamus, ~., pp. 28 - 29 and 62 -90.
23
per tree during the early plantation period began at several hundred
pounds and rapidl y exceeded 1,000 pounds per years. Consequently labor
inpu t s in the tapping, col l ec ting , and coagulating of rubber is very
low compared t o wild rubber cost where the average individual tapper
rarely had an out put in excess of 100 pounds per year.24
World-rubber price had remained around 60 cents per pound in the
decade 1895-1904 as plantation cultivation of Hevea expanded s l owl y
but steadily in South and Southeas t Asia. In 1905-1906 r ecord high
prices had substantial impact on world rubber s upplies. A rubber
planting boom, fi nanced in large part by London speculators and later
joined by Amsterdam speculators, was under way. Rapidl y increas ing
demand for rubber as a result of g rowing needs in the American aut o
industry, and the inability of wild rubber production to meet the require-
ments sent r ubber prices skyrocke ting t o mere than $2 a pound in th e
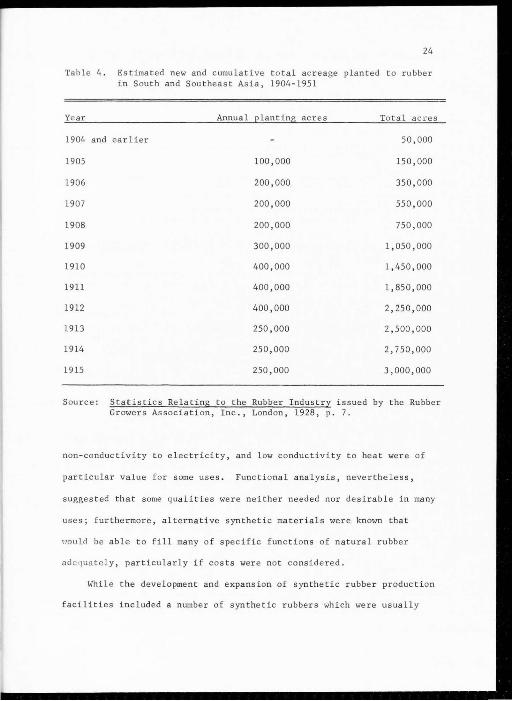
Uni t ed States in 1910 and 1911. The impact of the spectacu lar price
rise on rubber planting in South and Sou theast Asia is indicated in
Table 4.
Consumers of rubber in the United States, Germany, Russia, and the
Uni t ed Kingdom wer e all faced with the f act that rubber's t echnica l
value in us e stemmed from a unique set o f prope rties possessed by no
o the r known material. Elasticity, res iliency, extensibility, and capa-
city to absorb shock were the most important of thes e general properties,
but highl y specific ones like inertnes s , impermeability t o water and
numero us other liquids and gases, high fictional r es istance when dry,
24 T. R. McHale, "Changing Technology and Shifts in the Supply and
Demand for Rubber, an Analytical History," Malayan Economic Review, IX(l964) , p. 33 .
24
Table 4 . Estimated new and cumulative total acreage planted to rubbe r in South and Southeast As ia, 1904-1951
Year Annual elanting acres To tal acres
1904 and earlier 50 ,000
1905 100,000 150,000
1906 200,000 350,000
1907 200,000 550,000
1908 200,000 750,000
1909 300,000 1,050,000
1910 400,000 1,450,000
1911 400,000 1, 850 , 000
1912 400,000 2,250 , 000
1913 250,000 2 ,500,000
1914 250,000 2,750,000
1915 250,000 3,000,000
Source: Statistics Relating t o the Rubber Industry issued by the Rubber Growers Assoc iation, Inc., London, 1928, p . 7.
non-conductivity to e lectrici ty, and l ow conductivity to hea t were of
particular value for some uses. Functional ana l ysis, never theless ,
suggested that some qualities were neither needed nor desirable in many
uses ; f urthermore, alternative synthetic mater ials were known that
uould be able to fi ll many of specific functions of natural rubber
ad equa t e ly, particularly if costs were not considered.
While the development and expansion of synthetic rubber production
facilities included a number of synthetic rubbers which we r e usuall y
25
described as general purpose rubbers, budadiene - styrene co-polymers,
now referred to as SBR, were considered the most important substitutes .
Of all the available synthetics, they possessed the greatest balance
of functional qualities sought in the widest range of applications.
SBR rubbers were super i or to natural rubber in on ly a few minor ways
but, for most heavy volume use, they provided an adequate substitutes
for natural rubber. 25
Not only was the South and Southeas t Asian rubber supply potential
far greater than anything known, but it was also technically, organiza-
tionally , and economically different from the wide rubber supply
complexes of South America or Africa. Systematic planting, cultiva-
tion, and tapping tied up large amounts of capi tal and labor over long
periods of time. Direct labor inputs in the tapping and processing ,
on the other hand, were reduce d from a dominent cost input to a minor
cost input on a typical plantation. The increasing level of f ixed
cos ts involved in rubber production and the decreasing level of variable
costs in the form of direct labor inputs mean t that rubber supplies
were becoming far more inelastic than they had been when wild rubber,
with its low capital commitment and highly variable direct labor input,
dominated the scene. 26
25 R. F. Dunbrook, "Historical Review," in G. S. Whitby and Other
{eds.), Synthetic Rubber {New York: John Wiley and Sons, Inc., 1954), pp. 32 -5 5; Phillips,~., pp . 10-15; Huke, ~., pp. 27-65.
26The emergence of the smallholder changed this to some degree.
World War II and the development of
synthe tic substitu tes for natural
rubber
26
The fifth phase in the history of rubber began during the Second
World War. With the world ' s largest consumers of rubber effectively
cut off from the major Southeast Asian producers, alternative sources
of natural rubber supplies or alternative material that could replace
natural rubber had to be found without delay. The seven years gap
between planting Hevea andlits'initial tappability, the limited pros
pects of any dramatic increase in wild rubber supplies, and unpromising
prospects for semi-tropical or temperate vegetative sources forced all
major consumers to seek a solution to their prob lem in development of
"synthetic" s ubstitutes rather than in new vegetative sourc es of natural
rubber.
Working with synthetics during the war led to the identification
of limited areas where synthetics possessed technical advantages over
natural rubber. In th e immediate postwar period, however, when free
choice between natural and synthetic rubber became possible, the heavy
demand for natural rubber reflected its technical and cost advantages
in all large volume usages.
While the so - called speciality synthetics , like CR, IIR, and NBR
appeared capable of holding and expanding a relatively low vo lume
technical market, the future of general-purpose SBR was clearly in
doubt in the early postwar year--particularly in the United States.
Wartime research and development had led to a number of substantia l
i mprovements in processing and f abricating SBR, but it still appeared
unable to compete, even at a significantly lower cost, with natural
27
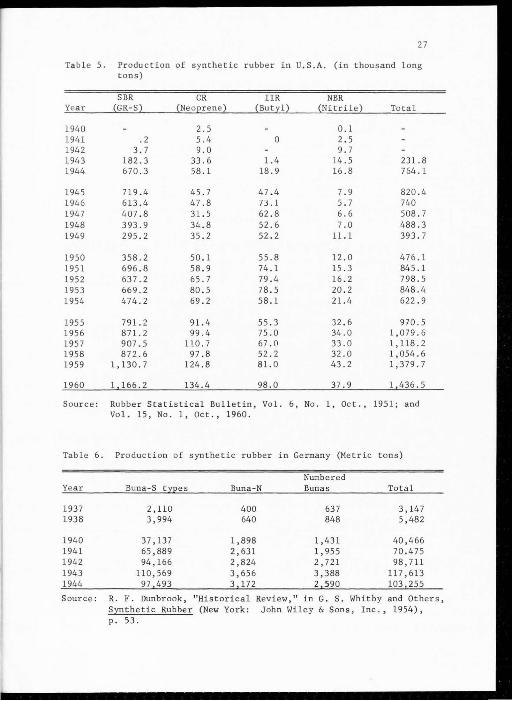
Table 5. Production of synthetic rubber in U.S.A. (in thousand long tons)
SBR CR IIR NBR Year (GR-S) (Neoprene) (Butyl) (Nitrile ) Total
1940 2.5 0.1 1941 .2 5.4 0 2 . 5 1942 3 .7 9.0 9.7 1943 182.3 33.6 1.4 14.5 231.8 1944 670.3 58 . 1 18 . 9 16 .8 764. 1
1945 719 . 4 45.7 47.4 7.9 820.4 1946 613.4 47 . 8 7:J. l 5.7 740 1947 407 .8 31.5 62.8 6.6 508.7 1948 393 . 9 34.8 52.6 7.0 488.3 1949 295.2 35.2 52 . 2 11.1 393.7
1950 358.2 50.1 55.8 12 .0 476 .1 1951 696.8 58 . 9 74 . 1 15 .3 845.1 1952 637.2 65.7 79.4 16.2 798.5 1953 669.2 80.5 78 . 5 20.2 848.4 1954 474 . 2 69 . 2 58.1 21.4 622.9
1955 791.2 91.4 55.3 32.6 970.5 1956 871.2 99.4 75.0 34.0 1 ,079 .6 1957 907.5 110.7 67.0 33.0 1,118.2 1958 872 .6 97.8 52.2 32.0 1,054.6 1959 1,130. 7 124 . 8 81.0 43.2 1,379 . 7
1960 l 166.2 134.4 98 . 0 37 . 9 l 436 . 5
Source: Rubbe r Stat is t ical Bul l etin, Vol. 6 , No. l , Oct., 1951; and Vol. 15, No. l, Oct., 1960 .
Table 6 . Producti on of synthetic rubber in Germany (Metric tons)
Numbered Year Buna-S t y2es Buna -N Buna s Total
1937 2,110 400 637 3,147 1938 3,994 640 848 5,482
1940 37,137 1,898 1 , 431 40,466 1941 65 , 889 2,631 1,955 70.475 1942 94, 166 2,824 2,721 98,711 1943 110,569 3,656 3,388 117,613 1944 97 493 3 172 2 590 103 255
Source: R. F. Dunb r ook, "Histor ical Review , 11 in G. s . Whitby and Others , S~the tic Rubber (New York: John Wiley & Sons , Inc . , 1954), p. 53.
28
rubber in any large volume. Fear that most of the synthetic rubber
industry established dur ing the war in the Uni t ed States would face
imminent economic collapse in the postwar years prompted legislation
(the Rubber Act of 1948, Public Law 469 of the 80th Congress) designed
to ensure survival of the industry. The law, which was to be adminis
t ered by the De partment of Commerce , r equ ired rubber manufacturers t o
use a certain percentage of synthetics in various rubber goods in ord er
to keep aggregate demand up to a specified level . With the technical
development, however, the legislation proved unnecessary and the law
had no impact on the industry.
Cold polymerization, new compounding
materials. and the stereo-regular
syn the tics
Polymer research ha s resulted in a continuous flow of new synthe
tic rubber type. Three major technical developments came into the pic
ture of Amiercan synthetic rubber. 27 The fi rst discovery technique
was the low t emperature polymerization of s tyrene and budadiene in
replacing a high temperature polymerization process which had been
used during the war because it permitted maximum output in the shortest
time . The discovery of a relatively quick "cold" polymerization process
in the immediate postwar years l ed to the production of a SBR with
great ly improved abrasion and aging resistance both substantial l y
superior t o natural rubber without a major increase in production cost.
Cold SBR soon demonstrated advantages over natural rubber in automobile
tire treads, and rapidly gained a major place in this important market.
27McHale, ~., p. 37-39.
29
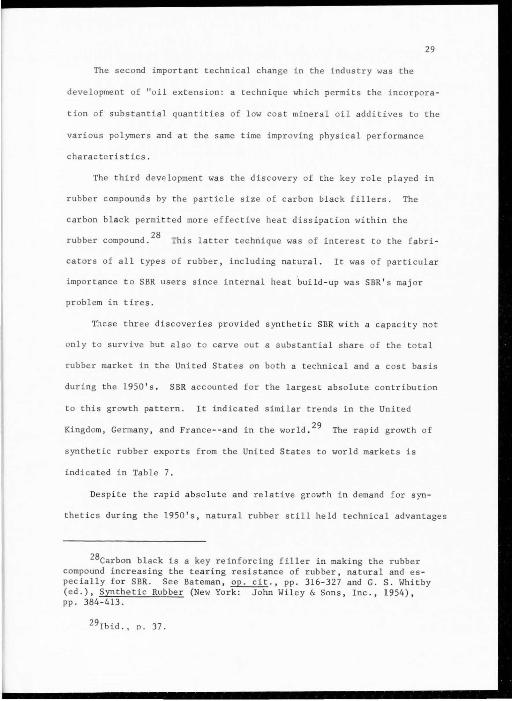
The second important technical change in the industry was the
development of "oil extension: a technique which permits the incorpora-
tion of substantial quantities of low cost mineral oil additives t o the
various polymers and at the same time improving physical performance
characteristics.
The third developmen t was the discovery of the key role played in
rubber compounds by the particle size of carbon black fillers. The
carbon black permitted more effective heat dissipation within the
rubbe r compound.28
This latter t echnique was of interest to the f abri-
cators of all types of rubber, including natural. It was of par ticular
importance t o SBR users since internal heat .build - up was SBR' s major
problem in tires.
These three discoveries pr ovided synthetic SBR with a capacity not
onl y to survive but zlso to carve out a subs t antial share of the total
rubber market in the United States on both a technical and a cost basis
during the 1950's. SBR accounted for the larges t abso lute contribution
to this growth pattern. It indicated similar trends in the United
Kingdom, Germany, and France - -and in the world. 29 The rapid growt h of
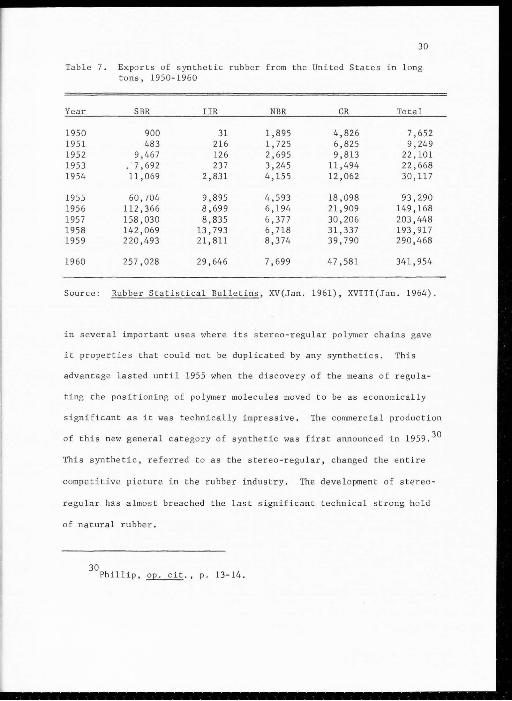
synthe t ic rubber exports from the United States to world markets is
indicated in Table 7.
Despite the rapid absolute and relative growth in demand for syn-
thetics during the 1950's, natural rubber still held t echni cal advantages
28carbon black is a key reinforcing fil l er in making the rubber compound increasing the tearing resistance of rubber, natural and es pecially for SBR. See Bateman,~., pp. 316-327 and G. S. Whitby (ed.), Synthetic Rubber (New Yo rk : John Wiley & Sons, Inc., 1954), pp. 384-413.
29Tbid . , p. 37.
30
Table 7. Exports of synthetic rubber from the United States i n l ong tons, 1950-1960
Year SBR IIR NBR CR Total
1950 900 31 1,895 4,826 7,652 1951 483 216 l , 725 6 ,825 9,249 1952 9,467 126 2,695 9,813 22' 101 1953 . 7,692 237 3,245 ll , 494 22' 668 1954 ll ,069 2,831 4, 155 12,062 30' ll 7
1955 60,704 9,895 4 ,593 18 '098 93,290 1956 112,366 8,699 6 ,194 21,909 149,168 1957 158,030 8,835 6 ,3 77 30,206 203 '448 1958 142 ,069 l3' 793 6 , 718 31,337 193,917 1959 220 , 493 21,8ll 8,374 39,790 290 ,468
1960 257,028 29' 646 7,699 47,581 341,954
Source: Rubber Statistical Bulletins, XV(Jan. 1961), XVI ll(Jan. 1964).
in sev e r a l important uses where it s s tereo -regu lar po l ymer cha ins gave
it proper ties that could not be dupl ica t ed by any synthetics. This
advantage lasted until 1955 when t he discovery of the means of regula-
ting the positioning of polymer molecules moved to be as econ om ically
significant as it was t echnically impressive. The commercia l production
of this new genera l category of syn the tic was first announced in 1959. 30
This synthe ti c, refer r ed to as the stereo-regular, changed the entire
competitive picture in the rubber industry. The deve l opment of stereo -
regular has almos t breached the last significant technical strong hold
of natura l rubber.
30 Phillip, ~-, p. 13-14.
31
Three stereo -regular rubbers are now being produced in significant
quantities in the United States and Europe. 31 If the cis 1,4 polyisoprene
is from a chemical stand point a synthetic "natural" rubber, in physi-
cal porperties it approximates natural rubber. Another stereo synthetic,
cis 1, 4 polybudadiene, is chemically dissimilar to natural rubber but
looms as a major economic and technical threa t in the automative tire
field because of substantially superior physical wear advantages over
natural rubber in almost all important func tional uses. A third stereo
synthetic, ethylene- propylene rubber or EPR, is potentially the most
inexpensive general -purpose rubber on the horizon and has attracted
wide -ranging attention despite its newness and the fact that it is
stil l not available in large commercial quantities.
31Richard A. Arnold, "The World Stereo Homopolymer Rubbers, " 54, 1966, pp. 59 - 63 .
CHAPTER III
ECONOMIC STRUCTURE OF THE NATURAL RUBBER INDUSTRY
Natural rubber is grown only in developing countries and consumed
almost exclusively elsewhere . In 1959-1961 less than 5 percent of
total output was consumed in countries where rubber is grown , 73 percent
was exported to developed and 21 percent to centrally planned countries.l
Most of the natural rubber produced is from Southeast Asia . It can be
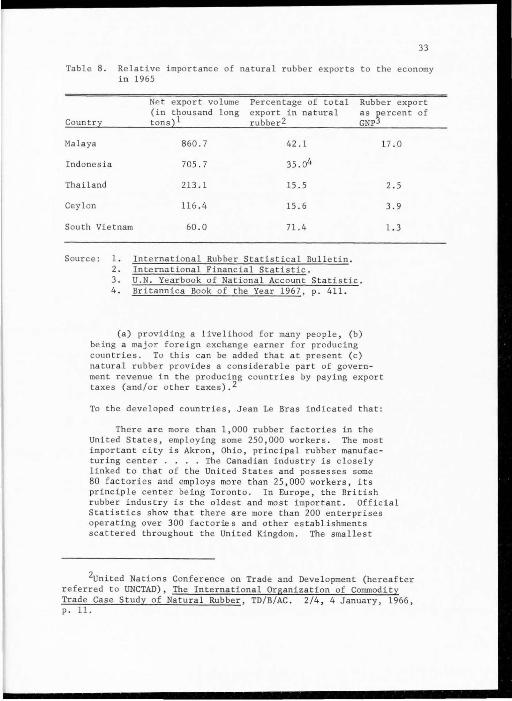
seen in Table 8 that for most of these countries natural rubber is a
major foreign exchange earner, and for some of them a very important
source of national income and therefore furnishes one of the major
opportunities for emp loyment and economic deve l opment. On the whole
it can be said that for most countries in Southeast Asia natural
rubber is one of the main pillars of the economy.
As Table 8 indicates, over two thirds of the total export earnings
were attained through the exports of natural rubber in the Federation
of Malaya, Indonesia and South Vietnam. In the other two nations
whic h owe sizeable proportions of their exports t o rubber, the percen-
tages were about 16 percent. Therefore, Mrs. M. J. 't Hooft Welvaars,
of Amsterdam University, described the role of natural rubber in develop-
ing countries as:
1F.A.O. Commodity Review-Special Supplement, Trade in Agricultural
Commodities in the United Nations Development Decade, Vol. l (CCp 64/6), 1964, p. II - 101.
33
Table 8. Relative importance of natural rubber exports t o the economy in 1965
Ne t export volume Percen tage of t o tal Rubbe r export (in thousand long export in natural as ~ercent
Country tons) 1 rubber2 GNP
Malaya 860.7 42 . 1 17 .0
Indones ia 705.7 35.04
Thailand 213.1 15.5
Ceylon 116.4 15.6
South Vietnam 60.0 71.4
Source: 1 . 2. 3. 4.
Inte rnational Rubber Stat ist i cal Bu lletin . International Financial Statistic. U.N. Yearbook of National Account Stati s tic . Britannica Book of the Year 1967, p. 411 .
(a ) providing a livelihood fo r many people , (b) being a major foreign exchange earner for producing countries. To this can be add ed that at present (c) na tural rubbe r provides a considerable part of government revenue in the producing countries by paying export taxes (and/or other taxes) .2
To the deve l oped countries, J ean Le Bras indicated that :
There are more than 1,000 rubbe r factories in the United State s, employ ing some 250,000 workers. The most important city is Akron, Ohio, principal rubber manufacturing center . . . . The Canadian industry is close l y linked t o that of the United States and possesses some
2 .5
3.9
1.3
80 f actories and employs more than 25,000 workers, its principl e center be ing Toronto . In Europe, t he British rubbe r indu s try i s the oldest and most impor t ant. Official Statistics show that there are more than 200 enterprises operating over 300 factories and other es tablishments sca tte r ed throughout the United Kingdom. The smallest
2united Nations Confe rence on Trade and Deve l opment (hereaf t er referred to UNCTAD), The Inte rnational Organization of Commodity Trade Case Study of Natural Rubber, TD/B/AC. 2/4 , 4 January , 1966, p. 11.
of
34
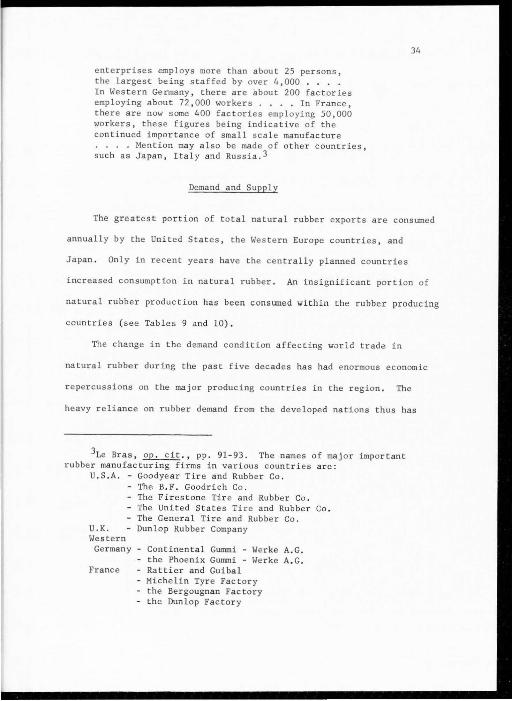
en t erprises employs more than about 25 persons, the largest being staffed by over 4,000 .... In Western Germany, ther e are about 200 factories employing about 72,000 workers ... . In France, the r e are now some 400 factories employi ng 50,000 workers, these figures being indicative of the continued importanc e of small scal e manufacture . ... Me ntion may al so be made of other countries, such as Japan, Italy and Russia .3
Demand and Supply
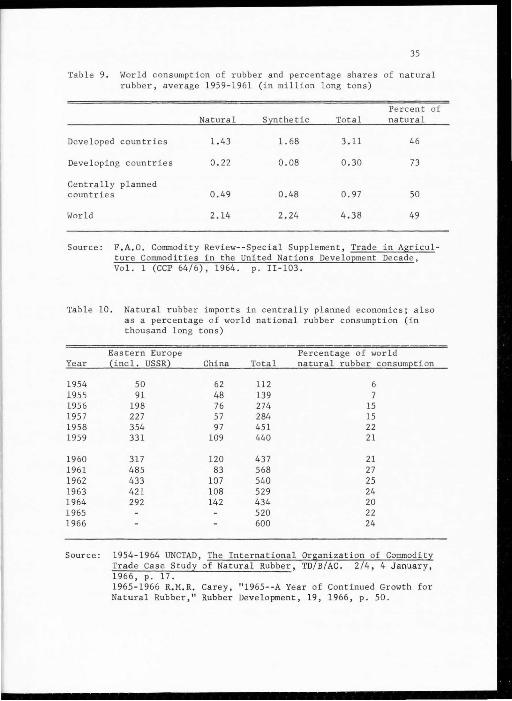
The greatest portion of t otal natural rubber exports are consumed
annually by the United States , the Wes t e rn Europe countries, and
Japan . Only in r ecent years have the cen trally planned countries
increased consumption in natural rubber . An insignificant portion of
natural rubber production has been consumed within the rubber producing
countries ( see Tables 9 and 10) .
The change in the demand condition a ffec ting warld trade in
na t ural rubber during the past five decades has had enormous economic
r epercussi ons on the maj or produ c ing countries in the reg i on. Th e
heavy r e liance on rubber demand from the deve loped nation s thus has
3Le Bras,~., pp. 91-93 . The names of major important rubbe r manufacturing firms in various countrie s are:
U.S.A. - Goodyear Tire and Rubber Co. - The B.F. Goodrich Co . - The Firestone Tir e and Rubbe r Co. - The United States Tire and Rubber Co. - The General Tire and Rubbe r Co.
U.K . - Dunlop Rubber Company Western
Germany - Continental Gummi - Werke A.G. - the Phoenix Gummi - Werke A.G.
France - Rattier and Guibal - Michelin Tyre Factory - the Bergougnan Factory - the Dunlop Factory
35
Table 9. Wor ld consumption of rubber and percentage shares of natural rubber, average 1959 -1961 (in million long t ons)
Percent of Natural S:i!!thetic Total natural
Developed countries 1.43 1. 68 3.11 46
Dev e loping countries 0.22 0.08 0.30 73
Cent ra ll y planned countries 0.49 0.48 0.97 50
World 2.14 2.24 4.38 49
Source: F.A.O. Commodity Review--Special Supplement, Trade in Agriculture Commodities in the United Nations Deve lopment Decade, Vo l. 1 (CCP 64/6), 1964 . p. II-103.
Table 10. Natural rubbe r imports in centrally planned economics; also as a pe r centage of world national r ubber cons umption (in thousand l ong t ons )
Eastern Europe Percentage of world Year (inc 1. USSR) China Total natural ru bber consumpti on
1954 50 62 112 6 1955 91 48 139 7 1956 198 76 274 15 1957 227 57 284 15 1958 354 97 451 22 1959 331 109 440 21
1960 317 120 437 21 1961 485 83 568 27 1962 433 107 540 25 1963 421 108 529 24 1964 292 142 434 20 1965 520 22 1966 600 24
Source : 1954-1964 UNCTAD , The International Organization of Commodity Trade Case Study of Natural Rubber, TD/B/AC. 2/4, 4 January, 1966, p . 17 . 1965-1966 R. M.R. Carey, "19 65 --A Yea r of Con tinued Growth for Na tural Rubber," Rubber Development, 19 , 1966, p. 50.
36
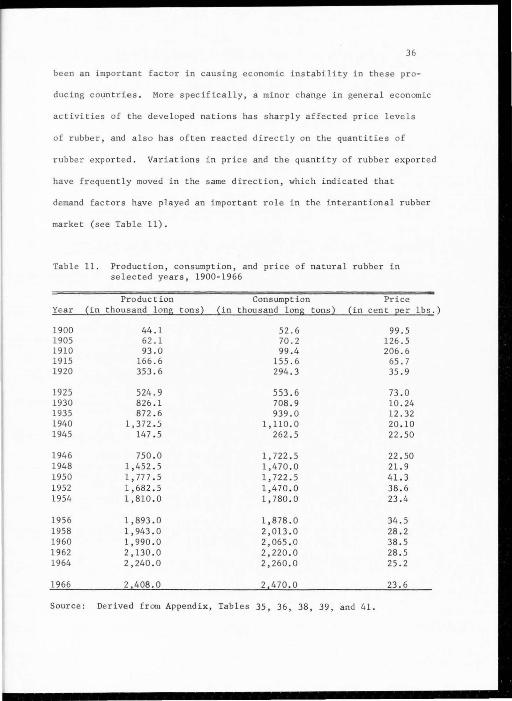
been an important fac t or in causing economic ins tability in these pro-
ducing countr ies . More specifically, a minor c hange in gene ral economic
act i vities of the developed nations has sharply affected price levels
of rubber, and also has often reacted directly on the quantities of
rubber exported. Variations in price and the quantity of rubbe r exported
have f r equently moved in the same direc tion, which indicated that
demand factors have played an important r ole in the interantional rubber
market (see Table 11).
Table 11 . Production, co nsumption, and price of natural rubber in se lec t ed years , 1900-1966
Production Consumption Price Ye ar {in thousand l ong tons2 {in thou sand long tons2 {in c e nt 2er
1900 44 . 1 52.6 99.5 1905 62.1 70.2 126.5 1910 93.0 99 .4 206 . 6 1915 166.6 155 . 6 65 . 7 1920 353.6 294 . 3 35.9
1925 524.9 553.6 73 . 0 1930 826.1 708.9 10 .24 1935 872 . 6 939.0 12.32 1940 1,372 . 5 1,11 0 .0 20 . 10 1945 147 . 5 262 . 5 22.50
1946 750.0 1,722.5 22 . 50 1948 1,452 . 5 1,470.0 21.9 1950 1 '777 . 5 1, 722 . 5 41.3 1952 1 ,682 . 5 1, 470 . 0 38 . 6 1954 1,810 . 0 1,780 . 0 23 . 4
1956 1,893.0 1,878.0 34.5 1958 1,943.0 2,013.0 28 . 2 1960 1,990 . 0 2,065 . 0 38.5 1962 2,130.0 2,220 .0 28 . 5 1964 2,240 . 0 2,260 . 0 25 . 2
1966 2 408.0 2 470.0 23.6
Source: Derived from Appendix, Tables 35, 36, 38, 39, and 41 .
lbs.)
37
However, the heavy de pendenc e on the demand for natural rubber in
developed countries has no t been the only cause of instabilit y in these
rubber producing nations. This vu lnerable position has been accentuated
by the l ow e lasticity and f lexibility of natural rubber supply . The
students of the rubber industry are generally agreed that short-run
suppl y of the natural rubber industry is price inelastic:
While production is responsive t o price~, the ex tent to wh ich it c an be increased at any one time is limited by the number of tree s which can be tapped. It must be remembered that it takes seven years from the time of planting for a rubber tree to come into tapping . . .. Supply does not therefore, due to it r e lative short -term inelasticity , fully or rapidl y adjust itself to major changes in demand and in consequence this is a maj or cause of price in stabili t y . 4
P. T. Bauer adds:
The vulnerable position of the industry was accentuated by the low elasticity of 8Upply of important group s of produce rs.S
When rubber demand has declined in the past, the majority of estat e
producers have maintained output at a fairly constant level until the
price of rubber declined be low direct costs. These direct costs are
es t ima ted at approximately one-third to two-fifths of t otal costs.
But many small holders have virtually no direct costs and they can be
expected not on l y to maintain their c urren t production, but they may
e ven increase output in order to compensate for l os t income due to the
4p. E. Adams, Memorandum on the Fluctuations in the Price of Natural Rubber (Kuala Lumper, Malaysia: Governmen t Printer, 1958), pp. 2-3.
5P. T. Bauer, The Rubber Industry: A Study in Competiti on and Monopoly (Cambridge: Harvard University Press, 1948), p. 28.
price declines. 6 Owing to the characteristic of the demand for and
supply of natural rubber, prices have exh ibited abrupt and violent
fluctuations . 7
Consumption by Regions
The world consumption of new rubber, including both natural and
syn thetic, has been continuously rising, despite the years of sharp
38
depression and political and economic uncertainties . Table 12 presents
the average regional share of the world's total consumption of new
rubber in each decade since the turn of this century for the United
States and Western Europe. The information in Tables · 2 , 35 and 36 are
considered together . It can be seen that the average consumption
figures in each decade shown in Table 12 for the United States, Wes tern
Europe, and the world as a whole, have been higher than the peak con-
sump tion in any year during the preceding decade. Tables 35 and 36
not on l y indicate the rapid growth in the consumption of new rubber
which has taken place in this century, but also clearly present the
importance of the United States and Western Europe as a rubber consumer.
In the present decade the United States' share of rubber consumption
has decreased. However, it is still the major rubber consuming country.
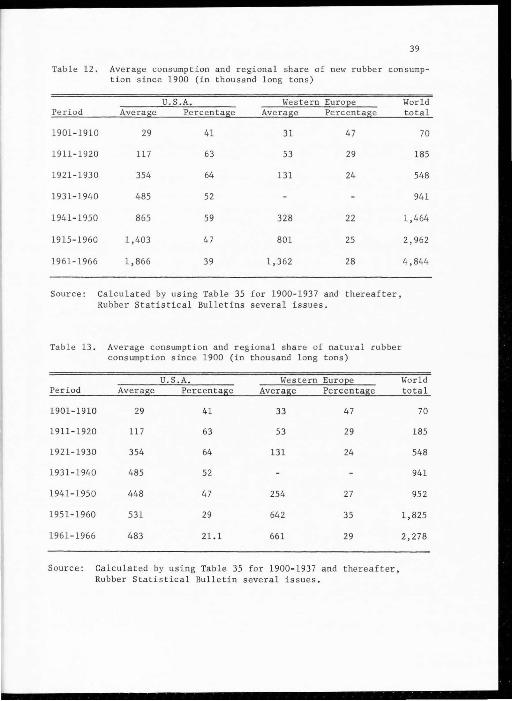
Table 13 shows the average consumption of natural rubber by regional
share of the world consumption, for the United States and Western Europe.
6you, Man He, "A Study of the Natural Rubber Industry with Special Emphasis on Its Future Prospects;" (Unpublished Ph.D . Disser tation, Eugene, Oregon: Univer sity of Oregon, 1963), p. 7.
7wharton, Clifton R. "Rubber Supply Condition: Some Policy Implication," in T. H. Sil cock and E. K. Fisk (eds.), The Political Economy of Independence Malaya: A Case Study in Development (Berkeley and Los Angeles, California: University of California Press, 1963), pp . 133-134.
39
Table 12. Average consumption and regional share of new rubber consump tion since 1900 (in thou sand long tons)
U.S.A. Western EuroEe World Pe riod Average Percentage Ave rage Percentage t ota l
1901-1910 29 41 31 47 70
1911- 1920 117 63 53 29 185
1921-193 0 354 64 131 24 548
1931-1940 485 52 941
1941- 1950 865 59 328 22 1,464
1915- 1960 1,403 47 801 25 2,962
1961- 1966 1,866 39 1,362 28 4,844
Source: Calcu lat ed by using Table 35 for 1900- 1937 and thereafter, Rubber Statistical Bulletins several issues .
Table 13. Average consumption and r egional s hare of natura l rubber consumpt i on since 1.900 (in thousand l ong t ons)
U. S. A. Western Euro2e World Period Average Perc entage Average Percentage total
1901- 1910 29 41 33 47 70
1911- 1920 11 7 63 53 29 185
1921-1930 354 64 131 24 548
1931- 1940 485 52 941
1941-1950 448 47 254 27 952
1951- 1960 531 29 642 35 1 , 825
1961-1966 483 21.1 661 29 2,278
Source: Calcula ted by using Table 35 for 1900- 1937 and therea f ter, Rubber Statistical Bulletin several issues .
40
There has been a gr owth in the cons umpt ion of natural rubber in each
decade in bo th the United States and Wes t ern Europe. Ye t, alth ough
average cons umption increased, it did no t e x pand enough t o s ur pas s the
peak of the preceeding decade. Th is i s an inte r e sting contras t t o the
case of new rubber which was examined in Table 12.
In th e period 1951-1960 and 1961-1966, the United State s and Wes t ern
Eur ope t oge ther consumed 64 and 50 per cent of the world's t o tal consump-
tion of natural r ubbe r re spective l y . This drastic decline f r om the
appr oximate 90 perc ent ave rage in the fi r s t three decade s was pr i maril y
due t o the large change in the us e of s ynthe tic rubber, parti cu l arly
i n the United States . Be f or e the s ynthe tic industry was successfull y
de ve loped, the United States alone absorbed 63 percent and 64 pe rcent
of the t o tal world consumption in the decade s 1911-1920 and 1921-1930
res pec tive l y . The e ff ec ts of th~ inc rea se use of >ynthe tic rubber
for wide l y diversified pr oduc t s in the decade 1951-1960 and 1961-1966 ,
on the Uni t ed States' de pendence on na tural rubber were great.8 The
share of the United States in the t otal world consumption of natura l
rubbe r wa s diminished t o 21 pe r cent in the period 1961- 1966, the all-
time l ow. In the present decade , the annual consumpti on of natural
rubbe r in the United States was approximate ly 500,000 t ons l ess than
that of We stern Europe .
Clearl y , less reliance on f or e ign sources f or natural rubbe r by
the United States is a result o f the succe ssful devel opment of synthetic
8UNCTAD, Report of the International Rubber, Study Group Working
Part y on the Prospects for Natural Rubber, TD/B / C. 1/ 20, 28 June , 1966, Appendix 1, pp. 1-7 .
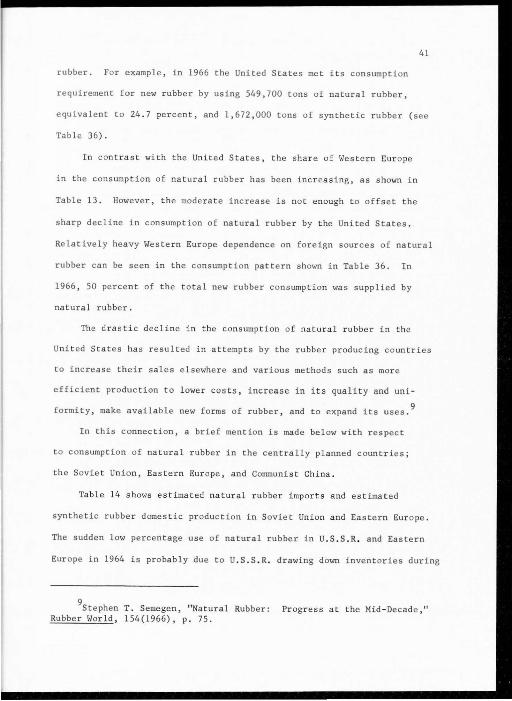
41
rubber. For example, in 1966 the United States met its consumption
requirement for new rubber by using 549,700 tons of natural rubber,
equivalent to 24.7 percent, and 1,672,000 tons of synthetic rubber (see
Table 36).
In contrast with the United States, the share of Western Europe
in the consumption of natural rubber has been increasing, as shown in
Table 13 . However, the moderate increase is not enough to offset the
sharp decline in consumption of natural rubber by the United States.
Relatively heavy Western Europe dependence on foreign sources of natural
rubber can be seen in the consumption pattern shown in Table 36. In
1966, 50 percent of the total new rubber consump tion was supplied by
natural rubber.
The drastic decline in the consumption of natural rubber in the
United States has resulted in attempt s by the rubber producing countries
to increase their sales elsewhere and various methods such as more
efficient production to lower cos t s , increase in its quality and uni
formity, make available new forms of rubber, and t o expand its uses. 9
In this connection, a brief mention is made below with respect
to consumption of natural rubber in the centrally planned countries;
the Soviet Union, Ea s t e rn Europe, and Communist China.
Table 14 s hows es tima t ed natural rub ber impor ts and estima t ed
synthetic rubbe r domestic production in Soviet Union and Eastern Europe .
The sudden low percentage use of natural rubber in U.S.S.R . and Eastern
Europe in 1964 is probably due to U. S.S . R. drawing down inventories during
9stephen T. Semegen, "Natural Rubber: Progress at the Mid -Decade, "
Rubber World, 154(1966), p. 75.
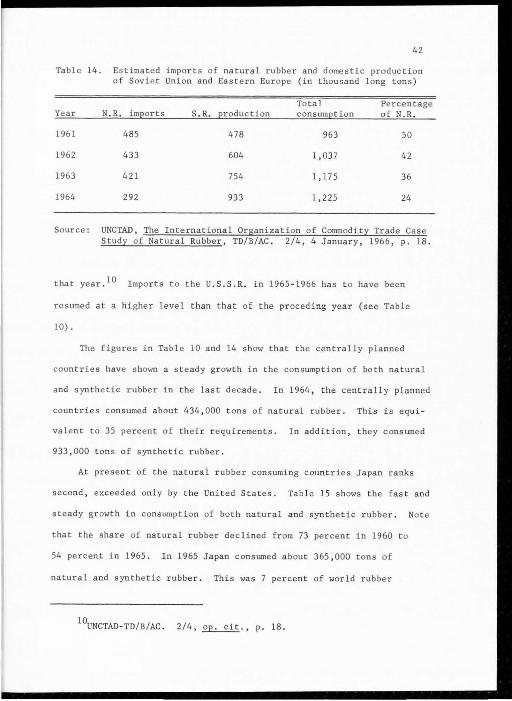
42
Table 14. Estimated imports of natural rubber and domestic production of Soviet Union and Eastern Europe (in thousand long tons)
Total Percentage Year N.R. im2orts S. R. eroduction consumEtion of N.R .
1961 485 478 963 50
1962 433 604 1,037 42
1963 421 754 1' 17 5 36
1964 292 933 1,225 24
Source: UNCTAD, The International Organization of Commodity Trade Case Study of Natural Rubber, TD/B/AC . 2/4, 4 January, 1966, p. 18.
that year. 10 Imports to the U.S.S.R. in 1965- 1966 has t o have been
resumed at a higher level than that of the preceding year (see Table
10) .
The figures in Table 10 and 14 show that the centrally planned
countri es have shown a steady growth in the consumption of both natural
and synthetic rubber in the last decade. In 1964 , t he centrally planned
countries consumed abou t 434 , 000 tons of natural rubber . This is equi -
valent to 35 percent of their requirements. In addition, they consumed
933,000 tons of synthetic rubber.
At present of the natural rubber consuming countries Japan ranks
second , exceeded on l y by t he United States. Table 15 shows the fast and
steady growth in consumption of both natural and synthetic rubber. No te
that the share of natural rubber declined from 73 percent in 1960 to
54 percent in 1965. In 1965 Japan consumed about 365,000 tons of
natural and synthetic rubber . This was 7 percent of world rubber
lOUNCTAD-TD/B/AC . 2/4, ~., p. 18 .
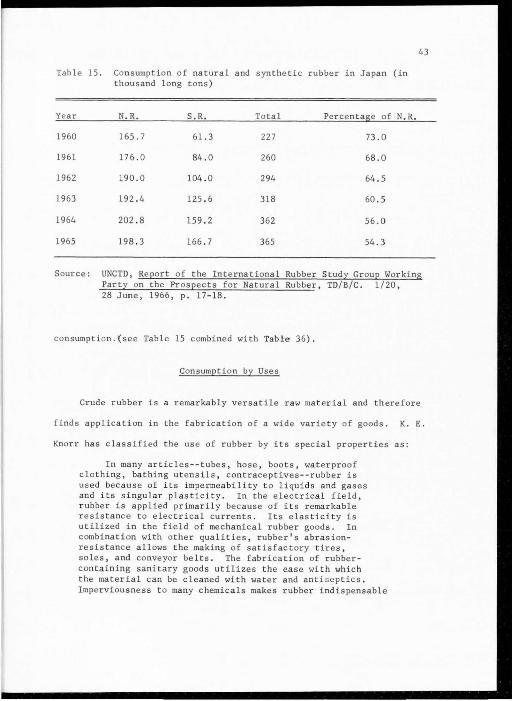
43
Table 15. Consumption of natural and synthetic rubber in Japan (in thousand long tons)
Year N. R. S.R. Total Percentage of N. R.
1960 165.7 61.3 227 73.0
1961 176.0 84 . 0 260 68.0
1962 190.0 104.0 294 64 . 5
1963 192.4 125 . 6 318 60.5
1964 202.8 159.2 362 56.0
1965 198.3 166.7 365 54.3
Source: UNCTD, Report of the International Rubber Stud y Group Working Party on the Prospects for Natural Rubber, TD/B/C. 1/20, 28 June, 1966, p . 17-18.
consumption . (see Table 15 combined with Table 36).
Consumption by Uses
Crude rubber is a remarkably versatile raw ma t er ial and therefore
finds application in the fabrica tion of a wide variety of goods. K. E .
Knorr has classified the use of rubber by its special properties as:
In many articles--tubes, hose , boots, waterproof clothing, bathing utensils, contraceptives-- rubber is used because of its impermeability to liquids and gases and its singular plasticity. In the electrical field, rubber is applied primarily because of its remarkable resistanc e to electrical currents. Its elast icity is utilized in the field of mechanical rubber goods. In combination with o the r qualities, rubber's abrasionresistance allows the making of satisfactory tires, soles, and conveyor belts . The fabrication of rubbercontaining sanitary goods utilizes the ease with which the material can be c leaned with water and antisep tics. Imperviousness t o many chemicals makes rubber indispensable

44
in the modern laboratory. 11
Concerning the importance of rubber, P. W. Barker, a rubber s pecial -
ist with the U. S. Department of Commerce has point ed out that:
Rubber is the one of the mos t useful substances in the world t oday. Remove it entire ly from our live s and civil ization would be plunged into another Dark Age ; gone wou ld be the modern system of communication and transportation . . . whole branches of the arts
and a bewildered world we would inhabit.l2
World consumption of rubbe r takes many forms. Countries not only
differ in the amount, but al so in th e natur e of the goods they produce.
The extreme l y rapid development of the pneumatic tire, which account ed
for more than 70 percent of total consumption around 1940, made its
mark almost everywhere , and, as a r es ult, production methods became
relatively standardized. 13 J ean Le Bras has classified the major types
of goods with reference t o the four l oca lizations of the industry .l4
First, there i s the heavy finished products industr y, corr esponding
to application in cars, bicycles and aircraft. It manufactures pne umatic
tires, inner tubes, solid tires, e tc., using mass - production methods
in extensive factories. It has been es tablished where a large labor
fo rce is readily available.
11K. E. Knorr, Wor ld Rubber and Its Regulation (California : Stanford University Press, 1945), pp. 44-45.
12P. W. Barker, Rubber Industry of the United States 1839~1939 Trade Promotion Series, No. 197 (Washington, D. C. Department of Commerce, 1939), p . 30.
13Le Bras, op. cit., p. 93.
14 Ibid . , pp. 93-9 6 .

45
The second group consists of the footwear industry, including the
manufacture of soles and heels, and the clothing industry. These are
frequently associated with the textile industry.
The third group includes the ancillary industries, covering the
production of all rubber articles li kely to be used in engineering or
for machine tools, such as hose, belting, conveyor belts, brake lining,
coating for metals, and also the cables and insula ting material for
elec trical equipment. Their location usually tends to reflect the
influence of concen tration of the engineering or electrical manufactur
ing industries .
In addition, there are many other types of goods --medical , surgical,
and dental goods , f urni shing materials, sports goods, glues and adhe
sives, printing accessories, and ebonite goods. Factors which determine
where it shall be produced are the location of the consumer, and very
frequently the availability of skilled labor of the different types
required for the heavy section of the industry.
Table 16 shows that in the United States, until 1941, 100 percent
of new rubber required in the production of transportation goods was
provided by natural rubber. However, abundant supplies of synthetic
rubber caused abrupt changes in the relative distribution of natural
and s~1thetic rubbe r in transportation products, as well as in non
transportation goods .
The use of natural rubber in transportation, almost entirely in
tires and tubes for automobile, farm tractors, trucks, buses, airplanes,
and bicycles , declined from 100 percent in 1941 to 14.7 percent in 1945 . 15
l5"The Rubber Wo rld Outlook for '67," Rubber World, 155, (January,
Table 16. Consumption of rubber in transportation and non-transportat ion and perce ntage of natural rubber to the total consumption (in thousand long t ons)
U.S.A. U.K. Franc e Year Trans2. % Non-transE:· % Trans E. % Non- transE. % TransE:· % Non -transE: ·. %
1935 378.5 100 113.2 99 . 8 1937 424.0 100 120.1 99.6 1939 442 . 7 100 151.1 98 . 7
1941 525.0 100 256.3 97.5 1943 348.8 66 . 5 139 . 7 61.5 1945 590.2 14.7 208.8 8.9 1947 830 . 6 53.3 291.6 41.1 1949 659.5 58.0 329 . 4 58 . 3 64.6 95.0 39.9 85.1
1950 818.2 58.4 440 . 3 55.1 128.7 100 93 . 8 97 . 0 65.4 95. 4 41.9 89.3 1951 812 . 0 38.1 401.0 36.1 135.8 100 102.3 96 . 3 1952 842.0 35.9 419.0 36 . 0 108.1 99 . 8 94.1 94.8 1953 858 . 0 41.7 480 .0 40.7 115.9 99. 6 95.6 95.3 1954 777.0 49.6 456 . 0 46.1 133.6 97.9 119.4 95.0
1955 960 . 0 42 . 7 570.0 39.5 147.9 92.5 120.7 92.5 1956 897 . 0 40.6 539.0 36.7 126.2 78 .4 113 . 6 89.9 1957 926.0 37 . 0 538 . 0 36 . 4 128 . 0 66 . 5 116.5 87.3 1958 861.0 35.1 496.0 36.9 126.6 63.0 119.3 86 .0 1959 1,024.0 34.7 603.0 33.8 142.3 59.1 120 . 0 83.3 115.5 66.5 84 . 2 67 . 3
1960 995 . 0 32.5 563.0 27 . 5 155.6 53.3 135.4 71.5 124 . 1 60.8 94.1 55.3
Source : Calculated from data in Man He You, ''A Study of the Natural Rubber Industr y with Spec ial Emphasis on Its Future Prospects 11 (Unpublished Ph.D. Dissertation, 'Eugene , Oregon: University o f Or egon, 1963), pp. 192- 197.
,_ "'
47
This was caused by the United Stat es being cu t off from Southeast Asia
rubber sources during World War II . Renewed supply of natural rubber
from Sout heast Asia after 1945 increased the proportion of natural rubber
absorbed in transportation products to 58 percent in 1950. This rise did
not last l ong . After the Korean Conflict, the sufficient supply of
syn thet i c rubber offe r ed various advantages in both prices and quality
as compar ed to natural rubber (see the detai l in Chapter V). The consump
tion of natural rubber in transportation declined t o the low level of
32 percent in 1960 . The most r ecent report from the General Tire Company
reveals that synthet i c rubber in America's transportation cont i nued its
gr owth in usage as i t r eached approximately 76 percent of t otal 1966
volume of raw mate rial . 16
As in the Unit ed States, the predominant position he ld by natural
rubber in transporation products has been serious l y a ffec t ed by the
recent emergence of syn thet ic rubber industries in both the Unit ed
Kingdom and France. Table 16 shows that the percentage use of natural
rubber declined f r om 100 percent in 1951 t o 53 percent i n 1960 in the
United Kingdom. In the case of France, the percentage dec lined f r om
95 percent in 1950 t o 61 percent in 1960 .
A similar trend in the dec l ine of the percentage use of natural
rubber in transpor tation goods is also apparent in non-transportati on
goods . In the United States, the proport i on of natural rubber used in
non-transportation products has been not only continuousl y fal ling,
but is also lower than the proportion of natural rubber used i n
16Ibid., p. 51
48
transportation goods. For exampl e: in 1960, 28 percent of total new
rubber consumption for non-transportation goods was supplied by natural
ru bbe r, while 32 percent was natural rubb e r in transportation products.
In the United Kingdom no sharp c hange in the distribution of new
rubber consumption in non-transportation produc ts ha s occurred in the
pas t decade . However, quite a change is ev ident in case of France.
Production
Plantation rubber production is ver y we ll developed in Southeas t
Asia because of well-distributed rainfall, t emperatur es between seventy
and nine t y degrees Fahrenheit, and abundant cheap labor .17
In addition
t o these fac t ors, four others are cited by Sir Andrew Me Fadyean in
explaining the development of rubber plantations in this area: (l) All
of the early experimental work on rubber planting was carried out he r e;
(2) the countries in which the plantation industry was begun had stable
governments with good a dministrators s ince they were either British
or Dutch colonies; (3) there was ample land suitable for planting; and
(4) ther e was no great trans portational difficulties, all the territories
having easy access to the sea from coast lines l ong in proportion to the
areas behind them. 18
As Table 2 ind i cates, in 1910 almost all of the world production
of raw rubber, 93,000 t ons, came f rom wild rubber trees . The plantation
rubber-growing industry, at this early stage of its devel opment, produced
17Phillips, ~. , p. 147 .
18Andrew Me Fadyean, The History of Rubber Regulation 1934-1943 (London: George Allen & Unwin, Ltd., 1944), p. 10 .
49
only 11,000 tons, or abou t 12 percent of the year' s supply . 19 By 1966
the wor ld produc ti on of raw rubber increased t o about 5,726,000 t ons,
of which 2,408,000 long t ons was natural rubber f r om plantation and
about 3,318,000 l ong t ons was synthetic.
Since 1914 plantation rubbe r ha s maintained its l eader ship over
wi ld rubber , contribu ting about 99 per cent of the t otal natural rubber
output of the world in 1966. In this case, plantation rubber was developed
not only to i ncrease the supp l y of rubber, but also for technological
advantages . Wild rubber was non-un iform and dirty , and cou ld not meet
the basic technological requi r emen t s for all kinds of expansion of the
rubber industry during the early 1900's . 20 Another reason for the rapid
development of plantati on of rubber i s the greater regularity of supply
and l ower price . As Lennox A. Mills wrote:
By 1914 the ou t put of estate rubber exceeded that of j ungle rubber, since systematized produc tion with settled labor condi t ions proved the more economical and reliable . Ma layan estates could deliver rubber i n New York for less than its cost to collec t and s hip wi ld rubber fro m the Amazon. Moreove r they could assure a r egular su~rl y while the collector s of wild rubber could not.
The r ise i n demand for r ubber due to improved t echnology and new
uses r esulted i n greater effor ts t o improve and deve l op new sources of
rubber supply ( see Chap t er II). In 1962, 10.5 million acres we r e plant ed
19G. S. Whitby and othe rs (eds.), Synthetic Rubbe r (New York :
John Wiley & Sons, Inc., 1954), p. 1.
20s . M. Caldwell, "Scientific Contributions to the Rubber Industry," Rubber World, 145, (April, 195 7), p . 58.
211 . A. Mills , Malaya: A Political and Economic Apprai sa l (Minneapolis,
Minnesota: Univers ity of Minnesota Press, 1958), p. 22.
50
with natural rubber trees. 22 On a world wide basis rubber is exported
by Malaya, Indonesia, Thailand, Ceylon, and many other Asian countries,
as we ll as some countries in Africa and Latin America. The States of
Malaya, Indonesia, Thailand, and Ceylon together have provid ed about 80
percent of the wor ld' s rubber production since 1948.
Table 17 indicates the ranking of the more important rubber producing
countries in Asia. Table 18 shows the relative importance of es tates and
small holdings in various countries.
Thr oughout the first quarter of the cen tury, the bulk of all rubber
produced was supplied by the estates. 23 Gradually , however, the samll
holders have strengthened their position. Today, small holdings supply
nearly two-trhids of the total output in Indonesia, more than two - f ifths
in Malaya, and almost the en ti re output of rubber in Thailand . 24 Although
the distinction between estate producers and native small holders is
arbitrary, a distinction between the two types of production is useful
for economic analysis of flexibility of supplies, discussed in Chapter V.
Mrs . M. J . ' tHooft Welvaars' case study fo r UNCTAD presented the signifi -
cant difference between estates and small holdings as follows:
Perhaps it may be said that those countries producing natural rubber largely on estate are better f itt ed in the rac e for higher productivity than the countries pr oducing mainly on smallholdings, unless the latter 's gove rnment s are very active of applying r esearch and possess -- or provided with--the financial means to carry their sma llholders over
22Po l hamus, ~. , pp. 31-3 2 .
23Percy W. Bidwell, Raw Material: A Study of American Po l icy (New York: Harper & Br others, 1958), p. 264.
24Phillips, ~ .• pp. 147-148.

Table 17 . Production of natural rubber in the principle producing countries (in thousand long tons)
Latin Year Ma laya Indonesia Thailand Ceylon Vietnam Rest of Asia Africa America World Total
1956 626.0 686.7 134.6 95:4 69 . 1 138.0 113.5 29.7 1,893
1957 637.5 684.5 134.0 98 . 2 68.6 135.9 116.3 30.0 1,905
1958 662 . 9 685 . 2 138.4 100 . 2 70.5 136.2 123 . 3 26 . 3 1,943
1959 697 . 8 693.5 171.3 91.7 74.2 144 . 6 141.8 28.1 2,043
1960 708.4 610 . 5 168.2 97.3 75.4 154 . 2 147 . 0 29.0 1,990
1961 736.7 671.4 183 . 2 96.0 77.9 158.4 142.0 29.4 2,095
1962 751.6 670.8 192.3 102.4 74.0 159 . 8 150.8 28.3 2,130
1963 788.5 573.1 186.8 103.1 70 .7 166.8 151.8 27.2 2,068
1964 825.3 638.4 218 . 2 109.8 73.3 181.3 158.8 34.9 2,240
1965 860 . 7 705.7 213 . l 116.4 60 . 0 182.8 153.5 35.8 2 . 328
1966 928.5 700 . 0 210 . 0 128 . 9 50.7 187 . 4 170.0 32 . 5 2 408
Source: Commodity Yearbook 1967, p. 282.
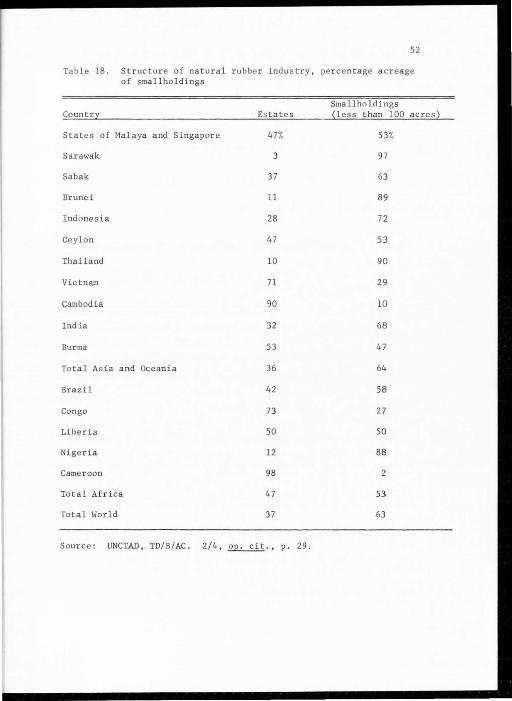
52
Table 18. Structure of natural rubber industry, percentage acreage of srnal lholdings
Srnallholdings Country Esta t es (l ess than 100 acres)
States of Malaya and Singapore 47% 53%
Sarawak 3 97
Sabak 37 63
Brunei 11 89
Indonesia 28 72
Ceylon 47 53
Thailand 10 90
Vie tnam 71 29
Cambodia 90 10
India 32 68
Burma 53 47
Total Asia and Oceania 36 64
Brazil 42 58
Congo 73 27
Liberia 50 50
Nigeria 12 88
Cameroon 98 2
Total Africa 47 53
Total World 37 63
Source: UNCTAD, TD/B/AC . 2/4, op. cit., p. 29.
53
a replanting period . 25
Production of Synthetic Rub ber
At the e nd of World War II, only four countries had any substantial
synth et ic rubbe r production capacity--Canada, Ge rmany, Ru ss ia, and the
United States . The competition between natural and synthetic rubber did
not become serious until 1940 when the United States embarked on a syn the -
tic rubber program to counter the threat of being cu t off from the rubber
source in Asia. The Japanese conquest of nearly all the producing areas
in Asia resul t ed in a rapid acceleration of the synthetic rubber program .
American advance technology and mass produc tion techniques fostered
the infant synthetic rubber industry t o a high level of produc tion in
l ess than five years .26
After 1945, the f uture of synthetic rubber
remained uncertain . Few countri es other than the United States showed
interest in building the new industry. In the past few years, however,
capacity ou t s ide the United States had rapidly expanded .
Table 19 s howed the production of syn thetic rubbe r in various
countr i es from 1940-1966. The bulk of synthe tic rubber at present
produced is accounted fo r by SBR, which is well ahead, followed by butyle ,
neo prene , s t ereo- rubbers (pol yi sopr ene and polybu tadiene) and nitrile . 27
At the same time, we find that produc tion is on the i ncrease in many
25UNCTAD-TD/B/AC. 2/4, ~-, p. 30.
26A completed s tud y of U. S. synteh t ic rubber indus try during the World War II, see Frank A. Howard, Buna Rubber: the Birth of an Industry (New York: D. Van Nostrand Company, Inc., 1947).
27Phillips, ~ . • pp. 68 - 82 .
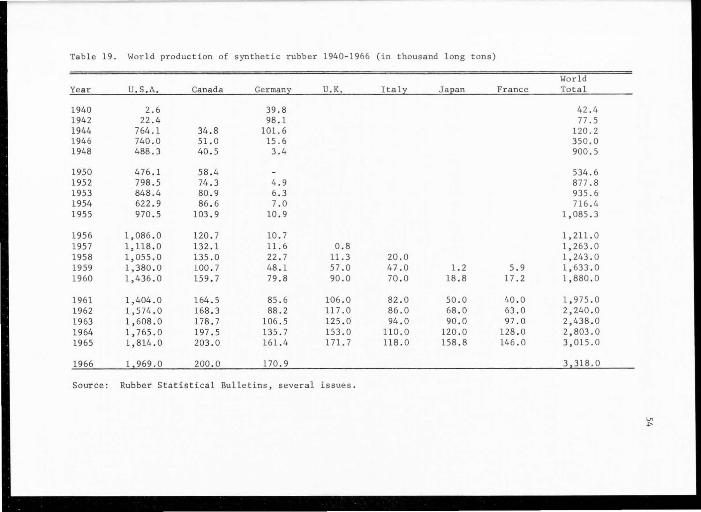
Table 19. World production of synthetic rubber 1940-1966 (in thousand long t ons)
World Year u.s .A. Canada Germany U.K. Italy Ja2an France To tal
1940 2. 6 39.8 42.4 1942 22.4 98 . 1 77 . 5 1944 764.1 34.8 101.6 120.2 1946 740 . 0 51.0 15.6 350.0 1948 488 . 3 40 . 5 3 . 4 900.5
1950 476.1 58 .4 534.6 1952 798.5 74 . 3 4 . 9 877.8 1953 848 .4 80 . 9 6. 3 935.6 1954 622.9 86 . 6 7.0 716.4 1955 970 . 5 103 . 9 10 . 9 1,085.3
1956 1,086.0 120 . 7 10.7 1,211.0 1957 1,118 . 0 132 . 1 11.6 0 . 8 1,263.0 1958 1, 055.0 135 . 0 22 . 7 11.3 20 . 0 1,243 .0 1959 1,380 . 0 100.7 48 . 1 57 . 0 47 . 0 1.2 5.9 1,633.0 1960 1,436.0 159.7 79 . 8 90.0 70 . 0 18.8 17.2 1,880.0
1961 1,404.0 164.5 85.6 106.0 82.0 50 . 0 40 . 0 1,975.0 1962 1,574 . 0 168 . 3 88 . 2 117 . 0 86 . 0 68 . 0 63 . 0 2,240.0 1963 1,608 . 0 178 . 7 106 . 5 125 . 0 94 . 0 90 . 0 97.0 2,438.0 1964 1,765.0 197 . 5 135.7 153 . 0 110 . 0 120 . 0 128 . 0 2, 803.0 1965 1,814 . 0 203.0 161.4 171.7 118 . 0 158.8 146 . 0 3,015.0
1966 1 969 . 0 200.0 170 . 9 3 318.0
Sour ce: Rubber Statistical Bulletins, s everal issues .
'-" t-
55
countries . Germany, Russia, Canada, and the United States are the
pioneer countries. The new countries, who made a determined entry into
their branch of the synthetics industry, have recentl y been joined
by Great Britain, Italy, Holland, France, Japan, Australia, and Brazil.
In addition, projects have been announced in several other countries,
namely, Poland, India, Israel, Mexico, Argentina, South Africa, Belgium,
Rumania, and Red China. 28
28Le Bras, ~-, p. 70.
CHAPTER IV
THE NATURAL RUBBER INDUSTRY IN THAILAND
Structure of the Economy
A country with an area of approximately 200,000 square miles,
entirely under the tropical monsoon climate, and a population of about
32 million people, Thailand is relatively small and underdeveloped. 1
Known resources are limited to agriculture and rubber-planting areas,
tin deposits, and some high-value teak forests . Basic mineral and power
resources, as far as they are known, are particularly poor . 2 Relatively
be tter endowed with hydro e l ectric power potentials, the first hydro
power dam, part of the Yanhee Multi-Purpose Project, 3 was completed
in 1964. In terms of absolute number, the population of 32 million,
increasing at a rate about three percent per annum, is sizable. Per
capita income, however, was only about $125 dollars in 1965 (see
Table 20).
1 Office of t he Prime Minister, Thailand Official Yea rbook 1964
(Bangkok: Government Hou se Printing Office, 1965), pp. 1-10, 327 -374.
2united Nations, Economic Survey fo r Asia and the Far East , 1947-ll..2.,L (Bangkok) .
3The first project to undertake storage and regulation of river waters in Thailand on a large scale includes a 150 meter high dam and a reservoir of over 5 billion cubic meter capacity. Beside providing 560,000 kilowatts of electric power, it will benefit irrigation and flood control in the Central Plain.
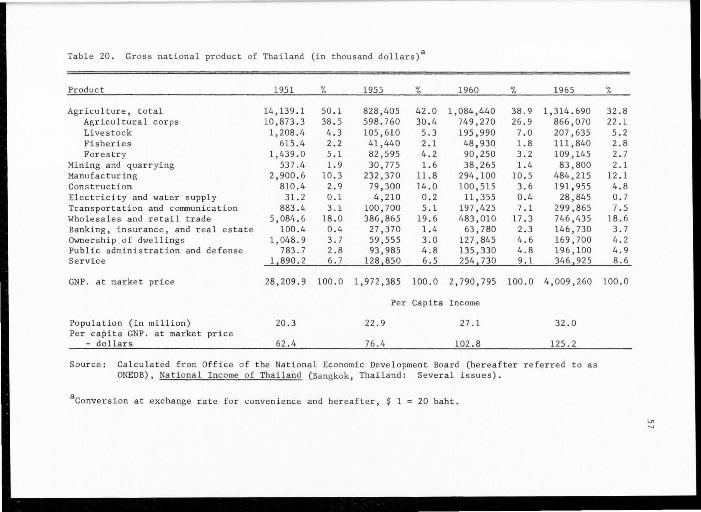
Table 20. Gross national product of Thailand (in thousand dollars)a
Product
Agriculture, total Agricultural corps Livestock Fisherie s For estry
Mining and quarrying Manufacturing Construction Electricity and water supply Transportation and communication Wholesales and retail trade Banking, insurance, and real es tate Ownership .of dwell ing s Public administration and defense Service
GNP. at market price
Population (in million) Per capita GNP. at market price
- dollars
1951
14,139.1 10,873 . 3
1,208.4 615 .4
1,439.0 537 . 4
2,900.6 810.4
31.2 883 . 4
5,084.6 100.4
1,048.9 783.7
1 890.2
28,209.9
20.3
62.4
%
50 . 1 38.5 4.3 2.2 5.1 1.9
10.3 2.9 0.1 3 .1
18.0 0 . 4 3.7 2.8 6.7
100.0
1955
828,405 598.760 105,610 41,440 82,595 30,77 5
232,370 79,300 4,210
100,700 386,865
27,370 59,555 93,985
128 850
1,972,385
%
42.0 30 . 4
5 .3 2.1 4.2 1.6
11 . 8 14 . 0 0.2 5.1
19.6 1.4 3 . 0 4 . 8 6.5
100.0
1960
1,084,440 749,270 195,990 48,930 90,250 38,265
294,100 100,515
11,355 197,425 483,010
63,780 127,845 135,330 254 730
2 ,790, 795
Per Capita Income
22.9 27.1
76.4 102.8
'7.
38.9 26.9
7 .o 1.8 3.2 1.4
10.5 3.6 0.4 7.1
17.3 2.3 4 .6 4.8 9.1
100.0
1965
1,314.690 866,070 207,635 111,840 109,145 83,800
484,215 191,955
28,845 299,865 746,435 146,730 169,700 196,100 346 925
4,009,260
32.0
125 . 2
Source: Calculated from Office o f the National Economic Deve lopment Board (hereafter r eferred to as ONEDB), National Income of Thailand .(Bangkok , Thailand : Several issues).
aConversion at exchange rate for convenience and hereafter, $ 1 = 20 baht.
'7.
32.8 22.1 5.2 2.8 2.7 2.1
12.1 4.8 0.7 7 . 5
18.6 3 .7 4.2 4.9 8.6
100.0
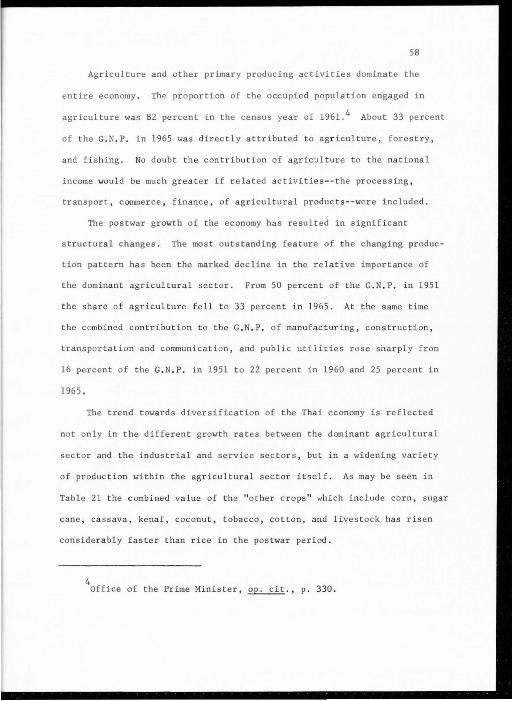
58
Agriculture and other primar y producing activities dominate the
entire economy . The pr oportion of the occupied population engaged in
agriculture was 82 percent in the census year of 1961. 4 About 33 percent
of the G. N. P. in 1965 was directly attributed t o agriculture, forestry,
and fishing. No doubt the contribution of agriculture t o the national
income would be much greater if related activities --the processing,
transport, commerce, finance, of agricultural products --were included.
The postwar growth of the economy has resulted in significant
structural changes. The most outstanding feature of the changing produc
tion pattern has been the marked decline in the relative importance of
the dominant agricultural sector . From 50 percent of the G.N . P. in 1951
the share of agricul t ur e fell t o 33 percent in 1965 . At the same time
the combined contribution to the G. N. P. of manufacturing , construction,
transportation and communication, and public utilities rose sharply f r om
16 percent of the G.N.P , in 1951 t o 22 percent in 1960 and 25 percent in
1965.
The trend towards diversification of the Thai economy is reflected
not only in the different growth rates between the dominant agricultural
sector and the industrial and service sectors, but in a widening variety
of production within the agricultural sector itself. As may be seen in
Table 21 the combined value of the "other crops " which include corn, sugar
cane, cassava, kenaf, coconut, tobacco, cotton, and live s tock has risen
cons iderabl y faster than rice in the postwar period .
4 Office of the Prime Minister,~., p. 330 .

59
Table 21. Percentage shares of the value of major types of agricultural production in Thailand
1938- 39 1948-50 1953-55 1958 1961 1963 1965
Rice 62 .6 55.5 42.1 40.0 39.8 46.2 43 . 4
Rubber 8.9 8 . 8 11.4 8.8 9.1 8.0 7 . 6
Other Crops 28.5 35.7 46.5 51.2 51.1 43 .2 46 .2
Total 100.0 100.0 100 . 0 100 . 0 100.0 100.0 100.0
Source: For 1938-1950: J. S . Gould, Preliminary Estimates of the Gross Geographical Product and Domestic Income of Thailand (Bangkok: National Economic Council, 1953), pp. 11 - 12. For 1953-1965: ONEDB, National Income of Thailand (Bangkok: several issues)
The share of the "other crops" in recent years has amounted to about
half of the total value of all agricultural production whereas the share
of rice s ince the ear l y 1950's has dec lined from about one half to just
more than one-third . But the rubber hes gene rally constituted an annual
share in agricultural sector of about eight to nine percent yearly.
Development of Rubber Plantations
Rubber (Hevea Brasiliensis), according to the records available,
was introduced into Thailand from Malaya on two occa sions . The first
one was taken to Trang (southern region) around 1900-1901 by the late
Phya Rasda-nu Pradit, then the Governor of Trang. The second was
conveyed some ten years later by Luang Rajmaitree, a prominent resident
of Chantaburee (eastern region).s From these two importations rubber
Span Maleewan ," Future of Rubber Plantation Owners in Thailand," Agriculture XXXII(l959), pp . 281-283. Ceylon began planting in 1889, Malaya in 1895, and Indonesia in 1896. Virginia Thompson, Thailand: The New Siam (New York: the Macmillan Company, 1941), p. 479); Dijkman, ~.,p.6.
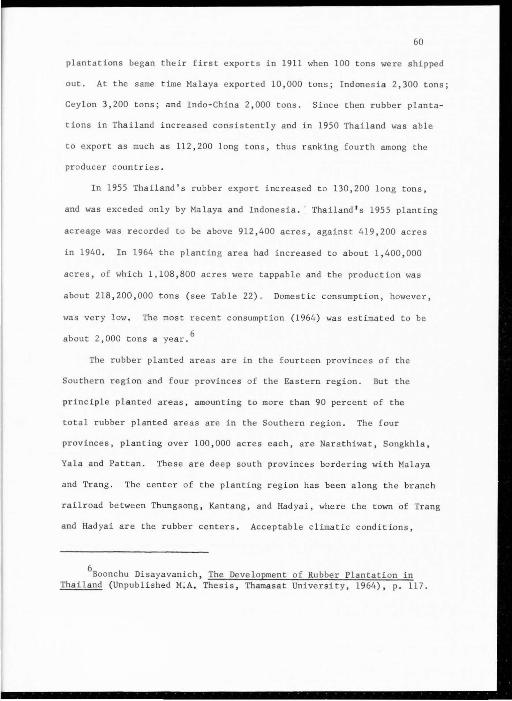
60
plantations began their first exports in 1911 when 100 tons were shipped
out. At the same time Mala ya exported 10,000 tons; Indonesia 2,300 tons;
Ceylon 3,200 tons; and Indo-China 2,000 tons. Sinc e then rubber planta-
tions in Thailand increased consistently and in 1950 Thailand was able
to expor t as much as 112,200 long tons, thus ranking fourth among the
producer countries.
In 1955 Thailand's rubber export increased to 130,200 long tons,
and was exceded onl y by Malaya and Indonesia. · Thailand's 1955 planting
acreage was r ecorded to be above 912,400 acres, against 419,200 acres
in 1940 . In 1964 the planting area had increased t o about 1,400,000
acres, of which 1,108,800 acres were tappable and the production was
about 218,200,000 tons (see Table 22). Domes tic consumption, however,
was very l ow . The most recent consumption (1964) was estimated to be
about 2 ,000 t ons a year . 6
The rubber planted areas are in the fourteen provinces of the
Southern region and four provinces of the Eastern region. But the
principle planted areas, amounting to more than 90 percent of the
total rubber planted areas are in the Southern region . The four
provinces, planting over 100,000 acres each, are Narathiwat, Songkhla,
Yala and Pattan. These are deep south provinces bordering with Malaya
and Trang. The center of the planting region has been along the branch
railroad between Thungsong, Kantang, and Hadyai, where the town of Trang
and Had yai are the rubber centers. Acceptable climatic conditions,
6soonchu Disayavanich, The Development of Rubber Plantation in
Thailand (Unpublished M:A. Thesis , Thamasat University, 1964), p. 117.

61
Table 22. Rubber plantation areas in Thailand (in thousand acres)
Production Year (in long tons)
1920 400
1929 4,300
1934 17,700
1940
1950 112,200
1955 130,200
1960 168,200
1962 192,300
1964 218,200
1966 210,000
Source: For 1920-1950, James C. Ingram , Economic Change in Thailand Since 1850. (Stanford, California: Stanford University Fress, 1955), p. 102. For 1955-1966, ONEDB, Annual Report on Economic Condi t ion of Thailand, several issues.
8 Rai is an area measure in Thailand, equal to 1 ,600 square meters or about 0.4 acre (hereafter referred to this rate to convert rai to acres).
unused land, and easy railway access favored this development in the
southern penins ula. Smaller acreages are found along the l ower s l opes of
rainy hills in Chanthaburi, Rayong, and Trat on the southeas t coast of 7
the mainland .
7Department of Agriculture, Ministry of Agriculture, "Para Rubber," Bangkok , 1965, pp. 1-3. (Mimeographed)
62
Rubber-growing in Thailand followed a different pattern of development
from that in other countries of South Asia . Plantations have neve r been
large . Mos t plantings are of only a few acres each. K. P. Landon wr ot e
in the late 1930 ' s that most of the small planters had 2,000 t o 3,000
trees, and that on l y a few es ta tes have as many as 10,000 trees. 8 The
plan ting and production are controlled by Chinese and native Thai, not
by Europeans as in Ma laya. 9
Production of rubber in Thailand has responded roughly to price
changes. Production was firs t undertaken during the automobile boom
at the beginning of this century when the price of the wor ld rubbe r
market ros e to over $1.00 dur ing the period 1904-191 2 ( see Figure 1) .
The acreage was increased extremely s l owl y in this period. By 1920
only about 60,000 acres wer e planted . Af ter that yea r world rubber
prices colla psed (the rubber price at New York moved down from 36 cents
per pound in 1920 t o a s low as 3.4 cen ts per pound in 1932), and grower s
ceased t o plant trees and abandoned gardens not old enough to be tapped .
However, interest r evived for a short period from about 1921, reaching
its peak in 1925 when the British Government and Rubber Growers ' Associa-
tion in Malaya and Indonesia cont rolled production a nd expor t s in Malaya,
Indones ia, and Ceyl on. From 19 25 , prices s tarted t o fall again rapidly
r eaching the l owes t point in 1931 because of the world economic cri sis.
Because the controls - imposed were only regional in nature , the y we r e only
SK. P. Landon, Siam in Transition (Chicago, Illinois: Univer si t y of Chicago Press, 1939), pp. 70- 73. Ther e ar e average abou t 125 rubber trees per ac re .
9 Robert L . Pendleton, Thailand: Aspec ts of Landscape and Life
(New Yor k : Duell, Sloan and Pearce, 1963), p. 202.
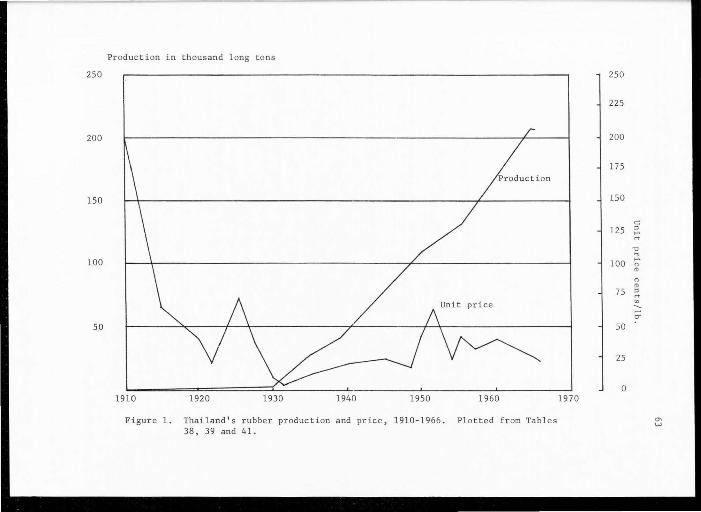
Production in thousand l ong t ons
250 250
225
200 200
175
150 150
c: 125 " '"' ,..,
"' ... 100 100 '"' " (!)
" (!)
75 " ,.., "' --.... cr'
50 50
25
0 1910 1920 1930 1940 1950 1960 1970
Figur e l. Thailand ' s rubber production and price, 1910-1966 . Plotted f r om Tab l es "' w 38, 39 and 41.
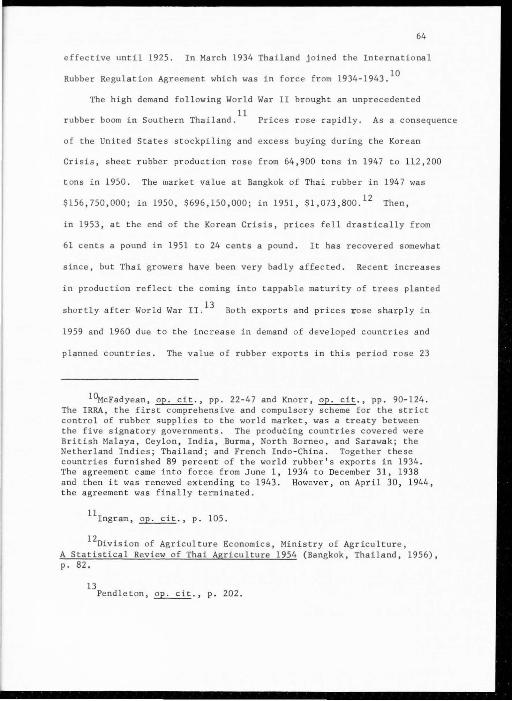
64
e ffective until 1925 . In March 1934 Thai land j oined the International
Rubber Regulation Agreement whi ch was i n force f r om 1934-1943. 10
The high demand following World War II br ought an unprecedented
11 rubber boom in Southern Thailand. Prices rose rapidly . As a consequence
of the United States s t ockpiling and excess buying during the Korean
Crisis, s hee t rubber produc tion rose f r om 64,900 tons in 1947 t o 112 ,200
tons in 1950 . The market valu e at Bangkok of Thai r ubber in 1947 was
$156 ,750,000; in 1950, $696,150,000 ; in 1951, $1,073,800. 12 Then,
in 1953, a t the end of the Korean Crisis, prices fel l drastically from
61 cen ts a pound in 195 1 to 24 cen t s a pound. It has recovered somewhat
since, but Thai growers have been ve r y badly affected. Recen t increases
in production r ef lect the coming into tappable ma turity of trees plant ed
shortly af ter World War II . 13 Both exports and prices r ose sharply in
1959 and 1960 due t o the increase in demand of deve loped coun t ries a nd
planned countrie s. The val ue of rubber exports in this period r ose 23
1 ~cFadyean, ~. , pp. 22- 47 and Knorr,~. , pp. 90- 124. The IRRA, the first comprehensive and compulsory scheme fo r the strict control of rubber supplies t o the world marke t, was a treaty between the five signator y governments. The produCing countries covered we re Bri ti s h Malaya, Ceylon, India, Burma, North Borneo, and Sarawak; the Netherland Indies ; Thailand; and French Indo - China. Together these countri es furn i shed 89 perc ent of the world rubber ' s export s in 1934 . The agreement came into force from June 1, 1934 t o Decemb er 31, 1938 and then it was renewed extending t o 1943. However, on April 30, 1944, the agreemen t was finally terminated .
11Ingram, ~. , p. 105 .
12oivision of Agriculture Economics, Ministry of Agriculture, A Statistical Review of Thai Agriculture 1954 (Bangkok, Thailand, 1956), p . 82.
13 Pend leton, ~., p. 202.

65 14
percent, bringing a 30 percent rise in income. The year 1960 was
the firs t time that rubber export exceeded rice earned $128,950,000 ,
thus exceeding rice which was $128,500 ,000 and had always been
Thailand' s most important expor t items ( see Table 25).
Rubb er Holding
Native planters control most of the rubber acreage. Table 23 shows
that the average acreage holding was only 8 . 5 acres in 1950. Ninety-six
percent of the number of holdings in 1950 were under 19 acres, and 67
percent of the ac reage in rubber was in these small holdings. Only 8
percent of the t o tal area was in plantations of 99 acr es or over, and
these 241 ho ldings averaged only 266 acres . Large - scal e plantati on cul-
tivation is not important in Thailand.
Rubb er acreage expansi on in recent years ha s come principally f r om
small holdings und e r the Thai or Chinese . The smaller plantings are
generally owned by Thai , es pec ially those of Malay descent. Larger
plantings, including genuine plantati ons, are primarily Chinese-owned and
operated. Table 24 shows the owner ship of rubber holding s , based on
nationality.
It is es timated that roughly about hal f the t otal rubber area is
owned by pe rsons of Chinese ances try, bu t there are no officia l statistics
on this point .15
Of holdings unde r 20 acres , the Chinese - owned holdings
averaged nearly 10 acres, compared to onl y 5.6 acres f or those owned by
14u. S . Department of Commerce, Wor ld Trade Information Service: Economic Development in the Far East and Oceania, 1959 . Part, No. 60-67, Wash i ngt on, 1960.
15Ingrarn, ~., p. 103 .
Table 23. Rubber holdings in Thailand, 1944 and 1945
250 rai (98.75 acres) and over 50 - 250 rai (19.75-98.75 acres) Less than 50 rai (19 . 75 acres)
Total
250 rai (98.75 acres) and over 50- 250 rai (19:75 - 98.75 acres) Less than 50 rai (19.75 acres)
Total
1944
Number of holdings
213 1,915
72 ' 817 75 , 000
1950
241 3,426
87 '780 91,447
Area in holding (in acres)
65 '9 65 71' 100
298 , 225 435,290
61,620 198,290 518 , 820 779' 730
66
Average size of hold ing (in acres)
250 rai (98.75 acres) and over 50 - 250 rai (19.75 - 98.75 acres) Less than 50 rai (19.75 acres)
Over-all ave r age
Source: Ingram,~., p. 102.
309.7 35.9 4 .0 -----s:s
Table 24 . Ownership of rubber holdings in 1949
Holding, under 20 acres Holdings , Nationa lit y of owner Number A1:ea Number
Thai 77,845 423 ,402 1 ' 716
Chinese 5,752 57,220 1,858
Other 151 60 .4 67
Source: Ingram,~., p. 103.
20
266.2 57.7 5.9
----s:s
acres or Area
107,174
130,655
8,147
over
67
Thai, For the most part the Thai rubber grower is a very small operator .
Not much capi tal was needed to develop and operate a small holding
in the past. So , Western capital and enterpr eneurshi p have not played
an important part in the Thai rubber i nd ustry . In the late 1920's
American and othe r Wes t ern interests considered developing the Southern
r eg ion of Thailand . But because of un favor able loca l conditions and the
r efusal of the Thai government to encourage an increase in the numbers
of foreigners in the economy, the American attempts in this region were
soon abandoned.16
In 1949 only 67 planta tion-type holdings, ave raging 90
acres apiece, were owned by foreigners other than Chinese. For e i gners
of non-Chinese descen t , including Europeans, controlled only one percent
of the total rubber acreage in Thailand.
Process ing and Marketing
Small holders usually sell their rubber in the form of raw rubber
sheets and the buyers do the smoking on a large scale. The larger owners
operate their own smokehouses, and they may also have equipment for
washing, congea ling, and rolling the rubber on a large scale. The rubber
merchant s of all l evels ( local, city center, expor ting cen t er) who buy
raw and smoke shee ts also sort, grade, pack, and export it. Some of the
larger plantati ons , i nclud ing a gove rnment rubber plantation, operate
crepe -rubber r o lling fact ori es , and some export crepe-rubber directly.
Mos t smoked s hee t s, however, are expor t ed by rubber merchants, nearly
all of whom are Chinese. 17
16Pendleton, ~. , pp . 203-204.
17 Ingram, ~., p. 104 .
68
Thai rubber has a reputation for a rather poor quality. This is the
result of the low price, or classifying it as bearing a low grade price.
It is f r equent l y said that the fault lay with the Chinese merchants who
do not grade or sort it properly. This part of the problem, in fact,
comes from the small holding - t ype of rubber industry . The growe rs have
different standards, poor facilities and tools, and inadequat e quality
grading. No doubt this is part of the problem . The establishment of
standards has also been hindered by the processing methods of the small
holders. They need t o l earn t o clean and pr epare the rolled sheets
properly .
Williard A. Hanna has explained some basic characteristics of Thai
rubber processing and marketing:
The tappers are also mainly Thai--whether owners, tappers, or share-tappers who t end the Thai - Chinese estates . As a rule, the tappers are also the processors. /Ma rket ing, however, is the function of middlemen, of-whom,_ in Thailand, there are layers upon layers ... . :..1 Instead of using formic acid t o coagulate the latex, they use sulphuric acid, which is cheaper but less suitable and results in a rubber that is deficient in elasticity. They squeeze the liquid out of the coagulate and dry it in the sun, but they rarely go to the pains to produce the neatly waffled evenly smoked, brown sheet for which the buyers pay premium prices.
Once the rubber is ready for market, they sell it to a collector, who smokes it and sells it to shopkeeper, who sells it to a journeyman, who sells it ' to a dealer - none of whom neglects to charge a commission.l8
In 1950, the rubber industry furnished employment for about 150,000
individuals and their dependent families . There are ove r 91,000 planters,
18 Williard, A. Hanna, "Peninsular Thailand: Rubber of Haadyai and
the Tin of Phuket," American University Field Staff , Sou theast Asia Series, Vol. 13, No. 25 (October , 1965), pp. 2- 3.
69
50,000-60,000 tappers , and an indeterminate number of factory workers,
merchant s , and othe rs direc tly dependent upon the industry fo r their
livelihood .19
A recent es timate of people who worked on rubbe r planta-
t ions excluding marketing, was made by Boonchu Disayavanic h, of the
Ministry of Agriculture:
From this rough calculation, we can estimate that the rubber industry employs 990,632 people. This is equivalent t o 4 . 52 percent of the population or 6 . 06 percent of the people ID ccupied · in agricultur e.20
Export of Natural Rubber
Rubbe r is a relative newcomer, having become a major export on l y
since the second half of the 1930' s . The growth of Thailand ' s rubber
produc tion and export s, however, has been quite rapid. It was increased
at the rate of about 8 percent per year between 1934-1935 and 1955-1957,
and 7 percent per year between 1960-1964. In consequence, the contribu-
tion of rubber to the total export earnings of Thailand ha s increased
f r om 2 percent during the interwar period 1925-1929, to 13 percent be fo r e
the outbreak of World War II, and t o a s high as 30 percent in 1959- 1960 .
Rubber ha s therefo re far outranked bo th tin and teak, and as mentioned
overtook rice in 1960.
Since 1961 the percentage share of rubber has declined s t eadily
f r om 21 percent of t otal exports t o 13 percent in 1966. During 1961-1966,
the world natural rubber price was shaken by the United States and
Britain releasing their rubber stockpil es and by the strong competition
19Ingram , op. cit., p. 104.
20Disayavanich, ~., p . 21.
70
of synthetic rubber. The average rubber price at Bangkok declined from
$582 pe r ton in 1961 to $442 per ton in 1966 (see Table 25) . At the
same time, Thailand's Government Replanting Scheme of 1960 has started
e ffecting the decreasing volume of produc tion, beginning in 1964. In
any event, the growth of rubber exports has significantly affected
Thailand's balance of payments situation, especially in the postwar
period.
Statistics released by the Depar tment of Customs showed that in
1965, Thailand expor ted a t otal of 213 ,100 metric t ons of rubber to twenty
six countrie s . 21 Most of the export went t o the Asian countries. Japan
and Singapore and Malaysia were the leading buyers who imported 54,178
and 46,217 metric t ons, respectively. They were followed by the United
Kingdom, the Federal Republic of Germany, Italy, and France ( see Table
27) .
Traditionally, the United States was the most important Thailand
rubber importing country. From 1950-1957, the United States bought more
than 90 percent of Thailand rubber. 22 Since then the United States '
share was decreased steadily, because of he r own production of synthetic
rubber. In 1965, the United States imported only 7,028 metric tons of
Thai rubber--3.3 percent of total rubber exports.
Since 1962 Japan has become the principal Thailand rubber customer,
r ep lacing the United States.
21 Bangkok Bank Monthly Review , November 1965, p. 228 .
22somporn Devsi tha, Economics and Trade Perspective (Bangkok,
Thailand: Progress Printing Office, 1962), p. 44.
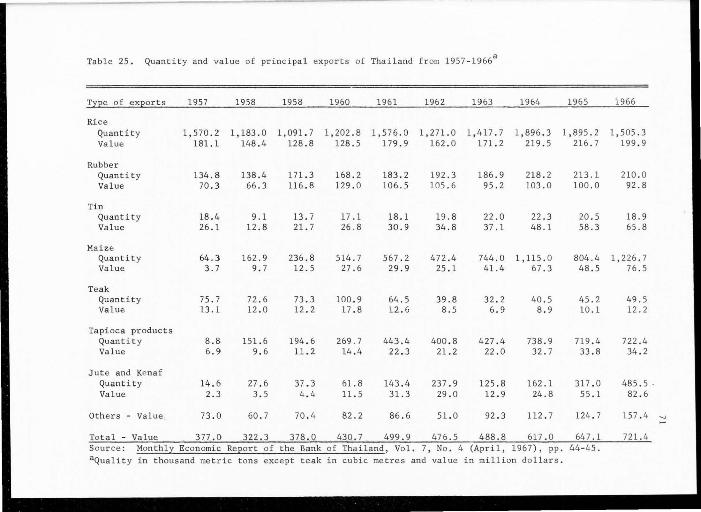
Table 25. Quantity and value of principal exports of Thailand from 1957-1966a
T;tEe of ex2ort s 1957 1958 1958 1960 1961 1962 1963 1964 1965 1966
Rice Quantity 1,570.2 1,183.0 1,091. 7 1,202.8 1,576.0 1,271.0 1,417 . 7 1,896 . 3 1 ,895 .2 1,505 . 3 Value 181.1 148.4 128.8 128.5 179 . 9 162 . 0 171.2 219 . 5 216.7 199.9
Rubber Quantity 134.8 138.4 171.3 168 . 2 183.2 192.3 186.9 218.2 213.1 210.0 Va lue 70.3 66.3 116.8 129. 0 106.5 105.6 95.2 103.0 100.0 92.8
Tin Quantity 18.4 9 . 1 13.7 17.1 18.1 19.8 22.0 22.3 20.5 18.9 Value 26 . 1 12.8 21.7 26 . 8 30.9 34.8 37.1 48.1 58.3 65.8
Maize Quantity 64.3 162.9 236.8 514.7 567.2 472.4 744.0 1,115. 0 804.4 1,226.7 Value 3.7 9.7 12.5 27.6 29 . 9 25.1 41.4 67.3 48.5 76.5
Teak Quant ity 75 . 7 72.6 73.3 100.9 64 .5 39.8 32 . 2 40.5 45.2 49.5 Value 13 . 1 12.0 12.2 17. 8 12.6 8.5 6.9 8 . 9 10.1 12.2
Tapioca products Quantity 8.8 151.6 194 . 6 269.7 443.4 400 .8 427.4 738.9 719.4 722.4 Value 6.9 9.6 11.2 14.4 22 . 3 21.2 22 . 0 32.7 33.8 34.2
Jute and Kenaf Quantity 14.6 27.6 37.3 61.8 143.4 237 . 9 125.8 162.1 317.0 485.5 . Value 2.3 3.5 4 . 4 11 . 5 31.3 29.0 12 . 9 24.8 55.1 82 . 6
Others - Value 73 . 0 60.7 70 . 4 82.2 86 . 6 51.0 92.3 112.7 124 . 7 157.4 ._, .....
Total - Value 377 . 0 322 . 3 378.0 430 . 7 499.9 476.5 488.8 617.0 64 7.1 721.4 Source: Monthl;t Economic ReE:ort of the Bank of Thailand, Vol. 7, No . 4 (April, 1967), pp. 44-45. aQuality in thousand metric tons except t eak in cubic metres and value in million do llars.
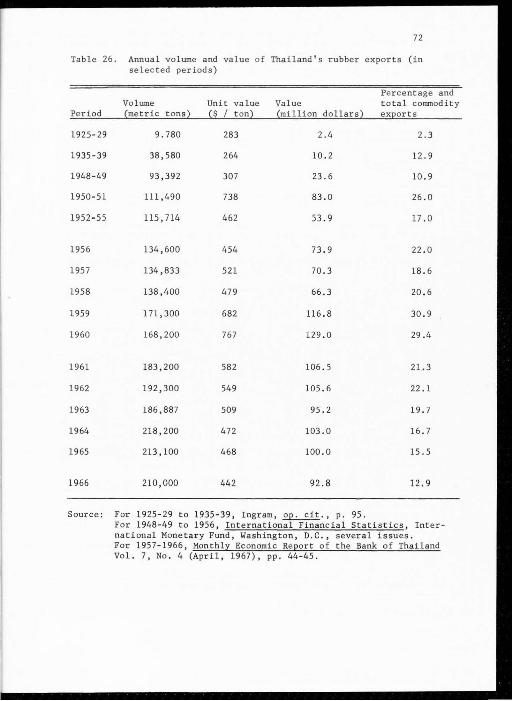
72
Table 26 . Annual volume and value of Thai land' s rubber exports (in selected periods)
Percentage and Volume Unit value Value total commodity
Period {metric t ons2 {~ I t on2 {million dollars2 exeorts
1925-29 9.780 283 2.4 2. 3
1935-39 38,580 264 10.2 12.9
1948-49 93,392 307 23.6 10.9
1950-51 111,490 738 83.0 26.0
1952-55 115 .714 462 53.9 17.0
1956 134,600 454 73.9 22 . 0
1957 134,833 521 70.3 18.6
1958 138,400 479 66.3 20 . 6
1959 171,300 682 116.8 30.9
1960 168,200 767 129.0 29.4
1961 183,200 582 106.5 21.3
1962 192,300 549 105.6 22.1
1963 186,887 509 95.2 19.7
1964 218,200 472 103.0 16.7
1965 213,100 468 100.0 15 .5
1966 210,000 442 92.8 12.9
Source: For 1925-29 to 1935-39, Ingram,~-, p . 95. For 1948-49 to 1956, International Financial Statistics, Inter-national Monetary Fund, Washington, D.C., several issues. For 1957-1966, Monthly Economic Reeort of the Bank of Thailand Vol. 7, No . 4 (April, 1967), pp. 44-45.
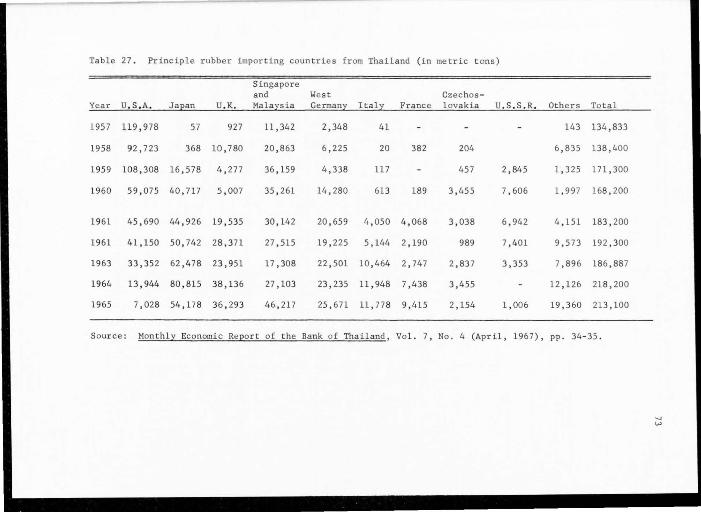
Table 27 . Principle rubber importing countries from Thailand (in metric t ons)
Singapore and West Czechos -
Year U. S. A. Japan U. K. Malaysia Germany Italy France lovakia U.S . S . R. Others Total
1957 119 '978 57 927 11,342 2,348 41 143 134 , 833
1958 92 '723 368 10,780 20 , 863 6,225 20 382 204 6,835 138,400
1959 108,308 16,578 4,277 36,159 4,338 117 457 2,845 1,325 171,300
1960 59,075 40,717 5,007 35,261 14,280 613 189 3,455 7,606 1, 997 168,200
1961 45,690 44,926 19,535 30,142 20,659 4,050 4,068 3,038 6,942 4' 151 183, 200
1961 41 '150 50,742 28, 371 27,515 19,225 5,144 2,190 989 7,401 9,573 192,300
1963 33,352 62,478 23,951 17,308 22,501 10,464 2,747 2,837 3,353 7,896 186,887
1964 13,944 80,815 38,136 27,103 23,235 11 '948 7,438 3,455 12,126 218,200
1965 7,028 54,178 36,293 46,217 25.6 71 11,778 9,415 2,154 1,006 19,360 213,100
Source: Monthl)! Economic Reeort of the Bank of Thailand, Vol. 7' No. 4 (April, 196 7)' pp. 34-35 .
74
Centrally planned countries have recently shown increasing interest
in the natural rubber market. When Thailand cancelled its prohibition
of expor ting rubber t o the Communist Bloc on September 22, 1957, 23
Czechoslovakia and U. S. S . R. became important customers. In 1965 they
imported 2,154 and 1,000 metric tons , respectively.
One important cause of the rapid growth of Thailand rubber produc-
tion and exports has been the strong world demand for rubber . Since
the turn of the centur y aggregate rubber consumption has generally
doubled every decade, increasing at the rate of 7 . 5 percent per year.
Although there has been some slowing down in growth since the end of
the Korean Conflict, the rate of growth remains as high as 6 percent
per year, which exceeds the rate of increase in both GNP and industrial
production of the more highly industrialized countries.24
Due to the rapid rate of increase as outlined before, Thailand
has not onl y participated in the rubber boom but has increased its
share in total world exports of natural rubber from 3 . 2 percent during
that late thirties , to 6.6 percent in 1948, to 7.3 percent during 1955-
1957 and 9.0 percent during 1960-1965 (see Table 28) . In the process,
Thailand has moved from the fif th place to become the third larges t
rubber exporting coun try of the world since 1954, after Malaya and
Indonesia.
The significant rate of gr owth of Thai rubber produc tion and export
over the past two or three decades may not, perhaps, continue after the
23oNEDB, Economic Condition of Thailand 1957 {Bangkok, 1958), p . 54.
24International Bank for Reconstruction and Development, The Prospec ts.
for Rubber, (Unpublished, Washington, D.C., September 11, 1959), quoted
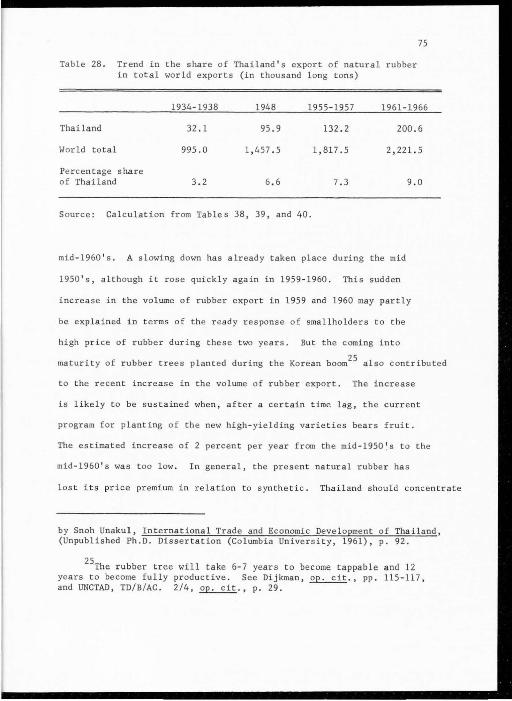
Table 28 . Trend in the share of Thailand ' s export of natural rubber in total world exports (in thousand l ong tons)
75
1934-1938 1948 1955-1957 1961-1966
Thailand 32.1 95 . 9 132.2 200.6
World total 995.0 1,457 . 5 1,817.5 2,221 . 5
Percentage share of Thailand 3.2 6 . 6
Source: Calculation from Tables 38, 39, and 40.
7.3
mid - 1960 ' s. A slowing down has already taken place during the mid
1950's, although it rose quickly again in 1959-1960. This sudden
9.0
increase in the volume of rubber export in 1959 and 1960 may partly
be explained in terms of the r eady response of smallholders to the
high price of rubber during these two years. But the coming into
maturity of rubber trees planted during the Korean boom25 also contributed
to the recent increase i n the volume of rubber export. The increase
is likely to be sustained when, after a certain time lag, the current
program for planting of the new high - yielding var i e ti es bears frui t.
The estimated increase of 2 percent per year from the mid-1950~s to the
mid-1960's was too l ow . In general , the pr esent natural rubber has
lost its price premium in relation t o synthetic. Thailand should concentrate
by Snoh Unakul, International Trade and Economic Development of Thailand, (Unpublished Ph.D . Dissertation (Columbia University, 1961), p . 92 .
25The rubber tree will take 6-7 years to become tappable and 12
years to become fully productive. See Dijkman, ~., pp. 115 - 117, and UNCTAD , TD/B/AC. 2/4, ~., p. 29.
76
on improving quality and yield and thus lowering its cost of rubber
production. I f and when the time comes, the cost of production will
be the most crucial factor determining the volume of exports of natural
rubber, and the high cos t produc er will be driven out of the market. The
relative importance of rubber and its future foreign exchange contribu-
tions t o the total export earning of Thailand thus depends on how
e ffectively the government of Thailand responds to the changing rubber
market condition in the coming decade.
Role of the Government
Perhaps as a result of the absence of an extensive middle c la ss
ther e is little valid public opinion. The Thai knows little and cares
less for international politics and i s only very slightly interested
in questions of internal politics, which are, for him, mostly a matter
of personalities. The people merely wish to be left alone to grow their
rice, catch their fish, and have an occasional festival at their local
Buddhist temple. So, the long-term economic development is initiated
and pushed principally by government policy. Thai tradition believes
that governmen t will provide every means or will do everything for the
people. 26
But, rubb er may be a specia l case whic h was pioneered by the
people, especial l y by those of Chinese descent . The rubber areas were
expanded rapidl y, responding r oughly to the price rise during the
26w . D. Reeve, Public Administration in Siam {London: Royal Institute of International Affairs, 1951), pp. 8- 9, and F. W. Riggs, "Modern Thai Administration," Ecology of Public Administration (London: Asia Publishing House , 1961), pp . 87-91.
77
automobile boom in the early part of this century and World War II.
Rubber trees are well suited t o Thai soi ls and climates. Moreove r
it is f it for the small holding and family operations . Rubber trees
need no good soil and can be grown even in sloping mountain areas. The
cul tivation of rubber was considerably more profitable than rice cultiva
tion,27 because after the tree gives latex it needs little care. The
tree will give latex at l east twenty-five years.
Jmae C. Ingram explained how the Thai government came to involve
the rubber industry :
Rubber was produced in Thailand for several years without license, tax, or other interference by the government. The growers and tapper were independent entrepreneurs and, unlike tin producers, they needed no license from the government to begin operations. Not until the mid- 1930 ' s did the government place an export tax on rubber. The export duty was set at 7 percent ad valorem, and this rat e is still in force (in 1955). The government has encouraged the cultivation of rubber by allowing land to be taken f r om the s tate for a noffiinal fee, and by taxing rubbe r produc tion lightly. A permit must be obtained to plant new rubber but since World War II this has been granted without difficul t y.28
During the Vo luntary Restriction of 1920-1921 and the Stevenson
Restriction Scheme of 1922-1928 in regulating rubber suppl y for improv -
ing price, Thailand was not a member of the cartel. But the high price
maintained by the cartel induced Thai rubber growers t o plant more
rubber, although the acreage figures given before were not accurate
enough to enable us to compare the acreage increase of the 1920's with
that of the 1930's. During the latter decade, however, Thailand was
27Ingram, ~., p . 105.
28 Ibid.
a member of the cartel and new planting was supposed to be rigidly
controlled . 29
78
The International Rubber Regulation Agreement of 1934-1943 was
formed in 1933. The member governments felt that it was necessary for
Thailand to become a member of the agreemen t because of the long common
border with Malaya which facilitated smuggling and reduced the effec tive-
ness of the agreement. Therefore, Thailand was given exceptionally
favorable terms in order to induce her to become a member.
K. E. Knorr expla ined the position of Thailand under the cartel
as follows:
Thailand was guaranteed a m1n1mum percentage of her basic quo ta amounting to 50, 75, 85, 90, and 100 percent fo r the f ive control years from 1934 to 1938. Despite this liberal concession, the Thai parliament r efus ed to ratify the agreement, insisting on an increase in its basic quota from 15,000 to 40,000 tons and complete freedom of action. These demands were not grant ed immediately, and the restriction scheme was started without Thailand's participation. Yet her position was so strong, both on account of her expanding production capacity and a geographic location eminently suitable as a smuggling base, that the country ' s basic quota was increased as demanded for the years f rom 1935 to 1938, and Thailand permitted /sic/ t o extend its rubber plantations by a t otal of Jl,OOO acres.30
Again the result was that the quotas allotted to Thailand did not
necessitate much curtailment of output; indeed, in most years she was
not able to produce her full quota. 31
29McFadyean , ~., pp. 24-47, and Knorr,~., pp. 88-107.
30rbid., p . 114.
31Ibid., p. 248 .
79
Since World War II there has been no restriction on rubbe r produc-
tion. The governmen t has encouraged production through its land policy
and through technical assistance to growers, while at the same time it
has derived revenue from the industry by taxing exports.
Al t hough Thailand is one of the leading producers, yet her problems
are not identical wit h those of most of her neighbors. Most of the
plantations are in the fo rm of smallholdings, whi le most of the rubber-
bearing areas in other producing territ ories are under the efficien t
management of various estate concerns. The smallholders work their
trees on a hand-to-mouth basis. They do not care much about the quantity
of the rubber produced and sometimes lack knowledge and use poor techni-
ques. Virginia Thomson once said that the price received by Thai rubber
is always lower than that for Malayan rubber because Thailand lacks
scientific methods. 32
Another problem about rubber trees which was reported by American
University Field Staff was that:
The rubber trees, for instance, are almost prewar stock, irregularly planted, uneven in growth, and scarred in tapping. Many have been badly tilted by the winds, and many more are badly overgrown with fungi and parasites. The undergrowth i s rarely cleared~ fertilizers, if used at all, are applied parsimoniously.~)
Although, the above view is rather over sta ted, such as that
most rubber trees are of prewar stock, nevertheless, it is not without
reason and cas ts light on Thai problems.
32virginia Thomson, Thailand: The New Siam (New York: the Macmillan
Company, 1941), p . 480.
33Hanna, ~. , p. 3.
80
Beside all these problems, certain specia l difficulties have arisen
f r om the st rong competition with synthetic r ubber . Synthetic rubber
production and consumption have gone f ar ahead of natura l rubber since
1962-1963. Thailand, however, still looks bright for the f uture of
natural rubber as Sir Harry Melville, the President of the British
Science Research Council says :
Natur al rubber can compete with s ynthetic rubber provided natural r ubber i s so ld at compet itive price
. Natural rubber has certain unique qualities which synthe tic rubber can never hope t o replace.34
Anyhow, the Tha i government is well aware of the world natural
rubber si t uation and her own natural rubber industry. She is convinced
tha t rubber is one of the principal foreign exchange earners , employment,
governmen t income , and National income as a whole . Practically , all
the tasks involved in the improvement of the industry r es t heavily
on the government. The fo llowing are various steps which offer
projec t s in impr oving the Thai rubber industry . 35
Varietal and quality improvement
l. Indigenous varietal selection of rubber. Almos t all Heavea
plantations in Thailand grow by using seedlings resulting f r om natural
crosses of native var i e ti es. Thu s a wide r ange of variations occurred.
The objec t of this investigati on i s to survey and select high yi e ld
3~alayan Strait Time, Se ptember 17, 1965, quoted in Ratana Petchara Chantara, Future Situation of Natural Rubber and Development in Rubber Plantation, Rubber Division, Department of Agricultur e , Min i s try of Agriculture, Thailand, June 15, 1966, p. 8 . (Mimeographed )
35This part is heavily based on Department of Agriculture , Ministry
of Agriculture, Thailand, Para Rubber Improvement Project, 1965, pp. l-3. (Mimeographed)
81
varieties for further planting and distribution.
2. Selection of rubber through the improved varieties. During
World War II several good varieties of rubber have been introduced into
Thailand under government support. The planting of good varieties now
total approximately 24,710 acres (10,000 hectares). The productivity
of the new plant ations were better than those of na t ives, but many
varieties introduced are not of a pure line. The purpose of the inves
tigation is to select superior lines among these varieties for further
propagation studies .
3. Varietal improvement through hybridization. The ob jective of
varietal improvement is to search for a high yielding plant . However,
owing to past experiences it was found that many of the high yield
plants usually carr y many inferior characters, such as formation of
trunk, susceptible to insects and diseases, etc. The purpose of this
study is to hybridize plants of superior character, study and collecting
the good desirable characters for better planting.
4. Regional testing of rubber varieties . Selected varieties of
Hevea may fit and grow well in certain locations but may not do so in
others. Regional trials for varieties in different locations will
assist in finding out proper varieties to be recommended and extended
to planters.
5 . Quality impr ovement of rubber . Thailand r anks t hird in export
ing rubber, but 55 percent of the products are of low grade. This does
not mean the raw latex is of low quality; it is mostly due to the lack
of proper technique in processing. For example, many private firms
still use coconut shells in collecting latex instead of porcelain cups
or other equivalents . Fil t ering is still practiced in a primitive way,
82
and there is lack of curing and procession. Since the Thai government
has already ga the red all information needed through previous inves tiga -
tions, the main purpose of thi s project is to extend correct methods
fo r processing, not on ly be r ecommendat ion but also including training,
demonstration , and investigati on of other better methods for processing .
The varie tal and quality improvement mainly was worked through the
government branches in the Ministry of Agriculture . But the principal
works are assigned to the Rubb er Division, Department of Agriculture
and Rubber Organiza ti on. The Rubber Division has branches and stations
sca ttered over the rubber areas in the Eastern and Southern r egions--
altogether, twenty-seven off ices and stations. The Rubber Organization
has the head off ice and rubber plantation at the center of the Sou thern
r egion between Surat Thani and Nakorn Si Thammarat. 36
Impr ovement on cultural practice
The Office of Rubber Replanting Aid Fund has assisted private
rubber planters since 1961. Those who request aid have t o eliminate
their own poor native rubber trees and replant with new approved high
yield varieties. This requires at least seven years before the new
trees s tart t o give products whic h will affect the annual income of
owners . The Thailand replanting scheme will be discussed in de tail in
Chapte r VI. The objec tive of this research is to investigate artificial
means to s timulate the production of old plants, and to prolong their
productive lives in order to overcome the losses during the period of
36oisayavanich, ~- , pp . 166-1 76; and Public Admini s tration
Department, Manual of the Organization of Thailand (Bangkok, Thailand: Mongkol Karnpim, 1961), pp. 220- 221.
Rubber Organization was established under the Rubber Organization Act 1961 . After it has long experience and success in operating and demons trating rubber plantation business . At the same time it lends services in rubber field to the gove rnment and the people at large.
83
waiting for the new plantat ions to start yiel ding thei r products .
Soil fertili ty improvement
Generally, the rubber tree can gr ow in any type of soil of ordinary
fe rtility. Like any othe r crops, if ferti lity of soil could be improved,
its yie ld i ng ability would increase remarkedly. Many institutes have
fo und fertilizer formulars and grades fo r the rubber trees under their
conditions. It is therefore the purpose of this research t o find ou t
the proper fe rtilization for the rubber plantation under Thailand's
env ironmental conditions.
Pests and siseas control
Abnormal leaf fall is a common and often destructive disease on
rubbe r plants. In Thailand, the r eduction in yields due t o thi s disease
has been observed in many areas in the Southern regi on. Although young
r ubbe r trees seem to be more suscep t ible t o the disease , particularly
in winter, mature trees have of t en shown a high level of infec tion.
In Ma laya , the fungi Oidium heveae and /or Cloesoporium alborubrum are
the caus al agents.
CHAPTER V
COMPETITIVE POSITION OF NATURAL
AND SYNTHETIC RUBBER
Natural rubber long had a monopoly position in the rubber market.
Today over fifty percent of the annual production of rubber is in the
form of synthetic rubber and this proportion may be higher in the future .
It is perhaps trite, but nevertheless true, that the natural rubber
industry is "fighting for its life." Because of this, raw rubber
has been and continues to be the leading product and export commodity
of many underdeveloped countr i es. Their economic welfare, therefore,
is large l y tied to thi s commodity. The leaders of natural rubber
producing countries ar e confident that the competitive challenge offered
by synthetic can be met.
Ratana Petchara-Chantara, Director of Thailand's Rubber Division,
Department of Agriculture, in his report, "The Future of Natural Rubber,"
reported: "The future of the natural rubber industry is still bright
but the planters have to take an important step with high- yi eld
1 replanting.''
said:
B. C. Sekhar, Director of the Malayan Rubber Research Institute
Synthetic rubber science has been stretched t o the limit. The limit ha s probably been reached in the search
1Ratana Petchara Chantara, Future of Natural Rubber Situation and
Rubber Plantation Development (Bangkok: Department of Agriculture, 1966) ' p. 18.
by scientists for a synthetic that would fu lly rival natural rubber. Eve n though synthe tic is s lightly better in resilience, it does not have the inherent strength of natural rubber . When the scientists tried to i ncrease the s tre ngth of synthetic, they found its resilience had decreased. 2
85
In viewing the present position of the natural rubber industry,
it is necessary to make a careful study of the factors dec id i n g the
compe titiveness of natural rubber and synthetic rubber. Those facto r s
would seem t o be:
l . The s tructure of the rubber marke t and the availabilit y of
nat ural and syn the tic rubber.
2 . Technical advantages and disadvantages.
3. The r e lative price of natural and synthetic rubber.
4. The r e lative production of natural and synthetic rubbe r .
Str uctur e of the Rubber Market
A very important aspect would seem to be that synthetic r ubbe r
plants are usually not inde pendent firms, but belong either to one of
the giant rubbe r-using companies, or t o the equa ll y giant petrochemical
concerns that produce the raw material for synthe tic rubber. Those
rubber manufacturers whi ch own a synthetic rubber plant will not easily
swi tch to natural rubber. As Charles F. Phillips stated:
In terms of production capacity the synt hetic rubber industry is an oligopo l y. The four firm concentration ratio for the general purpose rubber3 producers is 62 percent,
2Ibid., p. 5. Mr. Sekhar lecturing at Penang City Hall and was report~y Malayan Straits Time, Se ptember 29, 1965 .
3There are two major classifications of synthetic rubber . (1) General purpose rubber (Styrene-Budadiene Rubber : SBR), developed t o replace natural rubber in major uses, accounts f or nearly 82 percent of
representing a slight increase over the 1955-1959 period . This oversta t es, however, the concentration of sa l es passing through the actual market, since the largest producers are also the mos t fully integrated. Nearly 51 percent of domestic SBR sa l es are "captive " re presenting eithe r intercompany transfers or sales to affiliated or constituen t companies . 4
86
Although some natural rubbe r plantations are owned by rubbe r using
companies (usuall y tire manufacturers), their importance is small . 5
It is obvious that the exis tence of captive marke ts ensures a
competitive advantage for exis t i ng synthetic producers. The existence
of ca ptive markets is repeated in brief by Mr s. M. J. 't Hooft We lvaar s :
It is stated that in 1960 only 25 percent of budadiene sal es wer e true open market sa l es , 46 percent of sales on the contrary were merel y inter-company transfer .... Regarding sales of gene ra l purpose rubber, captive sales amounted t o 55 per cent of t otal U. S. come stic sales in 1960. Thi s percentage was about equall y divided be tween i ntracompany transfers and sales to affiliated and consti tue nt companies .6
total syn the tic production. (2) Special pur pose rubber (Butyl: IIR, Neoprene : CR, and Nitrite : NBR), developed to replace natural rubber in cer tain uses, account for the remaining 18 percent. In recent years a third maj or t ype , s t ereo regular rubber, has been developed . This rubber has the same unit s tructure as the natural rubber hydrocarbon. Today, ster eo regular rubber has some shared in t he market. See Chapte r II, pp. 26-31 and also Charles F. Phillips, Jr . , "The Competitive Potential of Synthetic Rubber," Land Economics, XXXVI(l 960) , pp. 322-326 .
4c harles F. Phillips, Jr ., ' ~orkable Competition in the Synthetic
Rubbe r Industry, " Southern Economic J ournal, XXVIII(l96l-l962), p. 155 and also see Table l, p. 156.
5 Examples are Goodyear ownership of two large e states in Indonesia ,
Firestone and B. F . Goodrich owning 70,000 and 60,000 acres, r espectively , in Liber ia, Goodyear plants in Guatemala, e tc.
6 UNCTAD , TD/B/AC. 2/4 , op. cit., p. 21.
87
Another advantage is the time-distance. In the Uni ted States,
general l y, the raw material producer can ship synthetic rubber t o the
manufacturer almost overnight and in some cases the y are immediately
adjacent fi rms. For natural rubber, it takes about six weeks between
supp lier and factory.
Availability of synthetic rubber will in all probability continue
to be exce llent . The present overcapacity of synthetic rubbe r plants
is not very likely t o be diminished appreciably in the near future.
Technical Advantages and Disadvantages
In an address befor e the International Institute of Synthe ti c
Rubb er Producers' Conference~ which was held in Brussels, Belg ium, on
May 11, 1962, George R. Vila, Pres ident of the United States Rubber
Company , outlined the fac t ors determining the manufacturer ' s preference
be tween natural and the various types of synthetic rubber . He selected
five f actors most important for scoring performance. They are: wear
resistance, heat buildup, groove cracking r e sistance, ch ipping resis-
tance, and aging resistance. 7
According t o Mr. Vila, natural rubber is s till consider ed pr e tty
good in wear resistance. It is particularly durable at coo le r driving
t emperatures . The cold count r ies like Sweden pr efer na t ural rubber
because of this fundamental advantage . Low hea t build up remains the
best advantage of natural rubber, and makes it especially valuable for
7Geor ge R. Vila, speech delive r ed before the Internati onal
Institute of Synthetic Rubber Pr oducers in Brussels, Belgium, on May 11, 1962.
88
heavy duty tires. Although natural rubber starts to crack sooner than
synthetic rubbers, its cracks deteriorate more slowly. Natural rubber's
chipping resistance is outstanding and becomes the standard to which
all synthetic rubber strives. However, natural rubber is relativel y
deficient in resistance to aging. Natural rubber has been approached,
but never excelled by the synthetics in ease of mixing. It still
reigns supreme in building tack (adhesiveness) a l so, but when natural
rubber is cured above 140 degrees centigrade, the problem of polymer
deterioration arises.
In order t o provide a clearer picture of the comparative technical
competition between natural and synthetic rubber, P. C. Ratchaga has
divided the general purpose rubber market (the largest sector of rubber
market) into three zones:
1. Natural rubber zone
2. Synthetic rubber zone
3. Competitive zoneS
The natural zone is that portion of the general purpose market in
which natural rubber is preferred to synthetic rubber. Synthetic
rubber is preferred to natural rubber in the synthetic zone. In these
two zones, physical characteristics are the most important factors in
deciding which one to be used . There is still some degree of competition
in these two zones, especially if the price difference between the
two commodities is too large. The competitive zone is the fraction of
the market fo r general purpose rubber where the two commoditie s are
8P. C. Ratchaga, "The Future of Malay's Natural Rubber," Malayan
Ec onomic Review, I(l956), pp. 42-47.
89
competing with each other and price is the on ly factor in deciding which
one is t o be bought .
T. R. McHale made a brief conclu sion about these three zones as
fo llows: ·
In Zone 3, the ultimate choice be tween syn the tic or natural has revolved around price or cost conside rations . If the cost o f natural were l ower than the cost of synthetic relative t o the value of the final product, then natural was selected. As we shall see, recent developments in the syn thetic field threaten to virtually eliminate Zone 2, where natural enj oys a t echnical superiority and t o increase Zone 3 where there is competition between the two.9
The division into these three zones is made after deducting
special purpose rubber f r om the t otal rubber market, since nearl y all
special purpose rubber is now made from synthetic rubber.
Dr. J. N. Street, Dir ec tor of Laborator ies, Firestone Tire and
Rubber Company, estimated the respective sha r es of the three zo nes as
fo llows: Natural rubber zone, 27 percent of the t otal general purpose
rubber requirements; synthetic rubber zone, 38 percent; competitive
zone , 35 percent . 10
All three zones are not "complete l y black" or
"complete ly white " but all of them involve a certain degree of "grey ."
Even i n the competitive zo ne the two types of rubber are not absolutely
sa tisfactory substitutes. However, small price differential s are
significant and if maintained over a period of time will bring about
a large switch over within this area.
9r. R. McHale, "The Competiti on Between Synthetic and Natural Ru ber," The Malayan Economic Review, VI(l96l), p . 24.
10J . N. Street, Natural Rubber News, December, 1954, quote in "Ratchaga, 11 o p. cit . , p. 45.
90
Ratchaga conc l uded that if the price of natural rubber were higher
than the price of syn thetic rubber, only 27 percent of the general
purpose market would be ca ptured by natura l rubber. But if the price
of natura l rubber could be l owered to a level be l ow that of synthetic
r ubber , it is possible that total consumption will be 62 percent ( 27
+ 35 percent) of all t o t al general purpose rubber, assuming, of course ,
that the supply can be sufficiently i ncreased. In the s ame way, if the
price of synthetic rubbe r remain s l ower than that of natural rubber, the
total consumption of synthe tic rubber can be as high a s 73 percent (38
+ 35 percent) of total general purpose rubber consumption--if, that is,
supply can be sufficiently increased .11
Thus, if the producers of natural rubber can reduce their cos ts
so as to enable them t o offer their products in the international
market a t a price l ower than a price of synthetic rubber , the future of
the natural rubber industry can be bright . There is no reason, of
course, t o assume that the entir e 62 percent will be r ealized since most
synthetic rubber plants in the United States are in the hands of the
tire manufac turers. 12 Bu t the argument serves t o show that the market
for rubber is divided according t o the two aspects of compe tition men-
tioned above, and how the share of the t wo rubber industries ma y be
c hanged by varying the price and cost structur e.
The othe r aspect of competition is the technical advantage of
synthe tic rubber because of its uni fo rm quality. Because it is a synthetic,
11rbid., pp. 46-47.
12Robert Solo,"The New Threat of Synthetic t o Natural Rubber, " Southern Economic J ournal, XXII(l955 -1956), p. 57 .
91
man-made product, its chemical composition is known and can be control-
led. Moreover, producers can tailor synthetics to the needs of customers.
In contrast, the quality of natural rubber is far from uniform, varying
considerably among estates, small holdings, and producing countries .
This is one problem that has confronted rubber manufacturers for many
years. In a discussion of crude rubber quality problems the Rubber
Manufacturers Association reported in 1952:
The tremendous growth of small holders production compared to European-managed estates has created transport and distribution problems. The emergence of many new middlemen-traders and commercial packers having primary interest in short-term and speculative profits has brought emphasis on quantity rather than quality. Periods of excess demand and the large differentials between grades created incentive to upgrade, mix grades and otherwise engage in unscrupulous practices. 13
Recently, as a direct result of the emergence of the synthetic
rubber industry, attempts have been made to improve this situation, both
for export ing and importing nations. Natural rubber quality, including
poor pack, moisture in bales and mixture of grades, has been the prom-
inent topic of discussion and consultation. New grade specifications
have been adopted and accepted by producing and consuming countries
alike. As a fur ther aid, the members of the New York Commodity
Exchange adopted a new rubber contract, 11Standard Rubber Contract, "
in 1961.
The new contract basic grade is No . 1 International Ribbed Smoked Shee ts. Rubber inferior t o this grade is deliverable at discounts f or half-grade but not as low as No. 2 International Ribbed Smoked Sheets.l4
13w. J. Sears and C. C. Miller (eds.), Natural Rubber Buying (New York: The Rubber Manufacturers Association, Inc., 1953), p. 10.
14Rubber Age, March, 1961, p . 1050.
92
In 1965, Dr. Lim Swee Aun, the Malaysian Minister of Comme r ce and
Industry, announced that Malaysian producers are shortly t o market
natural rubber to a guaranteed t echnical specification, Standard Mal ayan
Rubber (SMR), in convenient plastic-covered bales. 15 The SMR has
quali fic ations roughly as followed:
The specification for SMR is broadly similar to that proposed by the International Organization. There will be three basic grades, SMR 5, SMR 20, and SMR 50. These wi ll be graded according to purity as measured by the content of particulate dirt and other injurious contaminants, rather than by visual appearance as at present
Minimum levels of dirt content are 0.05, 0.20, and 0.50 percent, respect ive l y , for the three grades.
The greatest advantage synthetic rubbers have over natural rubber,
however, is the vast amount of research and technical assistance that
goes into the production and use of synthetic rubber. According to Dr.
L. Bateman, Chairman of the Malaya n Rubber Fund Board, in an addre ss
in Tokyo in May 1964, the annual research expenditur e on syn thetic
rubber i n the United States alone amounted to $124 million, where total
r esearch expenditure for natural rubbe r over the world onl y added to
$6 million .16
Any improvement ei the r in composition or in pr oduction
processes is mainly sought for i n the field of synthetic rubber, and
thus s timulates its use, while extension of the se developments to the
natural rubber field is hindered by lack of funds, and perhaps by
lack of coordination of research.
At present the manufacture of rubber articles is still labor inten-
sive; changes t o a capital intensive production process might considerably
15Rubber Development, XVIII(l965 ), p. 21.
16 UNCTAD, TD/B/ AC, 2/4, ~ .• p. 23.
93
lower costs. Expe riments in this direction are pushed through by
synthe tic r ubber producers, who have made s pecia l solution polymers
for this pur pose. I f a s tage were r eached where this process is possible
fo r certain synthetic rubber, while it would still be impossible fo r
natural rubber, its labor cost saving aspects might l ead t o subs titu -
tion away from natural rubber t o syn the tic rubber , even if the la tt er
were mor e expensive raw material. 17
This aspect should no t be neg lected, es pecially as the main c onclu-
sion from previous paragraphs would seem t o be that in certain fields
of usa ge natural has no definite technical advantage ove r synthetic.
It would on l y be bough t at a price lower than that of synthetic rubber,
owing t o its shortcoming, both in constant availability and technical
spec i f i cati ons .
The Relative Price of Natural
and Synthe tic Rubber
If there were no qua lity difference between natural and synthetic
rubber, it would be perfectly justi fiab l e to say that the price com-
petition be tween the two commodities was alr eady over and had been won
by synthe t ic rubber . This would be justifiable since the price of
natural rubber, except in 1949, has been always highe r than the price of
synthetic rubber. A trade j ournal for the rubber industry recently
s tated:
In the past, natural rubber has normally c ommanded a fai rly substantial premium ove r general
17Ibid.

purpose syn the tic r ubber, because of its superior over-all qualities , but a new situation is now deve l oping as a result of the evolution of stereospecific rubbers .. . It is now quite clear that, more than ever in th e past, the natural rubber indu s tr y has t o face compe tit ion from man-made rubber on the basis of price, rather than qual ity . l8
94
The truth of this statement can be questioned, but its impl emen-
tation raise s many compl e x problems.
In the past, natural rubber pric e have borne littl e relationship
t o production costs. The suppl y curve of natural rubber is relatively
ine last ic in the short run, large l y due to the seven to ten year s
waiting-period be tween planting and tapping . In the short run, there -
fore , produc tion costs will have little effect upon the "free 11 market
price of natural rubber. But because demand conditions are subject to
continuous change, price show wide f luctuations over a period of years,
or even from one month t o another. Dr. C. R. Wharton, Jr. Malayan
economis t, made a brief view· about demand, supply, and price of
natural rubber that:
The threat of economic instability is certainly not due exclusively t o supply charact e ristics alone. Demand factors are equall y important shifts in demand due t o exogenous fac t ors s uch as wars, threats of war, stock piling decisions, deve l opment of sbustitutes and their prices . ... The short run in elastic ity of su pply of rubber shou ld not be neg lected in the formulation of policies designed to cope with the threat and r eality of instability. Given an inelasticity in supply, any shifts in demand merely aggrevate the fluctuation s in price and the resulting instabi lit y . Second , t he long-run inelasticity of supply which has very serious economic implications fo r r esource al location and mobility shou ld be taken into cons ideration.l9
l8Rubber Age, January, 1962, p. 676 .
19wharton, ~., p. 162 .
The following are brief (actors that influence natural rubber
prices, primarily from the demand side.
95
1. Economic conditions in consuming count ries. General economic
conditions in consuming countries raise or depress price of imported
crude rubber. Undoubtedly, this is the most significant factor affect
ing the long-run price of natural rubber.
2. Political disturbance within the rubber producing countries.
Prices are particularly sensitive to political disturbances that block
or threaten supply . The good example is the price of natural rubber
rising from 27 . 8 cents per pound (second quarter of 1950) to 73 cents
(first quarter of 1951) after the attack on Korea.
3 . Bilateral barter agreement. The supply of crude rubber is
further effected in any particular year by the number of trade agree
ments arranged between producing countries and buyers. In 1959, t o
illustrate, Ceylon exchanged 30,000 tons of rubber with Red China for
250 ,000 tons of rice. It was not until the following year, therefore,
this rubber producing country re-entered the rubber market and then only
for a shor t period of time.
4. Centrally planned countries purchases. In the past few years,
buying by the Communist Bloc ha s had important effects upon crude rubber
prices. In 1961, Russia purchased an es timated $76 mill ion worth of
Malayan rubber, compar ed with about $50 million the preceeding year. 20
Chinese purchases, too, have become significant. As these purchases
are unpredictable, they add to market f luctuation.
20Phillip, ~. , p . 165 .
96
5 . Stockpile programs . In recent yea r s t he wor ld rubber market
has been strongly influenced by the specific government policy relating
to the strategic stockpiling program in the Uni ted Kingdom and the
Uni t ed States. This policy is still a C<' ntrove r sy between rubber
producing countries and both consum rs.
These f i ve factors are significant in explaining variations in
natural rubbe r prices. Some are common to al l raw materials; others
are particular t o the rubber market. Over a l onger period, it is
expected that the s tabil ity of synthetic rubber prices will r educe
fl uctuations in the price of natural rubber (see Table 29).
Table 29 shows the average s po t price of R.S.S. l t ype of natural
rubbe r in New York and the average price of three major synthetic rubbers.
The prices of synthetic rubbers are overs tated because the quota tions
do not show the discounts which are almost the rule, bringing the price
down by one or two cents . Synthetic rubbe r prices are moreover
quo t ed on de livery , whereas the natural rubber price is the New York
c .i. f . price t o which fur the r t ransport cos ts must be added.
The situation in 1949, when the price of natural r ubbe r was actually
l ower than the price of syn the tic rubber, indicates that at that time
price competition was s till in pr ogress and almost won by the natural
rubber industry. Tire manu f acturers, who we re required t o con s ume a
certain amoun t of synthetic rubber , demanded tha t the synthetic rubber
plant s be abandoned and suggested that the stockpiling plan alone be
tru sted to provide securi t y .21
But before some r eal actions were taken,
21Rob ert Solo, "The Sale of Synthetic Rubber Plants," Journal of Indust rial Economic, II(l953), p. 37 .
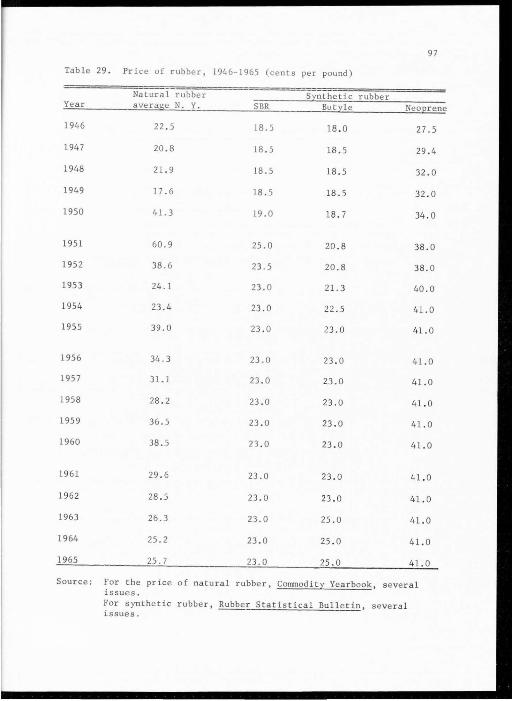
97
Table 29 . Price of rubber 1946- 1965 (cents per pound)
Year
1946
1947
1948
1949
1950
1951
1952
1953
1954
1955
1956
1957
1958
1959
1960
1961
1962
1963
1964
19 65
Natural rubber average N. Y.
22 . 5
20.8
21.9
17. 6
41.3
60.9
38.6
24.1
23 .4
39. 0
34.3
31.1
28 .2
36 . 5
38.5
29.6
28.5
26.3
25.2
25 . 7
Synthetic rubber SBR Butyle Neoprene
18.5 18 . 0 27.5
18.5 18.5 29.4
18.5 18. 5 32.0
18.5 18.5 32 . 0
19.0 18.7 34 .0
25.0 20.8 38.0
23 . 5 20.8 38 .0
23.0 21.3 40.0
23.0 22.5 41.0
23 . 0 23 . 0 41.0
23.0 23 . 0 41.0
23.0 23.0 41.0
23.0 23.0 41. 0
23.0 23.0 41.0
23 . 0 23 . 0 41.0
23 .0 23.0 41.0
23 . 0 23.0 41.0
23 . 0 25.0 41. 0
23.0 25 . 0 41.0
23.0 25.0 41.0
Sour ce: For the price of natural rubbe r, Commodit y Yearbook , several issues . For synthetic rubbe r, Rubber Statistical Bul l e tin, several issues.

98
the Korean Crisis had cuased the price o f natura l r ubber to r ise again
and the objec tions of the synthe t ic rubbe r consumer faded awa y .
Now, we can ask whether or no t t he s yn the tic rubber industry has
been competitive in terms of price s ince 1949. The fac t that the price
of natural rubbe r was higher than the price of synthetic rubber between
1950-1965 doe s not necessarily mean that the synt hetic rubber industry
has been competitive relative to the natural rubber industry in terms
of price . In order t o be able t o dec ide what the situation really is,
we have t o take the quality di ffe r ence between natural and synthetic
rubber into consideration . A price difference must allow fo r this
quality difference . Af t e r such a price dif fe r ence is deducted from the
price of natural rubbe r, then the above question can he answered
cor r ec tly.
The Relative Production Cost of
Natural and Synthe tic Rubber
The possible eme r gence of the price competit ion between natural
and synthetic rubber makes it imperat ive to cons ider the ir respective
production cos ts, and the possibilities of l owering either in the
long run. As wi th quality, natural rubber costs var y subs tantially
be t ween pr odu c ing countries . The r e lat ive cost invo lved in producing
na tural rubbe r and its synthetic counterpart now becomes the dominant
variable in the l ong run pattern of development.
One line of s tud y shows that an initial capital outla y for the
cons truct ion of an optimum size plant producing SBR per year i s e stimated
at $10,000,000 . An initial capital investment of $250 must be made for
99
every ton of rubber to be produced each year. 22 On the other hand,
McGavack estimated that about $500 per acre is required to bring planta -
tion rubber into maturity, if starte d f n ,m scratch. A production of a
little more than a ton of natural r ubber per acre per year is calculated.
Therefore, the initial capital inves tment in modern plantation rubber is
approximately twice the capital cost which is required to produce a ton
of synthetic rubber in the most efficient size plant. However, the life
of a plantation is about twice as long as that of modern synthetic
rubber plant . 23 Thus, it appears that over a long period of time the
relative capital outlay to produce a t on of ei ther natural or synthetic
rubber is about the same .
As to the labor cost , plantation labor cost is greater than that
of the synthetic rubber industry because a muc h greater number of laborers
is used per unit of production. However, the plantation rubber industry
has the offsetting advantages of a much lower rate of wage for hand
labor. It seems possible that this advantage will last for a long time
to come.
In addition, several recourses to overcome the necessity for this
greater employment of hand labor are available to the plantation rubber
industry. Replanting with high yielding clones, a new t echnical develop-
ment known as stimulation, which requires only small amounts of particular
chemicals at infrequent times to increase the yield of rubbe r trees,
and mechanization of some of the production process may outstrip the
22c. H. Chilton, Chemical Engineering, VI(l958), pp. 102- 105, as quoted by John McGavack, "The Future of Natural Rubber," Rubber Age, 91, February, 1959, p . 791.
23McGavack, Ibid . , p . 793.
100
current disadvantage of employing a greater number of hand laborers.
The strongest basis for Dr. McGavack 's belief that production cost
of syn thetic rubber will always be higher than natural rubber lies in
the assumption that all of the raw ma t erials which go into the produc-
tion of synthetic rubber have to be produced at a relatively high cost .
In contrast to the synthetic material, virtually the entire ingredients
required in the production of natural rubber ar e free. More specifi-
cally, the carbon dioxide of the air, the mineral substances from the
leaf drop of the trees, the tropical soi l, containing minerals and
water, and sunlight in quantities more than sufficient to polymerize
all the rubber are all there for the a sking.24
The other approach is in terms of cost reducing competition be
tween natural and synthetic rubber. 25 It m ~ght bring the price of
natural rubber do1.n to the point where it becomes unprofitable t o
produce synthetic rubber in existing plants, l e t alone to create new
capacity .
Dr. W. E . Cake, in a 1962 article "The Position of Natural and
26 Synthetic Rubber in this Changing World," es timated the selling price
of various types of synthetic rubber that would be necessary:
1 . To continue production at all
24Ibid . , pp. 795 - 796 .
25This part is based on Mrs. 't Hooft Walvaars' study, preparing for UNCTAD. UNCTAD, TD/B/AC . 2/4, ~., pp. 25 - 31.
26w. E. Cake, "The Position of Natural and Syn t hetic Rubber in t he Changing l~orld," Revue General de Caoutchouc, 39, 1962 , quoted in Petchara Chantara, ~. , p . 7.
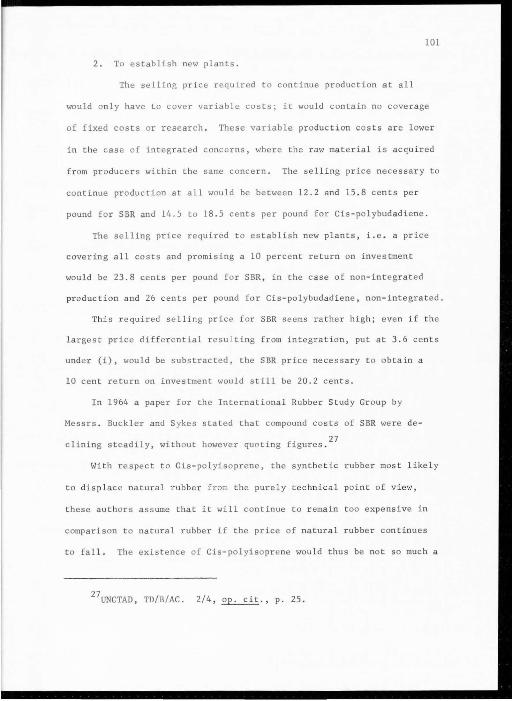
101
2. To establish new plants.
The selling price required to continue production at all
would only have to cover variable costs; it would contain no coverage
of fixed costs or research. These variable production costs are lower
in the case of integrated concerns, where the raw material is acquired
f r om producers within the same concern. The selling price necessary t o
continue production at all would be between 12.2 and 15 . 8 cents per
pound for SBR and 14.5 to 18.5 cents per pound for Cis-polybudadiene.
The selling price required to establish new plants, i.e . a price
covering all costs and promising a 10 percent return on investment
would be 23 .8 cents per pound for SBR, in the case of non-integrated
production and 26 cents per pound for Cis-polybudadiene, non-integrated .
This required selling price for SBR seems ra the r high; even if the
largest price differential resu l ting from integration, put at 3.6 cents
under (i), would be substracted, the SBR price necessary t o obta in a
10 cent return on investment would still be 20.2 cents .
In 1964 a paper for the Internationa l Rubber Stud y Group by
Messrs. Buckler and Sykes stated that compound costs of SBR were de
clining steadily, without however quoting figures . 27
With respect to Cis-polyisoprene, the synthetic rubber most likely
to displac e natural rubber from the purely technical point of view,
these authors assume that it will continue to remain too expensive in
comparison to natural rubber if the price of natural rubbe r continues
to fall. The existence of Cis-polyisoprene would thus be not so much a
27UNCTAD, TD/B/AC. 2/4 , ~., p. 25 .

102
threat t o natural rubber but an insurance against rising natural rubber
prices a nd natural rubber shortages . 28
A poss ible cost reduction in the synthet ic rubbe r industry might
stem from a lower price of the chemical raw material . The ma in chemical,
budadiene , was quoted i n 1956 at around 15 cents a pound and 1961 at
12-3/4 cents a pound. It is est ima ted that it could drop t o 10-1/2
cents a pound. 29
Considering the heavy amount of research in the synthetic industry ,
a lowering of cos t s through innovations seem always possible.
In the natural rubber industry an impressive process of cost redUc -
tion i s und erway . The information from the papers presented by Dr.
L. C. Bateman,30
t o the International Rubber Study Group mee tings in
Washington and Tokyo, in 1962 and 1964, r eve aled the fo llowing:
The reduction of production cos t s of natural rubbe r wou ld seem
possible in three ways:
(1) Rejuvenat i on pr ograms , as newer trees have been developed
with a f ar highe r yield,
(2) Mo r e sys t emat i c manuring and yi eld - s timu lat ion,
(3) Exploitation of f undamental research.
The last point , though of very grea t importance, is as yet diffi -
cult t o express by figures. The possible results of replanting or
new planting can be judged f r om the fo ll owing figures:
28Ibid., p. 26.
29Ibid.
301 . C. Bateman, "The Competitive Prospects of Natural Rubber over the Next Ten Years --The Suppl y of Natural Rubber," The Future of Natural and Synthe ti c Ru bbers, Proceedings of a Symposium organized by the International Rubber Stud y Group in Washing t on, D.C., May 20 t o June 1, 1962; and UNCTAD, ~., p. 26.
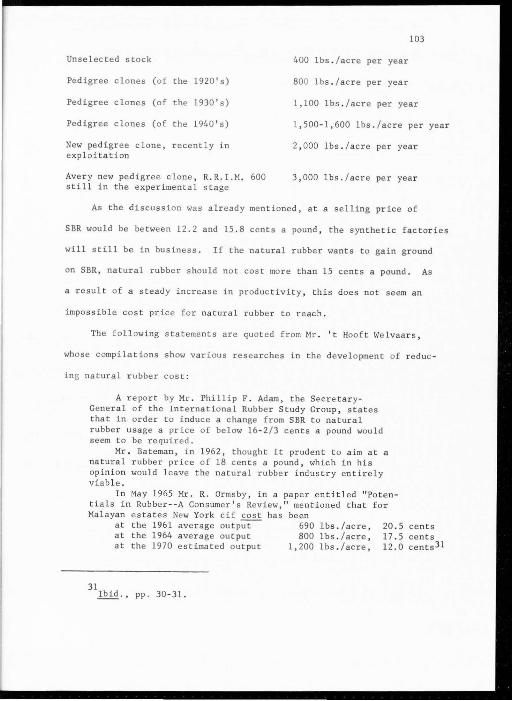
103
Unselected stock 400 lbs . /acre per year
Pedigree clones (of the 1920's) 800 lbs./acre per year
Pedigr ee clones (of the 1930's) 1,100 lbs./acre per year
Pedigree clones (of the 1940 ' s) 1,500-1,600 lbs./acre per year
New pedigree clone, recently in exp l oitation
2,000 lbs. / acre per year
Avery new pedigree clone, R.R .I.M. 600 stil l in the experimental stage
3,000 lbs . / acre per year
As the di scussion was already mentioned, at a selling price of
SBR would be between 12.2 and 15 . 8 cents a pound, the synthetic factorie s
will still be in business. If the natural rubber wants t o gain ground
on SBR, natural rubber should not cost more than 15 cents a pound. As
a r esult of a steady incre as e in productivity , this does not seem an
imposs ible cost price fo r natural r ubber t o reach.
The fo ll ow ing s tatements are quoted from Mr . 't Hoof t We lvaars,
whose com pilations show various researches in the develo pment of reduc -
ing natural ru bber cost:
A report by Mr. Phillip F . Adam, the SecretaryGeneral of the Internationa l Rubber Study Group, states that in order t o i nduce a c hange from SBR t o natural rubber usage a price of below 16-2/3 cents a pound would seem t o be required.
Mr . Bateman, i n 1962, thought it prudent to aim at a natural rubber price of 18 cents a pound, which in his opinion would leave the natural rubber industry en tirely viab l e.
In May 1965 Mr . R. Ormsby , in a paper en t itled "Potentials in Rubber--A Consumer's Review , 11 mentioned that for Malayan es tates New York cif cos t has been
at the 1961 ave rage outp~ 690 lbs . /acre, at the 1964 avera ge output 800 lbs. / acre , at the 1970 es timated out put 1, 200 lbs./acre,
31 Ibid . , pp. 30-31.
20.5 cents 17.5 cents 12.0 cents3l
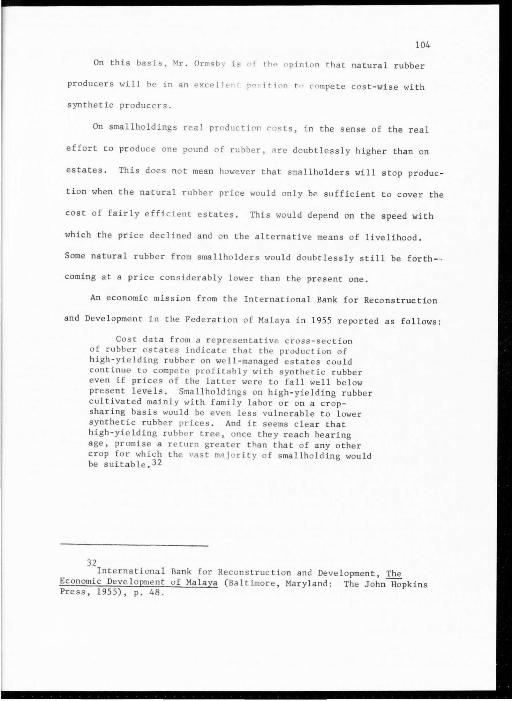
104
On this basis, Mr. Ormsb )' i s o f th "" o pinion t hat natural rubbe r
producers will be in an exc e ll pr.t r~ iti on t c1 c ompete cost-wise with
synthetic producers.
On smallholdings r eal pr oduc ti<'n r osts, in the sense of the real
effort to produce one pound of rubbe r , ~ r e doubtlessly higher than on
estates. This does not mean however that smal lholders will stop produc-
tion when the natural rubber price would only be sufficient to cover the
cost of fairly efficient es tates. This wo uld depend on the speed with
which the price declined and on the alternative means of livelihood .
Some natural rubber from smallholders wou ld doubtlessly still be forth - -
coming at a price consid e rabl y lower than the present one.
An economic mission from the International Bank for Reconstruction
and Development i n the Federation of Malaya in 1955 r eported as follows:
Cost data from a r e presentative c ross-s ec tion of rubber estates indicate that the pr duction of high-yie lding rubbe r on we ll-ma naged estates could continue to compete profitably with synthe tic rubber even if prices of the latte r were to fall well below present levels. Smallholdings on high-yielding rubber cultivated mainly with family labor or on a cr opsharing basis would be even less vulnerab le to lower synthetic rubber prices . And it seems clear that high-yielding rubbe r tree, once they reach bearing age, pr omise a return greater than that of any o ther crop for which the vast ma j ority of smallholding would be suitable . 32
32 Inte rnationa l Bank for Reconstructi on and Development, The
Economic Development of Malaya (Balt imore , Maryland: The John Hopkins Press, 1955), p . 48.
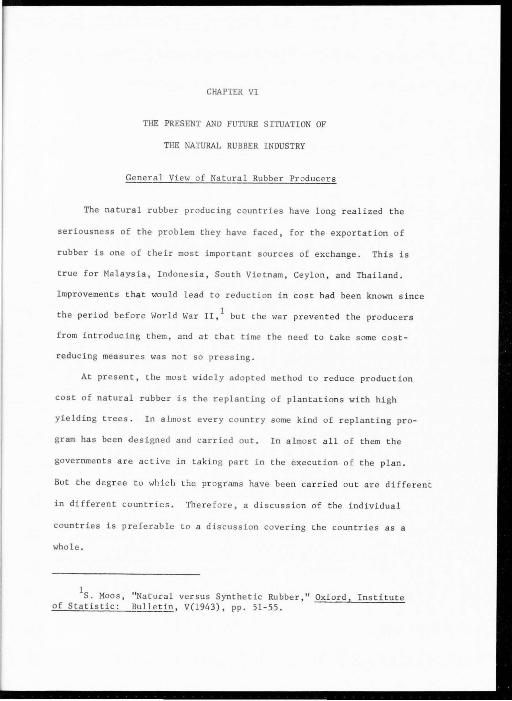
CHAPTER VI
THE PRESENT AND FUTURE SITUATI ON OF
THE NATURAL RUBBER INDUSTRY
General View of Natural Rubber Pr oducers
The natural rubber producing countries ha ve long realized the
seriousness of the problem they have faced, for the exportation of
rubber is one of their most important sources of exchange . This is
true fo r Malaysia, Indonesia, South Vietnam, Ceylon, and Thailand.
Improvements that would l ead t o reduction in cost had been known s ince
the period befor e World War II, 1 but t he war prevented the producers
f rom introducing them, and at that time the need to take some cost -
reducing mea s ures was no t so pressing .
At present, the most widely adopted met hod to reduce production
cost of natural rubber is the replanting of plantations with high
yield ing trees. In almost every country some kind of replanting pro-
gram ha s been designed and carried out . In almost all of them the
government s are active in t aking part in the execution of the plan.
But the degr ee t o which the programs have been carried out are di fferent
in differ ent countries. There fore , a discussion of the individual
countries is preferable to a discussion covering the countries as a
whole.
1s . Moos, "Natural versus Synthetic Rubbe r," Oxford, Institute of Statistic: Bulletin, V(l943), pp. 51-55 .
106
The Federation of Malaysia has proved the most successful in
replanting her rubber plantation. She has been engaged in replanting
schemes since 1955. With the large subsidy from the government, over
150,000 acres are currently being replanted per year, or about 4 percent
of the total land used for rubber production . At this rate, Malaya
expec ts to have completely high-yie ld acreage not later than 1973,
capable of producing an annual output of 1.2 million tons. 2 Today
more than 2,560,000 acres or about 60.7 percent of the total rubber
planted area has high yielding trees, as shown in Table 30 .
For Malaya today, the most important problem is time . The price
of natural rubber should remain fairly high and stable so that she can
complete the replanting scheme without too many difficulties. Thi s is
und erstandable since some of the funds used to finance the replanting
scheme have been obtained from export taxes . 3 The replanting scheme
has begun to show results at the present time. Until 1959, Indonesia
had been the world's leading producer of natural rubber. Since the
war, Malaya has forged vigorousl y ahead with the planting of new high
yielding stock and is now well established as the leading producer. 4
Indonesia, the second largest producer of natural rubber, is
still very far behind Malaya in replanting her plantations though s he
2The Wall Street Journal, January 11, 1961, p. l; and Rubber Age,
May, 1961, p. 313.
3Lim Chong Yah, "The Malayan Replanting Taxes," Malayan Economic
~' VI(l96l), pp. 43- 52 .
4D. D. Humphrey, "Indonesia ' s National Plan for Economic Develop
ment, " Asian Survey, II(l962), p. 13 .
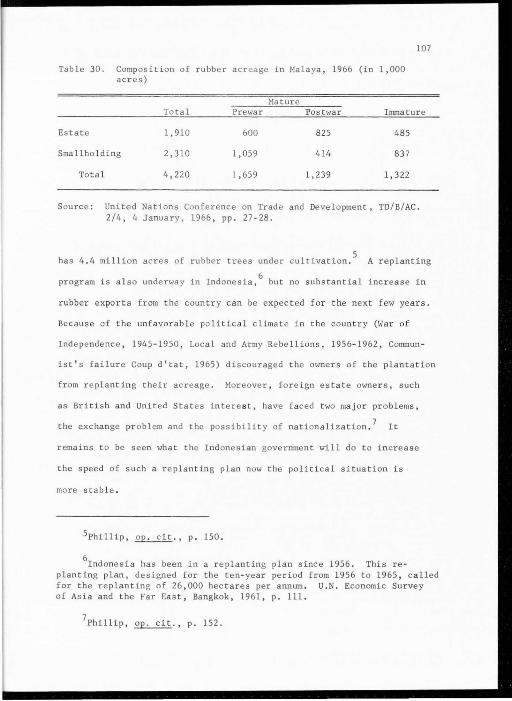
Table 30. Composition of rubbe r ac r eage in Malaya , 1966 (in 1,000 acres)
Mature
107
Total Prewar Postwar Immature
Estate 1,910 600 825 485
Smallholding 2,310 1,059 414 837
Total 4,220 1,659 1,239 1,322
Source: United Nations Confe r ence on Trade and Development, TD/B/AC. 2/4, 4 January, 1966, pp. 27-28.
has 4 . 4 million acres of rubber trees under cultivation.5
A replant ing
program is also underway in Indonesia,6
but no substantial increase in
rubber exports from the country can be expected for the next few year s.
Because of t he unfavorable political climate in the coun t r y (War of
Independence, 1945-1950 , Local and Army Rebellions, 1956-1962, Commun -
ist's failure Coup d'tat, 1965) discouraged the owners of the plantation
from replanting their acreage. Moreover , f or eign estate owners, such
as Britis h and United States interest, have f aced t wo major problems,
the exchange pr oblem and the poss ibilit y of nationalization . 7 It
r ema ins t o be seen what the Ind onesian government will do t o increase
the speed of such a replanting plan now the political situation is
more stab l e .
5Phillip, ~., p . 150.
6rndonesia has been in a replanting plan since 1956. This re
planting plan, designed for the ten- year period from 1956 to 1965, ca lled for the replanting of 26,000 hec t ares per annum . U.N. Economic Survey of Asia and the Far East, Bangkok, 1961, p. 111.
7Phillip, ~. , p. 152.
108
The present cond ition of the rubber plantations of Indonesia is
sti ll best described by Humphrey :
In rubber, as in other sector s , Indones ia ha s been living off of her capi tal s ince the trees have a productive life of 35 years, Indonesia still harves t s from prewar planting. Owing to neg l ec t of r eplanting 30% of es tate trees are now over 35 years old a nd additional 25% are ove r 30 years . Smallholders acreage which amount to more t han 70% of the total, though it accoun ts for about 60% of production, is in a s till worse condit ion owing t o the over - age trees . 8
The task of a replanting scheme in this country is muc h heavie r
than in Malaya . Immature trees which will come into produc ti on during
the next yea r consist of no more than 12 percent of the es tate area
and 3 percent of the smallholder area. 9 A recent r e port revealed that
if their af fa irs are straightened out in the next few years we might
10 expec t some improvement, per haps another 50 ,000 tons or so a year .
Thailand has the potential o f becomin g an important rubber pro-
ducing country. At the end of 1959, only 11.2 percent of the t otal
rubber plants wer e classified as high - yie lding trees. 11 The r e planting
program i s slow when compared with Malaya and Ceylon . A 1960 r e port by
F. A.O . called the attention of the Thai gove rnment to thi s fact:
The planting of rubber can no l onge r be looked upon, like in the pas t, as some thing that will take place of its own accord , without government he lp, advice, or control, according to the whim and will of a multitude of private individuals. The mere planting of new acres is not enough, they must be plant ed with the best available mate rials and according to up t o dat e techniques. Thailand can continue t o i gnore the hundreds of thousands of acres
8Humphrey , ~-, p . 13.
9Ibid . ,
lOH. C. Bugbee , "Natural Rubber's Place in the World Picture ," Rubber World, XV(l966), p . 95.

of low yielding rubber which are gradually , but sur ely becoming uneconomic a•1d are yearl y i ncreasing in numbe r.l2
109
Thailand ' s Rubber Replanting Act was drawn up in 1955, but little
concre t e action was t aken by the government until the Rubber Plantation
Aid Fund Act was passed on August 25 , 1960 . According to prediction
of the World Bank, the potentiality fo r expanding the productivity
capacity by means of develo pmen t of unu sed land in Southern Thailand
suitable for rubber trees was r egarded suff icient to increase the rubber
area two fo ld, with the possibility of tripling if these were terracing
of the usable hill country . 13 (The deve l opment of the Thailand replant-
ing program will be discussed later in this chapter.)
The government of Ceylon fol l owed the policy established by the
Ma layan gove rnment. Cey lon is now farther than Indonesia in her planting
scheme . But a new planting policy prohibits cultivati on of new rubbe r
without permission of the Min i ster of Agriculture and Land s . The present
Government subsidized rubbe r r eplanting scheme is the third five years
program t o be put in effect (the f irst and the second five years
program was f r om 1953 to 1958 and 1959 to 1963, respective ly). It is
hoped that Ceylon ' s tota l of 668,000 acres of rubber plant s will have
been comple tely r eplanted by the end of 1968 and the output of rubber
12F. A. 0., Expanded Technical Assistance Programme, Rome, 1960,
No. 1253 i s cited in the Far Eastern Economic Review , July 27, 1961, p. 182.
13 Inte rnational Bank fo r Reconstruction and Development, A Public
Develo pment Program for Thailand (Baltimore , Maryland: The John Hopkins Press, 1959) p. 71 .
110
will increase to about 160,000 long tons a year. 14
Elsewhere in South and Southeast Asia, Pakistan has recently
entered upon a rubber growing program in Eastern Pakistan, Chittagong,
and Sylhet. Their climatic conditions approach those in the Malayan
forest. There has not been much progress. In India, where most
rubber is produced by smallholders in Kerala Province and yearly averages
are low, the government has recently announced a modernization program
of planting and tapping. 15 In 1964, there were about 381,000 acres of
rubber trees and 6,519 acres were newly registered under the Rubber
Act of 194 7. 16 Finally, in Indochina, one-third of the cultivated
plantations were subjected t o war damage. However , Indochina rubber,
according to trade reports, is of high qua lity, c l ean, and well packed .
With the excep tion of Vietnam, which, despite the war, is still ex
porting some rubber, the outlook is good . 17 Cambodian estates , according
to a Rubber Age report were established by French companies whic h cover
90 percent of the total rubber area, producing 50,017 long tons in 1966.
This represents a spectacular yield of 1,302 pounds per acre, or over
450 pound more than the Malaysian yield . The present rubber tapped
area is only 70 percent of the total planted area, whereas the untapped
30 percent represent immature areas planted 5 year s ago with high yield
14Far Eastern Economic Review,~., p. 249 .
15Rubber Age, September 1960, p. 1087.
16Rubber Development, XVIII(l965), p. 54.
17 Bugbee, ~., p. 95.
111
trees . 18
Africa and Latin America produce about 200,000 long tons a year.
But they have many problems to solve. Natural rubber supplies from
Africa will continue to increase in the next few years . Two large
American rubber manufacturers, Firestone and B. F. Goodrich, own plan-
tations in Liberia, with free technical assistance being offered to
native producers, and both new planting and replanting continuing at a
rapid rate. 19 In Latin America, the rubber produced is not sufficient
for local consumption and still faces the lack of availability of labor.
They are unwilling to stay in the areas devoted to rubber production
without high wages. Moreover, the inability to control leaf blight
was a principal deterrent to plantation rubber. 20 Today, there are six
rubber companies {Firestone, Goodyear, Pirelli, Brasiliera de Borracha,
Dunlop, and General Tire), involved in rubber plantations in Brazil,
after the government decreed support of rubber plantations in 1952. The
other, Goodyear , has been establishing rubber plantations in Southwestern
Guatemala since 1957 . 21 It will be several yea rs before the success
of the program is known .
18 Rubber Age, April, 1967, p . 139.
19 Phillip,~. , p. 154-155 .
20 D. M. Phe l ps, Rubber Development in Latin America (Ann Arbor,
Michigan: University of Michigan Press, 195 7), pp. 169 - 170.
21 Phillip,~ - , pp. 155-156.
112
Thailand's Rubbe r Replant i ng Scheme22
It is generall y acce pted that rubbe r trees need about seven years
after the planting o f a rubbe r gr ove be fo r e the trees are sufficiently
mature for tapping . Ther eafte r its yiel d increases rapidly after the
first tapping until it reaches it s peak between the fourteenth and
seventeenth year. The maximum yi e ld of latex is attained in about 12
years . At 30 or 35 years , the re is declining yield and losses fro m
disease and the economic life of rubbe r trees . From then on , the tree
will not be worth tapping and will eventually produce nothing. 23
Thus it is clear that a rubber plantation must be periodical l y
renewed. It is generally accepted that t he whole stand should be
replanted approKimately every 30 years. If 3 percent of the trees
are replanted each year, the r enewal of the planted area will be completed
in roughly 31 years. Adding the period before the most recently planted
trees can be tapped, the tree will r enew its capital in about 40 years.
Then , at any one time, 21 percent of the planted area should be imma-
ture. The productive trees must carry the acr eage of immatur e rub be r
as well as the other plantation costs. In this case, if a plantation
postpones replanting until many of its trees approach the end of their
economic life , the revenue from the latter will not be enough to cover
all expenses , since much of the planta tion may be planted with immature,
non-yie lding trees .
23 Perey W. Bidwell , Raw Material : A Study of American Policy
(New York: Harper & Brothers, 1958), p. 266 , note 20 .
113
In Thailand, as discussed before, where almost the entire produc
tion of natural rubber is in the hands of the small holders, there are
about 1.8 million acres of rubber planted area. From the total rubber
planted area, 400,000 acres are immature . Of the remaining 1.4 million
acres, it is es timated that 600,000 acres are prewar stock and 800,000
acres are growing too old.24 In 1958 the IBRD recommended procedures
of replanting similar t o those followed in Malaya and Ceylon. In
addition, the World Bank strongly suggested that the essential element
of the rubber program should be to stimulate planting of new rubber
areas by smallholders. 25
After a long delay, the Thai government has finally decided to
carry out the rubber promotion program. She has enacted the Rubber
Planting Aid Fund, 1960, by imposing a cess tax of 2-5 1/2 cents a pound
depending on the grad e and export price of the smoked shee t s . These
exports will be used to finance the dissemination of the high-yielding
varieties for new planting. 26
The principal objec tive of the project is to collect contributions
from rubber exporters at a certain rate and place them in a central
fund. Subsidies are then given out of this fund to rubber growers who
possess old indigenous rubber trees and are will ing to cooperate with
the program. The subsidies are used to clear away the old trees and
replace them with high yielding clones. By this method, rubber growers
24Petchara Chantara, ~ . • p. 12.
25IBRD, ~., pp . 69-73.
26 Swang Kulthongkum, ~ . • p. 31.
114
will be able to r educe the cost of produc ti on in the fu ture and can
compete with synthetic rubber in the world market .
The Aid Fund Committee is responsible fo r executing the program,
approving the amount of each subsidy, and providing cash and/ or
materia l s (all t ogether no t exceeding $250 per acre) for the rubbe r
growe r who si gns a contract with the or ganization . Pa yment wil l be
made in six installment s within a period of five years after the rubber
growers f ulfill the provision of the fund step by step .
The allocation of this fund is as fo llows: 90 pe rcent for the
subsidies , 5 percent for the cost of administration, and the remaining
5 pe r cent for the cost of r esearch.
Since 1961 , the beginning of the ye ar of the replanting program
until 1964, 77,375 acres have been granted to replant the high yielding
clones. Only 56,678 acres have been r e port ed as planted. I f the r e -
planting scheme is in progress at the present moment, the completed
program should take about 25 years ( see Table 31). According t o recent
in fo rmation from 1961 to February 1967, about 96,000 acres were gran t ed
fo r r e planting with high yielding varie ties. The growers have had
replanted 72,000 acres, the rest will be in progress in the coming
planting season. The t ota l amount of cess tax, $25 million, were
co llected and $21 million have been appropriated . It is estimated that
for the year 1967 22,400 acres have been reported in applying for
r eplanting. The fund, amounting t o $5.5 mil liqn, ·will be used fo r 1967. 27
27The Rubber Replanting Aid Fund Office , Occupation on Thailand's
Soi l: Rubber Replanting with High-Yielding Varieties (Bangkok , 1967), p. 4. (mimeographed)
This material was presented in a televis i on pr ogram at Bangkok, Apr il 15, 1967. It was a conversation between Dr . Swang Kulthongkum,
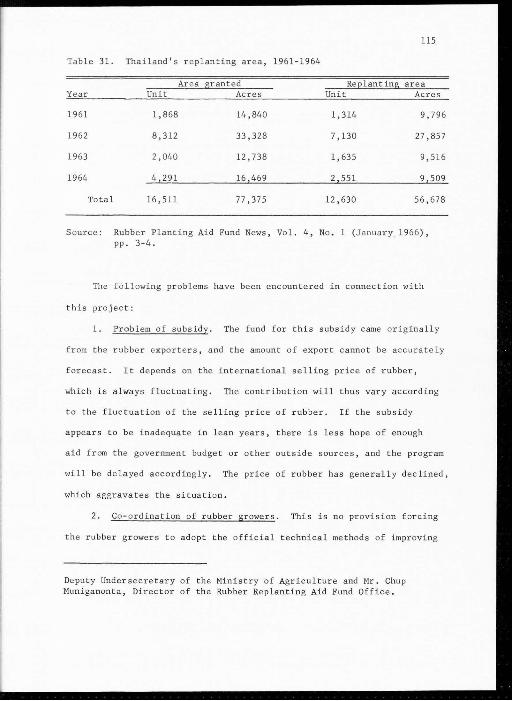
115
Table 31. Thailand's replanting area, 1961-1964
Area grant ed Re2lant ing area Year Unit Acres Unit Acres
1961 1,868 14,840 1,314 9,796
1962 8,312 33,328 7,130 27,857
1963 2,040 12,738 1,635 9,516
1964 ~l 16 469 2 551 9 509
Total 16 ,511 77,375 12,630 56,678
Source : Rubber Planting Aid Fund News, Vol. 4, No. l (January. 1966), pp. 3-4.
The fO llowing problems have been encountered in connection with
this project:
l. Problem of subsidy . The fund for this subsidy came originally
from the rubber exporters, and the amount of export cannot be accurately
forecast . It depends on the international selling price of rubber,
which is always fluctuating. The contribution will thus vary according
to the fluctuation of the selling price of rubber. If the subsidy
appears to be inadequate in l ean years, there is less hope of enough
aid from the government budget or other outside sources , and the program
will be delayed accordingly. The price of rubber has generally declined,
which aggravates the situation.
2. Co- ordination of rubber growers. This is no provision forcing
the rubber growers t o adopt the official technical methods of improving
Deputy Undersecretary of the Ministry of Agriculture and Mr. Chup Muniganonta, Director of the Rubber Replanting Aid Fund Office.
116
their rubber plantations. The method being used is persuasion and not
coercion. It is a r ecognized fact that people tend to resist change . 28
3. Rubber tree cutting. The rubber growers are r eluctant to cut
down their old rubber trees and replace them with trees of high-yielding
varieties. Most rubber growers have smallholdings and would be unable
to survive during the replanting period, 6-7 years. ~n fact, $250 per
acre for replanting is not covered . The government has insisted on
the various methods such as rotating the rubber area for replanting and
growing the other crops during the waiting period, etc.
4. Lack of skill and technical knowledge. In general, most rubber
growers lack skill and technical knowhow. The Department of Agriculture
and the Rubber Planting Aid Fund Office have to work closely together
in i nstituting effective traini ng programs .
Outlook for the Future of Natural Rubber
The long run outlook for natural rubber vis -a-vis synthetic rubber
is in doubt; the short run outlook is not.29
In the United States, a
ceiling on domestic imports of natural rubber seems t o have been estab-
lished by the growth of the American synthetic rubber industry. A change
in domestic consumption patterns, however, does not pose an immediate
threat to the continued expansion and prosperity of the natural rubber
growing industry. Because the annual consumpt i on of the United States
is always around 500,000 tons, it still holds the position of leader of
28Rubber Replanting Aid Fund News, Vol. 3, No. 1, (January, 1965), pp . 5-11.
29Phillip, ~., p. 167 .
117
the natural rubber consuming countries .
Outside of the United States and Sovie t Russia, the use of
synthet i c r ubber, in spite of r ecent gains, has not attained large
volume (see Chapter III). And although the syn thetic rubber production
capaci ty of these countries are increasing, world production has not
reached a significan t l eve l . Many for e ign manufacturers of tires and
other rubber products, e xce pt those a ffil iated wi th American companies,
s till lack chemical e ngineers who know how t o use synthetic rubber. 30
With natur al rubber supplies not expected t o increase s igni f i can tl y
un t il the 1970's, it seems certain that ample markets will be available
for all of the crude rubber that is produced.
For the expansion of natural rubber production due to begin in
the 1970 ' s, markets will have to be found largely outside the United
States and Canada. The world consumption of rubber has been steadily
increasing s ince the end of Wor ld War II. Countries outsid e the United
States raised their consumpt ion of rubber f r om 328 , 500 t ons i n 1945 to
an es tima t ed 3,468,300 t ons in 1966 . Of the latter, nearly 2 million
t ons were natural r ubber and onl y 1.5 million tons were synthetic.
Measured by American standards, foreign per capita consumption is s till
low. Table 32 shows 1964 usage of rubber in leading consuming countries .
Assuming freedom from major inte rnal disturbances and continued growth
in nationa l income in these major developed countries, foreign rubber
consumption will continue t o rise , particularly in the European Common
market and Japan; and in the virtually untapped markets of Afr ica, China,
30Ibid .
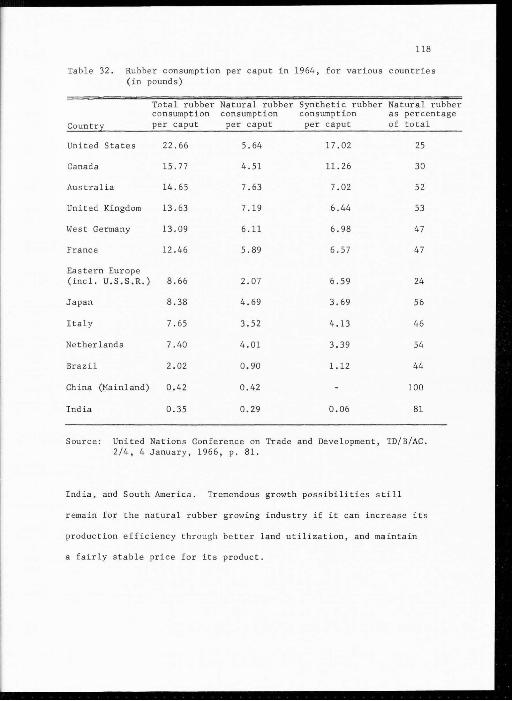
118
Table 32. Rubber consumption per caput in 1964, for various countries (in pounds)
Total rubber Natural rubber Synthetic rubber Natural rubber consumption consumption consumption as percentage
Countrz per caput per caput per caput of total
United States 22.66 5.64 17.02 25
Canada 15.77 4 . 51 11.26 30
Austral ia 14.65 7.63 7.02 52
United Kingdom 13.63 7.19 6.44 53
West Germany 13.09 6.11 6.98 47
France 12 . 46 5.89 6 . 57 47
Eastern Europe (incl. U.S.S.R.) 8.66 2.07 6.59 24
Japan 8 . 38 4.69 3.69 56
Italy 7 . 65 3.52 4.13 46
Ne therlands 7.40 4.01 3 . 39 54
Brazi l 2 . 02 0 . 90 1.12 44
China (Mainland) 0.42 0 . 42 100
India 0.35 0.29 0 . 06 81
Source: United Nations Conference on Trade and Development, TD/B/AC . 2/4, 4 January, 1966, p . 81.
India, and South America. Tremendous growth possibilities s ti l l
remain for the natural rubber growing industry if it can inc r ease its
production ef ficie ncy through be tter land util ization, and maintain
a fair l y stable pr ice for its product.
119
Estimate of Natural Rubber Consumption
Projecting current consumption patterns into the future is always
a speculative venture. Nevertheless, a review of various studies of
future rubber demand may be helpful in assessing the competitive position
of natural and synthetic rubbers.
Below are shown F .A.O. projections for 1970, 31 Mrs. 't Hooft Welvaars'
estimated for UNCTAD, 32 and International Study Group estimate for
UNCTAD. 33
F . A.O. estimate (1964) for 1970
Exclude Centrally Planned Countries
Mrs. 't Hoeft \</elvaars ' estimate (1964)
for 1970, excluding Centrally Planned
Countries
l.R .S. G. estimate (1965) for 1970
Exclude Centrally Planned Countries .
7.15 -8.47 million long tons
5.17-5.83 million long tons
6. 16 million long tons
6.60 million long tons
6 .03 mi ll ion long tons
Estimates for 1970 of the world rubber consumption differ consid-
erably . For convenience in making these estimates , it is useful to
eliminate the centrally planned countries, for which data are a matter
of conjecture.
According to Mrs. 't Hooft Welvaars' es timate, from 1954-1964,
exc lusive of centrally planned countries, there was an average yearly
growth rate of 6.37 percent. From 1959-1964 the average growth rate was
3lF.A. O. (CCP 64/6 I-III),~., p. II, 102-104.
32UNCTAD, TD/B/AC . 2/4 ' .2..E..:.....£l., pp. 36-38 .
33UNCTAD , TD/B/C. 1/20, ~., pp. 1-2.
120
7.3 percent. In fact, the growth of total demand for rubber is
dependent on the absolute l evel of national income of any one country
and on the rate of growth of G. N. P. Thus the faster growth between
1960 and 1964 seemed to result from the persistent boom in the U.S . A.
and the European Common Market countries . It should be remembered that
for the world as a who l e the calculated rate of gr owth of consumption
between 1959- 1964 slowed down as compared to the consumption in the
centrally planned economies .
World consumption, exclusive of centrally planned countries, has
been growing by 6.37 percent fr om 1954-1964, and by 7.3 percent from
1959- 1964. Mrs. Welvaars extrapolated the 1964 consumption figure
at an annual growth rate of 6.25 percent a year. This would bring
overall consumption in the Free World to 6.16 mil lion l ong tons in 1970.
The highest F . A.O. es timate of 5.83 million tons would mean an
average yearly growth rate of 5.5 percent since 1960, and of 4.5 percent
since 1964. The F.A.O. estimate will be assumed t o be a reasonably
conservative estimate of world demand for rubber in 1970 (excluding
centrally planned economies).
In the F.A.C. projection for 1970, eliminating centrally planned
economies, the percentage usage of natural rubber is estimated at 37
percent and 41 percent . Thus, the estimated consumpti on of natural
rubber, excluding the centrally planned countries, will be between 2.18
and 2.39 million tons. The F.A.O . 1970 es timate of natural rubber con
sump tion of centrally planned economies varies between 0 . 31 and 0.69
million tons. Added to the r es t of the world, the F.A. O. es timate for
1970 amounts to a total wor ld consumption of natural r ubber of be tween
2 . 48 to 3.08 million tons.
121
Mrs. 't Hoeft Welvaars' view that the percent usage of na tural
rubbe r is 37 percent and 41 percent seems t oo high. Since 1964 th e
natural rubber percentage usage for this part of the world was alread y
down to 40 percent. It is more likely that in the near fut ure the
natural rubber percentage of the total rubber consumption wo uld lie
between 25 percent and 35 percent. She used 35 percent as t he natural
rubber share in total r ubber consumption . A 35 percent usage of
natural rubbe r in 1970 would then amount to 2 . 16 million long tons of
natural rubber. Adding t he F . A.O . estima t es fo r the cent r ally planned
economies , total consumption of natural rubber might be be tween 2.47
and 2. 85 million long tons.
The International Rubber Stud y Group considered the prospects for
natural and syn the tic rubber consumption up to 1975 . The Working Party
had the benefit of the views of most of the main consuming countries,
and in particular es timates for 1970 and 1975. Table 33 summarizes
the group ' s informed judgment of the probab l e consumption in 1970 and
1975. 34
The Working Party had s tudied the actua l world consumption of
various countries for the period 1960-1965 and fo llowed with the es ti
mates for 1970 and 1975 of consumption and the natural rubbe r percentage .
It will be seen that world consumption , exc luding Eastern Europe and
Mainland China, is expected to be of the order of 6 , 025,000 l ong tons
i n 1970 and 7 ,500,000 long t ons in 1975 , with Eastern Europe and Main
land China importing a total of 575,000 l ong tons of natural rubber in
34Ibid ., p. 1.
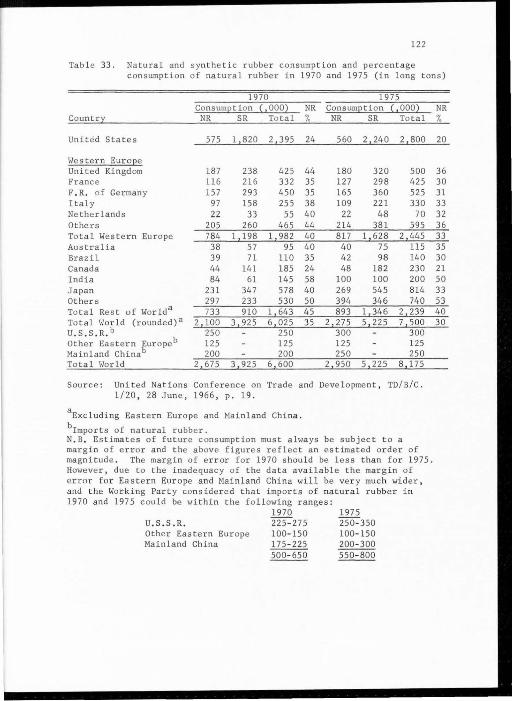
122
Table 33. Natural and synthetic rubber consumption and percentage consumption of natural rubber in 1970 and 1975 (in l ong tons)
1970 ConsumEtion {,000) NR
Country NR SR Total %
United States 575 1,820 2,395 24
Wester n Euro2e United Kingdom 187 238 425 44 France 116 216 332 35 F. R. of Germany 157 293 450 35 Italy 97 158 255 38 Netherlands 22 33 55 40 Others 205 260 465 44 Total Western Europe 784 1 , 198 1, 982 40 Australia 38 57 95 40 Brazil 39 7l 110 35 Canada 44 141 185 24 India 84 61 145 58 Japan 23 1 347 578 40 Others 297 233 530 50 Total Rest of Worlda 733 910 1 643 45 Tota l World (rounded)a 2 ,1 00 3 , 925 6 , 025 35 u.s . s . R. b 250 250 Other Eastern Europeb 125 125 Main l and Chinab 200 200 Tota l lo/orld 2 , 675 3 , 925 6 , 600
Sou r ce : Uni ted Nations Confer ence on Trade and 1/20 , 28 June, 1966, p. 19.
aExcludi ng Eastern Eu r ope and Main l and China .
blmpor ts of natural rubber.
1975 ConsumEtion { z 000)
NR SR Total
560 2 , 240 2, 800
180 320 500 127 298 425 165 360 525 109 221 330
22 48 70 214 381 595 817 1 , 628 2, 445 40 75 115 42 98 140 48 182 230
100 100 200 269 545 814 394 346 740 893 1 346 2 239
2 , 275 5 , 225 7 , 500 300 300 125 125 250 250
2, 950 5 , 225 8 , 175
Developmen t, TD/B/C.
N. B. Estimates of future consumption must always be subject t o a marg in of error and the above figures reflect a n estimated or der of magni t ude . The margin of error for 1970 should be less than fo r 1975. Howeve r , due to the inadequacy of the data available the margin of error fo r Eastern Europe and Ma inland China wi ll be ver y much wider , and the Work i ng Par t y consider ed tha t import s of natura l r ubber in 1970 and 1975 could be wi th in the fol l owing r anges:
U.S . S. R. Other Eastern Europe Ma i nland China
1970 225 - 275 100- 150 175- 225 500- 65 0
1975 250- 350 100- 150 200- 300 550-800
NR %
20
36 30 31 33 32 36 33 35 30 21 50 33 53 40 30
123
1970 and 675,000 long tons in 1975.
The estimates of the percentage of natural rubber to total world
rubber consumption assume, for the purpose of estimating, that there
will be no significant change in the competi tive relation between
natural and general purpose synthetic rubber. The estimat e of natural
rubber percentage of the total rubber consump tion are 35 percent in
1970 and 30 percent in 1975.
The 35 percent usage of natural rubber in the Free World in 1970
would then amount to 2,100,000 long tons of natural rubber in 1970
and 2,275,000 long tons in 1975 . To this should be added the estimate
importation of centrally planned economies natural rubber up t o 575,000
l ong tons in 1970 and 675,000 long tons in 1975 . The total consumption
of natural rubber might then be 2,675,000 long tons in 1970 and 2,950,000
long tons in 1975 (see Table 33).
Estimate of Natural Rubber Production35
Table 34 shows the world production of natural rubber during the
four years, 1962-1965, and the production of most countries.
According toW. G. G. Kellett, the principal estimates reveal that:
The estimate for world production of natural rubbe r for the year 1965 to 1975 inc lu sive shou l d not be interpreted as indicating the amounts woich wi ll actual l y be produced in these years. They are attempts to measure, ignoring al l outside influences including po lit ical circumstances, the amount s which could be produced by all those producers --estates and smallholders --who normally produce natural rubber . They do not take into consideration the effec ts of price on output, particularly smallholders ' ou tput, and exclude production from
35This part is heavy based on the study of Mr. W. G. G. Kellett who
was invited by the Working Part y of I.R.S. G. , Ibid., pp . 2-3 .
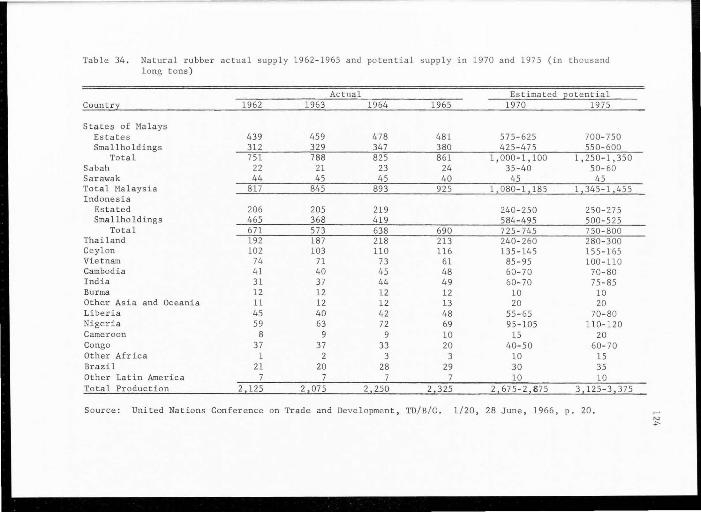
Table 34 . Natural rubber actual supply 1962-1965 and potential supply in 1970 and 1975 (in thousand long tons)
Actual Estimated E:Dtential Country 1962 1963 1964 1965 1970 1975
States of Malays Estates 439 459 478 481 575-625 700-750 Sma11holdings 312 329 347 380 425 - 475 550-600
Total 75 1 788 825 861 1,000- 1,100 1,250-1,350 Sa bah 22 21 23 24 35-40 50-60 Sar awak 44 45 45 40 45 45 Total Ma laysia 817 845 893 925 080-1 185 345-1 455 Indonesia
Es t ated 206 205 219 240- 250 250-275 Smallholdings 465 368 419 584 - 495 500-525
Total 671 573 638 690 725 - 745 750-800 Thailand 192 187 218 213 240- 260 280- 300 Ceylon 102 103 110 116 135-145 155-165 Vie tnam 74 71 73 61 85-95 100 - 110 Cambodia 41 40 45 48 60- 70 70-80 India 31 37 44 49 60- 70 75-85 Burma 12 12 12 12 10 10 Other Asia and Oceania 11 12 12 13 20 20 Li beria 45 40 42 48 55-65 70-80 Nigeria 59 63 72 69 95-105 110- 120 Cameroon 8 9 9 10 15 20 Congo 37 37 33 20 40- 50 60- 70 Other Africa 1 2 3 3 10 15 Brazil 21 20 28 29 30 35 Other Latin America 7 7 7 7 10 10 Total Production 2 125 2 075 2 250 325 2 67 5- 2 875 3 125-3 375
Source: Uni ted Nations Conference on Trade and Development , TD/B/C. 1/20, 28 June, 1966, p. 20 . >-' N ..,..
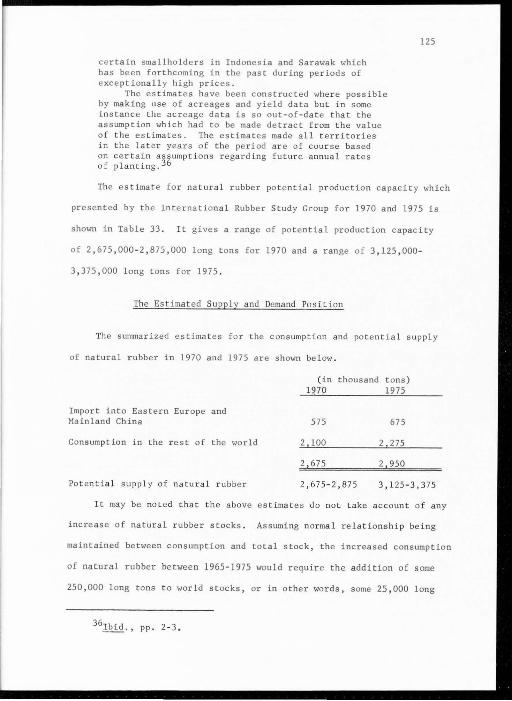
certain smallholders in Indonesia and Sarawak which has been forthcoming in the past during periods of exceptionall y high prices.
The es timates have been constructed where possible by making use of acreages and yield data but in some instance the acreage data is so out-of-da te that the assumption which had to be made detract from the value of the estimates. The estimates made all territories in the later years of the period are of course based on certain assumptions regarding future annual rates of planting.36
125
The estimate for natural rubber potential production capacity which
presented by the International Rubber Study Group for 1970 and 1975 is
shown in Table 33. It gives a range of potential production capacity
of 2,675,000-2,875,000 long tons for 1970 and a range of 3,125,000-
3,375,000 long tons for 1975.
The Estimated Supply and Demand Position
The summarized estimates for the consumption and potential supply
of natural rubber in 1970 and 1975 are shown below.
Import into Eastern Europe and Mainland China
Consumption in the rest of the world
Potential supply of natura l rubber
(in thousand tons) 1970 1975
575 675
2 100 275
675 2 950
2 , 675 - 2,875 3,125 - 3,375
It may be noted that the above es timates do no t take account of any
increase of natural rubber stocks. Assuming normal relationship being
maintained between consumption and total stock, the increased consumption
of natural rubber between 1965-1975 would require the addition of some
250,000 long t ons to world stocks, or in other wo r ds, some 25,000 long
36Ibid., pp. 2-3.
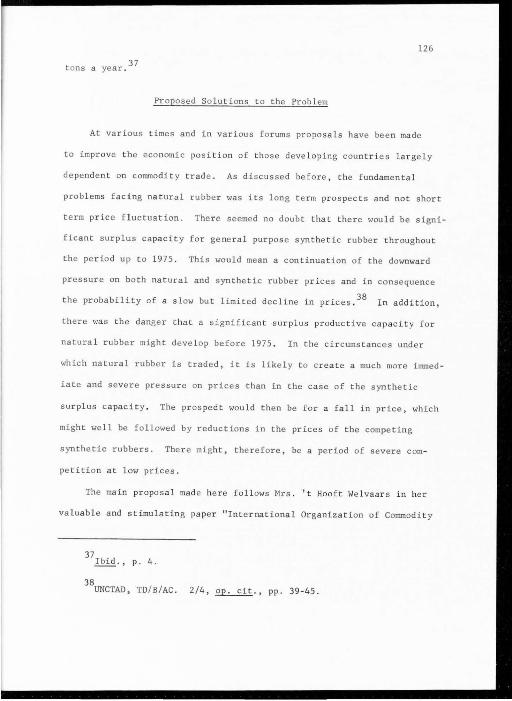
126
tons a year. 37
Proposed So lutions to the Problem
At various times and in various forums proposals have been made
to improve the economic position of those deve loping countries large ly
dependent on commodit y trad e . As discus sed before , the f undamental
problems f acing natural rubber was it s long t e rm prospec t s and not short
term price f luctuation. The r e seemed no doub t that ther e wou ld be signi
ficant surplu s capacit y fo r general purpose synthetic rubber throughout
the period up t o 1975. This would mean a continuation of the downward
pressure on both natural and synthetic rubber prices and in consequence
the probability of a slow bu t limited decline in prices. 38 In addition,
there was the danger that a significan t surplus productive capacity fo r
natura l rubber mi ght develop before 1975. In the circumstances under
which natural rubber is traded, i t is likely to create a much more immed -
iate and seve re pressure on prices than in the case of the syn the tic
sur plus capacity. The pros pedt would then be for a fall in price, which
might well be followed by reductions in t he prices of the competing
synthetic rubbers. There might, therefore, be a period of sever e com-
petition at low prices .
The main proposa l mad e here fo l lows Mrs. 't Hooft Welvaars in her
valuable and stimulating paper " International Organization of Commodity
37 Ibid., p. 4.
JBUNCTAD, TD/ B/ AC . 2/4, ~. , pp. 39-45.
127
Trade with r espec t to Natural Rubber."39 She recommends:
1. I~proving the eff icienc y of the natural rubber industry by:
a. Increasing the amount of agronomic and fundamental r esearch
which at present goes into improving the quality and
yi e lds of the rubber trees. Researchers in the field
constantly complain of lack of funds.
b. Disseminating the result of this research among estates
and smallholders, and putting new techniques into effect .
This might entail a good network of government-appointed
agronomic consultants in rubber gorwing areas. Pilot
projects might be needed to overcome the normal peasant
conser vatism. Financial incentives might also be needed.
c. Drawing up a co-ordinated replanting program in each country
and putting it into effec t. One of the most important
ways of continuousl y reducing production costs is steady
replanting .
2. Improving the technical qualities of natural rubber in order to
increase the demand for natural rubber. Most consumers of natural rubber
stress th e importance of:
a . Simplification of the grading system .
b. Better control of clean l iness and uni formi ty.
c . Improved methods of packing and presentation.
3. Stimulating the demand for natural rubber by:
39~ .• pp. 49-76 .
128
a. Removing obs tacl es to trade in technically improved natural
rubber. An important element would be the elimina tion or
reduction of the wall of import duties in both developed
and developing countries for rubber products.
b . Providing natural rubber consumer services in importing
countries. Thes e services could take advantage of techni
cal progress in manufacturing industries which might lead
to new techniques and new applications.
c . Supplying information which is in the interest of both
natural rubber and synthetic rubber producing coun t ries .
With sufficient information one might estimate the future
cost price of natural rubber. This might act as a check
on undue expansion synthetic rubber production.
d. Promoting cooperation between natural rubber and syn thetic
rubber producers in trying to increase overall demand,
through research into finding new uses of rubber.
4. Diversification. If through replanting and new planting rubber
trees ther e was a clear danger of excessive natural rubber production
capacity developing then diversifying into othe r crops would require
consideration. Diversification in its broadest sense can also include
the development of the industrial sector in a country primarily depen
dent on its a griculture .
5 . During the interim adjustment period, natural rubber pr oducing
count ries might need:
a. Compensatory fi nance to provide some temporary assistance
to natural rubber producers if the price of natural rubber
129
would fall significantly.
b. Long-term contract s of a bilateral or multilateral charac
t er . These cou l d ass ure a more stab l e return for some
part of the supply, at l eas t ove r the period of the contract.
CHAPTER VII
SUMMARY AND CONCLUSION
An entire ly new factor ent ered rubbe r t rade afte r World War II in
the shpe of compe titi on from syn thetic rubber. The appearance and
success of synthetic produc ts have drastically changed the supply and
demand condit i ons of the whol e rubber marke t. On the supply side, more
f lexibility has been i nt roduced by synthetic rubber's quicker response to
demand change; no rubber tree can be tapped earlie r than seven yea rs
after it ha s been planted . On the demand side, natural rubber has l os t
its monopo l y position in many uses and growing substitutabili t y has
increased th e price elastici t y of demand. This substitutability will
increase sharp l y with the deve l opment of stereo r egular rubber, which
can replace the natural product in many uses in which the ear lier
synthe tic could not.
Natural rubber prices have been subjec t t o considerable f luc tua
tions. This appears to be due to the fact that it is no t usually
possi bl e for manufacturers to shift frequently between one kind of
rubb er or mixture of rubbers t o another . They tend to subs titut e on
price grounds on l y when price di fferences are expected to last for some
time. Howeve r, in the sixties , price certainly became a more prominent
fac t or in the demand for natural rubbe r than it had ever been before.
The United States has been t raditionally the larges t cons ume r of
natural rubber; in recent years it has become a leading produce r of
synthetic rubbe r and thus threatens t o become l ost as a market for the
131
products of the rubber plantations of Asia. Such a tremendous disloca
tion of the natural rubber market poses especially difficult problems
for Thailand and other rubber producing countr i es which are in large
measure dependent upon rubber exports for their domestic economic
prosperity.
A stud y of the natural rubber industry shows that th e si tuation
it faces is not so much one of immediate surv ival as it is a question
of its future position in the world market. In fact, natural rubber
is a growing industry. The decline of the natural rubber industry has
not been an absolute one, but relative. Natural rubber is facing a
declining share of the market rather than decreasing output. For
example, according t o figures issues by the International Rubber Study
Group, world production of natural rubber was 1,918,000 l ong t ons in
1955, 1,990,000 long tons in 1960, and 2,408,000 long tons in 1966.
But its share in world rubber production was r educed from 63.9 percent
to 51.4 and 42 . 0 percent, respectively .
Since the demand for natural rubber is almost completely dependent
on the manufacture of tires and tubes for motor vehicles, and on the
absorption of rubber in other manufactured goods , the fluc tuations of
the natural rubbe r trade has been very closely associated with changes
in industrial act i vities, particularly the automotive industries . Thus,
the primary economic problem has been the transmission of trade cycles
from the United States and the other developed countries t o rubber
producing countries. Under thi s condition, changes in the United States'
and European industrial coun t ries' demand for natural rubber has exer
cised a vital role in determining the price movement, instead of the
opposite being true. This means that in the fu ture a change in the
132
price of natural rubbe r will have littl e impact on the amount of rubber
used in automobile product ion because rubber is only a small fract i on
of the price of an automobile. Shou ld natural prices at any time have
a significant influence on the price of an automobile, synthetic rubber
might be substituted for it . IRSG has reported that a rise of some 3.5
cents (3 pence) a pound fo r natural rubber wou ld pr ovid e an incentive
fo r a 5-1 0 percent substitution of natural rubber by synthe t ic rubber
in automobile tires. 1
The vulnerable position of the natural rub ber industry could have
been less severe than it has been if the inheren t inflexibility in the
structure of natural rubber supply were absent f r om the industry. Be -
cause of relatively stable rubber prices, es tat e producer can mor e ade-
quately plan capi t a l inves tment and develo p more comprehensive l ong
range labor policies, which will ensure a more efficien t u t ilization of
the labor force. On the other hand the sma l lholders, t o whom no alter-
native means of livelihood are available, not on l y continue to tap, but
also accelera te tapping in their efforts to maintain a subsistence
level of income .
In the c ompe titive market, syn thetic rub ber has enjoyed several
advantages over na tural rub ber. These are: availability, unique proper -
ties , technical improvement, and lower and mo re stable prices . But in
the f i e ld of gene r a l properties , natural rubber still hold s t he pre fe r ence .
In t he eyes of indus tria l consume r s, the pr ice stability and quality of
rubber ar e important fac t ors t o be conside r ed in the ir choice. Up t o
1UNCTAD, TD/B/C. 1 /20, ~. ,Appendix I, pp. 3-4 .
133
the present time, these advantages have been offer ed only by synthetic
rubbe r. Efforts t o improve the qualities and lower the cost of product ion
of natural rubber, which have already begun, will be stepped up.
According to es timates made by the IRSG, all natural rubber pro -
duced dur i ng the years t o 1970 will be so ld . Synthetic rubber will be
used to mee t excess demand fo r new rubber during their period (see pp.
119-126) . Obviously, for the past several years , excess demand has been
increasing at a fas t e r rate than natural rubber production. Howev e r,
the outlook f or natural rubbe r s till l ooks good . Proj ec tions s how
that in 1975 some surplus of natural rubber production will occur. But
the natural rubber industry ' s future depends t o a large degree on lowered
costs of production with replanting and new planting with high-yielding
trees, and improving it s quality and marke ting.
The f uture of the natural rubber industry is no t entirely bleak.
Natural rubber has a definite f uture . Mr. J ohn McGavack wrote:
It is well es tablished at the present time in the e lastome r field that about 30 percent of the production requires natural rubber r egardless of cost, and about 30 percent requires the synthe tic type . The balance, or 40 percent of the production, can use e ither de pending upon its cost . This percentage holds even if the newer synthetic t ypes which are quite similar t o natural rubber are taken into consideration . 2
P. C. Rat chaga came to a similar conc lusi on:
Natural rubber will always find a market, as wor ld demand for new rubber is increasing because of fur ther deve l opment of present us es for rubber, discoveries of new uses for rubber and the opening up of new markets f or rubber . 3
~cGavack, ~., p. 789.
3 Ratchaga, ~., p. 46.
134
Thailand' s rubber industry depends on the world rubber market situa
tion. Since World War II, the production of natural rubber has increased
s t eadil y from 52,000 l ong tons in 1947 t o the peak of 218,000 long t ons
in 1964. At pr esent the government of Thailand is busy promoting the
r e planting scheme which has been activated since 1961. Various polic i es
in improving the qualities of rubber and capacity of the tree are be ing
introduced. The gove rnment plans t o r eplant wi t h high- yie lding varie
ties up t o 400,000 acres within the next seven years before the price of
wor ld natural rubber dec lines . At that time Thailand would produce the
same as the present l evel of production, 200,000- 250,000 long t ons, so
that s he can maintain her economy at l east at t oda y ' s standard of employ
ment and income .4
In fac t, natural rubber must continue to be an important s ource
of foreign exchange . Despite the expansion of industry and othe r cro ps,
natural rubber is still one of the best hopes of fu rthe r economic deve l op-
men t, s ince it is a ver y important source of government r evenue and
pers onal inc ome. For the next several decades rubber will be a vital
e l ement in Thailand's economic development.
The fu ture of the natural rubber indu s try of Thailand, then, depend s
first, on how fast production could be stepped up; secondly how fast the
cost of production coul d be r educed by rep l anting with high-yi e lding
clones ; and thi r d l y on t he world price of na t ura l r ubber .
In conclusion, it can be said that the i nc reasing re lative share of
man- mad e rubber in the world ' s t o tal consumption of rubber ha s been
primarily due t o the slow increase in the supply of na t ural r ubber
4 Petc hara Chantara, ~., p. 12 .

135
compared to the technological development in the other sector of the
rubber industry. The natural rubber industry, therefore, shou ld in
crease the supply in such a way as to keep pace with the developments in
the synthetic rubber industry. The replanting scheme now being under
taken in the natural rubber producing countries will be of advantage not
only at present but also in the future.
BIBLIOGRAPHY
General Materials
Official Publications
Food and Agriculture Organization , Commodity Rev iew--Spec ial Suppl ement: Trade in Agriculture Commod ities in the United Nations Deve lopment Decade , Vol . 1 (CCP 64/6), 1964.
International Bank for Reconstruction and Dev e lopment, The Economic Deve lopment of Malaya (Baltimore, Mary land: The Johns Hopkin s Press, 1955).
The Economic Development of Ceylon ( Baltimore , Maryland : The Johns Hopkin s Press, 1956) .
International Mone tar y Fund, International Financial Stati stics , Washington, D.C .
Uni t ed Nations, Economic Commission for Asia and the Far East, Economic Bulletin for Asia and the Fa r East, Bangkok.
Economic Survey of Asia a nd the Far East, Bangkok.
United Nation Conferenc e on Trade and Deve l opment, The International Organization of Commodity Trade Ca se Study of Natural Rubber, TD/B/ AC. 2/ 4, 1966 .
----~~------~ · Re port of the International Rubber Study Group Working Party on the Pros pec t of Natural Rubber, TD/B/C . 1/20, 1966.
U.S . Depar t ment of Commerce, Rubber Industry of the United States, 1893-1939, pre pared by P. W. Barker for Trade Promotion Series , No. 197 (Washing t on, D.C . , 1939).
World Trade Information Service: Economic Devel opment in the Far East and Oceania, 1959, Part II, No. 60- 67 (Wa shington, D.C., 1960) .
Books
Adam, P. E., Memorandum on the Fluctuations in the Price o f Na tural Rubber (Kuala Lumper, Ma la sai : Government Printer , 1958) .
Akers , C. E., The Rubber Industry in Brazil and the Orien t (London: Methuen & Co ., 1914).
137
Ball, J. M., Reclaimed Rubber (New York: Rubber Reclaimers Association, Inc ., 1947).
Manual of Reclaimed Rubber (New York: Rubber Reclaimers Association Inc., 1956).
Bateman, L. The Chemistry and Physics of Rubber -Like Substance (London: Maclaren & Son Ltd., 1963).
Bauer, P. T., The Rubber Industry: A Study in Competition and Monopoly (London: The London School of Economic and Political Science, 1948).
Bidwell, Percy W., Raw Material: A Study of American Policy (New York: Harper & Brothers, 1958).
Browne, Edith. Rubber (London: Adam and Charles Black, 1912).
Buehr, Walter, Rubber: Na tural and Synthetic (New York: William Morrow and Company, 1964).
Clair, Colin. (London:
The Thing We Need and Where They Come from Rubber The Gawthorn Press Ltd., 1963).
Dawson , T . R. (ed.). History of the Rubber Industry (London: Institution of th e Rubber Industry, 1952).
Donnithorne, Audrey G. British Rubber Manufacturing, (London: Edward Arnold Publishers Ltd., 1958).
Firestone, Harvey S . (Jr.). The Romance and Drama of the Rubber Industry (Akron, Ohio: The Firestone Tire and Rubber Company, 1936).
Gamba, Charles. Synthetic Rubber and Malaya (Singapore: Donald Moore, 1956) .
Hathaway, Dale E. Problems of Progress in the Agricultural Ec onomy (Chicago, Illinois: Scott, Foresman and Company, 1964).
Howard, Frank A. Buna Rubber: The Birth of an Industry (New York: 0. Van Nostrand Company, Inc . , 1947).
Huke, D. W. Introduction to Natural and Synthetic Rubber (London: Hutchinson & Co. Publishers Ltd. , 1961) .
Knorr, K. E. World Rubber and Its Regulation (California: Stanford University Press, 1945) .
Kindleberger, Charles P. Foreign Trade and the National Economy (New Haven, Connecticut: Yale University Pres ~, 1964).
Le Bras, Jean. Introduction to Rubber (London: Maclaren and Sons Ltd., 1965).

138
McFadyean, Andrew. The History of Rubber Regulation 1934-1943 (London: George Allen & Unwin, Ltd., 1944).
Mc Pherson, A. T. and Alexander Kiemin .. Engineering Uses of Rubber (New Yor k: Reinhold Pub li shing Corporation, 1956) .
Mill, L. A. Malaya: A Political and Economic Appraisal (Minneapo lis, Minnesota: University of Minnesota Press , 1958).
Morton, Maurice. Introduction t o Rubber Technology (New York: Re inhold Publishing Corp oration, 1959) .
Moyle, Alton . Bibliography and Collected Abstracts on Rubber Producing Plants (College Sta tion , Texa s: Texas Expe rimental Station, 1942).
Myin t, Hla. The Economic of the Deve l oping Country (New York : Frederic A. Praeger, Inc . , Publisher s , 1966).
Naunton, W. J. S. The Apply Science of Rubber (London: Edward Arnold Publi sher s , Ltd., 1961).
What Every Engineer Should Know About Rubber (London : The British Rubber Deve lopment Board, 1954).
Nourr y , A. Reclaimed Rubber: Its Deve lopment, Applications and Future (London: Maclaren & Sons Ltd., 1962).
Payne, P. L. Eng land:
Rubber and Rai l ways in the Nineteenth Century (Liverpool, Liverpool University Press, 1961).
Phillips , Charles F. (Jr.). Competition in the Synthe tic Rubber Industry (Chape l Hill, North Carolina: The University of North Caro l ina Press, 1963) .
Polhamus, Loren G. Rubber: Botany, Production , and Utilization (London : Leaonar Hill (Books) Limited, 1962) .
Sears, W. J . and Miller, Charles C. (eds . ) Natural Rubber Buying (New York : Rubber Manufacturers Association, Inc., 1953).
Silicock, T . H. and Fish, E. K. (eds.) The Political Economy of Inde pendent Malaya: A Case Study of Deve l opment (Berke ley and Los Ange l es , California: University of California Press, 1963).
Styko lt, Stefan . Economic Analysis and Combines Policy (Tor onto, Canada: University of Tronto Press , 1965).
Terry, Hubert L. I ndia Rubber and Its Manufacture (London: Archibald C. Cons table & Co., Ltd ., 1944) .
Treloar, L. R. G. The Physic of Rubber Elasticity (London: Oxford Univers it y Press, 1949) .
139
You, Man He. A Study of the Natural Rubber Industry with Special Emphasis on Its Fu tur e Prospects , Unpublished Ph.D. Dissertation (Eugene, Or egon: Unive r sity of Oregon , 1963).
War r e n, Harr y V. , and E. F. Wilks. of Change (Vancouver, Canada:
Wo rld Resource Production 50 Years Tantalus Re search Limited, 1966).
Wolf, Howa rd . The Story of Scrap Rubber (Akron, Ohio: A Schulman, 1943).
Woodruff, William. The Rise of t he British Rubber Industry During the Nine t eenth Century (Liverpool, England: Liverpoo l University Press, 1958).
Woytinsky, W. S. and S . E. Woytinsky . World Population and Production (New York: Twnetieth Century Fund, 1953).
Periodicals
Abraham, P . D. and R. S. Tayler. "S timulation of Latex Flow in Hevea Brasiliensis, " Experime ntal Agriculture, III(l967), pp. l - 12 .
Arnold, Richard A. "The World Outlook for Stereo Homopolymer Rubber ," Rubbe r Age, 98(1966), pp. 65 - 70 .
Bloor, W. F . "Pos twar Rubber Ind ustry Capacities and Implications ," The Journal of Marketing , X(l945-l946), pp. 279-281.
Caldwell, S. M. "Scientific Contributions to t he Rubbe r Indu s try ," Rubbe r World, 145(1957), pp. 255- 260.
Chan Kwong Wah, Francis . "A Preliminary Study of the Supply Respons e of Malayan Rubber Estates Be t ween 1948-1950," The Malayan Economic Review, VII(l962), pp. 77 -94.
Chi s holm, John K. "Can Rubber Restriction Succeed?" Harvard Business Review, XIII(l934-1935) pp. 475-482.
Far Eastern Economic Review, Singa pore .
Hotchkiss, H. Stuart. "The. Evolution of the World Rubber Situation," Harvard Business Review, 11(1924), pp. 129-138.
Howard, Frank A. "Synth e tic Rubbe r," Harvard Business Review, XX (1941-1942) pp. l-9.
Knorr, Klaus E. "World Rubbe r Problem, " Harvard Busines s Review, XXIV, pp. 394-404 .
Lim Chong Yah. ' 'Malayan Rubber Replanting Taxes," The Malayan Ec onomic Rev i ew , VI(l961), pp. 43-52.

140
McHale, T. R. "The Competition Between Synthetic and Natural Rubber," The Malayan Economic Review, VI(l961), pp. 23-31.
"Changing Technology and Shifts in the Supply and Demand for Rubber, An Analytical History, 11 The Malayan Economic Review, IX(l964), pp. 24-48.
McGavack, John. "The Future of Natural Rubber, " Rubber Age, 84(1959), pp. 789-794.
Olmsted , Fred. "Rubber in the 1967 Automobile, " Rubber Age, 98(1966), pp. 65-70.
Orton , t.Jilliam. "Rubber: A Case Study," The American Economic Review, XVII(l927), pp. 617-635.
Penny, D. H. and M. Zulkifli. "Estates and Smallholding: Economic · Comparison," Journal of Farm Economic s , 45(1963), pp. 1017-1021.
Phillips, Charles F. (Jr . ) "Market Performance in the Synthetic Rubber Industry," Journal of Industrial Economics, IX(l960-19 61) , pp . 132- 150 .
"The Competitive Potential of Synthetic Rubber, " Land Economics, 36(1960), pp . 322-332 .
"Workable Competition in t he Synthetic Rubber Industry," Southern Economic J ournal , 28 ( 1961- 1962), pp. 154-162 .
Rubber Age, Rubber Trade Association, New Yor k .
Rubber Development, The Natural Rubber Producers ' Research Association, London.
Rubber Statistical Bulletin, International Rubber Stud y Group, London.
Rubber World, New York .
Ratchaga, P. C. "The Future of Malay ' s Natural Rubber ," Malayan Economic ~. 1(1956) , pp. 42-47.
Semegen, Ste phen T. "Natural Rubber: Progress and Prognostication a t the Mid-Decade , " Rubber World, 154(1 966 ), pp . 75-77.
Solo, Robert. "The Sa l e of the Syn t hetic Rubbe r Plants," Journal of Indu strial Economics II(l953-1954), pp. 32-43 .
"The New Threat of Synthetic to Natural Rubber," Southern Economic Journal, XXII(1955-1956), pp. 55 - 64.
"Research and Development in the Synthetic Rubber ," The Quarterly Journal of Economics, 68(1954), pp . 61-82.
141
Stern, Robert M. "The Export Tax on Malayan Rubber Problems and Policy ," National Tax Journal, XVI(l963), pp . 81- 88.
· ~alayan Rubber Production, Inventory Holdings and the Elasticity of Export Supply," Southern Economic Journal, 31 (1964-1965), pp. 314-323 .
Wendt, Paul. "The Control of Rubber in World War II," Southern Economic ~. XIII(l946-1947), pp. 203- 227.
Whittlesey, Charles R. "The Stevenson Plan: Some Conclusion and Observation," The J ournal of Political Economy, 39(1931), pp . 506-525.
1./ood, Ralph C. "The Control of Rubber: A Case Stud y, " The J ournal of Marketing, VII(l942-1943), pp. 99-106 .
1./oodruff, William. "Growth of the Rubber Industry of Great Britain and the United States," The Journal of Economic History, XV(l955), pp. 3~6-391.
Commodity Yearbook, Commodity Research Bureau, Inc., New York.
Encyclopaed i a Britannica, 1965, pp. 602 - 610D .
Encyclopaedia Americana, 1963, pp. 739-746.
Materials on Thailand
Official Publications
Bank of Thailand, Monthly Economic Report, Bangkok.
Annual Economic Report, Bangkok .
Rubber Situation in Thailand, 1957 and 1961, Bangkok, 1962. (Mimeographed)
Department of Agriculture, Para Rubber, Bangkok, 1965. (Mimeographed)
Para Rubber Improvement Project, Bangkok, 1965, (mimeo -graphed)
Future of Natural Rubber Situation and Rubber Plantation Development, prepared by Ratana Petchara Chantara, Bangkok, 1966. (Mimeographed)
142
Food and Agricultural Organization, Report of the F.A.O . Mission for Siam, Rome, 1948.
International Bank for Reconstruction and Development, A Public Development Program for Thailand (Baltimore, Maryland: The Johns Hopkins Press, 1959).
Ministry of Agriculture, A Statistical Review of Thai Agriculture , 1954, Bangkok, 1956.
Off ice of the National Economic Development Board , Economic Condition of Thailand (Annually), Bangkok .
Government of Thailand: The National Economic Development Plan, 1961-1966 (Second Phase: 1964-1966), Bangkok, 1964.
Southern Region Development Program, 1964-1966, Bangkok, 1964,
National Income, Bangkok , 1963.
Capital Formation in Thai land During 1957-1962, Bangkok . 1962.
Office of the Prime Minister, Thailand Official Yearbook, 1964 (Bangkok: Government House Printing Office, 1965).
Rubber Replanting Aid Fund Office , Occupation on Thailand's Soil: Rubber Replanting with High-Yielding Varie ti es , Bangkok, 1967 , (Mimeographed)
Rubber Replanting Aid Fund News, Bangkok.
Thamasat University, Public Administration Faculty, Manual of the Government Organization of Thailand (Bangkok: Mongkul Karnpim, 1961) .
Devsi tha, Somporn, Economic and Trade in Pers pective (Bangkok: Progress Printing Office , 1962) .
Disayavamich, Boonchu. The Development of Rubber Plantation i n Thailand, Unpublished M.A. Thesis (Bangkok: Thamasa t University, 1964).
Ingram, Jame C. California:
Economic Change in Thailand Since 1850 (Stanford, Stanford University Press, 1955).
Landon, K. P. Siam in Transition (Chicago , Illinois : University of Chicago Press, 1939).
Pendleton, Robert L. Thailand: As pec ts of Landscape and Life (New York: Duel l, Sloan arid Pearce, 1963).
143
Reeve, W. D. Public Administration in Siam (London: Royal In s titute of Int ernational Affairs, 1951).
Riggs, F. W. Ecology of Public Administration (London: Asai Publishing House , 1961).
Thompson , Virginia . Thailand: The New Siam (New York: The MacMillan Company , 1941) .
Unakul, Snoh , International Trade and Economic Deve l opmen t of Thailand, Unpubli s hed Ph.D. Di sser tat ion (New York: Columbia University, 1961).
Pe riodicals
Bangkok Bank, Bangkok Mon thly Review, Bangkok.
Hanna, Williard . "Peninsula Thailand: Rubber of Hasdyai and the Tin of Phuke t," American Universi t y Field Staff, Southeast Asia Series, 13, October , 1965 , pp. 1-11 .
Maleewan, Pan. 11Future of Rubbe r Plantation 0\vner in Thailand," ~' 32(1959), pp. 281-283.
Siamrat Weekly Review, 12, April 15, 1965, p. 30. (Rubbe r Industry in Thailand)

APPENDIX
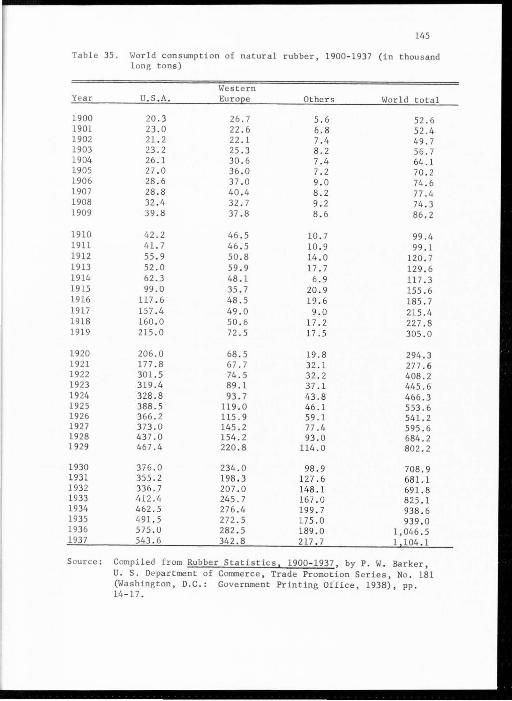
145
Tabl e 35. World consumption of natural rubber, 1900- 1937 (in thousand l ong tons)
Western Year U. S. A. Europe Others World total
1900 20.3 26.7 5.6 52.6 1901 23.0 22.6 6.8 52.4 1902 21.2 22.1 7.4 49.7 1903 23.2 25.3 8 .2 56.7 1904 26 .1 30.6 7 . 4 64.1 1905 27 .0 36.0 7.2 70 . 2 1906 28 . 6 37.0 9 . 0 74.6 1907 28.8 40.4 8 . 2 77.4 1908 32 . 4 32.7 9.2 74 . 3 1909 39.8 37.8 8 . 6 86 . 2
1910 42.2 46.5 10 . 7 99.4 1911 41.7 46 . 5 10.9 99 . 1 1912 55 . 9 50.8 14.0 120.7 1913 52.0 59.9 17.7 129.6 1914 62.3 48.1 6 . 9 117.3 1915 99 . 0 35.7 20 . 9 155. 6 1916 117 . 6 48 . 5 19.6 185.7 19 17 157.4 49.0 9 . 0 215 . 4 1918 160.0 50.6 17.2 227.8 1919 215.0 72.5 17.5 305.0
1920 206.0 68 . 5 19.8 294.3 1921 177.8 67 . 7 32 . 1 277.6 1922 301.5 74 0 5 32.2 408.2 1923 319.4 89.1 37 .1 445.6 1924 328 . 8 93.7 43.8 466.3 1925 388 . 5 119.0 46 . 1 553.6 1926 366 . 2 115.9 59.1 541.2 1927 373 . 0 145.2 77 .4 595.6 1928 437.0 154.2 93.0 684 . 2 1929 467.4 220.8 114.0 802.2
1930 376.0 234.0 98 . 9 708.9 1931 355.2 198 . 3 127.6 681.1 1932 336.7 207 . 0 148.1 691.8 1933 412.4 245 . 7 167.0 825 . 1 1934 462.5 276 .4 199 . 7 938.6 1935 491.5 272.5 175.0 939.0 1936 575 . 0 282.5 189.0 1,046.5 1937 543.6 342 . 8 217 . 7 l 104 . 1
Source: Compiled from Rubber Statistics , 1900- 1937, by P. W. Barker, u. s. Department of Commerce, Trade Promotion Series, No. 181 (Washington, D.C.: Government Printing Office, 1938), pp. 14-17.
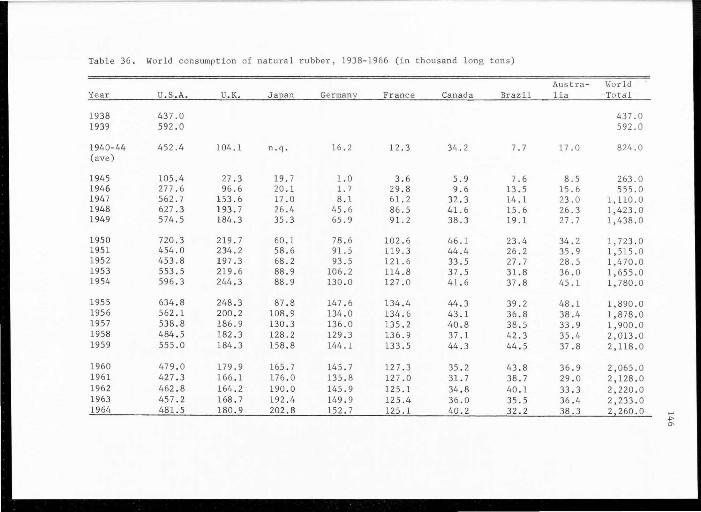
Table 36. Wor ld consumption of natural rubber, 1938- 1966 (in th ousand long tons)
Austra - World Year U. S. A. U. K. JaEan Germany France Canada Brazil lia ·Total
1938 437.0 437 . 0 1939 592 oO 592.0
1940- 44 452.4 104ol n.q . 16o 2 12.3 34 . 2 707 17.0 824.0 (ave)
1945 105.4 27.3 19.7 1.0 3 o6 5 . 9 7 . 6 8.5 263 . 0 1946 277.6 96o6 20 ol 1. 7 29 o8 9.6 13.5 15.6 555.0 1947 562o7 153 . 6 17 . 0 8.1 61.2 32.3 14.1 23.0 1,110.0 1948 627 03 193.7 26 .4 45.6 86.5 41.6 15 o6 26 o3 1,423o0 1949 574 . 5 184 . 3 35.3 65.9 91.2 38.3 19.1 27o 7 1,438 . 0
1950 720 o3 219o7 60 . 1 78 . 6 102.6 46.1 23.4 34 0 2 1,7 23o0 1951 454.0 234.2 58 o6 91.5 119 . 3 44.4 26 . 2 35.9 1,515. 0 1952 453.8 197 o3 68 o2 93 . 5 121.6 33 . 5 27.7 28.5 1,470. 0 1953 553 . 5 219 . 6 88.9 106o 2 114 . 8 37 o5 31.8 36 . 0 1,655.0 1954 596 . 3 244 . 3 88.9 130 . 0 127 .0 41.6 37 . 8 45 .1 1, 780.0
1955 634 . 8 248 . 3 87 . 8 147.6 134 . 4 44.3 39o2 48.1 1 , 890.0 1956 562. 1 200 . 2 108 . 9 134 . 0 134 . 6 43 . 1 36.8 38o4 1 , 878.0 1957 538 . 8 186 . 9 130 . 3 136 . 0 135 0 2 40.8 38 . 5 33 o9 1,900.0 1958 484 . 5 182 . 3 128 .2 129 . 3 136 0 9 37 . 1 42o3 35 .4 2,013. 0 1959 555.0 184 . 3 158.8 144 .l 133.5 44o3 44 . 5 37 .8 2,118. 0
1960 479 . 0 179 . 9 165 . 7 145 . 7 127.3 35 . 2 43.8 36 . 9 2,065.0 1961 427 . 3 166.1 176 . 0 135 . 8 127 . 0 31.7 38 o7 29 o0 2,128.0 1962 462 . 8 164 o2 190 . 0 145 . 9 125 . 1 34 . 8 40 . 1 33.3 2,22000 1963 457.2 168.7 192.4 149 . 9 125o4 36.0 35.5 36 o4 2,233 .0 1964 481. 5 180 .9 202.8 152 . 7 125 . 1 40 . 2 32 . 2 38o3 2 260 . 0 ,._.
~
"'
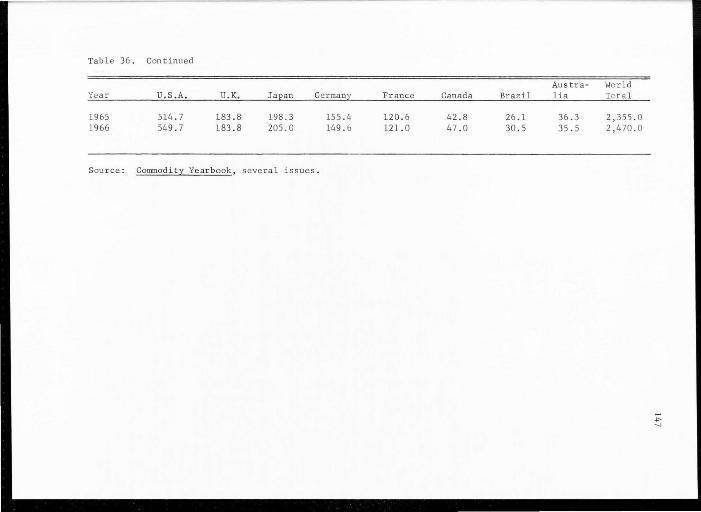
Tab l e 36 . Continued
Austra - World Year u.s .A. U. K. Ja Ean Germany: France Canada Brazil lia Total
1965 514 . 7 183 . 8 198.3 155.4 120 . 6 42 . 8 26.1 36.3 2,355 . 0 1966 549 . 7 183 . 8 205 . 0 149.6 121.0 47 . 0 30.5 35.5 2,470.0
Sou r ce : Commod i ty Year book , several issues .
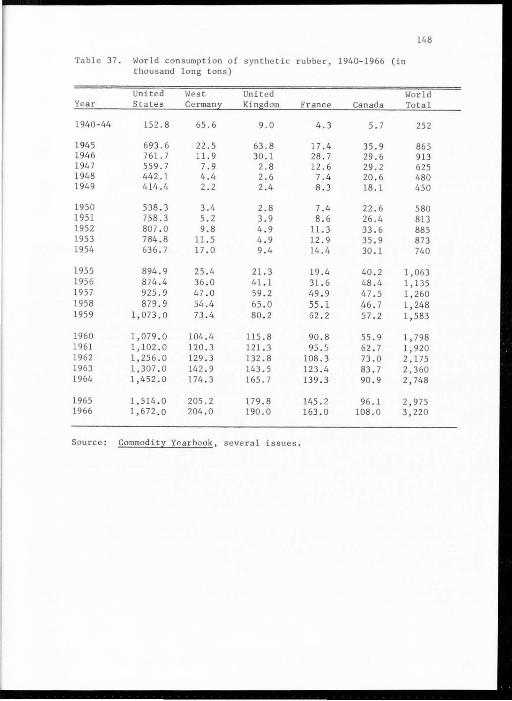
148
Table 37. World consumption of synthetic rubber, 1940-1966 (in thousand long tons)
United !<est United World Year States Germany Kingdom France Canada Total
1940-44 152.8 65.6 9.0 4.3 5.7 252
1945 693 . 6 22.5 63.8 17 .4 35.9 865 1946 761.7 11.9 30.1 28.7 29.6 913 1947 559.7 7.9 2.8 12.6 29.2 625 1948 442.1 4.4 2.6 7.4 20.6 480 1949 414.4 2.2 2.4 8.3 18.1 450
1950 538 . 3 3.4 2.8 7.4 22.6 580 1951 758.3 5.2 3.9 8.6 26.4 813 1952 807 . 0 9 . 8 4 . 9 11.3 33.6 885 1953 784.8 11.5 4 . 9 12 . 9 35.9 873 1954 636 . 7 17 . 0 9. 4 14.4 30.1 740
1955 894.9 25 . 4 21.3 19.4 40 . 2 1,063 1956 874.4 36 . 0 41.1 31.6 48 . 4 l, 135 1957 925.9 47.0 59.2 49.9 47 . 5 1,260 1958 879 . 9 54.4 65.0 55.1 46.7 1,248 1959 1,073.0 73.4 80 . 2 62.2 57 . 2 1,583
1960 1,079 . 0 104.4 115.8 90.8 55.9 1,798 1961 1,102 . 0 120 .3 121.3 95.5 62 .7 1, 920 1962 1,256.0 129.3 132.8 108.3 73.0 2 ,1 75 1963 1,307 . 0 142.9 143 . 5 123.4 83 . 7 2,360 1964 1,452 . 0 174.3 165.7 139 . 3 90.9 2,748
1965 1,514 . 0 205.2 179.8 145 . 2 96.1 2,9 75 1966 1,672.0 204.0 190.0 163.0 108.0 3,220
Source : Commodity Yearbook, several issues .
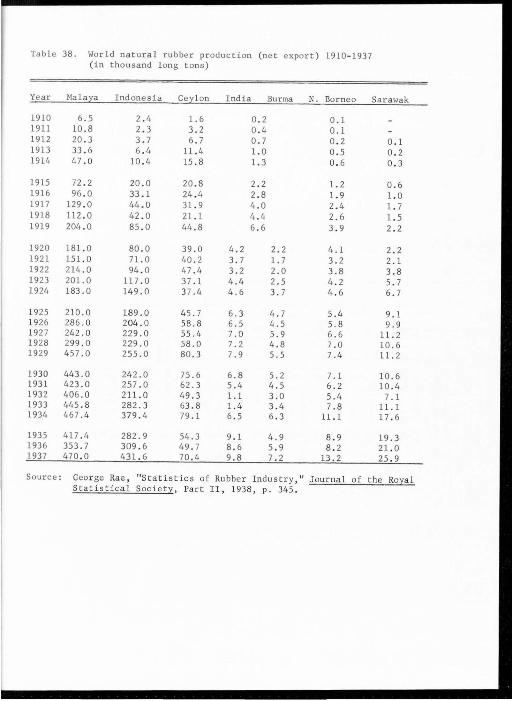
Table 38. World natural rubber production (net export) 1910-1937 (in thousand long tons)
Year Malaya Ind ones ia Ceylon India Burma N. Borneo SaJOawak
1910 6.5 2.4 1.6 0 . 2 0.1 1911 10.8 2.3 3.2 0 . 4 0.1 1912 20 .3 3.7 6 . 7 0.7 0.2 0.1 19 13 33 .6 6.4 11.4 1.0 0 . 5 0 . 2 1914 47 . 0 10.4 15.8 1.3 0.6 0.3
1915 72 .2 20 . 0 20.8 2.2 1.2 0.6 1916 96 .0 33.1 24.4 2.8 1.9 1.0 1917 129 . 0 44.0 31.9 4 .0 2 . 4 1.7 1918 112.0 42.0 21.1 4 . 4 2.6 1.5 1919 204.0 85.0 44 . 8 6.6 3 . 9 2 . 2
1920 181.0 80.0 39.0 4 .2 2.2 4 . 1 2.2 1921 151.0 71.0 40.2 3.7 1.7 3.2 2.1 1922 214.0 94 . 0 47 .4 3.2 2.0 3 . 8 3.8 1923 201.0 117.0 37.1 4.4 2.5 4.2 5.7 1924 183.0 149.0 37.4 4.6 3.7 4.6 6 . 7
1925 210.0 189.0 45.7 6 . 3 4 . 7 5 . 4 9.1 1926 286. 0 204.0 58.8 6.5 4.5 5 . 8 9.9 1927 242. 0 22 9.0 55 .4 7 . 0 5.9 6.6 11.2 1928 299 . 0 229.0 58.0 7.2 4.8 7.0 10.6 1929 457.0 255.0 80.3 7.9 5.5 7.4 11.2
1930 443.0 242.0 75.6 6.8 5.2 7. 1 10.6 1931 423.0 257.0 62 . 3 5.4 4.5 6 . 2 10.4 1932 406.0 211.0 49.3 1.1 3.0 5.4 7.1 1933 445.8 282.3 63.8 1.4 3 . 4 7 . 8 11.1 1934 467.4 379.4 79.1 6 . 5 6.3 11.1 17.6
1935 417 . 4 282.9 54.3 9 . 1 4.9 8 . 9 19.3 1936 353 .7 309 . 6 49 . 7 8.6 5.9 8.2 21.0 1937 470 . 0 431.6 70 . 4 9.8 7.2 13.2 25 . 9
Source; Geo10ge Rae, "Statistics of Rubbe r Industry, " Journal of the Royal Statis t ical Socie t y , Pa10t I I , 1938, p . 345.
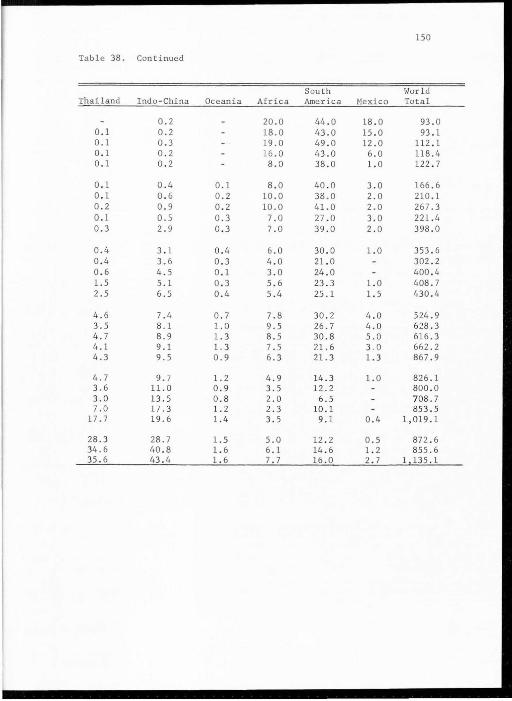
150
Table 38. Continued
South World Thailand Indo-China Oceania Africa America Mexico Total
0.2 20.0 44.0 18 . 0 93 . 0 0.1 0.2 18.0 43 . 0 15 . 0 93 . 1 0 . 1 0.3 19 .0 49 . 0 12.0 112.1 0 . 1 0 . 2 16.0 43 . 0 6.0 118 .4 0 . 1 0 . 2 8.0 38 . 0 1. 0 122.7
0 . 1 0 . 4 0.1 8.0 40.0 3.0 166. 6 0 . 1 0 . 6 0 . 2 10.0 38.0 2.0 210 . 1 0 . 2 0.9 0 .2 10.0 41.0 2.0 267.3 0 . 1 0.5 0.3 7.0 27 . 0 3.0 221 .4 0.3 2.9 0 . 3 7.0 39 . 0 2.0 398.0
0 . 4 3 .1 0.4 6.0 30. 0 1. 0 353.6 0 . 4 3 . 6 0 . 3 4.0 21.0 302 0 2 0 . 6 4.5 0.1 3.0 24 . 0 400 . 4 1.5 5.1 0 . 3 5 . 6 23.3 1.0 408 . 7 2 . 5 6 . 5 0 . 4 5 .4 25.1 1.5 430 . 4
4.6 7 . 4 0.7 7 . 8 30.2 4 . 0 524 . 9 3 . 5 8.1 1.0 9.5 26.7 4.0 628.3 4.7 8.9 1.3 8.5 30.8 5.0 616.3 4.1 9.1 1.3 7.5 21 .6 3 .0 662.2 4.3 9.5 0.9 6.3 21.3 1.3 867 . 9
4. 7 9.7 1.2 4.9 14.3 1.0 826.1 3.6 11.0 0.9 3.5 12.2 800 . 0 3 .0 13 . 5 0 . 8 2.0 6 . 5 708 .7 7.0 17 . 3 1.2 2.3 10.1 853.5
17. 7 19. 6 1.4 3 . 5 9.1 0 .4 1,019. 1
28 .3 28.7 1.5 5.0 12 . 2 0.5 872.6 34.6 40 . 8 1. 6 6 . 1 14 . 6 1.2 855.6 35 . 6 43 . 4 1.6 7.7 16.0 2.7 135.1
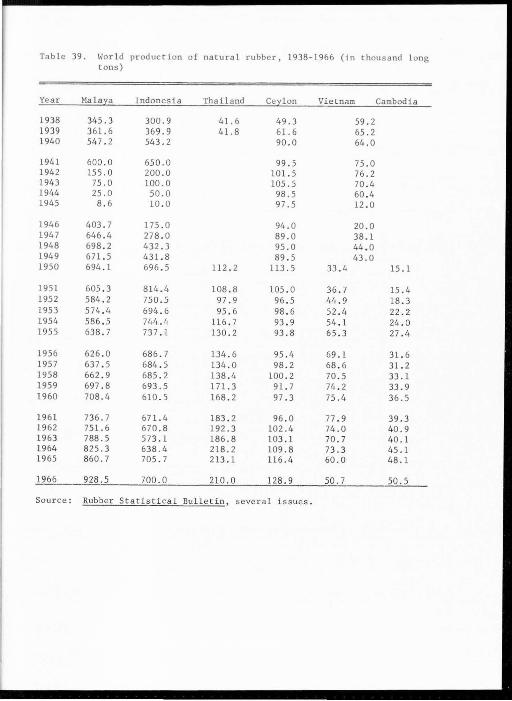
Table 39. World production of natural rubber, 1938-1966 (in thousand l ong tons)
Yea r Malala Indonesia Thailand Cellon Vietnam Cambodia
1938 345.3 300.9 41.6 49.3 59.2 1939 361.6 369.9 41.8 61.6 65.2 1940 547.2 543.2 90.0 64.0
1941 600.0 650.0 99.5 75.0 1942 155.0 200 .0 101.5 76 . 2 1943 75.0 100.0 105.5 70.4 1944 25.0 50 . 0 98.5 60 .4 1945 8.6 10.0 97.5 12.0
1946 403 . 7 175.0 94.0 20 . 0 1947 646.4 278 . 0 89 . 0 38.1 1948 698.2 432 .3 95.0 44.0 1949 671.5 431.8 89.5 43.0 1950 694.1 696 . 5 112 . 2 113.5 33.4 15.1
1951 605 . 3 814.4 108.8 105.0 36.7 15.4 1952 584 .2 750.5 97 . 9 96.5 44.9 18.3 1953 574 . 4 694 . 6 95 . 6 98.6 52.4 22.2 1954 586.5 744.4 116.7 93 . 9 54 . 1 24 . 0 1.955 638.7 737.1 130.2 93.8 65 .3 27.4
1956 626 . 0 686 . 7 134.6 95.4 69 . 1 31.6 1957 637 . 5 684.5 134.0 98.2 68.6 31.2 1958 662.9 685 . 2 138.4 100.2 70.5 33.1 1959 697.8 693.5 171.3 91.7 74 . 2 33 . 9 1960 708.4 610 . 5 168.2 97.3 75.4 36 . 5
1961 736.7 671.4 183.2 96.0 77.9 39 .3 1962 751.6 670 .8 192.3 102.4 74.0 40.9 1963 788.5 573.1 186.8 103 . 1 70.7 40 . 1 1964 825 . 3 638.4 218 . 2 109 .8 73 . 3 45.1 1965 860.7 705.7 213 . 1 116.4 60.0 48.1
1966 928 .5 700.0 210.0 128.9 50.7 50 . 5
Source: Rubber Statistical Bulletin, several issues.
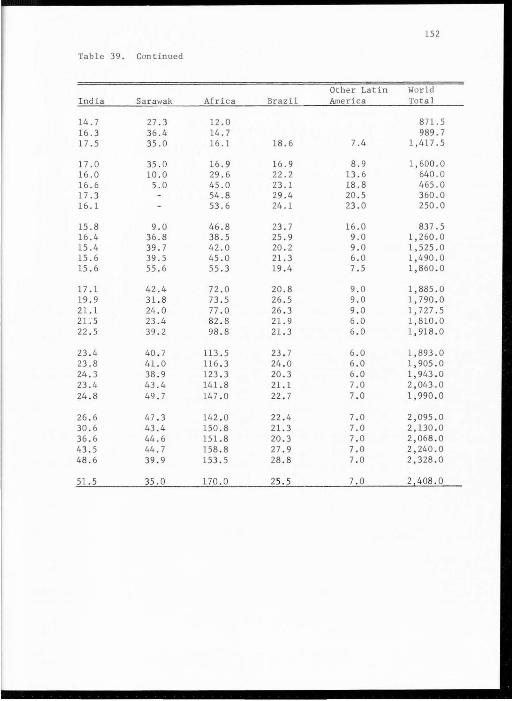
152
Table 39. Continued
Other Latin World India Sarawak Africa Brazil America Total
14.7 27.3 12.0 871.5 16.3 36.4 14.7 989.7 l7 .5 35.0 16.1 18.6 7.4 1,417.5
17 . 0 35.0 16.9 16.9 8.9 1,600.0 16.0 10.0 29.6 22.2 13 . 6 640.0 16.6 5.0 45.0 23 . 1 18 .8 465.0 17.3 54.8 29.4 20.5 360.0 16.1 53.6 24.1 23.0 250.0
15.8 9.0 46.8 23 . 7 16.0 837.5 16.4 36.8 38 . 5 25.9 9.0 1,260.0 15.4 39 . 7 42.0 20 . 2 9.0 1,525 . 0 15 .6 39 . 5 45 . 0 21.3 6 . 0 1,490.0 15.6 55.6 55.3 19.4 7 . 5 1,860 . 0
17 . 1 42.4 72.0 20.8 9.0 1,885.0 19.9 31.8 73 . 5 26 . 5 9.0 1,790.0 21.1 24.0 77.0 26.3 9 . 0 1,727.5 21:5 23.4 82.8 21.9 6 . 0 1,810 . 0 22.5 39.2 98.8 21.3 6. 0 1,918 . 0
23.4 40.7 113.5 23 . 7 6.0 1,893.0 23.8 41.0 116 . 3 24 . 0 6.0 1,905 . 0 24.3 38.9 123.3 20 . 3 6.0 1,943 . 0 23.4 43.4 141.8 21.1 7 .0 2,043.0 24 . 8 49.7 147.0 22.7 7 . 0 1,990.0
26.6 47.3 142.0 22.4 7. 0 2,095.0 30.6 43 .4 150.8 21.3 7 . 0 2,130.0 36.6 44 . 6 151.8 20.3 7.0 2,068.0 43.5 44.7 158.8 27 . 9 7.0 2,240.0 48.6 39.9 153 . 5 28.8 7. 0 2,328 . 0
51.5 35.0 170.0 25 . 5 7 .o 2 408 . 0
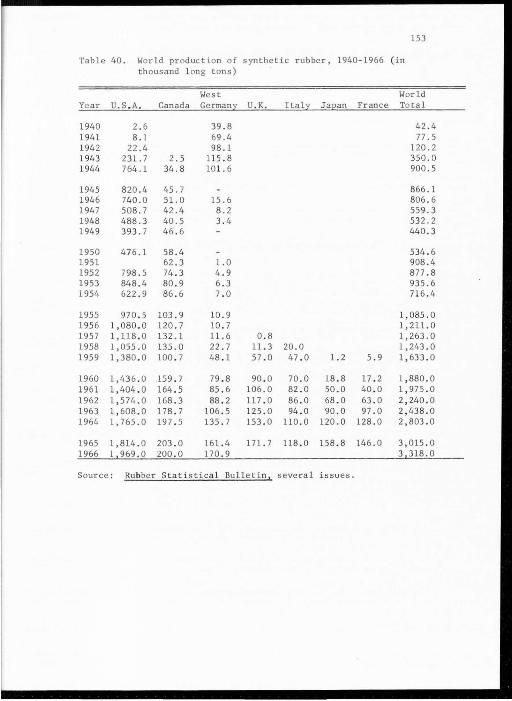
153
Table 40. World produc tion of synthetic rubber, 1940-1966 (in thousand long tons)
West World Year U.S . A. Canada Germany U.K. Italy Japan France Total
1940 2 . 6 39.8 42 .4 1941 8.1 69.4 77.5 1942 22.4 98.1 120 . 2 1943 231.7 2.5 115.8 350.0 1944 764.1 34.8 101. 6 900 . 5
1945 820 .4 45.7 866.1 1946 740 .0 51.0 15.6 806.6 1947 508.7 42 .4 8.2 559.3 1948 488 .3 40 . 5 3.4 532 .2 1949 393.7 46.6 440.3
1950 476.1 58.4 534.6 1951 62.3 l.O 908.4 1952 798 . 5 74 . 3 4 . 9 877.8 1953 848.4 80.9 6.3 935.6 1954 622.9 86.6 7.0 716 . 4
1955 970 . 5 103 . 9 10.9 1,085.0 1956 1,080 . 0 120 . 7 10.7 1,211. 0 1957 1,118.0 132.1 11.6 0.8 1,263.0 1958 1,055.0 135.0 22.7 11.3 20.0 1 , 243.0 1959 1,380 . 0 100.7 48 . 1 57.0 47 . 0 1.2 5.9 1,633.0
1960 1,436 . 0 159.7 79.8 90 . 0 70.0 18.8 17.2 1 , 880 . 0 1961 1,404 . 0 164 . 5 85.6 106.0 82 . 0 50.0 40 . 0 1,975 . 0 1962 1,574.0 168.3 88 . 2 117 . 0 86 . 0 68 . 0 63 . 0 2,240.0 1963 1,608 . 0 178.7 106 . 5 125.0 94 .0 90 . 0 97.0 2,438 . 0 1964 1,765.0 197 . 5 135.7 153 . 0 110.0 120.0 128 . 0 2,803 . 0
1965 1,814.0 203.0 161.4 171.7 118.0 158.8 146 . 0 3,015.0 1966 1 969 . 0 200 . 0 170 . 9 3 318.0
Source: Rubber St atistical Bulletin , severa l issues.
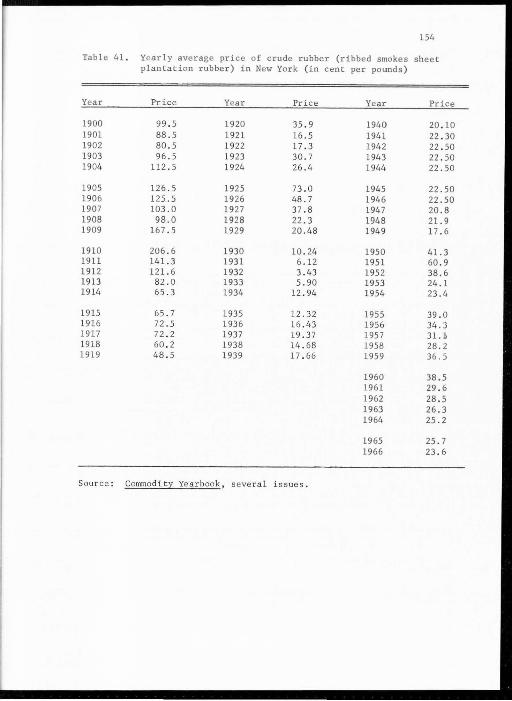
154
Table 41 . Yearly average price of crude rubber (ribbed smoke s sheet plantation rubber) in New York (in cent per pounds)
Year Price Year Price Year Price
1900 99 .5 1920 35.9 1940 20 . 10 1901 88.5 1921 16. 5 1941 22.30 1902 80.5 1922 17.3 1942 22 . 50 1903 96.5 1923 30.7 1943 22.50 1904 112.5 1924 26.4 1944 22.50
1905 126.5 1925 73 .0 1945 22.50 1906 125.5 1926 48.7 1946 22 . 50 1907 103.0 1927 37.8 1947 20.8 1908 98.0 1928 22 .3 1948 21.9 1909 167.5 1929 20. 48 1949 17.6
1910 206.6 1930 10.24 1950 41.3 1911 141.3 1931 6 .12 1951 60 . 9 1912 121.6 1932 3.43 1952 38.6 1913 82 . 0 1933 5.90 1953 24.1 1914 65.3 1934 12.94 1954 23.4
1915 65.7 1935 12.32 1955 39.0 1916 72.5 1936 16.43 1956 34 . 3 1917 72.2 1937 19.37 1957 31.1 1918 60 . 2 1938 14.68 1958 28.2 1919 48 . 5 1939 17 . 66 1959 36.5
1960 38.5 1961 29 . 6 1962 28.5 1963 26.3 1964 25.2
1965 25 . 7 1966 23.6
Source: Commodity Yearbook, several i ssues.
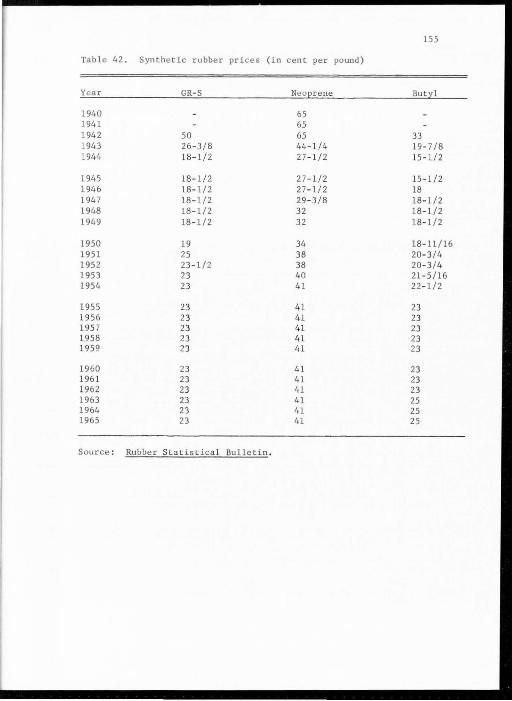
155
Table 42. Synthetic rubber prices (in cent per pound)
Year GR- S Neoprene Butyl
1940 65 1941 65 1942 50 65 33 1943 26- 3/8 44-1/4 19-7/8 1944 18-l/2 27 - 1/2 15-1/2
1945 18-l/2 27-l/2 15-1/2 1946 18-1/2 27-1/2 18 1947 18-1/2 29 - 3/8 18-1 /2 1948 18-1/2 32 18-1 /2 1949 18-1/2 32 18- 1/2
1950 19 34 18- 11/16 1951 25 38 20-3/4 1952 23 - 1/2 38 20-3 /4 1953 23 40 21-5 /16 1954 23 41 22-1/2
1955 23 41 23 1956 23 41 23 1957 23 41 23 1958 23 41 23 1959 23 41 23
1960 23 41 23 1961 23 41 23 1962 23 41 23 1963 23 41 25 1964 23 41 25 1965 23 41 25
Source : Rubber Statistical Bulletin.

156
VITA
Candidate for the Degree of
Master of Science
Thesis: A Study of the Natural Rubber Industry, with Special Reference t o Thailand
Major Field: Economics
Biographical Informati on:
Personal Data: Born at Supanburi, Thailand, November 17, 1931, son of Kieng and Sie Vayagool; married Charunee Vayagool; one child --Barnrularp .
Education: Attended Prasatvidhya School, Supanburi, Thailand; received B. Comm. degree from Thammasat University, Bangkok, Thailand, in 1956; B. B. A., Thammasa t University in 1957; completed requirements for the Master of Science degree at Utah State University in 1967.
Professional Experience: 1963 to present, member of the Auditor Association, Bangkok, Thailand; 1955- 1966, Deputy Member of the Audit Council, Bangkok, Thailand.