A Study of the India’s Agriculture Sector: Issues, Prosects and Performance
10
IRJMST Vol 5 Issue 9 [Year 2014] ISSN 2250 – 1959 (0nline) 2348 – 9367 (Print) International Research Journal of Management Science & Technology http://www.irjmst.com Page 68 A Study of the India’s Agriculture Sector: Issues, Prosects and Performance Vijay Kumar Rajiv Gandhi National Fellow, Dept. of Applied Economics, University of Lucknow Abstract Economist believes that Indian Agriculture sector achieved its growth upto remarkable level in last few decadess in the terms of Production, Output Growth etc. However there are various commodities in agriculture and allied sector which makes India Major producer in world market such as sugarcane, cotton, wheat, rice, spices, poultry farming, fisheries, livestock, milk, jute, pulses etc. The data of 12 th five year plan shows that the target for the growth of agriculture and allied sector was 4.0 per cent annully and the actual achievement was 3.6 per cent annually in the GDP. Although data shows that agriculture and allied sector did not acheved its target which was 4.0 per cent but in case of production, it achieved a remarkable growth rate as compare to the ratio of population. World trade data shows that in a critical condition where other countries was facing slow down in agriculture sector India still has its positive growth in the export of its agriculture and allied sector commodieties. This paper is based on the secondary data which aims to analyse the pattern of growth of agriculuture and allied sector in India. Data have been collected from various government agencies, ministries, RBI etc. Keywords: Agriculture growth, trade, WTO etc. Introduction- The science of farming including cultivation of the soil and rearing of animals is called “agriculture”. The term agriculture has been derived from the Latin word ager meaning field, and cultura meaning cultivation. Same kind of plants like cereal (grains) crops, Pulses and Oil seeds, fibre crops etc. cultivated and grown in large quantities in a field are known as crop plants. There are various variety of plants in cereal category but in India generally rice, wheat, maize are mostly cultivated. Figure: Types of Crops in India Sl. No. Types of Crops Examples 1. Cereals or grain crops Wheat, Rice, Maize, Barley, 2. Oil Seeds Soya bean, Mustard, Ground, Sunflower 3. Fibre crops Cotton, Jute 4. Pulses (Dals) or Legumes Beans, Peas, Grams 5. Root crops Carrot, Sweet Potato Agriculture data shows that the share of agriculture in GDP is decling countinously year to year like in the year of 2012 it was just 14.1 per cent but the role of agriculture is much higher than the other sector for the economic growth and development in terms of employment generation, food safety etc. Data of
-
Upload
independent -
Category
Documents
-
view
4 -
download
0
Transcript of A Study of the India’s Agriculture Sector: Issues, Prosects and Performance
IRJMST Vol 5 Issue 9 [Year 2014] ISSN 2250 – 1959 (0nline) 2348 – 9367 (Print)
International Research Journal of Management Science & Technology http://www.irjmst.com Page 68
A Study of the India’s Agriculture Sector: Issues, Prosects and Performance
Vijay Kumar Rajiv Gandhi National Fellow,
Dept. of Applied Economics, University of Lucknow
Abstract Economist believes that Indian Agriculture sector achieved its growth upto remarkable level in last few
decadess in the terms of Production, Output Growth etc. However there are various commodities in
agriculture and allied sector which makes India Major producer in world market such as sugarcane,
cotton, wheat, rice, spices, poultry farming, fisheries, livestock, milk, jute, pulses etc. The data of 12th
five year plan shows that the target for the growth of agriculture and allied sector was 4.0 per cent
annully and the actual achievement was 3.6 per cent annually in the GDP. Although data shows that
agriculture and allied sector did not acheved its target which was 4.0 per cent but in case of production,
it achieved a remarkable growth rate as compare to the ratio of population. World trade data shows that
in a critical condition where other countries was facing slow down in agriculture sector India still has
its positive growth in the export of its agriculture and allied sector commodieties. This paper is based on
the secondary data which aims to analyse the pattern of growth of agriculuture and allied sector in
India. Data have been collected from various government agencies, ministries, RBI etc.
Keywords: Agriculture growth, trade, WTO etc.
Introduction- The science of farming including cultivation of the soil and rearing of animals is called
“agriculture”. The term agriculture has been derived from the Latin word ager meaning field, and
cultura meaning cultivation. Same kind of plants like cereal (grains) crops, Pulses and Oil seeds, fibre
crops etc. cultivated and grown in large quantities in a field are known as crop plants. There are various
variety of plants in cereal category but in India generally rice, wheat, maize are mostly cultivated.
Figure: Types of Crops in India
Sl. No. Types of Crops Examples
1. Cereals or grain crops Wheat, Rice, Maize, Barley,
2. Oil Seeds Soya bean, Mustard, Ground, Sunflower
3. Fibre crops Cotton, Jute
4. Pulses (Dals) or Legumes Beans, Peas, Grams
5. Root crops Carrot, Sweet Potato
Agriculture data shows that the share of agriculture in GDP is decling countinously year to year like in
the year of 2012 it was just 14.1 per cent but the role of agriculture is much higher than the other sector
for the economic growth and development in terms of employment generation, food safety etc. Data of
IRJMST Vol 5 Issue 9 [Year 2014] ISSN 2250 – 1959 (0nline) 2348 – 9367 (Print)
International Research Journal of Management Science & Technology http://www.irjmst.com Page 69
2001 census shows that the 58.2 per cent of the Indian population was envolved in agriculture sector for
the employment. The target in the 12th five year plan for the agriculture sector was 4.0 per cent and the
actual achievement was 3.6 per cent although it was less than the target but still production growth was
the remarkable. This growth rate was the higher then the growth rate of 9th
and 10th
five year plan where
achievement was only 2.5 per cent and 2.4 per cent respectively.
Literature Review
1. Herberler (1959) –herberler focuses on the export sector and conclude in his study that the
export of any country is directly or indirectly related with the economic growth of that
country. According to him, Trade is the center point to give a boost to any economies.
2. Dutta (1964), Sinha (1986), Ram and Rath (1989)etc analyzed the demand pattern of
India’s export sector on the aggregate level. They studies various items which are exported
by India and some other economists such as Da Costa (1965), Biswas (1983), Lucas (1988),
Virmni (1991) also studied the same issue and divided total export into various groups on the
aggregate level.
3. Panchmukhi (1978) &Sainy (1979) –Panchmukhi analysis was focuses on the government
policy for the promotion and support to foreign trade and also studied the overall trade of
India during the period of 1960 but Sainy not only studied the government policy rather then
he tried to find the loop wholes for the policy formation and also related the foreign trade
with the Economics development of India. He considered foreign trade as an important key
factor for the overall economic growth.
4. Sekhar (2003) – Shekhar works on agriculture export especially on the export of rice of
India. He also tried to analyze the role of trade liberalization policy on agriculture export and
also studied the role of major exporter of rice at world level. He conclude in his study that the
income level of the rice importing country influenced the demand of rice by exporting
company.
5. Chand (2004) - He analyzed in his study about the competitiveness and export performance
of the Indian agriculture and the policy change due to Trade reform like reducing control on
the exchange rate and export process leads to increase in export performance. Various odds
like Technical Barriers to Trade and sanitary/Phyto-sanitary and infrastructural bottlenecks
etc. are the main determinants for the better export growth of livestock, horticultures. He
conclude that for various products like Sugar, Rice, Cotton, India has advantages to export
these product because of high level of production and favorable environment condition but
for the Wheat, they do not have any advantages to compete in foreign market.
6. Kaundal (2005) – Kaundal study was based on the impact of trade reform on the export
sector and he analyzed the causes, pattern of India’s export during the period of 1970 to
2002. He concluded that the share of some traditional goods like Jute, Cotton, Tea has been
fallen in overall export and on the other hand non-traditional goods like manufactured goods,
machineries etc. share has been increased in overall export.
7. Raju (2005) – Raju worked on the role of agriculture sector for the employment generation
and its role in GDP and economic growth. He studied the agreement on agriculture (AoA)
which was formed by World Trade Organization and also studied various other issue
regarding with agriculture growth in developing countries.
8. Chakraborty and Singh (2006) –They took agricultural subsidy as a main factor for the
increase and decrease of agriculture trade. They concluded that subsidy on agriculture is
favorable for developed country but for developing country it works as a hurdle for free trade
IRJMST Vol 5 Issue 9 [Year 2014] ISSN 2250 – 1959 (0nline) 2348 – 9367 (Print)
International Research Journal of Management Science & Technology http://www.irjmst.com Page 70
of agricultural product so they are not favorable negotiation. According to him negotiations
should be in such a way which can be beneficial for developing country also.
9. Ramphul (2006) - He analyzed the performance of agricultural trade of various developed
and developing country. He also analyzed the impact of WTO agreements and negotiation on
the agricultural trade at world level. He concluded that WTO has adverse effect on
agricultural trade at world level.
10. M. Ramesh, M. Chandrayya and M. Sankara (2009) - According to their point of view,
WTO has a direct and indirect relationship with various sector of Indian economics. Indian
agriculture sector affected so much from the WTO. WTO also have its impact on Indian
former because they are directly associated with agriculture and their livelihood depends on
agriculture sector so they affected so much by government policy to subsidies agriculture and
also from the policy of WTO. There is also a very big challenge for the Indian government to
protect these former on agriculture sector from the side effects of WTO and also a big task to
improve its competitiveness for the international market because after economic reform and
adoption of LPG India is getting a tough competition from foreign companies therefore
government is trying to make more favorable policy such as market policy, agriculture policy
to make former more capable for the production. There are various institutions which provide
financial help, training to the former for better agriculture growth.
11. P. Arunachalam (2009) - He studied the reasons that why agriculture is one of the main
sector for the study by various magazines, newspapers, books and academician, politicians
etc in special reference with WTO because there are various difference for the developed and
developing agriculture sector is in developed countries in WTO.
Objective of the Study: The objective for the the following research study mentioned
below-
To find out the Agriculture growth pattern in India.
To analyze whether agriculture sector achieving positively growth or negatively growth.
To understand the role of India’s Agriculture sector at world level.
AGRICULTURE ROLE IN GROSS DOMESTIC PRODUCT IN INDIA
It is observed that share of Agriculture and Allied Sector in overall GDP (Gross Domestic
Product) in India has been decreasing every year like it was 15.2 per cent during the 11th
five year plan
but in 2013-14 it is only 13.9 percent. In India, Agriculture is one of the most important sector in
providing employment, Data of censes 2011 shows that it accounts for almost 54.6 per cent employment
to population it is also clearly indicating after comparing the employment data of Census 2001 and
Census 2011 that number of cultivators also decreased from 127.3 million in 2001 to 118.7 million in
2011 which is showing the shifting of employment from farm to non-farm employment.
IRJMST Vol 5 Issue 9 [Year 2014] ISSN 2250 – 1959 (0nline) 2348 – 9367 (Print)
International Research Journal of Management Science & Technology http://www.irjmst.com Page 71
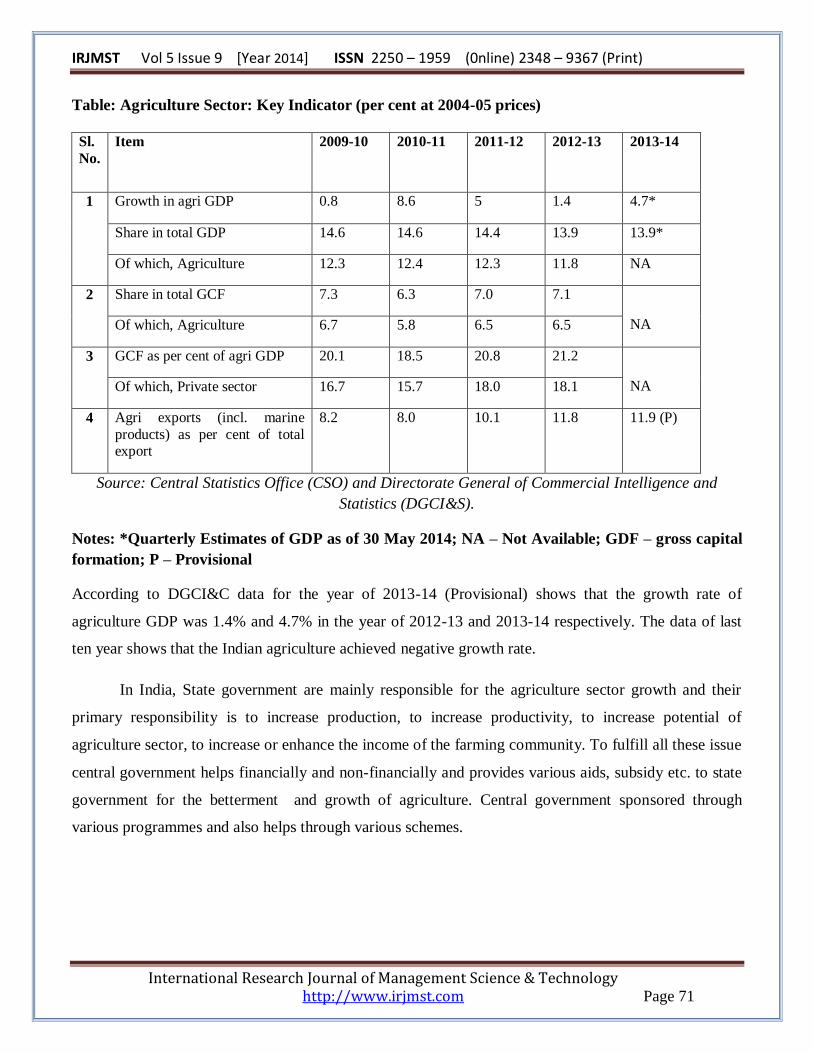
Table: Agriculture Sector: Key Indicator (per cent at 2004-05 prices)
Sl.
No.
Item 2009-10 2010-11 2011-12 2012-13 2013-14
1 Growth in agri GDP 0.8 8.6 5 1.4 4.7*
Share in total GDP 14.6 14.6 14.4 13.9 13.9*
Of which, Agriculture 12.3 12.4 12.3 11.8 NA
2 Share in total GCF 7.3 6.3 7.0 7.1
NA Of which, Agriculture 6.7 5.8 6.5 6.5
3 GCF as per cent of agri GDP 20.1 18.5 20.8 21.2
NA Of which, Private sector 16.7 15.7 18.0 18.1
4 Agri exports (incl. marine
products) as per cent of total export
8.2 8.0 10.1 11.8 11.9 (P)
Source: Central Statistics Office (CSO) and Directorate General of Commercial Intelligence and
Statistics (DGCI&S).
Notes: *Quarterly Estimates of GDP as of 30 May 2014; NA – Not Available; GDF – gross capital
formation; P – Provisional
According to DGCI&C data for the year of 2013-14 (Provisional) shows that the growth rate of
agriculture GDP was 1.4% and 4.7% in the year of 2012-13 and 2013-14 respectively. The data of last
ten year shows that the Indian agriculture achieved negative growth rate.
In India, State government are mainly responsible for the agriculture sector growth and their
primary responsibility is to increase production, to increase productivity, to increase potential of
agriculture sector, to increase or enhance the income of the farming community. To fulfill all these issue
central government helps financially and non-financially and provides various aids, subsidy etc. to state
government for the betterment and growth of agriculture. Central government sponsored through
various programmes and also helps through various schemes.
IRJMST Vol 5 Issue 9 [Year 2014] ISSN 2250 – 1959 (0nline) 2348 – 9367 (Print)
International Research Journal of Management Science & Technology http://www.irjmst.com Page 72
Table: Statistical data of major crops in 2013-14* (Area, Production, Yield), with % change over
2012-13.
(Area: million Ha; Prod: Million tonnes; Yield: kg/ha)
Group/Commodity Area Production Yield
Food grains (a)
Rice
Wheat
126.2 (4.47)
43.9 (2.57)
31.3 (4.33)
264.4 (2.88)
106.3 (1.05)
95.8 (2.46)
2095 (-1.55)
2419 (-1.75)
3059 (-1.86)
Coarse cereals
Maize
Bajra
25.5 (2.98)
9.3 (6.90)
7.9 (8.22)
42.7 (6.64)
24.2 (8.52)
9.2 (5.75)
1672 (2.83
2602 (1.40)
1161 (-3.09)
Pulses
Gram
Tur
25.4 (9.01)
10.2 (20.00)
3.9 (0.00)
19.6 (7.10)
9.9 (12.50)
3.4 (13.33)
770 (-2.41)
974 (-5.98)
857 (10.44)
Oilseeds
Groundnut
Rapeseed and mustard
Cotton(b)
28.2 (6.42)
5.5 (17.02)
6.5 (1.56)
11.7 (-2.50)
32.4 (4.85)
9.5 (102.10)
7.8 (-2.50)
36.5 (6.73)
1149 (-1.63)
1723(73.17)
1208 (-4.28)
529 (8.85)
Sugarcane 5.0 (0.00) 348 (2.11) 70 (0.00
Source: Directorate of Economics and Statistics, Department of Agriculture and
Cooperation (DAC).
Notes: *3rd Advance Estimates; a - Includes cereals, coarse cereals and pulses;b - million bales of 170
kgs each; Figures in brackets indicate per centchange over 2012-13.
The table mentioned above shows the data of some principle commodity in of 2013-14 for the change in
area, production and yield of this commodity. The table is based on the 3rd
Advance Estimation (3rd
AE)
IRJMST Vol 5 Issue 9 [Year 2014] ISSN 2250 – 1959 (0nline) 2348 – 9367 (Print)
International Research Journal of Management Science & Technology http://www.irjmst.com Page 73
which shows that food grains has increased about 126.2 million hectare, Coarse cereals 25.5 hectare,
Pulses about 25.4 hectare, Oil seeds 28.2 hectare and sugarcane about 5.0 hectare and the data of
production of food grain is about 264.4 million tonnes, Coarse cereals is about 42.7 million tonnes,
pulses about 19.6 million tones, oilseeds about 32.4 million and the data of yield is shown in kg/ha
where food grains about 2095 kg/ha, coarse cereals is about 1672 kg/ha, pulses is about 770 kg/ha,
oilseeds is about 1149 kg/ha and sugarcane 70 kg/hectare.
NATIONAL FOOD SECURITY MISSION (NFSM)
This mission has setup a new target for the production of food grains up to 25 million tonnes up to the
2016-17 after achieving the target of 20 million tonnes in last year. The targets for 2016-17 for
following commodities are:
Rice – 10 million tonnes
Wheat – 8 million tonnes
Pulses – 4 million tonnes
Coarse Cereals – 3 million
Government also has a plan to help farmers through organizational help named as Former Producer
Organizations (FPO’s) which aim is to improving cropping system and also focus on small and marginal
farmers. Government also helps through various funding programmes such s Rastriya krishi Vikas
Yojana (RKVY)
For the 12th five year plan this scheme funds 35% in production growth 35% in infrastructure and assets,
20% in sub schemes, 10% in flexible fund. Another scheme named Bringing Green Revolution of
Eastern India (BGREI) has allocated 1000 Crore rupees. In the year of 2003-14 which increased paddy
production in various states (those who implementing this scheme) by 7 % in the year of 2012-13 over
2011-12.
IRJMST Vol 5 Issue 9 [Year 2014] ISSN 2250 – 1959 (0nline) 2348 – 9367 (Print)
International Research Journal of Management Science & Technology http://www.irjmst.com Page 74
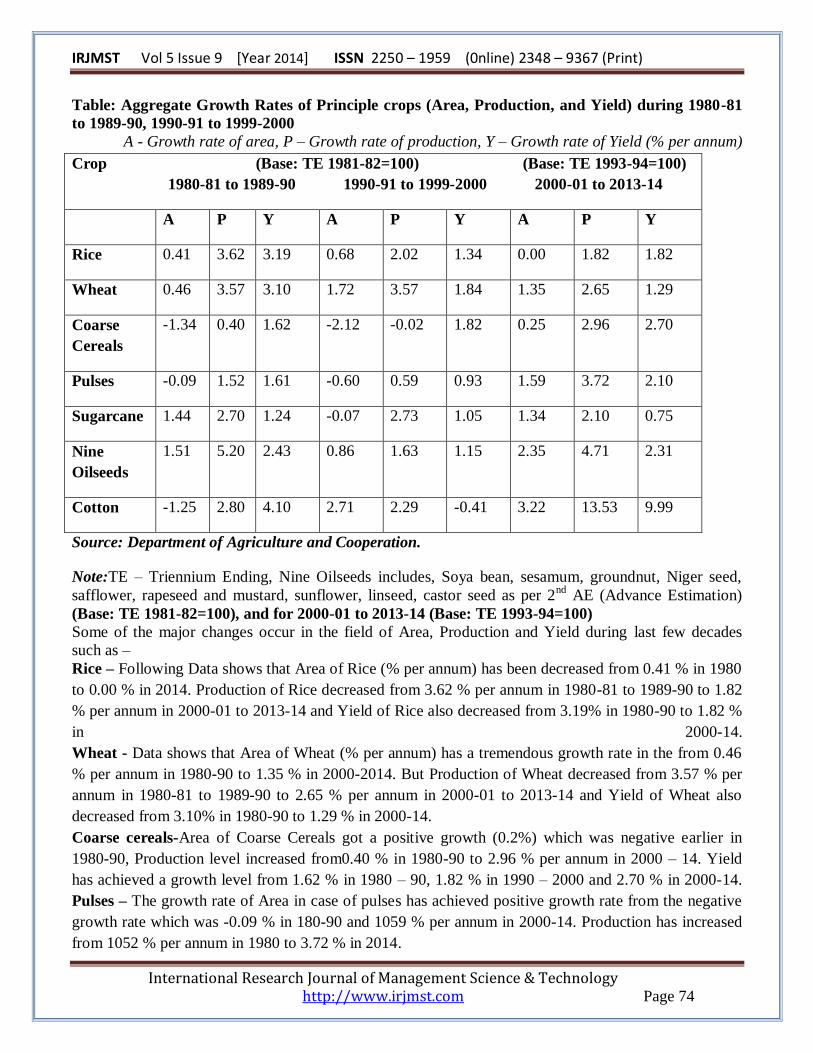
Table: Aggregate Growth Rates of Principle crops (Area, Production, and Yield) during 1980-81
to 1989-90, 1990-91 to 1999-2000
A - Growth rate of area, P – Growth rate of production, Y – Growth rate of Yield (% per annum)
Crop (Base: TE 1981-82=100) (Base: TE 1993-94=100)
1980-81 to 1989-90 1990-91 to 1999-2000 2000-01 to 2013-14
A P Y A P Y A P Y
Rice 0.41 3.62 3.19 0.68 2.02 1.34 0.00 1.82 1.82
Wheat 0.46 3.57 3.10 1.72 3.57 1.84 1.35 2.65 1.29
Coarse
Cereals
-1.34 0.40 1.62 -2.12 -0.02 1.82 0.25 2.96 2.70
Pulses -0.09 1.52 1.61 -0.60 0.59 0.93 1.59 3.72 2.10
Sugarcane 1.44 2.70 1.24 -0.07 2.73 1.05 1.34 2.10 0.75
Nine
Oilseeds
1.51 5.20 2.43 0.86 1.63 1.15 2.35 4.71 2.31
Cotton -1.25 2.80 4.10 2.71 2.29 -0.41 3.22 13.53 9.99
Source: Department of Agriculture and Cooperation.
Note:TE – Triennium Ending, Nine Oilseeds includes, Soya bean, sesamum, groundnut, Niger seed,
safflower, rapeseed and mustard, sunflower, linseed, castor seed as per 2nd
AE (Advance Estimation)
(Base: TE 1981-82=100), and for 2000-01 to 2013-14 (Base: TE 1993-94=100)
Some of the major changes occur in the field of Area, Production and Yield during last few decades
such as –
Rice – Following Data shows that Area of Rice (% per annum) has been decreased from 0.41 % in 1980
to 0.00 % in 2014. Production of Rice decreased from 3.62 % per annum in 1980-81 to 1989-90 to 1.82
% per annum in 2000-01 to 2013-14 and Yield of Rice also decreased from 3.19% in 1980-90 to 1.82 %
in 2000-14.
Wheat - Data shows that Area of Wheat (% per annum) has a tremendous growth rate in the from 0.46
% per annum in 1980-90 to 1.35 % in 2000-2014. But Production of Wheat decreased from 3.57 % per
annum in 1980-81 to 1989-90 to 2.65 % per annum in 2000-01 to 2013-14 and Yield of Wheat also
decreased from 3.10% in 1980-90 to 1.29 % in 2000-14.
Coarse cereals-Area of Coarse Cereals got a positive growth (0.2%) which was negative earlier in
1980-90, Production level increased from0.40 % in 1980-90 to 2.96 % per annum in 2000 – 14. Yield
has achieved a growth level from 1.62 % in 1980 – 90, 1.82 % in 1990 – 2000 and 2.70 % in 2000-14.
Pulses – The growth rate of Area in case of pulses has achieved positive growth rate from the negative
growth rate which was -0.09 % in 180-90 and 1059 % per annum in 2000-14. Production has increased
from 1052 % per annum in 1980 to 3.72 % in 2014.
IRJMST Vol 5 Issue 9 [Year 2014] ISSN 2250 – 1959 (0nline) 2348 – 9367 (Print)
International Research Journal of Management Science & Technology http://www.irjmst.com Page 75
Sugarcane - The growth rate of Sugarcane Area was 1.44 % per annum during 1980 – 90 which was
later in negative -0.07 % per annum during 1990 to 2000 but in the 2000 to 2014 it achieved a positive
growth rate of 1.34 per cent per annum but Production of sugarcane has been decreased from 2.70 % per
annum during 1980 – 90 later which was almost same 2.73 % per annum during 1990 to 2000 but during
2000 to 2014 it is still negative with 2.10 per annum.
Nine Oilseeds - Data shows that Area of Oilseeds has a negative growth rate in the from 1.51 % per
annum in 1980-90 to 0.86 % in 1990 – 2000 and later on in during the year of 2000 – 2014 it was
achieved positive growth rate which was 2035 % per annum. But Production of Wheat decreased from
5.20 % per annum in 1980-81 to 1.15 % in 1989-90 but it was 4.71 % per annum in 2000-01 to 2013-14
and Yield of Oilseeds also decreased from 2.43 % in 1980-90 to 2.31 % in 2000-14.
Cotton -Growth rate of Cotton Area achieved a positive growth rate after 1980.It was -1.25 % per
annum during 1980 – 90 which was later in positive 2.71 % per annum during 1990 to 2000 and during
the year of 2000 to 2014 it achieved a tremendous positive growth rate of 3.22 per cent per annum.
Production of sugarcane was almost same in the decades of 80’s and 90’s 2.80 % per annum during
1980 – 90 and 2.71 % in 1990 – 2000 but during the year of 2000 – 2014 it achieved a high growth rate
up to 13.53 % per annum, Yield of Cotton decreased from 4.10 % in 1980-90 to -0.41 % in 1990 – 2000
but later on it also achieved high growth rate of 9.99 % per annum during the year of 2000 – 2014.
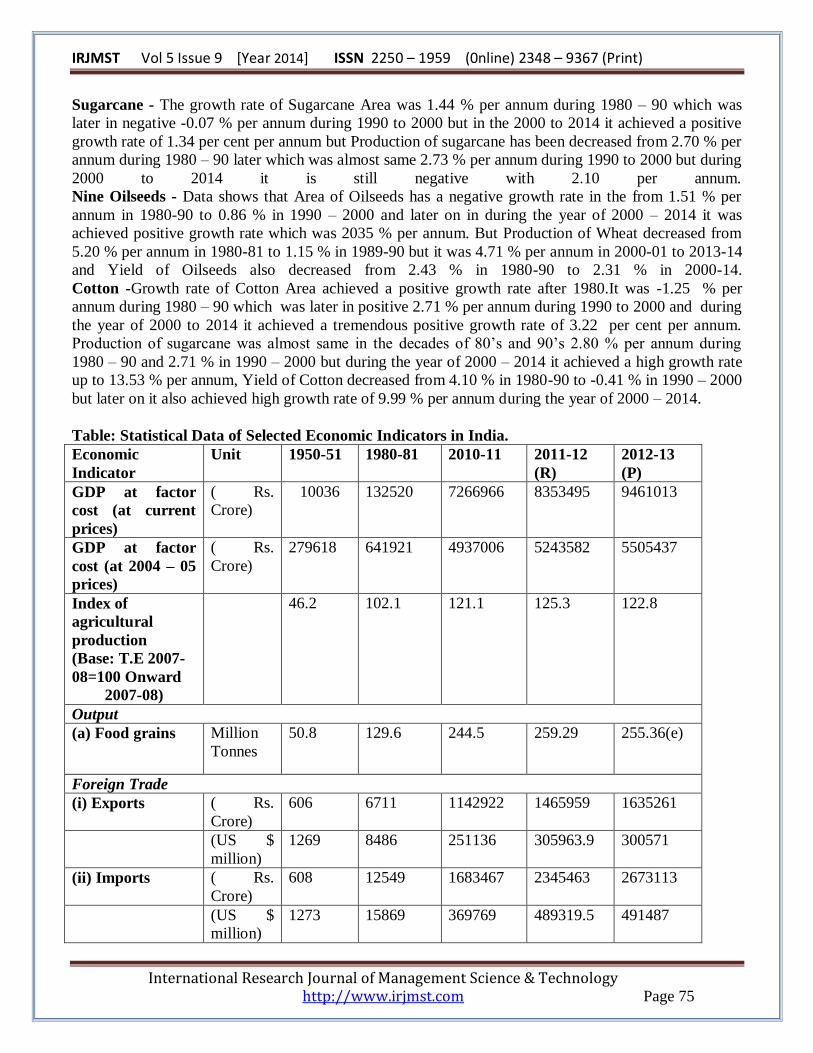
Table: Statistical Data of Selected Economic Indicators in India.
Economic
Indicator
Unit 1950-51 1980-81 2010-11 2011-12
(R)
2012-13
(P)
GDP at factor
cost (at current
prices)
( Rs.
Crore)
10036 132520 7266966 8353495 9461013
GDP at factor
cost (at 2004 – 05
prices)
( Rs.
Crore)
279618 641921 4937006 5243582 5505437
Index of
agricultural
production
(Base: T.E 2007-
08=100 Onward
2007-08)
46.2 102.1 121.1 125.3 122.8
Output
(a) Food grains Million
Tonnes
50.8 129.6 244.5 259.29 255.36(e)
Foreign Trade
(i) Exports ( Rs.
Crore)
606 6711 1142922 1465959 1635261
(US $
million)
1269 8486 251136 305963.9 300571
(ii) Imports ( Rs.
Crore)
608 12549 1683467 2345463 2673113
(US $
million)
1273 15869 369769 489319.5 491487
IRJMST Vol 5 Issue 9 [Year 2014] ISSN 2250 – 1959 (0nline) 2348 – 9367 (Print)
International Research Journal of Management Science & Technology http://www.irjmst.com Page 76
P: Provisional; R: Revised estimates; e: 4th Advance Estimates.
Source: Economic Survey 2012-13, Ministry of Finance and Handbook of Statistics on Indian Economy
2013, RBI
In this table some economic indicator has been mentioned like GDP at factor cost, Agriculture
Production, Output, Foreign Trade etc.
GDP at factor cost ( at current prices) - GDP data shows that GDP at factor cost ( at current prices) in
the year of 1950-51 was just only 10036 Rs. Crore and 132520 Rs. Crore in 1980-814 and in the decade
of 2010 it was 7266966 Rs. Crore and according to Economic survey 2012-13 Provisional data of 2012-
13 was 9461013 Rs. Crore.
GDP at factor Cost (at 2004-05 price) - In case of GDP at factor Cost (at 2004-05 price) was 2796.18
Rs. Crore in 1950-51 and it was 641921 Rs. Crore in the year of 1980-81 Rs. Crore and in the decades of
2010 it was Rs. 4937006 Crore and at last year 2012-13 GDP at factor price (at 2004-05 price) was
5505.437.
Food Grains Output - Data of food grains output shows that in the year of 1950-51 output of food
grains was 506 million tonnes and it increased to 129.6 million tonnes in the year of 1980-81 and it was
244.55 million tonnes in 2010-11 and last year 2012-13 data shows that food grains output was 255.36
million tonnes according to 4th advance estimates.
International Trade –Export data shows that in year of 1950-51 total export of India was only 606 Rs.
Crore in Dollar it was only 1269 US$ million which increased year by year and in the year of 1980 – 81
total export of India was 6711 Rs. Crore or 8486 US$ million and in 2010-11 it was 1142922 Rs. Crore
or 251136 US $ million and last year data (2012-13) total export was Rs. 1635261 Crore or 300571 US$
million.
Import of India increased more in the ratio of export it was 608 Rs. Crore (1273 US$ million) in 1950-
51 and it increased 12549 Rs. Crore (15869 US$ million) in 1980-81 and in the decade of 2010 total
import was Rs. 1683467 Crore) 369769US$million). At last year data (1012-13) total import of India
was Rs. 2673113 Crore (491487 US $ million).
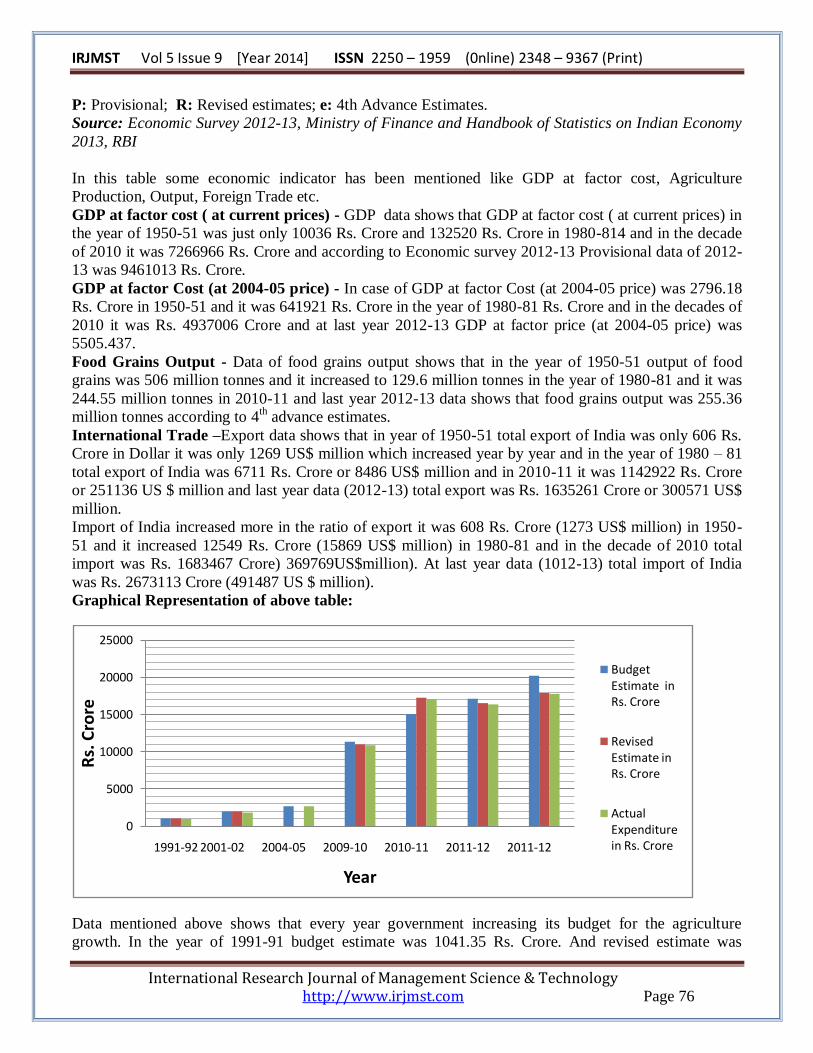
Graphical Representation of above table:
Data mentioned above shows that every year government increasing its budget for the agriculture
growth. In the year of 1991-91 budget estimate was 1041.35 Rs. Crore. And revised estimate was
0
5000
10000
15000
20000
25000
1991-92 2001-02 2004-05 2009-10 2010-11 2011-12 2011-12
Rs.
Cro
re
Year
Budget Estimate in Rs. Crore
Revised Estimate in Rs. Crore
Actual Expenditure in Rs. Crore
IRJMST Vol 5 Issue 9 [Year 2014] ISSN 2250 – 1959 (0nline) 2348 – 9367 (Print)
International Research Journal of Management Science & Technology http://www.irjmst.com Page 77
1016.936 Rs. Crore but Actual expenditure was less than estimation it was 957.86 Rs. Crore. After this
decades in the year of 2001-02 budget estimation was 1985.00 Crore and revised estimate was Rs
1985.00 Crore but Actual expenditure was less than expenditure which was Rs 1792.92 Crore.
Budget estimates again increased after 10 year which was Rs 15042.00 Crore in the year of 2010-11 and
revised estimate amount was Rs 17254.00 Crore and actual expenditure was Rs 17052.59 Crore.
Last year 2012-13 budget estimates increased from 17122.87 Rs Crore in 2011-12 to 202508.00 Rs.
Crore in 2012-13 and revised estimation data show that it was 16515.05 Rs. Crore in 2011-12 and
17867.32 Rs. Crore in the year of 2012-13 where Actual estimate was 16354.70 Rs. Crore in 2011-12
and 17765.24 Rs. Crore in 2012-13.
So data shows that budget estimate in the year of 1991-92 was just only Rs. 1041.35 Crore only but after
22 year it increased 20 times which was 20208.00 Rs. Crore in the year of 2012-13. Where Actual
Expenditure on Agriculture also increase almost 18 times which was just 957.86 Rs. Crore in 1991-92
and 17765.24 Rs. Crore in the year of 2012-13
Conclusions: Study shows that various compotants of agriculture sector such as share in GDP, share of
agriculture export, Area, Production, yield, National food security mission status, export and import of
agriculture etc. Growth in agriculture GDP shows that in last five year growth have been declined in per
centage terms whether the share in total GDP also declined from 14.6 per cent in 2009 to 13.9 per cent
in 2014. Agriculture export including marine product as per cent of total export increased in percentage
terms from 8.2 % to 11.9 per cent.
References
http://dgft.gov.in/
www.dgciskol.nic.in/
commerce.nic.in/
Economic survey of India various addition
World Trade report 2014
Annual report of the various ministry of India.
Ph.D Thesis by Vijay Kumar “An Analytical Study of WTO on Indian Agriculture Sector”.