A study of cortical morphology in children with fetal alcohol spectrum disorders
12
A Study of Cortical Morphology in Children With Fetal Alcohol Spectrum Disorders Franc¸ois De Guio, 1 * Jean-Franc ¸ois Mangin, 1 Denis Rivie `re, 1 Matthieu Perrot, 1 Christopher D. Molteno, 2 Sandra W. Jacobson, 2,3,4 Ernesta M. Meintjes, 4,5 and Joseph L. Jacobson 2,3,4 1 LNAO, NeuroSpin, I2BM, CEA, Gif-sur-Yvette, France 2 Department of Psychiatry, Faculty of Health Sciences, University of Cape Town, Cape Town, South Africa 3 Department of Psychiatry and Behavioral Neurosciences, Wayne State University School of Medicine, Detroit, Michigan 4 Department of Human Biology, Faculty of Health Sciences, University of Cape Town, Cape Town, South Africa 5 MRC/UCT Medical Imaging Research Unit, Faculty of Health Sciences, University of Cape Town, Cape Town, South Africa r r Abstract: Prenatal alcohol exposure is responsible for a broad range of brain structural malformations, which can be studied using magnetic resonance imaging (MRI). Advanced MRI methods have emerged to characterize brain abnormalities, but the teratogenic effects of alcohol on cortical morphol- ogy have received little attention to date. Twenty-four 9-year-old children with fetal alcohol spectrum disorders (9 with fetal alcohol syndrome, 15 heavy exposed nonsyndromal children) and 16 age- matched controls were studied to assess the effect of alcohol consumption during pregnancy on corti- cal morphology. An automated method was applied to 3D T1-weighted images to assess cortical gyrifi- cation using global and regional sulcal indices and two region-based morphological measurements, mean sulcal depth and fold opening. Increasing levels of alcohol exposure were related to reduced cortical folding complexity, even among children with normal brain size, indicating a reduction of bur- ied cortical surface. Fold opening was the strongest anatomical correlate of prenatal alcohol intake, indicating a widening of sulci in all regions that were examined. These data identify cortical morphol- Contract grant sponsor: The region Ile-de-France; Contract grant sponsor: from NIH/National Institute on Alcohol Abuse and Al- coholism (NIAAA); Contract grant number: R01 AA016781; Con- tract grant sponsor: The South African National Research Foundation; Contract grant number: Focus Area Grant FA2005040800024; Contract grant sponsor: The South African Research Chairs Initiative of the Department of Science and Tech- nology and National Research Foundation of South Africa; an administrative supplement to NIAAA; Contract grant numbers: R01 AA09524, U01 AA014790, U24 AA014815 in conjunction with the NIAAA Collaborative Initiative on Fetal Alcohol Spectrum Disorders; Contract grant sponsor: Medical Research Council of South Africa; Contract grant sponsor: University of Cape Town, the President of Wayne State University and the State of Michigan. *Correspondence to: Franc ¸ois De Guio, LNAO, NeuroSpin, CEA Saclay, I2BM, CEA, Gif-sur-Yvette, France. E-mail: [email protected] Received for publication 1 January 2013; Accepted 23 April 2013. DOI 10.1002/hbm.22327 Published online in Wiley Online Library (wileyonlinelibrary.com). r Human Brain Mapping 00:00–00 (2013) r V C 2013 Wiley Periodicals, Inc.
-
Upload
independent -
Category
Documents
-
view
0 -
download
0
Transcript of A study of cortical morphology in children with fetal alcohol spectrum disorders

A Study of Cortical Morphology in Children WithFetal Alcohol Spectrum Disorders
Francois De Guio,1* Jean-Francois Mangin,1 Denis Riviere,1 Matthieu Perrot,1
Christopher D. Molteno,2 Sandra W. Jacobson,2,3,4 Ernesta M. Meintjes,4,5
and Joseph L. Jacobson2,3,4
1LNAO, NeuroSpin, I2BM, CEA, Gif-sur-Yvette, France2Department of Psychiatry, Faculty of Health Sciences, University of Cape Town, Cape Town,
South Africa3Department of Psychiatry and Behavioral Neurosciences, Wayne State University School of
Medicine, Detroit, Michigan4Department of Human Biology, Faculty of Health Sciences, University of Cape Town, Cape
Town, South Africa5MRC/UCT Medical Imaging Research Unit, Faculty of Health Sciences, University of Cape
Town, Cape Town, South Africa
r r
Abstract: Prenatal alcohol exposure is responsible for a broad range of brain structural malformations,which can be studied using magnetic resonance imaging (MRI). Advanced MRI methods haveemerged to characterize brain abnormalities, but the teratogenic effects of alcohol on cortical morphol-ogy have received little attention to date. Twenty-four 9-year-old children with fetal alcohol spectrumdisorders (9 with fetal alcohol syndrome, 15 heavy exposed nonsyndromal children) and 16 age-matched controls were studied to assess the effect of alcohol consumption during pregnancy on corti-cal morphology. An automated method was applied to 3D T1-weighted images to assess cortical gyrifi-cation using global and regional sulcal indices and two region-based morphological measurements,mean sulcal depth and fold opening. Increasing levels of alcohol exposure were related to reducedcortical folding complexity, even among children with normal brain size, indicating a reduction of bur-ied cortical surface. Fold opening was the strongest anatomical correlate of prenatal alcohol intake,indicating a widening of sulci in all regions that were examined. These data identify cortical morphol-
Contract grant sponsor: The region Ile-de-France; Contract grantsponsor: from NIH/National Institute on Alcohol Abuse and Al-coholism (NIAAA); Contract grant number: R01 AA016781; Con-tract grant sponsor: The South African National ResearchFoundation; Contract grant number: Focus Area GrantFA2005040800024; Contract grant sponsor: The South AfricanResearch Chairs Initiative of the Department of Science and Tech-nology and National Research Foundation of South Africa; anadministrative supplement to NIAAA; Contract grant numbers:R01 AA09524, U01 AA014790, U24 AA014815 in conjunction withthe NIAAA Collaborative Initiative on Fetal Alcohol SpectrumDisorders; Contract grant sponsor: Medical Research Council of
South Africa; Contract grant sponsor: University of Cape Town,the President of Wayne State University and the State ofMichigan.
*Correspondence to: Francois De Guio, LNAO, NeuroSpin, CEASaclay, I2BM, CEA, Gif-sur-Yvette, France. E-mail:[email protected]
Received for publication 1 January 2013; Accepted 23 April 2013.
DOI 10.1002/hbm.22327Published online in Wiley Online Library(wileyonlinelibrary.com).
r Human Brain Mapping 00:00–00 (2013) r
VC 2013 Wiley Periodicals, Inc.

ogy as a suitable marker for further investigation of brain damage associated with prenatal alcohol ex-posure. Hum Brain Mapp 00:000–000, 2013. VC 2013 Wiley Periodicals, Inc.
Key words: fetal alcohol spectrum disorders; FAS; cortical morphology; fold opening
r r
INTRODUCTION
Prenatal alcohol exposure is associated with structuralmalformations to the brain and numerous cognitive andbehavioral deficits. Fetal alcohol syndrome (FAS), the mostsevere of the fetal alcohol spectrum disorders (FASD), isthe most common cause of preventable mental retardation.It is characterized by a distinctive pattern of craniofacialdysmorphology, small head circumference, and growth re-tardation [Hoyme et al., 2005; Stratton et al., 1996]. Indi-viduals with partial FAS exhibit some but not all of thedysmorphic features of FAS. Alcohol-related neurodeve-lopmental disorder, the most prevalent FASD, is character-ized by prenatal alcohol exposure and cognitive and/orbehavioral impairment in the absence of distinctive cranio-facial dysmorphology. Small head circumference, presum-ably reflecting reduced brain volume, is required for adiagnosis of FAS and is also seen in partial FAS and somenonsyndromal alcohol-exposed individuals [Carter et al.,2013; Day et al., 2002]. The prevalence of FASD has beenestimated to be as high as 2–5% of school-age children inthe United States and Western Europe [May et al., 2009].The highest rates of FAS have been reported among theCape Coloured (mixed ancestry) community in the West-ern Cape Province, South Africa, ranging from 68 to 89.2per 1,000 live births [May et al., 2007].
Several neuroimaging studies have used magnetic reso-nance imaging (MRI) to examine brain structure in chil-dren and adults with prenatal alcohol exposure.Reductions in cerebral volume are highly reproducible inFASD [Lebel et al., 2011; Norman et al., 2009] and are seeneven at low-to-moderate exposure levels [Eckstrand et al.,2012], but effects on specific brain structures are somewhatless consistent. The corpus callosum has been identified asparticularly affected by prenatal alcohol exposure, as is thecerebellum [Lebel et al., 2011; Spadoni et al., 2007; Yanget al., 2012a]. Deep gray-matter (GM) structures are alsoaffected, including the hippocampus and caudate nucleus.Brain tissue reductions have been reported in all lobarregions [Archibald et al., 2001; Astley et al., 2009; Li et al.,2008; Nardelli et al., 2011; Sowell et al., 2002] though find-ings are less regionally reproducible across groups. GMand white-matter (WM) differences and regional brainshape abnormalities have also been identified [Archibaldet al., 2001; Sowell et al., 2002]. Findings with regard tocortical thickness are contradictory, as one research groupreported thicker cortex in children with FASD [Sowellet al., 2008; Yang et al., 2012b], whereas another concludedthat prenatal alcohol exposure is associated with cortical
thinning [Zhou et al., 2011]. Thus, there continues to be aneed to examine subtle abnormalities associated with alco-hol-related cortical damage [Lebel et al., 2011].
To date, no studies in children with FASD have exam-ined cortical morphology, another potential biomarker ofdevelopmental abnormalities [Mangin et al., 2010]. Corti-cal folding indices have detected abnormalities in cortexgyrification in schizophrenia [Cachia et al., 2008], bipolardisorder [Penttila et al., 2009], elderly patients [Liu et al.,2010], and Alzheimer’s disease [Reiner et al., 2012]. Inthis study, we applied an automated method to T1-weighted MR images to extract morphometric measuresrelated to sulci, including global and regional sulcal indi-ces, regional sulcal mean depth, and fold opening toadvance our understanding of the effects of prenatalalcohol exposure on brain anatomy in preadolescentchildren.
MATERIALS AND METHODS
Participants
Participants were 40 9-year-old, right-handed childrenfrom the Cape Coloured community in South Africa, whoare participating in the prospective Cape Town Longitudi-nal Cohort Study [Jacobson et al., 2008]. Nine of these chil-dren met criteria for a diagnosis of FAS, 15 were heavilyexposed (HE) nonsyndromal, that is, did not meet dysmor-phia criteria for FAS, and 16 were typically developingcontrol (CTL) children. Sample characteristics are summar-ized in Table I. The mothers of children with FAS drank9.6 standard drinks per occasion on average and dranktwice as frequently per week as the mothers of HE chil-dren, who also binge drank, averaging six drinks per occa-sion. The Cape Coloured community is a mixed ancestrypopulation, composed of descendants of white Europeansettlers, Malaysian slaves, Khoi-San aboriginals, and blackAfrican ancestors.
Maternal alcohol consumption was assessed using atimeline follow-back approach [Jacobson et al., 2002]. Atrecruitment, the mother was interviewed to determine theincidence and amount of her drinking on a day-by-day ba-sis during a typical 2-week period at time of conception.Volume was recorded for each type of beverage consumedeach day, converted to oz of absolute alcohol (AA), andaveraged across pregnancy. Two groups of women wererecruited: (1) heavy drinkers, who consumed 14 or morestandard drinks/week and/or engaged in binge drinking(five or more drinks/occasion) during pregnancy and
r De Guio et al. r
r 2 r

(2) controls who abstained from drinking or drank onlyminimally. At recruitment, the mother was also askedwhether her drinking had changed since conception; if so,when did the change occur and how much she drank on aday-by-day basis during the last 2-week period. This pro-cedure was repeated in mid-pregnancy and again at 1-month postpartum to provide information about drinkingduring the latter part of pregnancy. Data from the threetimeline follow-back interviews were tabulated to providethree continuous measures of prenatal alcohol exposure:average oz AA consumed per day, average oz consumedper drinking day (dose/occasion) during pregnancy, andfrequency of drinking (days/week). All control motherswhose children were examined in this study abstained,except for one who drank two drinks on three occasionsduring pregnancy.
A clinic was organized in 2005, in which each childwas examined for growth and FAS anomalies using astandard protocol [Hoyme et al., 2005] by three expertFAS dysmorphologists, who subsequently reached agree-ment regarding FAS diagnosis [Jacobson et al., 2008]. Tomeet criteria for full FAS, the child had to have at leasttwo of the principal dysmorphic features (short palpebralfissures, thin upper lip, flat or smooth philtrum), smallhead circumference (<10th percentile), and low weight orshort stature (<10th percentile). As we were interested incontrasting cortical folding in children with full FAS withthat seen in HE nonsyndromal children, data from the 19children diagnosed with partial FAS were not included inthis study. One mother whose child met all the diagnosticcriteria for FAS denied drinking during pregnancy, andone mother who initially denied drinking reported drink-ing during pregnancy when interviewed at 5-year post-partum. The alcohol intake of these two mothers wasestimated by substituting the median reported by theother mothers of the children in their respective diagnos-tic groups.
Procedure
The scans were performed at the Cape UniversitiesBrain Imaging Centre (CUBIC). A staff driver and researchnurse transported the mother and child from their hometo CUBIC. Written informed consent was obtained fromthe mothers/guardians of the children, who provided oralassent. Approval for human research was obtained fromthe Wayne State University Human Investigation Commit-tee and from the Faculty of Health Sciences HumanResearch Ethics Committee of the University of CapeTown. Mothers and children were given a snack and lunchduring the visit, the mother received a small monetarycompensation, and the child was given a small gift andpicture of his/her brain scan.
MRI Protocol
High-resolution anatomical images were acquired using a3T Magnetom Allegra MRI scanner (Siemens Medical Sys-tems, Erlangen, Germany). The images were acquired in thesagittal plane using a three-dimensional inversion recoverygradient echo sequence (160 slices, TR 5 2,200 ms, TE 5
5.16 ms, TI 5 1,000 ms, FA 5 12�, slice thickness 5 1 mm,256 3 256 mm2 FOV, resolution 5 1 3 1 3 1 mm3).
Image Processing
Cortex gyrification and other morphology indices wereassessed automatically from the raw MRI structural vol-umes using BrainVISA software (http://brainvisa.info/)and its dedicated pipeline, Morphologist, including severalimage processing steps (Fig. 1). Brain tissues (GM, WM, cer-ebrospinal fluid [CSF]) were segmented after bias correc-tion. Cortical folds were automatically segmented from theskeleton of the GM/CSF mask and converted to a graph-based representation of the cortex with information related
TABLE I. Sample characteristics
FAS (N 5 9) HE (N 5 15) CTL (N 5 16) F or v2
Child’s age at scan 9.3 (0.3) 9.6 (0.6) 9.3 (0.4) 2.16Gender (% male) 33.3 53.3 43.8 0.93Parity 3.3 (1.2) 1.9 (0.8) 1.8 (0.8) 8.97b
Socioeconomic status 16.0 (7.7) 23.6 (9.6) 27.4 (7.6) 5.28b
Average oz AA/day during pregnancya 1.8 (2.2) 0.5 (0.5) 0.001 (0.003) 8.36b
Average oz AA/drinking dayduring pregnancy
4.8 (1.8) 3.0 (1.4) 0.1 (0.3) 48.15c
Frequency of drinking duringpregnancy (days/week)
2.2 (1.8) 1.1 (0.8) 0.0 (0.0) 15.09c
Cigarettes/day during pregnancy 7.7 (5.7) 7.6 (7.2) 3.4 (9.9) 1.32Marijuana use during pregnancy 0.1 (0.3) 0.0 (0.0) 0.0 (0.0) 1.79
Values are mean (standard deviation, SD).a1 oz absolute alcohol ’ about two standard drinks.bP < 0.01.cP < 0.001.
r Cortical Morphology in Fetal Alcohol Spectrum Disorders r
r 3 r

Figure 1.
Image processing pipeline within BrainVISA used to segment
brains from raw T1-weighted images, run bias correction, com-
pute WM/GM boundary, reconstruct white/gray mesh, and run
sulci recognition and labeling. For each hemisphere of each sub-
ject, g-SI, r-SI, mean sulcal depth, and regional fold opening were
measured in eight regions. g-SI was defined as the ratio between
total sulcal area and area of the outer cortex [Cachia et al.,
2008]. [Color figure can be viewed in the online issue, which is
available at wileyonlinelibrary.com.]
r De Guio et al. r
r 4 r

to the morphology (fold area, depth, length, and opening)[Mangin et al., 2004]. As children with FAS have smallerbrains, each index was measured in native space withoutspatial normalization to avoid deformation of the sulci.
An automatic recognition algorithm based on a congre-gation of artificial networks trained on manually labeledbrains [Riviere et al., 2002] was applied to the extractedcortical folds. This system labeled each cortical fold basedon a standard nomenclature including 58 sulci in eachhemisphere. Errors of identification were visually trackedand corrected for each subject. Eight regions of interestwere selected either because they were easily identifiableto serve as a reference (e.g., central sulcus) or based on apriori knowledge about regions found abnormal in otherneuroimaging studies of FASD (frontal, temporal, and pa-rietal cortices).
Brain tissues volumes
For each hemisphere, WM volume, GM volume, andtotal volume (defined as the sum of WM, GM, and CSF)were computed based on the segmentation of the raw T1MR images.
Global sulcal index
The global sulcal index (g-SI) was defined as the per-centage ratio between the total sulcal area and the outercortex area [Cachia et al., 2008]. The area of each corticalfold was measured as the sum of all the triangle areasdefining the fold mesh, and total sulcal area was calcu-lated as the sum of the area of all the segmented corticalfolds. This method uses the skeleton of the GM/CSFmask, with the cortical folds corresponding to the crevassebottoms of the “landscape” the altitude of which isdefined by intensity on MRI [Mangin et al., 2004]. The
outer cortex area is estimated from the area of the smoothenvelope of the brain mask. Thus, a cortex with extensivefolding has a large g-SI, whereas a cortex with a lowdegree of folding has a small g-SI. At a constant outer cor-tex area, the g-SI increases with the number and/or sur-face of sulcal folds, and the g-SI of a lissencephalic cortexis zero. Hence, this index focuses on the burying of thecortex and is, therefore, slightly different from standardgyrification indices, which often include additional infor-mation related to the cortex thickness and the sulcal open-ing. It can be regarded as a measure of cortex complexity.
Regional sulcal index
The regional sulcal index (r-SI) was defined as the per-centage ratio between the sum of areas of labeled sulci ina particular region and the outer cortex area [Cachia et al.,2008]. Hence, the r-SI increases with the depth and thelength of a sulcus. Sulcus area was estimated, as for the g-SI, from the area of the mesh defining the sulcus (Fig. 2).Thus, the sum of all the r-SIs in each hemisphere wasequal to the g-SI of that hemisphere. Notably, the g-SI wasdefined from nonlabeled sulci and was, therefore, notaffected by possible labeling errors.
Regional mean sulcal depth
Sulcal depth was measured as the height of the seg-mented sulcus computed in the perpendicular direction ofthe main long axis (Fig. 2). The average depth along thesulcus was reported in this study.
Regional mean fold opening
The opening of the fold was measured as the averagedistance between the two walls of the pial surface (Fig. 2).
Figure 2.
Illustration of sulcal morphometry on the central sulcus [Mangin
et al., 2010]: (a) surface area in blue, r-SI was defined as the
sum of areas of labeled sulci in each region divided by outer
cortical area [Cachia et al., 2008]; (b) maximal depth in yellow,
mean sulcal depth was reported in this study; (c) average
opening in blue, fold opening represents the average sulcal width
of a sulcus, that is, the mean distance between the two walls of
the gyri on each side of the sulcus. [Color figure can be viewed
in the online issue, which is available at wileyonlinelibrary.com.]
r Cortical Morphology in Fetal Alcohol Spectrum Disorders r
r 5 r

It has been shown to be a good biomarker of atrophy inaging [Kochunov et al., 2005; Liu et al., 2010] and Alzhei-mer’s disease [Reiner et al., 2012]. The fold opening is alsoreferred to as sulcal span in some studies [Liu et al., 2010].It should be noted that fold opening can be independentof sulcal index and sulcal depth. Indeed, two-folds canshare the same surface or depth, albeit with differentopenings.
Statistical Analyses
All statistical analyses were run using SPSS, version 20,and all significance tests were two tailed. Each of the sul-cal and brain volume measures was examined in relationto fetal alcohol diagnosis (FAS/HE/CTL) using analysis ofvariance (ANOVA) followed by least-significant-differencepost hoc tests. Potential confounding variables were identi-fied by examining the correlation of each of the followingcontrol variables with each of the outcome measures—child’s gender and age at assessment, maternal cigarettessmoked per day during pregnancy, number of days permonth mother used marijuana during pregnancy, parity,and socioeconomic status. Any control variable that waseven weakly related to an outcome measure (at P < 0.10)was considered a potential confounder of the relation ofdiagnostic group to that measure. The ANOVA for eachoutcome was then rerun as an analysis of covariance thatincluded the potential confounders as covariates to deter-mine if effects related to FASD diagnosis remained signifi-cant after adjustment for potential confounders. Finally,for the exposed children (FAS 1 HE), each of the morpho-metric measurements was examined in relation to the twocontinuous measures of alcohol consumption during preg-nancy—oz AA/day and dose/occasion (oz AA/drinkingday)—using Pearson’s correlation analysis.
RESULTS
Brain Tissue Volumes
Mean values of WM, GM, and total volumes for thethree groups are listed in Table II. Children with FAS hadsignificantly smaller total brain volumes compared to HEand CTL children, which was expected, as microcephaly isone of the criteria for an FAS diagnosis. Consequently,WM and GM volumes were also much smaller in the FASgroup. A mean reduction of 13% in total volume (12% forGM and 16% for WM) was observed in the FAS group,compared to the controls. The HE and CTL groups did notdiffer in WM, GM, or total volumes. All three effects con-tinued to be significant after control for gender, the solepotential confounding variable.
Global Sulcal Index
As no significant differences were observed between leftand right g-SI, the mean values for the two hemisphereswere summed and compared between groups (Table II). g-SI was significantly smaller in the FAS than in the CTLgroup with a reduction of 8%. g-SI was also smaller in theHE children than in the controls. Thus, less cortical surfacewas buried in both the microcephalic FAS group and theHE group whose brain volume was normal, comparedwith the controls. The effect of diagnostic group on g-SIcontinued to be significant after adjustment for parity, thesole potential confounding variable for that outcome. Inaddition, among the exposed children, both continuousmeasures of prenatal alcohol exposure were moderatelycorrelated with g-SI (Table IV). As shown in Figures 3 and4, the effects of diagnostic group and maternal alcoholconsumption during pregnancy on global sulcal morphol-ogy were both dose dependent.
TABLE II. Relationship of diagnostic group to measures of brain volume and g-SI
Post hoc P-values
FAS (n 5 9) HE (n 5 15) CTL (n 5 16) F
FASversus
HE
FASversusCTL
HEversusCTL Fa
Total brainvolume (cm3)
1.0 3 106 (9.6 3 104) 1.2 3 106 (9.2 3 104) 1.2 3 106 (9.9 3 104) 9.87f 0.000 0.000 0.902 9.96fb
WM (cm3) 3.7 3 105 (5.4 3 104) 4.5 3 105 (6.3 3 104) 4.4 3 105 (4.5 3 104) 7.85e 0.001 0.002 0.604 7.35eb
GM (cm3) 5.3 3 105 (4.4 3 104) 5.9 3 105 (4.2 3 104) 6.1 3 105 (4.5 3 104) 9.85f 0.003 0.000 0.175 10.70fb
g-SI 3.1 (0.2) 3.2 (0.2) 3.4 (0.2) 6.68e 0.186 0.001 0.019 4.10dc
Values are mean (SD).aAdjusted for potential confounders.bControlling for gender.cControlling for parity.dP < 0.05.eP < 0.01.fP < 0.001.
r De Guio et al. r
r 6 r

Regional Sulcal Index
Regional measurements were not reported for onecontrol subject for right precentral sulcus and for twocontrol subjects for right parietal sulcus as the automaticmethod was not able to label several sulci in theseregions.
FASD diagnostic group was significantly related tolower local sulcal index scores in only 2 out of the 16regions—left central and right prefronal sulcus—and onlythe effect on the left central sulcus remained significantafter control for confounders (Table III). Among theexposed children, the two measures of maternal alcoholconsumption during pregnancy were moderately corre-lated with the l-SI in the right prefrontal and left medial-temporal regions (Table IV). AA/day was also correlatedwith l-SI in the left central and right lateraltemporalregions.
Regional Mean Sulcal Depth
Diagnostic group was significantly related to reducedsulcal depth in only 2 out of the 16 regions—left
Figure 3.
Dose-dependent relationship between prenatal alcohol exposure
and global sulcal index. Values are group mean 1 standard error.
Post hoc comparisons: High exposure versus no exposure, P <0.001; intermediate exposure versus no exposure, P < 0.05;
high exposure versus no exposure, P 5 0.072.
Figure 4.
Scatterplot showing relationship of alcohol consumption per drinking day (dose/occasion) during
pregnancy to global sulcal index, r 5 20.58, P < 0.001.
r Cortical Morphology in Fetal Alcohol Spectrum Disorders r
r 7 r

intraparietal and right precentral—and only the effect onthe left intraparietal sulcus remained significant after con-trol for confounders (Table III). In addition, a significanteffect on the right prefrontal sulcus was seen after controlfor confounders. Among the exposed children, the twomeasures of maternal alcohol consumption were both
moderately correlated with sulcal depth in the left intra-parietal region, with correlations in the right precentralregion that fell short of statistical significance (Table IV).In addition, AA/day was correlated with sulcal depth inthe right prefrontal region, and AA/drinking day, withsulcal depth in the left medialtemporal region.
TABLE III. Effects of FASD diagnosis on local sulcal index, sulcal depth, and fold opening
FAS (n 5 9) HE (n 5 15) CTL (n 5 16) F Fa
Local sulcal IndexCentral sulcusLeft 0.062 (0.008) 0.065 (0.006) 0.073 (0.010) 5.83k 3.95i,b
Prefrontal sulcusRight 0.198 (0.033) 0.229 (0.033) 0.240 (0.035) 4.40j 1.60b,c
Sulcal depthPrecentral sulcusRight 11.78 (1.11) 12.00 (1.09) 12.84 (0.83) 4.20i 1.10b,d,e
Prefrontal sulcusRight 9.30 (0.23) 9.46 (0.45) 9.80 (0.67) 3.14h 3.65i,c
Intraparietal sulcusLeft 12.80 (0.62) 13.96 (1.05) 14.17 (0.95) 6.70j 6.33k,b,c
Regional fold opening
Central sulcusLeft 1.20 (0.08) 1.09 (0.12) 0.97 (0.21) 6.24j 2.81h,b,c
Right 1.14 (0.08) 1.09 (0.12) 0.96 (0.21) 4.52i 4.52i
Precentral sulcusLeft 1.13 (0.15) 1.03 (0.13) 0.91 (0.17) 6.29j 3.95i,e,f
Right 1.15 (0.09) 1.03 (0.09) 0.90 (0.19) 8.79k 4.55i,b,d,e
Prefrontal sulcusLeft 1.41 (0.15) 1.39 (0.21) 1.17 (0.22) 6.01j 6.01j
Right 1.48 (0.19) 1.39 (0.16) 1.18 (0.23) 8.14k 5.83j,b
Medial frontal sulcusLeft 1.71 (0.20) 1.67 (0.25) 1.49 (0.19) 3.91i 3.99i,f
Right 1.81 (0.16) 1.67 (0.13) 1.47 (0.25) 9.62k 3.60i,b,d,e
Intraparietal sulcusLeft 1.04 (0.08) 0.98 (0.15) 0.82 (0.18) 8.15k 8.15k
Right 1.01 (0.12) 0.96 (0.13) 0.80 (0.19) 7.18j 5.05i,e,f
Parietal sulcusLeft 1.62 (0.33) 1.32 (0.27) 1.29 (0.36) 3.51i 2.42f
Rightg 1.70 (0.43) 1.57 (0.25) 1.28 (0.26) 5.63j 5.63j
Lateral temporal sulcusLeft 1.08 (0.10) 1.06 (0.12) 0.87 (0.18) 8.57k 4.51i,d,e
Right 1.06 (0.11) 1.03 (0.17) 0.83 (0.18) 7.97k 3.10h,b,d,e
Medial temporal sulcusLeft 1.87 (0.44) 1.51 (0.24) 1.31 (0.32) 8.60k 6.00j,e
Right 1.79 (0.55) 1.67 (0.49) 1.42 (0.18) 2.72h 2.72h
Values are mean (SD).aAdjusted for potential confounders.bControlling for parity.cControlling for gender.dControlling for cigarettes/day during pregnancy.eControlling for socioeconomic status.fControlling for prenatal marijuana exposure.gMissing for two CTL subjects.hP < 0.10.iP < 0.05.jP < 0.01.kP < 0.001.
r De Guio et al. r
r 8 r
Regional Fold Opening
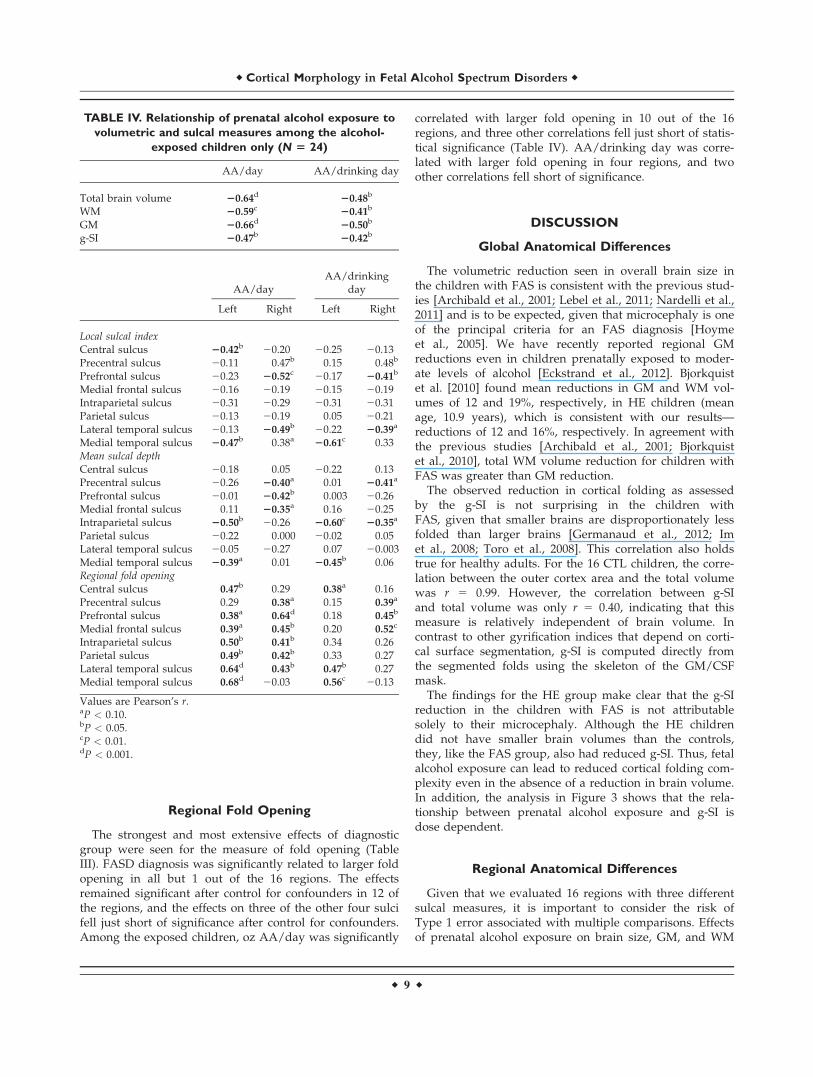
The strongest and most extensive effects of diagnosticgroup were seen for the measure of fold opening (TableIII). FASD diagnosis was significantly related to larger foldopening in all but 1 out of the 16 regions. The effectsremained significant after control for confounders in 12 ofthe regions, and the effects on three of the other four sulcifell just short of significance after control for confounders.Among the exposed children, oz AA/day was significantly
correlated with larger fold opening in 10 out of the 16regions, and three other correlations fell just short of statis-tical significance (Table IV). AA/drinking day was corre-lated with larger fold opening in four regions, and twoother correlations fell short of significance.
DISCUSSION
Global Anatomical Differences
The volumetric reduction seen in overall brain size inthe children with FAS is consistent with the previous stud-ies [Archibald et al., 2001; Lebel et al., 2011; Nardelli et al.,2011] and is to be expected, given that microcephaly is oneof the principal criteria for an FAS diagnosis [Hoymeet al., 2005]. We have recently reported regional GMreductions even in children prenatally exposed to moder-ate levels of alcohol [Eckstrand et al., 2012]. Bjorkquistet al. [2010] found mean reductions in GM and WM vol-umes of 12 and 19%, respectively, in HE children (meanage, 10.9 years), which is consistent with our results—reductions of 12 and 16%, respectively. In agreement withthe previous studies [Archibald et al., 2001; Bjorkquistet al., 2010], total WM volume reduction for children withFAS was greater than GM reduction.
The observed reduction in cortical folding as assessedby the g-SI is not surprising in the children withFAS, given that smaller brains are disproportionately lessfolded than larger brains [Germanaud et al., 2012; Imet al., 2008; Toro et al., 2008]. This correlation also holdstrue for healthy adults. For the 16 CTL children, the corre-lation between the outer cortex area and the total volumewas r 5 0.99. However, the correlation between g-SIand total volume was only r 5 0.40, indicating that thismeasure is relatively independent of brain volume. Incontrast to other gyrification indices that depend on corti-cal surface segmentation, g-SI is computed directly fromthe segmented folds using the skeleton of the GM/CSFmask.
The findings for the HE group make clear that the g-SIreduction in the children with FAS is not attributablesolely to their microcephaly. Although the HE childrendid not have smaller brain volumes than the controls,they, like the FAS group, also had reduced g-SI. Thus, fetalalcohol exposure can lead to reduced cortical folding com-plexity even in the absence of a reduction in brain volume.In addition, the analysis in Figure 3 shows that the rela-tionship between prenatal alcohol exposure and g-SI isdose dependent.
Regional Anatomical Differences
Given that we evaluated 16 regions with three differentsulcal measures, it is important to consider the risk ofType 1 error associated with multiple comparisons. Effectsof prenatal alcohol exposure on brain size, GM, and WM
TABLE IV. Relationship of prenatal alcohol exposure to
volumetric and sulcal measures among the alcohol-
exposed children only (N 5 24)
AA/day AA/drinking day
Total brain volume 20.64d 20.48b
WM 20.59c 20.41b
GM 20.66d 20.50b
g-SI 20.47b 20.42b
AA/dayAA/drinking
day
Left Right Left Right
Local sulcal indexCentral sulcus 20.42b 20.20 20.25 20.13Precentral sulcus 20.11 0.47b 0.15 0.48b
Prefrontal sulcus 20.23 20.52c 20.17 20.41b
Medial frontal sulcus 20.16 20.19 20.15 20.19Intraparietal sulcus 20.31 20.29 20.31 20.31Parietal sulcus 20.13 20.19 0.05 20.21Lateral temporal sulcus 20.13 20.49b 20.22 20.39a
Medial temporal sulcus 20.47b 0.38a 20.61c 0.33Mean sulcal depthCentral sulcus 20.18 0.05 20.22 0.13Precentral sulcus 20.26 20.40a 0.01 20.41a
Prefrontal sulcus 20.01 20.42b 0.003 20.26Medial frontal sulcus 0.11 20.35a 0.16 20.25Intraparietal sulcus 20.50b 20.26 20.60c 20.35a
Parietal sulcus 20.22 0.000 20.02 0.05Lateral temporal sulcus 20.05 20.27 0.07 20.003Medial temporal sulcus 20.39a 0.01 20.45b 0.06Regional fold openingCentral sulcus 0.47b 0.29 0.38a 0.16Precentral sulcus 0.29 0.38a 0.15 0.39a
Prefrontal sulcus 0.38a 0.64d 0.18 0.45b
Medial frontal sulcus 0.39a 0.45b 0.20 0.52c
Intraparietal sulcus 0.50b 0.41b 0.34 0.26Parietal sulcus 0.49b 0.42b 0.33 0.27Lateral temporal sulcus 0.64d 0.43b 0.47b 0.27Medial temporal sulcus 0.68d 20.03 0.56c 20.13
Values are Pearson’s r.aP < 0.10.bP < 0.05.cP < 0.01.dP < 0.001.
r Cortical Morphology in Fetal Alcohol Spectrum Disorders r
r 9 r

were predicted a priori based on the previous studies;moreover, an effect on g-SI was the principal hypothesisof this study. Among the 16 local sulcal index measures,effects of FASD diagnosis were significant in only tworegions—left central sulcus and left prefrontal sulcus.Given that 2 out of the 16 comparisons might well be sig-nificant by chance, the data suggest that the effect seen onthe global sulcal index was not focused on any particularsulcal region(s). Among the 16 sulcal depth measures,again only two of the effects of diagnosis were significant,suggesting that sulcal depth is not extensively affected byfetal alcohol exposure.
In contrast, diagnostic group was significantly related toall but one of the fold-opening measures, indicating thatthis aspect of cortical folding is highly sensitive to prenatalalcohol exposure. It is unlikely that the fold-opening find-ing was attributed to multiple comparisons as it was evi-dent throughout the brain. These fold-opening results,which are independent of the sulcal depth and r-SI com-putations, indicate a difference in sulcal shape; namely, anincrease in the mean distance between the two walls ofthe fold. The increasing magnitude of the opening of thefolds with increased alcohol exposure is similar to theassociation that has been reported between degree of foldopening and severity of pathology in Alzheimer’s disease[Reiner et al., 2012].
In contrast to cortical thickness methods, cortical foldingmeasurement does not rely on the contrast between GMand WM, which could vary with the severity of the pa-thology, but on the contrast between GM and CSF, whichis stronger and more consistent. The previous studies onthe effects of prenatal alcohol exposure on cortical thick-ness have yielded inconsistent results. Two studiesreported thicker cortex in bilateral temporal, bilateral infe-rior parietal, and right frontal regions in alcohol-exposedsubjects compared to controls [Sowell et al., 2008; Yanget al., 2012b], but Zhou et al. [2011] found no increases incortical thickness and significant cortical thinning in bilat-eral middle frontal lobe, pre-, and postcentral areas, lateraland inferior temporal, and occipital lobes. These inconsis-tencies could be owing to population differences in degreeof alcohol exposure and clinical diagnosis (e.g., FAS vs.HE) and/or differences in the methodologies used to com-pute cortical thickness. Limitations of these studies are thebroad age ranges (8–22 years in the study of Sowell et al.;6–30 years in the study of Zhou et al.) and that partici-pants with an FAS diagnosis were grouped together withother HE individuals. The strengths of the Cape Towncohort [Jacobson et al., 2008] include age homogeneity (9–10 years) and separation of groups according to rigorousdiagnostic criteria. Age and diagnostic group are of pri-mary concern in these studies as cortical thinningincreases with age during adolescence [Zhou et al., 2011],and cortical morphology is impacted by brain size. Giventhat in larger brains significantly less thickening has beendetected in left temporal, right frontal, and temporal lobesin normal subjects [Im et al., 2008], findings in cortical
thickness studies may be biased by the proportion of chil-dren with FAS in a given sample.
Given the reduced GM volume in the children with FAS,the greater fold opening in alcohol-exposed children is con-sistent with the inference of an association of prenatal alco-hol exposure with reduced cortical thickness. A reductionof cortical thickness might imply a greater distance betweenthe two walls of a fold. However, the sulcal opening iscomplex and is not necessarily determined by cortical thick-ness, as it is also linked to the global shape, surface, andnumber of the folds. Further studies are needed to betterunderstand the correlations among these MRI biomarkers.It is of interest that the regions found to have a thinner cor-tex in the study of Zhou et al. [2011]—prefrontal, precentraland lateral temporal cortices—were also found to havelarger fold opening, particularly in the children with FAS.
Although smoking during pregnancy was related to pre-natal alcohol exposure (r 5 0.43, P < 0.01), it was not sig-nificantly related to g-SI or any of the brain volume or r-SImeasures. Smoking was related to 1 out of the 16 sulcaldepth and 4 out of the 16 fold-opening measures but wasno longer significant in relation to those endpoints whenincluded with prenatal alcohol exposure in multipleregression analyses. Thus, these data indicate that corticalmorphology is much more sensitive to prenatal exposureto alcohol than to smoking.
Mechanism of Action
The fetus is affected by maternal alcohol consumptionthrough multiple mechanisms, including disruption ofneural proliferation and migration, decreased umbilical ar-tery blood flow, oxidative stress, hypoxia, and cell death[Lebel et al., 2011]. Continuous exposure to alcohol duringembryogenesis reduces the radial glial progenitor pool,which impacts on neural cell number [Rubert et al., 2006].Alcohol exposure induces apoptotic neurodegenerationduring synaptogenesis in mice and is believed to have thesame effect in humans [Ikonomidou et al., 2000; Olneyet al., 2002, 2004]. Thus, prenatal alcohol consumption pro-duces failures in the normal migration of radial cells fromwhich the rest of the brain cells eventually develop [Boscoand Diaz, 2012]. Minor changes in relative production ofprogenitors and neurons could produce dramatic changesin cortical surface area [Rakic, 2005] and could lead to adecreased number of radial columns and thus a reducedexpansion of the cerebral cortex [Chenn et al., 2002].
These processes are consistent with our observations ofg-SI reductions in the FAS and HE groups (surface reduc-tion) compared to the CTL children. The effects on g-SImay be attributable to a decrease in the number of neu-rons in alcohol-exposed children resulting from the mecha-nisms noted above, which could lead to a reduced buryingof the cortex at 9 years of age.
Our results also showed increased fold opening withincreasing alcohol exposure, which could reflect reductionsin tissue volume. Although brain atrophy is commonly
r De Guio et al. r
r 10 r

found in adult alcoholics [Garcia-Valdecasas-Campeloet al., 2007; Geibprasert et al., 2010], it can be reversible ifadult alcohol abuse is stopped [Geibprasert et al., 2010],whereas prenatal alcohol exposure causes irreversiblebrain damage. This global pattern of decreasing g-SI andsulcal depth with an increase in fold opening has alsobeen found in aging [Kochunov et al., 2005; Liu et al.,2010], but the underlying mechanisms may differ, withneurodegenerative diseases in aging and developmentalabnormalities in infancy and childhood although neuronalloss is common to both.
Limitations of the Study
From a methodological point a view, it was advanta-geous that the age range in this sample was narrow asbrain size and cortical thickness change during develop-ment. However, given this homogeneity in age, our con-clusions regarding reduced sulcal indices and increasedfold opening may be limited to exposed school-age chil-dren within the age range studied. It will be interesting toexamine the effects on cortical folding during adolescencewhen extensive synaptic pruning is observed in CTL chil-dren. In addition, little is known about anatomical deficitsin the brains of adults exposed to alcohol in utero.
Several brain regions were examined in this study, butthe results on other medial regions were not reportedowing to poor labeling or segmentation of the folds.Future studies should focus on these sulci as the corpuscallosum is known to be affected in FASD, as is cingulategyrus [Bjorkquist et al., 2010].
This study used morphological tools to evaluate anatom-ical differences associated with prenatal alcohol exposure,and future studies are needed to examine the relationshipof the observed structural malformations to the functionaldisabilities that are of primary concern in FASD.
CONCLUSIONS
This study used new morphological tools, which are dif-ferent from but complementary to the GM volumetry andcortical thickness measures used in prior studies, to pro-vide a more complete picture, both global and regional, ofthe teratogenic effects of alcohol exposure on brain devel-opment. Brains of alcohol-exposed children were globallyless folded than those of CTL children, after statisticaladjustment for potential confounders, an effect that wasdose dependent. Among the cortical morphology indices,fold opening was the most sensitive biomarker of prenatalalcohol exposure, linking this exposure to an extensivewidening of sulci in the 9-year exposed children.
ACKNOWLEDGMENTS
The authors thank the dysmorphologists H.E. Hoyme, L.K.Robinson, and N. Khaole, who performed the FAS
dysmorphology examinations of the children; M.-L. de Vil-liers and N. Maroof, the radiographers at the Cape Univer-sities Brain Imaging Centre; M. September for her work onparticipant recruitment and retention; R. Sun for her workon processing the alcohol exposure data; and N.C. Dodgefor assistance with the data analysis. The authors alsoexpress their gratitude to the mothers and children whohave participated in the Cape Town Longitudinal Study.
REFERENCES
Archibald SL, Fennema-Notestine C, Gamst A, Riley EP, MattsonSN, Jernigan TL (2001): Brain dysmorphology in individualswith severe prenatal alcohol exposure. Dev Med Child Neurol43:148–154.
Astley SJ, Aylward EH, Olson HC, Kerns K, Brooks A, CogginsTE, Davies J, Dorn S, Gendler B, Jirikowic T, Kraegel P, Mara-villa K, Richards T (2009): Magnetic resonance imaging out-comes from a comprehensive magnetic resonance study ofchildren with fetal alcohol spectrum disorders. Alcohol ClinExp Res 33:1–19.
Bjorkquist OA, Fryer SL, Reiss AL, Mattson SN, Riley EP (2010):Cingulate gyrus morphology in children and adolescents withfetal alcohol spectrum disorders. Psychiatry Res 181:101–107.
Bosco C, Diaz E (2012): Placental hypoxia and foetal development ver-sus alcohol exposure in pregnancy. Alcohol Alcohol 47:109–117.
Cachia A, Paillere-Martinot ML, Galinowski A, Januel D, de Beau-repaire R, Bellivier F, Artiges E, Andoh J, Bartr�es-Faz D, Duch-esnay E, Riviere D, Plaze M, Mangin JF, Martinot JL (2008):Cortical folding abnormalities in schizophrenia patients withresistant auditory hallucinations. NeuroImage 39:927–935.
Carter RC, Jacobson JL, Sokol RJ, Duggan C, Avison MJ, JacobsonSW (2013): Prenatal alcohol exposure and moderating effectsof maternal nutrition on growth from birth through youngadulthood. Alcohol Clin Exp Res 37:452–462.
Chenn A, Walsh CA (2002): Regulation of cerebral cortical size bycontrol of cell cycle exit in neural precursors. Science 297:365–369.
Day NL, Leech SL, Richardson GA, Cornelius MD, Robles N,Larkby C (2002): Prenatal alcohol exposure predicts continueddeficits in offspring size at 14 years of age. Alcohol Clin ExpRes 26:1584–1591.
Eckstrand KL, Ding Z, Dodge NC, Cowan RL, Jacobson JL, Jacob-son SW, Avison MJ (2012): Persistent dose-dependent changesin brain structure in young adults with low-to-moderate alco-hol exposure in utero. Alcohol Clin Exp Res, 36:1892–1902.
Garcia-Valdecasas-Campelo E, Gonzales-Reimers E, Santolaria-Fer-nandez F, De La Vega MJ, Milena-Abril A, Sanchez-Perez MJ,Martinez-Riera A, Rodriguez-Rodriguez E (2007): Brain atro-phy in alcoholics: Relationships with alcohol intake; liver dis-ease; nutritional status, and inflammation. Alcohol Alcohol42:533–538.
Geibprasert S, Gallucci M, Krings T (2010): Alcohol-inducedchanges in the brain assessed by MRI and CT. Eur Radiol20:1492–1501.
Germanaud D, Lefevre J, Toro R, Fischer C, Dubois J, Hertz-Pan-nier L, Mangin JF (2012): Larger is twistier: Spectral analysis ofgyrification (SPANGY) applied to adult brain size polymor-phism. NeuroImage 63:1257–1272.
Hoyme HE, May PA, Kalberg WO, Kodituwakku P, Gossage JP,Trujillo PM, Buckley DG, Miller JH, Aragon AS, Khaole N,
r Cortical Morphology in Fetal Alcohol Spectrum Disorders r
r 11 r

Viljoen DL, Jones KL, Robinson LK (2005): A practical clinicalapproach to diagnosis of fetal alcohol spectrum disorders:Clarification of the 1996 Institute of Medicine criteria. Pedia-trics 115:39–47.
Ikonomidou C, Bittigau P, Ishimaru MJ, Wozniak DF, Koch C,Genz K, Price MT, Stefovska V, Horster F, Tenkova T, Dikra-nian K, Olney JW (2000): Ethanol-induced apoptotic neurode-generation and fetal alcohol syndrome. Science 287:1056–1060.
Im K, Lee JM, Lyttelton O, Kim SH, Evans AC, Kim SI (2008):Brain size and cortical structure in the adult human brain. Cer-ebral Cortex 18:2181–2191.
Jacobson SW, Chiodo LM, Jacobson JL, Sokol RJ (2002): Validity ofmaternal report of alcohol, cocaine, and smoking during preg-nancy in relation to infant neurobehavioral outcome. Pediatrics109:815–825.
Jacobson SW, Stanton ME, Molteno CD, Burden MJ, Fuller DS,Hoyme HE, Robinson LK, Khaole N, Jacobson JL (2008):Impaired eyeblink conditioning in children with fetal alcoholsyndrome. Alcohol Clin Exp Res 32:365–372.
Kochunov P, Mangin JF, Coyle T, Lancaster J, Thompson P, Riv-iere D, Cointepas Y, Schlosser A, Royall DR, Zilles K, Maz-ziotta J, Toga A, Fox PT (2005): Age-related morphologytrends of cortical sulci. Hum Brain Mapp 26:210–220.
Lebel C, Roussotte F, Sowell ER (2011): Imaging the impact of pre-natal alcohol exposure on the structure of the developinghuman brain. Neuropsychol Rev 21:102–118.
Li Z, Ma X, Peltier S, Hu X, Coles CD, Lynch ME (2008): Occipi-tal–temporal reduction and sustained visual attention deficit inprenatal alcohol exposed adults. Brain Imaging Behav 2:39–48.
Liu T, Wen W, Zhu W, Trollor J, Reppermund S, Crawford J, JinJS, Luo S, Brodaty H, Sachdev P (2010): The effects of age andsex on cortical sulci in the elderly. NeuroImage 51:19–27.
Mangin JF, Riviere D, Cachia A, Duchesnay E, Cointepas Y, Papa-dopoulos-Orfanos D, Scifo P, Ochiai T, Brunelle F, R�egis J(2004): A framework to study the cortical folding patterns.NeuroImage 23:S129–S138.
Mangin JF, Jouvent E, Cachia A (2010): In vivo measurement ofcortical morphology: Means and meanings. Curr Opin Neurol23:359–367.
May PA, Gossage JP, Marais AS, Adnams CM, Hoyme HE, JonesKL, Robinson LK, Khaole NC, Snell C, Kalberg WO, HendricksL, Brooke L, Stellvato C, Viljoen DL (2007): The epidemiologyof fetal alcohol syndrome and partial FAS in a South Africancommunity. Drug Alcohol Depend 88:259–271.
May PA, Gossage JP, Kalberg WO, Robinson LK, Buckley D, Man-ning M, Hoyme HE (2009): Prevalence and epidemiologic char-acteristics of FASD from various research methods with anemphasis on recent in-school studies. Dev Disabil Res Rev15:176–192.
Nardelli A, Lebel C, Rasmussen C, Andrew G, Beaulieu C (2011):Extensive and deep gray matter volume reductions in childrenand adolescents with fetal alcohol spectrum disorders. AlcoholClin Exp Res 35:1404–1417.
Norman AL, Crocker N, Mattson SN, Riley EP (2009): Neuroimag-ing and fetal alcohol spectrum disorders. Dev Disabil Res Rev15:209–217.
Olney JW, Tenkova T, Dikranian K, Qin YQ, Labruyere J, Ikonomi-dou C (2002): Ethanol-induced apoptic neurodegeneration in thedeveloping C57BL/6 mouse brain. Dev Brain Res 133:115–126.
Olney JW, Young C, Wozniak DF, Jevtovic-Todorovic V, Ikonomi-dou C (2004): Do pediatrics drugs cause developing neuronsto commit suicide? Trends Pharmacol Sci 25:135–139.
Penttila J, Cachia A, Martinot JL, Ringuenet D, Wessa M, Houe-nou J, Galinowski A, Bellivier F, Gallarda T, Duchesnay E,Artiges E, Leboyer M, Oli�e JP, Mangin JF, Paillere-MartinotML (2009): Cortical folding difference between patients withearly-onset and patients with intermediate-onset bipolar disor-der. Bipolar Disord 11:361–370.
Rakic P (2005): Less is more: Progenitor death and cortical size.Nat Neurosci 8:981–982.
Reiner P, Jouvent E, Duchesnay E, Cuingnet R, Mangin JF, Chabr-iat H (2012) : Sulcal span in Azheimer’s disease, amnestic mildcognitive impairment, and healthy controls. J Alzheimers Dis29:605–613.
Riviere D, Mangin JF, Papadopoulos-Orfanos D, Martinez JM,Frouin V, R�egis J (2002): Automatic recognition of cortical sulciof the human brain using a congregation of neural networks.Med Image Anal 6:77–92.
Rubert G, Minana R, Pascual M, Guerri C (2006): Ethanol expo-sure during embryogenesis decreases the radial glial progeni-tor pool and affects the generation of neurons and astrocytes. JNeurosci Res 84:483–496.
Sowell ER, Thompson PM, Mattson SN, Tessner KD, Jernigan TL,Riley EP, Toga EW (2002): Regional brain shape abnormalitiespersist into adolescence after heavy prenatal alcohol exposure.Cerebral Cortex 12:856–865.
Sowell ER, Mattson SN, Kan E, Thompson PM, Riley EP, TogaEW (2008): Abnormal cortical thickness and brain-behaviorcorrelation patterns in individuals with heavy prenatal alcoholexposure. Cerebral Cortex 18:136–144.
Spadoni AD, McGee CL, Fryer SL, Riley EP (2007). Neuroimagingand fetal alcohol spectrum disorders. Neurosci Biobehav Rev31:239–245.
Stratton K, Howe C, Battaglia F (1996): Fetal Alcohol Syndrome:Diagnosis, Epidemiology, Prevention, and Treatment. Wash-ington, DC: National Academy Press.
Toro R, Perron M, Pike B, Richer L, Veillette S, Pausova Z, Paus T(2008): Brain size and folding of the human cerebral cortex.Cerebral Cortex 18:2352–2357.
Yang Y, Phillips OR, Kan E, Sulik KK, Mattson SN, Riley EP,Jones KL, Adnams CM, May PA, O’Connor MJ, Narr KL,Sowell ER (2012a): Callosal thickness reductions relate to facialdysmorphology in fetal alcohol spectrum disorders. AlcoholClin Exp Res 36:798–806.
Yang Y, Roussotte F, Kan E, Sulik KK, Mattson SN, Riley EP,Jones KL, Adnams CM, May PA, O’Connor MJ, Narr KL,Sowell ER (2012b): Abnormal cortical thickness alterations infetal alcohol spectrum disorders and their relationships withfacial dysmorphology. Cerebral Cortex 22:1170–1179.
Zhou D, Lebel C, Lepage C, Rasmussen C, Evans A, Wyper K, PeiJ, Andrew G, Massey A, Massey D, Beaulieu C (2011). Devel-opmental cortical thinning in fetal alcohol spectrum disorders.NeuroImage 58:16–25.
r De Guio et al. r
r 12 r