A study in Spanish regions’ poverty: a new methodological perspective
21
Advances in Management & Applied Economics, vol.2, no.1, 2012, 163-183 ISSN: 1792-7544 (print version), 1792-7552 (online) International Scientific Press, 2012 A study in Spanish regions’ poverty: a new methodological perspective José L. Calvo Gonzalez 1 , Pedro Cortiñas Vázquez 2 and Cristina Sánchez Figueroa 3 Abstract The present article reviews poverty studies in Spanish Autonomous Communities using a new methodological approach. One of the main concerns in those studies is poverty concentration in specific Spanish Autonomous Communities. This can be the result of a bias due to use a unique national poverty line, since the circumstances of every family unit, specifically if it is poor or not, could be different depending on the Region it inhabited. In order to test this assertion we estimate a CHAID algorithm and CATPCA. The main conclusion of this analysis is that Spanish poverty is strongly influenced by regional differences. To correct this effect we define as Spanish poor households those that are, at the same time, under the national and regional poverty line. We call this group Real poverty. Finally, we calculate ten poverty indexes for this real poor population. The results show that it is no possible to categorize Spanish Autonomous Communities 1 UNED, Madrid, e-mail: [email protected] 2 UNED, Madrid, e-mail: [email protected] 3 UNED, Madrid, e-mail: [email protected] Article Info: Received : January 9, 2012. Revised : February 8, 2012 Published online : February 28, 2012
Transcript of A study in Spanish regions’ poverty: a new methodological perspective

Advances in Management & Applied Economics, vol.2, no.1, 2012, 163-183 ISSN: 1792-7544 (print version), 1792-7552 (online) International Scientific Press, 2012
A study in Spanish regions’ poverty:
a new methodological perspective
José L. Calvo Gonzalez1, Pedro Cortiñas Vázquez2
and Cristina Sánchez Figueroa3
Abstract
The present article reviews poverty studies in Spanish Autonomous Communities
using a new methodological approach. One of the main concerns in those studies
is poverty concentration in specific Spanish Autonomous Communities. This can
be the result of a bias due to use a unique national poverty line, since the
circumstances of every family unit, specifically if it is poor or not, could be
different depending on the Region it inhabited. In order to test this assertion we
estimate a CHAID algorithm and CATPCA. The main conclusion of this analysis
is that Spanish poverty is strongly influenced by regional differences. To correct
this effect we define as Spanish poor households those that are, at the same time,
under the national and regional poverty line. We call this group Real poverty.
Finally, we calculate ten poverty indexes for this real poor population. The results
show that it is no possible to categorize Spanish Autonomous Communities
1 UNED, Madrid, e-mail: [email protected] 2 UNED, Madrid, e-mail: [email protected] 3 UNED, Madrid, e-mail: [email protected] Article Info: Received : January 9, 2012. Revised : February 8, 2012 Published online : February 28, 2012

164 A study in Spanish regions’ poverty ...
depending on poverty indexes, since they do not configure a specific distribution
of those regions. On the contrary, every index establishes its own regional
ordering. Therefore, we should introduce regional adjustments in data and focus in
household characteristics –size, type, age, level of education…- to explain Spanish
poverty. The information comes from the Spanish Survey on Income and Living
Conditions (SILC) in 2008.
JEL classification numbers: I32, I31, C43
Keywords: Economic Poverty, Real poverty, indexes
1 Introduction
Poverty has been an important subject in Spanish economics studies. Some
of those researches have focused on regional differences (EECB Málaga
University [9]; [1-8, 10-15, 17]), showing a very heterogeneous behavior of
Spanish Autonomous Communities4, with some of them between the richest
European regions with low poverty rates and, at the same time, others in an
extreme situation with high poor population. This should confirm the existence of
place poverty in Spain [16, 18].
Numerous indexes have been employed to study the condition of poor
people. The most popular are Head count ratio (H); Income gap ratio (I); Poverty
gap ratio (HI); Percentage Contribution to Poverty (CPI); the Relative
Contribution to Poverty (CRI); Sen index (S); Gini Index (G); the family of Foster,
Green & Thorbecke (FGT); and Hagenaars index (HAG).
In a previous study, Calvo, Sánchez and Martínez [6] applied those indexes
to Spanish Autonomous Communities to obtain a multidimensional poverty index
4 From now on CC.AA.

Calvo, Cortiñas and Sánchez 165
to classify them. Using a national poverty line and a methodological combination
of factorial and cluster analysis we categorized Regions in three groups: the first
one composed by those in the best situation, with low poverty rates –Madrid,
Catalonia, the Basque Country and Navarra-; group two integrated by those
around national mean –Andalucía, Aragón, Asturias, Cantabria, Castilla & León,
Valencia, Galicia, Balearic Islands, La Rioja and Murcia-; and a third cluster with
Regions in difficulties, suffering from high poverty rates and
intensity –Extremadura, Castilla-La Mancha, Canary Islands and Ceuta and
Melilla-.
Our main concern with the method used in the preceding article was the
use of a unique poverty line. We suspected that poverty concentration in specific
Spanish regions could be the result of a bias due to the use of this national
measure, since the circumstances of every family unit, specifically if it is poor or
not, could be different depending on the Region it inhabited. If this is true, a new
methodological approach should be implemented to correct this bias.
The first step in this direction is to analyze the influence of location factors
in Spanish poverty. We estimate CHAID (Chi-squared Automatic Interaction
Detector) to obtain the main characteristics, other than rent, that can explain
household poverty. We find the best predictor is Region variable.
To extend the study of the relationships between poverty and different
variables we conduct a principal components categorical analysis (CATPCA).
This is a two steps categories’ reduction procedure: in the first one it generates a
weight of the analyzed variables; in the second it estimates a classic principal
components model. The main result is that poverty, region and household size
belong to the same factor. So, if we employ national poverty line we are
assimilating poverty to region due to regional income differences.
Since Spanish poverty studies are strongly conditioned by regional
differences, we propose a method to correct the heterogeneity they introduce. We
define as Spanish poor households those that are, at the same time, under the

166 A study in Spanish regions’ poverty ...
national and regional poverty line. We call this group Real poverty. Finally, we
calculate poverty indexes for this real poor population.
The idea behind this option is to remove the national/regional bias: if we
apply as the general criterion the national poverty line we would include some
households that are poor at national level but not at regional status. This is
important for the poorest regions; on the contrary, if we exclusively utilize the
regional poverty line we would consider as poor some family units that are not
under the national poverty line (not poor at national level). This is related to the
richest regions; but if we use the intersection of both criteria, national and regional
poverty lines, we attain the real poor, those households considered poor compared
to the rest of the nation and also measured up to their region.
The article presents the following structure: in its first epigraph we discuss
the general methodology and the data; the second one is devoted to describe the
heterogeneity of Spanish poverty by Autonomous Communities; section three
establishes the procedure we apply to “homogenize” those regions and how we
achieve the real poor using a double poverty line; the fourth section calculates
poverty indexes under this new criterion; finally epigraph five presents the main
conclusions of the study.
2 General methodology and data
Data come from the Survey on Income and Living Conditions (SILC) in
2008 (observations from 2007) conducted by the Spanish Statistics National
Institute (INE). The unit of analysis is the household. It works with a sample of
13,014 observations representing 16,580,451 Spanish families. It is significant at
regional level.
The variable we employ to attain poverty line is the income per unit of
equivalent consumption. In order to calculate it we select the total family’s

Calvo, Cortiñas and Sánchez 167
income5 and divide it by the number of members of the household using modified
OECD equivalence scales. Its formula is:
1 0,7( 1) 0,5h h he a m
with he the equivalent scale; ha the number of adults in h household; and hm
the number of children under 16 years.
We define poverty line following EUROSTAT criterion as 60 per cent of the
median of income per unit of equivalent consumption. Therefore, those families
whose income per unit of equivalent consumption is under the 60 per cent of the
distributional median have been classified as poor households.
3 Regional poverty in Spain
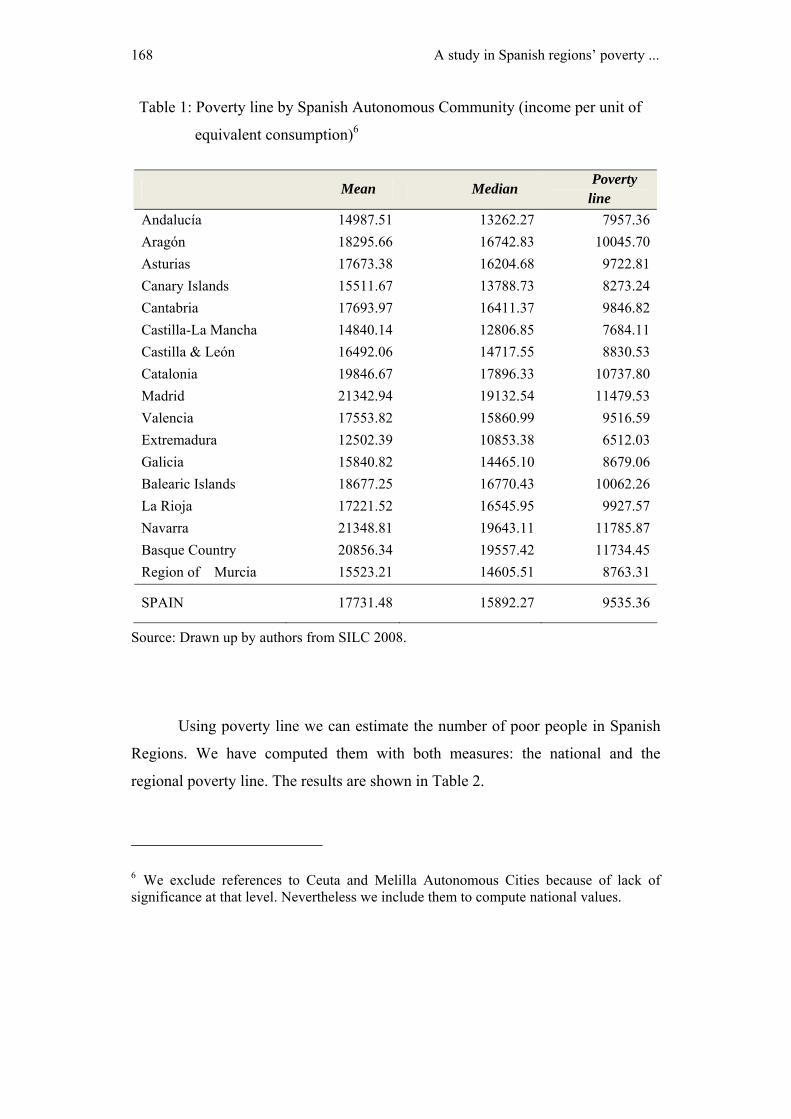
The Spanish poverty line was 9,535.36€ per year in 2008. Nevertheless, if
we disaggregate by CC.AA the poverty threshold differs depending on the region
considered. Table 1 shows the results.
Spanish Regions are very heterogeneous. Extremadura has the lowest
income per unit of equivalent consumption mean: 12,502.39€ per year, 70% of
Spanish mean. Under that mean are also Andalucía, Canary Islands, Region of
Murcia, Castilla-La Mancha, Castilla & León, Galicia or La Rioja. On the contrary,
Aragon, Balearic Islands, Catalonia, the Basque Country and especially Madrid
and Navarra have an income per unit of equivalent consumption mean higher than
the national one.
If we compute a specific poverty line for each region, column 3,
heterogeneity persists. So, poverty threshold ranks from 6,512€ per year in
Extremadura to 11,785€ in Navarra.
5 In Calvo, Martinez and Sánchez (2008, pp 107-116) we describe the methodology to calculate total household income as well as income per unit of equivalent consumption.
168 A study in Spanish regions’ poverty ...
Table 1: Poverty line by Spanish Autonomous Community (income per unit of
equivalent consumption)6
Mean Median Poverty
line
Andalucía 14987.51 13262.27 7957.36
Aragón 18295.66 16742.83 10045.70
Asturias 17673.38 16204.68 9722.81
Canary Islands 15511.67 13788.73 8273.24
Cantabria 17693.97 16411.37 9846.82
Castilla-La Mancha 14840.14 12806.85 7684.11
Castilla & León 16492.06 14717.55 8830.53
Catalonia 19846.67 17896.33 10737.80
Madrid 21342.94 19132.54 11479.53
Valencia 17553.82 15860.99 9516.59
Extremadura 12502.39 10853.38 6512.03
Galicia 15840.82 14465.10 8679.06
Balearic Islands 18677.25 16770.43 10062.26
La Rioja 17221.52 16545.95 9927.57
Navarra 21348.81 19643.11 11785.87
Basque Country 20856.34 19557.42 11734.45
Region of Murcia 15523.21 14605.51 8763.31
SPAIN 17731.48 15892.27 9535.36
Source: Drawn up by authors from SILC 2008.
Using poverty line we can estimate the number of poor people in Spanish
Regions. We have computed them with both measures: the national and the
regional poverty line. The results are shown in Table 2.
6 We exclude references to Ceuta and Melilla Autonomous Cities because of lack of significance at that level. Nevertheless we include them to compute national values.

Calvo, Cortiñas and Sánchez 169
Table 2: Poor population in Spanish Autonomous Communities. National and
regional poverty lines
National Poverty
line
Regional Poverty
lines
Poor Households Poor Households
Number (%) Number (%)
Difference
(1)–( 3)
Absolute
values
Difference
(3)/(1)
Percentage
Andalucía 626,401 25.7 368,358 16.8 258,043 41.19
Aragón 44,936 1.8 58,216 2.7 -13,28 -29.55
Asturias 39,326 1.6 43,628 2.0 -4,302 -10.94
Canary Islands 150,745 6.2 95,859 4.4 54,886 36.41
Cantabria 21,704 0.9 25,879 1.2 -4,175 -19.24
Castilla-La Mancha
177,215 7.3 78,379 3.6 98,836 55.77
Castilla & León 164,246 6.7 132,332 6.0 31,914 19.43
Catalonia 258,766 10.6 382,328 17.5 -123,562 -47.75
Madrid 170,345 7.0 315,122 14.4 -144,777 -84.99
Valencia 240,128 9.9 236,222 10.8 3,906 1.63
Extremadura 149,579 6.1 43,531 2.0 106,048 70.90
Galicia 162,497 6.7 124,552 5.7 37,945 23.35
Balearic Islands 54,114 2.2 62,934 2.9 -8,82 -16.30
La Rioja 18,199 0.7 19,063 0.9 -0,864 -4.75
Navarra 13,102 0.5 24,742 1.1 -11,64 -88.84
Basque Country 46,799 1.9 91,925 4.2 -45,126 -96.43
Region of Murcia
86,347 3.5 75,456 3.4 10,891 12.61
SPAIN 2,434,983 100.0 2,188,988 100.0 245,995 10.10
Source: Drawn up by authors from SILC 2008
There are big differences depending on the poverty line considered. The
most relevant, in absolute values, are related to Andalucía, where poor households
reduce in more than a quarter of a million when regional threshold is employed

170 A study in Spanish regions’ poverty ...
instead of national one, and Catalonia and Madrid, where poor increase by more
than 100,000 employing the same method.
In percentage terms the changes are still more important. Extremadura
decreases its poor families by 71% if we take into account the regional poverty
line instead of the national one; on the contrary, Navarra, the Basque Country and
Madrid increase their poor population by more than 80%.
The problem with using a national poverty line is we do not consider the
circumstances of every family unit could be different depending on the Region,
biasing the results. We do not have a regional price index7 to normalize income,
but we suspect the cost of living differs between CC.AA. If this is true, the use of a
unique poverty boundary translates into considering a “misleading poor
distribution”: we regard as deprived some households that are not poor if we
employ a regional line –those with a positive value in columns 5 and 6 of Table 2-
and the contrary –the negative values.
4 Is Region affecting Spanish poor categorization?
In order to test this assertion we apply a CHAID algorithm and CATPCA.
Chi-squared Automatic Interaction Detector analyses other variables rather than
income to explain poverty. The objective is to find the most influent
characteristics on poverty excluded the defining variable (income).
We classify households depending on their main variables: type of
household, number of members, household economic activity situation, main
family member level of studies, the size of the municipality their live and region.
Table 3 shows the first two cataloging levels.
7 At least is not public in Spain. We are working on developing some kind.

Calvo, Cortiñas and Sánchez 171
Table 3: CHAID analysis
Level 1 Variables Level 1 values Level 2 variables
Region Andalucía Household economic activity situation
Region Aragón Main household member level of
studies
Region Asturias Size of municipality
Region Canary Islands Type of household
Region Cantabria Type of household
Region Castilla y león Type of household
Region Castilla-La Mancha Type of household
Region Catalonia Type of household
Region Comunidad de Madrid Number of members
Region Comunidad Valenciana Type of household
Region Extremadura Household economic activity situation
Region Galicia Main household member level of
studies
Region Balearic Islands Type of household
Region La Rioja Type of household
Region Navarra Type of household
Region Basque Country Household economic activity situation
Region Region of Murcia Type of household
Once we have discovered the main variable to explain poverty (other than
income) is Region we want to find why. Then, we conduct a CATPCA analysis in
order to determine the relationship between poverty and the rest of variables. This
is a two steps categories’ reduction method: in the first one it generates weights to
the variables; and in the second one it applies a principal components analysis.
The results are presented in Table 4 and Figure 1.
With this method we uncover two dimensions: the first one incorporates
number of members, the type of household, the situations of its members related
to economic activity and the level of studies; the second one aggregates the size of
the municipality, region and poverty (measured as a dummy variable: 1 if the

172 A study in Spanish regions’ poverty ...
household is poor and 0 otherwise).
Table 4: CATPCA analysis
Dimension 1 Dimension 2
household economic activity situation .821 -.028
main family member level of studies .488 -.399
Region (CC.AA.) -.061 .768
Number of members .840 .269
Poverty dummy -.071 .500
Size of municipality -.118 .788
Type of household .938 .177
Source: Drawn up by authors
Table 5: Households’ distribution depending on regional and national poverty lines.
Regional Level Poverty line: less than 60 per cent of CC.AA median of income per unit of equivalent consumption
Households whose income is under the poverty line
Households whose income surpass the poverty line
Households whose income is under the poverty line
REAL POVERTY
1,831,017
Households considered poor at national level but
not at regional status
603,967
Nacional Level Poverty line: less than 60 per cent of national median of income per unit of equivalent consumption
Households whose income surpass the poverty line
Households not considered poor at
national level but poor at regional status
357,972
NOT POOR
Source: Drawn up by authors from SILC 2008

Calvo, Cortiñas and Sánchez 173
Figure 1: CATPCA analysis
Figure 2: Real poverty
Size of municipality
Region
Poverty dummy
Number of members
Type of household
Household situation
Level of studies

174 A study in Spanish regions’ poverty ...
Table 6: Real Poverty by Autonomous Communities
Real Poverty Poor Households
(number) Poor Households
(number)
Andalucía 368,358 20.1
Aragón 44,936 2.5
Asturias 39,326 2.1
Canary Islands 95,859 5.2
Cantabria 21,704 1.2
Castilla-La Mancha 78,379 4.3
Castilla & León 132,332 7.2
Catalonia 258,766 14.1
Madrid 170,345 9.3
Valencia 236,222 12.9
Extremadura 43,531 2.4
Galicia 124,552 6.8
Balearic Islands 54,114 3.0
La Rioja 18,199 1.0
Navarra 13,102 0.7
Basque Country 46,799 2.6
Region of Murcia 75,456 4.1
SPAIN 1,831,017 100.0
Source: Drawn up by authors from SILC 2008
Therefore, we can conclude that Spanish poverty classification is strongly
affected by differences between Autonomous Communities. Consequently, a

Calvo, Cortiñas and Sánchez 175
measure of Spanish relative poverty should take into account regional diversity.
If we combine national and regional poverty lines we can examine all
households’ possibilities. Table 3 and Figure 2 describe them showing the
distribution of Spanish families from SILC 2008.
• A : Poor people at national level but not poor at regional level Related
to Regions with poverty line under National poverty line
• B : Poor people at regional level but not poor at regional level Related
to Regions with poverty line over National poverty line
2,434,983 Spanish households were under the national poverty line in 2008.
From this group 603,967 are considered not poor if we employ the regional
poverty threshold. They come from the most disadvantaged Spanish regions:
Extremadura, Canary Islands… For example, Andalucía’s families with income
per unit of equivalent consumption between 7,957.36€ and 9,535.36€ per year
belong to that faction.
On the other side, 2,188,988 Spanish families were poor if we only take
into account regional poverty lines. From them 357,972 can be excluded if we add
national threshold. They reside in the most developed Spanish Communities:
Madrid, Catalonia, the Basque Country or Navarra. A Navarra’s household with
an income smaller than 11,785€ and bigger than 9,535.36€ per year fits in this
group.
If we take into account both criterions then only 1,831,017 can be
categorized as Real Poor: those that are under national and regional poverty lines.
They are poor in a double sense: compared to the rest of national households and
also related to their regional counterpart. Table 6 presents this population
distributed by CC.AA.

176 A study in Spanish regions’ poverty ...
5 Poverty indexes
In this section we present the results for different indexes calculated for
real poor population in Spanish Regions. Since Real Poverty includes both
national and regional poverty threshold, we should use one or another depending
on the circumstances8. The indexes are the following:
- Head Count Ratio (H)
- Income Gap Ratio (I):
- Poverty Gap Ratio (HI):
- Percentage Contribution to Poverty (CPI)
- Relative Contribution to Poverty (CRI)
- Gini’s coefficient
- Sen’s index (S)
- Foster, Green & Thorbecke’s Indexes (FGT)
- Hagenaars‘ index (HAG)
The results for real poverty households are included in Tables 7 and 8.
The first index (H) specifies the share of poor people in total population.
We can classify CC.AA in three groups depending on this indicator: the first one
is integrated by those Communities with poverty rates bigger than the mean:
Region of Murcia, La Rioja, Castilla & León, Balearic and Canary Islands,
Andalucía, Valencia and Galicia; in the second group we can aggregate those
around the Spanish mean: Castilla-La Mancha, Extremadura and Cantabria; finally
the third one is composed by the most developed Spanish regions: the Basque
Country, Navarra, Madrid, Aragón, Catalonia and Asturias, where the rate of poor
population is smaller than Spanish average. Figure 2 sorts Spanish Communities
based on this index.
8 We do not include the way indexes are computed because of lack of space. They are disposable upon request.

Calvo, Cortiñas and Sánchez 177
The Income Gap Ration (I) completely changes the order of Communities
since it modifies the approach, emphasizing poverty intensity. With values over
0.34 (the mean is 0.336) are Asturias, La Rioja, the Basque Country and Castilla
& León. On the contrary, Madrid, Balearic and Canary Islands, Cantabria and
Valencia reach values smaller than 0.23.
Table 7: Real Poor Households: Poverty Indexes I
H I H*I CPI CRI
Andalucía 0.131 0.394 0.052 0.216 1.275
Aragón 0.089 0.236 0.021 0.023 0.763
Asturias 0.096 0.210 0.020 0.017 0.680
Canary Islands 0.133 0.252 0.034 0.035 0.816
Cantabria 0.106 0.240 0.026 0.010 0.778
Castilla-La
Mancha 0.114 0.342 0.039 0.046 1.107
Castilla & León 0.138 0.220 0.030 0.041 0.713
Catalonia 0.095 0.336 0.032 0.179 1.088
Madrid 0.077 0.336 0.026 0.146 1.087
Valencia 0.127 0.260 0.033 0.094 0.840
Extremadura 0.112 0.253 0.028 0.019 0.818
Galicia 0.126 0.223 0.028 0.043 0.722
Balearic Islands 0.133 0.269 0.036 0.021 0.871
La Rioja 0.153 0.220 0.034 0.005 0.713
Navarra 0.059 0.217 0.013 0.009 0.702
Basque Country 0.056 0.416 0.023 0.068 1.347
Region of Murcia 0.157 0.375 0.059 0.035 1.215
SPAIN 0.110 0.309 0.034 1.000 1.000
Source: Drawn up by the authors from ECV 2008
The Poverty Gap Ratio (HI) is the first one to be sensitive to both the share
of poor households in Spanish population and the degree of poverty. The regions

178 A study in Spanish regions’ poverty ...
with the highest index –in the worst situation in terms of poverty- are the Region
of Murcia, Andalucía and Castilla-La Mancha; the best positioned Navarra,
Asturias, Aragón and the Basque Country.
The Percentage Contribution to Poverty (CPI) indicates the share of each
Community in total poor households. In this case we can observe that Andalucía
contributes with more than 20 per cent; Catalonia with almost 18 and Madrid with
more than 14. On the other side La Rioja and Navarra add less than 1 per cent.
Finally, the Relative Contribution to Poverty (CRI) shows if a Community
is over or underrepresented. If CRI is bigger than 1 then the affected Community
is in a worsen situation than Spain as a whole; on the contrary, if the value is
smaller than 1 the Community is better off. Once more the index changes the
classification. The Basque Country, Andalucía, Murcia, Castilla-La Mancha,
Catalonia and Madrid are overrepresented. The rest of the Communities are
underrepresented, especially Asturias and Navarra.
Gini’s coefficient is a measure of inequality. If G=0 the equality between the
poor is maximum. In this case S = HI. On the contrary, if G=1 then poor people
are unequally distributed and S =H.
The categorization of Spanish Communities is again modified. Those where
the poor are more unequally distributed are Balearic Islands, Extremadura and the
Basque Country, all of them over the national mean (0.165); on the contrary, the
equality between poor households is the highest in Madrid (0.109).
Sen Index combines information about the poor (number and distribution),
the degree of poverty and inequality (Gini’s coefficient). Then, it is a good
approach to measure the real problems related to poverty and the situation of poor
families. The position worsens with higher values of the index. The Region of
Murcia, Andalucía, La Rioja, Castilla-La Mancha and Balearic Islands reach the
worst values, with indexes well above or close to 0.15. On the other side of the
distribution, with the smallest rates, are the Basque Country, Navarra, Aragón and
Madrid.

Calvo, Cortiñas and Sánchez 179
The family of Foster, Green & Thorbecke indexes takes into account the
relative distance to poverty line. Then, when poverty aversion parameter increases
(α) the relevance attributed to poorest households augments.
Table 8: Real Poor Households: Poverty Indexes II
G S FGT3 FGT4 HAG
Andalucía 0.162 0.064 0.089 0.453 0.006
Aragón 0.150 0.031 0.011 0.009 0.004
Asturias 0.165 0.033 0.009 0.005 0.003
Canary Islands 0.133 0.047 0.018 0.015 0.005
Cantabria 0.145 0.037 0.012 0.008 0.003
Castilla-La Mancha 0.147 0.050 0.035 0.058 0.002
Castilla & León 0.156 0.047 0.014 0.008 0.007
Catalonia 0.163 0.042 0.025 0.037 0.004
Madrid 0.109 0.031 0.036 0.128 0.002
Valencia 0.143 0.046 0.020 0.026 0.004
Extremadura 0.199 0.045 0.014 0.010 0.005
Galicia 0.128 0.041 0.012 0.007 0.004
Balearic Islands 0.207 0.056 0.025 0.036 0.005
La Rioja 0.156 0.052 0.017 0.016 0.005
Navarra 0.139 0.019 0.005 0.002 0.002
Basque Country 0.170 0.029 0.026 0.046 0.002
Region of Murcia 0.162 0.075 0.034 0.025 0.008
SPAIN 0.165 0.047 0.034 0.112 0.004
Source: Drawn up by the authors from ECV 2008
FGT3 and FGT4 present very similar results. In both cases the biggest
poverty problems are concentrated in Andalucía, where the ratio more than
doubles the national mean. It looks like in this Spanish region poverty is a really
important problem, since the amount of poor population and poverty deepness are
the highest. Madrid and Castilla-La Mancha are close to the mean and the rest

180 A study in Spanish regions’ poverty ...
have smaller indexes, especially Navarra and Asturias.
Finally Hagenaars index considers the share of the poor in total population
as well as an aggregate measure of poverty intensity. Communities’ distribution
again changes with Region of Murcia, Castilla & León and Andalucía well over
the national mean; La Rioja, Balearic and Canary Islands and Extremadura also
bigger than the national value and Castilla-La Mancha, Madrid, Navarra and the
Basque Country with the lowest ratios.
6 Conclusion
In previous studies we analyzed the characteristics of Spanish poverty and
discover that regional variables were very important. In fact, we could categorize
Spanish regions in different clusters depending on the number of poor people and
poverty intensity.
Nevertheless, we suspected that those results were biased because of the use
a unique national poverty line, since the circumstances of every family should be
different contingent to the region it resides.
In this article we have tested this assertion. To do that we, first, have
introduced a CHAID algorithm and CATPCA analysis; afterwards, and based on
the results showing that region is very correlated to poverty –measured by income-,
we have selected the Real Poor in order to correct this bias: those households that
are, at the same time, under the national and regional poverty line.
1,831,017 Spanish families can be classified as real poor following that
double criterion. We have calculated ten poverty indexes for that population.
Spanish regions cannot anymore be categorized on clusters depending on
poverty indexes computed to poor. There is no a concrete regional distribution to
apply factorial and cluster analysis.
Therefore, we should correct data by regional factors and look for the

Calvo, Cortiñas and Sánchez 181
reasons to explain Spanish poverty in household’s characteristics –sex, age, level
of education, type of family, size, economic situation…- rather than in locational
aspects. And Spanish and EU social policy should concentrate in those factors.
References
[1] L. Ayala, A. Jurado and J. Pérez-Mayo, Pobreza y privación: un análisis
regional. Universidad de Extremadura, Instituto de Estudios Fiscales y
Universidad Rey Juan Carlos (mimeo), (2006A).
[2] L. Ayala, A. Jurado and J. Pérez-Mayo, Pobreza monetaria y privación
multidimensional: ¿qué explica el análisis territorial? Universidad de
Extremadura, Instituto de Estudios Fiscales y Universidad Rey Juan Carlos,
(2006B).
http://www.ual.es/congresos/docs/Distribucion/Distribucion%204/Ayala%20Jurado.
[3] L. Ayala, A. Jurado and J. Pérez-Mayo, Income Poverty and
Multidimensional Deprivation: lessons from Cross-Regional Analysis,
Review of Income and Wealth, (2010).
[4] L. Ayala, A. Jurado and F. Pedraja, Desigualdad y bienestar en la
distribución interterritorial de la renta, 1973-2000, Investigaciones
Regionales, 8, (2006), 5-30.
[5] J.L Calvo, J.A. Martínez and C. Sánchez, Evaluación de las condiciones de
vida de la población pobre en España. Un análisis comparativo del Informe
FOESSA 1998 y la ECV 2005. Ministry of Labor and Immigration, State
Secretary for Social Security, FIPROS Project, (2009).
[6] J.L Calvo, J.A. Martínez and C. Sánchez, Poverty in Spain: A regional
analysis, Studio Regionals Polish Academy of Sciences, Committee for
Spatial Economy and Regional Planning, Presentada en el 49º Congreso de la
ERSA. 25-29 de agosto, Lodz, Polonia, 23, (2009), 101-118.

182 A study in Spanish regions’ poverty ...
[7] J.L. Calvo, C. Sánchez and P. Cortiñas, Changes in the characteristics of
Spanish poor households: the case of Imputed Rent, Presentado en el 50º
Congreso de la ERSA, 19 al 23 de agosto, Jönköping, Suecia, (2010).
[8] J.L. Calvo, C. Sánchez and P. Cortiñas, Joint estimation of the characteristics
and intensity of poverty in Spain: The case of Imputed Rent, Economics
Research International, 2010, Article ID 854634, 17 pages, (2010),
doi:10.1155/2010/854634.
[9] ECB- Equipo de Economía Cuantitativa del Bienestar de la Universidad de
Málaga, La riqueza y la pobreza bajo una perspectiva regional,
Documentación social, 76, Madrid, (1989).
[10] A. García Linaza, G. Martín Reyes, La distribución territorial de la pobreza
en España, chapter 2º del V Informe FOESSA, Madrid, (1993).
[11] O. García-Luque, M. Lafuente and U. Faura, Disparidad territorial de la
pobreza dinámica en España, Estudios de Economía Aplicada, 27-2, (2009),
417-436.
[12] A. Jurado and J. Pérez-Mayo, Aproximación a un índice de bienestar
económico multidimensional para las CC.AA. españolas, Universidad de
Extremadura, (2006), http://economiapublica.com/ponencias/3.11.pdf
[13] A. Jurado and J. Pérez-Mayo, La dimensión territorial de la pobreza, Revista
Española del Tercer Sector, 15, (2010).
[14] C. Navarro and L. Ayala, La exclusión en vivienda en España: una
aproximación a través de índices multidimensionales de privación,
Conference in IX Encuentro de Economía Pública, Barcelona, (2004).
http://www.ub.es/ecopubBCN/ponencias/arch_pdf/navarro_ayala.pdf
[15] J. Pérez-Mayo, Un análisis multinivel de la distribución regional del riesgo
de pobreza en España, Documento presentado al International Meeting on
Regional Science, The Future of the Cohesion Policy, 7º Workshop,
Badajoz-Elvas, (17-19 Noviembre, 2010).

Calvo, Cortiñas and Sánchez 183
[16] M. Powell, G. Boyne and R. Ashworth, Towards a Geography of People
Poverty and Place Poverty, Policy and Politics, 29(3), (2001), 243-258.
[17] C. Poza Lara, Pobreza multidimensional: el caso específico español a través
del Panel de Hogares de la Unión Europea, Doctoral Dissertation,
Universidad Complutense de Madrid, 2007.
[18] D.M. Smith, Human Geography: a Welfare Approach, Edward Arnold,
Londres, 1977.