A spectroscopy approach for the study of the interactions of bioactive vanadium species with bovine...
10
This article appeared in a journal published by Elsevier. The attached copy is furnished to the author for internal non-commercial research and education use, including for instruction at the authors institution and sharing with colleagues. Other uses, including reproduction and distribution, or selling or licensing copies, or posting to personal, institutional or third party websites are prohibited. In most cases authors are permitted to post their version of the article (e.g. in Word or Tex form) to their personal website or institutional repository. Authors requiring further information regarding Elsevier’s archiving and manuscript policies are encouraged to visit: http://www.elsevier.com/copyright
-
Upload
independent -
Category
Documents
-
view
1 -
download
0
Transcript of A spectroscopy approach for the study of the interactions of bioactive vanadium species with bovine...
This article appeared in a journal published by Elsevier. The attachedcopy is furnished to the author for internal non-commercial researchand education use, including for instruction at the authors institution
and sharing with colleagues.
Other uses, including reproduction and distribution, or selling orlicensing copies, or posting to personal, institutional or third party
websites are prohibited.
In most cases authors are permitted to post their version of thearticle (e.g. in Word or Tex form) to their personal website orinstitutional repository. Authors requiring further information
regarding Elsevier’s archiving and manuscript policies areencouraged to visit:
http://www.elsevier.com/copyright
Author's personal copy
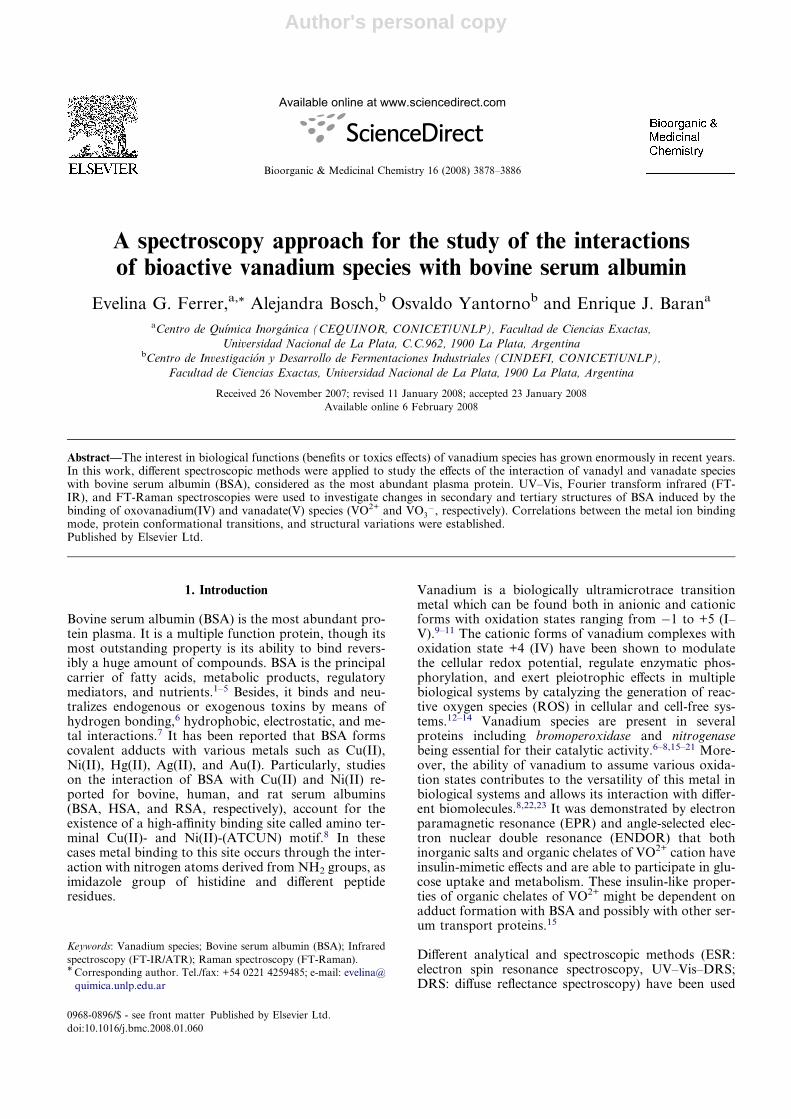
A spectroscopy approach for the study of the interactionsof bioactive vanadium species with bovine serum albumin
Evelina G. Ferrer,a,* Alejandra Bosch,b Osvaldo Yantornob and Enrique J. Barana
aCentro de Quımica Inorganica (CEQUINOR, CONICET/UNLP), Facultad de Ciencias Exactas,
Universidad Nacional de La Plata, C.C.962, 1900 La Plata, ArgentinabCentro de Investigacion y Desarrollo de Fermentaciones Industriales (CINDEFI, CONICET/UNLP),
Facultad de Ciencias Exactas, Universidad Nacional de La Plata, 1900 La Plata, Argentina
Received 26 November 2007; revised 11 January 2008; accepted 23 January 2008
Available online 6 February 2008
Abstract—The interest in biological functions (benefits or toxics effects) of vanadium species has grown enormously in recent years.In this work, different spectroscopic methods were applied to study the effects of the interaction of vanadyl and vanadate specieswith bovine serum albumin (BSA), considered as the most abundant plasma protein. UV–Vis, Fourier transform infrared (FT-IR), and FT-Raman spectroscopies were used to investigate changes in secondary and tertiary structures of BSA induced by thebinding of oxovanadium(IV) and vanadate(V) species (VO2+ and VO3
�, respectively). Correlations between the metal ion bindingmode, protein conformational transitions, and structural variations were established.Published by Elsevier Ltd.
1. Introduction
Bovine serum albumin (BSA) is the most abundant pro-tein plasma. It is a multiple function protein, though itsmost outstanding property is its ability to bind revers-ibly a huge amount of compounds. BSA is the principalcarrier of fatty acids, metabolic products, regulatorymediators, and nutrients.1–5 Besides, it binds and neu-tralizes endogenous or exogenous toxins by means ofhydrogen bonding,6 hydrophobic, electrostatic, and me-tal interactions.7 It has been reported that BSA formscovalent adducts with various metals such as Cu(II),Ni(II), Hg(II), Ag(II), and Au(I). Particularly, studieson the interaction of BSA with Cu(II) and Ni(II) re-ported for bovine, human, and rat serum albumins(BSA, HSA, and RSA, respectively), account for theexistence of a high-affinity binding site called amino ter-minal Cu(II)- and Ni(II)-(ATCUN) motif.8 In thesecases metal binding to this site occurs through the inter-action with nitrogen atoms derived from NH2 groups, asimidazole group of histidine and different peptideresidues.
Vanadium is a biologically ultramicrotrace transitionmetal which can be found both in anionic and cationicforms with oxidation states ranging from �1 to +5 (I–V).9–11 The cationic forms of vanadium complexes withoxidation state +4 (IV) have been shown to modulatethe cellular redox potential, regulate enzymatic phos-phorylation, and exert pleiotrophic effects in multiplebiological systems by catalyzing the generation of reac-tive oxygen species (ROS) in cellular and cell-free sys-tems.12–14 Vanadium species are present in severalproteins including bromoperoxidase and nitrogenasebeing essential for their catalytic activity.6–8,15–21 More-over, the ability of vanadium to assume various oxida-tion states contributes to the versatility of this metal inbiological systems and allows its interaction with differ-ent biomolecules.8,22,23 It was demonstrated by electronparamagnetic resonance (EPR) and angle-selected elec-tron nuclear double resonance (ENDOR) that bothinorganic salts and organic chelates of VO2+ cation haveinsulin-mimetic effects and are able to participate in glu-cose uptake and metabolism. These insulin-like proper-ties of organic chelates of VO2+ might be dependent onadduct formation with BSA and possibly with other ser-um transport proteins.15
Different analytical and spectroscopic methods (ESR:electron spin resonance spectroscopy, UV–Vis–DRS;DRS: diffuse reflectance spectroscopy) have been used
0968-0896/$ - see front matter Published by Elsevier Ltd.
doi:10.1016/j.bmc.2008.01.060
Keywords: Vanadium species; Bovine serum albumin (BSA); Infrared
spectroscopy (FT-IR/ATR); Raman spectroscopy (FT-Raman).* Corresponding author. Tel./fax: +54 0221 4259485; e-mail: evelina@
quimica.unlp.edu.ar
Available online at www.sciencedirect.com
Bioorganic & Medicinal Chemistry 16 (2008) 3878–3886
Author's personal copy
to study the interaction of vanadium species with HSA,BSA, or with transferrin protein. Nevertheless, themechanisms by which they interact with biological mol-ecules have not been clearly elucidated yet.21,24–27 In re-cent years, Fourier transform infrared spectroscopy(FT-IR) and FT-Raman spectroscopy have been widelyused as a tool to monitor chemical structure changes ofpolypeptides and proteins, particularly they were ap-plied to determine protein secondary structure modifica-tions in both aqueous and non-aqueous solutions.28–34
Since non-polar groups give intense absorbances in Ra-man spectra, and polar groups cause high-absorptionpeaks in FT-IR spectroscopy; the use of both spectro-scopic techniques in a complementary fashion, can pro-vide important and complete information.35 FT-IRspectroscopy has the advantage of giving higher sig-nal-to-noise ratio, while FT-Raman can provide addi-tional information on the tertiary structure of proteinsand the microenvironment of protein side chains.29,30
An important difference to remark between these tech-niques is that the O–H stretching vibration is very strongin IR, but very weak in Raman spectra. For this reason,water is practically ‘invisible’ in Raman spectroscopy,while it dominates the IR spectrum, if present. Due tothis fact, Raman scattering has the advantage of allow-ing the study of protein structure in situ. Both tech-niques in cooperation have enabled the understandingand monitoring of structural changes produced in pro-teins under the influence of diverse environmental condi-tions or different processes such as mixing, aeration,thermal treatments, aggregation and gelation, bufferconditions, incorporation of chaotropic salts, proteinstructure perturbants (dithiothreitol, ethylene glycol,dodecylsulfate), and coordination of ligands such asmetals and organometallic compounds.28,33,35–39 IRspectroscopy of biological samples has been widelyimplemented with the attenuated total reflection(ATR) technique.40,41 For FT-IR/ATR measurements,the sample is placed on the surface of a trapezoidal-shaped IR-transparent crystal. The IR beam is guidedthrough the crystal in such a way that some total reflec-tions take place at the surface. The penetration depth ofthe IR radiation in this arrangement is of a few microm-eters. Therefore, the IR spectrum obtained contains onlyinformation about the very thin layer of the sample thatis in close proximity to the surface of the crystal. Thus,by means of this technique it is possible to obtain a spec-trum of a protein in H2O or buffer solution withoutmuch interference from IR absorption of the bulkwater.33
In this paper, we investigate the ability of vanadate andvanadyl ions to produce conformational changes in na-tive BSA in Tris–HCl buffer solutions at physiologicalpH. For these purposes, FT-IR/ATR, FT-Raman, andUV–Vis spectroscopic techniques have been used. Aquantitative analysis is provided of each conformationalcomponent such as a-helix, b-sheet, turns, and randomcoil structures for BSA, and the corresponding vana-dium complexes. Our work attempts to give the basisfor the understanding of BSA/vanadium interactionswhich might provide significant insights into structuralfeatures, critical to biological functions. Since most
studies of metals binding to proteins focus on the metalcoordination and not metal-induced perturbations ofthe protein structure, this study could serve as an exam-ple of complementary data that could be obtained whenthe binding of metal ions to proteins is studied.
2. Results and discussion
2.1. FTIR and UV–Vis spectroscopies
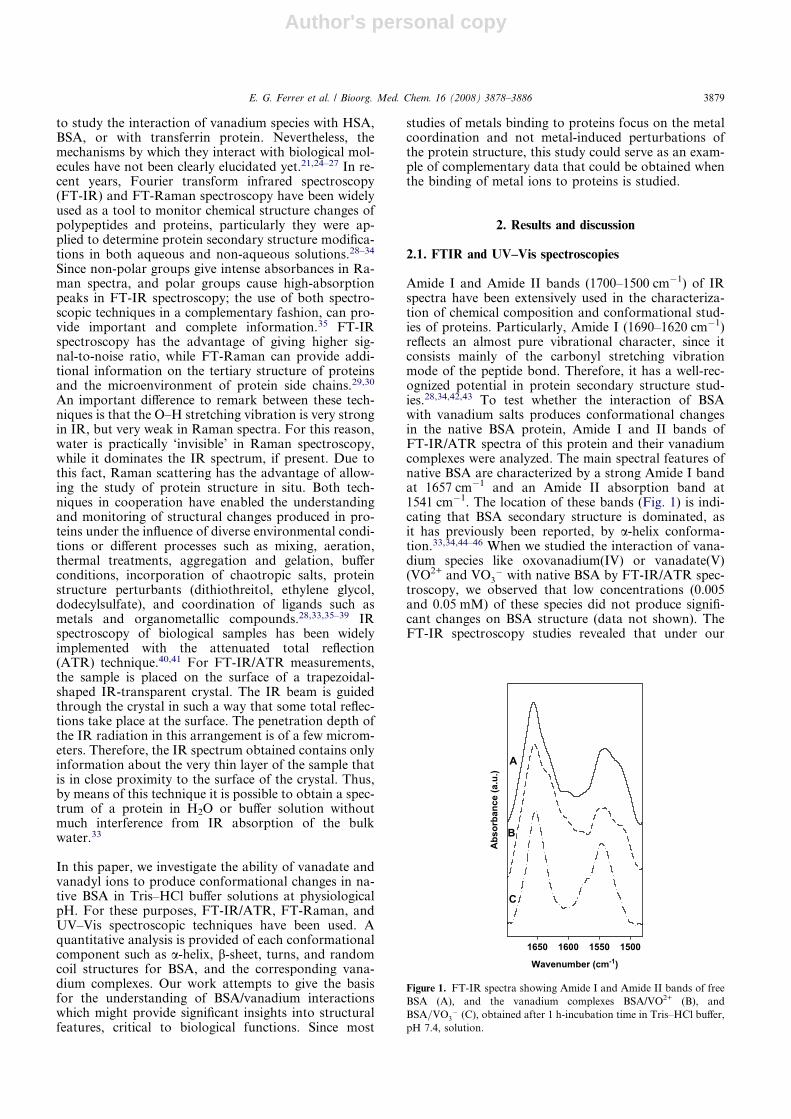
Amide I and Amide II bands (1700–1500 cm�1) of IRspectra have been extensively used in the characteriza-tion of chemical composition and conformational stud-ies of proteins. Particularly, Amide I (1690–1620 cm�1)reflects an almost pure vibrational character, since itconsists mainly of the carbonyl stretching vibrationmode of the peptide bond. Therefore, it has a well-rec-ognized potential in protein secondary structure stud-ies.28,34,42,43 To test whether the interaction of BSAwith vanadium salts produces conformational changesin the native BSA protein, Amide I and II bands ofFT-IR/ATR spectra of this protein and their vanadiumcomplexes were analyzed. The main spectral features ofnative BSA are characterized by a strong Amide I bandat 1657 cm�1 and an Amide II absorption band at1541 cm�1. The location of these bands (Fig. 1) is indi-cating that BSA secondary structure is dominated, asit has previously been reported, by a-helix conforma-tion.33,34,44–46 When we studied the interaction of vana-dium species like oxovanadium(IV) or vanadate(V)(VO2+ and VO3
� with native BSA by FT-IR/ATR spec-troscopy, we observed that low concentrations (0.005and 0.05 mM) of these species did not produce signifi-cant changes on BSA structure (data not shown). TheFT-IR spectroscopy studies revealed that under our
Wavenumber (cm-1)
1500155016001650
Abs
orba
nce
(a.u
.)
A
B
C
Figure 1. FT-IR spectra showing Amide I and Amide II bands of free
BSA (A), and the vanadium complexes BSA/VO2+ (B), and
BSA=VO3� (C), obtained after 1 h-incubation time in Tris–HCl buffer,
pH 7.4, solution.
E. G. Ferrer et al. / Bioorg. Med. Chem. 16 (2008) 3878–3886 3879
Author's personal copy
experimental conditions, vanadium concentrationsshould be equal or higher than 0.5 mM to producedetectable spectral changes associated to BSA secondarystructure. Incubations with oxovanadium(IV) and vana-date(V) species at this concentration and under the con-ditions indicated in methods, produced small shifts ofthe typical 1657 cm�1 band present in BSA spectrum to-ward lower frequencies (1655 and 1653 cm�1 for V(IV)and V(V), respectively) (Fig. 1). Furthermore, AmideII band at 1542 cm�1 in native BSA shifted to1547 cm�1 for both species. Besides the shoulder ob-served in BSA spectrum at 1521 cm�1 appeared at1514 cm�1 for V(IV) complexes and its intensityvanished for V(V) ion compounds.
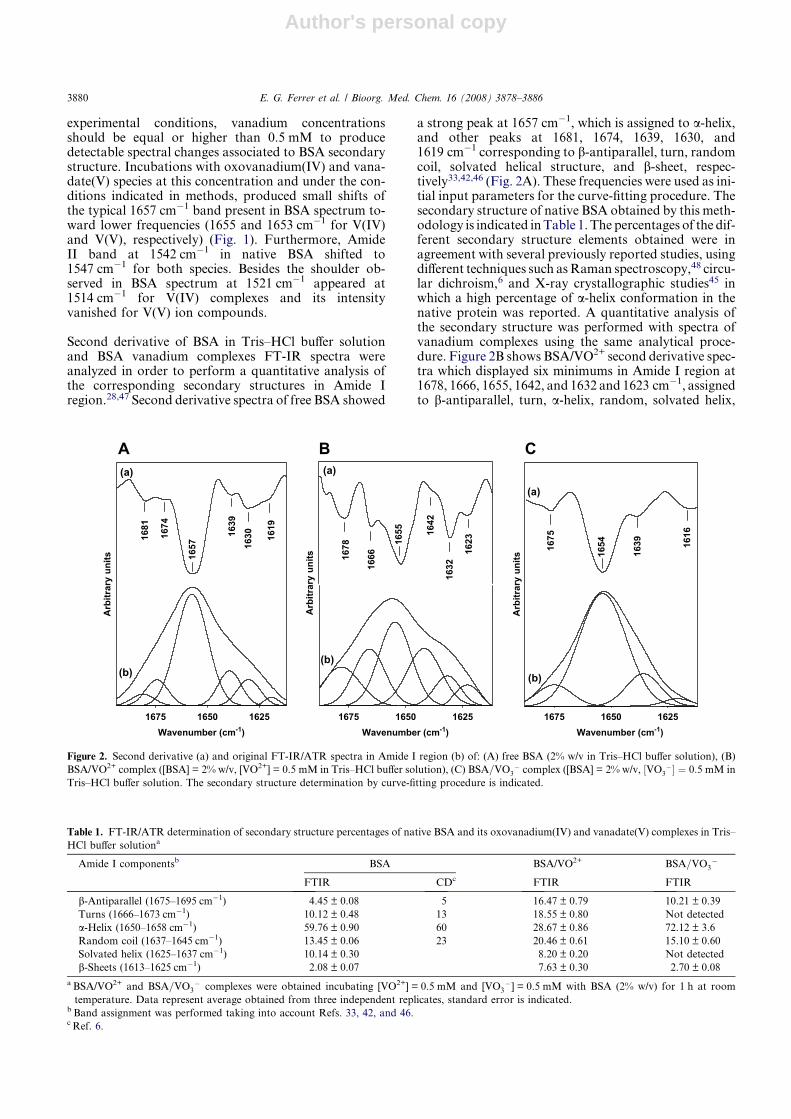
Second derivative of BSA in Tris–HCl buffer solutionand BSA vanadium complexes FT-IR spectra wereanalyzed in order to perform a quantitative analysis ofthe corresponding secondary structures in Amide Iregion.28,47 Second derivative spectra of free BSA showed
a strong peak at 1657 cm�1, which is assigned to a-helix,and other peaks at 1681, 1674, 1639, 1630, and1619 cm�1 corresponding to b-antiparallel, turn, randomcoil, solvated helical structure, and b-sheet, respec-tively33,42,46 (Fig. 2A). These frequencies were used as ini-tial input parameters for the curve-fitting procedure. Thesecondary structure of native BSA obtained by this meth-odology is indicated in Table 1. The percentages of the dif-ferent secondary structure elements obtained were inagreement with several previously reported studies, usingdifferent techniques such as Raman spectroscopy,48 circu-lar dichroism,6 and X-ray crystallographic studies45 inwhich a high percentage of a-helix conformation in thenative protein was reported. A quantitative analysis ofthe secondary structure was performed with spectra ofvanadium complexes using the same analytical proce-dure. Figure 2B shows BSA/VO2+ second derivative spec-tra which displayed six minimums in Amide I region at1678, 1666, 1655, 1642, and 1632 and 1623 cm�1, assignedto b-antiparallel, turn, a-helix, random, solvated helix,
Wavenumber (cm-1) Wavenumber (cm-1) Wavenumber (cm-1)162516501675
(a)
(b)
1681
1674
1657
1639
1630 16
19
Arb
itrar
y un
its
162516501675
(a)
(b)
1678
1666
1655 16
42
1632
1623
Arb
itrar
y un
its
162516501675
(b)
1675
1654
1639 16
16
Arb
itrar
y un
its
(a)
A B C
Figure 2. Second derivative (a) and original FT-IR/ATR spectra in Amide I region (b) of: (A) free BSA (2% w/v in Tris–HCl buffer solution), (B)
BSA/VO2+ complex ([BSA] = 2% w/v, [VO2+] = 0.5 mM in Tris–HCl buffer solution), (C) BSA=VO3� complex ([BSA] = 2% w/v, ½VO3
�� ¼ 0:5 mM in
Tris–HCl buffer solution. The secondary structure determination by curve-fitting procedure is indicated.
Table 1. FT-IR/ATR determination of secondary structure percentages of native BSA and its oxovanadium(IV) and vanadate(V) complexes in Tris–
HCl buffer solutiona
Amide I componentsb BSA BSA/VO2+ BSA=VO3�
FTIR CDc FTIR FTIR
b-Antiparallel (1675–1695 cm�1) 4.45 ± 0.08 5 16.47 ± 0.79 10.21 ± 0.39
Turns (1666–1673 cm�1) 10.12 ± 0.48 13 18.55 ± 0.80 Not detected
a-Helix (1650–1658 cm�1) 59.76 ± 0.90 60 28.67 ± 0.86 72.12 ± 3.6
Random coil (1637–1645 cm�1) 13.45 ± 0.06 23 20.46 ± 0.61 15.10 ± 0.60
Solvated helix (1625–1637 cm�1) 10.14 ± 0.30 8.20 ± 0.20 Not detected
b-Sheets (1613–1625 cm�1) 2.08 ± 0.07 7.63 ± 0.30 2.70 ± 0.08
a BSA/VO2+ and BSA=VO3� complexes were obtained incubating [VO2+] = 0.5 mM and [VO3
�] = 0.5 mM with BSA (2% w/v) for 1 h at room
temperature. Data represent average obtained from three independent replicates, standard error is indicated.b Band assignment was performed taking into account Refs. 33, 42, and 46.c Ref. 6.
3880 E. G. Ferrer et al. / Bioorg. Med. Chem. 16 (2008) 3878–3886
Author's personal copy
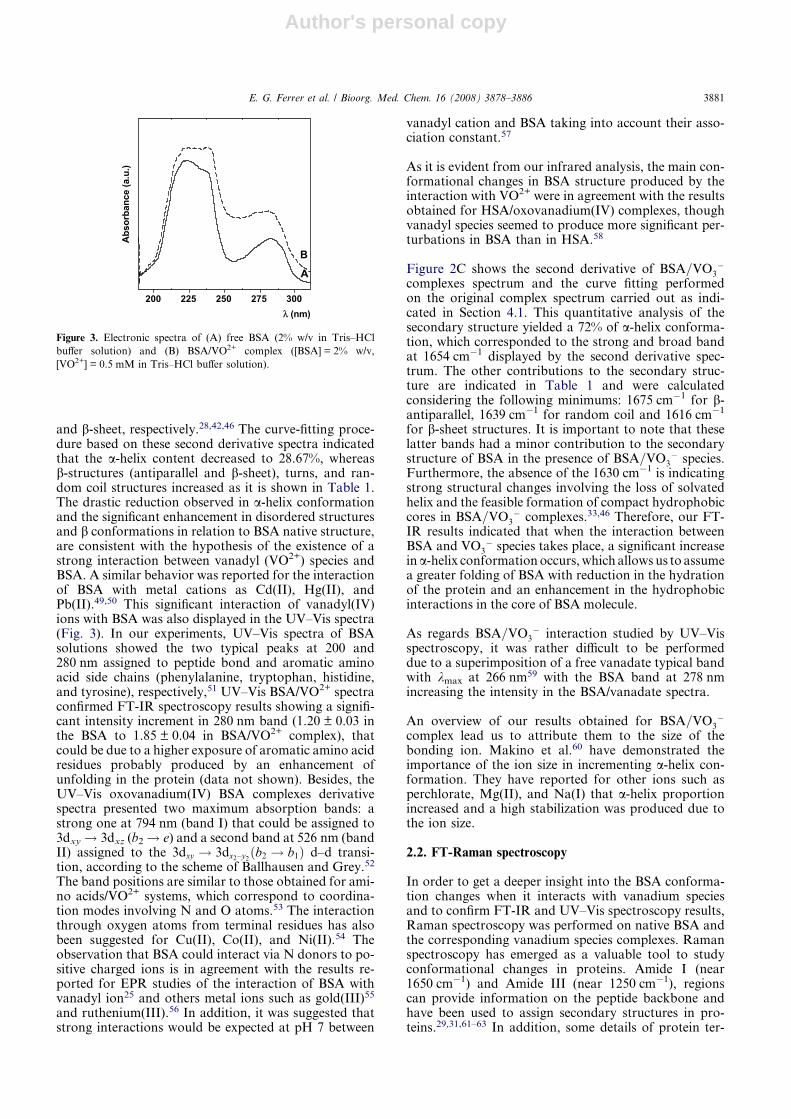
and b-sheet, respectively.28,42,46 The curve-fitting proce-dure based on these second derivative spectra indicatedthat the a-helix content decreased to 28.67%, whereasb-structures (antiparallel and b-sheet), turns, and ran-dom coil structures increased as it is shown in Table 1.The drastic reduction observed in a-helix conformationand the significant enhancement in disordered structuresand b conformations in relation to BSA native structure,are consistent with the hypothesis of the existence of astrong interaction between vanadyl (VO2+) species andBSA. A similar behavior was reported for the interactionof BSA with metal cations as Cd(II), Hg(II), andPb(II).49,50 This significant interaction of vanadyl(IV)ions with BSA was also displayed in the UV–Vis spectra(Fig. 3). In our experiments, UV–Vis spectra of BSAsolutions showed the two typical peaks at 200 and280 nm assigned to peptide bond and aromatic aminoacid side chains (phenylalanine, tryptophan, histidine,and tyrosine), respectively,51 UV–Vis BSA/VO2+ spectraconfirmed FT-IR spectroscopy results showing a signifi-cant intensity increment in 280 nm band (1.20 ± 0.03 inthe BSA to 1.85 ± 0.04 in BSA/VO2+ complex), thatcould be due to a higher exposure of aromatic amino acidresidues probably produced by an enhancement ofunfolding in the protein (data not shown). Besides, theUV–Vis oxovanadium(IV) BSA complexes derivativespectra presented two maximum absorption bands: astrong one at 794 nm (band I) that could be assigned to3dxy! 3dxz (b2! e) and a second band at 526 nm (bandII) assigned to the 3dxy ! 3dx2–y2
ðb2 ! b1Þ d–d transi-tion, according to the scheme of Ballhausen and Grey.52
The band positions are similar to those obtained for ami-no acids/VO2+ systems, which correspond to coordina-tion modes involving N and O atoms.53 The interactionthrough oxygen atoms from terminal residues has alsobeen suggested for Cu(II), Co(II), and Ni(II).54 Theobservation that BSA could interact via N donors to po-sitive charged ions is in agreement with the results re-ported for EPR studies of the interaction of BSA withvanadyl ion25 and others metal ions such as gold(III)55
and ruthenium(III).56 In addition, it was suggested thatstrong interactions would be expected at pH 7 between
vanadyl cation and BSA taking into account their asso-ciation constant.57
As it is evident from our infrared analysis, the main con-formational changes in BSA structure produced by theinteraction with VO2+ were in agreement with the resultsobtained for HSA/oxovanadium(IV) complexes, thoughvanadyl species seemed to produce more significant per-turbations in BSA than in HSA.58
Figure 2C shows the second derivative of BSA=VO3�
complexes spectrum and the curve fitting performedon the original complex spectrum carried out as indi-cated in Section 4.1. This quantitative analysis of thesecondary structure yielded a 72% of a-helix conforma-tion, which corresponded to the strong and broad bandat 1654 cm�1 displayed by the second derivative spec-trum. The other contributions to the secondary struc-ture are indicated in Table 1 and were calculatedconsidering the following minimums: 1675 cm�1 for b-antiparallel, 1639 cm�1 for random coil and 1616 cm�1
for b-sheet structures. It is important to note that theselatter bands had a minor contribution to the secondarystructure of BSA in the presence of BSA=VO3
� species.Furthermore, the absence of the 1630 cm�1 is indicatingstrong structural changes involving the loss of solvatedhelix and the feasible formation of compact hydrophobiccores in BSA=VO3
� complexes.33,46 Therefore, our FT-IR results indicated that when the interaction betweenBSA and VO3
� species takes place, a significant increasein a-helix conformation occurs, which allows us to assumea greater folding of BSA with reduction in the hydrationof the protein and an enhancement in the hydrophobicinteractions in the core of BSA molecule.
As regards BSA=VO3� interaction studied by UV–Vis
spectroscopy, it was rather difficult to be performeddue to a superimposition of a free vanadate typical bandwith kmax at 266 nm59 with the BSA band at 278 nmincreasing the intensity in the BSA/vanadate spectra.
An overview of our results obtained for BSA=VO3�
complex lead us to attribute them to the size of thebonding ion. Makino et al.60 have demonstrated theimportance of the ion size in incrementing a-helix con-formation. They have reported for other ions such asperchlorate, Mg(II), and Na(I) that a-helix proportionincreased and a high stabilization was produced due tothe ion size.
2.2. FT-Raman spectroscopy
In order to get a deeper insight into the BSA conforma-tion changes when it interacts with vanadium speciesand to confirm FT-IR and UV–Vis spectroscopy results,Raman spectroscopy was performed on native BSA andthe corresponding vanadium species complexes. Ramanspectroscopy has emerged as a valuable tool to studyconformational changes in proteins. Amide I (near1650 cm�1) and Amide III (near 1250 cm�1), regionscan provide information on the peptide backbone andhave been used to assign secondary structures in pro-teins.29,31,61–63 In addition, some details of protein ter-
λ (nm)200 225 250 275 300
Abs
orba
nce
(a.u
.)
A
B
Figure 3. Electronic spectra of (A) free BSA (2% w/v in Tris–HCl
buffer solution) and (B) BSA/VO2+ complex ([BSA] = 2% w/v,
[VO2+] = 0.5 mM in Tris–HCl buffer solution).
E. G. Ferrer et al. / Bioorg. Med. Chem. 16 (2008) 3878–3886 3881
Author's personal copy
tiary structure (environment of tyrosine sidechain, disulfide bridge conformations, hydrophobicinteractions, salt bridges) can also be revealed by thistechnique.29,32,64–68
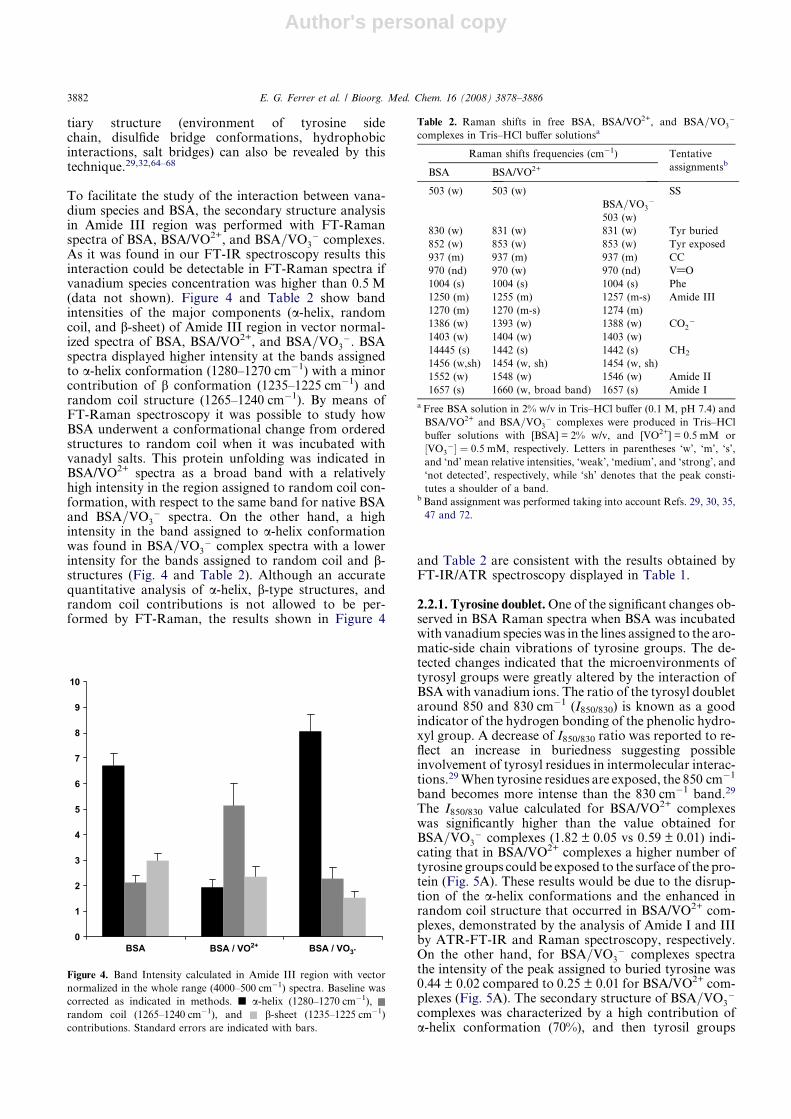
To facilitate the study of the interaction between vana-dium species and BSA, the secondary structure analysisin Amide III region was performed with FT-Ramanspectra of BSA, BSA/VO2+, and BSA=VO3
� complexes.As it was found in our FT-IR spectroscopy results thisinteraction could be detectable in FT-Raman spectra ifvanadium species concentration was higher than 0.5 M(data not shown). Figure 4 and Table 2 show bandintensities of the major components (a-helix, randomcoil, and b-sheet) of Amide III region in vector normal-ized spectra of BSA, BSA/VO2+, and BSA=VO3
�. BSAspectra displayed higher intensity at the bands assignedto a-helix conformation (1280–1270 cm�1) with a minorcontribution of b conformation (1235–1225 cm�1) andrandom coil structure (1265–1240 cm�1). By means ofFT-Raman spectroscopy it was possible to study howBSA underwent a conformational change from orderedstructures to random coil when it was incubated withvanadyl salts. This protein unfolding was indicated inBSA/VO2+ spectra as a broad band with a relativelyhigh intensity in the region assigned to random coil con-formation, with respect to the same band for native BSAand BSA=VO3
� spectra. On the other hand, a highintensity in the band assigned to a-helix conformationwas found in BSA=VO3
� complex spectra with a lowerintensity for the bands assigned to random coil and b-structures (Fig. 4 and Table 2). Although an accuratequantitative analysis of a-helix, b-type structures, andrandom coil contributions is not allowed to be per-formed by FT-Raman, the results shown in Figure 4
and Table 2 are consistent with the results obtained byFT-IR/ATR spectroscopy displayed in Table 1.
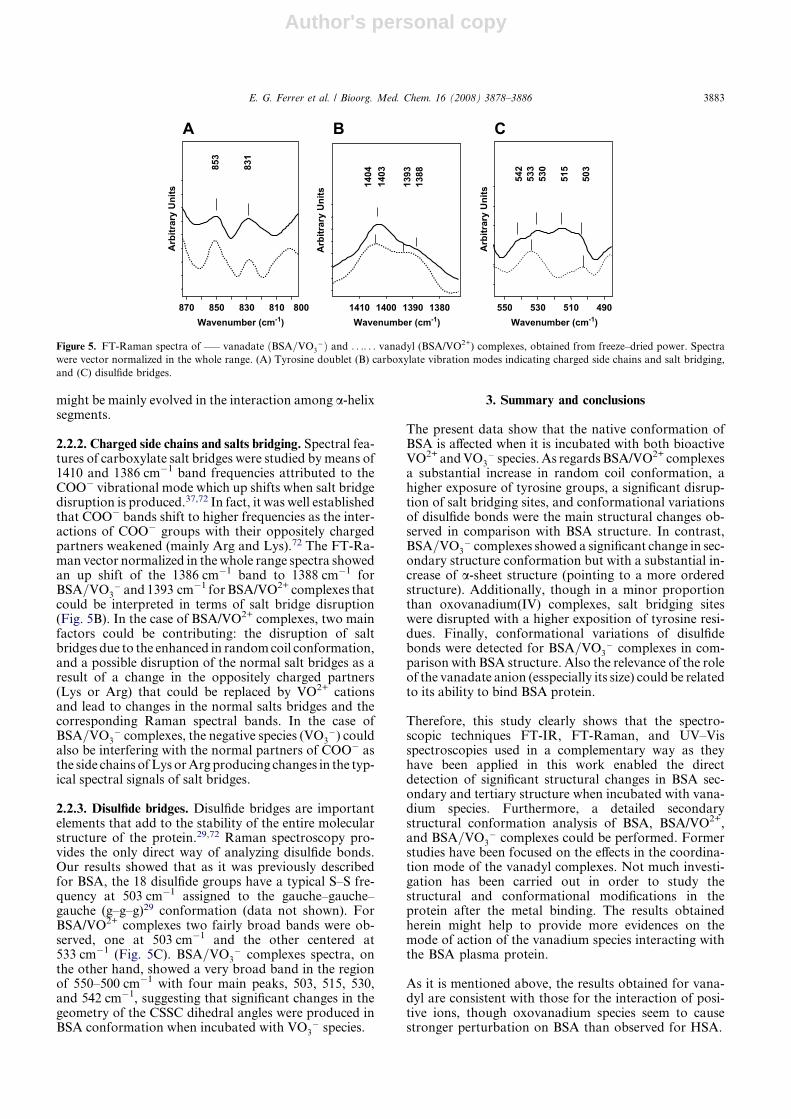
2.2.1. Tyrosine doublet. One of the significant changes ob-served in BSA Raman spectra when BSA was incubatedwith vanadium species was in the lines assigned to the aro-matic-side chain vibrations of tyrosine groups. The de-tected changes indicated that the microenvironments oftyrosyl groups were greatly altered by the interaction ofBSA with vanadium ions. The ratio of the tyrosyl doubletaround 850 and 830 cm�1 (I850/830) is known as a goodindicator of the hydrogen bonding of the phenolic hydro-xyl group. A decrease of I850/830 ratio was reported to re-flect an increase in buriedness suggesting possibleinvolvement of tyrosyl residues in intermolecular interac-tions.29 When tyrosine residues are exposed, the 850 cm�1
band becomes more intense than the 830 cm�1 band.29
The I850/830 value calculated for BSA/VO2+ complexeswas significantly higher than the value obtained forBSA=VO3
� complexes (1.82 ± 0.05 vs 0.59 ± 0.01) indi-cating that in BSA/VO2+ complexes a higher number oftyrosine groups could be exposed to the surface of the pro-tein (Fig. 5A). These results would be due to the disrup-tion of the a-helix conformations and the enhanced inrandom coil structure that occurred in BSA/VO2+ com-plexes, demonstrated by the analysis of Amide I and IIIby ATR-FT-IR and Raman spectroscopy, respectively.On the other hand, for BSA=VO3
� complexes spectrathe intensity of the peak assigned to buried tyrosine was0.44 ± 0.02 compared to 0.25 ± 0.01 for BSA/VO2+ com-plexes (Fig. 5A). The secondary structure of BSA=VO3
�
complexes was characterized by a high contribution ofa-helix conformation (70%), and then tyrosil groups
0
1
2
3
4
5
6
7
8
9
10
BSA BSA / VO2+ BSA / VO3-
Figure 4. Band Intensity calculated in Amide III region with vector
normalized in the whole range (4000–500 cm�1) spectra. Baseline was
corrected as indicated in methods. j a-helix (1280–1270 cm�1),
random coil (1265–1240 cm�1), and b-sheet (1235–1225 cm�1)
contributions. Standard errors are indicated with bars.
Table 2. Raman shifts in free BSA, BSA/VO2+, and BSA=VO3�
complexes in Tris–HCl buffer solutionsa
Raman shifts frequencies (cm�1) Tentative
assignmentsb
BSA BSA/VO2+
503 (w) 503 (w) SS
BSA=VO3�
503 (w)
830 (w) 831 (w) 831 (w) Tyr buried
852 (w) 853 (w) 853 (w) Tyr exposed
937 (m) 937 (m) 937 (m) CC
970 (nd) 970 (w) 970 (nd) V@O
1004 (s) 1004 (s) 1004 (s) Phe
1250 (m) 1255 (m) 1257 (m-s) Amide III
1270 (m) 1270 (m-s) 1274 (m)
1386 (w) 1393 (w) 1388 (w) CO2�
1403 (w) 1404 (w) 1403 (w)
14445 (s) 1442 (s) 1442 (s) CH2
1456 (w,sh) 1454 (w, sh) 1454 (w, sh)
1552 (w) 1548 (w) 1546 (w) Amide II
1657 (s) 1660 (w, broad band) 1657 (s) Amide I
a Free BSA solution in 2% w/v in Tris–HCl buffer (0.1 M, pH 7.4) and
BSA/VO2+ and BSA=VO3� complexes were produced in Tris–HCl
buffer solutions with [BSA] = 2% w/v, and [VO2+] = 0.5 mM or
½VO3�� ¼ 0:5 mM, respectively. Letters in parentheses ‘w’, ‘m’, ‘s’,
and ‘nd’ mean relative intensities, ‘weak’, ‘medium’, and ‘strong’, and
‘not detected’, respectively, while ‘sh’ denotes that the peak consti-
tutes a shoulder of a band.b Band assignment was performed taking into account Refs. 29, 30, 35,
47 and 72.
3882 E. G. Ferrer et al. / Bioorg. Med. Chem. 16 (2008) 3878–3886
Author's personal copy
might be mainly evolved in the interaction among a-helixsegments.
2.2.2. Charged side chains and salts bridging. Spectral fea-tures of carboxylate salt bridges were studied by means of1410 and 1386 cm�1 band frequencies attributed to theCOO� vibrational mode which up shifts when salt bridgedisruption is produced.37,72 In fact, it was well establishedthat COO� bands shift to higher frequencies as the inter-actions of COO� groups with their oppositely chargedpartners weakened (mainly Arg and Lys).72 The FT-Ra-man vector normalized in the whole range spectra showedan up shift of the 1386 cm�1 band to 1388 cm�1 forBSA=VO3
� and 1393 cm�1 for BSA/VO2+ complexes thatcould be interpreted in terms of salt bridge disruption(Fig. 5B). In the case of BSA/VO2+ complexes, two mainfactors could be contributing: the disruption of saltbridges due to the enhanced in random coil conformation,and a possible disruption of the normal salt bridges as aresult of a change in the oppositely charged partners(Lys or Arg) that could be replaced by VO2+ cationsand lead to changes in the normal salts bridges and thecorresponding Raman spectral bands. In the case ofBSA=VO3
� complexes, the negative species (VO3�) could
also be interfering with the normal partners of COO� asthe side chains of Lys or Arg producing changes in the typ-ical spectral signals of salt bridges.
2.2.3. Disulfide bridges. Disulfide bridges are importantelements that add to the stability of the entire molecularstructure of the protein.29,72 Raman spectroscopy pro-vides the only direct way of analyzing disulfide bonds.Our results showed that as it was previously describedfor BSA, the 18 disulfide groups have a typical S–S fre-quency at 503 cm�1 assigned to the gauche–gauche–gauche (g–g–g)29 conformation (data not shown). ForBSA/VO2+ complexes two fairly broad bands were ob-served, one at 503 cm�1 and the other centered at533 cm�1 (Fig. 5C). BSA=VO3
� complexes spectra, onthe other hand, showed a very broad band in the regionof 550–500 cm�1 with four main peaks, 503, 515, 530,and 542 cm�1, suggesting that significant changes in thegeometry of the CSSC dihedral angles were produced inBSA conformation when incubated with VO3
� species.
3. Summary and conclusions
The present data show that the native conformation ofBSA is affected when it is incubated with both bioactiveVO2+ and VO3
� species. As regards BSA/VO2+ complexesa substantial increase in random coil conformation, ahigher exposure of tyrosine groups, a significant disrup-tion of salt bridging sites, and conformational variationsof disulfide bonds were the main structural changes ob-served in comparison with BSA structure. In contrast,BSA=VO3
� complexes showed a significant change in sec-ondary structure conformation but with a substantial in-crease of a-sheet structure (pointing to a more orderedstructure). Additionally, though in a minor proportionthan oxovanadium(IV) complexes, salt bridging siteswere disrupted with a higher exposition of tyrosine resi-dues. Finally, conformational variations of disulfidebonds were detected for BSA=VO3
� complexes in com-parison with BSA structure. Also the relevance of the roleof the vanadate anion (esspecially its size) could be relatedto its ability to bind BSA protein.
Therefore, this study clearly shows that the spectro-scopic techniques FT-IR, FT-Raman, and UV–Visspectroscopies used in a complementary way as theyhave been applied in this work enabled the directdetection of significant structural changes in BSA sec-ondary and tertiary structure when incubated with vana-dium species. Furthermore, a detailed secondarystructural conformation analysis of BSA, BSA/VO2+,and BSA=VO3
� complexes could be performed. Formerstudies have been focused on the effects in the coordina-tion mode of the vanadyl complexes. Not much investi-gation has been carried out in order to study thestructural and conformational modifications in theprotein after the metal binding. The results obtainedherein might help to provide more evidences on themode of action of the vanadium species interacting withthe BSA plasma protein.
As it is mentioned above, the results obtained for vana-dyl are consistent with those for the interaction of posi-tive ions, though oxovanadium species seem to causestronger perturbation on BSA than observed for HSA.
853
831
800810830850870Wavenumber (cm-1) Wavenumber (cm-1) Wavenumber (cm-1)
Arb
itrar
y U
nits
542
530
515
503
533
490510530550
Arb
itrar
y U
nits
1404
1393
1403
1388
1380139014001410A
rbitr
ary
Uni
ts
A B C
Figure 5. FT-Raman spectra of —– vanadate ðBSA=VO3�Þ and . . .. . . vanadyl (BSA/VO2+) complexes, obtained from freeze–dried power. Spectra
were vector normalized in the whole range. (A) Tyrosine doublet (B) carboxylate vibration modes indicating charged side chains and salt bridging,
and (C) disulfide bridges.
E. G. Ferrer et al. / Bioorg. Med. Chem. 16 (2008) 3878–3886 3883
Author's personal copy
The understanding of the different structural changesthat vanadyl and vanadate species produced in BSAstructure could serve for a better knowledge of themechanism that is involved in the therapeutic action oforganic vanadium complexes, which denote differentand relevant biological activities (e.g., insulin mimeticand anticarcinogenic properties).
4. Experimental
4.1. Materials and methods
4.1.1. Protein and complex preparation. Bovine serumalbumin BSA (A-6003, essentially fatty acid-free) wasobtained from Sigma Chemical Company (St. Louis,MO) and used as supplied. The VOCl2Æ2H2O (CarloErba) and NaVO3 (Aldrich) salts used were of analyticalgrade. These drugs were selected considering that chlo-ride and sodium are the most abundant ions in plasma.BSA was dissolved in Tris–HCl (0.1 M, pH 7.4) buffer toattain a final concentration of 4% w/v (�0.6 mM).Vanadium salt solutions were added drop wise to the2% BSA solution (�0.3 mM) with constant stirring toensure the formation of homogeneous solution and toobtain the desired metal ion concentration of 0.005,0.05, and 0.5 mM. The BSA concentration used in thisstudy is the one usually applied in metal–albumin inter-actions (e.g., human serum albumin is about 0.63 mM(40 mg/ml) in blood). Three independent replicates ofBSA solutions, BSA/VO2+, and BSA=VO3
� complexeswere performed. Solutions were allowed to stand for1 h before being placed on the ATR cells. These solu-tions were also assayed by UV–Vis electronic spectros-copy. In order to improve signal–noise ratio in Ramanspectra, Tris–HCl buffer, BSA solutions, and BSA/vana-dium complexes were lyophilized. This procedure wascarried out taking into account that as occurred withother proteins, particularly globulins, FT-Raman spec-tra of protein solutions and freeze–dried powders are al-most identical, therefore, freeze drying do not affectprotein conformation as determined by FT-Ramanspectroscopy.29,37,69
4.1.2. Spectroscopic measurements and data processing4.1.2.1. FT-IR spectroscopy. FT-IR/ATR spectra
were recorded with a Bruker IFS 66 FTIR-spectropho-tometer from 4000 to 400 cm�1 equipped with an inter-nal reflectance accessory using ZnSe crystal designed tohave one angle of light incidence of 45�. Spectra were re-corded at room temperature with a spectral resolutionof 4 cm�1. To improve the signal-to-noise ratio, 200scans were averaged for each spectrum. As most avail-able published peak tables commonly contain and referto transmission spectra, peak positions, absorbanceintensities, and overall spectral patterns were correctedby ATR correction algorithms. Spectra of the Tris-buf-fer were subtracted from protein solution and protein–vanadium species prior to obtaining the second deriva-tive spectra in a similar procedure described in the liter-ature.28 A good subtraction was obtained by a flatbaseline around 2200 cm�1 caused by the cancellationof the water combination mode (1600 + 600 cm�1).
Several control tests with the same protein and metalion solutions were made in order to obtain a flat base-line.70 The results were reported as averages of the threeindependent replicates. For each treatment the corre-sponding average spectra (Xm) and standard deviation(r) were calculated using Opus software. For the analy-sis of differences among treatments Xm ± 2r were takeninto account (confidence limit 97.7%) (OPUS, BrukerOptics, USA).
4.1.2.2. Determination of protein secondary structure.Determination of secondary structure of BSA and BSA/vanadium complexes was carried out on the basis of theprocedure described by Byler and Susi.71 The Amide Iregion (1700–1600 cm�1) was used to investigate the sec-ondary structure of BSA in aqueous solution in a quan-titative manner. The frequencies, the number of peaks tobe fitted, and the half-width of each peak to start a least-square iterative curve-fitting procedure were those ob-tained from the second derivative of the original spectra.The areas of the bands were calculated by integration ofthe corresponding fitted band. A straight baseline pass-ing through the ordinates at 1700 and 1600 cm�1 wasadjusted as an additional parameter to obtain a bestfit. The curve-fitting procedure was performed bystepwise iterative adjustment towards a minimum root-mean-square error of the different parameters determin-ing the shape and position of the absorption peaks. Itwas carried out by assuming an initial mixed Lorentz-ian–Gaussian line-shape function, with full width bandat half-height (FWHH) of 13–18 cm�1 and a maximumresolution factor. Base line corrections, normalization,derivation, curve fitting and area calculation were car-ried out by means of Grams/32 (Galactic Industries Cor-poration, USA) software, OPUS 3.1 and Perkin-Elmersoftware. The resulting fitted curve was analyzed takinginto account the band assignment for the secondarystructure previously reported in the literature,6 a-helix,1658–1650 cm�1; b-sheets, 1637–1613 cm�1; turns,1673–1666 cm�1; random coil, 1645–1637 cm�1; and b-antiparallel, 1695–1675 cm�1. In order to calculate thepercentage contribution of the different types of confor-mations to the area of all the components, bands as-signed to a given conformation were summed anddivided by the total Amide I area.48 The obtained num-ber was taken as the proportion of the polypeptide chainin the corresponding conformation.
4.1.2.3. UV–Vis spectroscopy. Electronic absorptionspectra were recorded with a Hewlett–Packard 8453diode-array spectrophotometer, using 1 cm quartz cellsin the range (200–800 nm). Buffer solutions were placedin the reference compartment. Three independent repli-cates of BSA suspension and the corresponding com-plexes were measured.
4.1.2.4. FT-Raman spectroscopy. Raman spectra werecollected on a Bruker IFS 113 FT-IR spectrophotometerprovided with the NIR Raman attachment equippedwith an Nd:YAG laser at 1064 nm laser. Frequency cal-ibration of the instrument was undertaken using the sul-fur line at 217 cm�1. Spectra were recorded at roomtemperature with a laser power of 500 mW, and spectral
3884 E. G. Ferrer et al. / Bioorg. Med. Chem. 16 (2008) 3878–3886
Author's personal copy
resolution of 4 cm�1. Each spectrum was obtained aftercollecting and averaging 2000 scans in order to obtainhigh signal-to-noise ratio spectra. FT-Raman spectrawere plotted as intensity (arbitrary units) against Ramanshift in wavenumber (cm�1). All spectra were vectornormalized in the whole range (4000–500 cm�1). Theplotting, processing, normalizations, manipulations,and evaluation of spectra were carried out throughOPUS software (Bruker Optics, Germany). Buffer spec-tra were recorded with the same instrument settings em-ployed for protein solutions and when it was necessary,bands were further compensated by computer subtrac-tion techniques (Opus software). Band intensities werecalculated after a linear baseline correction performedwith an integration method developed within OPUSsoftware. Particularly, in Amide III region, peak intensi-ties were calculated in the range 1280–1200 cm�1 settingup two different baselines: (1) a straight line connecting1280 with 1230 cm�1 for the calculation of a (near1277 cm�1) and random coil (near 1248 cm�1) contribu-tions, and (2) another straight line connecting 1230 with1200 cm�1 for the calculation of peak intensity associ-ated to b-sheet contribution (near 1231 cm�1). Theintensity values obtained for the tyrosine doublet werecalculated relative to the local baseline of each peak(830 and 850 cm�1). Band assignment of the majorvibrational motions of the side chains or the peptidebackbone was based on comparison to Raman datareported in the literature.29,30,35,47,72 All analyses wereperformed in three independent experiments, and the re-sults were reported as averages of these replicates.
Acknowledgments
We highly appreciate the financial supports receivedfrom UNLP and CONICET (PIP-5078). E.G. Ferrerand E.J. Baran are members of the Carrera del Investig-ador, CONICET. A. Bosch is a member of the Carreradel Investigador CICPBA, Argentina. The authorsthank Dr. Patricia A.M. Williams and Dr. Susana B.Etcheverry for kindly correcting this manuscript.
References and notes
1. Nonaka, M.; Li-Chan, E.; Nakai, S. J. Agric. Food Chem.1993, 41, 1176.
2. Goodman, D. S. J. Am. Chem. Soc. 1958, 80, 3892.3. Adams, P. A.; Berman, M. C. Biochem. J. 1980, 191, 95.4. Yamashita, M. M.; Wesson, L.; Eisenman, G.; Eisenberg,
D. Proc. Natl. Acad. Sci. U.S.A. 1990, 87, 5648.5. Bal, W.; Christodoulou, J.; Sadler, P. J.; Tucker, A.
J. Inorg. Biochem. 1998, 70, 33.6. Rawel, H. M.; Rohn, S.; Kruse, H. P.; Kroll, J. Food
Chem. 2002, 78, 443.7. Zhang, Y.; Wilcox, D. E. J. Biol. Inorg. Chem. 2002, 7,
327.8. Harford, C.; Sarkar, B. Acc. Chem. Res. 1997, 30, 123.9. Macara, I. G. Science 1980, 5, 92.
10. Rehder, D. Biometals 1991, 5, 3.11. Tsiani, E.; Fantus, I. G. Trends Endocrinol. 1997, 8, 51.12. Byczkowski, L. Z.; Wan, B.; Kulkarni, A. P. Bull. Environ.
Contam. Toxicol. 1988, 41, 696.
13. Carmichael, A. J. FEBS Lett. 1990, 261, 165.14. Ozawa, T.; Hanaki, A. Chem. Pharm. Bull. 1989, 37, 1407.15. Sakurai, H.; Fujii, K.; Fujimoto, S.; Fujisawa, Y.;
Takechi, K.; Yasui, H. In Vanadium Compounds: Chem-istry, Biochemistry and Therapeutic Applications; Tracey,A. S., Crans D. C., Eds.; ACS Symposium Series; NewYork, 1998; Vol. 711, pp 344.
16. Vanadium in the Environment. In Adv. Environ. Sci.Technol; Nriagu, J. O., Ed; John Wiley and Sons Inc.: NewYork, 1998; Vol. 31, part 2 (Health Effects).
17. Vanadium in the Environment. In Adv. Environ. Sci.Technol; Nriagu, J. O., Ed; John Wiley and Sons Inc.: NewYork, 1998; Vol. 30, part 1 (Chemistry and Biochemistry),Chapter 12, pp 285.
18. Baran, E. J. In Vanadium in the Environment; Nriagu, J.O., Ed.; John Wiley and Sons: New York, 1998, part 2(Health Effects) Chapter 16, pp 317.
19. Rehder, D. Inorg. Chem. Commun. 2003, 6, 604.20. Sakurai, H.; Tamura, A.; Fugono, J.; Yasui, H.; Kiss, T.
Coord. Chem. Rev. 2003, 245, 31.21. Makinen, M. W.; Brady, M. J. J. Biol. Chem. 2002, 277,
12215.22. Nechay, B. R. Ann. Rev. Pharmacol. Toxicol. 1984, 24, 501.23. Toshikazu, H. Chem. Rev. 1997, 97, 2707.24. Heinemann, G.; Fichtl, B. l.; Mentler, M.; Vogt, W.
J. Inorg. Biochem. 2002, 90, 38.25. Chasteen, N. D.; Francavilla, J. J. Phys. Chem. 1976, 80,
867.26. Liborion, B. D.; Thompson, K. H.; Hanson, G. R.; Lam,
E.; Aebischer, N.; Orvig, C. J. Am. Chem. Soc. 2005, 127,5104.
27. Dornyei, A. D.; Marcao, S. M.; Costa Pessoa, J.; Jakusch,T.; Kiss, T. Eur. J. Inorg. Chem. 2006, 18, 3614.
28. Susi, H.; Byler, D. M. Biochem. Biophys. Res. Commun.1983, 115, 391.
29. Tu, A. T. Raman Spectroscopy in Biology. In Principalsand Applications; John Wiley and Sons Inc.: New York,1982.
30. Li-Chan, E. C. Y. In Methods to Monitor Process-inducedChanges in Food Proteins. An overview. Process—InducedChemical Changes in Foods; Shahidi, F., Ho, C.-T.,Chuyen, N., Eds.; New York, 1998, pp 5.
31. Williams, W.; Dunker, A. K. J. Mol. Biol. 1981, 152, 783.32. Overman, S. A.; Thomas, G. J., Jr. J. Raman Spectrosc.
1998, 29, 23.33. Fabian, H.; Mantele, W. In Infrared Spectroscopy of
Proteins. Handbook of Vibrational Spectroscopy; Chal-mers, J. M., Griffiths, P. R., Eds.; Biochemical Applica-tions; John Wiley and Sons Ltd: Chichester, 2002; p 3399.
34. Fabian, H.; Schultz, C. P. In Fourier Transform InfraredSpectroscopy in Peptide and Protein Analysis; Meyer, R.A., Ed.; Encyclopedia of Analytical Chemistry; JohnWiley and Sons: Chichester, 2000; p 5779.
35. Ma, C. Y.; Phillips, D. L. Cereal Chem. 2002, 79, 171.36. Casal, H. L.; Kohler, U.; Mantsch, H. H. Biochim.
Biophys. Acta 1988, 957, 11.37. Li-Chan, E.; Nakai, S.; Hirotsuka, M. In Raman Spec-
troscopy as Probe of Protein Structure in Food Systems;Yada, R. Y., Jackson, R. L., Smith, L. L., Eds.; ProteinStructure–Function Relationship in Foods; Blakie Aca-demic: London UK, 1994; p 163.
38. Meng, G.; Ma, C. Y.; Phillips, D. L. Food Chem. 2003, 81,411.
39. Ma, C. Y.; Rout, M. K.; Mock, W. Y. J. Agric. FoodChem. 2001, 49, 3328.
40. Fringeli, U. P. In In situ Infrared Attenuated TotalReflection Membrane Spectroscopy; Mirabella, F. M.,Ed.; Internal Reflection Spectroscopy, Theory and Appli-cations; Marcel Dekker: New York, 1992; p 255.
E. G. Ferrer et al. / Bioorg. Med. Chem. 16 (2008) 3878–3886 3885
Author's personal copy
41. Goormaghtigh, E.; Raussens, V.; Ruysschaert, M. M.Biophys. Acta 1999, 1422, 105.
42. Gilmanshin, R.; Williams, S.; Callender, R. H.; Woodruff,W. H.; Dyer, R. B. Proc. Natl. Acad. Sci. U.S.A. 1997, 94,3709.
43. Surewicz, W. K.; Mantsh, H. H.; Chapman, D. Biochem-istry 1992, 32, 389.
44. Tamm, L. K.; Taulian, S. A. Q. Rev. Biophys. 1997, 30,365.
45. Carter, D. C.; He, X. M.; Munson, S. H.; Twigg, P. D.;Gernert, K. M.; Broom, M. B.; Miller, T. Y. Science 1989,244, 1195.
46. Murayama, K.; Tomida, M. Biochemistry 2004, 43, 11526.47. Damain, G.; CapeanRomanian, V. J. Biophys. 2005, 15, 67.48. Lippert, J. L.; Tyminski, D.; Desmeules, P. J. J. Am.
Chem. Soc. 1976, 98, 7075.49. Ahmed, A.; Tajmir-Riahi, A. J. Inorg. Biochem. 1993, 50,
235.50. Kanthinathi, M.; Maheshwari, R.; Chathathreyan, D.
Lamgmuir 2003, 19, 3398.51. Stoscheck, C. M. Methods Enzymol. 1990, 182, 50.52. Ballhausen, C. J.; Gray, H. B. Inorg. Chem. 1962, 1, 111.53. Dessı, A.; Micera, G.; Sanna, D. J. Inorg. Biochem. 1993,
52, 275.54. Liang, H.; Huang, J.; Tu, C. Q.; Zhang, M.; Zhou, Y. Q.;
Shen, P. W. J. Inorg. Biochem. 2001, 85, 167.55. Marcon, G.; Messori, L.; Orioli, P.; Cinellu, M. A.;
Ghetti, G. Eur. J. Biochem. 2003, 270, 4655.56. Messori, L. L.; Orioli, P.; Vullo, D.; Alessio, E.; Lengo, E.
Eur. J. Biochem. 2000, 267, 1206.
57. Vanadium and its Role in Life. In Metal Ions in BiologicalSystems; Sigel, H., Sigel, A., Eds.; Chasteen N. D. inVanadium–Protein Interactions; Marcel Dekker Inc.: NewYork, 1995, Vol. 31, Chapter 7, pp 235.
58. Purcell, M.; Neault, J. F.; Malonga, H.; Arakawa, H.;Tajmir-Riahi, H. A. Can. J. Chem. 2001, 79, 1415.
59. Harris, W. R.; Carrano, C. J. J. Inorg. Biochem. 1984, 22,201.
60. Makino, S.; Wakabayashi, K.; Sugai, S. Biopolymers 1968,6, 551.
61. Pelton, J. T.; McLean, L. R. Anal. Biochem. 2000, 277, 167.62. Williams, W. J. Mol. Biol. 1983, 166, 581.63. Alix, A. J. P.; Pedanou, G.; Berjot, M. J. Mol. Struct.
1988, 174, 159.64. Overman, S. A.; Thomas, G. J., Jr. Biochemistry 1998, 37,
5654.65. Overman, S. A.; Thomas, G. J., Jr. Biochemistry 1999, 38,
4018.66. Tsuboi, M.; Suzuki, M.; Overman, S. A.; Thomas, G. J.,
Jr. Biochemistry 2000, 39, 2677.67. Carmnona, P.; Molina, M.; Rodıguez-Casado, A. Eur.
Biophys. J. 2003, 32, 137.68. Chang, J.; Ballatore, A. FEBS Lett. 2000, 473, 183.69. Ma, C. Y.; Rout, M. K.; Chan, W.; Phillips, D. L.
J. Agric. Food Chem. 2000, 48, 1542.70. Nonaka, M.; Li-Chan, E.; Nakai, S. J. Agric. Food Chem.
1993, 41, 1176.71. Byler, D. M.; Susi, H. Biopolymers 1986, 25, 469.72. Ngarize, S.; Herman, H.; Adams, A.; Howell, N. K.
J. Agric. Food Chem. 2003, 52, 6470.
3886 E. G. Ferrer et al. / Bioorg. Med. Chem. 16 (2008) 3878–3886