A SPECTROPOLARIMETRIC VIEW ON THE NATURE OF THE PECULIAR TYPE I SN 2005hk
16
draft Preprint typeset using L A T E X style emulateapj v. 08/22/09 A SPECTROPOLARIMETRIC VIEW ON THE NATURE OF THE PECULIAR TYPE I SN 2005HK * Justyn R. Maund 1,2,3 , J. Craig Wheeler 4 ,Lifan W ang 5 ,Dietrich Baade 6 ,Alejandro Clocchiatti 7 , Ferdinando P atat 6 ,Peter H¨ oflich 8 ,J ason Quinn 7 , and P aula Zelaya 7 draft ABSTRACT We report two spectropolarimetric observations of SN 2005hk, which is a close copy of the “very pecu- liar” SN 2002cx, showing low peak luminosity, slow decline, high ionization near peak and an unusually low expansion velocity of only about 7,000 km s -1 . Further to the data presented by Chornock et al., (2006), at -4 days before maximum, we present data of this object taken on 9 November 2005 (near maximum) and 23 November (+ two weeks) that show the continuum and most of the spectral lines to be polarized at levels of about 0.2-0.3%. At both epochs the data corresponds to the Spectropolarimetric Type D1. The general low level of line polarization suggests that the line forming regions for most species observed in the spectrum have a similar shape to that of the photosphere, which deviates from a spherical symmetry by < 10%. In comparison with spectropolarimetry of Type Ia and Core-collapse SNe at similar epochs, we find that the properties of SN 2005hk are most similar to those of Type Ia SNe. In particular, we find the low levels of continuum and line polarization to indicate that the explosion mechanism is approximately spherical, with homogeneous ejecta (unlike the chemically segregated ejecta of CCSNe). We discuss the possibility that SN 2005hk was the result of the pure deflagration of a white dwarf and note the issues concerning this interpretation. Subject headings: supernovae – spectropolarimetry 1. INTRODUCTION The nature of the complex explosion mechanisms thought to be behind Supernovae (SNe), of all types, is expected to leave a signature in the resulting geometry of the explosion. The study of the polarized light arising from SN explosions provides a unique and powerful method for directly measur- ing asymmetries in SNe. The power of spectropolarimetry is demonstrated by its application to the study of the shapes of SNe at large distances, providing an effective spatial resolution far superior to any current or currently planned imaging technique (see Wang & Wheeler 2008, for a review). In SN photospheres, the predominant form of opacity is due to electron scattering, which is also a polarizing process. In a spherical symmetry, light originating from different quadrants of the photosphere have opposite but equal polarization com- ponents, leading to a zero net observed polarization. In the presence of asymmetries, the cancellation of the polarization components arising from different portions of the ejecta is incomplete, leading to an observable polarization whose magnitude is related to the degree of the asymmetry. In * BASED ON OBSERVATIONS MADE WITH ESO TELESCOPES AT THE PARANAL OBSERVATORY, UNDER PROGRAM 076.D-0178(A). 1 Dark Cosmology Centre, Niels Bohr Institute, University of Copen- hagen, Juliane Maries Vej, DK-2100 Copenhagen Ø, Denmark; justyn@dark- cosmology.dk 2 Department of Astronomy & Astrophysics, University of California, Santa Cruz, 95064, U.S.A. 3 Sophie & Tycho Brahe Fellow 4 Department of Astronomy and McDonald Observatory, The University of Texas, 1 University Station C1402, Austin, Texas 78712-0259, U.S.A.; [email protected] 5 Department of Physics, Texas A&M University, College Station, Texas 77843-4242, U.S.A.; [email protected] 6 ESO - European Organisation for Astronomical Research in the Southern Hemisphere, Karl-Schwarzschild-Str. 2, 85748 Garching b. M¨ unchen, Ger- many; [email protected]; [email protected] 7 Departamento de Astronoma y Astrofsica, PUC Casilla 306, Santiago 22, Chile; [email protected]; [email protected]; [email protected] 8 Department of Physics, Florida State University, Tallahassee, Florida 32306-4350, U.S.A.; [email protected] addition to the polarization of continuum light, the absorption due to line forming species exterior to the photosphere cast shadows on the photosphere. If the photosphere is not completely covered, a polarization signature will be associated with wavelength-dependent absorption features, with the degree of polarization related to the amount and orientation of the coverage of the photosphere by the line forming region. Previous polarimetric studies of SNe have shown that Type Ia SNe and Core-collapse Supernovae (CCSNe) have different polarization properties. Type Ia SNe are observed to have generally low polarizations, indicative of a close-to-spherical symmetry. The degree of polarization of these events de- creases with time, as deeper layers of ejecta are revealed, implying the ionization/ density structure becomes more spherically symmetric with depth. In contrast, CCSNe have been observed with a wide variety of polarizations, generally larger than those observed for Type Ia SNe. In addition, the degree of polarization is observed to increase with time for CCSNe, suggesting the ejecta become more asymmetric at increasing depth. In the classical observing modes of photometry and spec- troscopy, Type Ia SNe at certain phases can be confused upon casual inspection with Type Ic SNe at other phases due to the common display of Fe II lines. Special care must be given when trying to determine the type and the physics of “pecu- liar” Type Ia and “peculiar” Type Ic SNe. The application of spectropolarimetry can provide additional constraints, both in the abstract sense of the Stokes parameters and in the inferred geometries, that can help separate events belonging to the different distinct classifications. One particular class of SNe, which have been previously classified as Type Ia SNe (albeit “the most peculiar Type Ia”; Li et al. 2003), are the so-called 2002cx-like SNe. It has recently been suggested that members of this class may be representative of Type Ia SN events that result from a pure-deflagration (see Branch et al. 2004, and references therein) or instead may be peculiar, low-luminosity Type Ic arXiv:1008.3985v2 [astro-ph.SR] 25 Aug 2010
Transcript of A SPECTROPOLARIMETRIC VIEW ON THE NATURE OF THE PECULIAR TYPE I SN 2005hk
draftPreprint typeset using LATEX style emulateapj v. 08/22/09
A SPECTROPOLARIMETRIC VIEW ON THE NATURE OF THE PECULIAR TYPE I SN 2005HK∗
Justyn R. Maund1,2,3, J. CraigWheeler4, LifanWang5, Dietrich Baade6, Alejandro Clocchiatti7,Ferdinando Patat6, Peter Hoflich8, Jason Quinn7, and Paula Zelaya7
draft
ABSTRACTWe report two spectropolarimetric observations of SN 2005hk, which is a close copy of the “very pecu-
liar” SN 2002cx, showing low peak luminosity, slow decline, high ionization near peak and an unusually lowexpansion velocity of only about 7,000 km s−1 . Further to the data presented by Chornock et al., (2006), at-4 days before maximum, we present data of this object taken on 9 November 2005 (near maximum) and 23November (+ two weeks) that show the continuum and most of the spectral lines to be polarized at levels ofabout 0.2-0.3%. At both epochs the data corresponds to the Spectropolarimetric Type D1. The general lowlevel of line polarization suggests that the line forming regions for most species observed in the spectrum havea similar shape to that of the photosphere, which deviates from a spherical symmetry by < 10%. In comparisonwith spectropolarimetry of Type Ia and Core-collapse SNe at similar epochs, we find that the properties ofSN 2005hk are most similar to those of Type Ia SNe. In particular, we find the low levels of continuum andline polarization to indicate that the explosion mechanism is approximately spherical, with homogeneous ejecta(unlike the chemically segregated ejecta of CCSNe). We discuss the possibility that SN 2005hk was the resultof the pure deflagration of a white dwarf and note the issues concerning this interpretation.Subject headings: supernovae – spectropolarimetry
1. INTRODUCTION
The nature of the complex explosion mechanisms thoughtto be behind Supernovae (SNe), of all types, is expected toleave a signature in the resulting geometry of the explosion.The study of the polarized light arising from SN explosionsprovides a unique and powerful method for directly measur-ing asymmetries in SNe. The power of spectropolarimetryis demonstrated by its application to the study of the shapesof SNe at large distances, providing an effective spatialresolution far superior to any current or currently plannedimaging technique (see Wang & Wheeler 2008, for a review).In SN photospheres, the predominant form of opacity is dueto electron scattering, which is also a polarizing process. In aspherical symmetry, light originating from different quadrantsof the photosphere have opposite but equal polarization com-ponents, leading to a zero net observed polarization. In thepresence of asymmetries, the cancellation of the polarizationcomponents arising from different portions of the ejecta isincomplete, leading to an observable polarization whosemagnitude is related to the degree of the asymmetry. In
∗BASED ON OBSERVATIONS MADE WITH ESO TELESCOPES AT THEPARANAL OBSERVATORY, UNDER PROGRAM 076.D-0178(A).
1 Dark Cosmology Centre, Niels Bohr Institute, University of Copen-hagen, Juliane Maries Vej, DK-2100 Copenhagen Ø, Denmark; [email protected]
2 Department of Astronomy & Astrophysics, University of California,Santa Cruz, 95064, U.S.A.
3 Sophie & Tycho Brahe Fellow4 Department of Astronomy and McDonald Observatory, The University
of Texas, 1 University Station C1402, Austin, Texas 78712-0259, U.S.A.;[email protected]
5 Department of Physics, Texas A&M University, College Station, Texas77843-4242, U.S.A.; [email protected]
6 ESO - European Organisation for Astronomical Research in the SouthernHemisphere, Karl-Schwarzschild-Str. 2, 85748 Garching b. Munchen, Ger-many; [email protected]; [email protected]
7 Departamento de Astronoma y Astrofsica, PUC Casilla 306, Santiago 22,Chile; [email protected]; [email protected]; [email protected]
8 Department of Physics, Florida State University, Tallahassee, Florida32306-4350, U.S.A.; [email protected]
addition to the polarization of continuum light, the absorptiondue to line forming species exterior to the photospherecast shadows on the photosphere. If the photosphere isnot completely covered, a polarization signature will beassociated with wavelength-dependent absorption features,with the degree of polarization related to the amount andorientation of the coverage of the photosphere by the lineforming region.Previous polarimetric studies of SNe have shown that Type IaSNe and Core-collapse Supernovae (CCSNe) have differentpolarization properties. Type Ia SNe are observed to havegenerally low polarizations, indicative of a close-to-sphericalsymmetry. The degree of polarization of these events de-creases with time, as deeper layers of ejecta are revealed,implying the ionization/ density structure becomes morespherically symmetric with depth. In contrast, CCSNe havebeen observed with a wide variety of polarizations, generallylarger than those observed for Type Ia SNe. In addition, thedegree of polarization is observed to increase with time forCCSNe, suggesting the ejecta become more asymmetric atincreasing depth.In the classical observing modes of photometry and spec-troscopy, Type Ia SNe at certain phases can be confused uponcasual inspection with Type Ic SNe at other phases due to thecommon display of Fe II lines. Special care must be givenwhen trying to determine the type and the physics of “pecu-liar” Type Ia and “peculiar” Type Ic SNe. The application ofspectropolarimetry can provide additional constraints, both inthe abstract sense of the Stokes parameters and in the inferredgeometries, that can help separate events belonging to thedifferent distinct classifications.One particular class of SNe, which have been previouslyclassified as Type Ia SNe (albeit “the most peculiar TypeIa”; Li et al. 2003), are the so-called 2002cx-like SNe. Ithas recently been suggested that members of this class maybe representative of Type Ia SN events that result from apure-deflagration (see Branch et al. 2004, and referencestherein) or instead may be peculiar, low-luminosity Type Ic
arX
iv:1
008.
3985
v2 [
astr
o-ph
.SR
] 2
5 A
ug 2
010
2
SNe (Foley et al. 2009; Valenti et al. 2009).Here we report two epochs of spectropolarimetry of the2002cx-like SN 2005hk, acquired at approximately max-imum light and two weeks later using the Very LargeTelescope (VLT) of the European Southern Observatory(ESO). SN 2005hk was discovered in UGC 272 by Burket& Li (2005). The location of SN 2005hk, relative to its hostgalaxy, is shown as Fig. 1. Early spectroscopy was presentedby Jha et al. (2006), Chornock et al. (2006), Phillips et al.(2007) and Sahu et al. (2008). They identify the early highionization (e.g. Fe III) species typical of SN 2002cx-likeSNe, as well as the bright Type Ia SN 1991T (see alsoSerduke et al. 2005), and the low velocities characteristicof SN 2002cx (∼ 6000 km s−1 ). The spectra of Jha et al.and Chornock et al. showed intermediate-mass elementswith weaker features than regular SNe Ia, but stronger thanSN 1991T. Chornock et al. suggested that Ni and Co maybe present in the early spectra and hence in the outermostlayers of the ejecta. The red portions of the spectra showappreciable features of O I and Mg II between 7500 and9000Å, whereas SN 1991T, a possible analog, showed abasically featureless spectrum in that phase and wavelengthrange. Both SN 2002cx and SN 2005hk showed similar finescale structure suggesting that the structure was systematicand hence not the product of random clumping in the ejectaof either event. Phillips et al. (2007) present extensiveu’g’r’i’BVRIJHK photometry and optical spectroscopy ofSN 2005hk, including the spectral data of Jha et al. andChornock et al.. Importantly, they note that the light curvesof these two events are very similar, with neither showing thetypical secondary maxima in R and I displayed by normalSNe Ia, but light curves that are also distinctly different thanunder-luminous SNe Ia such as SN 1991bg. In addition, thebolometric light curve, including Swift UV data, shows arather slow light curve (∆m15(B) = 1.56; Phillips et al. 2007),uncharacteristic of under-luminous SN Ia and similar tonormal Type Ia SNe over a magnitude brighter at maximum.Chornock et al. (2006) presented spectropolarimetry ofSN 2005hk, at 4 days prior to our first observation. Theydetermined that the continuum was polarized ∼ 0.4% in thered, with the data represented by a dominant axis. They alsoidentified a weak modulation of the polarization of the Fe IIIline at λ5129.In Section 2 we present our spectropolarimetric observationsand our adopted reduction procedure. The results fromthese observations are presented in §3 and these results arediscussed in §4. In §5 we present our conclusions.
2. OBSERVATIONS
Spectropolarimetry of SN 2005hk was acquired usingthe ESO-VLT on 2005 Nov 9 and 23, with the FORS1instrument in polarization PMOS mode. A log of theseobservations is presented in Table 1. The data were reducedfollowing the scheme outlined in Maund et al. (2007a). Ateach epoch, the observations consisted of four exposureswith the half-wavelength retarder plate positioned at fourposition angles 0◦, 45◦, 22.5◦, and 67.5◦, to derive the twolinear Stokes parameters Q and U9. Both observations wereconducted with the 300V grism, without an order separationfilter, providing a spectral resolution of 12.5Å as measured
9 We adopt the notation of Wang & Wheeler (2008), where the normalizedStokes parameters are given by Q = Q/I and U = U/I.
from arc line calibration data. Telluric lines were removedfrom flux spectra in the standard manner. Flux standard starswere observed, with the full polarimetry optics in place, tocalibrate the flux levels of the SN data and remove telluricfeatures. The telluric features are not expected to affect thepolarimetry, except to decrease the level of signal-to-noiseacross the absorption, provided there is no significant changein the strength of absorptions between exposures with theretarder plate rotated by 45◦.The instrumental stability between the observations at thetwo epochs was assessed by calculating the differencebetween the instrumental signature corrections εQ and εU(Maund 2008). At both epochs the difference was found tobe 0 ± 0.1%, implying a limit on the instrumental stabilityand the measurement of the Stokes parameters to 0.1%. Thisis consistent with previous reported measurements of theinstrumental signature corrections and limits on stability ofthe VLT FORS instrument (Maund et al. 2009).The degree of polarization was corrected for biases due toobservational noise using the equations derived in Wang et al.(1997), and, additionally, using a Monte Carlo simulation ofthe FORS1 instruments in the manner of Patat & Romaniello(2006) and Maund (2008). The wavelength scales werecorrected for the heliocentric recessional velocity of the hostgalaxy of 3895 km s−1.10
3. OBSERVATIONAL RESULTS
3.1. The Distinguishing Spectral FeaturesThe spectroscopic properties of SN 2005hk have already
been described in some detail in other works (Chornock et al.2006; Phillips et al. 2007). Here the prominent spectroscopicfeatures, which characterise SN 2005hk at the epochs at whichspectropolarimetry was acquired, will be briefly reviewed toorient the reader. The flux spectra from our two spectropolari-metric observations are presented as Fig. 2.Our data from 2005 November 9 are interleaved with thecoverage presented by Phillips et al. (2007) who give spec-tra from 7 and 14 November that they assign to -3 and +4days with respect to B maximum which they determine to beJD2,453,685.1. This means our data are from very near Bmaximum, perhaps a day earlier. We confirm that the spectralfeatures are very similar to those of SN 2002cx at the sameepoch (Li et al. 2003). Furthermore, Chornock et al. (2006)acquired a flux spectrum of SN 2005hk in the course of ac-quiring spectropolarimetry at November 5.4, 4 days prior toour first observation. Chornock et al. performed line identifi-cations using the SYNOW11 code for their spectrum. Theyfound that the strongest lines were from Fe III with otherlines of intermediate mass elements being present, but rela-tively weaker. They obtained a better fit in the blue by addinglines of Ni II, Co II, Ti II and C III. They used an excita-tion temperature of 10,000 K for the low-ionization stage el-ements and 15,000 K for the higher ionization stages, Fe IIIand Si III. Our flux spectrum from the 2005 November 09 ob-servation, despite being acquired 4 days later, requires similaridentifications to those made by Chornock et al.. In the redportion of the spectrum, we identify the Ca II IR triplet, al-though the synthetic spectra of Chornock et al. suggested thatat the epoch of their observations this was mostly due to O Iand Mg II. The feature at ∼ 7600Å is identified by Phillips
10 http://nedwww.ipac.caltech.edu/11 http://www.nhn.ou.edu/ parrent/synow.html
3
et al. (2007) as Fe II, while Chornock et al. (2006) suggestedit was a mixture of O I and Mg II. Li et al. (2003) observedthe appearance of O I λ7774 after maximum in spectra ofSN 2002cx, which suggests that at 0 days for SN 2005hk thisfeature could be at least partially due to O I.Our spectrum from 2005 November 23 corresponds to anepoch two weeks after B maximum. Our data are very similarto spectra of that date presented by Phillips et al. (2007), butour data have higher signal to noise and broader wavelengthcoverage. The spectrum of Phillips et al. 2007 from Novem-ber 25 (+15 days) has similar wavelength coverage to ours ofNovember 23 and remains very similar to our flux spectrum.At this epoch, the underlying continuum is cooler with a rel-ative paucity of flux in the blue compared to the spectrum of9 November. The spectrum is characterized by the growth inamplitude of small scale features. SYNOW was used by us, inconjunction with previously published line identifications, todetermine line identifications specific to the spectrum at thisepoch. The degree of blending of multiple lines is lower atthe second epoch, due to the relative decrease in the expan-sion velocity. The truncation of the red-side of the O I λ7774emission line profile at 7980 Å may be evidence for Mg II,but it is located close to strong telluric absorption features.The identification of Si II λ6355 at +14 days is debatable, andis likely to be due to an increase in Fe II λλ6456, 6518 (Liet al. 2003). Branch et al. (2004) similarly found that Si IIwas no longer required to fit spectra of SN 2002cx at a similarepoch. The photospheric velocity was estimated, using linesof Fe II(42), to be ∼ −7000km s−1 .At the second epoch, there are also two distinct absorptionfeatures that are likely to be caused by the Ca II IR triplet.The Ca II IR triplet was identified at 12 days after maxi-mum in the spectrum of SN 2002cx (Branch et al. 2004). Thetwo features might be due to partially resolving the triplet inthis low velocity photosphere (−5650 km s−1 ), or there couldbe two kinematically separate components such as those ob-served in normal Type Ia SNe (Mazzali et al. 2005). If the lat-ter, the absorption minima correspond to velocities of −8400and −5500 km s−1 , respectively, taking the mean wavelengthof the Ca II blend to be 8579Å. The bluer of these two compo-nents is moving somewhat more rapidly than the typical rangeidentified for photospheric features for Type Ia SNe at similarepochs (Mazzali et al. 2005). Comparison with SN 2002cxat 12 days (Branch et al. 2004) leads to the identification ofthe strong absorption observed at 5730Å as Na I intrinsic tothe SN, corresponding to a velocity of −8150km s−1 (which issimilar to the high velocity Ca II feature).At the first epoch, there is a feature at ∼ 7200Å. Chornocket al. (2006) argue it is unlikely to be due to C II due to ab-sence of other stronger lines that should occur in the wave-length range of these observations (e.g. λ6578). Rather Sahuet al. (2008) suggests the 7200Å may arise from Fe II λ7308.Branch et al. (2004) could not identify C I features in spec-tra of SN 2002cx. At the second epoch, however, there is asuggestion of an absorption (blended with an Fe II line givingrise to a flat topped emission line profile for that line) whichis consistent with the expected position of C II λ6578 with avelocity of −5500 km s−1 (similar to the low velocity compo-nent of Ca II).
3.2. The Polarization of SN 2005hkSpectropolarimetry of SN 2005hk at the two epochs is pre-
sented in Figs. 3 and 4.
The correct measurement of the intrinsic polarization of SNerequires the subtraction of the polarization contribution of theinterstellar medium, both in the Galaxy and in the host. Inthe first instance, a general limit can be placed on the degreeof the Interstellar Polarization (ISP) by the amount of redden-ing measured towards SN 2005hk. For Galactic-type dust themaximum degree of the ISP is related to the reddening by thelimit pIS P < 9 × E(B − V) (Serkowski et al. 1975). The de-gree of Galactic foreground reddening in the direction of SN2005hk has been reported to be E(B − V) = 0.022 (Schlegelet al. 1998). The limit on ISP arising in the foreground is0.2%.The reddening towards SN 2005hk can be estimated, if weassume that the narrow Na I D absorption component arisesin the interstellar medium (ISM) of the host. The equivalentwidth of the Na I D absorption feature at the first epoch wasmeasured to be Wλ = 0.30 ± 0.02. This value is smallerthan the value reported by Chornock et al. (2006), for ob-servations 4 days prior to our first observations, although thedifference between the two measured values is ∼ 2σ. Wenote Chornock et al. do not quote errors on their determinedequivalent width. It is not clear if this difference is withinthe measurement errors or if it reflects evolution triggered bythe SN (Patat et al. 2007). We follow Chornock et al. (2006),who adopt the results of Munari & Zwitter (1997) for evalu-ating the relationship between Na ID absorption and the red-dening. This relationship is based on Galactic-type extinctionlaws (e.g. Cardelli et al. 1989). It is, therefore, implicitly as-sumed that the reddening component, measured from the nar-row Na I absorption component in the host galaxy, follows asimilar law. As the Na I D component lines are not resolvedin our data, we also adopt a range of flux ratios between Na ID1 and D2 of 1.1 to 2 (Chornock et al. 2006). This limits thereddening of the host to 0.05 < E(B − V) < 0.07. The totalreddening, for Galactic type reddening and ISP law, yields aconstraint on the total ISP of pIS P < 0.8%.Howell et al. (2001) present a technique for the determina-tion of the ISP for specific wavelength ranges which havenull intrinsic polarization. This assumes that, for these spe-cific wavelength ranges, there is sufficient overlap betweengroups of lines such that there is complete intrinsic depolar-ization over these wavelengths. Howell et al. suggest that thewavelength region of 4800-5600Å is intrinsically depolarized,where line blanketing opacity dominates over electron scatter-ing opacity. Any polarization, observed over this wavelengthrange, is expected to be due to the ISP alone. For SN 2005hk,at both epochs, the lack of significant overlap and blendingof lines leads to the complex behaviour of the Stokes param-eters. Chornock et al. (2006) find that the wavelength rangeof 4000-4200Å satisfies the criteria for intrinsic depolariza-tion, namely significant line blanketing. The observation ofChornock et al. at November 5.4 is sufficiently close to ourobservation at the first epoch that we observed similar featuresin the polarization spectrum and the Stokes parameter spec-tra. Importantly, we too determine that this wavelength rangeprovides the best approximation to a line blanketed regime.The measured Stokes parameters across this range at the firstepoch are Q = 0.04% ± 0.03 and U = −0.32% ± 0.03. Theuncertainties on these quantities are the combined systematicand statistical uncertainties.The spectral evolution of SN 2005hk by the second epoch,with the increase in the strengths of individual Mg II andFe III lines in the range of 4000-4200Å, leads to the pres-
4
ence of intrinsic polarization (Q = 0.12% ± 0.06 and U =−0.47% ± 0.060). Instead, we identify the region of 4250-4450Å as being spectroscopically similar to a line blanketedregime with no unblended line structure. Over this wave-length range the average values of the Stokes parameters aremeasured as Q = 0.09% ± 0.03 and U = −0.30% ± 0.03. Themeasured Stokes parameters, over the depolarized wavelengthrange, agree with those determined at the first epoch.We adopt values of the ISP Stokes parameters of QIS P =0.07% ± 0.03 and UIS P = −0.31% ± 0.03, for both the Galac-tic and host ISP components, which are approximately con-sistent with the values measured by Chornock et al. (whocalculate separate Galactic and host components). The valueof the ISP relative to the observed Stokes parameters is shownon Figs. 3 and 4. These values correspond to a polarizationof pIS P = 0.32% ± 0.03 with an angle of θIS P = 141◦ ± 3.The orientation of the ISP component is shown on Fig. 1.As previously observed for other SNe (Maund et al. 2007b;Patat et al. 2009, 2010), the ISP component is aligned withthe spiral arm pattern at the SN location, due to alignment ofmagnetic field lines and, hence, dust grains along spiral arms(Scarrott et al. 1987).Given the limited wavelength range over which it can be de-termined, it is not clear if and how the ISP component varieswith wavelength. Although a standard Serkowski-type lawcould be applied, it is unclear what the appropriate values ofλmax and pmax would be. Furthermore, it has been observedfor a number of SNe with significant ISPs that the ISP doesnot necessarily even follow a Galactic-Serkowski type law ofwavelength dependence (e.g. SN2006X; Patat et al. 2009).Given the small value of the ISP, we subtract, therefore, aconstant ISP component from the observed data, to recoverthe intrinsic polarization of the SN (as shown by P0 in Figs. 3and 4), under the assumption that any wavelength dependenceof the ISP is smaller than the uncertainties derived above.On the Stokes Q − U plane (see Figs. 5 and 6), the ISP com-ponent is located close to the centroid of the SN 2005hk data.The calculated weighted centroids for the ISP-corrected data(Q,U
)are listed in Table 3.
After correction for the ISP, the intrinsic polarization ofSN 2005hk is observed to be extremely low across the ob-served wavelength range. The degree of polarization of anumber of features observed to be relatively strongly polar-ized in the uncorrected polarization spectrum, are no longeras polarized once the data have been corrected for the ISP.Utilising the data across the range 6600 − 7000Å as repre-sentative of a region of pure continuum emission, the levelof the continuum polarization is measured as 0.17 ± 0.05%and 0.19 ± 0.05% at the first and second epochs, respec-tively. At the second epoch the assumption that this wave-length range represents a true continuum region is most likelyinvalid, due to the presence of a number of minor, broad un-dulations which are most likely due to the lines (rather thanincorrect flatfielding of the flux spectrum). This wavelengthrange avoids any polarization associated with the feature at7200Å, and is less than the continuum polarization measuredby Chornock et al. (2006) at 2005 Nov 5.4 of 0.36%. Thislevel of polarization is consistent with a spheroidal configura-tion with axial ratio > 0.9 (Hoflich 1991).The significance of the polarization signal is given by(S/N)P = P/σP =
√N/2P(S/N) (Patat & Romaniello 2006).
At both epochs there are no features, at either 15Å or 30Å
binning, which are detected in the intrinsic polarization spec-trum P0 at > 3σ and only a small number of bins detected at> 2σ. Chornock et al. (2006) argue that in their data from5 November, only the line of Fe III λ5129 is polarized andat a rather small level. On inspection, their data suggest thatFe III λ4404 is also somewhat polarized. There is another fea-ture of similar amplitude showing a minimum at λ4800 in thepolarized flux that has no strong component in the total fluxspectrum, but is likely to correspond to Si II λ5051.Our data at the first epoch also show possible modulation inthe polarization spectrum associated with Fe III λ5129, aswell as Si II λ6355 and the 7200Å feature. At redder wave-lengths there are a number of peaks which are associated withtelluric features, suggesting that these were variable over thecourse of the observations. The apparent significance of thesefeatures is therefore overestimated, as the possible variabilityof telluric features was not considered in the reduction pro-cess and not accounted for in the final error analysis.By the second epoch, there are possible peaks in the intrinsicpolarization associated with the absorptions of the Fe II mul-tiplet 42, the intrinsic Na I feature and the absorption of Fe IIλ6147.The absence of a significant signal in the polarization spec-trum does not necessarily imply that the intrinsic polarizationof spectral features is also not significant. Wang et al. (1997)and Leonard et al. (2002) studied the change in polarization∆P across particular spectral features, by comparing the mod-ulation in the Stokes Q and U parameters from the approxi-mate “continuum” level and at the wavelength of absorptionminimum, where:
∆P =
√(Q (λcont) − Q (λline))2 + (U (λcont) − U (λline))2 (1)
∆P is independent of the choice of the ISP component. Thevalues of ∆P for particular spectral features, at both epochs,are presented in Table 2.Even when assessed by modulation of the Stokes parameters,the data at both epochs show few significant features. At thefirst epoch, Ca II H&K, Fe II and, importantly, Si II λ6355show significant modulation, whereas at the second epoch thesignificant modulation is associated with the, now stronger,Fe II lines. The interpretation of the data presented in Table 2requires some caution, however, as the selection of λcont andλline, by eye, can lead to a bias in favour of selecting thosewavelengths that yield the maximum change in the Stokesparameters. The principal differences between the data pre-sented by Chornock et al. at -4 days, compared to our data at0 days, is due to much larger S/N achieved in their observa-tion. We estimate that at 7200Å, at 50Å binning, Chornocket al. achieved a final S/N ≈ 1400, whereas our observationreached S/N ≈ 390.At the first epoch, two sets of two contiguous bins (at 30Å)are observed at both the 7200Å feature and immediately red-ward at 7315Å. An obvious line feature is associated withthe former spectral line in the flux spectrum. The latter fea-ture corresponds to a telluric feature that, although it shouldbe equally cancelled between the two beams at each retarderplate position, may appear polarized due to variability in thetelluric line between the pair of observations used to deriveeach Stokes parameter.On the Stokes Q − U plane (see Figs. 5 and 6), the dataat both epochs assume an approximate elliptical distribution,with no major structure deviating from the main concentra-
5
tion of points. At the first epoch, the data have no obviouspreferred direction. By the second epoch the data are moreextended across the Q−U plane, although again with no majordeviations from the main concentration of data points. FromFig. 6 it is also evident that, by the second epoch, the degreeof polarization has become more wavelength dependent, withdata at bluer wavelengths being concentrated at lower valuesof Q and U than the data at the red extreme of the observedwavelength range. Our lower S/N data does not show thewavelength dependent elongation to the same degree as ob-served at -4 days, for which a dominant axis is clear to theeye. The behaviour of the data on the Stokes Q − U plane, atboth epochs, is quantified and discussed in Section 3.3.
3.3. Decomposition of the Stokes parametersThe determination of the dominant axis, and the de-
composition of the Stokes vector, permits a correction forthe random position angle at which target SNe have beenobserved, as well as determination of the principal axisof symmetry of the data, the relative orientations of thedifferent line forming species and, ultimately, the underlyinggeometry. The dominant axis forms a line across the StokesQ − U plane, and the decomposition process involvesrotating the data so that the principal rotated Stokes axis isaligned with the axis of greatest variance for the data onthe Stokes plane. The polarization signal is measured in thetwo orthogonal directions, which are effectively the “rotatedStokes parameters”, along the dominant axis (Pd) and alongthe orthogonal axis (Po). A polarization component in theorthogonal direction permits the identification of deviationsfrom the single axial symmetry represented by the dominantaxis.Here we explore two complementary techniques for deter-mining the dominant axis: least-squares fitting of a straightline and a principal components analysis of the data on theStokes Q−U plane. Importantly, these two different analysesshould give identical measures of the dominant axis, butprovide different parametrisation of the data on the StokesQ − U plane. This latter point is particularly crucial forapplying the SN spectropolarimetric classification scheme ofWang & Wheeler (2008).
3.3.1. Least-squares fit to the data
Straight lines, of the form U = α + βQ, were fit to thedata of both epochs, using a weighted least-squares fittingtechnique, where the data were weighted according to theerrors in both Q and U (Press et al. 1992). In order to confirmthe validity of this technique, the form of the straight line wasreversed and the best fit was calculated for Q = 1/βU − α/β,giving identical results. The value of β yields the angle ofthe dominant axis with respect to the Stokes Q-axis, throughwhich the data are to be rotated to decompose the Stokesvector onto the dominant and orthogonal axes. For a singleaxial symmetry, the dominant axis will pass through theorigin of the Stokes Q − U plane. In instances where the dataare offset from the origin (e.g. by a wavelength-independentcontinuum polarization component) the offset will be par-tially manifested in the measured α parameter.Dominant axes were calculated for the data at both epochsover two different wavelength ranges: 3700 to 8600Å and4000-7000Å. The former range wavelength encompasses theentire wavelength range of the observed data, whereas the
latter excludes regimes with poor levels of signal-to-noise(S/N ≤ 200). The regions of low signal-to-noise arise at theblue and red extremes of the data, due to line-blanketing andthe blue spectral energy distribution significantly reducingthe observed flux in the blue and red, respectively, and thedeclining detector response (in the red).The results of the least-squares analysis and the properties ofthe determined dominant axes are presented in Table 3. Thevalues of α, β, and the polarization angle of the dominant axis(θdom = 1
2 arctan β) were found to be relatively insensitive,within the uncertainties, to the choice of the wavelengthrange over which the dominant axis was calculated. Thedominant axes are shown on the Stokes Q − U plane on Figs.5 and 6. The large values of χ2 for the straight line fit, atboth epochs, indicate that the data are poorly described by astraight line, with a significant polarization component in theorthogonal direction. At the first epoch, simple inspection ofthe data on the Stokes Q − U plane would suggest that thedata are evenly distributed in angle about the centroid (as isillustrated in Section 3.3.2). At the second epoch, a dominantaxis is more clearly observed.
3.3.2. Principal Components Analysis
In order to better understand and quantify the distributionof the data on the Q − U Stokes plane and, in particular, thedegree of the orthogonal polarization component, a principalcomponent analysis of the data was conducted.The elements of the 2×2 weighted covariance matrix take theform:
covw(X j, Xk) =
∑i
1∆Xi j
1∆Xik
(Xi j − X j
) (Xik − Xk
)∑
i1
∆Xi j
1∆Xik
NN − 1
(2)
where j, k = 0, 1, X0 = Q, X1 = U (see Bevington & Robin-son 2003), i = 1...N and the weighted average of the Stokesparameters are X j =
∑i
Xi j
∆X2i j/∑
i1
∆X2i j
, as shown in Table 3,
over the N wavelength bins. The eigenvectors and eigenval-ues of the covariance matrix provide an alternative measureof the angles of the dominant and orthogonal axes (θe/2) andthe ratio of the degrees of polarization in the dominant andorthogonal directions (an axial ratio for the resulting ellipseb/a), respectively. This latter quantity can be used to describean ellipse on the Stokes Q −U plane which contains the data.The results of the principal component analysis are presentedin Table 3, and corresponding ellipses are presented on Figs.5 and 6. As expected, the polarization angle of the dominantaxis determined using this analysis agrees, within the uncer-tainties, with the result from the least-squares fit.The non-zero values of b/a determined from the principalcomponents analysis show that the data at the two epochsare inconsistent with both straight lines and null polarization.This suggests that, although the polarization measured at bothepochs is low, we have measured a real polarization signal forSN 2005hk. The ratio of the dominant and orthogonal compo-nents measured at the second epoch is smaller than that mea-sured at the first, implying that at the first epoch the ejectawere approximately round and, with time, departed more sig-nificantly from the spherical symmetry.This interpretation requires some caution, however, asChornock et al. observed data that corresponded to a dom-inant axis four days prior to our first observation, which wedo not see in our data at the first epoch. This may reflect the

6
low S/N of our first observation, rather than an “oscillating”evolution in shape of the structure of the ejecta; with the ejectaappearing approximately spherical at maximum but departingfrom a spherical symmetry both before and after maximumlight.
3.3.3. The data on the dominant and orthogonal axes
The data were rotated onto the dominant and orthogonalaxes, using the angles determined from the least-squares fitanalysis (for the limited wavelength range of 4000-7000Å).The rotated data are presented as Figs. 7 and 8. Despitethe apparent increase in the polarization angle from the firstto second epochs, the determined polarization angles for thedominant axes are different from the angle measured at -4days, for which Chornock et al. determined θdom = 35.6◦.At the first epoch, the dominant and orthogonal polarizationcomponents are similar to Stokes Q and U, due to the smallangle through which the data were rotated. The polarizationmodulations associated with Ca II, Fe III, Si II are predomi-nantly observed in the dominant polarization component, andover the range 4000-7000Å the deviations observed in theorthogonal polarization spectrum are consistent with the ex-pected noise level. Similar to the Chornock et al. observa-tions at -4 days, an important exception is the 7200Å ab-sorption feature (and possibly Fe III λ5129) which has bothdominant and orthogonal polarization components (althoughChornock et al. refer to the rotated Stokes parameters qRS Pand uRS P, these are equivalent to our dominant and orthog-onal axes). At our second epoch, the majority of features,associated with Fe II, Na I and, particularly, the 7200Å fea-ture show some modulation in both the dominant and orthog-onal polarization components. While Chornock et al. ob-served an obvious wavelength dependence in the dominantpolarization component, with increasing Pd at redder wave-lengths (which we estimate to be 0.1% per 1000Å), 4 dayslater we found the wavelength dependence to be shallower0.05% ± 0.01 per 1000Å. At +14 days we measure a similarwavelength dependence 0.07%± 0.01 per 1000Å. This wave-length dependence is clearly seen on Fig. 6. The change maynot be evidence for evolution in the wavelength dependenceof the dominant polarization component, in itself, as the ob-servations of Chornock et al. were acquired with higher S/N.Such wavelength dependence of the polarization, increasingat redder wavelengths was observed for SN 1999by (Howellet al. 2001). At the temperatures determined for SN 2005hk,and for Fe-rich matter, the opacity at the photosphere is dom-inated by blends of line transitions for λ < 6000Å (see Fig.2 of Hoflich et al. 1993). At redder wavelengths, the opacityis primarily due to electron scattering. The continuum po-larization may indicate an aspherical Thomson scattering re-gion, e.g. by a global asymmetry induced by the rotation ofthe White Dwarf progenitor (Howell et al. 2001) or off-centerdelayed detonations (Hoflich et al. 2006). Because multipleline scatterings are effectively depolarizing, the observationof increasing polarization with wavelength may be understoodin terms of the decrease of the role of line opacity at redderwavelengths. If the dominant axis corresponds to a principalaxial symmetry, then the line forming regions of the speciesobserved in the flux spectrum follow the same axial symme-try as that of the continuum at the first epoch, but not at thesecond epoch.
3.4. The Inferred Ejecta GeometryOn the basis of the continuum polarizations measured at 0
and 14 days, any asymmetry in the shape of the photosphere(assuming a spheroidal configuration) requires an axial ratio> 0.9 (Hoflich 1991). A similar limit on the asphericity of thephotosphere is achieved if one uses the higher value of con-tinuum polarization (0.36%) determined by Chornock et al.The general level of line polarization is low, suggestingthat the line forming regions cover an approximately spher-ically symmetric photosphere homogeneously. Limits on theamount of polarization expected to be observed can be calcu-lated, given a level of continuum polarization and line depth,under the assumption that the line forming region blocks onlyunpolarized light from the photosphere, while not blockingpolarized light arising from the limb (i.e. that the photo-sphere can be separated into discrete polarized and unpolar-ized zones):
pline ≤ pcont.Icont
Iline(3)
where Icont and Iline are the observed fluxes in the continuumand in the absorption line minimum, respectively (i.e. suchthat the line depth is Icont − Iline - this convention is chosen asthe observed polarization arises from the light that is not ab-sorbed). As Chornock et al. (2006) calculated for their obser-vation of SN 2005hk, we also calculate the theoretical limitson the line polarization for measured absorption line depthsin our observations.At the first epoch, the maximum polarization for the Si IIλ6355 line is only 0.14%. As Chornock et al. suggest, thatthe lines are not strongly polarized is commensurate with theirapparent weakness. This is true at the first epoch, where linestrengths of only > 0.7 are observed. At the second epoch,however, absorption line depths of ∼ 0.5 are observed, andwith the increase in depth of these lines it might be expectedthat, should the line forming regions be asymmetric, that therewould also be a commensurate increase in the polarization ob-served across these lines (see Fig. 9).Eqn. 3 assumes that all of the polarization is due to the con-tinuum, which implicitly assumes that the photosphere itselfis asymmetric. In a number of cases, in particular for core-collapse SNe, the classical limit for line polarization is ex-ceeded (see e.g. Maund et al. 2007a, 2009), for low values ofcontinuum polarization which suggest approximately spheri-cal photospheres. Violations of this criterion can be explainedby large scale structure, with a dissimilar geometry to that ofthe photosphere, or clumping, which may produce polariza-tion irrespective of the shape of the photosphere or the degreeof continuum polarization. The degree of observed polariza-tion, for a clumpy line forming region, should depend on thesize of the clumps: for a given line absorption depth, fewerlarger clumps block larger areas with contiguous polarizationvectors, whereas more smaller clumps can be distributed moreevenly across the photosphere.In order to explore the possible role of clumping, and theexpectation for the production of polarization across shallowlines, a Monte-Carlo toy model of a simple photosphere andobscuring clumped line forming region was constructed fol-lowing the scheme of Wang et al. (2007). A circular contin-uum emitting photosphere was adopted, with the luminosityas a function of projected radius rp across a photosphere of
7
radius Rph set to:
I(rp)/I(0) = 1 − k
1 −√
1 −(rp/Rph
)2 (4)
with limb darkening modelled using the coefficient k, whichfor k = 0 yields no limb darkening. For a three-dimensionalspherical photosphere, this would correspond to to a limbdarkening law of I(rp = Rph sin θ)/I(0) = (1 − k (1 − cos θ)).The radial dependence of the polarization was assumed to fol-low a quadratic form p ∝ (rp/Rph)2, with the constant of pro-portionality chosen to yield 15% polarization for light emittedat the limb of the photosphere (Chandrasekhar 1960). Opaquecircular clumps were assumed, with τ >> 1, such that allphotospheric flux from the region underlying the clump wasblocked. For each iteration of the model, N clumps of sizeRclump/Rph were randomly positioned across the photosphereand the corresponding flux of the uncovered regions, and theirpolarization components, were summed. Clumps were per-mitted to overlap and only partially cover the photosphere.For each size of clumps, 3000 simulations were conducted.This permits a comparison of the expected polarization fora given absorption line depth, assuming a particular clumpsize in the line forming region. The results of this model (forRclump/Rph = 0.1, 0.2, 0.3 and 0.4) are shown as Fig. 9.For some of the models, zero polarization was achieved foruniform coverage of the photosphere by the clumps, howeverthe difference between the average polarizations expected (asshown in Fig. 9) and null polarization was > 1σ for all the cal-culated models. These models suggest that, for a clumpy lineforming region, the clump scale for SN 2005hk is very small(≤ 0.2Rph) to produce lines of the depths observed, in theflux spectra at both epochs, with low polarization. The uni-formly low polarization observed for lines arising from differ-ent species suggest that the ejecta are generally mixed, withno separate structures on the plane of the sky for different el-ements or ionization stages(e.g Fe II and Fe III). The elementresponsible for the absorption at 7200Å may be an excep-tion, with a line forming region that is more aspherical thanother species. The data for SN 2005hk, at the two epochs pre-sented here and those presented by Chornock et al. (2006), areconsistent with an approximately spherical symmetric pho-tosphere surrounded by similar line forming regions for allspecies.The principal assumption of the model presented above isthat the line forming region and the photosphere are sepa-rate. As discussed in §3.3.3, the opacity at the photosphere(where the quasi-continuum forms) is not due to electron scat-tering alone, but rather includes a significant wavelength de-pendent contribution from atomic transitions; this implies thatline forming regions are not, in reality, separate entities exceptin the most high-velocity regions such as those discussed byKasen et al. (2003).The size of the clumps and their relation to ”large-scale”structure within the ejecta, leads to an interesting problem ofsemantics: since very large clumps (Rclump/Rph = 0.4) maybe considered large scale structure and very small clumps(Rclump/Rph = 0.1) tend towards constituting an effectivelyhomogeneous medium. Large opacities require that a largefraction of the photosphere, the last Thomson scattering dis-tance, are reprocessed by lines, mostly due to iron-group ele-ments (which will result in a significantly altered spectrum).
4. DISCUSSION
4.1. SN 2005hk as a Type Ia SNThe class of SNe similar to SN 2002cx currently has 15
members, including 2005hk and 2008ha (Foley et al. 2009).As discussed in detail by Li et al. (2003) and Phillips et al.(2007), both SN 2002cx and SN 2005hk were of especiallylow velocity at the photosphere near maximum light, ∼ 6000km s−1 , had early relatively high ionization, and low peakluminosity. Neither showed the typical secondary maximain R and I of normal SN Ia, but were also dissimilar topreviously studied under-luminous SN Ia that do not showthe secondary maxima (e.g. Filippenko et al. 1992). Thereis also extreme diversity within the class, with SN 2008habeing ≈ 3 magnitudes fainter than SN 2002cx (Foley et al.2009). The light curve decline is rather slow, unlike previousunder-luminous SN Ia that serve to define the light curvebrightness/decline relation prominently used in cosmologystudies.Li et al. (2003) pointed out that no published model of aSN Ia corresponds to all the behavior of SN 2002cx, butsuggested that a pulsating delayed detonation (Khokhlov1991) model might be worth considering further. Jha et al.(2006) suggested that the nebular spectral characteristics thatthey determined might be consistent with a pure deflagrationmodel since the models in the literature have insufficientenergy to correspond to normal SNe Ia and hence tend tohave smaller expansion velocities and produce less 56Ni andhence tend to be dim. Phillips et al. (2007) suggest thatthe low expansion velocities, low peak luminosity, and theabsence of secondary maxima in the NIR light curves may bereproduced by a 3D pure-deflagration model (Gamezo et al.2004; Ropke et al. 2006) that produces 0.25M� of 56Ni.A key issue with the hypothesis that this class of explosionsrepresents pure deflagrations of white dwarfs is that the puredeflagration models leave a substantial amount of unburnedC and O in the outer layers. This C and O should show upin the early phases and while O I λ7774 is clearly present atthe second epoch (and possibly the first), the case for C IIλ6578 (and possibly for a contribution to the 7200Å feature)is less clear but it is not conclusively absent. In addition,Kozma et al. (2005) suggest that the late-time spectra of puredeflagration models show no similarity to that of SN 2002cxeither, in particular the absence of strong features due to Cand O. Jha et al. (2006) claim a marginal detection of O I inlate-time nebular spectra of SN 2002cx, with the suggestionthat more unburned C and O may be contained inside thedense, still optically thick core at late times. Sahu et al.claim that at early times O I λ7774 is suppressed by hightemperatures and, at late times, nebular O I lines are alsosuppressed by high temperatures. The lack of observationof O I λ7774 for SN 2005hk at very early times (before ourobservations) is uncertain, due to poor spectral coverage atearly times (Phillips et al. 2007) and low S/N (Sahu et al.2008). Sahu et al. (2008) are able to approximately modelthe photospheric spectrum of SN 2005hk, based on theW7 deflagration explosion model (Nomoto et al. 1984).Importantly, Sahu et al. find that, given the conditions ofthe SN, their spectral synthesis suggests large amounts ofunburned O. Their model also assumes spherical symmetry,for which they achieve a reasonable approximation to theline profiles (which are somewhat sensitive to any departuresfrom spherical symmetry; see e.g. Tanaka et al. 2009 for acounter example). The features remain too broad, are for-bidden rather than permitted, and show prominent emission

8
of [O I] λ6300, 6364. High densities, as evidenced by thelow expansion velocities and P Cygni profiles observed atlate nebular epochs, might suppress the [O I] feature, butit is predicted in the models and so its absence is a definiteconstraint on the nature of SN 2005hk.Chornock et al. (2006) consider the possibility that theseevents may be related to normal SNe Ia, but viewed along the“hole” left by having the binary companion nearly directlyalong the line of sight (Marietta et al. 2000; Kasen et al.2004). Such an aspect might increase the prominence ofhigh-ionization species, weaken absorption lines, reduce thephotospheric velocity and induce some polarization due tothe non-spherical geometry of the ejecta. One issue with thismodel for SN 2002cx and related explosions is that it wouldresult in higher luminosities than when viewed from otheraspect angles. Even if the underlying explosion were a sub-luminous event such as SN 1991bg, if the view were “downthe hole,” the result would be brighter than SN 1991bg. BothSN 2002cx and SN 2005hk were subluminous by about 1magnitude in all bands (except H; Phillips et al. 2007). It iscertainly not clear that this is consistent with a “hole” model.Chornock et al. 2006 comment that their measurement ofa small but appreciable continuum polarization and weakline features was inconsistent with the prediction of Kasenet al. (2004) of a continuum polarization of ∼ 0.1 percentand strong line polarization peaks for an explosion viewedslightly off the axis of the hole. As the SN evolves, therelative size of the hole and the photosphere will change(in particular if the hole closes, which Kasen et al. 2004expect to be a slow process if it occurs), which should leadto a commensurate change in the polarization properties.Importantly, we see only moderate change in the polarization,despite the significant changes in the flux spectrum, betweenthe epochs at which SN 2005hk was observed. In addition,it is not at all clear how such a model would account for thelate-time permitted line spectrum delineated by Jha et al.(2006). Our observations do suggest some line polarization.This demands some asymmetry in the ejecta, consistent witha single axial symmetry, but does not spell out quantitativeagreement with the “hole” model.An alternative model might be a “plume” model (Plewaet al. 2004; Livne et al. 2005) in which a single plume (orvery few plumes) reach the surface, spreading fresh 56Ni.If the plume burned little, the expansion might be slow andleave high densities at late times. Our spectropolarimetrysuggests that the outer layers of the ejecta are approximatelyhomogeneously mixed, although stratified, which suggestsmixing in a large number of smaller plumes (with size≤ 0.2Rph at the first epoch).This class of objects thus presents many conundra. Theyshow high excitation early on but otherwise have none of theproperties of SNe Ia like SN 1991T that show early Fe III.Their light curves are dim but broad, violating the “Phillipsrelation”. They have very slow expansion velocities and mayremain partially optically thick at nearly 300 days after theexplosion. They are mildly asymmetric in the continuum,in the Fe III early on and in Si II near maximum. Thepolarization of SN 2005hk is completely compatible with theobserved range of polarization properties for Type Ia SNe(see Table 4). The level of polarization of SN 2005hk isnot the lowest detected for a SN, with SN 1996X (a normalType Ia SN; Wang et al. 1997) showing polarization justabove statistical significance and with no apparent dominant
axis. The observations of SN 2005hk show it to have aspectropolarimetric type of D1 (Wang & Wheeler 2008),similar to most Type Ia SNe, indicating that there is aprincipal axis of symmetry to the ejecta. Importantly, thereare no apparent loop like features, even for the strongest lines(which is particularly pertinent for the observations at thesecond epoch) which would indicate a significant departurefrom this main axial symmetry. Normal Type Ia SNe, such asSN 2001el (Wang et al. 2003a) and SN 2004S (Chornock &Filippenko 2008), show some structure in their ejecta princi-pally in the Si II, as well as the high velocity component ofthe Ca II IR3 (see also Wang et al. 2003a; Patat et al. 2009).Conversely, there are Type Ia SNe, such as SN 2004dt (Wanget al. 2006), whose line polarization is principally in thedominant polarization component which is consistent with asingle axial symmetry. In the case of SN 2004dt, however,the observed line polarization was ∼ 1%. In summary, thesimilarity between the spectropolarimetry of SN 2005hkand Type Ia SNe indicates that their respective explosionmechanisms are both approximately spherical (see Table 4).Wang et al. (2007) identified a correlation between thedegree of polarization of Si II, at -5 days, with the declinerate (∆m15(B)) of the light curve. At some wavelengthsSN 2005hk is an outlier from the Phillips brightness-declinerelationship, although it is consistent with the relationshipin the I and H bands (Phillips et al. 2007). While thepolarization measurements of SN 2005hk is offset from themeasured relation derived for normal Type Ia SNe by Wanget al., it is not as significant an outlier as the subluminousType Ia SNe 1999by and 2005ke (see Fig. 10).
4.2. SN 2005hk as a Core-Collapse SNJha et al. (2006), Valenti et al. (2009) and Foley et al.
(2009) consider the possibility that events such as SN 2002cxand 2005hk are not related to Type Ia SNe, but may in-stead be a type of CCSN. Based on the photometric andspectroscopic similarity between SN 2008ha and SN 2005hkwith low-luminosity Type IIP and Type Ic SNe (2005cs and2007gr, respectively) and the occurrence of these events inlate-type galaxies, Valenti et al. (2009) suggest 2002cx-likeSNe are low-luminosity Type Ic SNe, potentially associatedwith Gamma Ray Bursts (GRBs). Foley et al. (2009) presentadditional events in this class, which are claimed to have takenplace in lenticular S0 galaxies, which may argue against mas-sive stars as the universal progenitors for this type of event.Spectropolarimetry provides additional parameter space inwhich to examine the similarities between different types ofSNe.Valenti et al. (2009) and Foley et al. (2009) note the spectro-scopic similarity between SN 2005hk and SN 2008ha at +15and +8 days (after optical maximum), respectively, as well astheir similarity with the subluminous Type IIP SN 2005cs at+44 days, whilst it was still on the photometric plateau (Pas-torello et al. 2009). At such times Type IIP SNe have gener-ally low polarizations (Leonard et al. 2006), seemingly similarto that observed by us for SN 2005hk. From a spectropolari-metric perspective, however, comparison of SN 2005hk withSN 2005cs whilst on the plateau is inappropriate. During theplateau phase, in Type IIP SNe, the photosphere is locatedin the hydrogen envelope. Due to the low ionization energyof H, the shape of the photosphere is approximately spher-ical. Once the photosphere has descended below the H en-velope, into the He layer (He being harder to ionize and ex-
9
cite), the shape of the photosphere more closely follows theshape of the underlying exciting material. Despite an asym-metric explosion, Leonard et al. (2006) observed that duringthe plateau SN 2004dj had a low polarization, which increasedsignificantly once the plateau phase had ended. Given the H-deficient nature of SN 2002cx-like SNe, a more appropriatecomparison is with the H-deficient CCSNe, which have beenobserved (as listed in Table 4) to have significant continuumand line polarization for different species indicating the roleof highly asymmetric explosion mechanisms. Highly asym-metric interiors have also been observed for the Type IIP SNe2001dh and 2003gd (Maund et al., 2010, in prep.), which sug-gest that an asymmetric explosion mechanism is common toall these CCSN events.It is interesting to note another ongoing controversy involv-ing SNe Ia and SNe Ic. SN 2002ic was revealed by Hamuyet al. (2003) to resemble a SN Ia embedded in a hydrogen-rich medium. Hamuy et al. interpreted this as a SN Iaexploding with an evolved binary companion. Wang et al.(2004) showed that the hydrogen component was stronglypolarized and argued that the geometry was consistent withan extended, clumpy, disk-like structure such as observed inproto-planetary nebula stars. Hamuy et al. and Wang et al.(2004) identified other events of this category that were orig-inally identified as Type IIn events, but which, on closer in-spection and comparison with SN 2002ic, revealed an under-lying Type I spectrum. More recently, Benetti et al. (2006)have challenged this interpretation, arguing that the underly-ing supernova in SN 2002ic more closely matched a SN Icthan a SN Ia.In summary, the nature of the polarization of SN 2005hk is in-consistent with the polarization measured for CCSNe, in par-ticular those of Type Ibc which have been generally observedto have very large polarization (especially line polarization)that increases with time.
5. CONCLUSIONS
SN 2005hk has been observed at two epochs, correspond-ing to maximum light and two weeks after maximum. Af-ter subtraction of the ISP component, the SN is observed tohave a very low to null intrinsic polarization. A modulationin the Stokes parameters is observed across the Si II λ6355line being the most significant feature, at the first epoch, with∆P = 0.54 ± 0.12%.At both epochs, a dominant axis can be fit to the data, al-though the data are poorly described by simple straight linefits on the Stokes Q − U plane. While there is modulation inthe dominant polarization component, at the first epoch, that isassociated with line features in the flux spectrum, the absenceof similar modulations in the orthogonal polarization compo-
nent implies that the line forming regions of the species in theflux spectrum share the same axial symmetry as that of thephotosphere. The data at both epochs is classified as being ofSpectropolarimetric Type D1.In comparison with previously published high S/N observa-tions of SN 2005hk at -4 days (Chornock et al. 2006), weobserve a possible rotation of the polarization angle of thedominant axis, but it is unclear (due to the differences in S/N)if this represents a real rotation of the principal axis of sym-metry with depth into the ejecta.The low level of continuum polarization limits the asymme-try of the photosphere, at both epochs, to < 10%. The lowline polarization is suggestive that the line forming regions aremixed, that different species occupy similar locations withinthe ejecta, and that they have a similar geometry to that of thephotosphere. This is similar to the general behaviour of TypeIa SNe, and different from the chemically segregated ejectaobserved for CCSNe.We conclude that the spectropolarimetry of SN 2005hk is notinconsistent with some of the expectations of the deflagrationexplosion model. We find that, in order to preserve the ap-proximate spherical symmetry of the photosphere and the lineforming regions, any plume-like structures would be requiredto have a scale, in the plane of the sky, of ≤ 0.2Rph at bothepochs. This would give the overall appearance of homoge-neously mixed ejecta containing both the products of nucle-osynthesis (Fe, Ni, Co) and unburned O at all depths.Spectral similarities between SN 2002cx-like events and low-luminosity Type IIP SNe are likely to be merely superfi-cial. The differences in the observed spectropolarimetry ofSN 2005hk with CCSNe suggests, from a geometry perspec-tive, that these events have different underlying explosionmechanisms. Unfortunately, with spectropolarimetry of onlyone SN from the 2002cx-like class it is not possible to deter-mine if these results are applicable to the entire class, in par-ticular to the most peculiar member of this class, SN 2008ha.
ACKNOWLEDGEMENTS
The research of JRM is funded through the Sophie & Ty-cho Brahe Fellowship. The Dark Cosmology Centre is sup-ported by the DNRF. The research of JCW is supported in partby NSF grant AST-0707769. PAH is supported by the NSFgrants AST 0708855 and 0703902. The authors are gratefulto the European Organisation for Astronomical Research inthe Southern Hemisphere for the generous allocation of ob-serving time. They especially thank the staff of the ParanalObservatory for their competent and never-tiring support ofthis project in service mode. The authors thank the anony-mous referee for useful comments and suggestions that haveimproved the manuscript.
REFERENCES
Benetti, S., Cappellaro, E., Turatto, M., Taubenberger, S., Harutyunyan, A.,& Valenti, S. 2006, ApJL, 653, L129
Bevington, P. R., & Robinson, D. K. 2003, Data reduction and error analysisfor the physical sciences (Boston, MA: McGraw-Hill)
Branch, D., Baron, E., Thomas, R. C., Kasen, D., Li, W., & Filippenko,A. V. 2004, PASP, 116, 903
Burket, J., & Li, W. 2005, IAUC, 8625Cardelli, J. A., Clayton, G. C., & Mathis, J. S. 1989, ApJ, 345, 245Chandrasekhar, S. 1960, Radiative transfer (New York: Dover, 1960)Chornock, R., & Filippenko, A. V. 2008, AJ, 136, 2227Chornock, R., Filippenko, A. V., Branch, D., Foley, R. J., Jha, S., & Li, W.
2006, PASP, 118, 722
Filippenko, A. V., Richmond, M. W., Branch, D., Gaskell, M., Herbst, W.,Ford, C. H., Treffers, R. R., Matheson, T., Ho, L. C., Dey, A., Sargent,W. L. W., Small, T. A., & van Breugel, W. J. M. 1992, AJ, 104, 1543
Foley, R. J., Chornock, R., Filippenko, A. V., Ganeshalingam, M., Kirshner,R. P., Li, W., Cenko, S. B., Challis, P. J., Friedman, A. S., Modjaz, M.,Silverman, J. M., & Wood-Vasey, W. M. 2009, AJ, 138, 376
Gamezo, V. N., Khokhlov, A. M., & Oran, E. S. 2004, Physical ReviewLetters, 92, 211102
Hamuy, M., Phillips, M. M., Suntzeff, N. B., Maza, J., Gonzalez, L. E.,Roth, M., Krisciunas, K., Morrell, N., Green, E. M., Persson, S. E., &McCarthy, P. J. 2003, Nature, 424, 651
Hoflich, P., Mueller, E., & Khokhlov, A. 1993, A&A, 268, 570Hoflich, P. 1991, A&A, 246, 481
10
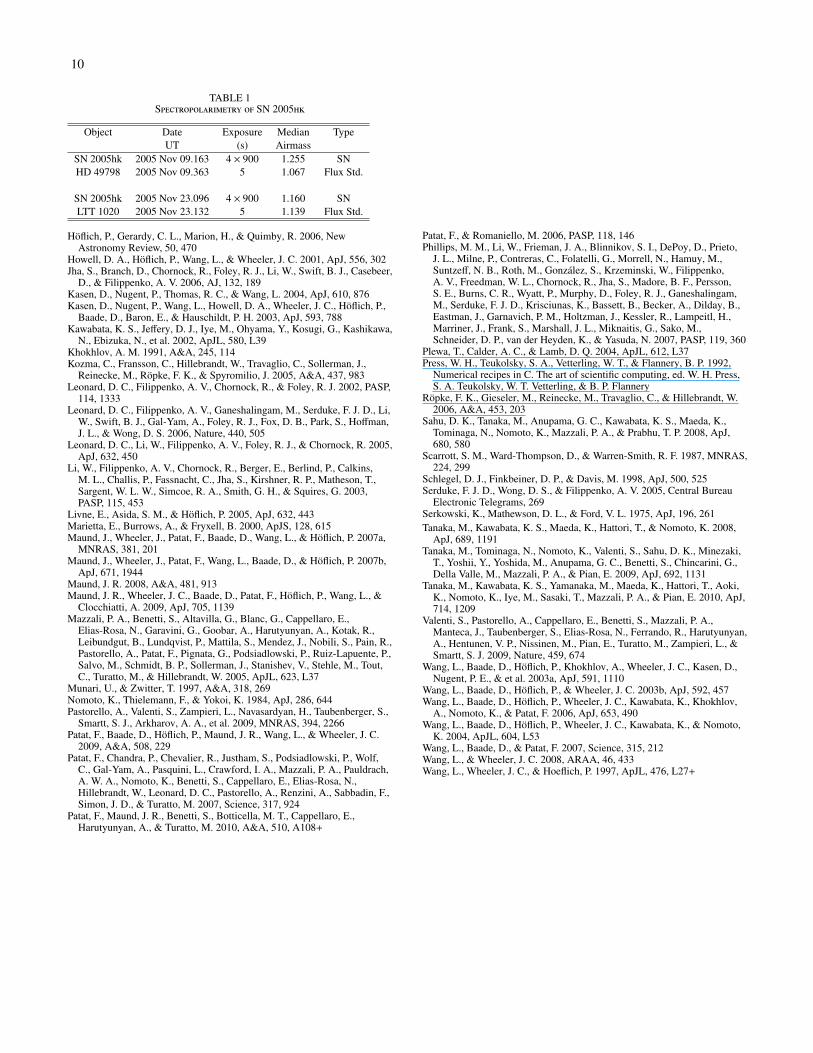
TABLE 1Spectropolarimetry of SN 2005hk
Object Date Exposure Median TypeUT (s) Airmass
SN 2005hk 2005 Nov 09.163 4 × 900 1.255 SNHD 49798 2005 Nov 09.363 5 1.067 Flux Std.
SN 2005hk 2005 Nov 23.096 4 × 900 1.160 SNLTT 1020 2005 Nov 23.132 5 1.139 Flux Std.
Hoflich, P., Gerardy, C. L., Marion, H., & Quimby, R. 2006, NewAstronomy Review, 50, 470
Howell, D. A., Hoflich, P., Wang, L., & Wheeler, J. C. 2001, ApJ, 556, 302Jha, S., Branch, D., Chornock, R., Foley, R. J., Li, W., Swift, B. J., Casebeer,
D., & Filippenko, A. V. 2006, AJ, 132, 189Kasen, D., Nugent, P., Thomas, R. C., & Wang, L. 2004, ApJ, 610, 876Kasen, D., Nugent, P., Wang, L., Howell, D. A., Wheeler, J. C., Hoflich, P.,
Baade, D., Baron, E., & Hauschildt, P. H. 2003, ApJ, 593, 788Kawabata, K. S., Jeffery, D. J., Iye, M., Ohyama, Y., Kosugi, G., Kashikawa,
N., Ebizuka, N., et al. 2002, ApJL, 580, L39Khokhlov, A. M. 1991, A&A, 245, 114Kozma, C., Fransson, C., Hillebrandt, W., Travaglio, C., Sollerman, J.,
Reinecke, M., Ropke, F. K., & Spyromilio, J. 2005, A&A, 437, 983Leonard, D. C., Filippenko, A. V., Chornock, R., & Foley, R. J. 2002, PASP,
114, 1333Leonard, D. C., Filippenko, A. V., Ganeshalingam, M., Serduke, F. J. D., Li,
W., Swift, B. J., Gal-Yam, A., Foley, R. J., Fox, D. B., Park, S., Hoffman,J. L., & Wong, D. S. 2006, Nature, 440, 505
Leonard, D. C., Li, W., Filippenko, A. V., Foley, R. J., & Chornock, R. 2005,ApJ, 632, 450
Li, W., Filippenko, A. V., Chornock, R., Berger, E., Berlind, P., Calkins,M. L., Challis, P., Fassnacht, C., Jha, S., Kirshner, R. P., Matheson, T.,Sargent, W. L. W., Simcoe, R. A., Smith, G. H., & Squires, G. 2003,PASP, 115, 453
Livne, E., Asida, S. M., & Hoflich, P. 2005, ApJ, 632, 443Marietta, E., Burrows, A., & Fryxell, B. 2000, ApJS, 128, 615Maund, J., Wheeler, J., Patat, F., Baade, D., Wang, L., & Hoflich, P. 2007a,
MNRAS, 381, 201Maund, J., Wheeler, J., Patat, F., Wang, L., Baade, D., & Hoflich, P. 2007b,
ApJ, 671, 1944Maund, J. R. 2008, A&A, 481, 913Maund, J. R., Wheeler, J. C., Baade, D., Patat, F., Hoflich, P., Wang, L., &
Clocchiatti, A. 2009, ApJ, 705, 1139Mazzali, P. A., Benetti, S., Altavilla, G., Blanc, G., Cappellaro, E.,
Elias-Rosa, N., Garavini, G., Goobar, A., Harutyunyan, A., Kotak, R.,Leibundgut, B., Lundqvist, P., Mattila, S., Mendez, J., Nobili, S., Pain, R.,Pastorello, A., Patat, F., Pignata, G., Podsiadlowski, P., Ruiz-Lapuente, P.,Salvo, M., Schmidt, B. P., Sollerman, J., Stanishev, V., Stehle, M., Tout,C., Turatto, M., & Hillebrandt, W. 2005, ApJL, 623, L37
Munari, U., & Zwitter, T. 1997, A&A, 318, 269Nomoto, K., Thielemann, F., & Yokoi, K. 1984, ApJ, 286, 644Pastorello, A., Valenti, S., Zampieri, L., Navasardyan, H., Taubenberger, S.,
Smartt, S. J., Arkharov, A. A., et al. 2009, MNRAS, 394, 2266Patat, F., Baade, D., Hoflich, P., Maund, J. R., Wang, L., & Wheeler, J. C.
2009, A&A, 508, 229Patat, F., Chandra, P., Chevalier, R., Justham, S., Podsiadlowski, P., Wolf,
C., Gal-Yam, A., Pasquini, L., Crawford, I. A., Mazzali, P. A., Pauldrach,A. W. A., Nomoto, K., Benetti, S., Cappellaro, E., Elias-Rosa, N.,Hillebrandt, W., Leonard, D. C., Pastorello, A., Renzini, A., Sabbadin, F.,Simon, J. D., & Turatto, M. 2007, Science, 317, 924
Patat, F., Maund, J. R., Benetti, S., Botticella, M. T., Cappellaro, E.,Harutyunyan, A., & Turatto, M. 2010, A&A, 510, A108+
Patat, F., & Romaniello, M. 2006, PASP, 118, 146Phillips, M. M., Li, W., Frieman, J. A., Blinnikov, S. I., DePoy, D., Prieto,
J. L., Milne, P., Contreras, C., Folatelli, G., Morrell, N., Hamuy, M.,Suntzeff, N. B., Roth, M., Gonzalez, S., Krzeminski, W., Filippenko,A. V., Freedman, W. L., Chornock, R., Jha, S., Madore, B. F., Persson,S. E., Burns, C. R., Wyatt, P., Murphy, D., Foley, R. J., Ganeshalingam,M., Serduke, F. J. D., Krisciunas, K., Bassett, B., Becker, A., Dilday, B.,Eastman, J., Garnavich, P. M., Holtzman, J., Kessler, R., Lampeitl, H.,Marriner, J., Frank, S., Marshall, J. L., Miknaitis, G., Sako, M.,Schneider, D. P., van der Heyden, K., & Yasuda, N. 2007, PASP, 119, 360
Plewa, T., Calder, A. C., & Lamb, D. Q. 2004, ApJL, 612, L37Press, W. H., Teukolsky, S. A., Vetterling, W. T., & Flannery, B. P. 1992,
Numerical recipes in C. The art of scientific computing, ed. W. H. Press,S. A. Teukolsky, W. T. Vetterling, & B. P. Flannery
Ropke, F. K., Gieseler, M., Reinecke, M., Travaglio, C., & Hillebrandt, W.2006, A&A, 453, 203
Sahu, D. K., Tanaka, M., Anupama, G. C., Kawabata, K. S., Maeda, K.,Tominaga, N., Nomoto, K., Mazzali, P. A., & Prabhu, T. P. 2008, ApJ,680, 580
Scarrott, S. M., Ward-Thompson, D., & Warren-Smith, R. F. 1987, MNRAS,224, 299
Schlegel, D. J., Finkbeiner, D. P., & Davis, M. 1998, ApJ, 500, 525Serduke, F. J. D., Wong, D. S., & Filippenko, A. V. 2005, Central Bureau
Electronic Telegrams, 269Serkowski, K., Mathewson, D. L., & Ford, V. L. 1975, ApJ, 196, 261Tanaka, M., Kawabata, K. S., Maeda, K., Hattori, T., & Nomoto, K. 2008,
ApJ, 689, 1191Tanaka, M., Tominaga, N., Nomoto, K., Valenti, S., Sahu, D. K., Minezaki,
T., Yoshii, Y., Yoshida, M., Anupama, G. C., Benetti, S., Chincarini, G.,Della Valle, M., Mazzali, P. A., & Pian, E. 2009, ApJ, 692, 1131
Tanaka, M., Kawabata, K. S., Yamanaka, M., Maeda, K., Hattori, T., Aoki,K., Nomoto, K., Iye, M., Sasaki, T., Mazzali, P. A., & Pian, E. 2010, ApJ,714, 1209
Valenti, S., Pastorello, A., Cappellaro, E., Benetti, S., Mazzali, P. A.,Manteca, J., Taubenberger, S., Elias-Rosa, N., Ferrando, R., Harutyunyan,A., Hentunen, V. P., Nissinen, M., Pian, E., Turatto, M., Zampieri, L., &Smartt, S. J. 2009, Nature, 459, 674
Wang, L., Baade, D., Hoflich, P., Khokhlov, A., Wheeler, J. C., Kasen, D.,Nugent, P. E., & et al. 2003a, ApJ, 591, 1110
Wang, L., Baade, D., Hoflich, P., & Wheeler, J. C. 2003b, ApJ, 592, 457Wang, L., Baade, D., Hoflich, P., Wheeler, J. C., Kawabata, K., Khokhlov,
A., Nomoto, K., & Patat, F. 2006, ApJ, 653, 490Wang, L., Baade, D., Hoflich, P., Wheeler, J. C., Kawabata, K., & Nomoto,
K. 2004, ApJL, 604, L53Wang, L., Baade, D., & Patat, F. 2007, Science, 315, 212Wang, L., & Wheeler, J. C. 2008, ARAA, 46, 433Wang, L., Wheeler, J. C., & Hoeflich, P. 1997, ApJL, 476, L27+

11
TABLE 2Polarization changes across spectral features
Species λcont(Å) λline(Å) ∆P2005 Nov 09
Ca II H &K 3780 3960 0.64 ± 0.15%Fe II 4225 4315 0.34 ± 0.11%Si II 6120 6270 0.54 ± 0.12%Fe II? 7070 7215 0.45 ± 0.17%Ca II IR3 8340 8490 0.31 ± 0.40%
2005 Nov 23Ca II H &K 3750 3930 0.49 ± 0.23%Fe II 4017 4077 0.54 ± 0.19%Fe II 4610 4910 0.35 ± 0.12%Fe II 5910 6030 0.5 ± 0.11%Fe II? 7130 7220 0.34 ± 0.14%
TABLE 3Best-fit Dominant Axes
Least Squares Fit Analysis Principal Components CentroidsDate α β χ2/do f θdom Axial Ratio θe/2 Q U
b/a09 Nov 2005A 0.138 ± 0.008 0.077 ± 0.074 347.2/154 2.2 ± 7.7 0.87 3.7 −0.037 ± 0.016 0.135 ± 0.01609 Nov 2005B 0.138 ± 0.009 0.226 ± 0.084 202.3/98 6.4 ± 7.9 0.78 8.7 −0.049 ± 0.016 0.127 ± 0.016
23 Nov 2005A 0.075 ± 0.008 0.545 ± 0.051 288.8/154 14.3 ± 5.0 0.47 14.0 0.011 ± 0.016 0.081 ± 0.01523 Nov 2005B 0.079 ± 0.010 0.771 ± 0.077 160.9/98 18.8 ± 5.0 0.42 18.55 −0.022 ± 0.016 0.062 ± 0.016A for data over the wavelength range 3700-8600ÅB for data over the wavelength range 4000-7000Å
TABLE 4Comparison SN Spectropolarimetry
SN Spectral Epoch† SP Continuum Line Ref.Type Type‡ Pol. (%) Pol. (%)
1996X Ia (normal) -7 N1 < 0.3 Si II:0.6 ± 0.15 11999by Ia (sub) -1 D1 0.8 ± 0.1 22001el Ia (normal) +2 D1+L(Ca) 0.3 Si:0.3;Ca:0.7 32003du Ia (normal) +18 D1 0.2 42004S Ia (normal) +9 D 0.4% ≤ 0.5 52004dt Ia (normal) -7 D1(Si+Mg) Si II:2 62006X Ia (normal) 0 D1+L < 0.2 Si II:0.8 72005hk 2002cx-like -4 D1 0.4 8· · · · · · 0 D1 ∼ 0.2 this work· · · · · · 14 D1 ∼ 0.2 this work2002ap Ic (broad-lined) 0 DL ∼ 0.3% O I:4 92005bf Ib (pec) -6∗ D1,L(He+Ca) < 0.45% He I:1.3,Ca II:4 102007gr Ic +21 D1+L(Ca) 0.5% Ca II:2.5 112008D Ib 0 D1+L(He+Ca) < 0.4% He I:0.6,Ca II:1.8 12· · · · · · 14 D1+L(He+Ca) < 0.4% He I:1.1,Ca II:2.5 12
† Relative to optical maximum; ‡ SN Spectropolarimetric types seeWang & Wheeler (2008); ∗ relative to the second maximum; References (1)Wang et al. (1997); (2) Howell et al. (2001); (3) Wang et al. (2003a); (4)Leonard et al. (2005); (5) Chornock & Filippenko (2008); (6) Wang et al.(2006); (7) Patat et al. (2009); (8) Chornock et al. (2006); (9) Wang et al.(2003b), Kawabata et al. (2002), Leonard et al. (2002); (10) Maund et al.(2007a); (11) Tanaka et al. (2008); (12) Maund et al. (2009).
12
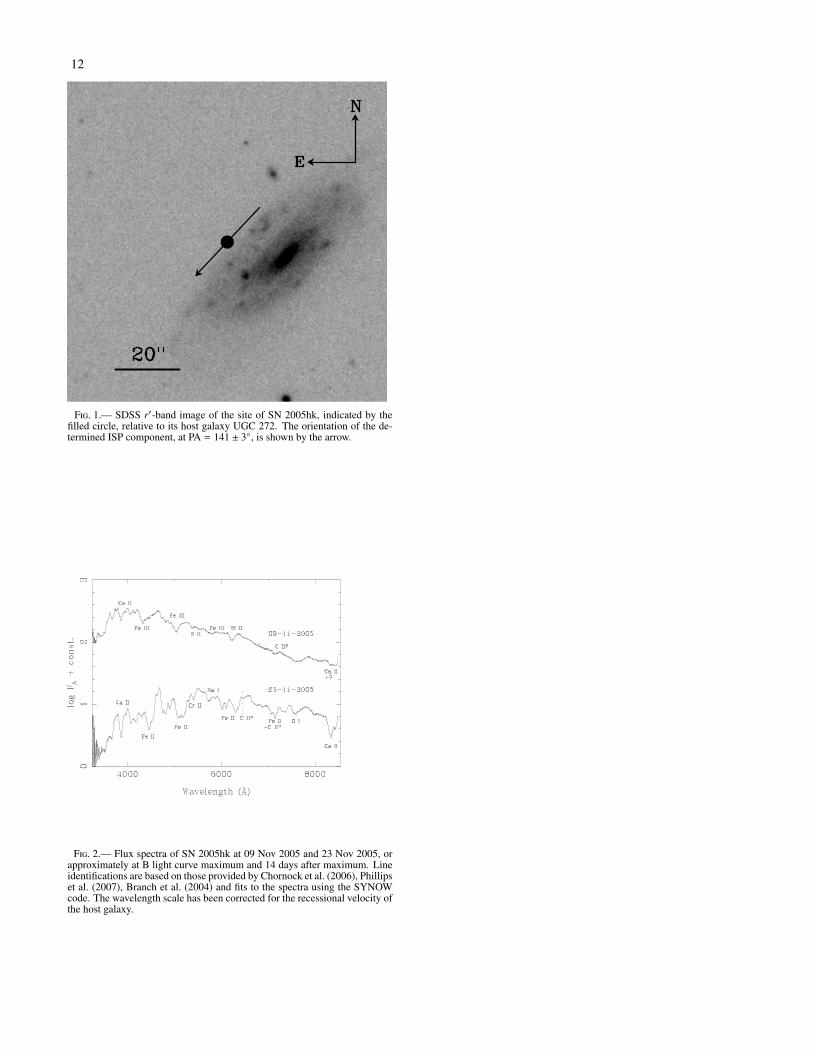
Fig. 1.— SDSS r′-band image of the site of SN 2005hk, indicated by thefilled circle, relative to its host galaxy UGC 272. The orientation of the de-termined ISP component, at PA = 141 ± 3◦, is shown by the arrow.
Fig. 2.— Flux spectra of SN 2005hk at 09 Nov 2005 and 23 Nov 2005, orapproximately at B light curve maximum and 14 days after maximum. Lineidentifications are based on those provided by Chornock et al. (2006), Phillipset al. (2007), Branch et al. (2004) and fits to the spectra using the SYNOWcode. The wavelength scale has been corrected for the recessional velocity ofthe host galaxy.
13
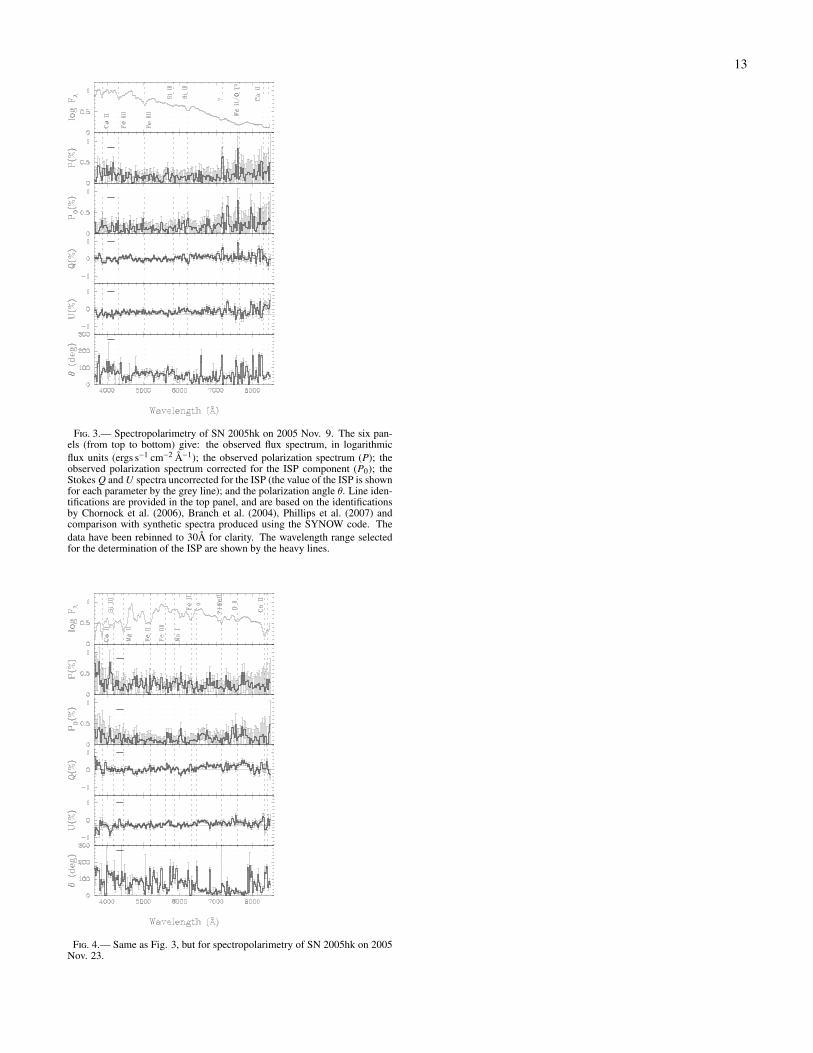
Fig. 3.— Spectropolarimetry of SN 2005hk on 2005 Nov. 9. The six pan-els (from top to bottom) give: the observed flux spectrum, in logarithmicflux units (ergs s−1 cm−2 Å−1); the observed polarization spectrum (P); theobserved polarization spectrum corrected for the ISP component (P0); theStokes Q and U spectra uncorrected for the ISP (the value of the ISP is shownfor each parameter by the grey line); and the polarization angle θ. Line iden-tifications are provided in the top panel, and are based on the identificationsby Chornock et al. (2006), Branch et al. (2004), Phillips et al. (2007) andcomparison with synthetic spectra produced using the SYNOW code. Thedata have been rebinned to 30Å for clarity. The wavelength range selectedfor the determination of the ISP are shown by the heavy lines.
Fig. 4.— Same as Fig. 3, but for spectropolarimetry of SN 2005hk on 2005Nov. 23.

14
Fig. 5.— Spectropolarimetry of SN 2005hk on 2005 Nov. 9, on the StokesQ−U plane. The data have been binned to 30Å for clarity, and have been cor-rected for the ISP component, which is indicated on the Stokes plane by thefilled black circle, with the radius of the circle corresponding the measureduncertainties. The data are colour coded according to wavelength followingthe scheme of the colour bar. The origin of the Stokes plane is indicated bythe cross (+). The black dashed circle represents the null polarization enve-lope, at 6000Å. The heavy black line indicates the best fit to the “dominantaxis.” The ellipse shows the apparent axial ratio and orientation of the data,as determined using the Principal Components Analysis, with the size of theellipse arbitrarily scaled.
Fig. 6.— Same as Fig. 5 but for spectropolarimetry of SN 2005hk at 2005Nov. 23.
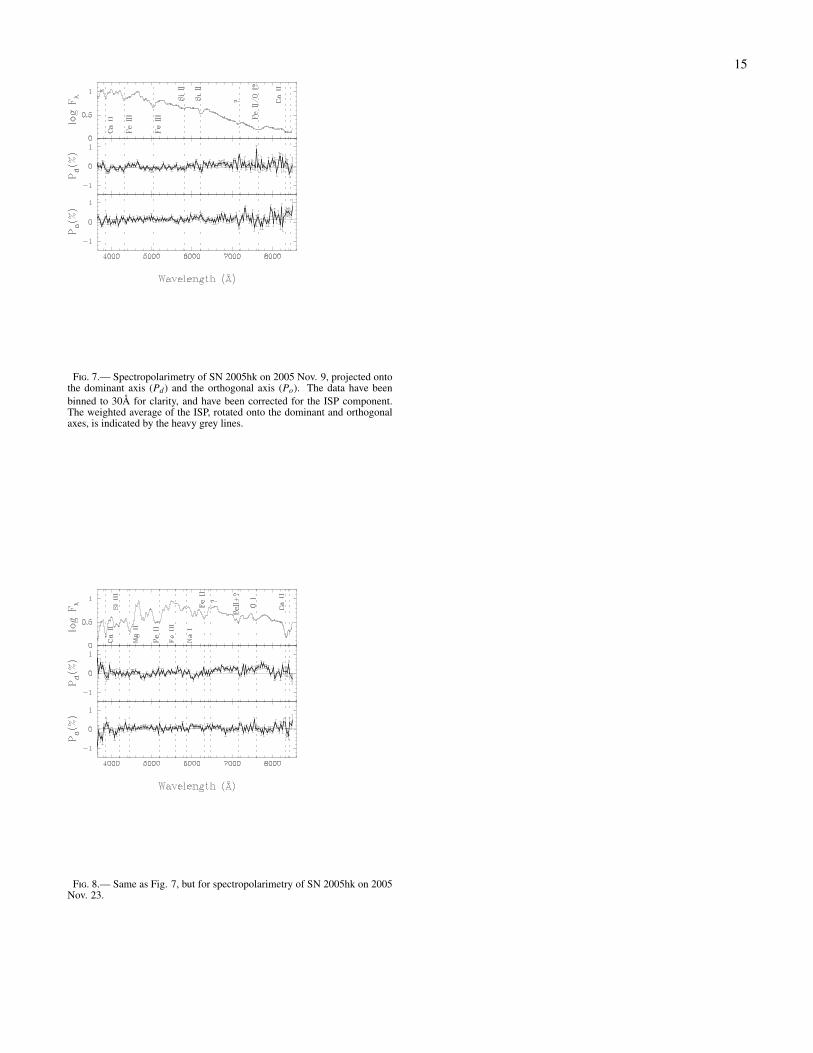
15
Fig. 7.— Spectropolarimetry of SN 2005hk on 2005 Nov. 9, projected ontothe dominant axis (Pd) and the orthogonal axis (Po). The data have beenbinned to 30Å for clarity, and have been corrected for the ISP component.The weighted average of the ISP, rotated onto the dominant and orthogonalaxes, is indicated by the heavy grey lines.
Fig. 8.— Same as Fig. 7, but for spectropolarimetry of SN 2005hk on 2005Nov. 23.
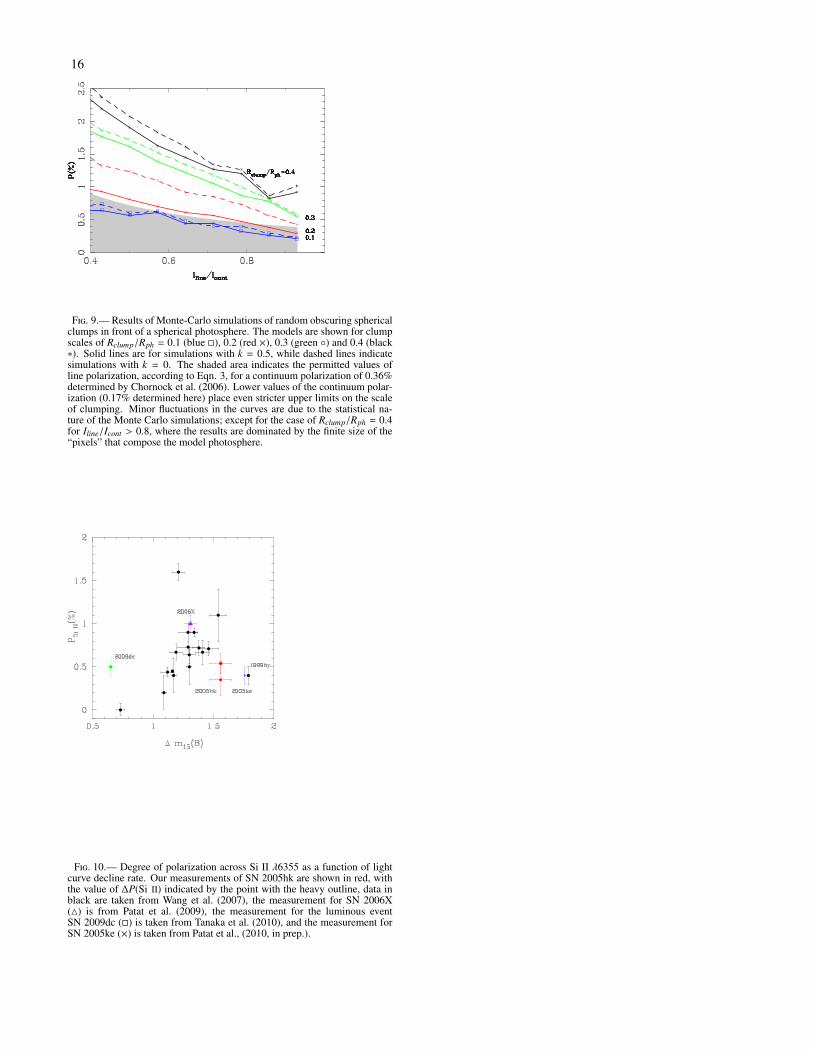
16
Fig. 9.— Results of Monte-Carlo simulations of random obscuring sphericalclumps in front of a spherical photosphere. The models are shown for clumpscales of Rclump/Rph = 0.1 (blue �), 0.2 (red ×), 0.3 (green ◦) and 0.4 (black∗). Solid lines are for simulations with k = 0.5, while dashed lines indicatesimulations with k = 0. The shaded area indicates the permitted values ofline polarization, according to Eqn. 3, for a continuum polarization of 0.36%determined by Chornock et al. (2006). Lower values of the continuum polar-ization (0.17% determined here) place even stricter upper limits on the scaleof clumping. Minor fluctuations in the curves are due to the statistical na-ture of the Monte Carlo simulations; except for the case of Rclump/Rph = 0.4for Iline/Icont > 0.8, where the results are dominated by the finite size of the“pixels” that compose the model photosphere.
Fig. 10.— Degree of polarization across Si II λ6355 as a function of lightcurve decline rate. Our measurements of SN 2005hk are shown in red, withthe value of ∆P(Si II) indicated by the point with the heavy outline, data inblack are taken from Wang et al. (2007), the measurement for SN 2006X(4) is from Patat et al. (2009), the measurement for the luminous eventSN 2009dc (�) is taken from Tanaka et al. (2010), and the measurement forSN 2005ke (×) is taken from Patat et al., (2010, in prep.).