A Spatiotemporal Analysis of the Global Diffusion of ISO 9000 and ISO 14000 Certification
18
MANAGEMENT SCIENCE Vol. 53, No. 3, March 2007, pp. 451–468 issn 0025-1909 eissn 1526-5501 07 5303 0451 inf orms ® doi 10.1287/mnsc.1060.0633 © 2007 INFORMS A Spatiotemporal Analysis of the Global Diffusion of ISO 9000 and ISO 14000 Certification Paulo Albuquerque Simon Graduate School of Business, University of Rochester, 3-110R Carol Simon Hall, Rochester, New York 14627, [email protected] Bart J. Bronnenberg, Charles J. Corbett Anderson School of Management, University of California at Los Angeles, 110 Westwood Plaza, Los Angeles, California 90095 {[email protected], [email protected]} W e study the global diffusion of ISO 9000 and ISO 14000 certification using a network diffusion framework. We start by investigating the presence and nature of contagion effects by defining alternative cross-country networks and testing their relative strength. Second, we study how the rate of diffusion differs between the two standards and between early- and later-adopting countries. Third, we identify which countries had more influence on diffusion than others. Empirically, we build a diffusion model which includes several possible cross- country contagion effects and then use Bayesian methods for estimation and model selection. Using country by year data for 56 countries and nine years, we find that accounting for cross-country influences improves both the fit and the prediction accuracy of our models. However, the specific cross-country contagion mechanism is different across the two standards. Diffusion of ISO 9000 is driven primarily by geography and bilateral trade relations, whereas that of ISO 14000 is driven primarily by geography and cultural similarity. We also find that the diffusion rate of ISO standards is higher for later-adopting countries and for the later ISO 14000 standard. We discuss several implications of our findings for the global diffusion of management standards. Key words : global diffusion; management practice; ISO 9000; ISO 14000; spatiotemporal analysis; Bayesian estimation History : Accepted by Christopher H. Loch, technological innovation, product development, and entrepreneurship; received December 22, 2004. This paper was with the authors 10 1 2 months for 2 revisions. 1. Introduction Managers in many leading firms are increasingly con- cerned about practices in place at their suppliers and other trading partners. Poor management systems at suppliers can lead to poor quality of incoming prod- ucts, which in turn will cause problems for the firm and its own downstream customers. Firms are also concerned about unreliable shipments from suppliers with poor internal procedures, and about the poten- tial damage to a firm’s reputation if its suppliers do not behave responsibly in an environmental or social context. These concerns, combined with the difficulty involved in monitoring suppliers’ internal processes, led to the emergence of, at first, the ISO 9000 series of quality management systems standards, later fol- lowed by standards for issues that are not immediately related to quality, such as the ISO 14000 environmental management systems standard. The ISO management standards are intended to be adopted globally but, partly due to their relative youth, little is known in the literature about how they dif- fuse across countries. Our goal in this paper is to con- tribute to knowledge about the mechanisms underlying their global diffusion, about how the adoption rate differs between the two standards and between early- and later-adopting countries, and about the influence that different countries have on the global diffusion process. Our approach is to use a framework of network diffusion and apply concepts from social interaction theory (e.g., Granovetter 1978) to the understanding of how and why firms in different countries influ- ence each other’s adoption behavior. This allows us to formalize the nature and speed of diffusion and to determine cross-country influence in global diffusion processes as a function of between-country proximity and of past adoption behavior. Empirically, we propose and estimate a diffusion model, in which cross-country influences can follow: (1) geography, where adoption spreads to neighbor- ing countries, (2) trade, where adoption spreads to exporting countries, and (3) culture, where adoption spreads to culturally similar countries, or (4) any combination of these. We estimate the model using Bayesian methods on data tracking the diffusion of ISO 9000 and ISO 14000 certification across countries and years. Our results indicate that cross-country influence is important for ISO 9000 and ISO 14000 certification. Interestingly, however, the underlying mechanisms 451
-
Upload
independent -
Category
Documents
-
view
2 -
download
0
Transcript of A Spatiotemporal Analysis of the Global Diffusion of ISO 9000 and ISO 14000 Certification
MANAGEMENT SCIENCEVol. 53, No. 3, March 2007, pp. 451–468issn 0025-1909 �eissn 1526-5501 �07 �5303 �0451
informs ®
doi 10.1287/mnsc.1060.0633©2007 INFORMS
A Spatiotemporal Analysis of the GlobalDiffusion of ISO 9000 and ISO 14000 Certification
Paulo AlbuquerqueSimon Graduate School of Business, University of Rochester, 3-110R Carol Simon Hall,
Rochester, New York 14627, [email protected]
Bart J. Bronnenberg, Charles J. CorbettAnderson School of Management, University of California at Los Angeles, 110 Westwood Plaza,
Los Angeles, California 90095 {[email protected], [email protected]}
We study the global diffusion of ISO 9000 and ISO 14000 certification using a network diffusion framework.We start by investigating the presence and nature of contagion effects by defining alternative cross-country
networks and testing their relative strength. Second, we study how the rate of diffusion differs between thetwo standards and between early- and later-adopting countries. Third, we identify which countries had moreinfluence on diffusion than others. Empirically, we build a diffusion model which includes several possible cross-country contagion effects and then use Bayesian methods for estimation and model selection. Using country byyear data for 56 countries and nine years, we find that accounting for cross-country influences improves boththe fit and the prediction accuracy of our models. However, the specific cross-country contagion mechanism isdifferent across the two standards. Diffusion of ISO 9000 is driven primarily by geography and bilateral traderelations, whereas that of ISO 14000 is driven primarily by geography and cultural similarity. We also find thatthe diffusion rate of ISO standards is higher for later-adopting countries and for the later ISO 14000 standard.We discuss several implications of our findings for the global diffusion of management standards.
Key words : global diffusion; management practice; ISO 9000; ISO 14000; spatiotemporal analysis; Bayesianestimation
History : Accepted by Christopher H. Loch, technological innovation, product development, andentrepreneurship; received December 22, 2004. This paper was with the authors 10 12 months for 2 revisions.
1. IntroductionManagers in many leading firms are increasingly con-cerned about practices in place at their suppliers andother trading partners. Poor management systems atsuppliers can lead to poor quality of incoming prod-ucts, which in turn will cause problems for the firmand its own downstream customers. Firms are alsoconcerned about unreliable shipments from supplierswith poor internal procedures, and about the poten-tial damage to a firm’s reputation if its suppliers donot behave responsibly in an environmental or socialcontext. These concerns, combined with the difficultyinvolved in monitoring suppliers’ internal processes,led to the emergence of, at first, the ISO 9000 seriesof quality management systems standards, later fol-lowed by standards for issues that are not immediatelyrelated to quality, such as the ISO 14000 environmentalmanagement systems standard.The ISO management standards are intended to be
adopted globally but, partly due to their relative youth,little is known in the literature about how they dif-fuse across countries. Our goal in this paper is to con-tribute toknowledgeabout themechanismsunderlyingtheir global diffusion, about how the adoption ratediffers between the two standards and between early-
and later-adopting countries, and about the influencethat different countries have on the global diffusionprocess.Our approach is to use a framework of network
diffusion and apply concepts from social interactiontheory (e.g., Granovetter 1978) to the understandingof how and why firms in different countries influ-ence each other’s adoption behavior. This allows usto formalize the nature and speed of diffusion and todetermine cross-country influence in global diffusionprocesses as a function of between-country proximityand of past adoption behavior.Empirically, we propose and estimate a diffusion
model, in which cross-country influences can follow:(1) geography, where adoption spreads to neighbor-ing countries, (2) trade, where adoption spreads toexporting countries, and (3) culture, where adoptionspreads to culturally similar countries, or (4) anycombination of these. We estimate the model usingBayesian methods on data tracking the diffusion ofISO 9000 and ISO 14000 certification across countriesand years.Our results indicate that cross-country influence is
important for ISO 9000 and ISO 14000 certification.Interestingly, however, the underlying mechanisms
451

Albuquerque et al.: A Spatiotemporal Analysis of the Global Diffusion of ISO 9000 and ISO 14000 Certification452 Management Science 53(3), pp. 451–468, © 2007 INFORMS
are different. Diffusion of ISO 9000 follows bilateraltrade flows and geographic proximity, while for ISO14000 certification, cultural similarity is also impor-tant. This suggests that the diffusion mechanism isdriven in part by the nature and objectives of thestandard. We also find that ISO 14000 diffuses fasterthan ISO 9000 and that both standards diffuse fasterin later-adopting countries. We argue that the differ-ence in the amount of evidence about the usefulnessof ISO standards available to different countries andat various stages in the diffusion process is a driv-ing factor for these findings. Finally, we find that acountry’s relative influence on the diffusion variesbetween the ISO standards. For instance, while theUnited Kingdom is the most influential nation in bothcases, Japan and Sweden are more influential in thediffusion of ISO 14000 than ISO 9000. These findingscan partly be explained by the different nature (eco-nomic versus cultural) of the network along whichthe ISO standards are found to spread.Our results are hopefully useful to the wide
range of policy makers and institutions involved inISO standards, specifically in determining where tofocus their resources in launching future managementstandards.In §2, we briefly describe the ISO standards. Sec-
tion 3 formulates research questions on diffusion ofISO 9000 and ISO 14000. Section 4 introduces thetemporal and spatial aspects of the model; the dataare presented in §5. Section 6 covers estimation andmodel selection. Section 7 focuses on the results and§8 concludes.
2. ISO Management StandardsISO 9000 refers to a series of quality management sys-tems standards (introduced in 1986), while ISO 14000refers to the series of environmental managementsystems standards (introduced in 1996). A “manage-ment system standard” is a set of requirements thata management system must meet to receive certi-fication of compliance, usually from a third-partyauditor.1 A firm that has ISO 9000 certification hasa well-documented and consistent quality manage-ment system; the certification does not, in itself, sayanything about product quality. Similarly, an ISO14000 certification indicates that a firm has a well-documented consistent environmental managementsystem, but again does not in itself say anything abouta firm’s environmental impacts. Audits are performedby independent firms, that in turn are accredited byvarious independent agencies worldwide. Firms mustbe re-audited every three years to keep their certifica-tion current.
1 See, for instance http://www.iso.org/iso/en/iso9000-14000/un-derstand/inbrief.html (last accessed June 10, 2006) for more detail.
It is important to note the fundamental differencein scope between the two standards. ISO 9000 focuseson quality management, which makes it relevant pri-marily for buyer-seller relationships. On the otherhand, ISO 14000 is explicitly aimed at a much broaderaudience, including governments, communities, non-governmental organizations (NGOs), and others. Bothstandards have been updated since they were firstintroduced. As of December 2004, there were 670,399ISO 9000 certifications outstanding in 154 countries,and 90,569 ISO 14000 certifications in 127 countries(ISO 2004).
3. Research Framework3.1. Theoretical BackgroundIn this section, we consider how the diffusion pat-terns of the ISO 9000 and ISO 14000 standards dif-fer from each other and across countries. Research ineconomics (e.g., Bikhchandani et al. 1992), sociology(Valente 1995, Granovetter 1978), and marketing (Bass1969) focuses on descriptions of adoption behavioras a contagion process. This contagion is often por-trayed as the result of communication between agentsvia social interaction networks (Granovetter 1978). Inthis view, adopting firms are receptive to evidenceabout the usefulness of an innovation, in our caseabout the usefulness of adopting the ISO standards.Different firms have different “evidentiary” thresh-olds that represent the minimum amount of evidenceto convince the adopter to act, such as a minimumnumber of past adopters in one’s reference group(e.g., Granovetter 1978). Adoption takes place once theamount of supporting evidence collected by the firmsurpasses its threshold. Factors affecting firms’ recep-tion of evidence or their evidentiary thresholds cantherefore affect the nature of diffusion, the speed ofdiffusion, and the extent of influence of certain coun-tries in propagating standards. The following sectionsidentify these factors and consider how they affectthe diffusion process of the ISO 9000 and ISO 14000standards.
3.2. Nature of DiffusionThe degree to which firms are exposed to evidenceis governed by their proximity, on an inter-firm net-work, to firms that have already adopted. The natureof the diffusion mechanisms is then related to the def-inition of proximity. Below, we speculate on whethercertification is subject to cross-national influences and,if so, when and why proximity to past adopters interms of culture, geography, or trade relations carriesmore weight.First, it is well documented that geographic proxim-
ity to past adopters affects the decision to adopt a newproduct or service. Geographical proximity of rivalsis shown to be linked to knowledge spillovers, inno-vative activity, and firm development (Audretsch and
Albuquerque et al.: A Spatiotemporal Analysis of the Global Diffusion of ISO 9000 and ISO 14000 CertificationManagement Science 53(3), pp. 451–468, © 2007 INFORMS 453
Feldman 1996, Glaeser et al. 1992), thereby facilitatingthe transmission of ideas, imitation, and improve-ment. There is also strong networking between firmsof geographic clusters (Baptista 2000), leading to pres-sures from social contacts and localized competitiveenvironments. Hence, geographic closeness facilitatescontacts between any pair of firms, regardless of theirsector, but proxies primarily for contacts betweenrival firms, i.e., for horizontal connectedness.Because this effect is independent of the specific
scope of the standard, geographic proximity of coun-tries is expected to be important to both ISO 9000 andISO 14000 certification.Second, another dimension of proximity on an in-
ter-firm network is defined by economic relations, i.e.,bilateral trade. It is likely that a stronger business rela-tionship between firms, even across national borders,will lead to a stronger pressure to adopt. “Economic”proximity may therefore be different from geographicproximity. Because it focuses on buyer-seller relations,the bilateral trade mechanism represents vertical con-nectedness.Economically-oriented reasons to adopt are com-
monly found in the diffusion of ISO 9000 but less sofor ISO 14000. For ISO 9000, export considerations,quality improvements, and cost reduction are reasonsto certify (Anderson et al. 1999, Guler et al. 2002). Cer-tification follows supply chains “upstream” (Corbett2006) because buyers require foreign sellers to be ISO9000 certified. Thus, we expect that bilateral trade isrelatively more important in the decision to certify forISO 9000 than for ISO 14000.Finally, cultural similarity is a third dimension of
proximity between firms. Culture plays amulti-facetedrole in influencing firms’ relations and in shapingcooperation between managers. For instance, cultureimpacts the importance given to cooperative solutionsand creates social barriers to cooperation betweenpeople (Nakamura et al. 1997). In general, if groupshave the same cognitive framework, they are morelikely not to distort the information they receive fromothers. Thus, the greater is the cognitive and culturalsimilarity, the better is the flow of information (Trian-dis and Suh 2002). Culturally similar countries aretherefore expected to have more contact.ISO 14000 is relevant to communities, NGOs, reg-
ulators, and other noneconomic parties that neednot have any business links with the certified firm(Neumayer and Perkins 2004). In that sense, ISO14000 affects a broader set of stakeholders, and hencecould reflect a country’s cultural values more stronglythan ISO 9000. For instance, Corbett et al. (2003) reportthat firms adopting ISO 14000 are more motivated byrelations with authorities and communities than firmsadopting ISO 9000. Consequently, we expect that cul-tural similarity is relatively more important in thedecision to seek ISO 14000 than ISO 9000 certification.
3.3. Speed of DiffusionFirms adopt when the current accumulated evidenceexceeds their evidentiary threshold. Diffusion speedis therefore adversely affected by the gap between theaccumulated evidence and the threshold. Due to theattenuation of adoption risk over time, the eviden-tiary thresholds of firms in later-adopting countriesare generally lower (see, e.g., Valente 1995 for a dis-cussion of the attenuation of adoption risk and itsreducing effect on thresholds). In addition, firms incountries where certification starts late are exposedto more evidence of the usefulness of ISO standardsin countries where certification started earlier. Usingthis logic, we speculate on differences in diffusionrates between early- and later-adopting countries, andbetween the ISO 9000 and ISO 14000 standards.
3.3.1. Differences Between Early- and Later-Adopting Countries. We expect firms in countriesthat start late to adopt faster. First, when the diffusionof an innovation has reached a critical mass, perceivedrisk of adoption decreases. As stated above, this de-creases the “evidentiary” threshold and “less expo-sure is sufficient to persuade individuals to adopt”(Valente 1995, p. 92). In our case, the attenuationof risk is likely governed by decreased uncertaintyabout the usefulness of a particular ISO standardafter many countries have started certification. Forthis reason, later-adopting countries are expected toshow higher within-country diffusion rates. Second,even if all countries had the same firm-level distri-bution of thresholds, later-adopting countries benefitfrom supporting evidence about the usefulness of theinnovation accumulated across earlier adopting firms.Therefore, firms in such countries start the adoptiondecision closer to exceeding their threshold.Most of the literature suggests that diffusion in
later-adopting countries is faster than in early-adopt-ing countries and that later-adopting countries catchup with earlier-adopting countries. For instance,Takada and Jain (1991) find that the imitation coeffi-cient will be greater for a country in which a productis introduced later. Comin and Hobijn (2004) com-pare diffusion patterns across countries and find thatwhile economic leaders tend to adopt first, the rateat which lagging countries catch up is accelerating.Although there is no direct literature on accelera-tion of cross-country contagion effects, later-adoptingcountries may exhibit higher cross-country imitationrates. Later-adopting countries tend to be less eco-nomically developed (Lücke 1993, Comin and Hobijn2004), more likely to be further upstream in supplychains, and hence subject to pressure from a largernumber of downstream parties. Corbett (2006) findsthat early-adopting firms in later-adopting countriesare more heavily motivated by export considerations,which would also suggests a higher cross-countryimitation rate.

Albuquerque et al.: A Spatiotemporal Analysis of the Global Diffusion of ISO 9000 and ISO 14000 Certification454 Management Science 53(3), pp. 451–468, © 2007 INFORMS
3.3.2. Differences Between ISO 9000 and ISO14000 Diffusion Rates. We predict that the adoptionof the later ISO 14000 standard takes place at a fasterpace than adoption of the earlier ISO 9000 standardbecause the installed base of ISO 9000 removed partof the uncertainty about the commercial value andrelevance of management systems standards.The literature on diffusion rates of successive inno-
vations is mixed but on balance favors the predic-tion that later innovations diffuse faster than earlierones, consistent with the statement above. Mahajanand Muller (1994) find that the imitation parameteris higher for diffusion in a unified (European Union)market than in individual countries. The globaliza-tion that has occurred between the introductions ofISO 9000 (1986) and ISO 14000 (1996) would suggestthat ISO 14000 should have a higher imitation ratethan ISO 9000. Grubler (1991) finds that first versionsof a technology (in our case a management standard)may clash with implemented practices, be perceivedas risky, and take considerable time to be accepted asvaluable by the community. Van den Bulte (2000) alsofinds that diffusion of new consumer goods is accel-erating over time.
3.4. Influential CountriesFinally, the degree to which firms are effective intransmitting evidence is dependent on their positionin the network. Given the inferred structure of thenetwork, firms in some countries are better positionedto have more influence in propagating certificationwhile others are more susceptible to it. In our anal-ysis of influence and susceptibility, we use the struc-ture of this network defined by nodes (countries) andedges (relations between them) to propose a mea-sure of how one country affects the adoption of ISOstandards in another (for an in-depth discussion onmeasures of influence based on network structure,see Wasserman and Faust 1994 and Anderson et al.1999). Based on this measure, we identify groups ofcountries that are influential in or susceptible to cross-country contagion.
4. Modeling the Global DiffusionProcess
4.1. BackgroundMansfield (1961) is perhaps the first to explicitlymodel the process of technology diffusion usingthe well-known logistic function and correspondingS-shaped growth curve. Teece (1980) shows that thismodel also describes the spread of an administra-tive innovation, hence making it applicable to the ISO9000 and ISO 14000 standards. Bass (1969) shows thatessentially the same model applies to the diffusionof consumer goods, and others have integrated the
effects of management action into this model (e.g.,Horsky and Simon 1983). Granovetter (1978) proposesthat collective adoption behavior is driven by the dis-tribution of individuals’ adoption thresholds. Finally,Shaikh et al. (2005) show that the S-shaped diffusionmodel can be derived from network diffusion primi-tives so the use of, say, the Bass model is consistentwith a network diffusion interpretation.The international diffusion literature has focused
on (1) heterogeneity in country-specific diffusion rates(e.g., Gatignon et al. 1989 and Talukdar et al. 2002),and (2) cross-country contagion (e.g., Kumar andKrishnan 2002, Neelamegham and Chintagunta 1999and Putsis et al. 1997). Diffusion models are used inthese papers to capture installed-base effects on sub-sequent adoption. Surprisingly, the existing literatureon ISO 9000 and ISO 14000 rarely refers to this bodyof literature, despite the fact that the spread of man-agement standards is probably subject to installed-base effects. In addition, diffusion models typicallyfocus on certification growth rather than on certifi-cation levels. This is appropriate here because theinvestment in obtaining the initial certification is sunkand large compared to the costs of renewing it. Theinstalled base will therefore predominantly affect thetiming of the initial certification decision, not that ofthe renewal decision. Second, if most initial certifica-tions are renewed (as is the case for ISO 9000 andISO 14000), the yearly certification levels are cumu-lative variables. Newbold and Granger (1974) showthat regressions among cumulative variables oftenyield statistically significant results where none arepresent. The standard solution to this spurious regres-sion effect is to difference the time series, i.e., focuson certification growth rather than levels.
4.2. Features of the Diffusion ModelWe focus on ISO 9000 and ISO 14000 certification lev-els by country and by year, particularly on the tempo-ral and cross-sectional aspects of diffusion. Our modelhas four distinguishing features, each of which canbe operationalized in several ways, discussed in moredetail below. First, it accounts for differing degrees ofcross-country influence, defined as the effect of pastcertifications in one country on current certificationin another. We estimate two versions of the model,where only recent or all past certifications influencecurrent new certifications.Second, the model allows for alternative views of
which countries influence each other. We considerfour definitions of “influence sets” of nations basedon geography, trade relations, cultural similarity, or acombination of these.Third, the model includes an econometric control
for omitted variables by allowing for contempora-neous correlation of unobserved factors across geog-raphy (see, e.g., Anselin 1988). For instance, some

Albuquerque et al.: A Spatiotemporal Analysis of the Global Diffusion of ISO 9000 and ISO 14000 CertificationManagement Science 53(3), pp. 451–468, © 2007 INFORMS 455
relevant factors that contribute to the diffusion of cer-tifications may be at the level of economic regionssuch as the European Market (EU) or North Ameri-can Free Trade Agreement (NAFTA). Any such factorthat creates a multicountry “trend” in certification willcause contemporaneous correlation when omitted. Wespecify two models, with and without contemporane-ously correlated errors.Finally, to ensure that what we measure as cross-
country influence is not simply a form of unobservedheterogeneity, we allow for random (country-specific)effects. We specify two models, one flexible with ran-dom effects and one more restrictive with nonrandomeffects.These four dimensions of model specification lead
to a total design of 2× 4× 2× 2= 32 models, each ofwhich is estimated for both ISO 9000 and ISO 14000.2
The following subsections focus on each of these fourmodel design dimensions. We present the model inthe context of ISO 9000; the models for ISO 14000 areanalogous.
4.3. The Multicountry Diffusion ModelWe start by defining a multicountry Bass model wherethe cross-country imitation effects are based on thecumulative number of certifications in other coun-tries. Here, firms are influenced by other firms, athome and abroad, that have received certification inpast periods. We model the number of new certifica-tions ckt in country k at time t as
ckt =(
pk +K∑
k′=1qkk′
Ck′� t−1Mk′
)Mk −Ck� t−1�+ ekt� (1)
where Ckt (ckt) is the cumulative (incremental) num-ber of certifications in country k = 1� �K at timet = 1� � T . pk is the coefficient of innovation, qkk′ isthe contagion effect of past adoption in country k′ oncurrent adoption in country k, Mk is the potential forthe number of certifications, and ekt is the error term.To allow for heteroskedastic errors, we assume thatthe ekt are normally distributed with mean zero andvariance proportional to the previous year’s growthof certifications,3
ekt ∼N0��2e · �ck� t−1�� (2)
2 Using all combinations of random effects (yes/no) with omitted-variables control (yes/no), we additionally estimate four specifica-tions without cross-country effects.3 We set ck� t−1 = 1 for the few cases where ck� t−1 = 0. This addi-tive and heteroskedastic residual term is a simple and parsimo-nious way to account for the empirical patterns in our data: (1) theresiduals in countries with more certifications have higher variance,(2) the absolute errors tend to increase over time as certification lev-els increase, and (3) in very rare occasions, reflecting measurementerror and occasional decertification, ckt can be zero or negative inthe ISO data.
The parameters to be estimated are pk, qkk′ , Mk, andthe error variance �2e .An alternative assumption is that a firm only exerts
influence on firms in other countries soon after its owncertification process. Cross-country contagion is thendriven only by recent certifications in other countries.This would occur if managers in different countriesare more likely to transmit information about recentor ongoing projects than about older events. There-fore, we also examine a model where the cross-countryeffects depend on recent rather than cumulative certi-fications in other countries:
ckt =(
pk + qkk
Ck� t−1Mk
+ ∑k′=1� �K�k′ =k
qkk′ck′� t−1Mk′
)
· Mk −Ck� t−1�+ ekt (3)
Note that the within-country contagion effects do stilldepend on cumulative adoption to maintain the struc-ture and spirit of the traditional S-shaped diffusioncurve.
4.4. Cross-Country InfluenceIn this section, we define the cross-country effects qkk′ ,which depend on a country’s “neighbor sets,” i.e., theset of countries that are hypothesized to affect adop-tion in that country. According to our model of net-work diffusion and inter-firm contagion, we defineneighbor sets based on geography, trade, and culture.4
4.4.1. Geographic Distance. This notion of influ-ence is appropriate if a management standard’s dif-fusion follows geographical patterns, for instance,starting in Western Europe, then spreading West,South, and East from there. For each country k, wedefine the neighbor set Gkn� as the n geographicallyclosest countries, where distance between countriesis measured as the surface distance between countrycapitals.5 The contagion effects in Equations (1) and(3) are specified accordingly:
qGkk′ =
�Gk if k′ = k
�Gk if k′ ∈Gkn�
0 otherwise�
(4)
where k′ ∈ Gkn� means that country k′ is among then closest geographical neighbors of k. �G
k is the usualcoefficient of own-country imitation, while �G
k is thecoefficient that measures the strength by which firms
4 For a clarifying example of different neighbor sets across thesedefinitions, see the end of this subsection.5 We also tested a countinuous distance specification, with qkk′ =exp−�kD
−1kk′ �, where Dkk′ is the geographical distance between
country k and k′. This specification produced worse results in termsof fit.

Albuquerque et al.: A Spatiotemporal Analysis of the Global Diffusion of ISO 9000 and ISO 14000 Certification456 Management Science 53(3), pp. 451–468, © 2007 INFORMS
in country k imitate firms located in countries k′ ∈Gkn�. Testing for geographical cross-country influ-ence is equivalent to testing that �G
k > 0. An appropri-ate value for n is determined empirically on the basisof model fit.
4.4.2. Bilateral Trade. If a larger share of countryk’s exports go to country k′, then country k′ likely hasmore influence on adoption in country k. We definethe share of exports, BTkk′� as follows:
BTkk′ =Exportskk′∑Jj=1 Exportskj
(5)
Country k’s neighbor set Bkn� consists of its n largestexport markets, i.e., the n countries with highest BTkk′ .The cross-country effects are then operationalized as
qBkk′ =
�Bk if k′ = k
�Bk if k′ ∈ Bkn�
0 otherwise
(6)
Again, n is specified empirically. This definition is notsymmetric: for instance, the United States is a keyexport market for many countries which are not majorexport markets for the United States.
4.4.3. Cultural dimensions. To numerically repre-sent the culture of a given country, we use Hofstede’s(2001) four cultural dimensions: (1) power distance,(2) individualism, (3) masculinity, and (4) uncer-tainty avoidance.6 These cultural dimensions havebeen used in other work on comparing innovative-ness across countries. For instance, Shane (1993) findsa link between culture and the number of trademarksper country, while Van Everdingen and Waarts (2003)find that culture affects country-level adoption ratesof enterprise resource planning systems. Each countryk is represented by four scores scks , with s = 1� �4,one for each of Hofstede’s dimensions. We define thecultural distance between countries k and k′ using thedistance measure
Hkk′ =√√√ 4∑
s=1scks − sck′s�
2 (7)
6 These dimensions mean the following: (1) “power distance”focuses on the degree of equality versus inequality between dif-ferent people in terms of power and wealth; (2) “individualism”focuses on the importance given to the individual versus the col-lective in terms of achievements and relationships; (3) “masculin-ity” deals with the traditional role played by the man in terms ofcontrol, power and achievement; and (4) “uncertainty avoidance”regards the level of tolerance for uncertainty and risk.
For each country k, Hkn� contains the n countriesculturally closest to k. The cross-country effects areoperationalized as
qHkk′ =
�Hk if k′ = k
�Hk if k′ ∈Hkn�
0 otherwise�
(8)
with n determined empirically.
4.4.4. Combining the Neighbor Sets. Finally,neighbor sets can be defined as any combination ofthe three previous definitions, e.g., the union,
qAkk′ =
�Ak if k′ = k
qGkk′ + qB
kk′ + qHkk′ if k′ = k�
(9)
where qGkk′ , qB
kk′ , and qHkk′ are as defined previously in
Equations (4), (6), and (8). These cross-country effectscontain the parameters �G
k , �Bk , and �H
k , which are esti-mated concurrently. The �’s are identified because forany given n, the sets Gkn�, Bkn�, and Hkn� are notidentical. Under the union of these sets, each coun-try k may thus have more than n neighbors.
4.4.5. An Example: India. The countries in oursample that are considered India’s neighbors, assum-ing n= 5, under each of the above definitions are:• Geographical distance: Pakistan, United Arab
Emirates, Iran, Thailand, and Saudi Arabia.• Bilateral trade: United States, Japan, United
Kingdom, Hong Kong, and United Arab Emirates.• Cultural: Egypt, Jordan, Saudi Arabia, United
Arab Emirates, and Kenya.• Combined: the union of all 12 countries listed
above.The countries are listed in order of proximity under
each measure; it is clear that the neighbor set andordering of neighbors varies substantially across thedifferent measures.
4.5. Country HeterogeneityWe use two alternative methods to account for hetero-geneity in the country diffusion rates. The first usescountry-specific covariates (see, e.g., Gatignon et al.1989, Putsis et al. 1997). We make the parameters pk,Mk, �k, and �k a linear function of country character-istics, xk:
Mk = xMk�M� (10)
pk = xpk�p� (11)
�k = x�k��� (12)
�k = x�k��� (13)
where xpk, xMk, x�k, and x�k are factors such as pop-ulation, urbanization, and illiteracy ratings for each

Albuquerque et al.: A Spatiotemporal Analysis of the Global Diffusion of ISO 9000 and ISO 14000 CertificationManagement Science 53(3), pp. 451–468, © 2007 INFORMS 457
parameter. These expressions can be substituted inEquation (1) to get a nonrandom effects model ofcountry heterogeneity. The resulting model capturesobserved heterogeneity across countries.An alternative approach accounts for unobserved
as well as observed differences across countriesthrough a random coefficients model (e.g., Talukdaret al. 2002), where a hierarchical structure is placedon the parameters, which have a distribution of thefollowing form:
Mk � NxMk�M��2M�� (14)
pk � Nxpk�p��2p �� (15)
�k � Nx�k����2��� (16)
�k � Nx�k����2�� (17)
The first model produces a distribution for the param-eter vectors �= ��p��M������ . The country-specificparameter values then result from Equations (10) to(13). The second model provides distributions of thefinal parameters Mk, pk, �k, and �k for each country,capturing heterogeneity more flexibly.We use the following covariates. For the potential
number of certifications Mk, we choose populationand gross domestic product (GDP) per capita as themain source of heterogeneity. Larger countries gener-ally have more firms, while richer countries have ahigher proportion of firms that can support the costsof ISO 9000 certification. Specifically for ISO 14000,we include the sum of the “social and institutionalcapacity” and “global stewardship” components ofthe environmental sustainability index (World Eco-nomic Forum 2002) as a covariate (this measure isbroader than the measure based on the number ofenvironmental treaties used in Corbett and Kirsch2001).We use literacy rates as an alternative measure
of development. Studies in urban economics (Calemand Carlino 1991) show that urban centers offerbetter infrastructure and consequently facilitate fasterdiffusion of information about adoption of innova-tions, so we also include percentage of urban popula-tion. Empirically, variable selection for each model in(10)–(17) is based on model likelihood (corrected foroverfitting) and prediction.
4.6. Omitted VariablesA final feature of our model is that it allows for con-temporaneous correlation in the residuals ekt acrosscountries. This helps control for those omitted vari-ables that cause multicountry trends in certification,such as business cycles that are common to a neighborset of countries.A parsimonious model of contemporaneous corre-
lation can be specified as a spatial correlation on the
residuals of Equation (1). Recall that these residualsare heteroskedastic with variance ckt−1 · �2e . For easeof notation, define the transformed residuals ekt =ekt/
√ckt−1. Instead of assuming that the error compo-
nent ekt is independent across countries, we allow fora more general autocorrelated error process on the�K × 1 error vector et . That is,
et ="Wet +�t� (18)
where W is a K ×K matrix whose elements Wkk′ are1/n for all k′ ∈ Gkn� and 0 otherwise (recall that n isthe number of neighbors). The interpretation of Equa-tion (18) is that ekt is allowed to be a function of theaverage ek′t in the spatial neighbor set. " is a spatialautoregressive coefficient. Finally, the error term #kt isdistributed as #kt ∼N0��2#�.7
To summarize, we have presented a very generalmodel of diffusion of ISO 9000 (and ISO 14000) certi-fication that (1) accounts for cross-country and own-country imitation effects, (2) operationalizes differentdefinitions of cross-country effects, (3) allows forobserved and unobserved differences across coun-tries, and (4) accounts for omitted variables with aspatial structure.
5. DataOur data for the number of ISO 9000 and ISO 14000certifications were obtained from ISO, which tookover the original Mobil survey of global certificationdata that started in 1992. Altogether, 12 “cycles” of theglobal certification survey have been released during1992–2003 (ISO 2003). Although annual since 1995, theearliest cycles were released at irregular intervals. Totransform the early data to an annual grid, we usedcubic spline interpolation between sample points. Inthe year 2000, the major revision ISO 9000:2000 wasreleased. A significant number of firms that were pre-viously certified to the earlier version of the stan-dard did not seek recertification to the new version,although recertification is required every three years.Other firms consolidated multiple site-level certifica-tions into a single firm-level certification, which wasnot possible under the earlier versions of the stan-dard. Because neither disadoption nor consolidationis the focus of our study, we discarded the data onISO 9000 certification after 2000, leaving nine annualobservations per country (1992–2000) for ISO 9000.ISO 14000 was published in September 1996, and didnot undergo any major revision during our obser-vation horizon. We have eight annual observationsfor 1995–2002 (some firms received certification beforethe final standard was published).
7 Anselin (1988) shows that the joint distribution of the spatial errorvector et is normal with mean zero and variance-covariance matrixequal to � 2
#I−"W′�I−"W��−1.

Albuquerque et al.: A Spatiotemporal Analysis of the Global Diffusion of ISO 9000 and ISO 14000 Certification458 Management Science 53(3), pp. 451–468, © 2007 INFORMS
Figure 1 Map of the Spatial Sample
The initial sample includes all countries whichhave at least one ISO 9000 certification by the year2002, in a total of 169 countries. It is impossi-ble to meaningfully estimate diffusion patterns withseverely limited data, so we restrict our analysis tothe 59 countries with at least 200 cumulative certi-fications. We lack information about bilateral tradeor country characteristics for Taiwan, Lithuania, andLatvia, so our final sample includes 56 countries. Forconsistency, the same sample was used for ISO 14000.Figure 1 gives a graphical representation of the spatialsample.Of the 56 countries, 31 had less than 20 ISO 9000
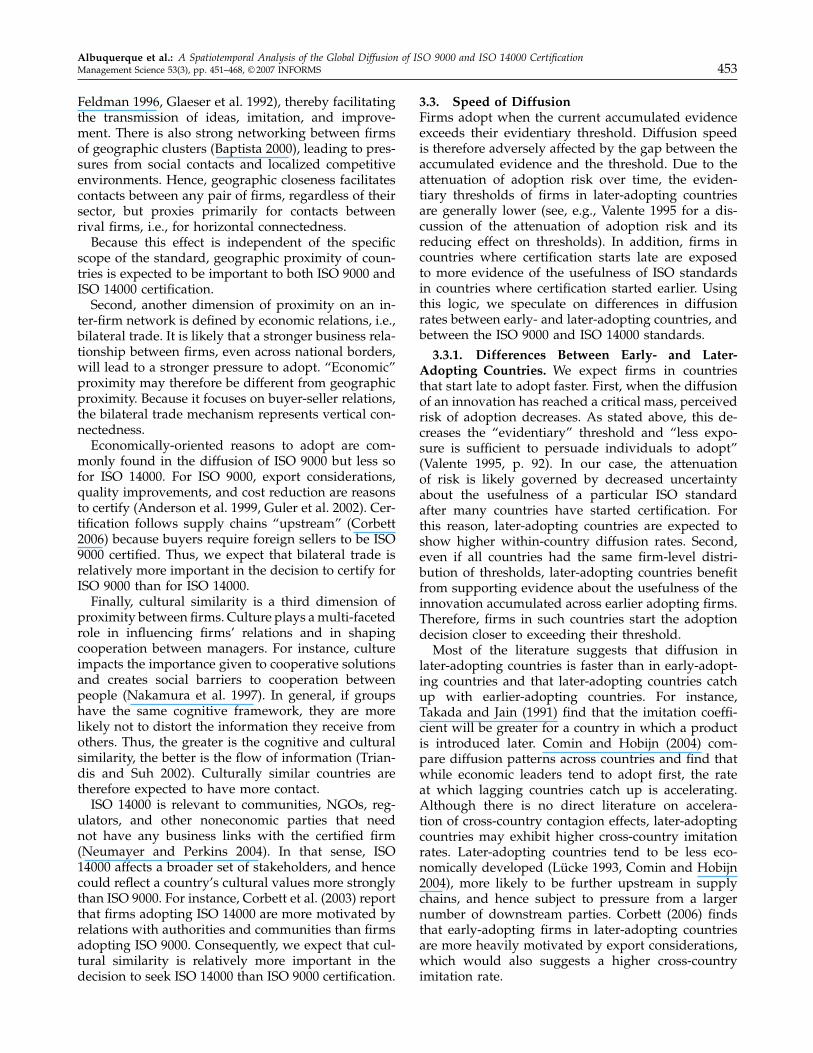
certifications in 1993, so in most countries widespreadadoption had not yet started. In contrast, for the lastyear in our analysis (T = 2000 for ISO 9000, T =2002 for ISO 14000), the mean cumulative number ofISO 9000 and ISO 14000 certifications is, respectively,7,170 and 851, with a standard deviation of 11,664and 1,622. Figure 2 shows that the diffusion curvesof selected but typical countries are either S-shapedor convex, consistent with the outcome of a diffusionprocess.Economic and demographic information was ob-
tained from the TableBase database (Dialog 2003),from the CIA World Factbook (CIA 2003), and fromthe Census Bureau. We mostly used values for 1997,except for population, which is from the year 2000,and bilateral trade, from 1996 (the latter is from theWorld Trade Flows, 1980–1997; see Feenstra 2000).8 Tomake the covariates of consistent scale, they werestandardized prior to using them in the diffusionmodel. Geographic distance was based on the lati-tude and longitude of the countries’ capitals. The cul-tural data were taken from Hofstede (2001), where theArab countries in our sample (Egypt, Jordan, SaudiArabia, and United Arab Emirates) are treated as oneregion. For Cyprus, we used Greece’s cultural scores;for Kenya, we applied the scores for Eastern Africa.
8 The top exporters do not vary much from year to year, circum-venting the need to make this measure time specific over the obser-vation period.
6. Empirical Analysis6.1. EstimationWe use Bayesian methods to estimate the parameters’mean and standard deviation. A detailed descriptionof the estimation algorithm is available in the onlineappendix (provided in the e-companion).9 Bayesianmethods allow us to estimate all proposed models,from nonrandom effects to hierarchical random coeffi-cients within a consistent framework. Our time seriesare short: for ISO 9000 (ISO 14000), we have onlynine (eight) observations per country. We focus onannual differences in certification rather than levels,so we “lose” one observation. Another observation isneeded for initialization in Equation (3). Finally, weuse the last available observation (year 2000 for ISO9000; 2002 for ISO 14000) as holdout to evaluate pre-diction. This leaves us with six observations per coun-try for model estimation for ISO 9000 and five for ISO14000. Such short time series are not uncommon whenstudying diffusion processes that are measured infre-quently, as is the case of ISO 9000 and ISO 14000. Theuse of Bayesian methods allows us to make the most ofthe country-specific data to estimate country diffusionrates. However, for those countries where the within-country data are uninformative of the diffusion pro-cess, the method will “shrink” the estimates towardthe hierarchical mean, which is based on pooled dataacross all countries. The amount of shrinkage is deter-mined by the informativeness of the within-countrydata relative to the pooled across-country data.10
We carried out preliminary tests with different val-ues for neighbor set size n for each distance mea-sure. The best results in terms of fit and predictionwere obtained with small set of neighbors, betweenthree and eight, with little sensitivity in that range.To compare the different contagion mechanisms witha manageable number of empirical models, we ranall models with n = 5. Recall that in addition to the32 models defined earlier, we defined four variants ofthe baseline model without cross-country effects withand without accounting for unobserved heterogeneity
9 An electronic companion to this paper is available as part of theonline version that can be found at http://mansci.journal.informs.org/.10 Using Markov chain Monte Carlo (MCMC) methods, we samplefrom the marginal posterior distribution of each parameter in turn,conditional on the current values of other parameters and on thedata (Tanner and Wong 1987, Gelfand and Smith 1990). All modelswere run for a total of 20,000 iterations. The first 15,000 observa-tions were used for initialization and the last 5,000 iterations wereused for inference. To reduce the autocorrelation in the MCMCsampler, every fifth draw was saved for analysis. The plots of thesampled values for each parameter show that they converge. Wetested for differences in parameters’ means across different inter-vals (Gelman et al. 1995) and found none significant. In most cases,convergence was achieved after 3,000 to 4,000 iterations.
Albuquerque et al.: A Spatiotemporal Analysis of the Global Diffusion of ISO 9000 and ISO 14000 CertificationManagement Science 53(3), pp. 451–468, © 2007 INFORMS 459
Figure 2 Yearly ISO 9000 and ISO 14000 Certification Counts for Four Countries
1992 1993 1994 1995 1996 1997 1998 1999 20000
0.5
1.0
1.5
2.0
2.5
3.0
3.5
4.0× 10⁴
Australia
Canada
United S
tates
United States
France
Cer
tific
atio
ns
1995 1996 1997 1998 1999 2000 2001 20020
500
1,000
1,500
2,000
2,500
3,000
Australia
Canada
FranceCer
tific
atio
ns
Time
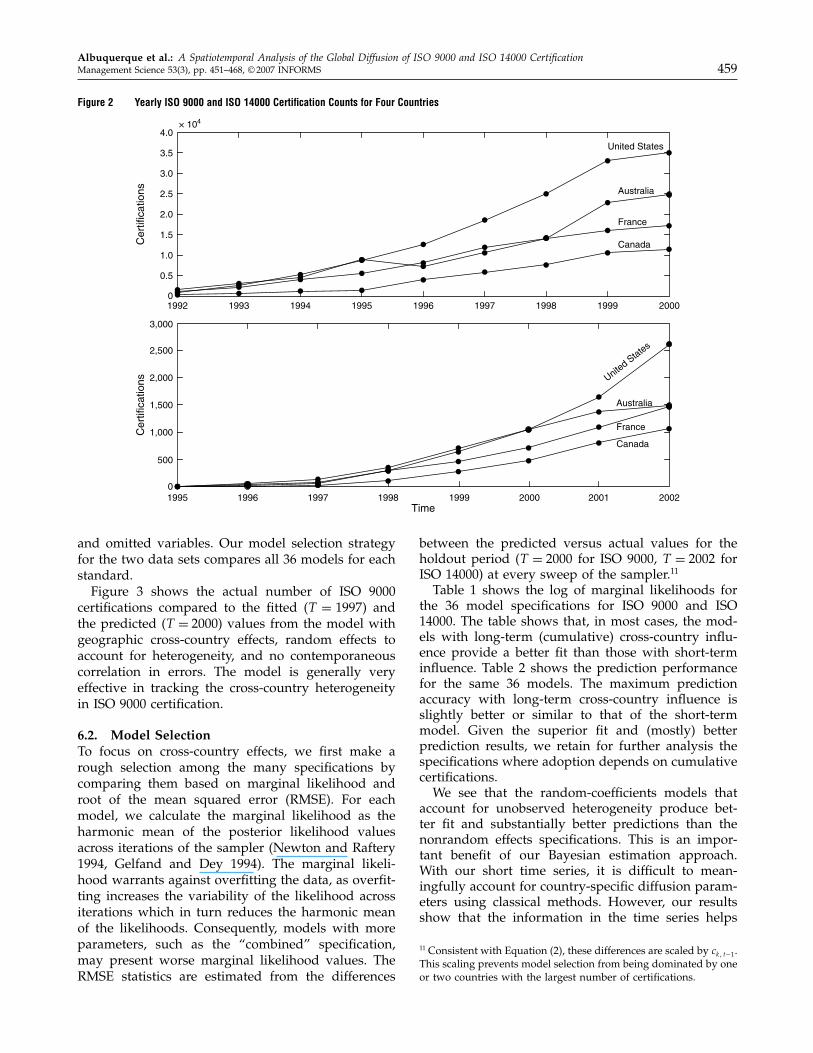
and omitted variables. Our model selection strategyfor the two data sets compares all 36 models for eachstandard.Figure 3 shows the actual number of ISO 9000
certifications compared to the fitted (T = 1997) andthe predicted (T = 2000) values from the model withgeographic cross-country effects, random effects toaccount for heterogeneity, and no contemporaneouscorrelation in errors. The model is generally veryeffective in tracking the cross-country heterogeneityin ISO 9000 certification.
6.2. Model SelectionTo focus on cross-country effects, we first make arough selection among the many specifications bycomparing them based on marginal likelihood androot of the mean squared error (RMSE). For eachmodel, we calculate the marginal likelihood as theharmonic mean of the posterior likelihood valuesacross iterations of the sampler (Newton and Raftery1994, Gelfand and Dey 1994). The marginal likeli-hood warrants against overfitting the data, as overfit-ting increases the variability of the likelihood acrossiterations which in turn reduces the harmonic meanof the likelihoods. Consequently, models with moreparameters, such as the “combined” specification,may present worse marginal likelihood values. TheRMSE statistics are estimated from the differences
between the predicted versus actual values for theholdout period (T = 2000 for ISO 9000, T = 2002 forISO 14000) at every sweep of the sampler.11
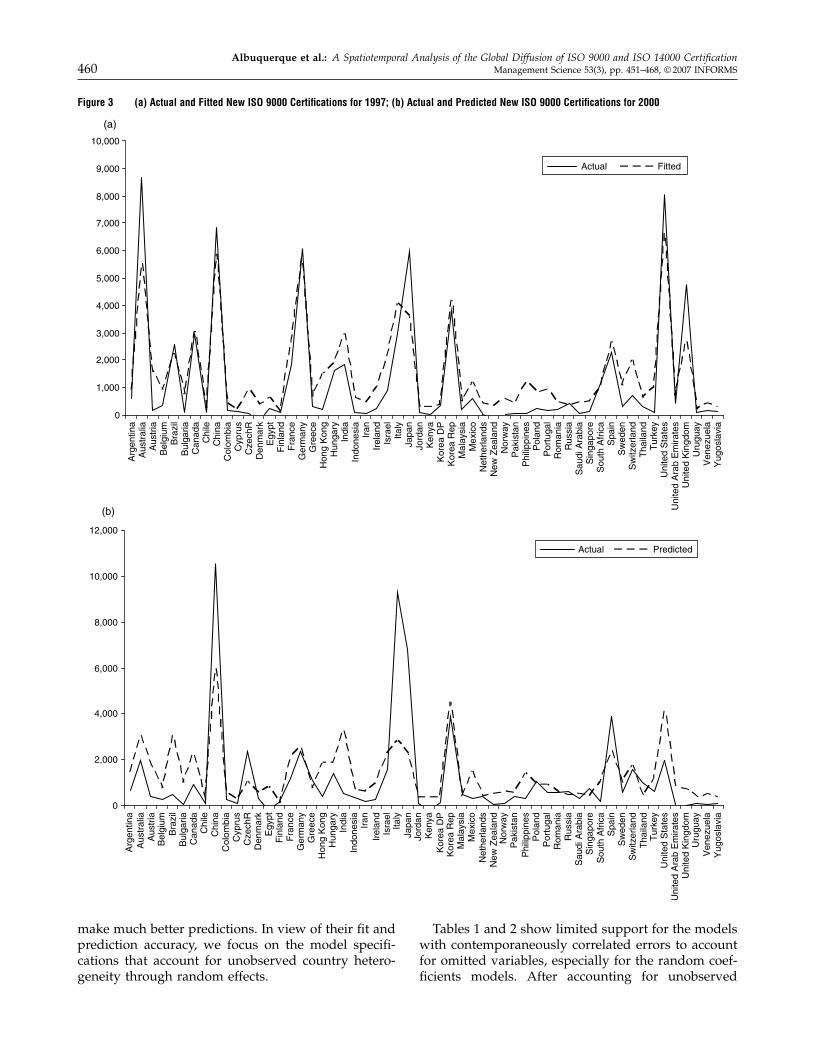
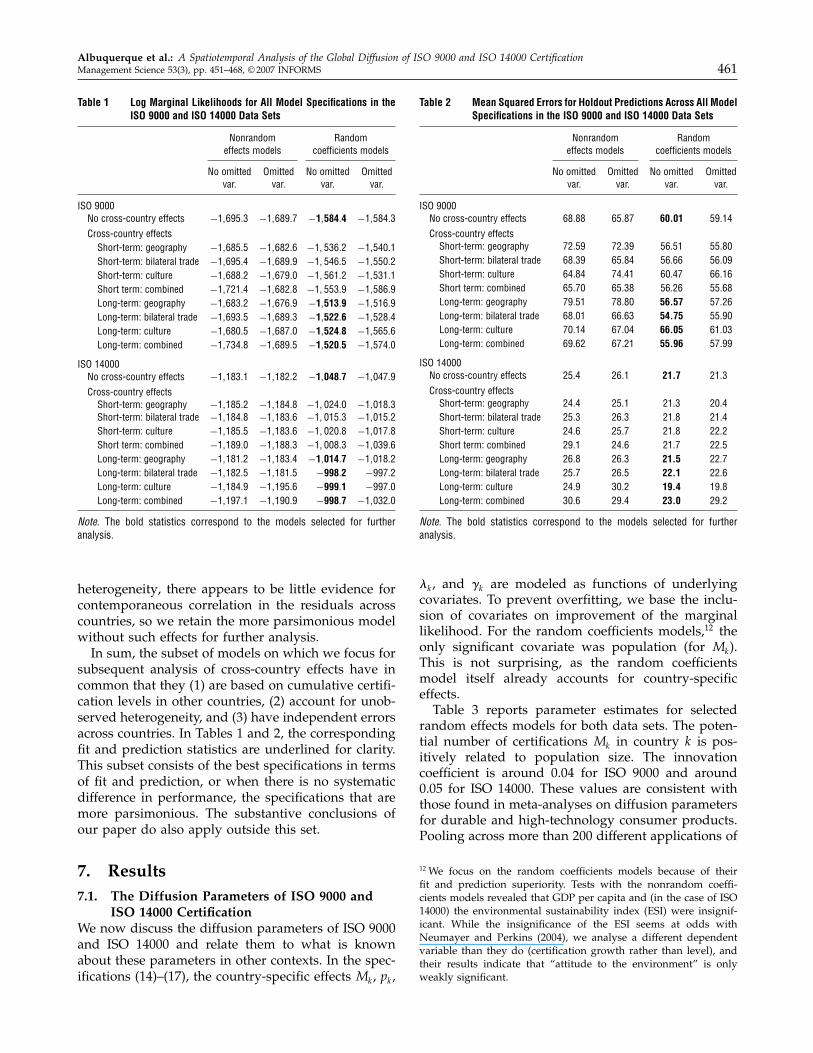
Table 1 shows the log of marginal likelihoods forthe 36 model specifications for ISO 9000 and ISO14000. The table shows that, in most cases, the mod-els with long-term (cumulative) cross-country influ-ence provide a better fit than those with short-terminfluence. Table 2 shows the prediction performancefor the same 36 models. The maximum predictionaccuracy with long-term cross-country influence isslightly better or similar to that of the short-termmodel. Given the superior fit and (mostly) betterprediction results, we retain for further analysis thespecifications where adoption depends on cumulativecertifications.We see that the random-coefficients models that
account for unobserved heterogeneity produce bet-ter fit and substantially better predictions than thenonrandom effects specifications. This is an impor-tant benefit of our Bayesian estimation approach.With our short time series, it is difficult to mean-ingfully account for country-specific diffusion param-eters using classical methods. However, our resultsshow that the information in the time series helps
11 Consistent with Equation (2), these differences are scaled by ck� t−1.This scaling prevents model selection from being dominated by oneor two countries with the largest number of certifications.
Albuquerque et al.: A Spatiotemporal Analysis of the Global Diffusion of ISO 9000 and ISO 14000 Certification460 Management Science 53(3), pp. 451–468, © 2007 INFORMS
Figure 3 (a) Actual and Fitted New ISO 9000 Certifications for 1997; (b) Actual and Predicted New ISO 9000 Certifications for 2000
0
1,000
2,000
3,000
4,000
5,000
6,000
7,000
8,000
9,000
10,000A
rgen
tina
Aus
tral
iaA
ustr
iaB
elgi
umB
razi
lB
ulga
riaC
anad
aC
hile
Chi
naC
olom
bia
Cyp
rus
Cze
chR
Den
mar
kE
gypt
Fin
land
Fra
nce
Ger
man
yG
reec
eH
ong
Kon
gH
unga
ryIn
dia
Indo
nesi
aIr
anIr
elan
dIs
rael
Italy
Japa
nJo
rdan
Ken
yaK
orea
DP
Kor
ea R
epM
alay
sia
Mex
ico
Net
herla
nds
New
Zea
land
Nor
way
Pak
ista
nP
hilip
pine
sP
olan
dP
ortu
gal
Rom
ania
Rus
sia
Sau
di A
rabi
aS
inga
pore
Sou
th A
fric
aS
pain
Sw
eden
Sw
itzer
land
Tha
iland
Tur
key
Uni
ted
Kin
gdom
Uru
guay
Ven
ezue
laY
ugos
lavi
a
Arg
entin
aA
ustr
alia
Aus
tria
Bel
gium
Bra
zil
Bul
garia
Can
ada
Chi
leC
hina
Col
ombi
aC
ypru
sC
zech
RD
enm
ark
Egy
ptF
inla
ndF
ranc
eG
erm
any
Gre
ece
Hon
g K
ong
Hun
gary
Indi
aIn
done
sia
Iran
Irel
and
Isra
elIta
lyJa
pan
Jord
anK
enya
Kor
ea D
PK
orea
Rep
Mal
aysi
aM
exic
oN
ethe
rland
sN
ew Z
eala
ndN
orw
ayP
akis
tan
Phi
lippi
nes
Pol
and
Por
tuga
lR
oman
iaR
ussi
aS
audi
Ara
bia
Sin
gapo
reS
outh
Afr
ica
Spa
inS
wed
enS
witz
erla
ndT
haila
ndT
urke
y
Uni
ted
Kin
gdom
Uru
guay
Ven
ezue
laY
ugos
lavi
a
(a)
0
2,000
4,000
6,000
8,000
10,000
12,000
Actual Predicted
(b)
Actual Fitted
Uni
ted
Sta
tes
Uni
ted
Ara
b E
mira
tes
Uni
ted
Sta
tes
Uni
ted
Ara
b E
mira
tes
make much better predictions. In view of their fit andprediction accuracy, we focus on the model specifi-cations that account for unobserved country hetero-geneity through random effects.
Tables 1 and 2 show limited support for the modelswith contemporaneously correlated errors to accountfor omitted variables, especially for the random coef-ficients models. After accounting for unobserved
Albuquerque et al.: A Spatiotemporal Analysis of the Global Diffusion of ISO 9000 and ISO 14000 CertificationManagement Science 53(3), pp. 451–468, © 2007 INFORMS 461
Table 1 Log Marginal Likelihoods for All Model Specifications in theISO 9000 and ISO 14000 Data Sets
Nonrandom Randomeffects models coefficients models
No omitted Omitted No omitted Omittedvar. var. var. var.
ISO 9000No cross-country effects −1�695�3 −1�689�7 −1�584�4 −1�584�3Cross-country effectsShort-term: geography −1�685�5 −1�682�6 −1�536�2 −1�540�1Short-term: bilateral trade −1�695�4 −1�689�9 −1�546�5 −1�550�2Short-term: culture −1�688�2 −1�679�0 −1�561�2 −1�531�1Short term: combined −1�721�4 −1�682�8 −1�553�9 −1�586�9Long-term: geography −1�683�2 −1�676�9 −1�513�9 −1�516�9Long-term: bilateral trade −1�693�5 −1�689�3 −1�522�6 −1�528�4Long-term: culture −1�680�5 −1�687�0 −1�524�8 −1�565�6Long-term: combined −1�734�8 −1�689�5 −1�520�5 −1�574�0
ISO 14000No cross-country effects −1�183�1 −1�182�2 −1�048�7 −1�047�9Cross-country effectsShort-term: geography −1�185�2 −1�184�8 −1�024�0 −1�018�3Short-term: bilateral trade −1�184�8 −1�183�6 −1�015�3 −1�015�2Short-term: culture −1�185�5 −1�183�6 −1�020�8 −1�017�8Short term: combined −1�189�0 −1�188�3 −1�008�3 −1�039�6Long-term: geography −1�181�2 −1�183�4 −1�014�7 −1�018�2Long-term: bilateral trade −1�182�5 −1�181�5 −998�2 −997�2Long-term: culture −1�184�9 −1�195�6 −999�1 −997�0Long-term: combined −1�197�1 −1�190�9 −998�7 −1�032�0
Note. The bold statistics correspond to the models selected for furtheranalysis.
heterogeneity, there appears to be little evidence forcontemporaneous correlation in the residuals acrosscountries, so we retain the more parsimonious modelwithout such effects for further analysis.In sum, the subset of models on which we focus for
subsequent analysis of cross-country effects have incommon that they (1) are based on cumulative certifi-cation levels in other countries, (2) account for unob-served heterogeneity, and (3) have independent errorsacross countries. In Tables 1 and 2, the correspondingfit and prediction statistics are underlined for clarity.This subset consists of the best specifications in termsof fit and prediction, or when there is no systematicdifference in performance, the specifications that aremore parsimonious. The substantive conclusions ofour paper do also apply outside this set.
7. Results7.1. The Diffusion Parameters of ISO 9000 and
ISO 14000 CertificationWe now discuss the diffusion parameters of ISO 9000and ISO 14000 and relate them to what is knownabout these parameters in other contexts. In the spec-ifications (14)–(17), the country-specific effects Mk, pk,
Table 2 Mean Squared Errors for Holdout Predictions Across All ModelSpecifications in the ISO 9000 and ISO 14000 Data Sets
Nonrandom Randomeffects models coefficients models
No omitted Omitted No omitted Omittedvar. var. var. var.
ISO 9000No cross-country effects 68�88 65�87 60.01 59�14Cross-country effectsShort-term: geography 72�59 72�39 56.51 55�80Short-term: bilateral trade 68�39 65�84 56.66 56�09Short-term: culture 64�84 74�41 60.47 66�16Short term: combined 65�70 65�38 56.26 55�68Long-term: geography 79�51 78�80 56.57 57�26Long-term: bilateral trade 68�01 66�63 54.75 55�90Long-term: culture 70�14 67�04 66.05 61�03Long-term: combined 69�62 67�21 55.96 57�99
ISO 14000No cross-country effects 25�4 26�1 21.7 21�3Cross-country effectsShort-term: geography 24�4 25�1 21.3 20�4Short-term: bilateral trade 25�3 26�3 21.8 21�4Short-term: culture 24�6 25�7 21.8 22�2Short term: combined 29�1 24�6 21.7 22�5Long-term: geography 26�8 26�3 21.5 22�7Long-term: bilateral trade 25�7 26�5 22.1 22�6Long-term: culture 24�9 30�2 19.4 19�8Long-term: combined 30�6 29�4 23.0 29�2
Note. The bold statistics correspond to the models selected for furtheranalysis.
�k, and �k are modeled as functions of underlyingcovariates. To prevent overfitting, we base the inclu-sion of covariates on improvement of the marginallikelihood. For the random coefficients models,12 theonly significant covariate was population (for Mk).This is not surprising, as the random coefficientsmodel itself already accounts for country-specificeffects.Table 3 reports parameter estimates for selected
random effects models for both data sets. The poten-tial number of certifications Mk in country k is pos-itively related to population size. The innovationcoefficient is around 0.04 for ISO 9000 and around0.05 for ISO 14000. These values are consistent withthose found in meta-analyses on diffusion parametersfor durable and high-technology consumer products.Pooling across more than 200 different applications of
12 We focus on the random coefficients models because of theirfit and prediction superiority. Tests with the nonrandom coeffi-cients models revealed that GDP per capita and (in the case of ISO14000) the environmental sustainability index (ESI) were insignif-icant. While the insignificance of the ESI seems at odds withNeumayer and Perkins (2004), we analyse a different dependentvariable than they do (certification growth rather than level), andtheir results indicate that “attitude to the environment” is onlyweakly significant.

Albuquerque et al.: A Spatiotemporal Analysis of the Global Diffusion of ISO 9000 and ISO 14000 Certification462 Management Science 53(3), pp. 451–468, © 2007 INFORMS
Table 3 Parameter Estimates for the ISO 9000 and ISO 14000 Data Sets with Standard Deviations in Parentheses
(1) (2) (3) (4) (5) (6)
ISO 9000Market potential: intercept/1,000 3�670 5�198∗ 3�998 9�452∗ 8�009∗ 7�481∗
�3�630� �2�426� �2�731� �1�680� �1�625� �1�629�Market potential: population 4�765∗ 1�888∗ 2�492∗ 3�152∗ 2�052∗ 1�877∗
�2�160� �0�940� �1�109� �1�284� �1�003� �0�899�Innovation coefficient 0�043 0�042 0�044 0�045 0�044 0�042
�0�028� �0�027� �0�028� �0�027� �0�027� �0�027�Imitation coefficient
Own-country 0�478∗ 0�278∗ 0�306∗ 0�291∗ 0�246∗ 0�218∗
�0�067� �0�052� �0�055� �0�051� �0�046� �0�043�Cross-country: geography 0�095∗ 0�076∗ 0�059∗
�0�030� �0�029� �0�027�Cross-country: bilateral trade 0�061∗ 0�047 0�040
�0�027� �0�027� �0�026�Cross-country: culture 0�105∗ 0�066∗
�0�034� �0�029�Error variance 722�1 456�5 477�3 489�3 436�5 427�66
�64�0� �40�1� �41�5� �43�8� �39�3� �39�5�
ISO 14000Market potential: intercept/1,000 1�747∗ 1�301∗ 1�136∗ 1�322∗ 1�044∗ 0�923∗
�0�399� �0�244� �0�238� �0�244� �0�214� �0�212�Market potential: population 0�549 0�235 0�260 0�372∗ 0�221 0�198
�0�405� �0�165� �0�148� �0�176� �0�113� �0�108�Innovation coefficient 0�040 0�045 0�065∗ 0�046 0�055 0�064∗
�0�027� �0�028� �0�030� �0�028� �0�028� �0�027�Imitation coefficient
Own-country 0�799∗ 0�370∗ 0�379∗ 0�342∗ 0�282∗ 0�260∗
�0�099� �0�063� �0�070� �0�058� �0�053� �0�049�Cross-country: geography 0�181∗ 0�098∗ 0�085∗
�0�033� �0�031� �0�031�Cross-country: bilateral trade 0�118∗ 0�090∗
�0�033� �0�031�Cross-country: culture 0�133∗ 0�108∗ 0�098∗
�0�035� �0�032� �0�032�Error variance 100�75 75�91 67�85 69�22 65�43 62�31
�9�75� �7�37� �7�02� �7�33� �7�40� �6�12�
∗Indicates that ratio of the parameter and its standard deviation exceeds 2. Model (1) has no cross-country effects. Model (2)–Model (4)contain cross-country effects based on geography, bilateral trade, and culture, respectively. Model (5) combines the best predicting two versionsof cross-country effects from Model (2)–Model (4). Model (6) combines all definitions of cross-country effects.
consumer durables, Sultan et al. (1990) find an aver-age value for p of 0.03. This means that the diffu-sion process for management standards (in essence anindustrial durable “good”) has a similar autonomouscomponent as that for a typical durable consumergood.When cross-country imitation is accounted for, the
own-country imitation coefficients are between 0.22and 0.31 for ISO 9000 and between 0.26 and 0.38for ISO 14000. Sultan et al. (1990) find an averagevalue of 0.3 for the imitation effect for consumerdurables. Note from a comparison of model (1) withmodels (2)–(6) that the own-country imitation coeffi-cient is inflated by 50% to 100% when cross-country
imitation is not accounted for. This suggests thatany work on multicountry diffusion that does notexplicitly consider the cross-country influence mayconfound within- and cross-country imitation effectsand hence overestimate the within-country imitationparameter.In Table 3, the estimated cross-country effect coef-
ficients vary from 0.040 to 0.181. No meta-analysisof cross-national diffusion coefficients exists for usto compare our estimates to. We note that the cross-country diffusion parameters are almost all significantand positive and that the findings of the models arerobust to the other empirical specifications from §4including those with spatially correlated errors.

Albuquerque et al.: A Spatiotemporal Analysis of the Global Diffusion of ISO 9000 and ISO 14000 CertificationManagement Science 53(3), pp. 451–468, © 2007 INFORMS 463
Figure 4 ISO 9000 and ISO 14000 Certifications Resulting from Various Diffusion Sources
1994 1995 1996 1997 1998 19990
100
200
300
400
500
600
700 ISO 9 K: Netherlands
1994 1995 1996 1997 1998 19990
200
400
600
800
1,000
1,200
1,400
1,600
1,800 ISO 9 K: China
1997 1998 1999 2000 20010
20
40
60
80
100
120
140
160 ISO 14 K: Netherlands
1997 1998 1999 2000 20010
20
40
60
80
100
120
140 ISO 14 K: China
Innovation
Own-country imitation
Bilateral trade cross-country imitation
Cultural cross-country imitation
To illustrate the differences between countries andto show the flexibility of our model in capturing arich set of diffusion phenomena, we show the diffu-sion patterns for two countries, the Netherlands andChina, and for the two standards. To construct thegraph, we use for each standard the model with allcross-country contagion mechanisms, but to avoid acluttered graph we focus on the contrast between theeffects of bilateral trade and cultural similarity.Figure 4 shows that the autonomous component of
adoption for both ISO 9000 and ISO 14000 is greater inthe Netherlands than in China. The developed coun-tries in Europe were among the first to adopt bothstandards and in turn influenced other countries. Thisis in some part a result of the availability of resourcesin those countries, which facilitates firms to take riskand be innovators.In China, adoption of ISO 9000 was initially largely
fueled by trade-related pressures. This is to beexpected, given that China has become one of themain suppliers of firms in developed countries and
downstream pressures are likely to occur. ISO 14000shows other driving forces beyond trade relations,as also suggested in the literature (e.g., the strengthof relations with communities and other cultural fac-tors). In both China and the Netherlands, the pro-portion of new ISO 14000 certifications that can beattributed to cultural similarity with other countriesis greater than in the case of ISO 9000.
7.2. The Research Questions Revisited
7.2.1. The Nature of Diffusion of ISO 9000 andISO 14000. Tables 1 and 2 show that the specificationswithout cross-country effects always fit and usuallypredict worse for ISO 9000 and ISO 14000. The empiri-cal evidence therefore clearly points to the presence ofcross-country effects in the spread of both standards.For ISO 9000, the cross-country effect based on
geographic distance produces superior fit and goodprediction, while that based on bilateral trade linksprovides good fit and superior prediction. However,
Albuquerque et al.: A Spatiotemporal Analysis of the Global Diffusion of ISO 9000 and ISO 14000 Certification464 Management Science 53(3), pp. 451–468, © 2007 INFORMS
Figure 5 Comparison of the Diffusion Coefficients Between ISO 9000 and ISO 14000 and Between Early- and Later-Adopting Countries
ISO 9 K ISO 14 K0
0.02
0.04
0.06
0.08
0.10Innovation
ISO 9 K ISO 14 K0.10
0.15
0.20
0.25
0.30
0.35
0.40Own country imitation
ISO 9 K ISO 14 K0.10
0.15
0.20
0.25
0.30
0.35
0.40Cross-country imitation
Late adopters
Early adopters
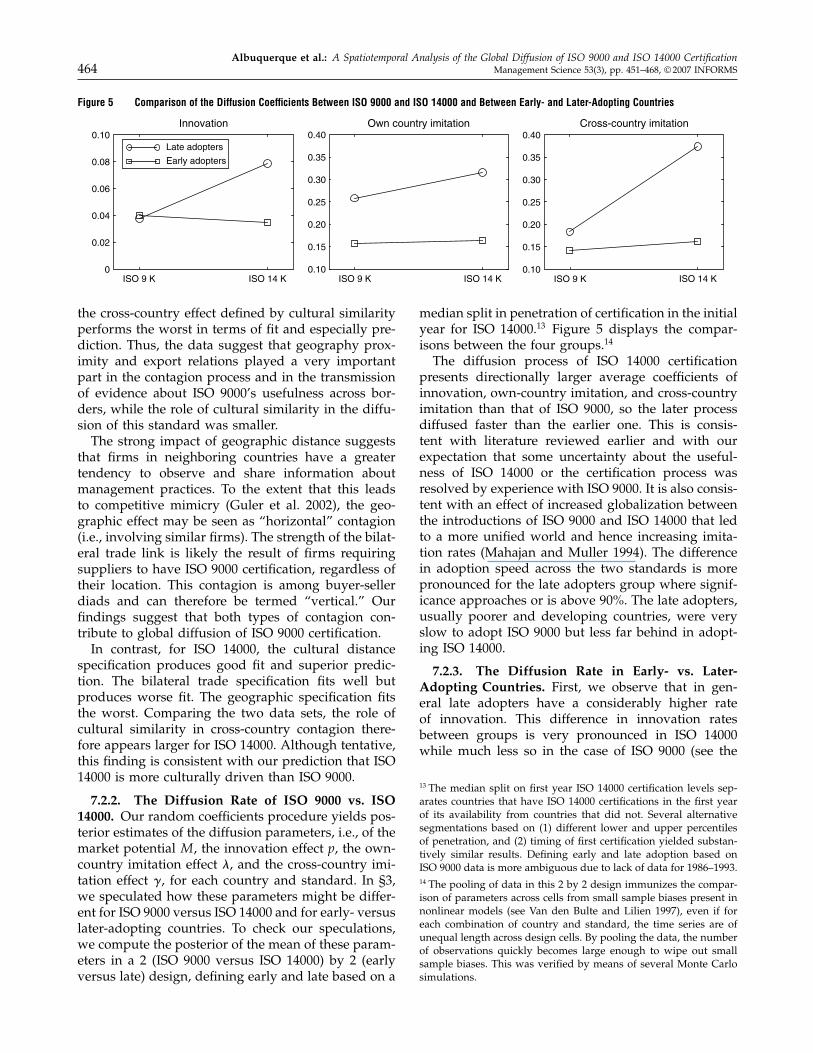
the cross-country effect defined by cultural similarityperforms the worst in terms of fit and especially pre-diction. Thus, the data suggest that geography prox-imity and export relations played a very importantpart in the contagion process and in the transmissionof evidence about ISO 9000’s usefulness across bor-ders, while the role of cultural similarity in the diffu-sion of this standard was smaller.The strong impact of geographic distance suggests
that firms in neighboring countries have a greatertendency to observe and share information aboutmanagement practices. To the extent that this leadsto competitive mimicry (Guler et al. 2002), the geo-graphic effect may be seen as “horizontal” contagion(i.e., involving similar firms). The strength of the bilat-eral trade link is likely the result of firms requiringsuppliers to have ISO 9000 certification, regardless oftheir location. This contagion is among buyer-sellerdiads and can therefore be termed “vertical.” Ourfindings suggest that both types of contagion con-tribute to global diffusion of ISO 9000 certification.In contrast, for ISO 14000, the cultural distance
specification produces good fit and superior predic-tion. The bilateral trade specification fits well butproduces worse fit. The geographic specification fitsthe worst. Comparing the two data sets, the role ofcultural similarity in cross-country contagion there-fore appears larger for ISO 14000. Although tentative,this finding is consistent with our prediction that ISO14000 is more culturally driven than ISO 9000.
7.2.2. The Diffusion Rate of ISO 9000 vs. ISO14000. Our random coefficients procedure yields pos-terior estimates of the diffusion parameters, i.e., of themarket potential M , the innovation effect p, the own-country imitation effect �, and the cross-country imi-tation effect �, for each country and standard. In §3,we speculated how these parameters might be differ-ent for ISO 9000 versus ISO 14000 and for early- versuslater-adopting countries. To check our speculations,we compute the posterior of the mean of these param-eters in a 2 (ISO 9000 versus ISO 14000) by 2 (earlyversus late) design, defining early and late based on a
median split in penetration of certification in the initialyear for ISO 14000.13 Figure 5 displays the compar-isons between the four groups.14
The diffusion process of ISO 14000 certificationpresents directionally larger average coefficients ofinnovation, own-country imitation, and cross-countryimitation than that of ISO 9000, so the later processdiffused faster than the earlier one. This is consis-tent with literature reviewed earlier and with ourexpectation that some uncertainty about the useful-ness of ISO 14000 or the certification process wasresolved by experience with ISO 9000. It is also consis-tent with an effect of increased globalization betweenthe introductions of ISO 9000 and ISO 14000 that ledto a more unified world and hence increasing imita-tion rates (Mahajan and Muller 1994). The differencein adoption speed across the two standards is morepronounced for the late adopters group where signif-icance approaches or is above 90%. The late adopters,usually poorer and developing countries, were veryslow to adopt ISO 9000 but less far behind in adopt-ing ISO 14000.
7.2.3. The Diffusion Rate in Early- vs. Later-Adopting Countries. First, we observe that in gen-eral late adopters have a considerably higher rateof innovation. This difference in innovation ratesbetween groups is very pronounced in ISO 14000while much less so in the case of ISO 9000 (see the
13 The median split on first year ISO 14000 certification levels sep-arates countries that have ISO 14000 certifications in the first yearof its availability from countries that did not. Several alternativesegmentations based on (1) different lower and upper percentilesof penetration, and (2) timing of first certification yielded substan-tively similar results. Defining early and late adoption based onISO 9000 data is more ambiguous due to lack of data for 1986–1993.14 The pooling of data in this 2 by 2 design immunizes the compar-ison of parameters across cells from small sample biases present innonlinear models (see Van den Bulte and Lilien 1997), even if foreach combination of country and standard, the time series are ofunequal length across design cells. By pooling the data, the numberof observations quickly becomes large enough to wipe out smallsample biases. This was verified by means of several Monte Carlosimulations.

Albuquerque et al.: A Spatiotemporal Analysis of the Global Diffusion of ISO 9000 and ISO 14000 CertificationManagement Science 53(3), pp. 451–468, © 2007 INFORMS 465
first panel of Figure 5). Second, we find that later-adopting countries have significantly higher within-country imitation rates for both ISO 9000 and ISO14000 (see also Comin and Hobijn 2004, Takada andJain 1991). Finally, later-adopting countries also havehigher cross-country imitation rates especially for thelater ISO 14000 standard (see the third panel of Figure5). These effects are consistent with the expectationformulated in §3 that early certification in one countrycan resolve uncertainty about ISO standards to firmsin another country and thereby speed up adoption.
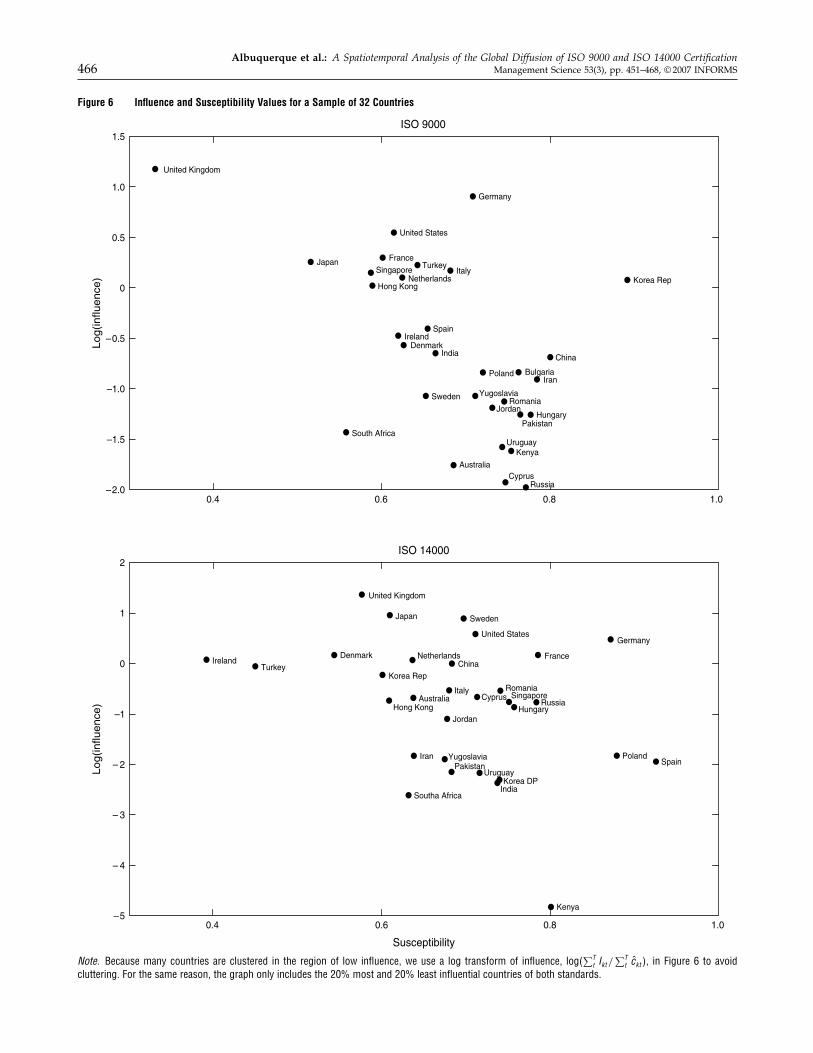
7.2.4. Measures of Influence and Susceptibility.As explained in the theoretical section and the model-ing section, the structure of cross-country interactiondepends on the exact measure of proximity on theinter-firm network. Empirically, we find that the dif-fusion of ISO 9000 and ISO 14000 certification takesplace within a global network of firms and managers,organized by geography, trade, and/or culture eachof which come with their own set of cross-countryeffects. We propose two measures of the importanceof countries in stimulating certification across borders,influence, and susceptibility, which seek to representhow much a country contributes to foreign certifica-tion and how much foreign countries contribute todomestic certification, respectively.Our influence and susceptibility measures are com-
puted by summing the estimated cross-country net-work matrix qkj k� j = 1� �K� alternatively acrosscolumns or rows, respectively. Specifically, the influ-ence index Ikt is defined as the total number of cer-tifications in country j = k that can be attributed topressure from country k in year t:
Ikt =∑
j=1� �K� j =k
qjk ·Ck� t−1Mk︸ ︷︷ ︸
pressure of k on j
· Mj −Cj� t−1�︸ ︷︷ ︸untapped firms in j
(19)
The index Ikt combines two terms. The first term issimply the multiplication of the coefficient qjk thatcaptures the strength of influence of k on j , withthe cumulative certification base Ck� t−1/Mk in k. Thisterm serves as a measure of the “pressure” exerted bycountry k on j . The second term is the “untapped”firms in country j . Similarly, the susceptibility ofcountry k is
Skt =∑
j=1� �K� j =k
qkj ·Cj� t−1Mj︸ ︷︷ ︸
pressure of j on k
· Mk −Ck� t−1�︸ ︷︷ ︸untapped firms in k
(20)
This measure equals the number of certified firms incountry k and year t that the model attributes to for-eign pressures. Figure 6 presents the summed (across
time) relative measures of influence,∑T
t Ikt/∑T
t ckt ,15
and susceptibility,∑T
t Skt/∑T
t ckt , using the combinedspecification (6) in Table 3. Note that the relative sus-ceptibility index
∑Tt Skt/
∑Tt ckt is equal to the cumu-
lative share of certifications in k due to foreignpressures from j = k (see Equation (1)).For ISO 9000, countries like the United Kingdom,
Japan, and the United States, appear to have mod-erate to low susceptibility to cross-national pressurescoupled with a large influence on other countries,i.e., the model estimates that for firms in these coun-tries, certification is not driven by firms in other coun-tries, but rather by those at home. Within the confinesof the model, these countries owe their influence totheir central place in the network consisting of bilat-eral trade relations and neighboring countries. On theother side of the spectrum reside countries like Chinaand Korea that have low to moderate influence butare quite susceptible. This distribution of countriesis consistent with the existence of downstream pres-sures among trading nations found by Lücke (1993)and Comin and Hobijn (2004).Comparing this with the bottom graph, we see that
environmentally proactive countries such as Sweden,Denmark, and the Netherlands were more influentialin the spread of ISO 14000 than of ISO 9000. Overallthough, the relative influence and susceptibility formany countries remains broadly similar across ISO9000 and ISO 14000.Interestingly, many countries have a share of cer-
tifications attributed to foreign pressures larger than0.5. For these countries, the majority of domestic cer-tification originates from cross-country influence. Forpolicy makers interested in encouraging rapid dif-fusion of management practices, our results suggestthat focusing on gaining rapid acceptance in a fewkey influential countries helps accelerate adoption inmany other, more susceptible, countries.
8. ConclusionWe presented a model of international diffusion ofmanagement standards and estimated it on countryby year data for ISO 9000 and ISO 14000 certifica-tion. Our predictions about the nature and speed ofadoption and about individual country influence arederived from a model of network diffusion wherein afirm’s adoption decision is based on proximity to ear-lier adopters on an inter-firm network and a privateevidentiary threshold.We estimated an empirical model of certification
that embeds alternative definitions of inter-firm prox-imity, and at the same time accounts for a wide array
15 To compare across countries, we divide the absolute measures bythe estimated total of certifications
∑Tt ckt in each country, to obtain
a relative measure of influence and susceptibility.
Albuquerque et al.: A Spatiotemporal Analysis of the Global Diffusion of ISO 9000 and ISO 14000 Certification466 Management Science 53(3), pp. 451–468, © 2007 INFORMS
Figure 6 Influence and Susceptibility Values for a Sample of 32 Countries
0.4 0.6 0.8 1.0–2.0
–1.5
–1.0
–0.5
0
0.5
1.0
1.5
Log(influ
ence
)
ISO 9000
Australia
Bulgaria
China
Cyprus
Denmark
France
Germany
Hong Kong
Hungary
India
Iran
Ireland
ItalyJapan
Jordan
Kenya
Korea RepNetherlands
Pakistan
Poland
Romania
Singapore
South Africa
Spain
Sweden
Turkey
United States
United Kingdom
Uruguay
Yugoslavia
0.4 0.6 0.8 1.0–5
– 4
– 3
– 2
–1
0
1
2
Susceptibility
Log(influ
ence
)
ISO 14000
Australia
China
Cyprus
Denmark France
Germany
Hong Kong Hungary
India
Iran
Ireland
Italy
Japan
Jordan
Kenya
Korea DP
Korea Rep
Netherlands
PakistanPoland
Romania
RussiaSingapore
Southa Africa
Spain
Sweden
Turkey
United States
United Kingdom
Uruguay
Yugoslavia
Russia
Note. Because many countries are clustered in the region of low influence, we use a log transform of influence, log�∑T
t Ikt /∑T
t ckt �, in Figure 6 to avoidcluttering. For the same reason, the graph only includes the 20% most and 20% least influential countries of both standards.

Albuquerque et al.: A Spatiotemporal Analysis of the Global Diffusion of ISO 9000 and ISO 14000 CertificationManagement Science 53(3), pp. 451–468, © 2007 INFORMS 467
of country-specific phenomena and cross-countryinfluences. We infer that cross-country effects are sta-tistically (Table 3) and substantively (Figure 4) impor-tant in both ISO 9000 and ISO 14000 certification.Moreover, ISO 9000 certification follows export flowsand geographic proximity, while ISO 14000 appearsto also diffuse across culturally similar countries. Weconclude therefore that the nature of diffusion seemsto be a function of the nature or scope of the standard.Although speculative, our results suggest that stan-dards with more narrowly business-related objectives,such as quality management, accounting principles,or software standards, will diffuse more along supplychains and hence bilateral trade relationships. In con-trast, standards that focus on “societal” issues suchas the environment, labor standards, corporate socialresponsibility, etc., may experience more culturally-driven diffusion.We further found evidence that past certification,
whether to the same standard in earlier-adoptingcountries or to an earlier standard, lowers the per-ceived risk associated with current adoptions, leadingto an increase in diffusion rates. Our results suggestthat the diffusion of future standards may increaseeven more, given the increasing installed base of ISOcertification and given the increased density of inter-firm networks caused by globalization.We finally focused on country level differences in
influence on—and susceptibility to—the global diffu-sion of these management practices. From our find-ings, we conclude that large developed countries suchas the United Kingdom, Japan, and the United Stateswill play key roles in the global diffusion of manage-ment standards. However, depending on the nature ofthe standard, some groups of countries with specificinterests may emerge as leaders in a specific area, e.g.,countries such as Denmark or Sweden, with their tra-ditionally higher concern for the environment, weresome of the most influential in global diffusion ofISO 14000 but less so in the case of ISO 9000. Ourresults may be useful to ISO, auditors, accreditationbodies, government agencies, and others. In partic-ular, they help determine where these organizationsshould focus their efforts in launching future manage-ment standards.A limitation to our approach is that we observe cer-
tification at the country level instead of the firm level.Should firm level observations become available, agood avenue for future research is to allow for moreflexible definitions of inter-firm networks. Also, ourapproach does not consider direct attempts by variousorganizations to encourage certification. It would beof practical interest to model the influence of sourcesof information other than the inter-firm network suchas seminars, government incentives, marketing effortsby ISO, marketing efforts by the auditors, and the like.
9. Electronic CompanionAn electronic companion to this paper is available aspart of the online version that can be found at http://mansci.journal.informs.org/.
AcknowledgmentsThe authors are grateful to Sachin Natu and Linh Goc forresearch assistance and collecting the data for this study. Theyalso express their appreciation to the department editor, thearea editor, and the reviewers for several very helpful sug-gestions, which improved the manuscript substantially. Thefirst author received financial support from the PortugueseFoundation for Science and Technology and from the Cen-ter for International Business Education and Research atUCLA Anderson. The second author received financial sup-port from the Center for International Business Educationand Research at UCLA Anderson. The third author receivedfunding from ISO. They express their gratitude for thisfinancial support.
ReferencesAnderson, S., J. Daly, M. Johnson. 1999. Why firms seek ISO 9000
certification: Regulatory compliance or competitive advantage?Production Oper. Management 8(1) 28–43.
Anderson, C. J., S. Wasserman, B. Crouch. 1999. A p∗ primer: Logitmodels for social networks. Soc. Networks 21 37–66.
Anselin, L. 1988. Spatial Econometrics: Methods and Models. KluwerAcademic Publishers, Boston, MA.
Audretsch, D., M. Feldman. 1996. Knowledge spillovers and thegeography of innovation and production. Amer. Econom. Rev.86 630–640.
Baptista, R. 2000. Do innovations diffuse faster within geographicalclusters? Internat. J. Indust. Organ. 18 515–535.
Bass, F. 1969. A new-product growth model for consumer durables.Management Sci. 15(1) 215–227.
Bikhchandani, S., D. Hirshleifer, I. Welch. 1992. A theory of fads,fashion, custom, and cultural change as informational cas-cades. J. Political Econom. 100 992–1026.
Calem, P., G. Carlino. 1991. Urban agglomeration economies in thepresence of technical change. J. Urban Economies 29(1) 82–95.
CIA. 2003. The World Factbook 2004. Central Intelligence Agency,Washington, D.C. http://www.cia.gov/cia/publications/factbook/index.html.
Comin, D., B. Hobijn. 2004. Cross-country technology adoption:Making the theories face the facts. J. Monetary Econom. 51(1)39–83.
Corbett, C. J. 2006. Global diffusion of ISO 9000 certificationthrough supply chains.Manufacturing Service Oper. Management8(4) 330–350.
Corbett, C. J., D. A. Kirsch. 2001. International diffusion of ISO14000 certification. Production Oper. Management 10(3) 327–342.
Corbett, C. J., A. M. Luca, J.-N. Pan. 2003. Global perspectives onglobal standards, a 15-economy survey of ISO 9000 and ISO14000. ISO Management Systems (January–February) 31–40.
Dialog. 2003. Dialog OnDisk TableBase. http://www.dialog.com.Feenstra, R. 2000. World Trade Flows, 1980–1997. Center of Interna-
tional Data, Institute of Governmental Affairs, University ofCalifornia, Davis, CA.
Gatignon, H., J. Eliashberg, T. Robertson. 1989. Modeling multina-tional diffusion patterns: An efficient methodology. MarketingSci. 8(3) 231–247.

Albuquerque et al.: A Spatiotemporal Analysis of the Global Diffusion of ISO 9000 and ISO 14000 Certification468 Management Science 53(3), pp. 451–468, © 2007 INFORMS
Gelfand, A., D. Dey. 1994. Bayesian model choice—Asymptoticsand exact calculations. J. Roy. Statist. Soc. Ser. B—Methodological56(3) 501–514.
Gelfand, A., A. Smith. 1990. Sampling-based approaches to calcu-lating marginal densities. J. Amer. Statist. Assoc. 85 398–409.
Gelman, A., J. Carlin, H. Stern, D. Rubin. 1995. Bayesian Data Anal-ysis. Chapman and Hall, London, UK.
Glaeser, E., H. Kallal, J. Scheinkman, A. Schleifer. 1992. Growth incities. J. Political Econom. 100 1126–1152.
Granovetter, M. 1978. Threshold models of collective behavior.Amer. J. Sociol. 83 1420–1443.
Grubler, A. 1991. Diffusion—Long-term patterns and discontinu-ities. Tech. Forecasting Soc. Change 39(1–2) 159–180.
Guler, I., M. F. Guillén, J. M. MacPherson. 2002. Global competition,institutions, and the diffusion of organizational practices: Theinternational spread of ISO 9000 quality certificates. Admin. Sci.Quart. 47(2) 207–232.
Hofstede, G. 2001. Culture’s Consequences—Comparing Values, Behav-iors, Institutions and Organizations Across Nations. Sage Publica-tions Ltd., Thousand Oaks, CA.
Horsky, D., L. S. Simon. 1983. Advertising and the diffusion of newproducts. Marketing Sci. 2(1) 1–17.
ISO. 2003. The ISO survey of ISO 9000 and ISO 14001 certifi-cates: Twelfth cycle: Up to and including 31 December 2002.Retrieved July 30, 2003, http://www.iso.org/iso/en/iso9000-14000/pdf/survey12thcycle.pdf.
ISO. 2004. The ISO survey—2004, ISO Central Secretariat,Geneva, Switzerland. Retrieved June 10, 2006, http://www.iso.org/iso/en/iso9000-14000/certification/isosurvey.html.
Kumar, V., T. V. Krishnan. 2002. Multinational diffusion models: Analternative framework. Marketing Sci. 21(3) 318–330.
Lücke, M. 1993. The diffusion of process innovations in industri-alized and developing-countries—A case study of the WorldTextile and Steel industries.World Development 21(7) 1225–1238.
Mahajan, V., E. Muller. 1994. Innovation diffusion in a border-less global market—Will the 1992 unification of the European-community accelerate diffusion of new ideas, products, andtechnologies? Tech. Forecasting Soc. Change 45(3) 221–235.
Mansfield, E. 1961. Technical change and the rate of imitation.Econometrica 29(4) 741–766.
Nakamura, M., I. Vertinsky, C. Zietsma. 1997. Does culture matterin inter-firm cooperation? Research consortia in Japan and theUSA. Managerial Decision Econom. 18(2), 153–175.
Neelamegham, R., P. Chintagunta. 1999. A Bayesian model to fore-cast new product performance in domestic and internationalmarkets. Marketing Sci. 18(2) 115–136.
Neumayer, E., R. Perkins. 2004. What explains the uneven take-up of ISO 14001 at the global level? A panel data analysis.Environment and Planning A 36(5) 823–839.
Newbold, P., C. W. J. Granger. 1974. Spurious regression in econo-metrics. J. Econometrics 2 111–120.
Newton, M., A. Raftery. 1994. Approximate Bayesian inference bythe weighted likelihood bootstrap. J. Roy. Statist. Soc. Ser. B 5641–42.
Putsis, W., Jr., S. Balasubramanian, E. Kaplan, S. Sen. 1997. Mix-ing behavior in cross-country diffusion. Marketing Sci. 16(4)354–369.
Shaikh, N. I., A. Rangaswamy, A. Balakrishnan. 2005. Modeling thediffusion of innovations using small-world networks. Workingpaper, Penn State University, Philadelphia, PA.
Shane, S. 1993. Cultural influences on national rates of innovation.J. Bus. Venturing 8 59–73.
Sultan, F., J. U. Farley, D. R. Lehmann. 1990. A meta analysis ofapplications of diffusion models. J. Marketing Res. 27(February)70–77.
Takada, H., D. Jain. 1991. Cross-national analysis of diffusion ofconsumer durable goods in pacific rim countries. J. Marketing55(2) 48–54.
Talukdar, D., K. Sudhir, A. Ainslie. 2002. Investigating new productdiffusion across products and countries. Marketing Sci. 21(1)97–114.
Tanner, M., W. Wong. 1987. The calculation of posterior distribu-tions by data augmentation. J. Amer. Statist. Assoc. 82 528–549.
Teece, D. 1980. The diffusion of an administrative innovation. Man-agement Sci. 26(5) 464–470.
Triandis, H. C., E. M. Suh. 2002. Cultural influences on personality.Ann. Rev. Psych. 53 133–160.
Valente, T. W. 1995. Network Models of the Diffusion of Innovations.Hampton Press, Cresskil, NJ.
Van den Bulte, C. 2000. New product diffusion acceleration: Mea-surement and analysis. Marketing Sci. 19(4) 366–380.
Van den Bulte, C., G. L. Lilien. 1997. Bias and systematic changein the parameter estimates of macro-level diffusion models.Marketing Sci. 16(4) 338–353.
Van Everdingen, Y. M., E. Waarts. 2003. The effect of nationalculture on the adoption of innovations. Marketing Lett. 14(3)217–232.
Wasserman, S., K. Faust. 1994. Social Network Analysis: Methods andApplications. Cambridge University Press, Cambridge, UK.
World Economic Forum. 2002. Environmental sustainability index.Retrieved July 31, 2004, http://www.ciesin.columbia.edu/indicators/ESI.