
A simple surfactant–free hydrothermal route for the preparation of HgS nanoparticles and their...
6
A simple hydrothermal route for the preparation of HgS nanoparticles and their photocatalytic activities† Rengaraj Selvaraj, * a Kezhen Qi, b Salma M. Z. Al-Kindy, a Mika Sillanp ¨ a ¨ a, c Younghun Kim d and Cheuk-Wai Tai e HgS nanoparticles have been successfully prepared by a hydrothermal method using polyethylene glycol (PEG) as stabilizing agent and characterized by a variety of methods. Our experiments confirmed that the size of the HgS nanocrystals could be easily modified by tuning the chain length of PEG. X-ray powder diffraction (XRD) results for the nanoparticles revealed the hexagonal structure of the HgS, i.e. a-phase known as cinnabar. Morphological studies performed by scanning electron microscopy (SEM) and transmission electron microscopy (TEM) showed that the synthesized nanocrystals were nanoparticles. Furthermore, a rational mechanism of the formation and evolution of the products was proposed. The optical properties of HgS were investigated by diffuse reflectance spectroscopy (DRS), which indicated that the band gap of the nanoparticles is slightly decreased from 2.05 to 2.00 eV as the average particle size decreases from 55 to 35 nm. Furthermore, the photocatalytic activity studies of the particles demonstrated their excellent photocatalytic performance in rapidly degrading aqueous methylene blue dye solution under visible light irradiation. These results suggest that HgS nanoparticles will be an interesting candidate of photocatalyst working in visible light range. 1. Introduction The rational design and fabrication of nanomaterials with special morphology have attracted a great deal of attention because the properties of material depend not only on its chemical composition and phase, but also depend on its shape and size. 1 Particularly, the synthesis of semiconductor nano- material with different sizes has motivated much attention due to its size-dependent properties, and potential applications in the elds of optics, catalysts, electronics, and so on. 2 Therefore, various approaches have been developed to synthesize nano- crystals with controlled morphology, 3 among which the hydro- thermal method is considered to be efficient, 4 because it is demonstrated to be effective for controlling the shape and size of nanomaterials. Metal suldes have been extensively investigated due to their promising properties and potential use in many devices. 5 Among the metal suldes, mercury(II) sulde (HgS) is widely used in many elds such as infrared sensor and emitter, 6 elec- trostatic image materials, 7 semiconductor, 8 optical applica- tions, 9 and photoelectric conversion devices. 10 These applications are resulted from its unique physicochemical properties, which depend not only on the phase but also on the shape and size. For instance, Higginson et al., demonstrated that the HgS crystals exhibit different optical properties corre- sponding to their different shape and size changes. 11 Over the past few years, great effort has been made to control the synthesis of HgS nanomaterial, many different HgS morphol- ogies have been reported, such as nanoparticle, 12 nanorod, 13 nanowire, 14 nanodendrite, 15 and nanotube. 16 However, the development of facile, mild and effective methods for the synthesis of HgS nanocrystals with a controllable size and morphology is still a great challenge. In this work, we present a simple hydrothermal synthesis of HgS nanocrystals using PEG as stabilizing agent. It is found that the morphology variations of the HgS nanoparticles were ach- ieved by simply varying the PEG length. Namely, the size of HgS particles is decreased by increasing the PEG length. Further- more, a rational mechanism for the formation and evolution of the products is proposed. The diffuse reectance spectrum (DRS) measurements showed that these HgS samples have the band gap from 2.05 to 2.00 eV. These HgS nanoparticles could a Department of Chemistry, College of Science, Sultan Qaboos University, Muscat, Sultanate of Oman. E-mail: [email protected]; Tel: +968-2414-2436 b College of Chemistry and Life Science, Shenyang Normal University, Shenyang, 110034, China c Laboratory of Green Chemistry, LUT Savo Sustainable Technologies, Lappeenranta University of Technology, Sammonkatu 12, FI-50130 Mikkeli, Finland d Department of Chemical Engineering, Kwangwoon University, Seoul 139-701, Korea e Department of Materials and Environmental Chemistry, Arrhenius Laboratory, Stockholm University, S-106 91 Stockholm, Sweden † Electronic supplementary information (ESI) available. See DOI: 10.1039/c4ra00483c Cite this: RSC Adv. , 2014, 4, 15371 Received 17th January 2014 Accepted 10th February 2014 DOI: 10.1039/c4ra00483c www.rsc.org/advances This journal is © The Royal Society of Chemistry 2014 RSC Adv. , 2014, 4, 15371–15376 | 15371 RSC Advances PAPER
Transcript of A simple surfactant–free hydrothermal route for the preparation of HgS nanoparticles and their...
RSC Advances
PAPER
aDepartment of Chemistry, College of Scie
Sultanate of Oman. E-mail: srengaraj1971@bCollege of Chemistry and Life Science, S
110034, ChinacLaboratory of Green Chemistry, LUT Savo
University of Technology, Sammonkatu 12,dDepartment of Chemical Engineering, KwaneDepartment of Materials and Environme
Stockholm University, S-106 91 Stockholm,
† Electronic supplementary informa10.1039/c4ra00483c
Cite this: RSC Adv., 2014, 4, 15371
Received 17th January 2014Accepted 10th February 2014
DOI: 10.1039/c4ra00483c
www.rsc.org/advances
This journal is © The Royal Society of C
A simple hydrothermal route for the preparation ofHgS nanoparticles and their photocatalyticactivities†
Rengaraj Selvaraj,*a Kezhen Qi,b Salma M. Z. Al-Kindy,a Mika Sillanpaa,c
Younghun Kimd and Cheuk-Wai Taie
HgS nanoparticles have been successfully prepared by a hydrothermal method using polyethylene glycol
(PEG) as stabilizing agent and characterized by a variety of methods. Our experiments confirmed that the
size of the HgS nanocrystals could be easily modified by tuning the chain length of PEG. X-ray powder
diffraction (XRD) results for the nanoparticles revealed the hexagonal structure of the HgS, i.e. a-phase
known as cinnabar. Morphological studies performed by scanning electron microscopy (SEM) and
transmission electron microscopy (TEM) showed that the synthesized nanocrystals were nanoparticles.
Furthermore, a rational mechanism of the formation and evolution of the products was proposed. The
optical properties of HgS were investigated by diffuse reflectance spectroscopy (DRS), which indicated
that the band gap of the nanoparticles is slightly decreased from 2.05 to 2.00 eV as the average particle
size decreases from 55 to 35 nm. Furthermore, the photocatalytic activity studies of the particles
demonstrated their excellent photocatalytic performance in rapidly degrading aqueous methylene blue
dye solution under visible light irradiation. These results suggest that HgS nanoparticles will be an
interesting candidate of photocatalyst working in visible light range.
1. Introduction
The rational design and fabrication of nanomaterials withspecial morphology have attracted a great deal of attentionbecause the properties of material depend not only on itschemical composition and phase, but also depend on its shapeand size.1 Particularly, the synthesis of semiconductor nano-material with different sizes has motivated much attention dueto its size-dependent properties, and potential applications inthe elds of optics, catalysts, electronics, and so on.2 Therefore,various approaches have been developed to synthesize nano-crystals with controlled morphology,3 among which the hydro-thermal method is considered to be efficient,4 because it isdemonstrated to be effective for controlling the shape and sizeof nanomaterials.
nce, Sultan Qaboos University, Muscat,
yahoo.com; Tel: +968-2414-2436
henyang Normal University, Shenyang,
Sustainable Technologies, Lappeenranta
FI-50130 Mikkeli, Finland
gwoon University, Seoul 139-701, Korea
ntal Chemistry, Arrhenius Laboratory,
Sweden
tion (ESI) available. See DOI:
hemistry 2014
Metal suldes have been extensively investigated due to theirpromising properties and potential use in many devices.5
Among the metal suldes, mercury(II) sulde (HgS) is widelyused in many elds such as infrared sensor and emitter,6 elec-trostatic image materials,7 semiconductor,8 optical applica-tions,9 and photoelectric conversion devices.10 Theseapplications are resulted from its unique physicochemicalproperties, which depend not only on the phase but also on theshape and size. For instance, Higginson et al., demonstratedthat the HgS crystals exhibit different optical properties corre-sponding to their different shape and size changes.11 Over thepast few years, great effort has been made to control thesynthesis of HgS nanomaterial, many different HgS morphol-ogies have been reported, such as nanoparticle,12 nanorod,13
nanowire,14 nanodendrite,15 and nanotube.16 However, thedevelopment of facile, mild and effective methods for thesynthesis of HgS nanocrystals with a controllable size andmorphology is still a great challenge.
In this work, we present a simple hydrothermal synthesis ofHgS nanocrystals using PEG as stabilizing agent. It is found thatthe morphology variations of the HgS nanoparticles were ach-ieved by simply varying the PEG length. Namely, the size of HgSparticles is decreased by increasing the PEG length. Further-more, a rational mechanism for the formation and evolution ofthe products is proposed. The diffuse reectance spectrum(DRS) measurements showed that these HgS samples have theband gap from 2.05 to 2.00 eV. These HgS nanoparticles could
RSC Adv., 2014, 4, 15371–15376 | 15371
RSC Advances Paper
be potentially applied to photocatalytic degradation studies.The photocatalytic activity of as-prepared HgS nanoparticleswas also evaluated by using methylene blue dye solution as amodel organic compound and the result revealed that theproduct as-obtained had good photocatalytic activity.
2. Experimental section2.1 Synthesis of HgS nanocrystal
The HgS nanocrystals were prepared using analytical grade,mercury(II) nitrate (Hg(NO3)2$4H2O) (Sigma-Aldrich 99%), thi-oacetamide (C2H5NS) (Sigma-Aldrich 99%) and poly(ethyleneglycol) (PEG) (Merck, Germany). In a typical synthesis,3.24 mmol of Hg(NO3)2$4H2O, 5.32 mmol of thioacetamide(TAA) and 0.6 g of PEG (PEG-0, 2000, 4000, and 6000) weredissolved in 50 mL of deionized water to form the reactionsolution. The mixture was continuously stirred for 30 min atroom temperature, and then was transferred into an autoclavewith a Teon lining and heated at 180 �C for 10 h, and thenallowed to cool to room temperature. The as-prepared productwas separated by centrifugation, washed several times withdeionized water and ethanol respectively, and dried at 60 �C for24 h. Finally, the products were calcined at 350 �C for 2 h forfurther characterization.
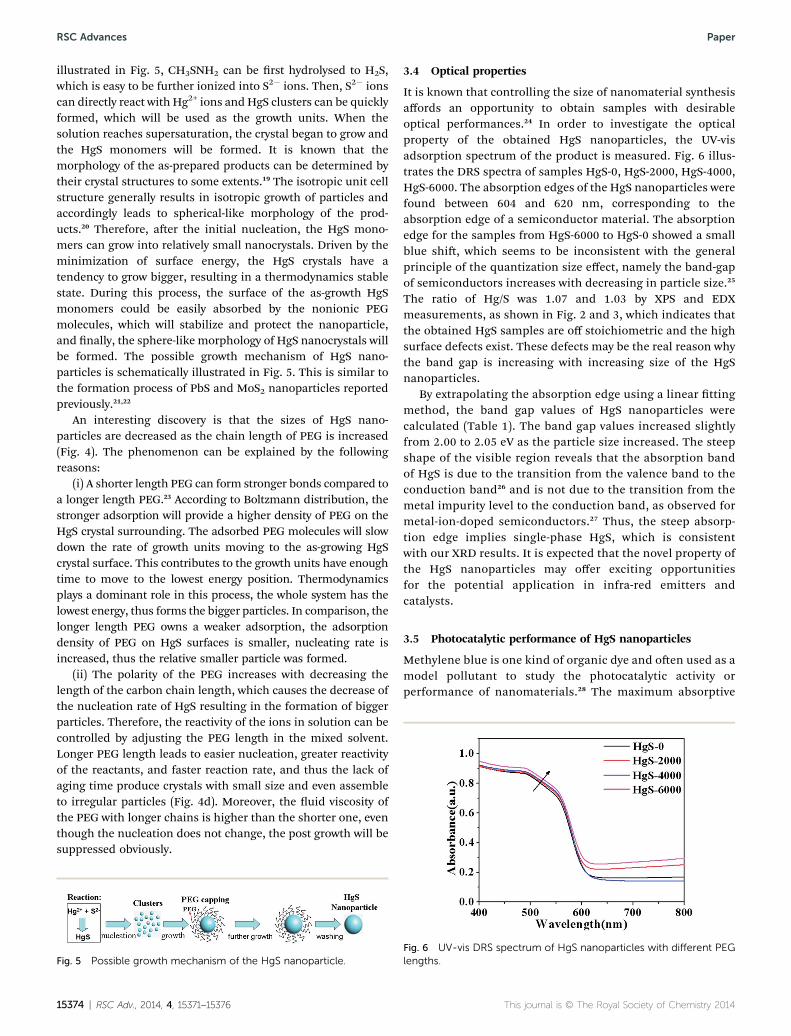
Fig. 1 XRD patterns of the as-prepared HgS products with differentPEG lengths (a) PEG-0, (b) PEG-2000, (c) PEG-4000, and (d) PEG-6000.
2.2 Characterization of HgS nanoparticles
The products were characterized by X-ray diffraction (XRD)using a Bruker (D5005) X-ray diffractometer equipped withgraphite monochromatized Cu Ka radiation (l ¼ 1.54056 A).The morphology of the as-synthesized products was examinedby scanning electron microscopy (SEM). The SEM measure-ments were performed with a Hitachi S-4800 high-resolutioneld-emission scanning electron microscope (HR-SEM), whichis equipped with an energy dispersive X-ray spectrometer (EDX).The morphology of the products was also carried out in trans-mission electron microscope (JEOL JEM-3010). The chemicalstates and the relative composition of the samples were studiedby X-ray photoelectron spectroscopy (XPS), which is a highlysurface sensitive technique with information depth in a fewnanometers. The X-ray source is Al Ka radiation (1.486.7 eV).The photo-emitted electrons escaped from the sample wereanalyzed in a hemispherical energy analyzer at a pass energy ofEp ¼ 20 eV. All spectra were obtained with an energy step of 0.1eV and a dwell time of 50 ms. A soware package (AvantageThermo VG) was used to analyze the XPS data and t the curves.The absorption spectrum of the samples in the diffusedreectance spectrum (DRS) mode was recorded in the wave-length range between 200 and 1000 nm using a spectropho-tometer (Jasco-V670), with BaSO4 as a reference. From theabsorption edge, the band gap values were calculated byextrapolation.
All photoreaction experiments were carried out in a photo-catalytic reactor system, which consists of a cylindrical boro-silicate glass reactor vessels with an effective volume of 500 mL,a cooling water jacket, and a 150 W sodium vapour lamp(OSRAM Vialox NAV-TS Super 150 W) positioned axially at the
15372 | RSC Adv., 2014, 4, 15371–15376
center as a visible light source. The reaction temperature waskept at 20 �C by cooling water. A special glass frit as an airdiffuser was xed at the reactor to uniformly disperse air intothe solution.
Visible light photocatalytic activity studies were performed toexamine the methylene blue (MB) degradation in an aqueoussolution. For each run the reaction suspensions were freshlyprepared by adding 0.10 g of catalyst into 250 mL of aqueousmethylene blue solution, with an initial concentration of 5 mgL�1. Prior to the photoreaction, the suspension was magneti-cally stirred in a dark condition for 30 min to attain theadsorption/desorption equilibrium condition. The aqueoussuspension containing methylene blue and photocatalyst wasthen irradiated with visible light with constant aeration. At thegiven time intervals, the analytical samples were taken from thesuspension, immediately centrifuged at 4000 revolutions perminute (rpm) for 15 min, and then ltered to remove the cata-lyst. The ltrate was analysed by an ultraviolet-visible (UV-vis)absorption spectra instrument (Perkin-Elmer Lambda 45 UV-visspectrometer) to understand the methylene blue degradation.The degree of degradation has been derived from the UV-visabsorption intensity, which has been integrated at the wave-length of 664 nm.
3. Results and discussion3.1 Structure and composition determination
The XRD patterns of the samples prepared in different length ofPEG are shown in Fig. 1. All diffraction peaks in the patterns canbe indexed to be a pure hexagonal phase (a-phase) HgS (JCPDScard no. 6-0256). It is worth to note that similar XRD patternswere observed for all samples prepared with different PEGlengths, indicating that changing PEG length does not changethe phase and crystallinity of HgS.
To conrm the composition of the samples (HgS–PEG-2000sample, for example), XPS analysis was carried out, as shown in
This journal is © The Royal Society of Chemistry 2014

Fig. 2 XPS analysis of the sample HgS–PEG-2000: (a) survey spec-trum, (b) Hg 4f bonding-energy spectrum, and (c) S 2p bonding-energy spectrum.
Fig. 3 The morphology and structure of as-prepared HgS nano-particles by PEG-2000 assistance. (a) Low-, and (b) high-magnificationTEM images; (c) HRTEM image of the selected area marked with a pinksquare in (b); the inset is the corresponding fast Fourier transformation(FFT) pattern; (d and e) the corresponding EDS elemental mappingimages of Hg and S. (f) EDX spectrum of the HgS nanoparticles.
Paper RSC Advances
Fig. 2. The binding energies obtained in the XPS analysis arecorrected for specimen charging by referencing the C 1s to285.2 eV. The wide XPS spectrum was shown in Fig. 2a. Nopeaks of other elements except C, O, Hg, and S were observed.The observed C peak is due to the carbon supporting lm on thecopper TEM grid, and the O peaks can be attributed to theabsorption of oxygen on the sample surface. The XPS spectra ofHgS sample was consistent with the typical HgS spectrumreported in the literature.17 Fig. 2b and c showed the high-resolution XPS spectra of Hg 4f and S 2p, respectively. The twostrong peaks taken for the Hg region at 99.4 and 103.3 eV wereassigned to the Hg 4f binding energy. The peaks measured inthe S energy region detected at 160.7 and 161.5 eV were attrib-uted to the S 2p transitions. These values are in good agreementwith the reported data.18 According to the measurements of theHg 4f and S 2p peak areas, the atomic ratio of Hg : S is 1.07 : 1,very close to the composition of HgS.
Fig. 4 SEM images of the as-prepared final HgS products withdifferent PEG lengths (a) PEG-0, (b) PEG-2000, (c) PEG-4000, and (d)PEG-6000.
3.2 Morphology of samples
Morphologies of the HgS nanocrystals prepared using differentPEG lengths under the same reaction condition that is thereaction temperature kept at 180 �C for 10 hours and the molarratio of Hg2+/S2� at 1 : 1. As an example, when PEG-2000 isemployed, the product is comprised of nanoparticles with adiameter of 30–50 nm (Fig. 3a), which agrees well the value ofcrystalline size based on the Scherrer formula, from the XRDdata. The HRTEM image of the edge of the single nanoparticle(Fig. 3b) marked by a square in Fig. 3c shows that the distancebetween adjacent lattice planes is about 0.33 nm, correspond-ing to the (101) plane, indicating that the nal HgS nanoparticleexhibits a preferred growth along the [101] direction. The EDXimage recorded from the same region also conrms that thecomponents of the products are only Hg and S with a ratio of1.03 : 1 (Fig. 3f), which is supported by the element map (Fig. 3dand e). The Cu signal is attributed to the copper supportinggrid.
This journal is © The Royal Society of Chemistry 2014
The morphology of the samples with different PEG lengths isfurther examined by SEM (Fig. 4). When PEG-2000 was used, thediameters of the as-obtained HgS nanoparticles are 40–60 nm(Fig. 4b). When the PEG length is decreased to PEG-0, thediameters are dispersed more from 40 to 70 nm (Fig. 4a). Whenthe PEG-2000 further increase to PEG-4000, the diameter disperserang is back to 30–50 nm (Fig. 4c). When PEG-6000 is employed,the product is comprised of the smallest nanoparticles illustratedin Fig. 4, about 25–45 nm. The results indicate that the size ofHgS nanoparticles can be easily controlled by changing the chainlength of PEG. Namely, the size of the HgS nanoparticles isdecreased when a PEG with longer length is used.
3.3 Growth mechanism of HgS nanoparticles
In the synthesis, when Hg(NO3)2 and C2H5NS are dissolved intothe deionized water, a clear solution was obtained. As
RSC Adv., 2014, 4, 15371–15376 | 15373
RSC Advances Paper
illustrated in Fig. 5, CH3SNH2 can be rst hydrolysed to H2S,which is easy to be further ionized into S2� ions. Then, S2� ionscan directly react with Hg2+ ions and HgS clusters can be quicklyformed, which will be used as the growth units. When thesolution reaches supersaturation, the crystal began to grow andthe HgS monomers will be formed. It is known that themorphology of the as-prepared products can be determined bytheir crystal structures to some extents.19 The isotropic unit cellstructure generally results in isotropic growth of particles andaccordingly leads to spherical-like morphology of the prod-ucts.20 Therefore, aer the initial nucleation, the HgS mono-mers can grow into relatively small nanocrystals. Driven by theminimization of surface energy, the HgS crystals have atendency to grow bigger, resulting in a thermodynamics stablestate. During this process, the surface of the as-growth HgSmonomers could be easily absorbed by the nonionic PEGmolecules, which will stabilize and protect the nanoparticle,and nally, the sphere-like morphology of HgS nanocrystals willbe formed. The possible growth mechanism of HgS nano-particles is schematically illustrated in Fig. 5. This is similar tothe formation process of PbS and MoS2 nanoparticles reportedpreviously.21,22
An interesting discovery is that the sizes of HgS nano-particles are decreased as the chain length of PEG is increased(Fig. 4). The phenomenon can be explained by the followingreasons:
(i) A shorter length PEG can form stronger bonds compared toa longer length PEG.23 According to Boltzmann distribution, thestronger adsorption will provide a higher density of PEG on theHgS crystal surrounding. The adsorbed PEG molecules will slowdown the rate of growth units moving to the as-growing HgScrystal surface. This contributes to the growth units have enoughtime to move to the lowest energy position. Thermodynamicsplays a dominant role in this process, the whole system has thelowest energy, thus forms the bigger particles. In comparison, thelonger length PEG owns a weaker adsorption, the adsorptiondensity of PEG on HgS surfaces is smaller, nucleating rate isincreased, thus the relative smaller particle was formed.
(ii) The polarity of the PEG increases with decreasing thelength of the carbon chain length, which causes the decrease ofthe nucleation rate of HgS resulting in the formation of biggerparticles. Therefore, the reactivity of the ions in solution can becontrolled by adjusting the PEG length in the mixed solvent.Longer PEG length leads to easier nucleation, greater reactivityof the reactants, and faster reaction rate, and thus the lack ofaging time produce crystals with small size and even assembleto irregular particles (Fig. 4d). Moreover, the uid viscosity ofthe PEG with longer chains is higher than the shorter one, eventhough the nucleation does not change, the post growth will besuppressed obviously.
Fig. 5 Possible growth mechanism of the HgS nanoparticle.
15374 | RSC Adv., 2014, 4, 15371–15376
3.4 Optical properties
It is known that controlling the size of nanomaterial synthesisaffords an opportunity to obtain samples with desirableoptical performances.24 In order to investigate the opticalproperty of the obtained HgS nanoparticles, the UV-visadsorption spectrum of the product is measured. Fig. 6 illus-trates the DRS spectra of samples HgS-0, HgS-2000, HgS-4000,HgS-6000. The absorption edges of the HgS nanoparticles werefound between 604 and 620 nm, corresponding to theabsorption edge of a semiconductor material. The absorptionedge for the samples from HgS-6000 to HgS-0 showed a smallblue shi, which seems to be inconsistent with the generalprinciple of the quantization size effect, namely the band-gapof semiconductors increases with decreasing in particle size.25
The ratio of Hg/S was 1.07 and 1.03 by XPS and EDXmeasurements, as shown in Fig. 2 and 3, which indicates thatthe obtained HgS samples are off stoichiometric and the highsurface defects exist. These defects may be the real reason whythe band gap is increasing with increasing size of the HgSnanoparticles.
By extrapolating the absorption edge using a linear ttingmethod, the band gap values of HgS nanoparticles werecalculated (Table 1). The band gap values increased slightlyfrom 2.00 to 2.05 eV as the particle size increased. The steepshape of the visible region reveals that the absorption bandof HgS is due to the transition from the valence band to theconduction band26 and is not due to the transition from themetal impurity level to the conduction band, as observed formetal-ion-doped semiconductors.27 Thus, the steep absorp-tion edge implies single-phase HgS, which is consistentwith our XRD results. It is expected that the novel property ofthe HgS nanoparticles may offer exciting opportunitiesfor the potential application in infra-red emitters andcatalysts.
3.5 Photocatalytic performance of HgS nanoparticles
Methylene blue is one kind of organic dye and oen used as amodel pollutant to study the photocatalytic activity orperformance of nanomaterials.28 The maximum absorptive
Fig. 6 UV-vis DRS spectrum of HgS nanoparticles with different PEGlengths.
This journal is © The Royal Society of Chemistry 2014
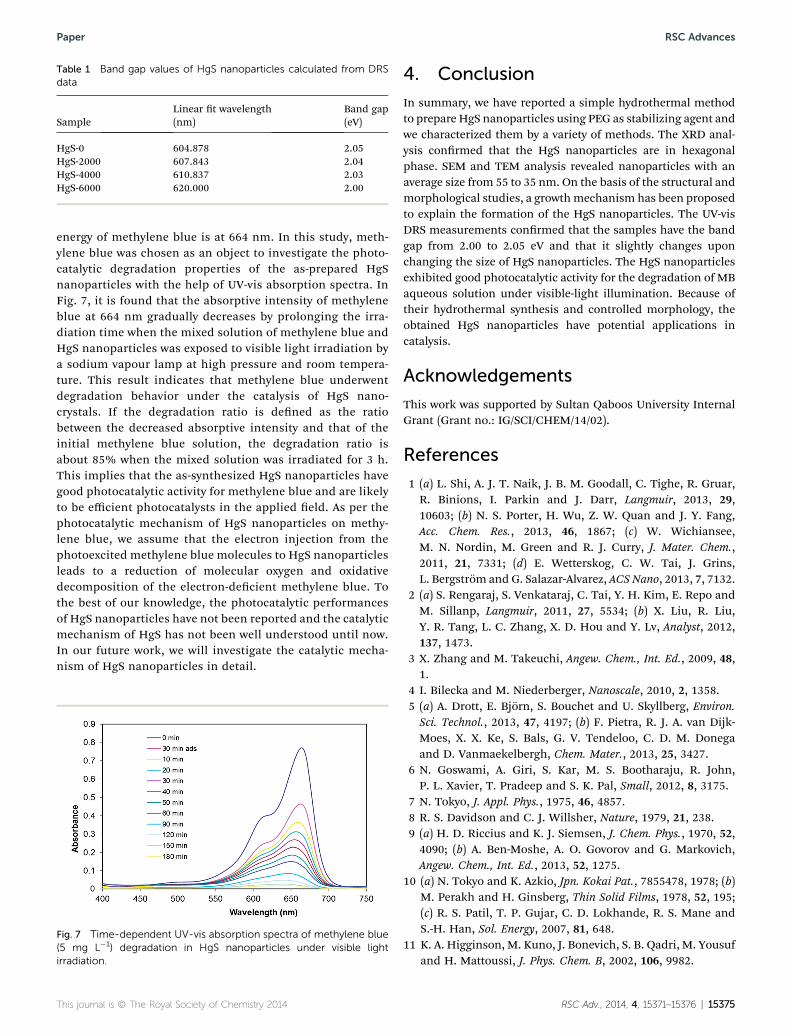
Table 1 Band gap values of HgS nanoparticles calculated from DRSdata
SampleLinear t wavelength(nm)
Band gap(eV)
HgS-0 604.878 2.05HgS-2000 607.843 2.04HgS-4000 610.837 2.03HgS-6000 620.000 2.00
Paper RSC Advances
energy of methylene blue is at 664 nm. In this study, meth-ylene blue was chosen as an object to investigate the photo-catalytic degradation properties of the as-prepared HgSnanoparticles with the help of UV-vis absorption spectra. InFig. 7, it is found that the absorptive intensity of methyleneblue at 664 nm gradually decreases by prolonging the irra-diation time when the mixed solution of methylene blue andHgS nanoparticles was exposed to visible light irradiation bya sodium vapour lamp at high pressure and room tempera-ture. This result indicates that methylene blue underwentdegradation behavior under the catalysis of HgS nano-crystals. If the degradation ratio is dened as the ratiobetween the decreased absorptive intensity and that of theinitial methylene blue solution, the degradation ratio isabout 85% when the mixed solution was irradiated for 3 h.This implies that the as-synthesized HgS nanoparticles havegood photocatalytic activity for methylene blue and are likelyto be efficient photocatalysts in the applied eld. As per thephotocatalytic mechanism of HgS nanoparticles on methy-lene blue, we assume that the electron injection from thephotoexcited methylene blue molecules to HgS nanoparticlesleads to a reduction of molecular oxygen and oxidativedecomposition of the electron-decient methylene blue. Tothe best of our knowledge, the photocatalytic performancesof HgS nanoparticles have not been reported and the catalyticmechanism of HgS has not been well understood until now.In our future work, we will investigate the catalytic mecha-nism of HgS nanoparticles in detail.
Fig. 7 Time-dependent UV-vis absorption spectra of methylene blue(5 mg L�1) degradation in HgS nanoparticles under visible lightirradiation.
This journal is © The Royal Society of Chemistry 2014
4. Conclusion
In summary, we have reported a simple hydrothermal methodto prepare HgS nanoparticles using PEG as stabilizing agent andwe characterized them by a variety of methods. The XRD anal-ysis conrmed that the HgS nanoparticles are in hexagonalphase. SEM and TEM analysis revealed nanoparticles with anaverage size from 55 to 35 nm. On the basis of the structural andmorphological studies, a growthmechanism has been proposedto explain the formation of the HgS nanoparticles. The UV-visDRS measurements conrmed that the samples have the bandgap from 2.00 to 2.05 eV and that it slightly changes uponchanging the size of HgS nanoparticles. The HgS nanoparticlesexhibited good photocatalytic activity for the degradation of MBaqueous solution under visible-light illumination. Because oftheir hydrothermal synthesis and controlled morphology, theobtained HgS nanoparticles have potential applications incatalysis.
Acknowledgements
This work was supported by Sultan Qaboos University InternalGrant (Grant no.: IG/SCI/CHEM/14/02).
References
1 (a) L. Shi, A. J. T. Naik, J. B. M. Goodall, C. Tighe, R. Gruar,R. Binions, I. Parkin and J. Darr, Langmuir, 2013, 29,10603; (b) N. S. Porter, H. Wu, Z. W. Quan and J. Y. Fang,Acc. Chem. Res., 2013, 46, 1867; (c) W. Wichiansee,M. N. Nordin, M. Green and R. J. Curry, J. Mater. Chem.,2011, 21, 7331; (d) E. Wetterskog, C. W. Tai, J. Grins,L. Bergstrom and G. Salazar-Alvarez, ACS Nano, 2013, 7, 7132.
2 (a) S. Rengaraj, S. Venkataraj, C. Tai, Y. H. Kim, E. Repo andM. Sillanp, Langmuir, 2011, 27, 5534; (b) X. Liu, R. Liu,Y. R. Tang, L. C. Zhang, X. D. Hou and Y. Lv, Analyst, 2012,137, 1473.
3 X. Zhang and M. Takeuchi, Angew. Chem., Int. Ed., 2009, 48,1.
4 I. Bilecka and M. Niederberger, Nanoscale, 2010, 2, 1358.5 (a) A. Drott, E. Bjorn, S. Bouchet and U. Skyllberg, Environ.Sci. Technol., 2013, 47, 4197; (b) F. Pietra, R. J. A. van Dijk-Moes, X. X. Ke, S. Bals, G. V. Tendeloo, C. D. M. Donegaand D. Vanmaekelbergh, Chem. Mater., 2013, 25, 3427.
6 N. Goswami, A. Giri, S. Kar, M. S. Bootharaju, R. John,P. L. Xavier, T. Pradeep and S. K. Pal, Small, 2012, 8, 3175.
7 N. Tokyo, J. Appl. Phys., 1975, 46, 4857.8 R. S. Davidson and C. J. Willsher, Nature, 1979, 21, 238.9 (a) H. D. Riccius and K. J. Siemsen, J. Chem. Phys., 1970, 52,4090; (b) A. Ben-Moshe, A. O. Govorov and G. Markovich,Angew. Chem., Int. Ed., 2013, 52, 1275.
10 (a) N. Tokyo and K. Azkio, Jpn. Kokai Pat., 7855478, 1978; (b)M. Perakh and H. Ginsberg, Thin Solid Films, 1978, 52, 195;(c) R. S. Patil, T. P. Gujar, C. D. Lokhande, R. S. Mane andS.-H. Han, Sol. Energy, 2007, 81, 648.
11 K. A. Higginson, M. Kuno, J. Bonevich, S. B. Qadri, M. Yousufand H. Mattoussi, J. Phys. Chem. B, 2002, 106, 9982.
RSC Adv., 2014, 4, 15371–15376 | 15375
RSC Advances Paper
12 (a) Y. D. Li, Y. Ding, H. W. Liao and Y. T. Qian, J. Phys. Chem.Solids, 1999, 60, 965; (b) H. Wang, J. R. Zhang and J. J. Zhu,J. Cryst. Growth, 2001, 233, 829.
13 J. H. Zeng, J. Yang and Y. T. Qian, Mater. Res. Bull., 2001, 36,343.
14 X. J. Zhang, Y. Xie, Q. R. Zhao and Y. P. Tian, New J. Chem.,2003, 27, 827.
15 X. Y. Chen, X. Wang, Z. H. Wang, X. G. Yang and Y. T. Qian,Cryst.Growth Des., 2005, 5, 347.
16 M. W. Shao, L. F. Kong, Q. Li, W. C. Yu and Y. T. Qian, Inorg.Chem. Commun., 2003, 6, 732.
17 H. Wang and J. J. Zhu, Ultrason. Sonochem., 2004, 11, 293.18 T. Ren, S. Xu, W. B. Zhao and J. J. Zhu, J. Photochem.
Photobiol., A, 2005, 173, 93.19 W. M. Du, X. F. Qian, X. S. Niu and Q. Gong, Cryst. Growth
Des., 2007, 7, 2733.
15376 | RSC Adv., 2014, 4, 15371–15376
20 X. C. Duan, X. D. Liu, Q. Chen, H. B. Li, J. Li, X. Hu, Y. Y. Li,J. M. Ma and W. J. Zheng, Dalton Trans., 2011, 40, 1924.
21 S. F. Wang, F. Gu and M. K. Lu, Langmuir, 2006, 22, 398.22 Z. Z. Wu, D. Z. Wang and A. Sun, J. Mater. Sci., 2010, 45, 182.23 K. Letchford and H. Burt, Eur. J. Pharm. Biopharm., 2007, 65,
259.24 X. G. Peng, L. Manna, W. D. Yang, J. Wichham, E. Scher,
A. Kadavanich and A. P. Alivisatos, Nature, 2000, 404, 59.25 S. Tawkaew, Y. Fujishiro, S. Yin and T. Sato, Colloids Surf., A,
2001, 179, 139.26 I. Tsuji, H. Kato and A. Kudo, Chem. Mater., 2006, 18, 1969.27 (a) I. Tsuiji and A. Kudo, J. Photochem. Photobiol., A, 2003,
156, 249; (b) D. W. Hwang, H. G. Kim, J. S. Lee, J. Kim,W. Li and S. H. Oh, J. Phys. Chem. B, 2005, 109, 2093.
28 W. Ho, J. C. Yu, J. Lin, J. Yu and P. Li, Langmuir, 2004, 20,5865.
This journal is © The Royal Society of Chemistry 2014