A Review of Faults and Crustal Structure in the San Francisco Bay Area as Revealed by Seismic...
27
119 Abstract This report summarizes and integrates the results from various seismic experiments conducted in the San Francisco Bay region. Three marine deep seismic-reflection surveys, two local-earthquake tomography studies, and multiple, focused high-resolution seismic-reflection experiments were aimed at resolving the structure of the strike-slip faults in the Pacific-North American Plate boundary zone. The primary conclusion from these studies is that the major strike-slip faults in the bay region cut through the entire crust at high angles (60º–80º). This conclusion implies that horizontal shear in the midcrust or lower crust plays a minimal role in accommodating the right-lateral strain that was proposed in several tectonic models. Among the major faults in the San Francisco Bay region, throughgoing faults identified by marine data are the Kirby Hills Fault in the eastern San Francisco Bay region (dipping ∼80º NE. in the lower crust), the Hayward Fault (dipping ∼70º SW. in the lower crust), and the San Andreas Fault (dipping ∼60º NE. in the lower crust). Strong lateral seismic-velocity contrasts across major right- lateral strike-slip faults are revealed by a three-dimensional tomography model in much of the upper crust to midcrust of the San Francisco Bay region. These cross fault velocity con- trasts affect determinations of earthquake focal mechanisms, hypocenter locations, and simulated strong ground motion because seismic energy can be refracted laterally along such velocity boundaries. Localized tomography on the San Fran- cisco peninsula indicates that the Pilarcitos Fault, paralleling the San Andreas Fault, is high angle and thus probably not an active thrust fault, as has been proposed. Most high-amplitude reflections in the lower crust are now recognized as reflecting from the dipping Hayward and San Andreas Faults. When these dipping reflections are accounted for, the remaining reflective texture of the lower crust is weak and highly discon- tinuous. Introduction Between 1991 and 1998, the U.S. Geological Survey (USGS) operated a project designed to augment earthquake- hazard studies in urban central California by focusing on earthquake sources and ground response at submerged and coastal sites. This report summarizes efforts within this proj- ect to identify and map fault structures by using seismic techniques. When the project was initiated, there was vigor- ous debate whether the major right-lateral faults connected to a low-angle detachment fault below seismogenic depths. Various proposals suggested that this low-angle detachment fault linked strain between the vertical strike-slip faults. Thus, A Review of Faults and Crustal Structure in the San Francisco Bay Area as Revealed by Seismic Studies: 1991–97 By Tom Parsons, Jill McCarthy, Patrick E. Hart, John A. Hole, Jon Childs, David H. Oppenheimer, and Mary Lou Zoback CONTENTS Page Abstract------------------------------------------------------------------------------ 119 Introduction-------------------------------------------------------------------------- 119 Tectonic Setting and Geology of the San Francisco Bay Region-------------- 120 Onland Crustal Seismic Experiments in the San Francisco Bay Region Since 1991--------------------------------------------------------------------- 120 Land Explosive-Source Studies, 1991–93------------------------------------ 120 Land-Array and Explosive-Source Studies in 1995------------------------- 120 Results From Seismic Experiments in the San Francisco Bay Region-------- 122 1991: BASIX–1, the Kirby Hills Fault Zone------------------------------------ 123 Ultra-High-Resolution Images of the Kirby Hills Fault Zone---------- 123 Acoustic Images of the Uppermost 75 m of the Crust Across the Kirby Hills Fault Zone----------------------------------------------- 123 Intermediate-Resolution Images of the Uppermost 2 km of Crust Across the Kirby Hills Fault Zone-------------------------------------- 124 Seismic Images of the Uppermost 6 to 9 km of Crust Across the Kirby Hills Fault Zone----------------------------------------------- 124 Seismicity in the Vicinity of the Kirby Hills Fault Zone----------------- 124 1995: Three-Dimensional Upper-Crustal Velocity Structure in the San Francisco Bay Region-------------------------------------------------- 127 Velocity-Modeling Methods and Data----------------------------------- 128 Regional Three-Dimensional Velocity Structure of the San Francisco Bay Region--------------------------------------------------- 131 Detailed Three-Dimensional Velocity Structure of the San Francisco Peninsula----------------------------------------------- 131 1995–97: Deep Configuration of the San Andreas and Hayward Faults from Crustal Reflections----------------------------------------- 133 Crustal Characteristics from Vertical-Incidence Reflection Data---- 135 High-Amplitude Dipping Reflectors------------------------------------- 135 High-Amplitude Dipping Reflections Recorded on Land-------------- 135 Marine High-Amplitude Dipping Reflections----------------------- 135 Combined Traveltime Observations: Why the Reflections Cannot Come from a Horizontal Detachment Fault---------------- 136 Three-Dimensional Traveltime Modeling of High-Amplitude Reflections------------------------------------------------------------- 140 Integration, Implications, and Conclusions-------------------------------------- 141 Acknowledgments------------------------------------------------------------------ 143 References Cited-------------------------------------------------------------------- 144 A Review of Faults and Crustal Structure in the San Francisco Bay Area
-
Upload
independent -
Category
Documents
-
view
2 -
download
0
Transcript of A Review of Faults and Crustal Structure in the San Francisco Bay Area as Revealed by Seismic...

119
AbstractThis report summarizes and integrates the results from
various seismic experiments conducted in the San Francisco Bay region. Three marine deep seismic-refl ection surveys, two local-earthquake tomography studies, and multiple, focused high-resolution seismic-refl ection experiments were
aimed at resolving the structure of the strike-slip faults in the Pacifi c-North American Plate boundary zone. The primary conclusion from these studies is that the major strike-slip faults in the bay region cut through the entire crust at high angles (60º–80º). This conclusion implies that horizontal shear in the midcrust or lower crust plays a minimal role in accommodating the right-lateral strain that was proposed in several tectonic models. Among the major faults in the San Francisco Bay region, throughgoing faults identifi ed by marine data are the Kirby Hills Fault in the eastern San Francisco Bay region (dipping ∼80º NE. in the lower crust), the Hayward Fault (dipping ∼70º SW. in the lower crust), and the San Andreas Fault (dipping ∼60º NE. in the lower crust). Strong lateral seismic-velocity contrasts across major right-lateral strike-slip faults are revealed by a three-dimensional tomography model in much of the upper crust to midcrust of the San Francisco Bay region. These cross fault velocity con-trasts affect determinations of earthquake focal mechanisms, hypocenter locations, and simulated strong ground motion because seismic energy can be refracted laterally along such velocity boundaries. Localized tomography on the San Fran-cisco peninsula indicates that the Pilarcitos Fault, paralleling the San Andreas Fault, is high angle and thus probably not an active thrust fault, as has been proposed. Most high-amplitude refl ections in the lower crust are now recognized as refl ecting from the dipping Hayward and San Andreas Faults. When these dipping refl ections are accounted for, the remaining refl ective texture of the lower crust is weak and highly discon-tinuous.
IntroductionBetween 1991 and 1998, the U.S. Geological Survey
(USGS) operated a project designed to augment earthquake-hazard studies in urban central California by focusing on earthquake sources and ground response at submerged and coastal sites. This report summarizes efforts within this proj-ect to identify and map fault structures by using seismic techniques. When the project was initiated, there was vigor-ous debate whether the major right-lateral faults connected to a low-angle detachment fault below seismogenic depths. Various proposals suggested that this low-angle detachment fault linked strain between the vertical strike-slip faults. Thus,
A Review of Faults and Crustal Structure in the San Francisco Bay Area as Revealed by Seismic Studies: 1991–97
By Tom Parsons, Jill McCarthy, Patrick E. Hart, John A. Hole, Jon Childs, David H. Oppenheimer, and Mary Lou Zoback
CONTENTS
PageAbstract------------------------------------------------------------------------------ 119Introduction-------------------------------------------------------------------------- 119Tectonic Setting and Geology of the San Francisco Bay Region-------------- 120Onland Crustal Seismic Experiments in the San Francisco Bay Region Since 1991--------------------------------------------------------------------- 120 Land Explosive-Source Studies, 1991–93------------------------------------ 120 Land-Array and Explosive-Source Studies in 1995------------------------- 120Results From Seismic Experiments in the San Francisco Bay Region-------- 122 1991: BASIX–1, the Kirby Hills Fault Zone------------------------------------ 123 Ultra-High-Resolution Images of the Kirby Hills Fault Zone---------- 123 Acoustic Images of the Uppermost 75 m of the Crust Across the Kirby Hills Fault Zone----------------------------------------------- 123 Intermediate-Resolution Images of the Uppermost 2 km of Crust Across the Kirby Hills Fault Zone-------------------------------------- 124 Seismic Images of the Uppermost 6 to 9 km of Crust Across the Kirby Hills Fault Zone----------------------------------------------- 124 Seismicity in the Vicinity of the Kirby Hills Fault Zone----------------- 124 1995: Three-Dimensional Upper-Crustal Velocity Structure in the San Francisco Bay Region-------------------------------------------------- 127 Velocity-Modeling Methods and Data----------------------------------- 128 Regional Three-Dimensional Velocity Structure of the San Francisco Bay Region--------------------------------------------------- 131 Detailed Three-Dimensional Velocity Structure of the San Francisco Peninsula----------------------------------------------- 131 1995–97: Deep Confi guration of the San Andreas and Hayward Faults from Crustal Refl ections----------------------------------------- 133 Crustal Characteristics from Vertical-Incidence Refl ection Data---- 135 High-Amplitude Dipping Refl ectors------------------------------------- 135 High-Amplitude Dipping Refl ections Recorded on Land-------------- 135 Marine High-Amplitude Dipping Refl ections----------------------- 135 Combined Traveltime Observations: Why the Refl ections Cannot Come from a Horizontal Detachment Fault---------------- 136 Three-Dimensional Traveltime Modeling of High-Amplitude Refl ections------------------------------------------------------------- 140Integration, Implications, and Conclusions-------------------------------------- 141Acknowledgments------------------------------------------------------------------ 143References Cited-------------------------------------------------------------------- 144
A Review of Faults and Crustal Structure in the San Francisco Bay Area
120 Crustal Structure of the Coastal and Marine San Francisco Bay Region, California
much of the initial focus of active-source marine seismic-data acquisition was aimed at resolving deep crustal structure. As the project matured, the goals of the USGS moved somewhat away from basic science toward more applied studies, and seismic projects began to be directed at shallow structure and specifi c faults. Here, we summarize and integrate most of the results from active- and passive-source seismic studies in the San Francisco Bay area conducted by, or in association with, the USGS and summarize what was learned about some of the major fault zones and associated crustal structures. Additional studies were conducted on the Golden Gate platform by Bruns and others (this volume), and Hart and others (this volume) discuss all the marine seismic data acquisition in the San Francisco Bay area by the USGS between 1991 and 1998.
Tectonic Setting and Geology of the San Francisco Bay Region
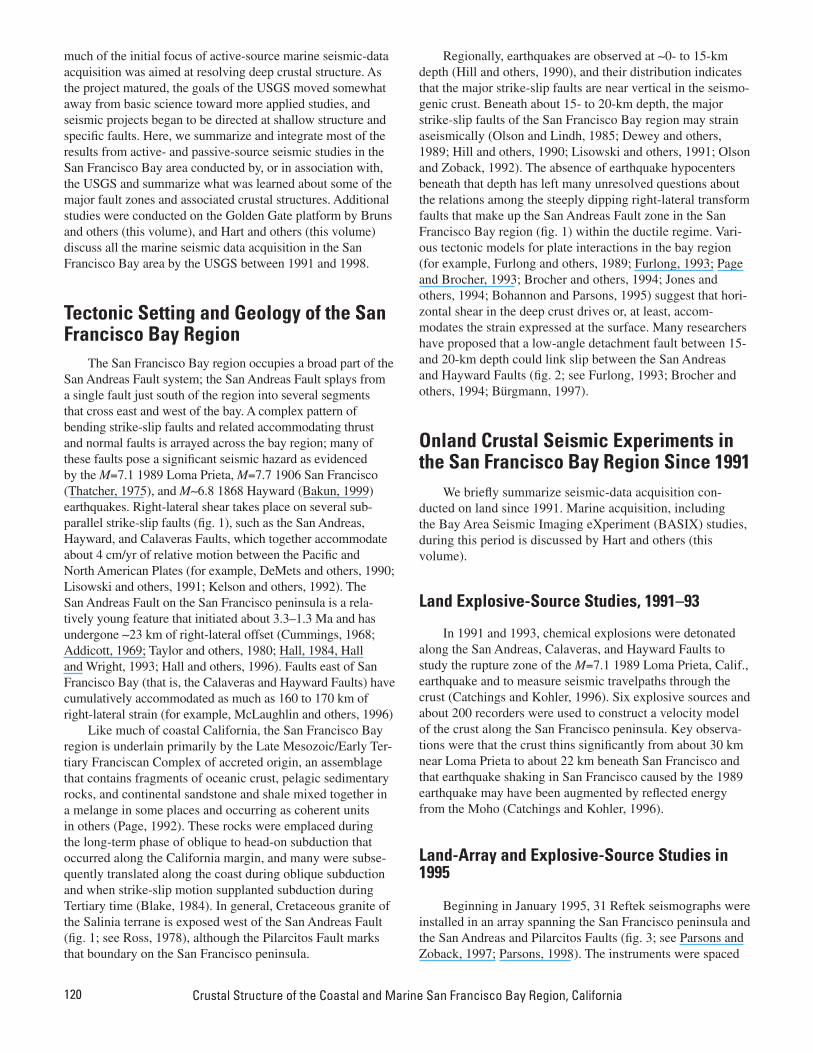
The San Francisco Bay region occupies a broad part of the San Andreas Fault system; the San Andreas Fault splays from a single fault just south of the region into several segments that cross east and west of the bay. A complex pattern of bending strike-slip faults and related accommodating thrust and normal faults is arrayed across the bay region; many of these faults pose a signifi cant seismic hazard as evidenced by the M=7.1 1989 Loma Prieta, M=7.7 1906 San Francisco (Thatcher, 1975), and M∼6.8 1868 Hayward (Bakun, 1999) earthquakes. Right-lateral shear takes place on several sub-parallel strike-slip faults (fi g. 1), such as the San Andreas, Hayward, and Calaveras Faults, which together accommodate about 4 cm/yr of relative motion between the Pacifi c and North American Plates (for example, DeMets and others, 1990; Lisowski and others, 1991; Kelson and others, 1992). The San Andreas Fault on the San Francisco peninsula is a rela-tively young feature that initiated about 3.3–1.3 Ma and has undergone ∼23 km of right-lateral offset (Cummings, 1968; Addicott, 1969; Taylor and others, 1980; Hall, 1984, Hall and Wright, 1993; Hall and others, 1996). Faults east of San Francisco Bay (that is, the Calaveras and Hayward Faults) have cumulatively accommodated as much as 160 to 170 km of right-lateral strain (for example, McLaughlin and others, 1996)
Like much of coastal California, the San Francisco Bay region is underlain primarily by the Late Mesozoic/Early Ter-tiary Franciscan Complex of accreted origin, an assemblage that contains fragments of oceanic crust, pelagic sedimentary rocks, and continental sandstone and shale mixed together in a melange in some places and occurring as coherent units in others (Page, 1992). These rocks were emplaced during the long-term phase of oblique to head-on subduction that occurred along the California margin, and many were subse-quently translated along the coast during oblique subduction and when strike-slip motion supplanted subduction during Tertiary time (Blake, 1984). In general, Cretaceous granite of the Salinia terrane is exposed west of the San Andreas Fault (fi g. 1; see Ross, 1978), although the Pilarcitos Fault marks that boundary on the San Francisco peninsula.
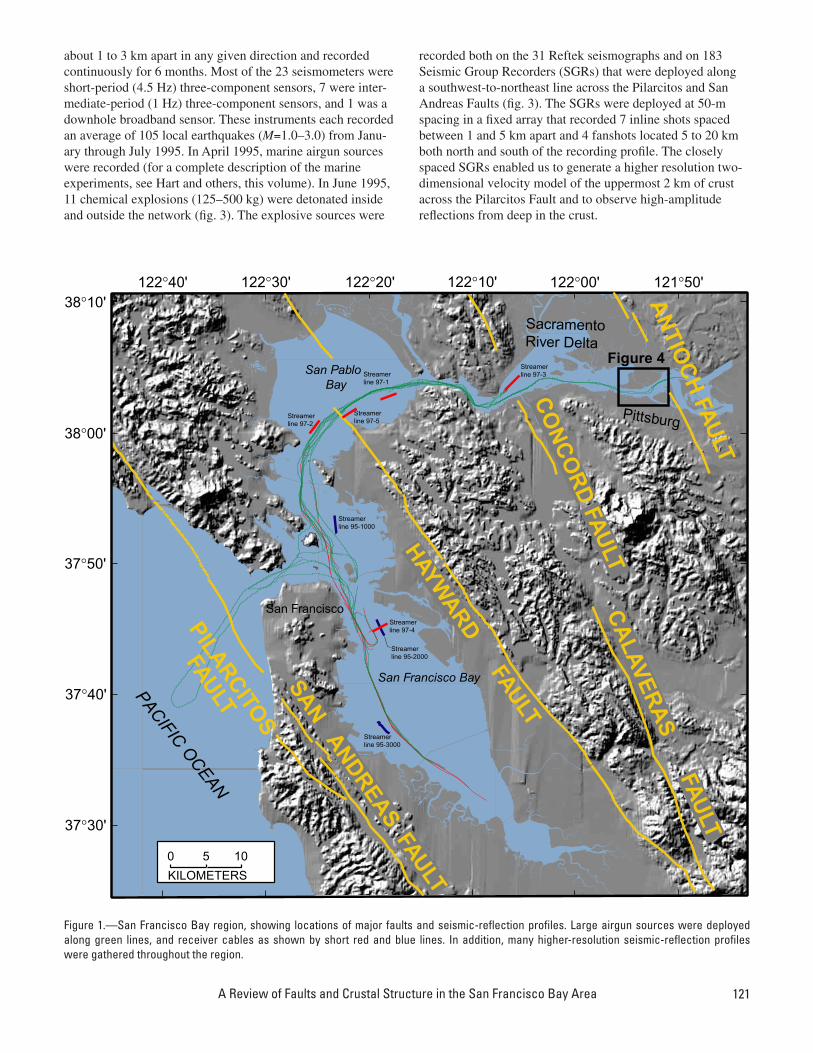
Regionally, earthquakes are observed at ∼0- to 15-km depth (Hill and others, 1990), and their distribution indicates that the major strike-slip faults are near vertical in the seismo-genic crust. Beneath about 15- to 20-km depth, the major strike-slip faults of the San Francisco Bay region may strain aseismically (Olson and Lindh, 1985; Dewey and others, 1989; Hill and others, 1990; Lisowski and others, 1991; Olson and Zoback, 1992). The absence of earthquake hypocenters beneath that depth has left many unresolved questions about the relations among the steeply dipping right-lateral transform faults that make up the San Andreas Fault zone in the San Francisco Bay region (fi g. 1) within the ductile regime. Vari-ous tectonic models for plate interactions in the bay region (for example, Furlong and others, 1989; Furlong, 1993; Page and Brocher, 1993; Brocher and others, 1994; Jones and others, 1994; Bohannon and Parsons, 1995) suggest that hori-zontal shear in the deep crust drives or, at least, accom-modates the strain expressed at the surface. Many researchers have proposed that a low-angle detachment fault between 15- and 20-km depth could link slip between the San Andreas and Hayward Faults (fi g. 2; see Furlong, 1993; Brocher and others, 1994; Bürgmann, 1997).
Onland Crustal Seismic Experiments in the San Francisco Bay Region Since 1991
We briefl y summarize seismic-data acquisition con-ducted on land since 1991. Marine acquisition, including the Bay Area Seismic Imaging eXperiment (BASIX) studies, during this period is discussed by Hart and others (this volume).
Land Explosive-Source Studies, 1991–93
In 1991 and 1993, chemical explosions were detonated along the San Andreas, Calaveras, and Hayward Faults to study the rupture zone of the M=7.1 1989 Loma Prieta, Calif., earthquake and to measure seismic travelpaths through the crust (Catchings and Kohler, 1996). Six explosive sources and about 200 recorders were used to construct a velocity model of the crust along the San Francisco peninsula. Key observa-tions were that the crust thins signifi cantly from about 30 km near Loma Prieta to about 22 km beneath San Francisco and that earthquake shaking in San Francisco caused by the 1989 earthquake may have been augmented by refl ected energy from the Moho (Catchings and Kohler, 1996).
Land-Array and Explosive-Source Studies in 1995
Beginning in January 1995, 31 Reftek seismographs were installed in an array spanning the San Francisco peninsula and the San Andreas and Pilarcitos Faults (fi g. 3; see Parsons and Zoback, 1997; Parsons, 1998). The instruments were spaced
121
Streamerline 95-1000
Streamerline 95-3000
Streamerline 95-2000
Streamerline 97-4
Streamerline 97-2
Streamerline 97-5
Streamerline 97-1
Streamerline 97-3
121°50'122°00'122°10'122°20'122°30'122°40'38°10'
38°00'
37°50'
37°40'
37°30'
PILARCITOS
FAULT
AN
TIOC
HFA
ULT
0 5 10
KILOMETERS
San Francisco
Pittsburg
SacramentoRiver Delta
San Francisco Bay
San PabloBay
Figure 4
SANANDREAS
FAULTHAYW
ARDFAULT
CO
NC
OR
DFA
ULT
CA
LAVE
RA
SFA
ULT
PACIFICO
CEAN
about 1 to 3 km apart in any given direction and recorded continuously for 6 months. Most of the 23 seismometers were short-period (4.5 Hz) three-component sensors, 7 were inter-mediate-period (1 Hz) three-component sensors, and 1 was a downhole broadband sensor. These instruments each recorded an average of 105 local earthquakes (M=1.0–3.0) from Janu-ary through July 1995. In April 1995, marine airgun sources were recorded (for a complete description of the marine experiments, see Hart and others, this volume). In June 1995, 11 chemical explosions (125–500 kg) were detonated inside and outside the network (fi g. 3). The explosive sources were
recorded both on the 31 Reftek seismographs and on 183 Seismic Group Recorders (SGRs) that were deployed along a southwest-to-northeast line across the Pilarcitos and San Andreas Faults (fi g. 3). The SGRs were deployed at 50-m spacing in a fi xed array that recorded 7 inline shots spaced between 1 and 5 km apart and 4 fanshots located 5 to 20 km both north and south of the recording profi le. The closely spaced SGRs enabled us to generate a higher resolution two-dimensional velocity model of the uppermost 2 km of crust across the Pilarcitos Fault and to observe high-amplitude refl ections from deep in the crust.
Figure 1.—San Francisco Bay region, showing locations of major faults and seismic-refl ection profi les. Large airgun sources were deployed along green lines, and receiver cables as shown by short red and blue lines. In addition, many higher-resolution seismic-refl ection profi les were gathered throughout the region.
A Review of Faults and Crustal Structure in the San Francisco Bay Area
122 Crustal Structure of the Coastal and Marine San Francisco Bay Region, California
A
Oceanic crust
Franciscan Great Valleybasement
Moho
400
30
20
10
0West
SAN ANDREAS FAULT
HAYWARD FAULT
Conspicuousreflector
DE
PT
HIN
KIL
OM
ET
ER
SD
EP
TH
INK
ILO
ME
TE
RS
Complex
20
?
?
East
60
CALAVERAS FAULT
DISTANCE IN KILOMETERS
DISTANCE IN KILOMETERS
Detachment
Great Valleybasement
B
Moho
40030
20
10
0West
SAN ANDREAS FAULT
HAYWARD FAULT
20
?
?
East
60
CALAVERAS FAULT
Figure 2.—Block diagrams of the San Francisco Bay region (fi g. 1), illustrating two candidate models for deep confi gura-tion of bay-region faults. Either faults (A) persist to midcrustal depths where, at base of seismicity, they terminate into a low-angle or detachment fault (for example Furlong and others, 1989; Furlong, 1993; Page and Brocher, 1993; Brocher and others, 1994; Jones and others, 1994); or (B) they cut through whole crust.
Results from Seismic Experiments in the San Francisco Bay Region
Here, we summarize our enhanced view into the crust of the San Francisco Bay region as provided by several imag-ing techniques. We present previously unpublished studies and expanded discussion, integration, and support of some
published results. Much of the investigation and imaging was concentrated on active faults, either on their structure in the seismogenic zone (∼3–15-km depth) or on their relations and connectivity in the lower crust beneath seismogenic depths. Some higher-resolution, shallower data were acquired for previously unknown or poorly known faults. We present the studies and principal results in chronological order, followed by a discussion and integration of the results.

123
1991: BASIX–1, the Kirby Hills Fault Zone
Marine seismic-refl ection data acquisition in San Fran-cisco Bay poses severe challenges because of the shallow water depth, strong currents, and heavy shipping traffi c. Not all of these problems were overcome during the fi rst experi-ment in 1991, and data quality was poor in many places. However, east of San Francisco Bay in the Sacramento River delta (fi g. 1), good-quality data were acquired and processed that confi rmed the existence of the Kirby Hills Fault zone, which, along with the Antioch Fault, represents the eastern-most segment of the San Andreas Fault system at the latitude of the Sacramento River. This feature is a reactivated struc-
Air-G
unTrack
San Francisco
Oakland
SFO
SANANDREAS
FAULT
PILARCITOSFAULT
13
PACIFIC OCEAN
SanFrancisco
Bay
Figure 3.—Sketch map of the San Francisco Bay region (fig. 1), showing location of land-based San Francisco peninsula seismic experiment. Dots and triangles, stations in temporary (6 month) seismic network; circles, permanent stations in the Northern California Seismic Network (Calnet). Dashed line in San Francisco Bay denotes approximate trackline for airgun shots recorded by Calnet (see fi g. 1). Squares, chemical-explosive shotpoints (box labeled “13” is gather shown in fi g. 13); dashed line on peninsula, high-resolution refraction and deep refl ection profi le.
ture that began its history as a normal fault during the Eocene (Krug and others, 1992; McKevett, 1992). Presently, the Kirby Hills Fault zone is a strike-slip fault dipping 80º–85º E. The fault is seismically active and is characterized by some of the deepest earthquakes recorded south of the Mendocino triple junction in northern California (Hill and others, 1990).
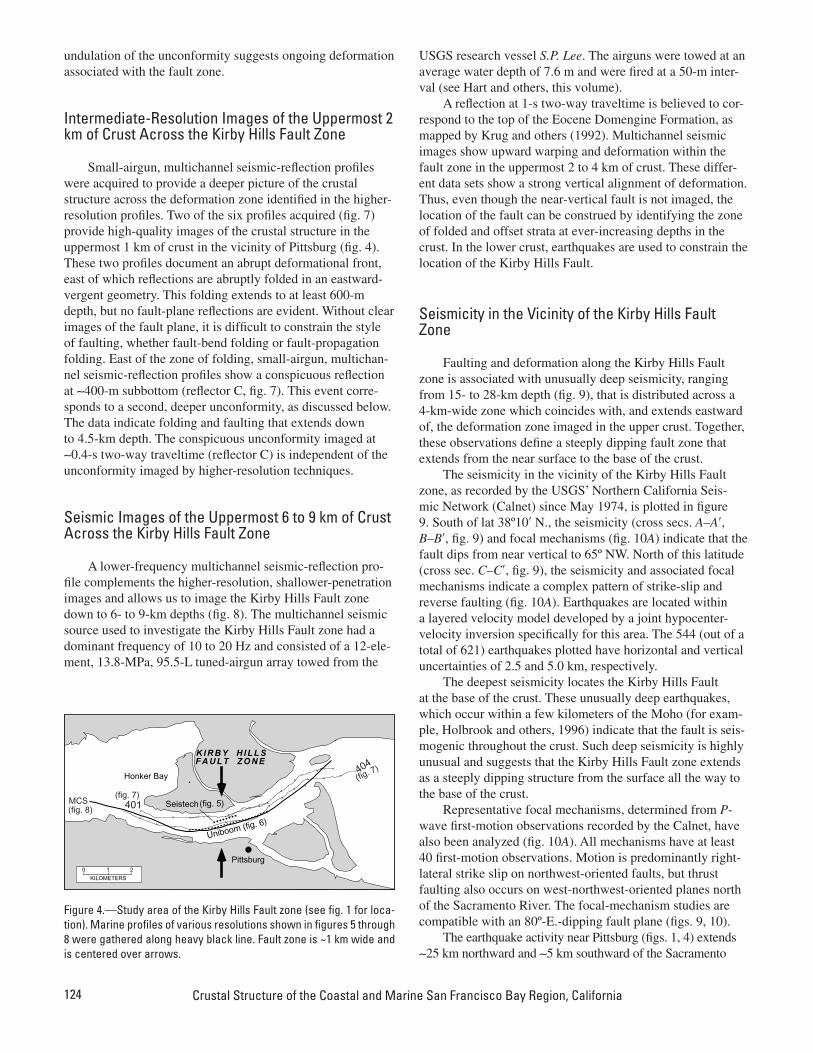
Various acoustic tools have been used to image the sub-surface geometry of faults at different depths in the Earth’s crust. A tradeoff exists between subsurface resolution and depth of source penetration, with lower-resolution but more powerful sources reaching deeper into the crust. When shallow and intermediate-depth acoustic images are combined with the information derived from deep earthquake activity, the position of the Kirby Hills Fault can be mapped down to the base of the crust. Such control is rare and provides important con-straints on the physical properties and structural architecture of the midcrust and lower crust underlying the California Coast Ranges. Here, we present acoustic images that collectively defi ne the subsurface geometry of the Kirby Hills Fault zone near Pittsburg (fi gs. 1, 4) and document that this structure cuts the entire crust down to at least 28-km depth.
Ultra-High-Resolution Images of the Kirby Hills Fault Zone
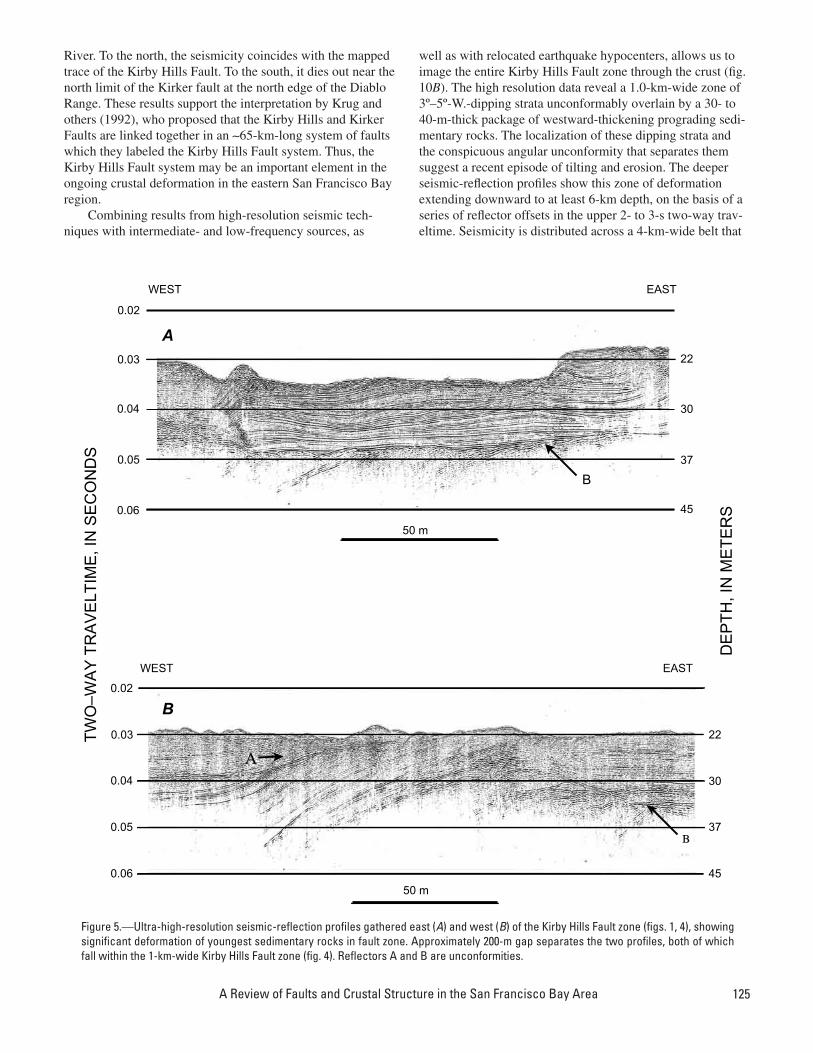
The ultra-high-resolution data provide images of deformed and folded sedimentary rocks in the uppermost 30 m of crust. Two windows from a single ultra-high-resolu-tion profi le within the 1-km-wide Kirby Hills fault zone are shown in fi gure 5. The eastern ultra-high-resolution profi le (fi g. 5A) reveals a conspicuous unconformity (refl ector B) in the shallow near-surface, approximately 15 m subbottom. Beneath this unconformity, strata dip approximately 5º–10º W., whereas above the discontinuity, channel-fi ll deposits are nearly fl at lying.
To the west (fi g. 5B), the unconformity is broadly warped and uplifted. The antiform breaches the surface near the confl u-ence of the Sacramento and San Joaquin Rivers, just opposite the town of Pittsburg (fi gs. 1, 4). Deformation of the river fl oor confi rms that the Kirby Hills Fault zone is an active feature.
Acoustic Images of the Uppermost 75 m of the Crust Across the Kirby Hills Fault Zone
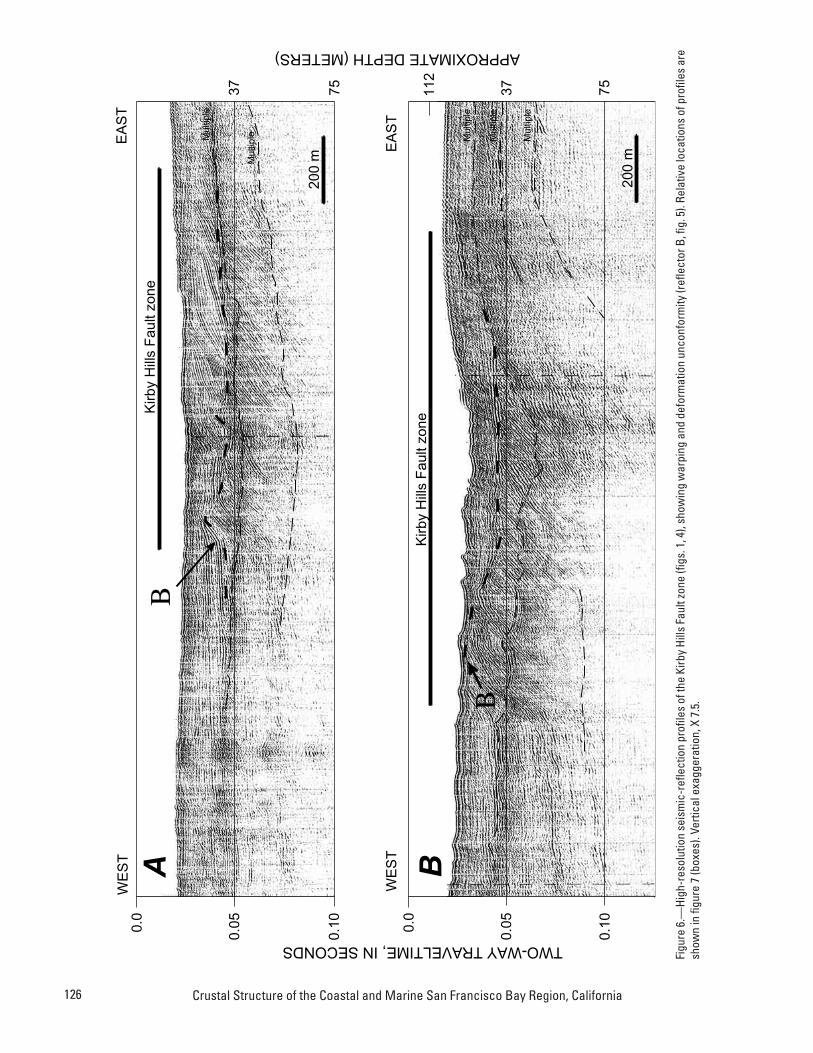
In the vicinity of the Kirby Hills Fault zone, a high-resolution source provides vivid images of the uppermost 75 m of crust. Two representative profi les are shown in fi gure 6, each of which displays the same three principal features identifi ed on the ultra-high-resolution profi les: (1) an upper series of fl at-lying to gently dipping sedimentary strata, (2) a conspicuous angular unconformity, and (3) a deeper series of 5º–10º-W.-dipping strata that terminates abruptly at the unconformity. On the high-resolution profi les, the upper sedi-mentary strata display a slight westward dip and onlap the underlying angular unconformity. The unconformity itself is warped and folded and occurs at 5- to 35-m depth. The
A Review of Faults and Crustal Structure in the San Francisco Bay Area
124 Crustal Structure of the Coastal and Marine San Francisco Bay Region, California
undulation of the unconformity suggests ongoing deformation associated with the fault zone.
Intermediate-Resolution Images of the Uppermost 2 km of Crust Across the Kirby Hills Fault Zone
Small-airgun, multichannel seismic-refl ection profi les were acquired to provide a deeper picture of the crustal structure across the deformation zone identifi ed in the higher-resolution profi les. Two of the six profi les acquired (fi g. 7) provide high-quality images of the crustal structure in the uppermost 1 km of crust in the vicinity of Pittsburg (fi g. 4). These two profi les document an abrupt deformational front, east of which refl ections are abruptly folded in an eastward-vergent geometry. This folding extends to at least 600-m depth, but no fault-plane refl ections are evident. Without clear images of the fault plane, it is diffi cult to constrain the style of faulting, whether fault-bend folding or fault-propagation folding. East of the zone of folding, small-airgun, multichan-nel seismic-refl ection profi les show a conspicuous refl ection at ∼400-m subbottom (refl ector C, fi g. 7). This event corre-sponds to a second, deeper unconformity, as discussed below. The data indicate folding and faulting that extends down to 4.5-km depth. The conspicuous unconformity imaged at ∼0.4-s two-way traveltime (refl ector C) is independent of the unconformity imaged by higher-resolution techniques.
Seismic Images of the Uppermost 6 to 9 km of Crust Across the Kirby Hills Fault Zone
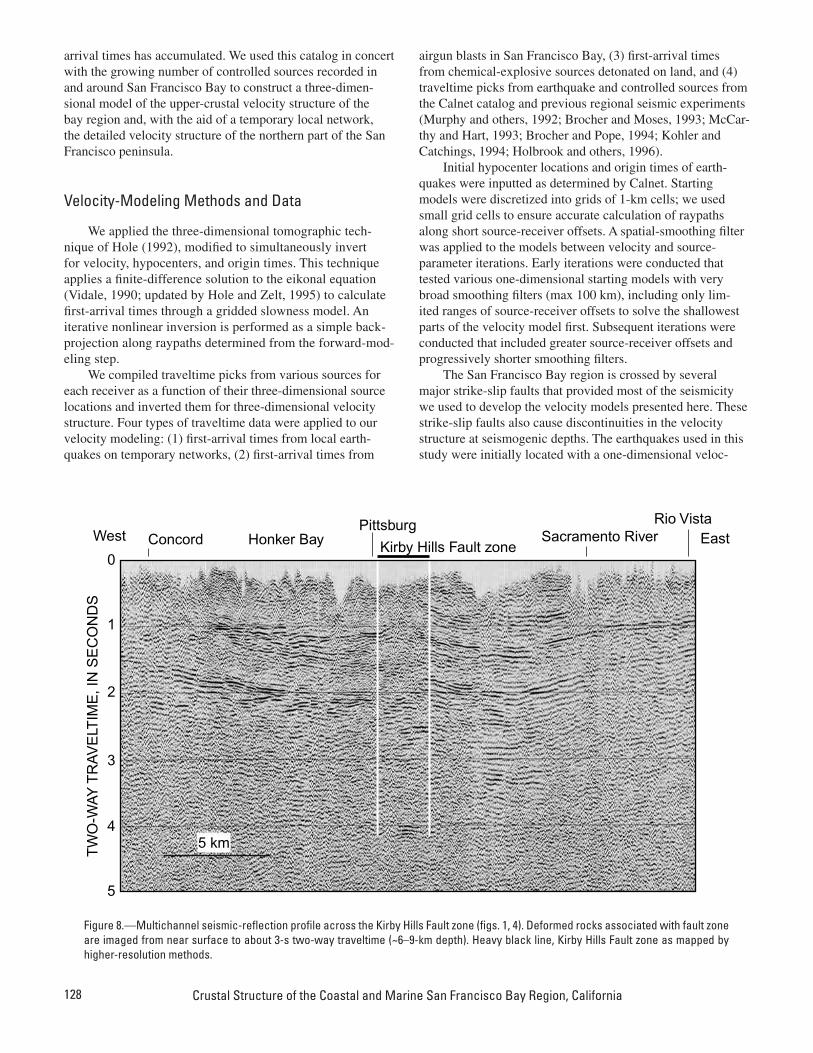
A lower-frequency multichannel seismic-refl ection pro-fi le complements the higher-resolution, shallower-penetration images and allows us to image the Kirby Hills Fault zone down to 6- to 9-km depths (fi g. 8). The multichannel seismic source used to investigate the Kirby Hills Fault zone had a dominant frequency of 10 to 20 Hz and consisted of a 12-ele-ment, 13.8-MPa, 95.5-L tuned-airgun array towed from the
USGS research vessel S.P. Lee. The airguns were towed at an average water depth of 7.6 m and were fi red at a 50-m inter-val (see Hart and others, this volume).
A refl ection at 1-s two-way traveltime is believed to cor-respond to the top of the Eocene Domengine Formation, as mapped by Krug and others (1992). Multichannel seismic images show upward warping and deformation within the fault zone in the uppermost 2 to 4 km of crust. These differ-ent data sets show a strong vertical alignment of deformation. Thus, even though the near-vertical fault is not imaged, the location of the fault can be construed by identifying the zone of folded and offset strata at ever-increasing depths in the crust. In the lower crust, earthquakes are used to constrain the location of the Kirby Hills Fault.
Seismicity in the Vicinity of the Kirby Hills Fault Zone
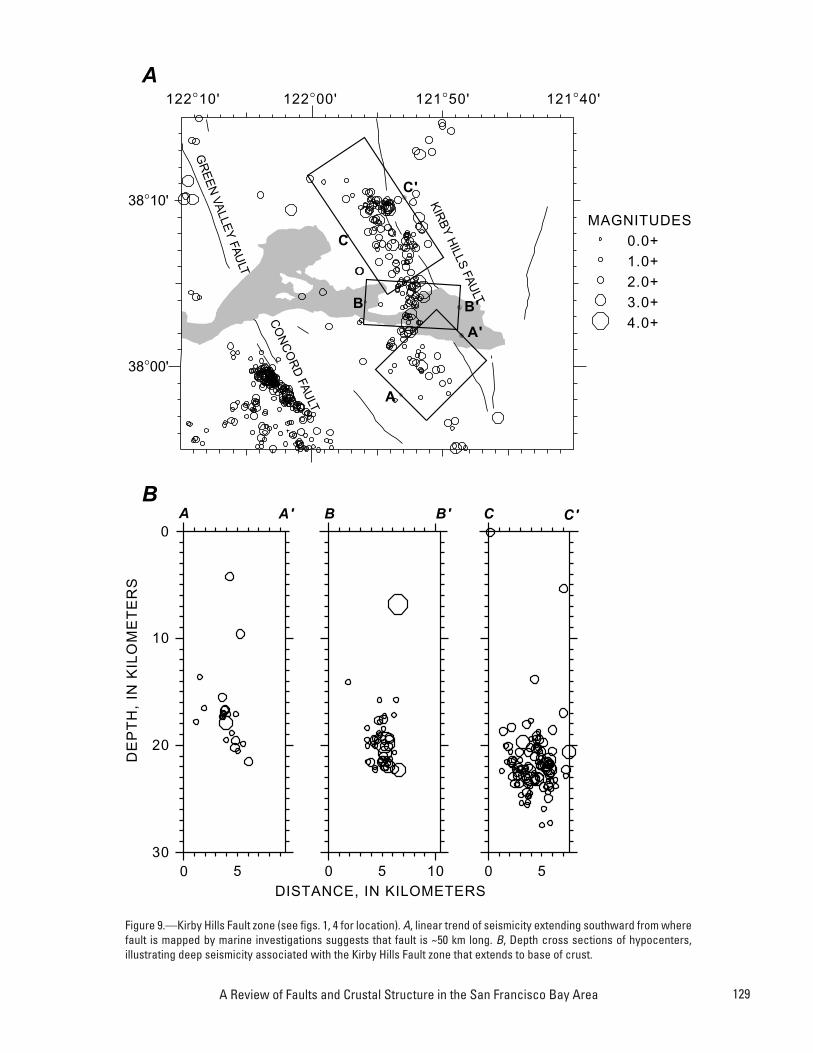
Faulting and deformation along the Kirby Hills Fault zone is associated with unusually deep seismicity, ranging from 15- to 28-km depth (fi g. 9), that is distributed across a 4-km-wide zone which coincides with, and extends eastward of, the deformation zone imaged in the upper crust. Together, these observations defi ne a steeply dipping fault zone that extends from the near surface to the base of the crust.
The seismicity in the vicinity of the Kirby Hills Fault zone, as recorded by the USGS’ Northern California Seis-mic Network (Calnet) since May 1974, is plotted in fi gure 9. South of lat 38º10′ N., the seismicity (cross secs. A–A′, B–B′, fi g. 9) and focal mechanisms (fi g. 10A) indicate that the fault dips from near vertical to 65º NW. North of this latitude (cross sec. C–C′, fi g. 9), the seismicity and associated focal mechanisms indicate a complex pattern of strike-slip and reverse faulting (fi g. 10A). Earthquakes are located within a layered velocity model developed by a joint hypocenter-velocity inversion specifi cally for this area. The 544 (out of a total of 621) earthquakes plotted have horizontal and vertical uncertainties of 2.5 and 5.0 km, respectively.
The deepest seismicity locates the Kirby Hills Fault at the base of the crust. These unusually deep earthquakes, which occur within a few kilometers of the Moho (for exam-ple, Holbrook and others, 1996) indicate that the fault is seis-mogenic throughout the crust. Such deep seismicity is highly unusual and suggests that the Kirby Hills Fault zone extends as a steeply dipping structure from the surface all the way to the base of the crust.
Representative focal mechanisms, determined from P-wave fi rst-motion observations recorded by the Calnet, have also been analyzed (fi g. 10A). All mechanisms have at least 40 fi rst-motion observations. Motion is predominantly right-lateral strike slip on northwest-oriented faults, but thrust faulting also occurs on west-northwest-oriented planes north of the Sacramento River. The focal-mechanism studies are compatible with an 80º-E.-dipping fault plane (fi gs. 9, 10).
The earthquake activity near Pittsburg (fi gs. 1, 4) extends ∼25 km northward and ∼5 km southward of the Sacramento
Honker Bay
401
404K I R B Y H I L L SF A U L T Z O N E
MCS
Uniboom (fig. 6)(fig. 8)
(fig. 7)
(fig. 7)(fig. 5)Seistech
0 1 2
KILOMETERS
Pittsburg
Figure 4.—Study area of the Kirby Hills Fault zone (see fi g. 1 for loca-tion). Marine profi les of various resolutions shown in fi gures 5 through 8 were gathered along heavy black line. Fault zone is ~1 km wide and is centered over arrows.
125
River. To the north, the seismicity coincides with the mapped trace of the Kirby Hills Fault. To the south, it dies out near the north limit of the Kirker fault at the north edge of the Diablo Range. These results support the interpretation by Krug and others (1992), who proposed that the Kirby Hills and Kirker Faults are linked together in an ∼65-km-long system of faults which they labeled the Kirby Hills Fault system. Thus, the Kirby Hills Fault system may be an important element in the ongoing crustal deformation in the eastern San Francisco Bay region.
Combining results from high-resolution seismic tech-niques with intermediate- and low-frequency sources, as
well as with relocated earthquake hypocenters, allows us to image the entire Kirby Hills Fault zone through the crust (fi g. 10B). The high resolution data reveal a 1.0-km-wide zone of 3º–5º-W.-dipping strata unconformably overlain by a 30- to 40-m-thick package of westward-thickening prograding sedi-mentary rocks. The localization of these dipping strata and the conspicuous angular unconformity that separates them suggest a recent episode of tilting and erosion. The deeper seismic-refl ection profi les show this zone of deformation extending downward to at least 6-km depth, on the basis of a series of refl ector offsets in the upper 2- to 3-s two-way trav-eltime. Seismicity is distributed across a 4-km-wide belt that
EASTWEST
50 m
B
0.06
0.05
0.04
0.03
0.02
22
30
37
45
0.06
WEST EAST
0.05
0.04
0.03
0.02
50 m
B
22
30
37
45
A
A
BD
EP
TH
,IN
ME
TE
RS
TW
O–W
AY
TR
AV
ELT
IME
,IN
SE
CO
ND
S
Figure 5.—Ultra-high-resolution seismic-refl ection profi les gathered east (A) and west (B) of the Kirby Hills Fault zone (fi gs. 1, 4), showing signifi cant deformation of youngest sedimentary rocks in fault zone. Approximately 200-m gap separates the two profi les, both of which fall within the 1-km-wide Kirby Hills Fault zone (fi g. 4). Refl ectors A and B are unconformities.
A Review of Faults and Crustal Structure in the San Francisco Bay Area
112
0.0
0.05
0.10 0.15
WE
ST
EA
ST
200
m
0.0
0.05
0.10
WE
ST
EA
ST
200
m
TWO-WAYTRAVELTIME,INSECONDS
37 75 112
37 75
APPROXIMATEDEPTH(METERS)
Mul
tiple
Mul
tiple Mul
tiple
Mul
tiple
Mul
tiple
B
Kirb
yH
ills
Fau
ltzo
ne
Kirb
yH
ills
Fau
ltzo
ne
BA B
126 Crustal Structure of the Coastal and Marine San Francisco Bay Region, California
Figu
re 6
.—Hi
gh-r
esol
utio
n se
ism
ic-r
efl e
ctio
n pr
ofi le
s of
the
Kirb
y Hi
lls F
ault
zone
(fi g
s. 1
, 4),
show
ing
war
ping
and
def
orm
atio
n un
conf
orm
ity (r
efl e
ctor
B, fi
g. 5
). Re
lativ
e lo
catio
ns o
f pro
fi les
are
sh
own
in fi
gure
7 (b
oxes
). Ve
rtica
l exa
gger
atio
n, X
7.5
.

127
coincides with, and extends eastward of, the deformation zone imaged in the upper crust. Together, these observations defi ne a near vertical or steeply (>75º–90º) east-dipping fault zone that extends from the near surface down almost to the base of the crust. Focal mechanisms indicate predominantly strike-slip faulting.
1995: Three-Dimensional Upper-Crustal Veloc-ity Structure in the San Francisco Bay Region
A three-dimensional seismic-velocity model of the San Francisco Bay region provides useful information for seis-
mic hazard analysis: (1) a detailed three-dimensional model is needed to better predict strong ground motion during an earthquake because the travelpaths of seismic waves are governed by the velocity structure; (2) a three-dimensional velocity model allows proper analysis of crustal fault-plane refl ections, (3) earthquake hypocenters can be better located, and focal mechanisms can be more accurately determined; and (4) subsurface fault zones can be mapped where insuffi -cient microseismicity exists to identify them directly. We thus conducted inversions for the regional velocity structure, using earthquake and controlled seismic sources. Calnet has been recording earthquakes in the San Francisco Bay region since the 1960s. Over time, a vast catalog of quality earthquake
C
0.0
0.5
1.0
0.0
0.5
1.0
WEST EAST
1 km
A
Kirby Hills Fault zone
C
0.0
0.5
1.0
0.0
0.5
1.0
EASTWEST
1 km
A
Kirby Hills Fault zone
TW
O-W
AY
TR
AV
ELT
IME
,IN
SE
CO
ND
S
DE
PT
H,I
NK
ILO
ME
TE
RS
Figure 7.—Intermediate-resolution seismic-refl ection profi les across the Kirby Hills Fault zone (fi gs. 1, 4), documenting an abrupt deformational front, east of which refl ections are abruptly folded in an eastward-vergent geometry. Although this folding extends to at least 600-m depth, no fault-plane refl ections are evident. Without clear images of fault plane, it is diffi cult to constrain style of faulting, whether fault-bend folding or fault-propagation folding. Boxes show locations of high-resolution profi les in fi gure 6.
A Review of Faults and Crustal Structure in the San Francisco Bay Area
128 Crustal Structure of the Coastal and Marine San Francisco Bay Region, California
arrival times has accumulated. We used this catalog in concert with the growing number of controlled sources recorded in and around San Francisco Bay to construct a three-dimen-sional model of the upper-crustal velocity structure of the bay region and, with the aid of a temporary local network, the detailed velocity structure of the northern part of the San Francisco peninsula.
Velocity-Modeling Methods and Data
We applied the three-dimensional tomographic tech-nique of Hole (1992), modifi ed to simultaneously invert for velocity, hypocenters, and origin times. This technique applies a fi nite-difference solution to the eikonal equation (Vidale, 1990; updated by Hole and Zelt, 1995) to calculate fi rst-arrival times through a gridded slowness model. An iterative nonlinear inversion is performed as a simple back-projection along raypaths determined from the forward-mod-eling step.
We compiled traveltime picks from various sources for each receiver as a function of their three-dimensional source locations and inverted them for three-dimensional velocity structure. Four types of traveltime data were applied to our velocity modeling: (1) fi rst-arrival times from local earth-quakes on temporary networks, (2) fi rst-arrival times from
airgun blasts in San Francisco Bay, (3) fi rst-arrival times from chemical-explosive sources detonated on land, and (4) traveltime picks from earthquake and controlled sources from the Calnet catalog and previous regional seismic experiments (Murphy and others, 1992; Brocher and Moses, 1993; McCar-thy and Hart, 1993; Brocher and Pope, 1994; Kohler and Catchings, 1994; Holbrook and others, 1996).
Initial hypocenter locations and origin times of earth-quakes were inputted as determined by Calnet. Starting models were discretized into grids of 1-km cells; we used small grid cells to ensure accurate calculation of raypaths along short source-receiver offsets. A spatial-smoothing fi lter was applied to the models between velocity and source-parameter iterations. Early iterations were conducted that tested various one-dimensional starting models with very broad smoothing fi lters (max 100 km), including only lim-ited ranges of source-receiver offsets to solve the shallowest parts of the velocity model fi rst. Subsequent iterations were conducted that included greater source-receiver offsets and progressively shorter smoothing fi lters.
The San Francisco Bay region is crossed by several major strike-slip faults that provided most of the seismicity we used to develop the velocity models presented here. These strike-slip faults also cause discontinuities in the velocity structure at seismogenic depths. The earthquakes used in this study were initially located with a one-dimensional veloc-
Figure 8.—Multichannel seismic-refl ection profi le across the Kirby Hills Fault zone (fi gs. 1, 4). Deformed rocks associated with fault zone are imaged from near surface to about 3-s two-way traveltime (~6–9-km depth). Heavy black line, Kirby Hills Fault zone as mapped by higher-resolution methods.
5 km
Kirby Hills Fault zoneSacramento River
Rio Vista
1
0
2
3
4
5
TW
O-W
AYT
RA
VE
LTIM
E,I
NS
EC
ON
DS
West Concord Honker Bay EastPittsburg
129
MAGNITUDES0.0+1.0+2.0+3.0+4.0+
38°10'
38°00'
B B'
C
C'
A
A'
GR
EE
NVA
LLEY
FAULT
CO
NC
OR
DFAU
LT
KIR
BY
HILLS
FAULT
A
B
DE
PT
H,
INK
ILO
ME
TE
RS
030
20
10
0A A'
DISTANCE, IN KILOMETERS0 10
B B'
0
C C'
5 55
122°10' 122°00' 121°50' 121°40'
Figure 9.—Kirby Hills Fault zone (see fi gs. 1, 4 for location). A, linear trend of seismicity extending southward from where fault is mapped by marine investigations suggests that fault is ~50 km long. B, Depth cross sections of hypocenters, illustrating deep seismicity associated with the Kirby Hills Fault zone that extends to base of crust.
A Review of Faults and Crustal Structure in the San Francisco Bay Area

130 Crustal Structure of the Coastal and Marine San Francisco Bay Region, California
38°00'
38°05'
38°10'
122°00' 121°50'
A
B
0
15
20
25
30
10
5
Great Valley
Sierranbasement?
??
??
5 km
Moho
Multichannel
Highresolution
DE
PT
H, I
N K
ILO
ME
TE
RS
Figure 10.—Kirby Hills Fault zone (see fi gs. 1, 4 for location). A, Focal mechanisms of seismicity associated with zone. All mechanisms have at least 40 fi rst-motion observations. Motion is pre-dominantly right-lateral strike-slip on northwest-oriented faults, but thrust faulting also occurs on west-northwest-oriented planes north of the Sacramento River. B, Schematic interpretation of the Kirby Hills Fault zone based on various data constraints.
131
ity model; thus, a degree of coupling between hypocenter location and the velocity structure derived from earthquake traveltimes is unavoidable and could cause signifi cant errors in the resolved velocity models (Thurber, 1993). To reduce such errors, hypocenters and origin times were relocated with controlled source locations and times held fi xed. The events were relocated between velocity iterations (mean relocation, 0.54 km; see Hole, 1992, and Hole and others, 2000, for full details on the traveltime-inversion algorithm).
Regional Three-Dimensional Velocity Structure of the San Francisco Bay Region
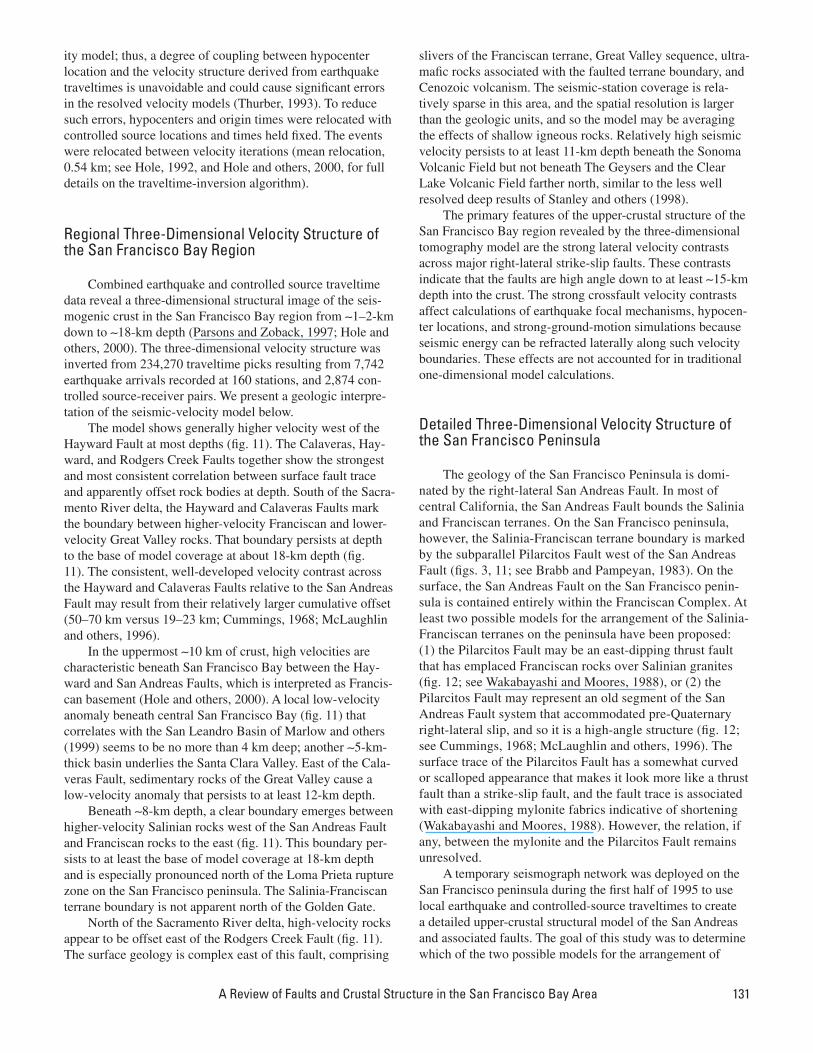
Combined earthquake and controlled source traveltime data reveal a three-dimensional structural image of the seis-mogenic crust in the San Francisco Bay region from ∼1–2-km down to ∼18-km depth (Parsons and Zoback, 1997; Hole and others, 2000). The three-dimensional velocity structure was inverted from 234,270 traveltime picks resulting from 7,742 earthquake arrivals recorded at 160 stations, and 2,874 con-trolled source-receiver pairs. We present a geologic interpre-tation of the seismic-velocity model below.
The model shows generally higher velocity west of the Hayward Fault at most depths (fi g. 11). The Calaveras, Hay-ward, and Rodgers Creek Faults together show the strongest and most consistent correlation between surface fault trace and apparently offset rock bodies at depth. South of the Sacra-mento River delta, the Hayward and Calaveras Faults mark the boundary between higher-velocity Franciscan and lower-velocity Great Valley rocks. That boundary persists at depth to the base of model coverage at about 18-km depth (fi g. 11). The consistent, well-developed velocity contrast across the Hayward and Calaveras Faults relative to the San Andreas Fault may result from their relatively larger cumulative offset (50–70 km versus 19–23 km; Cummings, 1968; McLaughlin and others, 1996).
In the uppermost ∼10 km of crust, high velocities are characteristic beneath San Francisco Bay between the Hay-ward and San Andreas Faults, which is interpreted as Francis-can basement (Hole and others, 2000). A local low-velocity anomaly beneath central San Francisco Bay (fi g. 11) that correlates with the San Leandro Basin of Marlow and others (1999) seems to be no more than 4 km deep; another ∼5-km-thick basin underlies the Santa Clara Valley. East of the Cala-veras Fault, sedimentary rocks of the Great Valley cause a low-velocity anomaly that persists to at least 12-km depth.
Beneath ∼8-km depth, a clear boundary emerges between higher-velocity Salinian rocks west of the San Andreas Fault and Franciscan rocks to the east (fi g. 11). This boundary per-sists to at least the base of model coverage at 18-km depth and is especially pronounced north of the Loma Prieta rupture zone on the San Francisco peninsula. The Salinia-Franciscan terrane boundary is not apparent north of the Golden Gate.
North of the Sacramento River delta, high-velocity rocks appear to be offset east of the Rodgers Creek Fault (fi g. 11). The surface geology is complex east of this fault, comprising
slivers of the Franciscan terrane, Great Valley sequence, ultra-mafi c rocks associated with the faulted terrane boundary, and Cenozoic volcanism. The seismic-station coverage is rela-tively sparse in this area, and the spatial resolution is larger than the geologic units, and so the model may be averaging the effects of shallow igneous rocks. Relatively high seismic velocity persists to at least 11-km depth beneath the Sonoma Volcanic Field but not beneath The Geysers and the Clear Lake Volcanic Field farther north, similar to the less well resolved deep results of Stanley and others (1998).
The primary features of the upper-crustal structure of the San Francisco Bay region revealed by the three-dimensional tomography model are the strong lateral velocity contrasts across major right-lateral strike-slip faults. These contrasts indicate that the faults are high angle down to at least ∼15-km depth into the crust. The strong crossfault velocity contrasts affect calculations of earthquake focal mechanisms, hypocen-ter locations, and strong-ground-motion simulations because seismic energy can be refracted laterally along such velocity boundaries. These effects are not accounted for in traditional one-dimensional model calculations.
Detailed Three-Dimensional Velocity Structure of the San Francisco Peninsula
The geology of the San Francisco Peninsula is domi-nated by the right-lateral San Andreas Fault. In most of central California, the San Andreas Fault bounds the Salinia and Franciscan terranes. On the San Francisco peninsula, however, the Salinia-Franciscan terrane boundary is marked by the subparallel Pilarcitos Fault west of the San Andreas Fault (fi gs. 3, 11; see Brabb and Pampeyan, 1983). On the surface, the San Andreas Fault on the San Francisco penin-sula is contained entirely within the Franciscan Complex. At least two possible models for the arrangement of the Salinia-Franciscan terranes on the peninsula have been proposed: (1) the Pilarcitos Fault may be an east-dipping thrust fault that has emplaced Franciscan rocks over Salinian granites (fi g. 12; see Wakabayashi and Moores, 1988), or (2) the Pilarcitos Fault may represent an old segment of the San Andreas Fault system that accommodated pre-Quaternary right-lateral slip, and so it is a high-angle structure (fi g. 12; see Cummings, 1968; McLaughlin and others, 1996). The surface trace of the Pilarcitos Fault has a somewhat curved or scalloped appearance that makes it look more like a thrust fault than a strike-slip fault, and the fault trace is associated with east-dipping mylonite fabrics indicative of shortening (Wakabayashi and Moores, 1988). However, the relation, if any, between the mylonite and the Pilarcitos Fault remains unresolved.
A temporary seismograph network was deployed on the San Francisco peninsula during the fi rst half of 1995 to use local earthquake and controlled-source traveltimes to create a detailed upper-crustal structural model of the San Andreas and associated faults. The goal of this study was to determine which of the two possible models for the arrangement of
A Review of Faults and Crustal Structure in the San Francisco Bay Area
132 Crustal Structure of the Coastal and Marine San Francisco Bay Region, California
3.6 3.8 4.0 4.2 4.4 4.6 4.8 5.0 5.2 5.4 5.6 4.0 4.2 4.4 4.6 4.8 5.0 5.2 5.4 5.6 5.8 6.0VELOCITY (km/s)
Z = 4 km
N
0
20
40
60
80
100
120
140
160
180
200
220
Y(k
m)
0 20 40 60 80 100 120X (km)
4.2 4.4 4.6 4.8 5.0 5.2 5.4 5.6 5.8 6.0 6.2VELOCITY (km/s)
Z = 6 km
N
0
20
40
60
80
100
120
140
160
180
200
220
Y(k
m)
0 20 40 60 80 100 120X (km)
4.804.955.105.255.405.555.705.856.006.156.30VELOCITY (km/s)
Z = 8 km
N
0
20
40
60
80
100
120
140
160
180
200
220
Y(k
m)
0 20 40 60 80 100 120X (km)
5.4 5.5 5.6 5.7 5.8 5.9 6.0 6.1 6.2 6.3 6.4VELOCITY (km/s)
Z = 10 km
N
0
20
40
60
80
100
120
140
160
180
200
220
Y(k
m)
0 20 40 60 80 100 120X (km)
5.6 5.7 5.8 5.9 6.0 6.1 6.2 6.3 6.4 6.5 6.6VELOCITY (km/s)
Z = 12 km
N
0
20
40
60
80
100
120
140
160
180
200
220
Y(k
m)
0 20 40 60 80 100 120X (km)
5.8 5.9 6.0 6.1 6.2 6.3 6.4 6.5 6.6 6.7 6.8VELOCITY (km/s)
Z = 14 km
N
0
20
40
60
80
100
120
140
160
180
200
220
Y(k
m)
0 20 40 60 80 100 120X (km)
6.0 6.1 6.2 6.3 6.4 6.5 6.6 6.7 6.8 6.9 7.0VELOCITY (km/s)
Z = 16 km
N
0
20
40
60
80
100
120
140
160
180
200
220
Y(k
m)
0 20 40 60 80 100 120X (km)
6.2 6.3 6.4 6.5 6.6 6.7 6.8 6.9 7.0 7.1 7.2VELOCITY (km/s)
Z = 18 km
N
0
20
40
60
80
100
120
140
160
180
200
220
Y(k
m)
0 20 40 60 80 100 120X (km)
VELOCITY (km/s)Z = 2 km
N
0
20
40
60
80
100
120
140
160
180
200
220
Y(k
m)
0 20 40 60 80 100 120X (km)
SA
NA
ND
RE
AS
RO
DG
ER
SC
RE
EK
HAY
WA
RD
CA
LAV
ER
AS
GeysersClear Lake
Figure 11.—Horizontal slices from a three-dimensional velocity model of the San Francisco Bay region taken at 2-km depth intervals. Colors represent variations in seismic velocity.
133
the Salinia-Franciscan terranes on the peninsula is correct. The answer to this question is important because an active Pilarcitos thrust fault could imply far more hazard to nearby San Francisco and peninsula cities than an extinct proto-San Andreas segment.
To make the best use of the San Francisco peninsula array, the regional velocity model was used to calculate trav-eltimes from earthquake sources located outside of the net-work to the edges of a second, more detailed model. Our 1- to 3-km-spaced network allowed for a much shorter smoothing fi lter than did the 5- to 20-km-spaced Calnet. Thus, in effect, the distant earthquake sources were migrated to the edges of a more detailed model and treated like deep sources along the model faces; this technique somewhat resembles a teleseismic experiment, in that traveltime variations from distant sources were used to augment a local-array study. The uncertain-ties in source location and traveltime misfi ts of the regional velocity model may accumulate on long travelpaths and could cause errors in the traveltime calculations to the edges of the more detailed model. In practice, however, such uncertainties manifested primarily as small static-velocity shifts at depth in the resolution tests. The application of controlled sources from known locations acted to calibrate the velocity models. In combination with fi xed sources, short (2 km) smoothing parameters and the close (1–3 km) station spacing prevented signifi cant spatial shifting of velocity anomalies. Intentional static mislocation of earthquake sources in test models caused only minor changes in resolved velocity.
A three-dimensional velocity model limited to the San Francisco peninsula was constructed by shortening the fi nal smoothing fi lter to 2 km, in accordance with the 1- to 3-km station spacing adopted for the temporary seismic network. The San Francisco peninsula model converged to an root-mean-square traveltime misfi t of 245 ms after fi ve iterations. Horizontal slices (20 by 20 km) from the three-dimensional model volume are shown in fi gure 12. At 3 km depth, the highest-velocity (5.5 km/s) rocks appear to be confi ned between the downward vertical projection of surface traces of the San Andreas and Pilarcitos Faults and probably repre-sent either a deeper expression of the Franciscan greenstone mapped at the surface, or a higher velocity unit underlying the Permanente terrane. Southwest of the Pilarcitos Fault, veloci-ties are consistent with the large outcrop of Cretaceous granite (Montara Mountain Granite) that is part of the Salinian block (Brabb and Pampeyan, 1983).
Below 3- to 5-km depth, a downward vertical projection of the surface trace of the Pilarcitos Fault appears to mark a velocity transition from lower velocities (5.5–6.0 km/s) to the southwest into higher velocities (6.2–6.8 km/s) to the north-east (especially evident at 7-km depth, fi g. 12). Our resolution tests indicate that below 6-km depth, velocity anomalies are resolvable only within ∼2 km of their true positions. Thus, this lateral velocity change could reasonably be attributed to either the San Andreas or Pilarcitos Fault. Below 7-km depth are hints of structures that could be bounded by downward vertical projections of the Pilarcitos and San Andreas Faults, but coverage at these depths is limited, and such correlations
are only tentative. More typical Franciscan velocities of ∼6.0 to 6.2 km/s are observed at these depths.
An implication of the three-dimensional velocity model for the San Francisco peninsula is that at 3-km depth, pos-sibly extending to 7-km depth, are velocity boundaries which are correlatable to the downward vertical projection of the Pilarcitos Fault (fi g. 12). Such a correlation suggests that the Pilarcitos Fault may be a high-angle feature. High-angle velocity changes are also evident across the San Andreas Fault and are strongest in the shallowest part of the upper crust (1–3-km depth), where an apparent high angle boundary exists between the Franciscan Permanente terrane southwest of the fault and highly sheared Franciscan rocks to the north-east (fi g. 12).
We conducted a higher-resolution two-dimensional trav-eltime inversion for the velocity of the Permanente terrane (bounded along its southwest side by the Pilarcitos Fault), using traveltimes recorded on instruments (SGRs) along a closely spaced (50-m station spacing, 2–3-km shot spac-ing) southwest-northeast-directed recording spread (fi g. 3). The spread was oriented at an angle of ∼90º to the strikes of the Pilarcitos and San Andreas Faults. Because of the short station spacing and overlapping coverage, we were able to reduce the velocity-model cell size to 100-m squares (in contrast to the 1-km cubes in the three-dimensional velocity models). Models derived from the two-dimensional higher-resolution seismic refraction data are most consistent with the Pilarcitos Fault as marking a vertical boundary in the upper-most 0.5 to 1.0 km of crust between relatively low velocity rocks of the Permanente terrane to the northeast (∼4.5 km/s) and adjacent rocks of the Salinia terrane to the southwest (fi g. 12D). The higher-resolution results tend to verify the indi-cations from horizontal slices out of the three-dimensional velocity model that the Pilarcitos Fault is a steeply dipping boundary. We thus interpret the Pilarcitos Fault as primarily a strike-slip fault rather than a thrust fault. Before ∼3 Ma, the Pilarcitos Fault probably accommodated most of the plate-boundary strain; a change in relative Pacifi c-North American Plate motions at ∼3.9–3.4 Ma stimulated the formation of the Peninsular segment of the San Andreas Fault, and the Pilarci-tos Fault was abandoned as the primary plate-boundary fault (Parsons and Zoback, 1997).
1995–97: Deep Configuration of the San Andreas and Hayward Faults from Crustal Reflections
After a few faint refl ections were observed in the original BASIX data in 1991, the presence of deep crustal refl ectors was fi rmly established by land and marine experiments in 1995 and 1997. BASIX–2 in April 1995 showed high-ampli-tude refl ections between 6- and 10-s two-way traveltime. In June 1995, land-based explosive sources were added that generated high-amplitude refl ections similar in appearance but at 11- to 13-s two-way traveltime. The disparity in arrival time with source-receiver position and strong refl ection dip,
A Review of Faults and Crustal Structure in the San Francisco Bay Area

134 Crustal Structure of the Coastal and Marine San Francisco Bay Region, California
Figure 12.—San Francisco peninsula. A, Horizontal slices from the three-dimensional velocity model from 1- to 11-km depth. Each slice represents a 20- by 20-km area. Color scale for velocity differs from slice to slice to highlight velocity variations. Velocity contours in kilometers per second. Black lines, downward vertical projections of surface traces of the Pilarcitos and San Andreas Faults and coastlines. B, Sketch map of the San Francisco Bay region, showing boundaries of horizontal slices shown in fi gure 12A. C, Simplifi ed geology of the San Francisco peninsula, showing possible structural models for relation between the Pilarcitos and San Andreas Faults. In most of central California, the San Andreas Fault separates the Salinia and Franciscan terranes, whereas on the San Francisco peninsula the Pilarcitos Fault marks the terrane boundary. The Pilarcitos Fault may be either an east-dipping thrust fault that has pushed Franciscan rocks up over Salinian rocks, or a vertical strike-slip fault that accommodated signifi cant right-lateral slip before formation of the San Andreas Fault on the San Francisco peninsula at ~3 Ma. D, High-resolution velocity cross section (inverted from explosive sources) across the San Andreas and Pilarcitos Faults, showing high-angle velocity contrasts associated with the two faults.
Velocity, 1-km depth
Velocity, 5-km depth
Velocity, 9-km depth Velocity, 11-km depth
Velocity, 3-km depth
Velocity, 7-km depth
A38°
37.5°
37.25°
37.75°
37°-123°
B
Saliniaterrane
Franciscanterrane
SAN ANDREAS FAULt
PILARCITOS FAULT
?
C
0.0
0.0
-0.5
0.5
1.0
1.5
5.0 10.0 15.0 20.0
DE
PT
H,I
NK
ILO
ME
TE
RS
DISTANCE, IN KILOMETERS
Pilarcitos Fault San Andreas Fault
D
5.0
5.0
5.0
5.0
6.0
6.0
4.64.8
5.0 5.0
5.2 5.2
5.4 5.4
6.0
6.0
6.0
6.0
6.0
6.0 6.2
6.26.2
6.2
6.5
6.5
6.8
6.2
5.0
4.0
4.0
4.5
4.5
5.5
5.5
5.5
5.5
5.5
5.5
5.8
5.8
6.0
6.0
5.8
5.8
6.5 6.5
4.5
3.5
3.5

135
or moveout (the change in refl ection traveltime as a function of source-receiver offset), inspired a third marine experiment (BASIX–3) in 1997. Collectively, these seismic-refl ection data enabled us to model the deep structure related to the Hayward and San Andreas Faults.
Crustal Characteristics from Vertical-Incidence Refl ection Data
Large-airgun and chemical sources deployed in and around San Francisco Bay returned refl ection energy through-out the crust (for example, Brocher and others, 1994; Parsons, 1998; Parsons and Hart, 1999), enabling some discussion on background refl ectivity. The land-receiver spread crossed the Salinia terrane southwest of the Pilarcitos Fault and the Franciscan Complex between the Pilarcitos and San Andreas Faults on the San Francisco peninsula, and the marine receiv-ers were all located within the Franciscan Complex (fi gs. 3, 12). These bedrock units show no coherent refl ections down to about 5- to 6-s two-way traveltime (∼14–15-km depth) over the entire source bandwidth (2–40 Hz; fi g. 13).
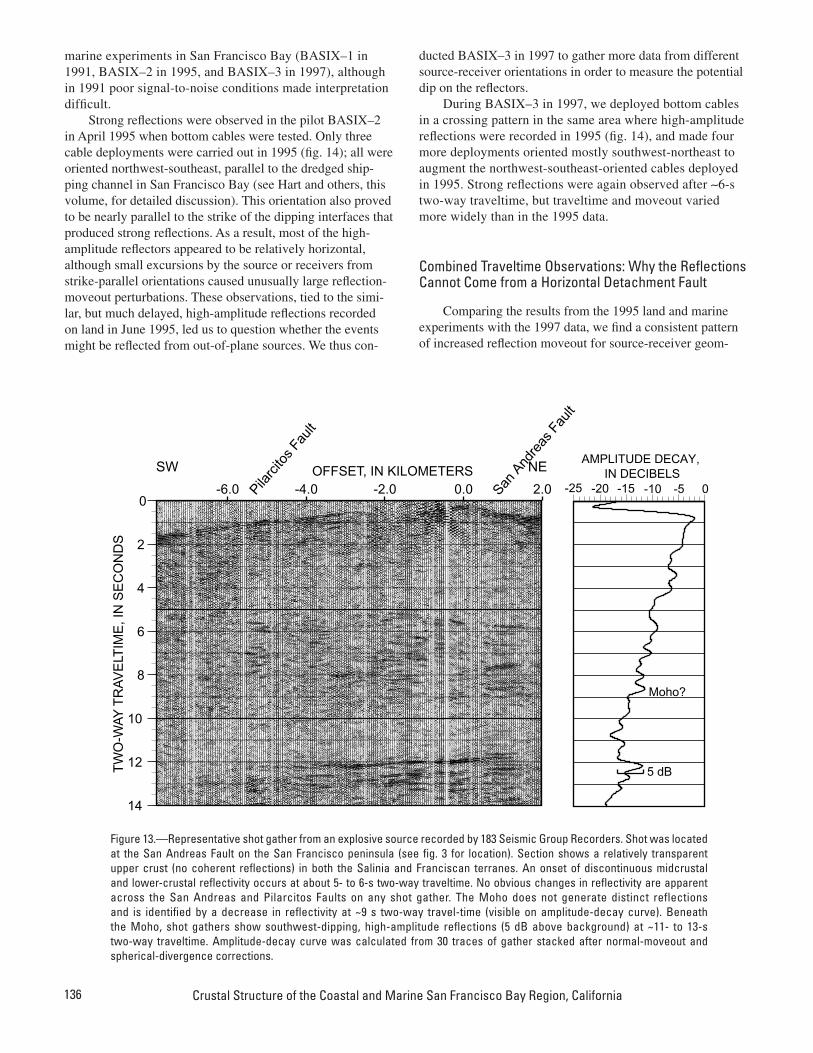
Below about 5- to 6-s two-way traveltime, the land data best show an onset of discontinuous midcrustal and lower-crustal refl ectivity (individual crustal-refl ection segments generally less than 1 km long) that extends to the inferred Moho (∼8–9-s two-way traveltime, 24–28-km depth). This depth to the Moho agrees reasonably well with models from wide-angle seismic data (Catchings and Kohler, 1996; Hol-brook and others, 1996) that found Moho depths of 22 to 26 km beneath the Golden Gate and near San Francisco Bay. The seismic-refl ection data do not show a discrete Moho refl ection but rather a progressive decrease of refl ectivity that can be traced most clearly on the amplitude-decay curve (fi g. 13). The background midcrustal refl ections are far less evident in the marine data because they tend to be suppressed by more nearly continuous, higher-amplitude dipping refl ec-tions.
The onset of midcrustal and lower-crustal refl ectivity at 5- to 6-s two-way traveltime corresponds to a step in crustal velocity (6.4–7.3 km/s) at ∼20-km depth, as modeled by Holbrook and others (1996). Because of wide observation in the San Francisco Bay region of an onset of refl ectivity and associated change in crustal velocity at ∼20 km depth, and the choppiness and discontinuity of the refl ections, we interpret the lower-crustal refl ectivity beneath the San Francisco peninsula as resulting from an increase in shear fabric, possibly due to a rheologic change at ∼20-km depth (for example, Holbrook and others, 1996). Lower-crustal refl ectivity, which is generally observed in terranes that have been transported long distances along strike-slip faults, such as beneath the central California margin and in Alaska, has been attributed to lower-crustal shearing during translation (Beaudoin, 1994).
High-Amplitude Dipping Refl ectorsThe most distinctive feature of vertical-incidence seismic
records from the San Francisco Bay region (fi g. 14) is late-
arriving (6–13-s two-way traveltime) refl ections with high amplitude, strong continuity, large moveout, and variations in traveltime and moveout with source-receiver position (fi gs. 13–16). If these events had been refl ected from a single, fl at horizon, very little change in traveltime or moveout would be expected. Refl ections from a fl at surface have predictable dip and obey the normal moveout equation
where t is the time, x
1 and x
2 are the reciprocal source and
receiver positions, V is the seismic velocity, and t0 is the
zero-offset refl ection time. Signifi cant departure from normal moveout implies a refl ection from a dipping interface; variation in moveout with source-receiver orientation can indicate the strike and dip of the refl ector. Most of the high-amplitude refl ections observed at vertical incidence must be distinguished from those regionally observed at wide source-receiver aperture from a near-horizontal refl ector interpreted as the top of mafi c lower crust by Brocher and others (1994) and Holbrook and others (1996).
High-Amplitude Dipping Reflections Recorded on Land
Following Moho traveltimes (∼9-s two-way traveltime), a band of continuous (max 5 km long), high-amplitude refl ections appears at ∼11- to 13-s two-way traveltime on a land transect across the San Francisco peninsula (fi gs. 3, 13). The relative amplitude of these refl ections is surprisingly high (5 dB above background; fi g. 13). For reference, the relative amplitudes reported for the Death Valley, Socorro, and Surrency brightspots range from 8.5 to 10 dB; the Death Valley and Socorro brightspots were interpreted as magma bodies (Brown and others, 1987). A consistent directivity is evident in the events at 11- to 13-s two-way traveltime; they all dip southwest and are refl ected from a horizon that must be located northeast of all the shots and the recording spread (fi g. 3). These events cannot be explained by P-wave Moho refl ections because the long traveltimes at crustal velocities would imply at least a 40-km-thick crust beneath San Fran-cisco Bay, inconsistent with interpretations of wide-angle seismic data (Page and Brocher, 1993; Catchings and Kohler, 1996; Holbrook and others, 1996), regional elevations, or the Bouguer gravity anomaly. Such origins for these events as crustal S-wave or upper-mantle P-wave refl ections were ruled out by Parsons (1998).
Marine High-Amplitude Dipping Reflections
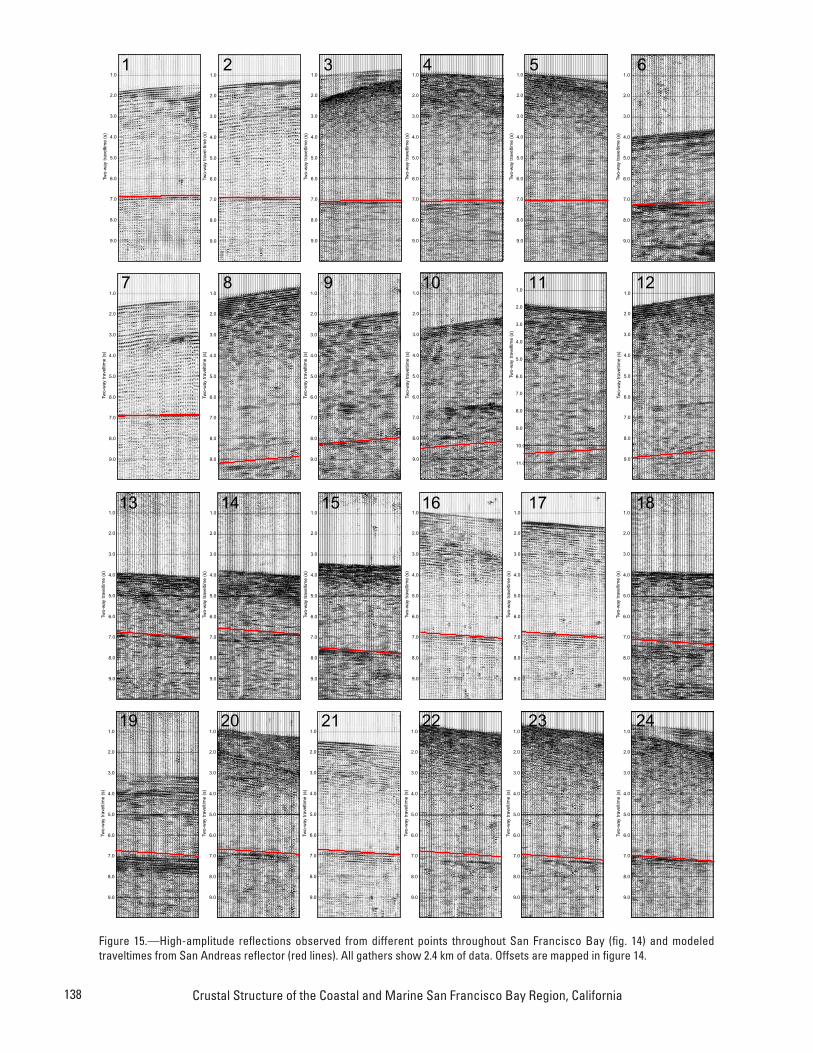
High-amplitude dipping refl ections were observed from many consecutive airgun blasts at 6- to 9-s two-way trav-eltime throughout San Francisco Bay (fi gs. 15, 16). These events are nearly identical to the refl ections at 11- to 13-s two-way traveltime recorded on the San Francisco penin-sula, except that most of the events at 6 to 9 s have earlier traveltimes. The refl ections were recorded during all three
A Review of Faults and Crustal Structure in the San Francisco Bay Area
tx x
V t=
−22
12
202
,
136 Crustal Structure of the Coastal and Marine San Francisco Bay Region, California
marine experiments in San Francisco Bay (BASIX–1 in 1991, BASIX–2 in 1995, and BASIX–3 in 1997), although in 1991 poor signal-to-noise conditions made interpretation diffi cult.
Strong refl ections were observed in the pilot BASIX–2 in April 1995 when bottom cables were tested. Only three cable deployments were carried out in 1995 (fi g. 14); all were oriented northwest-southeast, parallel to the dredged ship-ping channel in San Francisco Bay (see Hart and others, this volume, for detailed discussion). This orientation also proved to be nearly parallel to the strike of the dipping interfaces that produced strong refl ections. As a result, most of the high-amplitude refl ectors appeared to be relatively horizontal, although small excursions by the source or receivers from strike-parallel orientations caused unusually large refl ection-moveout perturbations. These observations, tied to the simi-lar, but much delayed, high-amplitude refl ections recorded on land in June 1995, led us to question whether the events might be refl ected from out-of-plane sources. We thus con-
ducted BASIX–3 in 1997 to gather more data from different source-receiver orientations in order to measure the potential dip on the refl ectors.
During BASIX–3 in 1997, we deployed bottom cables in a crossing pattern in the same area where high-amplitude refl ections were recorded in 1995 (fi g. 14), and made four more deployments oriented mostly southwest-northeast to augment the northwest-southeast-oriented cables deployed in 1995. Strong refl ections were again observed after ∼6-s two-way traveltime, but traveltime and moveout varied more widely than in the 1995 data.
Combined Traveltime Observations: Why the Reflections Cannot Come from a Horizontal Detachment Fault
Comparing the results from the 1995 land and marine experiments with the 1997 data, we fi nd a consistent pattern of increased refl ection moveout for source-receiver geom-
SanAnd
reas
Fault
Pilarc
itos Fa
ult
SW NEAMPLITUDE DECAY,
IN DECIBELS-25 -20 -15 -10 -5 0
Moho?
5 dB
14
12
10
8
6
4
2
00.0 2.0-2.0-4.0-6.0
TW
O-W
AYT
RA
VE
LTIM
E,I
NS
EC
ON
DS
OFFSET, IN KILOMETERS
Figure 13.—Representative shot gather from an explosive source recorded by 183 Seismic Group Recorders. Shot was located at the San Andreas Fault on the San Francisco peninsula (see fi g. 3 for location). Section shows a relatively transparent upper crust (no coherent refl ections) in both the Salinia and Franciscan terranes. An onset of discontinuous midcrustal and lower-crustal refl ectivity occurs at about 5- to 6-s two-way traveltime. No obvious changes in refl ectivity are apparent across the San Andreas and Pilarcitos Faults on any shot gather. The Moho does not generate distinct reflections and is identifi ed by a decrease in refl ectivity at ~9 s two-way travel-time (visible on amplitude-decay curve). Beneath the Moho, shot gathers show southwest-dipping, high-amplitude refl ections (5 dB above background) at ~11- to 13-s two-way traveltime. Amplitude-decay curve was calculated from 30 traces of gather stacked after normal-moveout and spherical-divergence corrections.

137
Figure 14.—San Francisco Bay region, showing locations of modeled arrivals from the San Andreas refl ector (A) and Hayward refl ector (B). Numbers correlate to gathers shown in fi gures 15 and 16. Colored triangles, source positions as recorded by bottom cables, repre-sented by lines of same color.
121°50'122°00'122°10'122°20'122°30'122°40'38°10'
38°00'
37°50'
37°40'
37°30'
SANANDREAS
FAULT
HAYWARD
FAULT
�
�����������������
�
�
���������������
BolinasLagoon
SanMateo
Berkeley
1-2,7
3-45
6
8
910
11
12
13
2223 24
14 15
16-17,21
181920
121°50'122°00'122°10'122°20'122°30'122°40'38°10'
38°00'
37°50'
37°40'
37°30'
�
�
��
�
�
���������������
�����������������������
������������������������������
����������������������������
���������������
���������������������
������������������������������
��������������������
�
�
���������������
�����������������������
������������������������������
����������������������������
���������������
���������������������
������������������������������
�������������������
���
30
31
32
33-34
35
37
3626
2829
27
��
��
�����
�� �
�
�
�
�
�
�
�
�
�
�
�
�
�
�
���
�
�
A
B
5 0 5KILOMETERS
A Review of Faults and Crustal Structure in the San Francisco Bay Area
138 Crustal Structure of the Coastal and Marine San Francisco Bay Region, California
1.0
3.0
4.0
2.0
5.0
6.0
8.0
9.0
7.0
Two-
way
trav
eltim
e(s
)
1.0
3.0
4.0
2.0
5.0
6.0
8.0
9.0
7.0Tw
o-w
aytr
avel
time
(s)
1.0
3.0
4.0
2.0
5.0
6.0
8.0
9.0
7.0
Two-
way
trav
eltim
e(s
)
1.0
3.0
4.0
2.0
5.0
6.0
8.0
9.0
7.0
Two-
way
trav
eltim
e(s
)
1.0
3.0
4.0
2.0
5.0
6.0
8.0
9.0
7.0
Two-
way
trav
eltim
e(s
)
1.0
3.0
4.0
2.0
5.0
6.0
8.0
9.0
7.0
Two-
way
trav
eltim
e(s
)
1.0
3.0
4.0
2.0
5.0
6.0
8.0
9.0
7.0
Two-
way
trav
eltim
e(s
)
1.0
3.0
4.0
2.0
5.0
6.0
8.0
9.0
7.0
Two-
way
trav
eltim
e(s
)
1.0
3.0
4.0
2.0
5.0
6.0
8.0
9.0
7.0
Two-
way
trav
eltim
e(s
)
1.0
3.0
4.0
2.0
5.0
6.0
8.0
9.0
7.0
Two-
way
trav
eltim
e(s
)
1.0
3.0
4.0
2.0
5.0
6.0
8.0
9.0
10.0
11.0
7.0
Two-
way
trav
eltim
e(s
)
1.0
3.0
4.0
2.0
5.0
6.0
8.0
9.0
7.0
Two-
way
trav
eltim
e(s
)
1.0
3.0
4.0
2.0
5.0
6.0
8.0
9.0
7.0
Two-
way
trav
eltim
e(s
)
1.0
3.0
4.0
2.0
5.0
6.0
8.0
9.0
7.0
Two-
way
trav
eltim
e(s
)
1.0
3.0
4.0
2.0
5.0
6.0
8.0
9.0
7.0
Two-
way
trav
eltim
e(s
)
1.0
3.0
4.0
2.0
5.0
6.0
8.0
9.0
7.0
Two-
way
trav
eltim
e(s
)
1.0
3.0
4.0
2.0
5.0
6.0
8.0
9.0
7.0
Two-
way
trav
eltim
e(s
)1.0
3.0
4.0
2.0
5.0
6.0
8.0
9.0
7.0
Two-
way
trav
eltim
e(s
)
1.0
3.0
4.0
2.0
5.0
6.0
8.0
9.0
7.0
Two-
way
trav
eltim
e(s
)
1.0
3.0
4.0
2.0
5.0
6.0
8.0
9.0
7.0
Two-
way
trav
eltim
e(s
)
1.0
3.0
4.0
2.0
5.0
6.0
8.0
9.0
7.0
Two-
way
trav
eltim
e(s
)
1.0
3.0
4.0
2.0
5.0
6.0
8.0
9.0
7.0
Two-
way
trav
eltim
e(s
)
1.0
3.0
4.0
2.0
5.0
6.0
8.0
9.0
7.0
Two-
way
trav
eltim
e(s
)
1.0
3.0
4.0
2.0
5.0
6.0
8.0
9.0
7.0
Two-
way
trav
eltim
e(s
)
1 2 3 4 5 6
7 8 9 10 11 12
13 14 15 16 17 18
19 20 21 22 23 24
Figure 15.—High-amplitude refl ections observed from different points throughout San Francisco Bay (fi g. 14) and modeled traveltimes from San Andreas refl ector (red lines). All gathers show 2.4 km of data. Offsets are mapped in fi gure 14.
139
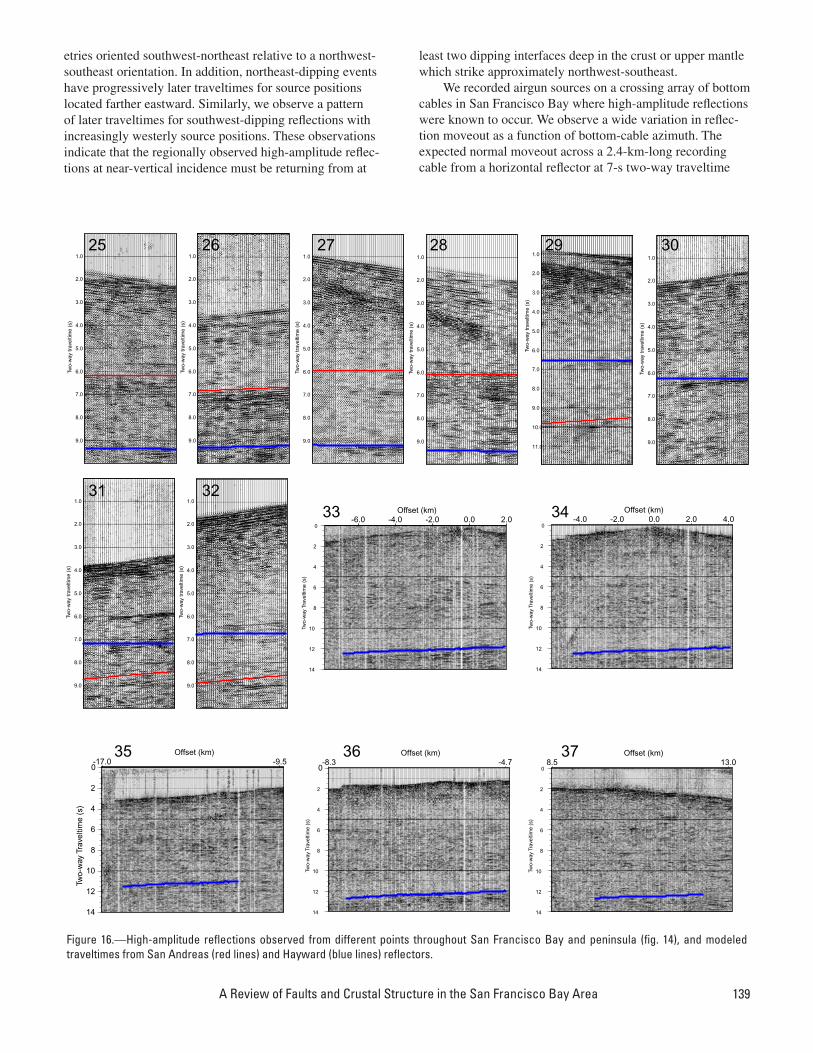
etries oriented southwest-northeast relative to a northwest-southeast orientation. In addition, northeast-dipping events have progressively later traveltimes for source positions located farther eastward. Similarly, we observe a pattern of later traveltimes for southwest-dipping refl ections with increasingly westerly source positions. These observations indicate that the regionally observed high-amplitude refl ec-tions at near-vertical incidence must be returning from at
least two dipping interfaces deep in the crust or upper mantle which strike approximately northwest-southeast.
We recorded airgun sources on a crossing array of bottom cables in San Francisco Bay where high-amplitude refl ections were known to occur. We observe a wide variation in refl ec-tion moveout as a function of bottom-cable azimuth. The expected normal moveout across a 2.4-km-long recording cable from a horizontal refl ector at 7-s two-way traveltime
1.0
3.0
4.0
2.0
5.0
6.0
8.0
9.0
7.0
Two-
way
trav
eltim
e(s
)
1.0
3.0
4.0
2.0
5.0
6.0
8.0
9.0
7.0
Two-
way
trav
eltim
e(s
)
1.0
3.0
4.0
2.0
5.0
6.0
8.0
9.0
7.0
Two-
way
trav
eltim
e(s
)
1.0
3.0
4.0
2.0
5.0
6.0
8.0
9.0
7.0
Two-
way
trav
eltim
e(s
)
1.0
3.0
4.0
2.0
5.0
6.0
8.0
9.0
10.0
11.0
7.0
Two-
way
trav
eltim
e(s
)
1.0
3.0
4.0
2.0
5.0
6.0
8.0
9.0
7.0
Two-
way
trav
eltim
e(s
)
1.0
3.0
4.0
2.0
5.0
6.0
8.0
9.0
7.0
Two-
way
trav
eltim
e(s
)
1.0
3.0
4.0
2.0
5.0
6.0
8.0
9.0
7.0
Two-
way
trav
eltim
e(s
)
14
12
10
8
6
4
2
00.0 2.0-2.0-4.0-6.0
Two-
way
Trav
eltim
e(s
)
Offset (km)
14
12
10
8
6
4
2
00.0 2.0 4.0-2.0-4.0
Two-
way
Trav
eltim
e(s
)
Offset (km)
14
12
10
8
6
4
2
0-9.5-17.0
Two-
way
Trav
eltim
e(s
)
Offset (km)
14
12
10
8
6
4
2
0-4.7-8.3
Two-
way
Trav
eltim
e(s
)
Offset (km)
14
12
10
8
6
4
2
013.08.5
Two-
way
Trav
eltim
e(s
)
Offset (km)
25 26
31 3233
35 36 37
34
27 28 29 30
Figure 16.—High-amplitude refl ections observed from different points throughout San Francisco Bay and peninsula (fi g. 14), and modeled traveltimes from San Andreas (red lines) and Hayward (blue lines) refl ectors.
A Review of Faults and Crustal Structure in the San Francisco Bay Area
140 Crustal Structure of the Coastal and Marine San Francisco Bay Region, California
for a shot positioned 2.5 km away from the cable is about 40 ms. Much larger moveout values (hundreds of milliseconds) imply a dipping refl ector. Refl ections recorded parallel to the San Andreas Fault are nearly horizontal at ∼7-s two-way trav-eltime (fi g. 17A), whereas refl ections recorded orthogonal to the fault dip down to the northeast (more than 200-ms differ-ence in moveout over a 2.4-km distance relative to the refl ec-tions recorded parallel to the fault; fi g. 17B). If the refl ector were horizontal, moveout would be independent of azimuth; thus, the refl ector must dip down to the northeast. We note a consistent pattern of azimuthal dependence of moveout throughout San Francisco Bay (fi g. 17C).
A dipping refl ector causes offset dependence on refl ec-tion traveltime; if the source position is moved farther down-dip from a fi xed receiver, then the refl ection traveltime is expected to be later. For example, in fi gure 18, the traveltime of the same refl ection event progressively increases with shot distance from the San Andreas Fault. Such a relation can be explained only by a refl ector with a steep downward dip to the northeast, somewhere in the vicinity of the San Andreas Fault. We observe a dependence of refl ection traveltime (southwest-dipping events) on distance from the San Andreas Fault throughout the bay (fi g. 18). We observe a second group of refl ections with northeastward dip that have progressively later traveltimes with increasing source distance from the Hayward Fault; these events range in traveltime from ∼6 s in San Pablo Bay to nearly 13 s recorded on the San Francisco peninsula (fi g. 18).
These observations demonstrate that a model with near-horizontal refl ectors beneath San Francisco Bay is inap-propriate for the high-amplitude refl ections. Therefore, a two-dimensional modeling approach that projects seismic raypaths into one vertical plane is also inappropriate. The combined geometry of the 1995 and 1997 land and marine seismic-refl ection experiments is complex, and poorly suited for pro-jection into one plane, even if the subsurface geology were simpler. Thus, any analysis of refl ection traveltimes in the San Francisco Bay region must be treated as a three-dimensional problem.
Three-Dimensional Traveltime Modeling of High-Amplitude Reflections
We use three-dimensional fi nite-difference traveltime cal-culations (Hole and Zelt, 1995) to model the surfaces respon-sible for high-amplitude refl ections recorded in San Francisco Bay (Parsons and Hart, 1999). We apply a three-dimensional velocity model for the region, constructed from earthquake sources (Parsons and Zoback, 1997; Hole and others, 2000) in combination with an extrapolation of a two-dimensional lower-crustal velocity model (Holbrook and others, 1996). The refl ector that best satisfi es all the northeast-dipping refl ection traveltimes dips 60º beginning at 12-km depth and parallels the strike of the San Andreas Fault in the study area (fi g. 19). The modeled refl ector dip begins beneath the down-ward vertical projection from the surface trace of the San Andreas Fault (fi g. 19). The uniqueness of this model is tested
by a wide variety of shot-receiver offsets and refl ection angles (fi gs. 17–19).
All the refl ection traveltimes were fi tted to within a 240-ms root-mean-square static shift (measured at the center of each refl ection). The refl ection-moveout variation was fi tted to within an 80-ms root-mean-square error (measured from end to end); the spread in moveout versus azimuth in fi gure 17 is the result of a two-dimensional projection of varying shot-receiver geometry and velocity variations. These errors are less than the uncertainties inherent in the three-dimen-sional velocity model that we apply (370 ms; Parsons and Zoback, 1997). The fi ts to the refl ections shown in fi gures 15 through 18, and the depth points shown in fi gure 19 were made by using the three-dimensional model. The collective moveout observations constrain a range in dip from 55º to 62º, with the best fi t at 60º.
Repeated refl ection observations at different offset ranges provide the overlapping depth coverage that limits possible solutions. The sources identifi ed in fi gure 14 in San Francisco Bay represent groups of airgun shots ranging from at least 5 to 20 sequential refl ection observations. Thus, although 37 modeled source points are marked in fi gure 14 (dots), actu-ally hundreds of repeated observations were made. The airgun spacing was ∼100 m, generating only slight variations in refl ection time and moveout between adjacent shots; however, the repeated sequential refl ection observations give us con-fi dence in their validity. The distribution in source-receiver locations produces refl ection depth points on the 60º-NE.-dip-ping structure along the strike of much of the San Andreas Fault, from the north at Bolinas Lagoon to the south at the city of San Mateo, a distance of 50 km (fi g. 14). The depth coverage on the dipping structure ranges from 14 to 22 km (fi g. 19B). This dipping horizon passes beneath a right step in the San Andreas Fault where the M=7.8 1906 San Francisco earthquake is thought to have initiated offshore of San Fran-cisco (Zoback and others, 1999). We model this right step as a slight bend in the fault at depth (fi g. 16).
We similarly model a separate group of southwest-dip-ping refl ections from beneath San Francisco Bay (fi g. 14). Among the 37 groups of airgun and explosive sources shown in fi gures 14 through 16, 13 produced refl ections from a 70º-SW.-dipping structure between 22- and 24-km depth paral-leling the Hayward Fault east of San Francisco Bay (fi gs. 14, 19). We observe this dipping structure from north of the city of Berkeley to south of the city of Hayward, an along-strike distance of 34 km (fi g. 14). The combined land and marine depth coverage ranges from 18 to 24 km. The Hayward Fault predates the Peninsular segment of the San Andreas Fault, has more cumulative slip (50–70 versus 19–23 km; Cummings, 1968; McLaughlin and others, 1996), and appears to dip more steeply beginning deeper in the crust.
Virtually all of the coherent high-amplitude refl ections recorded beneath San Francisco Bay at near-vertical inci-dence have thus been fi tted to dipping structures associated with either the San Andreas or Hayward Fault. No continuous high-amplitude horizontal refl ections were observed from the Moho or the top of the lower crust, although weaker, discon-
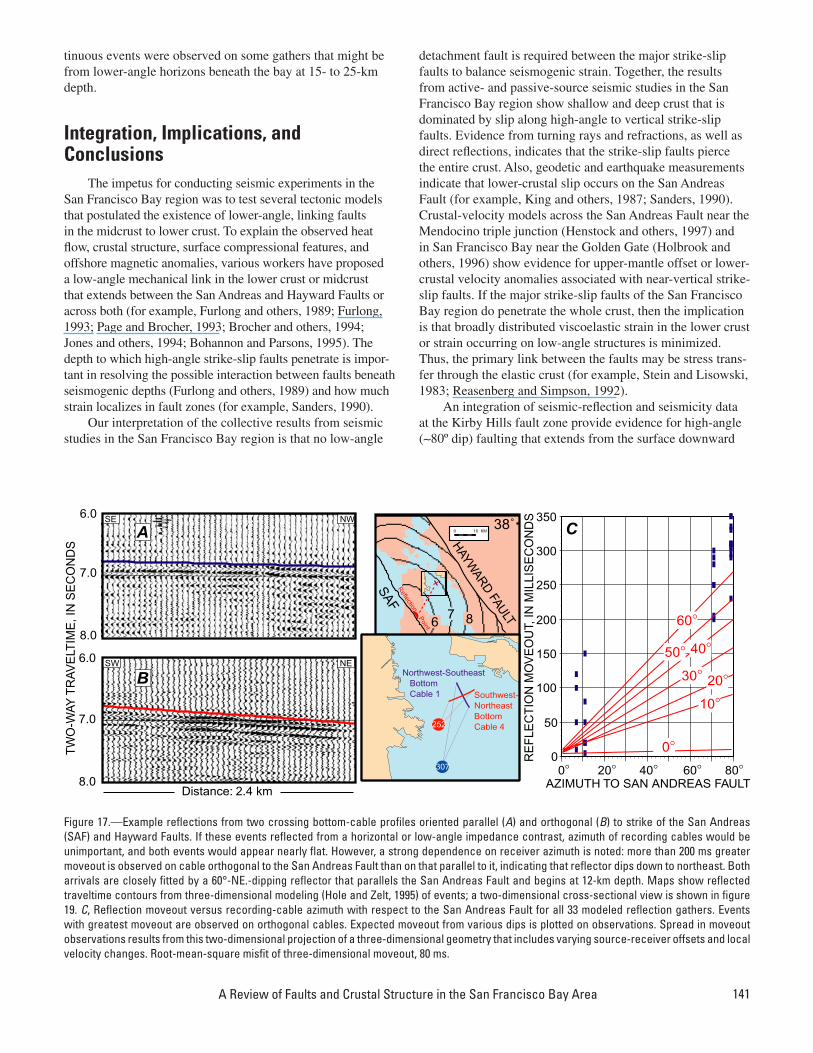
141
-121.5˚
7 86
SAF
HAYWARD
FAULT
0 10 KM38˚
ReflectionPoint
37.5˚
Northwest-SoutheastBottomCable 1 Southwest-
NortheastBottomCable 4
307
252
10°
0°
20°30°
40°50°
60°
00° 20° 40° 60° 80°
50
100
150
200
250
300
350R
EF
LEC
TIO
NM
OV
EO
UT,
INM
ILLI
SE
CO
ND
S
AZIMUTH TO SAN ANDREAS FAULT
TW
O-W
AYT
RAV
ELT
IME
,IN
SE
CO
ND
S
6.0
8.0
7.0
SE NW
A C
8.0
7.0
6.0
Distance: 2.4 km
SW NE
B
Figure 17.—Example refl ections from two crossing bottom-cable profi les oriented parallel (A) and orthogonal (B) to strike of the San Andreas (SAF) and Hayward Faults. If these events refl ected from a horizontal or low-angle impedance contrast, azimuth of recording cables would be unimportant, and both events would appear nearly fl at. However, a strong dependence on receiver azimuth is noted: more than 200 ms greater moveout is observed on cable orthogonal to the San Andreas Fault than on that parallel to it, indicating that refl ector dips down to northeast. Both arrivals are closely fi tted by a 60°-NE.-dipping refl ector that parallels the San Andreas Fault and begins at 12-km depth. Maps show refl ected traveltime contours from three-dimensional modeling (Hole and Zelt, 1995) of events; a two-dimensional cross-sectional view is shown in fi gure 19. C, Refl ection moveout versus recording-cable azimuth with respect to the San Andreas Fault for all 33 modeled refl ection gathers. Events with greatest moveout are observed on orthogonal cables. Expected moveout from various dips is plotted on observations. Spread in moveout observations results from this two-dimensional projection of a three-dimensional geometry that includes varying source-receiver offsets and local velocity changes. Root-mean-square misfi t of three-dimensional moveout, 80 ms.
tinuous events were observed on some gathers that might be from lower-angle horizons beneath the bay at 15- to 25-km depth.
Integration, Implications, and Conclusions
The impetus for conducting seismic experiments in the San Francisco Bay region was to test several tectonic models that postulated the existence of lower-angle, linking faults in the midcrust to lower crust. To explain the observed heat fl ow, crustal structure, surface compressional features, and offshore magnetic anomalies, various workers have proposed a low-angle mechanical link in the lower crust or midcrust that extends between the San Andreas and Hayward Faults or across both (for example, Furlong and others, 1989; Furlong, 1993; Page and Brocher, 1993; Brocher and others, 1994; Jones and others, 1994; Bohannon and Parsons, 1995). The depth to which high-angle strike-slip faults penetrate is impor-tant in resolving the possible interaction between faults beneath seismogenic depths (Furlong and others, 1989) and how much strain localizes in fault zones (for example, Sanders, 1990).
Our interpretation of the collective results from seismic studies in the San Francisco Bay region is that no low-angle
detachment fault is required between the major strike-slip faults to balance seismogenic strain. Together, the results from active- and passive-source seismic studies in the San Francisco Bay region show shallow and deep crust that is dominated by slip along high-angle to vertical strike-slip faults. Evidence from turning rays and refractions, as well as direct refl ections, indicates that the strike-slip faults pierce the entire crust. Also, geodetic and earthquake measurements indicate that lower-crustal slip occurs on the San Andreas Fault (for example, King and others, 1987; Sanders, 1990). Crustal-velocity models across the San Andreas Fault near the Mendocino triple junction (Henstock and others, 1997) and in San Francisco Bay near the Golden Gate (Holbrook and others, 1996) show evidence for upper-mantle offset or lower-crustal velocity anomalies associated with near-vertical strike-slip faults. If the major strike-slip faults of the San Francisco Bay region do penetrate the whole crust, then the implication is that broadly distributed viscoelastic strain in the lower crust or strain occurring on low-angle structures is minimized. Thus, the primary link between the faults may be stress trans-fer through the elastic crust (for example, Stein and Lisowski, 1983; Reasenberg and Simpson, 1992).
An integration of seismic-refl ection and seismicity data at the Kirby Hills fault zone provide evidence for high-angle (∼80º dip) faulting that extends from the surface downward
A Review of Faults and Crustal Structure in the San Francisco Bay Area

142 Crustal Structure of the Coastal and Marine San Francisco Bay Region, California
to approximately the base of the crust. Because fi rst-motion studies of earthquakes along the Kirby Hills Fault indicate predominantly right-lateral strike-slip motion, we interpret this fault to be the easternmost strand of the San Andreas Fault system. As such, this structure is presently offsetting the Cretaceous-Tertiary Coast Range-Great Valley tectonic wedge. The presence of whole-crustal dextral strike-slip fault-ing along the Coast Range-Great Valley boundary suggests that at this latitude, tectonic wedging is not currently active. Instead, any tectonic wedge that may have been constructed in the past is now being sliced and dismembered along the near-vertical crust-penetrating fault system at the east edge of the Coast Ranges.
The San Andreas and Hayward Faults are also modeled as cutting through the whole crust, at moderate to steep dip (60º–70º). If the interpreted lower-crustal dips of the San Andreas and Hayward Faults persist beneath the crust, these two faults would intersect at ∼45-km depth, 20 km into the upper mantle (fi g. 19). Below that depth, a single fault might accommodate all the relative Pacifi c-North American Plate motion. Our observations of fault-plane refl ections are limited to crustal depths because the constraints of marine recording in San Francisco Bay prohibit the long source-receiver offsets required to observe deeper, dipping refl ections. We can thus
only speculate about the sub-Moho geometry of the faults (fi g. 19). The dip of the faults might change after crossing the rheologic boundary at the Moho; the initiation of fault dip appears to be related to layer boundaries (seismic-velocity steps), identifi ed by wide-angle seismic methods, that also represent rheologic boundaries (Holbrook and others, 1996). Thus, a lower-angle fault might still be present in the upper mantle (fi g. 19), although we observe no refl ections from any near-horizontal boundaries at later traveltimes that could be observed at near offsets. Interestingly, all the faults identifi ed in the lower crust of the San Francisco Bay region have some apparent dip, ranging from ∼60º on the San Andreas Fault to ∼80º on the Kirby Hills Fault.
The relatively high amplitude (∼5 dB above background) of refl ections from deep, dipping surfaces signifi es strong impedance contrasts in the lower crust beneath the surface traces of the Hayward and San Andreas Faults. Thus, right-lateral movement on these faults may have occurred through the whole crust and offset signifi cantly different rock types. Alternatively, the presence of fl uids in the fault zones or localized shearing and accompanying metamorphism within the fault zones may have generated an impedance contrast (for example, Fountain and others, 1984; Wang and others, 1989; Kern and Wenk, 1990; Siegesmund and others, 1991).
Figure 18.—Three shot gathers (A) recorded in northern San Francisco Bay (B), each showing same refl ection event from the San Andreas Fault. Traveltime is progressively later with increasing shot distance northeast of fault, a consequence of a dipping refl ector (C). Calculated three-dimensional refl ection traveltimes from a 60° modeled refl ector are superimposed on data plots. D, Refl ection times to center of all modeled refl ections as a function of their distance from the San Andreas (blue squares) or Hayward (red dots) Fault. Those source-receiver pairs located farthest from faults have refl ections with latest arrivals. Three green squares represent data examples shown in fi gure 18A.
SW NEshot 1 shot 2 shot 3
9.0
11.0
10.0
8.0
TW
O-W
AYT
RA
VE
LTIM
E,
INS
EC
ON
DS
1 2 3
San Andreas Fault
A
C65 55 45 35 25 15 5
ORTHOGONAL DISTANCE FROMHAYWARD FAULT, IN KILOMETERS
5 15 25 35 45 55 65ORTHOGONAL DISTANCE FROMSAN ANDREAS FAULT, IN KILOMETERS
RE
FLE
CT
ION
TIM
E,I
NS
EC
ON
DS
12
10
8
6 D
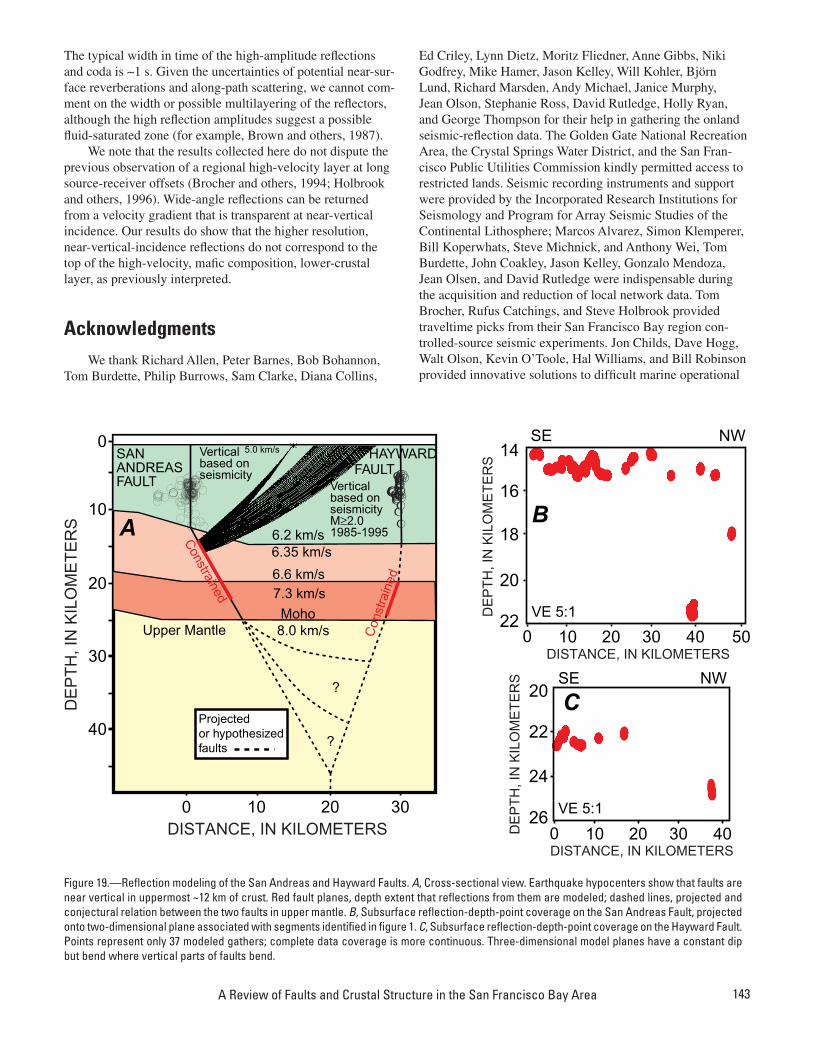
143
The typical width in time of the high-amplitude refl ections and coda is ∼1 s. Given the uncertainties of potential near-sur-face reverberations and along-path scattering, we cannot com-ment on the width or possible multilayering of the refl ectors, although the high refl ection amplitudes suggest a possible fl uid-saturated zone (for example, Brown and others, 1987).
We note that the results collected here do not dispute the previous observation of a regional high-velocity layer at long source-receiver offsets (Brocher and others, 1994; Holbrook and others, 1996). Wide-angle refl ections can be returned from a velocity gradient that is transparent at near-vertical incidence. Our results do show that the higher resolution, near-vertical-incidence refl ections do not correspond to the top of the high-velocity, mafi c composition, lower-crustal layer, as previously interpreted.
AcknowledgmentsWe thank Richard Allen, Peter Barnes, Bob Bohannon,
Tom Burdette, Philip Burrows, Sam Clarke, Diana Collins,
Ed Criley, Lynn Dietz, Moritz Fliedner, Anne Gibbs, Niki Godfrey, Mike Hamer, Jason Kelley, Will Kohler, Björn Lund, Richard Marsden, Andy Michael, Janice Murphy, Jean Olson, Stephanie Ross, David Rutledge, Holly Ryan, and George Thompson for their help in gathering the onland seismic-refl ection data. The Golden Gate National Recreation Area, the Crystal Springs Water District, and the San Fran-cisco Public Utilities Commission kindly permitted access to restricted lands. Seismic recording instruments and support were provided by the Incorporated Research Institutions for Seismology and Program for Array Seismic Studies of the Continental Lithosphere; Marcos Alvarez, Simon Klemperer, Bill Koperwhats, Steve Michnick, and Anthony Wei, Tom Burdette, John Coakley, Jason Kelley, Gonzalo Mendoza, Jean Olsen, and David Rutledge were indispensable during the acquisition and reduction of local network data. Tom Brocher, Rufus Catchings, and Steve Holbrook provided traveltime picks from their San Francisco Bay region con-trolled-source seismic experiments. Jon Childs, Dave Hogg, Walt Olson, Kevin O’Toole, Hal Williams, and Bill Robinson provided innovative solutions to diffi cult marine operational
●●●●●●●●●●●●●●●●●●●●●●●●●●●●●●●●●●●●●●●●●●●●●●●●●●●●●●●●●●●●●●●●●●●●●●●●●●●●●●●●●●●●●●●●●●●●●●●●●●●●●●●●●●●●●●●●●●●●●●●●●●●●●●●●●●●●●●●●●●●
●●●●●●●●●●●●●●●●●●●●●●●●●●●●●●●●●●●●●●●●●●●●●●●●●●●●●●●●●●●●●●●●●●●●●●●●●●●●●●●●●●●●●●●●●●●●●●●●●●●●●
●●●●●●●●●●●●●●●●●●●●●●●●●●●●●●●●●●●●●●●●●●●●●●●●●●●●●●●●●●●●●●●●●●●●●●●●●●●●●●●●●●●●●●●●●●●●●●●●●●●●●●●●●●●●●●●●●●●●●●●●●●●●●●●●●●●●●●●●●●●●●●●●●●●●●●●●●●●●●●●●●●●●●●●●●●●●●●●●●●●●●●●●●●●●●●●●●●●●●●●●●●●●●●●●●●●●●●●●●●●●●●●●●●●●●●●●●●●●●●●●●●●●●●●●●●●●●●●●●●●●●●●●●●●●●●●●●●●●●●●●●●●●●●●●●●●●●●●●●●●●●●●●●●●●●●●●●●●●●●●●●●●●●●●●●●●●●●●●●●●●●●●●●●●●●●●●●●●●●●●●●●●●●●●●●●●●●●●●●●●●●●●●●●●●●●●●●●●●●●●●●●●●●●●●●●●●●●●●●●●●●●●●●●●●●●●●●●●●●●●●●●●●●●●●●●●●●●●●●●●●●●●●●●●●●●●●●●●●●●●●●●●●●●●●●●●●●●●●●●●●●●●●●●●●●●●●●●●●●●●●●●●●●●●●●●●●●●●●●●●●●●●●●●●●●●●●●●●●●●●●●●●●●●●●●●●●●●●●●●●●●●●●●●●●●●●●●●●●●●●●●●●●●●●●●●●●●●●●●●●●●●●●●●●●●●●●●●●●●●●●●●●●●●●●●●●●●●●●●●●●●●●●●●●●●●●●
●●●●●●●●●●●●●●●●●●●●●●●●●●●●●●●●●●●●●●●●●●●●●●●●●●●●●●●●●●●●●●●●●●●●●●●●●●●●●●●●●●●●●●●●●●●●●●●●
●●●●●●●●●●●●●●●●●●●●●●●●●●●●●●●●●●●●●●●●●●●●●●●●
●●●●●●●●●●●●●●●●●●●●●●●●●●●●●●●●●●●●●●●●●●●●●●●● ●●●●●●●●●●●●●●●●●●●●●●●●●●●●●●●●●●●●●●●●●●●●●●●●●●●●●●●●●●●●●●●●●●●●●●●●●●●●●●●●●●●●●●●●●●●●●●●● ●●●●●●●●●●●●●●●●●●●●●●●●●●●●●●●●●●●●●●●●●●●●●●●●●●●●●●●●●●●●●●●●●●●●●●●●●●●●●●●●●●●●●●●●●●●●●●●●●●●●●●●●●●●●●●●●●●●●●●●●●●●●●●●●●●●●●●●●●●●●●●●●●●●●●●●●●●●●●●●●●●●●●●●●●●●●●●●●●●●●●●●●●●●●●●●●●●●●●●●●●●●●●●●●●●●●●●
●●●●●●●●●●●●●●●●●●●●●●●●●●●●●●●●●●●●●●●●●●●●●●●●●●●●●●●●●●●●●●●●●●●●●●●●●●●●●●●●●●●●●●●●●●●●●●●●●●●●●●●●●●●●●●●●●●●●●●●●●●●●●●●●●●●●●●●●●●●●●●●●●●●●●●●●●●●●●●●●●●●●●●●●●●
●●●●●●●●●●●●●●●●●●●●●●●●●●●●●●●●●●●●●●●●●●●●●●●●●●●●●●●●●●●●●●●●●●●●●●●●●●●●●●●●●●●●●●●●●●●●●●●●●●●●●●●●●●●●●●●●●●●●●●●●●●●●●●●●●●●●●●●●●●●●●●●●●●●●●●●●●●●●●●●●●●●●●●●●●●●●●●●●●●●●●●●●●●●●●●●●●●●●●●●●●●●●●●●●●●●●●●●●●●●●●●●●●●●●●●●●●●●●●●●●●●●●●●●●●●●●●●●●●●●●●●●●●●●●●●●●●●●●●●●●●●●●●●●●●●●●●●●●●●●●●●●●●●●●●●●●●●●●●●●●●●●●●●●●●●●●●●●●
14
16
18
20
22VE 5:1
20
22
24
26 VE 5:1
●●●●●●●●●●●●●●●●●●●●●●●●●●●●●●●●●●●●●●●●●●●●●●●●●●●●●●●●●●●●●●●●●●●●●●●●●●●●●●●●●●●●●●●●●●●●●●●●●●●●●●●●●●●●●●●●●●●●●●●●●●●●●●●●●●●●●●●●●●●●●●●●●●●●●●●●●●●●●●●●●●●●●●●●●●●●●●●●●●●●●●●●●●●●●●●●●●●●●●●●●●●●●●●●●●●●●●●●●●●●●●●●●●●●●●●●●●●●●●●●●●●●●●●●●●●●●●●●●●●●●●●●●●●●●●●●●●●●●●●●●●●●●●●●●●●●●●●●●●●●●●●●●●●●●●●●●●●●●●●●●●●●●●●●●●●●●●●●
●●●●●●●●●●●●●●●●●●●●●●●●●●●●●●●●●●●●●●●●●●●●●●●● ●●●●●●●●●●●●●●●●●●●●●●●●●●●●●●●●●●●●●●●●●●●●●●●●
●●●●●●●●●●●●●●●●●●●●●●●●●●●●●●●●●●●●●●●●●●●●●●●●
B
C
SE
SE NW
NW
0 10 20 30 40 50
0 10 20 30 40
DISTANCE, IN KILOMETERS
DISTANCE, IN KILOMETERS
SANANDREASFAULT
HAYWARD
Moho
0
10
20
30
0 10 20 30
40
Verticalbased onseismicity
Constrained
Con
stra
ined
Verticalbased onseismicityM≥2.01985-1995
Projectedor hypothesizedfaults
Upper Mantle
❍❍❍❍❍❍❍
❍❍❍
❍❍❍❍❍❍❍❍
❍❍
❍❍
❍
❍❍
❍❍❍❍❍❍
❍❍❍
❍
❍❍❍
❍
?
?
●
●
●●●●
●
●
●
●●
●●●
●●●●●●●●●●●●●
●●●
●●●●●●●●●
●●●●●●●●●●●
●
●●●●●●●
●●●●●●●●
●●●●●●●●●●●●●●●●●●
●●
●●●●
●●●
●
●
●●
●●
●
●●●●
●● ●●●
●●●●
●
●
●●●●●●
5.0 km/s
6.2 km/s6.35 km/s
6.6 km/s7.3 km/s
8.0 km/s
FAULT
A
DISTANCE, IN KILOMETERS
DE
PT
H,I
NK
ILO
ME
TE
RS
DE
PT
H,I
NK
ILO
ME
TE
RS
DE
PT
H,I
NK
ILO
ME
TE
RS
Figure 19.—Refl ection modeling of the San Andreas and Hayward Faults. A, Cross-sectional view. Earthquake hypocenters show that faults are near vertical in uppermost ~12 km of crust. Red fault planes, depth extent that refl ections from them are modeled; dashed lines, projected and conjectural relation between the two faults in upper mantle. B, Subsurface refl ection-depth-point coverage on the San Andreas Fault, projected onto two-dimensional plane associated with segments identifi ed in fi gure 1. C, Subsurface refl ection-depth-point coverage on the Hayward Fault. Points represent only 37 modeled gathers; complete data coverage is more continuous. Three-dimensional model planes have a constant dip but bend where vertical parts of faults bend.
A Review of Faults and Crustal Structure in the San Francisco Bay Area
144 Crustal Structure of the Coastal and Marine San Francisco Bay Region, California
situations. Discussions with Kevin Furlong, Bob Jachens, Art Lachenbruch, Ben Page, and George Thompson helped to guide our thinking. Guy Cochrane, Alan Cooper, and Eric Geist reviewed the manuscript, which was edited by George Havach.
References CitedAddicott, W.O., 1969, Late Pliocene mollusks from San Francisco
Peninsula, California, and their paleogeographic signifi cance: California Academy of Sciences Proceedings, ser. 4, v. 37, no. 3, p. 57–93.
Bakun, W.H., 1999, Seismic activity of the San Francisco Bay region: Seismological Society of America Bulletin, v. 89, no. 3, p. 764–784.
Beaudoin, B.C., 1994, Lower-crustal deformation during terrane dis-persion along strike-slip faults: Tectonophysics, v. 232, no. 1–4, p. 257–266.
Blake, M.C., Jr., 1984, Franciscan geology of northern California: Society of Economic Paleontologists and Mineralogists, Pacifi c Section Field Trip Guidebook, v. 43, 254 p.
Bohannon, R.G., and Parsons, Tom, 1995, Tectonic implications of post-30 Ma Pacifi c and North American relative plate motions: Geological Society of America Bulletin, v. 107, no. 8, p. 937–959.
Brabb, E.E., and Pampeyan, E.H., compilers, 1983, Geologic map of San Mateo County, California: U.S. Geological Survey Miscel-laneous Investigations Series Map I–1257–A, scale 1:62,500.
Brocher, T. M., McCarthy, Jill, Hart, P.E., Holbrook, W.S., Furlong, K.P., McEvilly, T.V., Hole, J.A., and Klemperer, S.L., 1994, Seismic evidence for a lower-crustal detachment beneath San Fran-cisco Bay, California: Science, v. 265, no. 5177, p. 1436–1439.
Brocher, T.M., and Moses, M.J., 1993, Onshore-offshore wide-angle seismic recordings of the San Francisco Bay area seismic imaging experiment (BASIX); the fi ve-day recorder data, U.S. Geological Survey Open-File Report 93–276, 89 p.
Brocher, T.M., and Pope, D.C., 1994, Onshore-offshore wide-angle seismic recordings of the San Francisco Bay Area seismic imaging experiment (BASIX); data from the Northern California Seismic Network: U.S. Geological Survey Open-File Report 94–156, 123 p.
Brown, L.D., Wille, C.E., Zheng, Li, de Voogd, Beatrice, Mayer, J.R., Hearn, T.M., Sanford, W.E., Caruso, C.W., Zhu, T.F., Nelson, D.K., Potter, C.J., Hauser, E.C., Klemperer, S.L., Kaufman, Sidney, and Oliver J.E., 1987, COCORP; new perspectives on the deep crust: Royal Astronomical Society Geophysical Jour-nal, v. 89, no. 1, p. 47–54.
Bürgmann, Roland, 1997, Active detachment faulting in the San Fran-cisco Bay area?: Geology, v. 25, no. 12, p. 1135–1138.
Catchings, R.D., and Kohler, W.M., 1996, Refl ected seismic waves and their effect on strong shaking during the 1989 Loma Prieta, California, earthquake: Seismological Society of America Bul-letin, v. 86, no. 5, p. 1401–1416.
Cummings, J.C., 1968, The Santa Clara Formation and possible post-Pliocene slip on the San Andreas fault in central California, in Dickinson, W.R., and Grantz, Art, eds., Proceedings of the conference on geologic problems of the San Andreas fault system: Stanford, Calif., Stanford University Publications in Geological Sciences, v. 11, p. 191–207.
DeMets, Charles, Gordon, R.G., Argus, D.F., and Stein, Seth, 1990, Cur-
rent plate motions: Geophysical Journal International, v. 101, no. 2, p. 425–478.
Dewey, J.W., Hill, D.P., Ellsworth, W.L., and Engdahl, E.R., 1989, Earthquakes, faults, and the seismotectonic framework of the contiguous United States, in Pakiser, L.C., and Mooney, W.D., eds., Geophysical framework of the continental United States: Geological Society of America Memoir 172, p. 541–576.
Fountain, D.M., Hurich, C.A., and Smithson, S.B., 1984, Seismic refl ec-tivity of mylonite zones in the crust: Geology, v. 12, no. 4, p. 195–198.
Furlong, K.P. 1993, Thermal-rheologic evolution of the upper mantle and the development of the San Andreas fault system: Tecto-nophysics, v. 223, no. 1–2, p. 149–164.
Furlong, K.P., Hugo, W.D., and Zandt, George, 1989, Geometry and evolution of the San Andreas fault zone in northern California: Journal of Geophysical Research, v. 94, no. B3, p. 3100–3110.
Hall, N.T., 1984, Holocene history of the San Andreas fault between Crystal Strings Reservoir and San Andreas Dam, San Mateo County, California: of the Seismological Society of America Bulletin, v. 74, no. 1, p. 281–299.
Hall, N.T., and Wright, R.H., 1993, Paleoseismic investigations of the San Andreas Fault on the San Francisco Peninsula, Califor-nia: fi nal technical report to U.S. Geological Survey, National Earthquake Hazards Reduction Program, 15 p.
Hall, N.T., Wright, R.H., Clahan, K.B., 1996, Paleoseismic investiga-tions of the San Andreas fault on the San Francisco Peninsula, California: Reston, Va., U.S. Geological Survey, National Earth-quake Hazards Reduction Program Final Technical Report 14–08–0001–G2081, 45 p.
Henstock, T.J., Levander, A.R., and Hole, J.A., 1997, Deformation in the lower crust of the San Andreas fault system in northern California: Science, v. 278, no. 5338, p. 650–653.
Hill, D.P., Eaton, J.P., and Jones, L.M., 1990, Seismicity, 1980–86, chap. 5 of Wallace, R.E., ed., The San Andreas fault system, California: U.S. Geological Survey Professional Paper 1515, p. 115–151.
Holbrook, W.S., Brocher, T.M., ten Brink, U.S., and Hole, J.A., 1996, Crustal structure of a transform plate boundary, San Francisco Bay and the central California continental margin: Journal of Geophysical Research, v. 101, no. B10, p. 22311–22334.
Hole, J.A., 1992, Nonlinear high-resolution three-dimensional seismic travel time tomography: Journal of Geophysical Research, v. 97, no. B5, p. 6553–6562.
Hole, J.A., Klemperer, S.L., Brocher, T.M., Parsons, Tom, Benz, H.M., and Furlong, K.P., 2000, Three-dimensional seismic velocity structure of the San Francisco Bay area: Journal of Geophysi-cal Research, v. 105, no. B6, p. 13859–13874.
Hole, J.A., and Zelt, B.C., 1995, 3-D fi nite-difference refl ection trav-eltimes: Geophysical Journal International, v. 121, no. 2, p. 427–434.
Jones, D.L., Graymer, R.W., Wang, Chi, McEvilly, T.V., and Lomax, Anthony, 1994, Neogene transpressive evolution of the Califor-nia Coast Ranges: Tectonics, v. 13, no. 3, p. 561–574.
Kelson, K.I., Lettis, W.R., and Lisowski, Michael, 1992, Distribution of geologic slip and creep along faults in the San Francisco Bay region, in Galehouse, J.S., ed., Programs and abstracts of the second conference on earthquake hazards in the eastern San Francisco Bay area: California Division of Mines and Geology Special Publication 113, p. 31–38.
Kern, Hartmut, and Wenk, H.-R., 1990, Fabric-related velocity anisot-ropy and shear wave splitting in rocks from the Santa Rosa mylonite zone, California: Journal of Geophysical Research, v.
145
95, no. B7, p. 11213–11223.King, N.E., Segall, Paul, and Prescott, W.H., 1987, Geodetic measure-
ments near Parkfi eld California, 1959–1984: Journal of Geo-physical Research, v. 92, no. B3, p. 2747–2766.
Kohler, W.M., and Catchings, R.D., 1994, Data report for the 1993 seis-mic refraction experiment in the San Francisco Bay area, Cali-fornia: U.S. Geological Survey Open-File Report 94–241, 71 p.
Krug, E.H., Cherven, V.B., Hatten, C.W., and Roth, J.C., 1992, Sub-surface structure in the Montezuma Hills, southwestern Sacramento Basin, in Cherven, V.B., and Edmondson, W.F., eds., Structural geology of the Sacramento Basin: American Association of Petroleum Geologists, Pacifi c Section Miscel-laneous Publication 41, p. 41–60.
Lisowski, Michael, Savage, J.C., and Prescott, W.H., 1991, The veloc-ity fi eld along the San Andreas fault in central and southern California: Journal of Geophysical Research, v. 96, no. B5, p. 8369–8389.
Marlow, M.S., Jachens, R.C., Hart, P.E., Carlson, P.R., Anima, R.J., and Childs, J.R., 1999, Development of San Leandro Synform and neotectonics of the San Francisco Bay Block, California: Marine and Petroleum Geology, v. 16, no. 5, p. 431–442.
McCarthy, Jill, and Hart, P.E., 1993, Data report for the 1991 Bay area seismic imaging experiment (BASIX): U.S. Geological Survey Open-File Report 93–301, 26 p.
McKevett, N.H., 1992, The Kirby Hills fault zone, in Cherven, V.B., and Edmondson, W.F., eds., Structural geology of the Sacramento Basin: American Association of Petroleum Geologists, Pacifi c Section Miscellaneous Publication 41, p. 61–78.
McLaughlin, R.J., Sliter, W.V., Sorg, D.H., Russell, P.C., and Sarna-Wojcicki, A.M., 1996, Large-scale right-slip displacement on the East San Francisco Bay region fault system, California; implications for location of late Miocene to Pliocene Pacifi c plate boundary: Tectonics, v. 15, no. 1, p. 1–18.
Murphy, J.M., Catchings, R.D., Kohler, W.M., Fuis, G.S., and Eberhart-Phillips, D.M., 1992, Data report for 1991 active-source seismic profi les in the San Francisco Bay area, California: U.S. Geo-logical Survey Open-File Report 92–570, 45 p.
Olson, J.A., and Lindh, A.G., 1985, Seismicity of the San Andreas Fault from Cienega Winery to the Golden Gate, in Shearer, C.F., ed., Minutes of the National Earthquake Prediction Evaluation Council, July 26–27, 1985, Menlo Park, California: U.S. Geologi-cal Survey Open-File Report 85–754, p. 316–324.
Olson, J.A., and Zoback, M.L., 1992, Seismic deformation patterns on the San Francisco peninsula [abs.]: Eos (American Geophysi-cal Union Transactions), v. 73, no. 43, supp., p. 401.
Page, B.M., 1992, Tectonic setting of the San Francisco Bay Region, in Galehouse, J.S., ed., Programs and abstracts of the second conference on earthquake hazards in the eastern San Fran-cisco Bay area: California Division of Mines and Geology Spe-cial Publication 113, p. 1–7.
Page, B.M., and Brocher, T.M., 1993, Thrusting of the central Califor-nia margin over the edge of the Pacifi c plate during the trans-form regime: Geology, v. 21, no. 7, p. 635–638.
Parsons, Tom, 1998, Seismic refl ection evidence that the Hayward fault extends into the lower crust of the San Francisco Bay area: Seismological Society of America Bulletin, v. 88, no. 5, p. 1212–1223.
Parsons, Tom, and Hart, P.E., 1999, Dipping San Andreas and Hay-ward faults revealed beneath San Francisco Bay, California:
Geology, v. 27, no. 9, p. 839–842.Parsons, Tom, and Zoback, M.L., 1997, Three dimensional upper
crustal velocity structure beneath San Francisco Peninsula, California: Journal of Geophysical Research, v. 102, no. B3, p. 5473–5490.
Reasenberg, P.A., and Simpson, R.W., 1992, Response of regional seismicity to the static stress change produced by the Loma Prieta earthquake: Science, v. 255, no. 5052, p. 1687–1690.
Ross, D.C., 1978, The Salinian Block; Mesozoic granite orphan in the California Coast Ranges, in Howell, D.G., and McDougall, K.A., eds., Mesozoic paleogeography of the Western United States (Pacifi c Coast Paleogeography Symposium 2): Los Angeles, Society of Economic Paleontologists and Mineralogists, Pacifi c Section, p. 509–522.
Sanders, C.O., 1990, Earthquake depths and the relation to strain accumulation and stress near strike-slip faults in southern California: Journal of Geophysical Research, v. 95, no. B4, p. 4751–4762.
Siegesmund, Sigfried, Fritzsche, Michael, and Braun, Günther, 1991, Refl ectivity caused by texture-induced anisotropy in mylonites, in Meissner, R.O., Brown, L.D., Dürbaum, H.-J., Franke, Wolfgang, Fuchs, Karl, and Seifert, Friedrich, eds., Continental lithosphere; deep seismic refl ections (Geodynam-ics Series, v. 22): Washington D.C., American Geophysical Union, p. 291–298.
Stanley, W.D., Benz, H.M., Walters, M.A., Villaseñor, Antonio, and Rodriguez, B.D., 1998, Tectonic controls on magmatism in The Geysers-Clear Lake region; evidence from new geophysical models: Geological Society of America Bulletin, v. 110, no. 9, p. 1193–1207.
Stein, R.S., and Lisowski, Michael, 1983, The 1979 Homestead Valley earthquake sequence, California; control of aftershocks and postseismic deformation: Journal of Geophysical Research, v. 88, no. B8, p. 6477–6490.
Taylor, C.L., Cummings, J.C., and Ridley, A.P., 1980, Discontinuous en echelon faulting and ground warping, Portola Valley, Califor-nia, in Streitz, Robert, and Sherburne, R.W., eds., Studies of the San Andreas fault zone in northern California: California Divi-sion of Mines and Geology Special Report 140, p. 59–70.
Thatcher, Wayne, 1975, Strain accumulation and release mechanism of the 1906 San Francisco earthquake: Journal of Geophysical Research, v. 80, no. 35, p. 4862–4872.
Thurber, C.H., 1993, Local earthquake tomography; velocities and Vp/Vs—theory, in Iyer, H.M., and Hirahara, Kazuro, eds., Seismic tomography; theory and practice: London, Chapman and Hall, p. 663–683.
Vidale, J.E., 1990, Finite-difference calculation of traveltimes in three dimensions: Geophysics, v. 55, no. 5, p. 521–526.
Wakabayashi, John, and Moores, E.M., 1988, Evidence for collision of the Salinian block with the Franciscan subduction zone, Cali-fornia: Journal of Geology, v. 96, no. 2, p. 245–253.
Wang, Chi, Okaya, D.A., Ruppert, Charles, Davis, G.A., Guo, Tieshuan, Zhong, Zengqui, and Wenk, H.-R., 1989, Seismic refl ectivity of the Whipple Mountain shear zone in southern California: Jour-nal of Geophysical Research, v. 94, no. B3, p. 2989–3005.
Zoback, M.L., Jachens, R.C., and Olson, J.A., 1999, Abrupt along-strike change in tectonic style; San Andreas fault zone, San Francisco Peninsula: Journal of Geophysical Research, v. 104, no. B5, p. 10719–10742.
A Review of Faults and Crustal Structure in the San Francisco Bay Area