A question of scales: studying Neolithic subsistence using micro CT scanning of midden deposits
10
A question of scales: studying Neolithic subsistence using micro CT scanning of midden deposits D.J. Huisman a, b, * , D. Ngan-Tillard c , M.A. Tensen a , F.J. Laarman a , D.C.M. Raemaekers d a Cultural Heritage Agency of the Netherlands, P.O. Box 1600, 3800 BP Amersfoort, The Netherlands b Leiden University, Faculty of Archaeology, Leiden, The Netherlands c Delft Technical University, Faculty of Civil Engineering and Geosciences, GeoEngineering Section, The Netherlands d University of Groningen, Groningen Institute of Archaeology, The Netherlands article info Article history: Received 19 December 2013 Received in revised form 7 May 2014 Accepted 11 May 2014 Available online xxx Keywords: Microarchaeology Micromorphology Microstratigraphy Fish bones Phytoliths Coprolites Taphonomy abstract We tested whether micro CT scanning could be used to study phytoliths and bone fragments on samples from a Middle Neolithic midden deposit from Swifterbant (The Netherlands). We scanned an untreated block sample, and an impregnated sample that was used to make a thin section of. Ample small bones or bone fragments could be discerned and identified e most of them from fish e although sieving showed that many went undetected. It was possible, however, to identify several deposition events within a few cm of stratigraphy, and distinguish deposits with cleaning refuse from bones that were discarded during or after meals. Bone fragments embedded in coprolitic material represented the ingested and excreted bone fragments. Moreover, it proved to be possible to identify articulated bones or bone fragments that would become separated and unidentifiable during sieving and to recognize specific decay patterns. Silica phytoliths could be discerned, but the resolution was not enough to use it for species identification. Overall, the greatest advantage of microCT scanning of undisturbed samples form archaeological sites seem to lie in non-destructively providing context and taphonomical information on which further sample treatment and analyses e including microsampling and micromorphology e can be based. © 2014 Elsevier Ltd. All rights reserved. 1. Introduction Neolithic sites on the banks of a former creek system in the Swifterbant area (the Netherlands) e 14 C dated between 4300 and 4000 cal. BC e commonly consist of deposits of dark, artefact- and refuse-rich material up to a metre thick (Lanting and van der Plicht, 1999/2000; Raemaekers, 1999; de Roever, 2004). Exceptionally good preservation of materials and the microstratigraphy made it possible to study sequences of human activities and natural events in detail. A microstratigraphical approach using high-density sampling micromorphology e similar to the approach by Shillito et al. (2011a) e on one of the sites (S4) showed evidence for many instances of refuse dumping and several phases of natural clay sedimentation, interspersed with phases of soil tillage (Huisman et al., 2009; Huisman and Raemaekers, in press). The dark deposits were found to consist mostly of phytoliths and carbonized materials, and to contain large amounts of charcoal, bone fragments and carnivore or omnivore coprolites. It is most likely that these deposits represent middens where refuse was dumped together with grass-like plant material (grass, reeds or straw; possibly bedding) and burned or left to decay in situ (Huisman et al., 2009; Huisman and Raemaekers, in press). Despite the large amount of information that was derived from detailed micromorphological investigations in Swifterbant, the method is limited by its two-dimensional nature. Random cross- sections through phytoliths and bones prevent proper species identification. Normally such identification is done by sampling and fine-mesh sieving (for bones) or elaborate sample preparation (for phytoliths). This has several disadvantages that up till now could not be overcome. Firstly, spatial relations are lost in sieving and/or processing. This results in the mixing of multiple layers, and therefore multiple events, in finely layered deposits. Articulated or in situ fragmented material will become separated, which may hinder identification. Secondly, even if a small mesh size is chosen e e.g. 2 mm e some identifiable bone fragments will still be too small to be recovered. They are therefore systematically overlooked. Finally, linking results with micromorphological * Corresponding author. Cultural Heritage Agency of the Netherlands, P.O. Box 1600, 3800 BP Amersfoort, The Netherlands. E-mail address: [email protected] (D. Huisman). Contents lists available at ScienceDirect Journal of Archaeological Science journal homepage: http://www.elsevier.com/locate/jas http://dx.doi.org/10.1016/j.jas.2014.05.006 0305-4403/© 2014 Elsevier Ltd. All rights reserved. Journal of Archaeological Science xxx (2014) 1e10 Please cite this article in press as: Huisman, D.J., et al., A question of scales: studying Neolithic subsistence using micro CT scanning of midden deposits, Journal of Archaeological Science (2014), http://dx.doi.org/10.1016/j.jas.2014.05.006
-
Upload
cultureelerfgoed -
Category
Documents
-
view
1 -
download
0
Transcript of A question of scales: studying Neolithic subsistence using micro CT scanning of midden deposits
lable at ScienceDirect
Journal of Archaeological Science xxx (2014) 1e10
Contents lists avai
Journal of Archaeological Science
journal homepage: http : / /www.elsevier .com/locate/ jas
A question of scales: studying Neolithic subsistence using micro CTscanning of midden deposits
D.J. Huisman a, b, *, D. Ngan-Tillard c, M.A. Tensen a, F.J. Laarman a, D.C.M. Raemaekers d
a Cultural Heritage Agency of the Netherlands, P.O. Box 1600, 3800 BP Amersfoort, The Netherlandsb Leiden University, Faculty of Archaeology, Leiden, The Netherlandsc Delft Technical University, Faculty of Civil Engineering and Geosciences, GeoEngineering Section, The Netherlandsd University of Groningen, Groningen Institute of Archaeology, The Netherlands
a r t i c l e i n f o
Article history:Received 19 December 2013Received in revised form7 May 2014Accepted 11 May 2014Available online xxx
Keywords:MicroarchaeologyMicromorphologyMicrostratigraphyFish bonesPhytolithsCoprolitesTaphonomy
* Corresponding author. Cultural Heritage Agency1600, 3800 BP Amersfoort, The Netherlands.
E-mail address: [email protected] (D
http://dx.doi.org/10.1016/j.jas.2014.05.0060305-4403/© 2014 Elsevier Ltd. All rights reserved.
Please cite this article in press as: Huisman,deposits, Journal of Archaeological Science (
a b s t r a c t
We tested whether micro CT scanning could be used to study phytoliths and bone fragments on samplesfrom a Middle Neolithic midden deposit from Swifterbant (The Netherlands). We scanned an untreatedblock sample, and an impregnated sample that was used to make a thin section of. Ample small bones orbone fragments could be discerned and identified e most of them from fish e although sieving showedthat many went undetected. It was possible, however, to identify several deposition events within a fewcm of stratigraphy, and distinguish deposits with cleaning refuse from bones that were discarded duringor after meals. Bone fragments embedded in coprolitic material represented the ingested and excretedbone fragments. Moreover, it proved to be possible to identify articulated bones or bone fragments thatwould become separated and unidentifiable during sieving and to recognize specific decay patterns.Silica phytoliths could be discerned, but the resolution was not enough to use it for species identification.Overall, the greatest advantage of microCT scanning of undisturbed samples form archaeological sitesseem to lie in non-destructively providing context and taphonomical information on which furthersample treatment and analyses e including microsampling and micromorphology e can be based.
© 2014 Elsevier Ltd. All rights reserved.
1. Introduction
Neolithic sites on the banks of a former creek system in theSwifterbant area (the Netherlands) e 14C dated between 4300 and4000 cal. BC e commonly consist of deposits of dark, artefact- andrefuse-rich material up to a metre thick (Lanting and van der Plicht,1999/2000; Raemaekers, 1999; de Roever, 2004). Exceptionallygood preservation of materials and the microstratigraphy made itpossible to study sequences of human activities and natural eventsin detail. A microstratigraphical approach using high-densitysampling micromorphology e similar to the approach by Shillitoet al. (2011a) e on one of the sites (S4) showed evidence formany instances of refuse dumping and several phases of naturalclay sedimentation, interspersed with phases of soil tillage(Huisman et al., 2009; Huisman and Raemaekers, in press). Thedark deposits were found to consist mostly of phytoliths and
of the Netherlands, P.O. Box
. Huisman).
D.J., et al., A question of scale2014), http://dx.doi.org/10.10
carbonized materials, and to contain large amounts of charcoal,bone fragments and carnivore or omnivore coprolites. It is mostlikely that these deposits represent middens where refuse wasdumped together with grass-like plant material (grass, reeds orstraw; possibly bedding) and burned or left to decay in situ(Huisman et al., 2009; Huisman and Raemaekers, in press).
Despite the large amount of information that was derived fromdetailed micromorphological investigations in Swifterbant, themethod is limited by its two-dimensional nature. Random cross-sections through phytoliths and bones prevent proper speciesidentification. Normally such identification is done by sampling andfine-mesh sieving (for bones) or elaborate sample preparation (forphytoliths). This has several disadvantages that up till now couldnot be overcome. Firstly, spatial relations are lost in sieving and/orprocessing. This results in the mixing of multiple layers, andtherefore multiple events, in finely layered deposits. Articulated orin situ fragmented material will become separated, which mayhinder identification. Secondly, even if a small mesh size is chosene e.g. 2 mm e some identifiable bone fragments will still betoo small to be recovered. They are therefore systematicallyoverlooked. Finally, linking results with micromorphological
s: studying Neolithic subsistence using micro CT scanning of midden16/j.jas.2014.05.006
D.J. Huisman et al. / Journal of Archaeological Science xxx (2014) 1e102
observations is not possible because the observations are done onseparate samples. As a result, there is either a lack of speciesidentification (in thin sections) or a lack of micro-context in othermethods of analysis.
These problems can be overcome to some extent by combiningmicromorphology withmicrosampling (e.g. Madella and Lancelotti,2010; Matthews, 2010; Shillito et al., 2011a) which entails takingsmall samples in the lab from micromorphology samples prior toimpregnation and thin section production. This method, however,still has the disadvantage that sampling precedes the thin sectionstudy (which gives the microstratigraphic and taphonomic infor-mation). Moreover, micro samples are too small to be useful for thestudy of small bones or bone fragments.
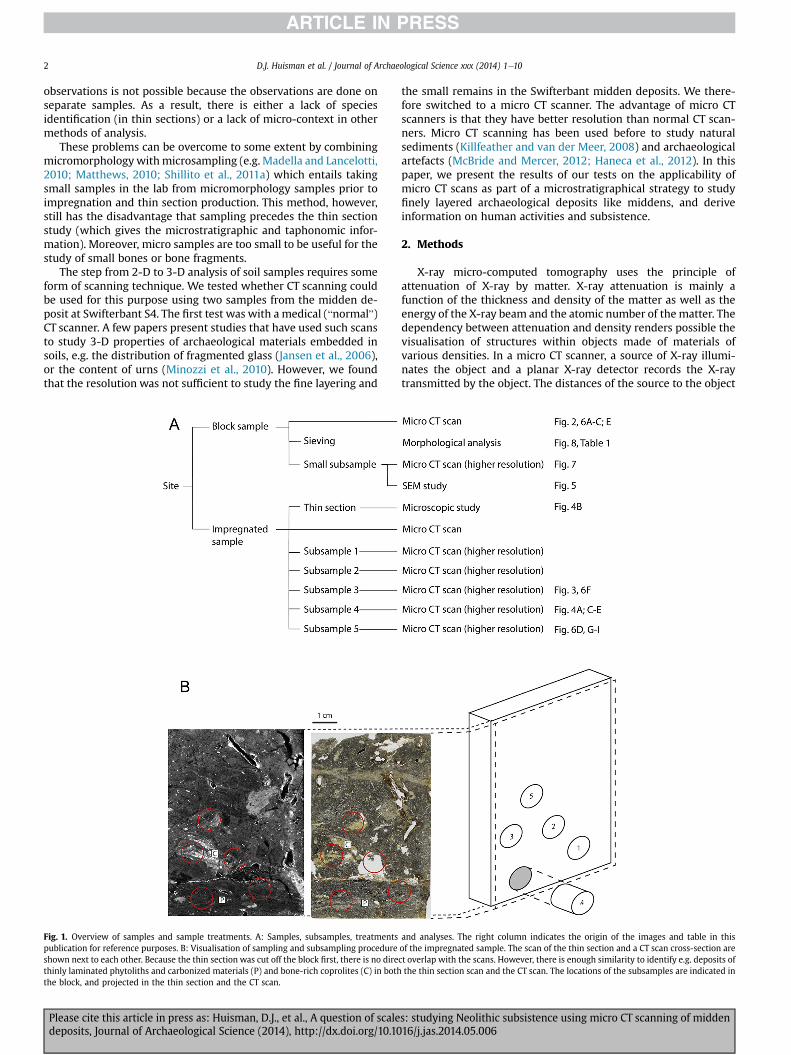
The step from 2-D to 3-D analysis of soil samples requires someform of scanning technique. We tested whether CT scanning couldbe used for this purpose using two samples from the midden de-posit at Swifterbant S4. The first test was with a medical (“normal”)CT scanner. A few papers present studies that have used such scansto study 3-D properties of archaeological materials embedded insoils, e.g. the distribution of fragmented glass (Jansen et al., 2006),or the content of urns (Minozzi et al., 2010). However, we foundthat the resolution was not sufficient to study the fine layering and
Fig. 1. Overview of samples and sample treatments. A: Samples, subsamples, treatmentspublication for reference purposes. B: Visualisation of sampling and subsampling procedureshown next to each other. Because the thin section was cut off the block first, there is no direthinly laminated phytoliths and carbonized materials (P) and bone-rich coprolites (C) in boththe block, and projected in the thin section and the CT scan.
Please cite this article in press as: Huisman, D.J., et al., A question of scaledeposits, Journal of Archaeological Science (2014), http://dx.doi.org/10.10
the small remains in the Swifterbant midden deposits. We there-fore switched to a micro CT scanner. The advantage of micro CTscanners is that they have better resolution than normal CT scan-ners. Micro CT scanning has been used before to study naturalsediments (Killfeather and van der Meer, 2008) and archaeologicalartefacts (McBride and Mercer, 2012; Haneca et al., 2012). In thispaper, we present the results of our tests on the applicability ofmicro CT scans as part of a microstratigraphical strategy to studyfinely layered archaeological deposits like middens, and deriveinformation on human activities and subsistence.
2. Methods
X-ray micro-computed tomography uses the principle ofattenuation of X-ray by matter. X-ray attenuation is mainly afunction of the thickness and density of the matter as well as theenergy of the X-ray beam and the atomic number of the matter. Thedependency between attenuation and density renders possible thevisualisation of structures within objects made of materials ofvarious densities. In a micro CT scanner, a source of X-ray illumi-nates the object and a planar X-ray detector records the X-raytransmitted by the object. The distances of the source to the object
and analyses. The right column indicates the origin of the images and table in thisof the impregnated sample. The scan of the thin section and a CT scan cross-section arect overlap with the scans. However, there is enough similarity to identify e.g. deposits ofthe thin section scan and the CT scan. The locations of the subsamples are indicated in
s: studying Neolithic subsistence using micro CT scanning of midden16/j.jas.2014.05.006
D.J. Huisman et al. / Journal of Archaeological Science xxx (2014) 1e10 3
and to the detector are adjusted to magnify the image of the objecton the detector. The object is rotated over 360� step by step and ateach step, an image is recorded. The images are then combined tore-construct the object in 3-D. One can scroll through cross-sections and interpolate cross-sections along different planes toinspect the internal structure of the object.
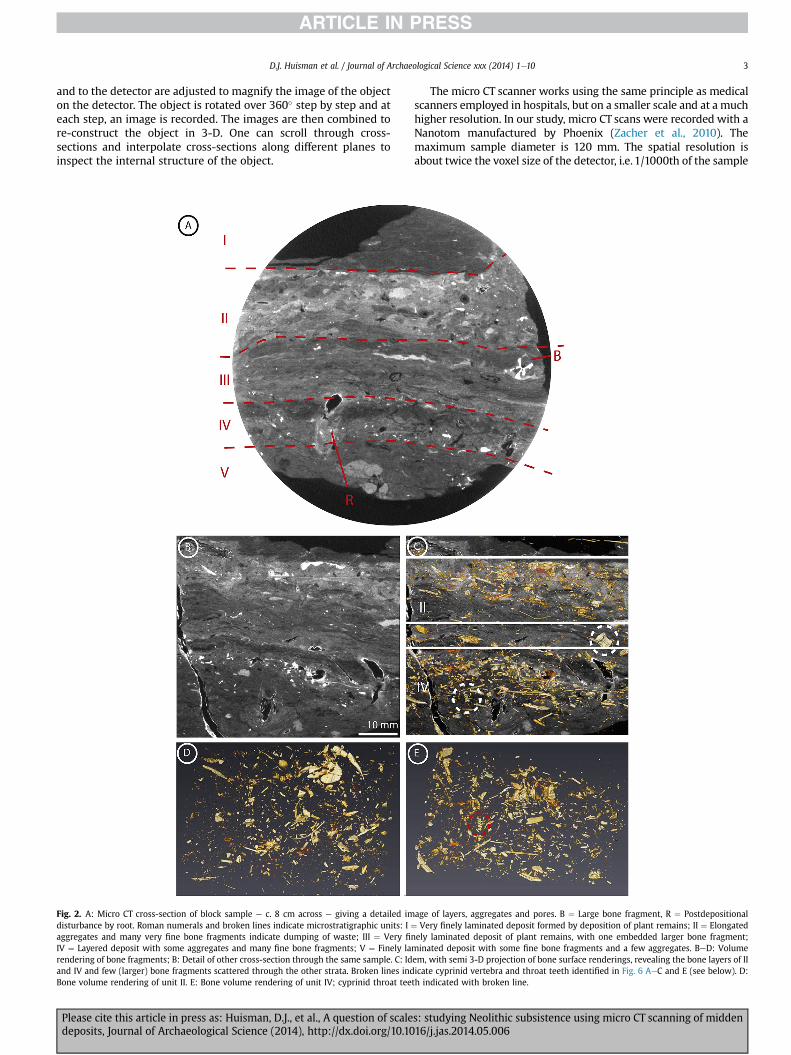
Fig. 2. A: Micro CT cross-section of block sample e c. 8 cm across e giving a detailed imdisturbance by root. Roman numerals and broken lines indicate microstratigraphic units: I ¼aggregates and many very fine bone fragments indicate dumping of waste; III ¼ Very finIV ¼ Layered deposit with some aggregates and many fine bone fragments; V ¼ Finely larendering of bone fragments; B: Detail of other cross-section through the same sample. C: Idand IV and few (larger) bone fragments scattered through the other strata. Broken lines indBone volume rendering of unit II. E: Bone volume rendering of unit IV; cyprinid throat tee
Please cite this article in press as: Huisman, D.J., et al., A question of scaledeposits, Journal of Archaeological Science (2014), http://dx.doi.org/10.10
The micro CT scanner works using the same principle as medicalscanners employed in hospitals, but on a smaller scale and at a muchhigher resolution. In our study, micro CT scans were recorded with aNanotom manufactured by Phoenix (Zacher et al., 2010). Themaximum sample diameter is 120 mm. The spatial resolution isabout twice the voxel size of the detector, i.e. 1/1000th of the sample
age of layers, aggregates and pores. B ¼ Large bone fragment, R ¼ PostdepositionalVery finely laminated deposit formed by deposition of plant remains; II ¼ Elongatedely laminated deposit of plant remains, with one embedded larger bone fragment;
minated deposit with some fine bone fragments and a few aggregates. BeD: Volumeem, with semi 3-D projection of bone surface renderings, revealing the bone layers of IIicate cyprinid vertebra and throat teeth identified in Fig. 6 AeC and E (see below). D:th indicated with broken line.
s: studying Neolithic subsistence using micro CT scanning of midden16/j.jas.2014.05.006
D.J. Huisman et al. / Journal of Archaeological Science xxx (2014) 1e104
width, except for extreme sample magnification when it is governedby the size of the beam spot, 0.9 mm for the Nanotom. Bright imageswith a high density contrast are obtained by tuning the energy of theX-ray beam. The X-ray beammust be strong enough to penetrate thesample without over-exposing the panel detector.
Our images have been processed with the AVIZO Fire software.They have been denoised using a median gaussian filter. Objectssuch as bones have been separated from their background bythresholding. Their surface has been represented by using con-strained smoothening surface rendering techniques. Volumerendering has been used to opacify some features and make otherstransparent. Insight on issues related to micro CT artefacts and theimage processing can be found in Tarplee et al. (2011). Scan timesdepended on angular increment, the number of stacks, imagesskipped and the duration of one record, but were usually c. 1 h long.
Two samples were used to test the method (see Fig. 1A for anoverview of the samples, subsamples and tests performed). Bothcame from the base of the midden deposits of Swifterbant S4. Onewas a c. 10 � 10 � 5 cm block sample that was taken during the2007 excavation and stored. This sample is referred to as the blocksample. A 2 mm fragment of the block sample was also scanned toexplore the limits of the micro CT scanner at imaging microstruc-tural details and to make images with a XL 30 Philips Environ-mental Scanning Electron Microscope (ESEM). After the scans werecompleted, the block sample was also subjected to the ‘traditional’analysis of determination based on morphology, by sieving over a1 mm sieve to extract bone fragments. Thus, we could test thepower and the limitations of the micro CT scan analysis bycomparing its results to those of morphological analysis of the samematerial. The fish bone elements in the sample were determinedmorphologically using the reference collection of the archae-ozoology laboratory at the Cultural Heritage Agency. For identifi-cation of the small bone elements, an Olympus SD30 stereomicroscope and a Zeiss Discovery V8 microscope were used. Pho-tographs were taken using a Zeiss Axiocam MRC5 camera on theZeiss Discovery V8 microscope. Several lightning regimes wereapplied (light from top, bottom and side or combinations) toenhance the level of visual information captured.
The second sample was taken during the 2005 excavation andimpregnated by KMS in Bennekom (NL) in order to make a thinsection for micromorphological analysis (thin section 1e2 inHuisman et al., 2009). We used the 8 � 5 � 1 cm impregnatedsample that was left after the thin sectionwasmade, which enableda direct comparison of the micromorphological observations in
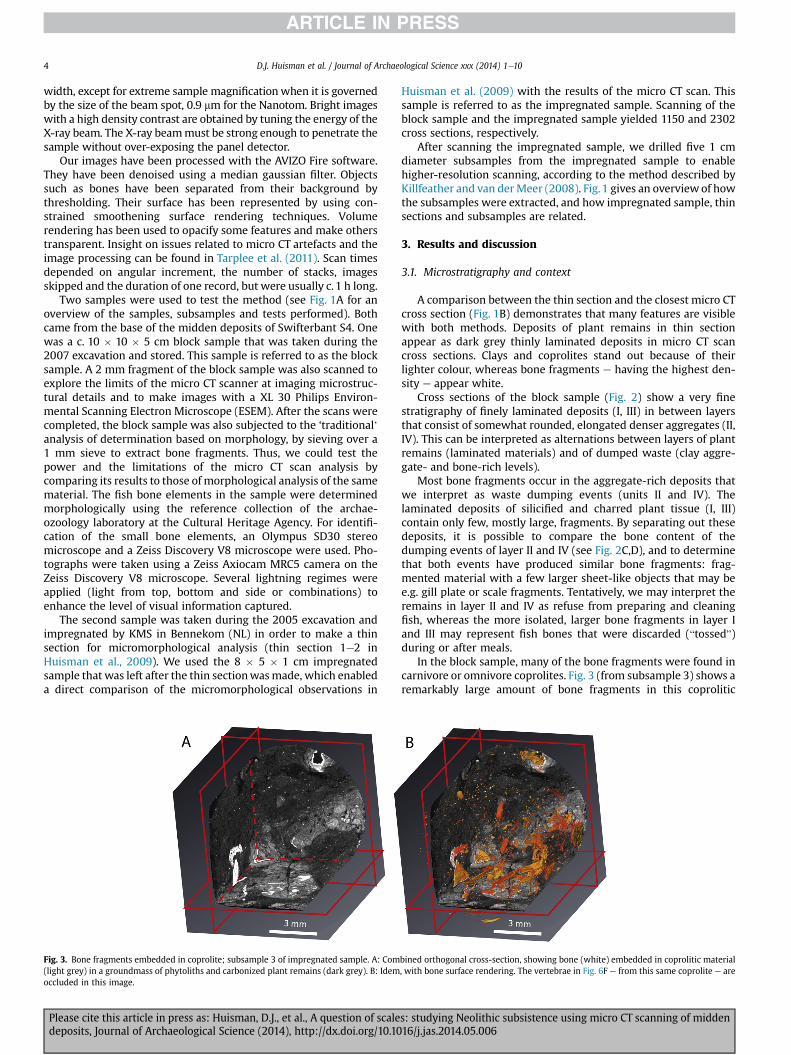
Fig. 3. Bone fragments embedded in coprolite; subsample 3 of impregnated sample. A: Com(light grey) in a groundmass of phytoliths and carbonized plant remains (dark grey). B: Idemoccluded in this image.
Please cite this article in press as: Huisman, D.J., et al., A question of scaledeposits, Journal of Archaeological Science (2014), http://dx.doi.org/10.10
Huisman et al. (2009) with the results of the micro CT scan. Thissample is referred to as the impregnated sample. Scanning of theblock sample and the impregnated sample yielded 1150 and 2302cross sections, respectively.
After scanning the impregnated sample, we drilled five 1 cmdiameter subsamples from the impregnated sample to enablehigher-resolution scanning, according to the method described byKillfeather and van derMeer (2008). Fig.1 gives an overview of howthe subsamples were extracted, and how impregnated sample, thinsections and subsamples are related.
3. Results and discussion
3.1. Microstratigraphy and context
A comparison between the thin section and the closest micro CTcross section (Fig. 1B) demonstrates that many features are visiblewith both methods. Deposits of plant remains in thin sectionappear as dark grey thinly laminated deposits in micro CT scancross sections. Clays and coprolites stand out because of theirlighter colour, whereas bone fragments e having the highest den-sity e appear white.
Cross sections of the block sample (Fig. 2) show a very finestratigraphy of finely laminated deposits (I, III) in between layersthat consist of somewhat rounded, elongated denser aggregates (II,IV). This can be interpreted as alternations between layers of plantremains (laminated materials) and of dumped waste (clay aggre-gate- and bone-rich levels).
Most bone fragments occur in the aggregate-rich deposits thatwe interpret as waste dumping events (units II and IV). Thelaminated deposits of silicified and charred plant tissue (I, III)contain only few, mostly large, fragments. By separating out thesedeposits, it is possible to compare the bone content of thedumping events of layer II and IV (see Fig. 2C,D), and to determinethat both events have produced similar bone fragments: frag-mented material with a few larger sheet-like objects that may bee.g. gill plate or scale fragments. Tentatively, we may interpret theremains in layer II and IV as refuse from preparing and cleaningfish, whereas the more isolated, larger bone fragments in layer Iand III may represent fish bones that were discarded (“tossed”)during or after meals.
In the block sample, many of the bone fragments were found incarnivore or omnivore coprolites. Fig. 3 (from subsample 3) shows aremarkably large amount of bone fragments in this coprolitic
bined orthogonal cross-section, showing bone (white) embedded in coprolitic material, with bone surface rendering. The vertebrae in Fig. 6F e from this same coprolite e are
s: studying Neolithic subsistence using micro CT scanning of midden16/j.jas.2014.05.006
D.J. Huisman et al. / Journal of Archaeological Science xxx (2014) 1e10 5
material. Such high contents of bone are often seen as an indicationthat the coprolites are from dogs. It has recently been shown bymolecular analysis, however, that theymay be from humans as well(Shillito et al., 2011b). Using micro CT scans on such coprolites, dietof humans and/or dogs can be assessed in a direct and non-destructive way. Maybe even more useful is the option to makesuch analyses on impregnated samples if coprolites or coprolitefragments are identified in thin sections.
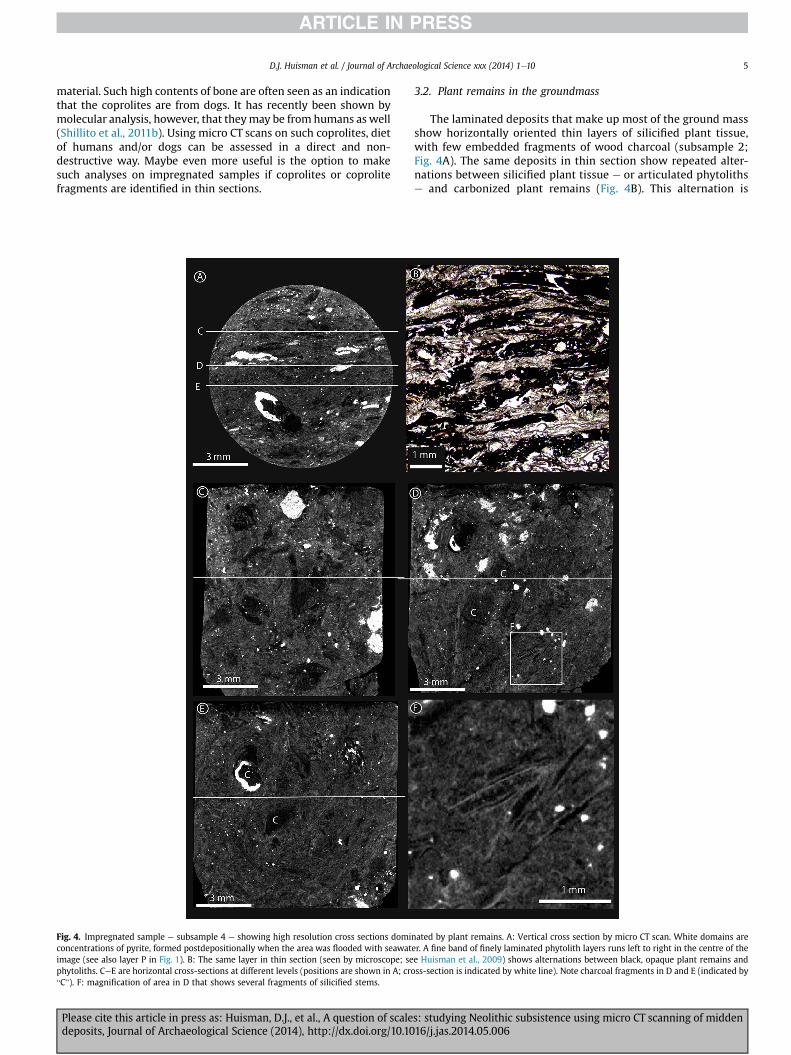
Fig. 4. Impregnated sample e subsample 4 e showing high resolution cross sections domiconcentrations of pyrite, formed postdepositionally when the area was flooded with seawatimage (see also layer P in Fig. 1). B: The same layer in thin section (seen by microscope; sephytoliths. CeE are horizontal cross-sections at different levels (positions are shown in A; cro“C”). F: magnification of area in D that shows several fragments of silicified stems.
Please cite this article in press as: Huisman, D.J., et al., A question of scaledeposits, Journal of Archaeological Science (2014), http://dx.doi.org/10.10
3.2. Plant remains in the groundmass
The laminated deposits that make up most of the ground massshow horizontally oriented thin layers of silicified plant tissue,with few embedded fragments of wood charcoal (subsample 2;Fig. 4A). The same deposits in thin section show repeated alter-nations between silicified plant tissue e or articulated phytolithse and carbonized plant remains (Fig. 4B). This alternation is
nated by plant remains. A: Vertical cross section by micro CT scan. White domains areer. A fine band of finely laminated phytolith layers runs left to right in the centre of thee Huisman et al., 2009) shows alternations between black, opaque plant remains andss-section is indicated by white line). Note charcoal fragments in D and E (indicated by
s: studying Neolithic subsistence using micro CT scanning of midden16/j.jas.2014.05.006
D.J. Huisman et al. / Journal of Archaeological Science xxx (2014) 1e106
barely visible on the micro CT scans of the resin-impregnatedsubcores. The carbonized remains are mostly hydrocarbons(Braadbaart and Poole, 2008) and therefore less dense than thesilicates of phytoliths of silicified plant tissue. That is why char-coal fragments are darker grey than the surrounding silicifiedplant tissue in micro CT (e.g. in Fig. 4D). The fragments that wereidentified micromorphologically as carbonized plant tissueapparently have the same density as the silicified plant tissuefragments, and are less similar to charred organic matter. Thisindicates that these dark fragments in thin sections may in factbe fragments of silicified plant tissue that also contain charredorganic material.
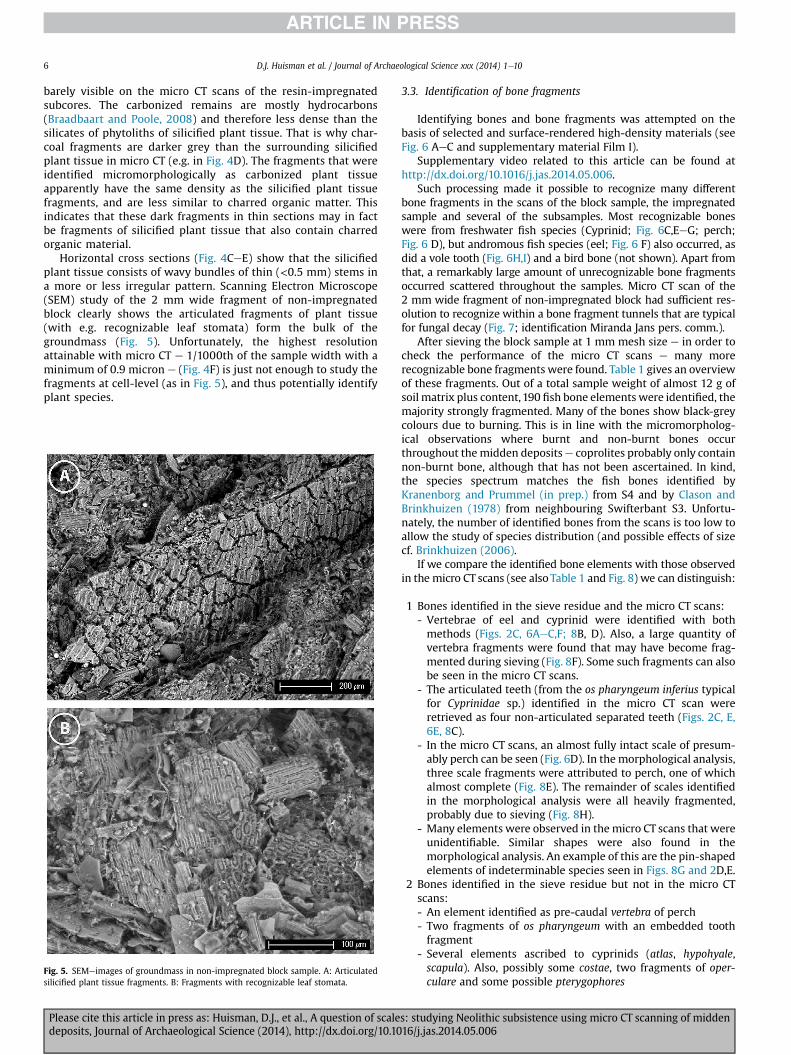
Horizontal cross sections (Fig. 4CeE) show that the silicifiedplant tissue consists of wavy bundles of thin (<0.5 mm) stems ina more or less irregular pattern. Scanning Electron Microscope(SEM) study of the 2 mm wide fragment of non-impregnatedblock clearly shows the articulated fragments of plant tissue(with e.g. recognizable leaf stomata) form the bulk of thegroundmass (Fig. 5). Unfortunately, the highest resolutionattainable with micro CT e 1/1000th of the sample width with aminimum of 0.9 micron e (Fig. 4F) is just not enough to study thefragments at cell-level (as in Fig. 5), and thus potentially identifyplant species.
Fig. 5. SEMeimages of groundmass in non-impregnated block sample. A: Articulatedsilicified plant tissue fragments. B: Fragments with recognizable leaf stomata.
Please cite this article in press as: Huisman, D.J., et al., A question of scaledeposits, Journal of Archaeological Science (2014), http://dx.doi.org/10.10
3.3. Identification of bone fragments
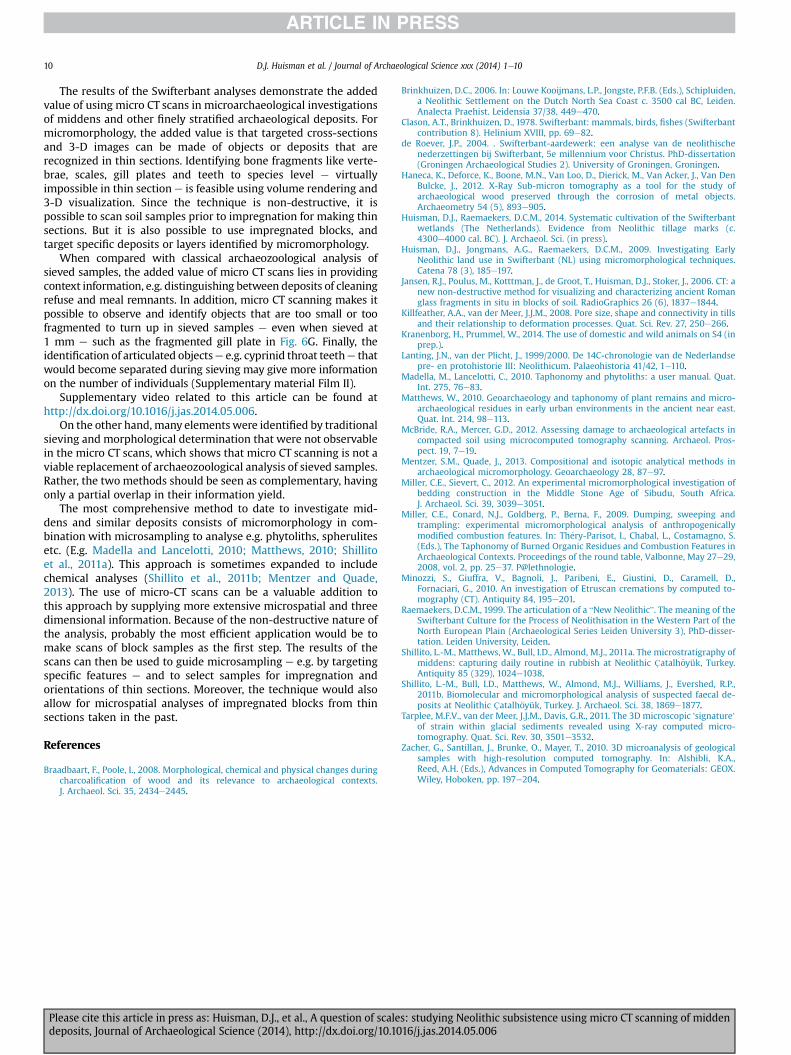
Identifying bones and bone fragments was attempted on thebasis of selected and surface-rendered high-density materials (seeFig. 6 AeC and supplementary material Film I).
Supplementary video related to this article can be found athttp://dx.doi.org/10.1016/j.jas.2014.05.006.
Such processing made it possible to recognize many differentbone fragments in the scans of the block sample, the impregnatedsample and several of the subsamples. Most recognizable boneswere from freshwater fish species (Cyprinid; Fig. 6C,EeG; perch;Fig. 6 D), but andromous fish species (eel; Fig. 6 F) also occurred, asdid a vole tooth (Fig. 6H,I) and a bird bone (not shown). Apart fromthat, a remarkably large amount of unrecognizable bone fragmentsoccurred scattered throughout the samples. Micro CT scan of the2 mm wide fragment of non-impregnated block had sufficient res-olution to recognize within a bone fragment tunnels that are typicalfor fungal decay (Fig. 7; identification Miranda Jans pers. comm.).
After sieving the block sample at 1 mm mesh size e in order tocheck the performance of the micro CT scans e many morerecognizable bone fragments were found. Table 1 gives an overviewof these fragments. Out of a total sample weight of almost 12 g ofsoil matrix plus content,190 fish bone elements were identified, themajority strongly fragmented. Many of the bones show black-greycolours due to burning. This is in line with the micromorpholog-ical observations where burnt and non-burnt bones occurthroughout the midden depositse coprolites probably only containnon-burnt bone, although that has not been ascertained. In kind,the species spectrum matches the fish bones identified byKranenborg and Prummel (in prep.) from S4 and by Clason andBrinkhuizen (1978) from neighbouring Swifterbant S3. Unfortu-nately, the number of identified bones from the scans is too low toallow the study of species distribution (and possible effects of sizecf. Brinkhuizen (2006).
If we compare the identified bone elements with those observedin the micro CT scans (see also Table 1 and Fig. 8) we can distinguish:
1 Bones identified in the sieve residue and the micro CT scans:- Vertebrae of eel and cyprinid were identified with bothmethods (Figs. 2C, 6AeC,F; 8B, D). Also, a large quantity ofvertebra fragments were found that may have become frag-mented during sieving (Fig. 8F). Some such fragments can alsobe seen in the micro CT scans.
- The articulated teeth (from the os pharyngeum inferius typicalfor Cyprinidae sp.) identified in the micro CT scan wereretrieved as four non-articulated separated teeth (Figs. 2C, E,6E, 8C).
- In the micro CT scans, an almost fully intact scale of presum-ably perch can be seen (Fig. 6D). In the morphological analysis,three scale fragments were attributed to perch, one of whichalmost complete (Fig. 8E). The remainder of scales identifiedin the morphological analysis were all heavily fragmented,probably due to sieving (Fig. 8H).
- Many elements were observed in themicro CT scans that wereunidentifiable. Similar shapes were also found in themorphological analysis. An example of this are the pin-shapedelements of indeterminable species seen in Figs. 8G and 2D,E.
2 Bones identified in the sieve residue but not in the micro CTscans:- An element identified as pre-caudal vertebra of perch- Two fragments of os pharyngeum with an embedded toothfragment
- Several elements ascribed to cyprinids (atlas, hypohyale,scapula). Also, possibly some costae, two fragments of oper-culare and some possible pterygophores
s: studying Neolithic subsistence using micro CT scanning of midden16/j.jas.2014.05.006
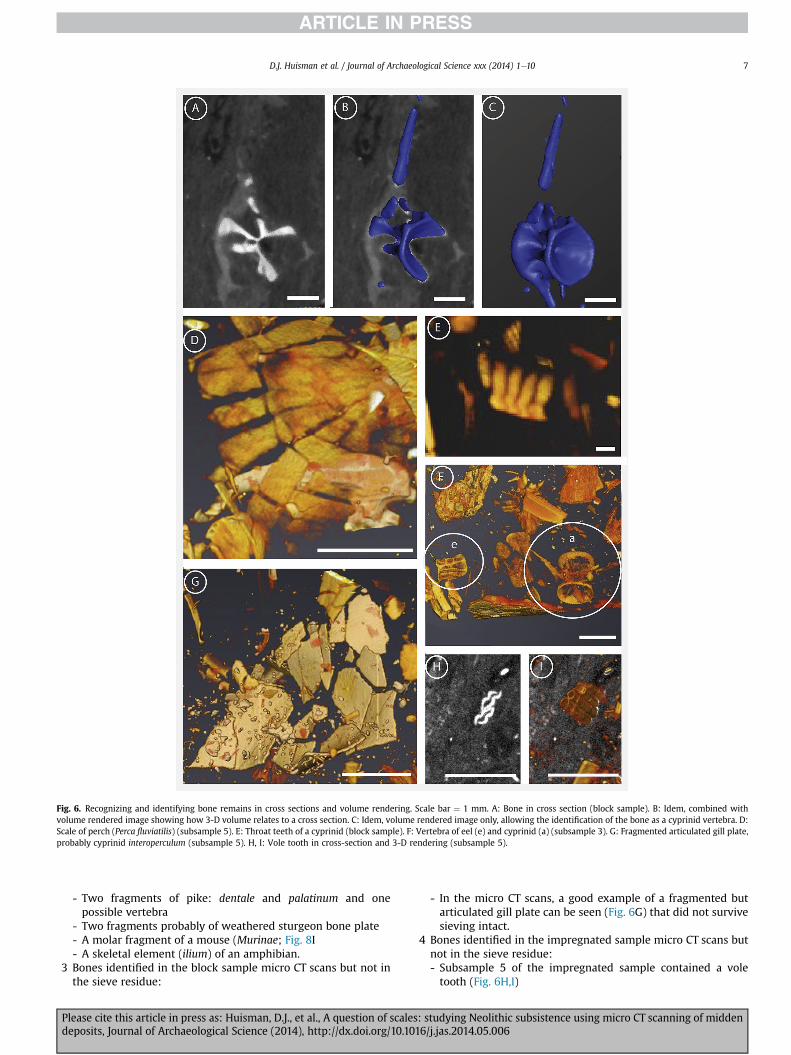
Fig. 6. Recognizing and identifying bone remains in cross sections and volume rendering. Scale bar ¼ 1 mm. A: Bone in cross section (block sample). B: Idem, combined withvolume rendered image showing how 3-D volume relates to a cross section. C: Idem, volume rendered image only, allowing the identification of the bone as a cyprinid vertebra. D:Scale of perch (Perca fluviatilis) (subsample 5). E: Throat teeth of a cyprinid (block sample). F: Vertebra of eel (e) and cyprinid (a) (subsample 3). G: Fragmented articulated gill plate,probably cyprinid interoperculum (subsample 5). H, I: Vole tooth in cross-section and 3-D rendering (subsample 5).
D.J. Huisman et al. / Journal of Archaeological Science xxx (2014) 1e10 7
- Two fragments of pike: dentale and palatinum and onepossible vertebra
- Two fragments probably of weathered sturgeon bone plate- A molar fragment of a mouse (Murinae; Fig. 8I- A skeletal element (ilium) of an amphibian.
3 Bones identified in the block sample micro CT scans but not inthe sieve residue:
Please cite this article in press as: Huisman, D.J., et al., A question of scaledeposits, Journal of Archaeological Science (2014), http://dx.doi.org/10.10
- In the micro CT scans, a good example of a fragmented butarticulated gill plate can be seen (Fig. 6G) that did not survivesieving intact.
4 Bones identified in the impregnated sample micro CT scans butnot in the sieve residue:- Subsample 5 of the impregnated sample contained a voletooth (Fig. 6H,I)
s: studying Neolithic subsistence using micro CT scanning of midden16/j.jas.2014.05.006
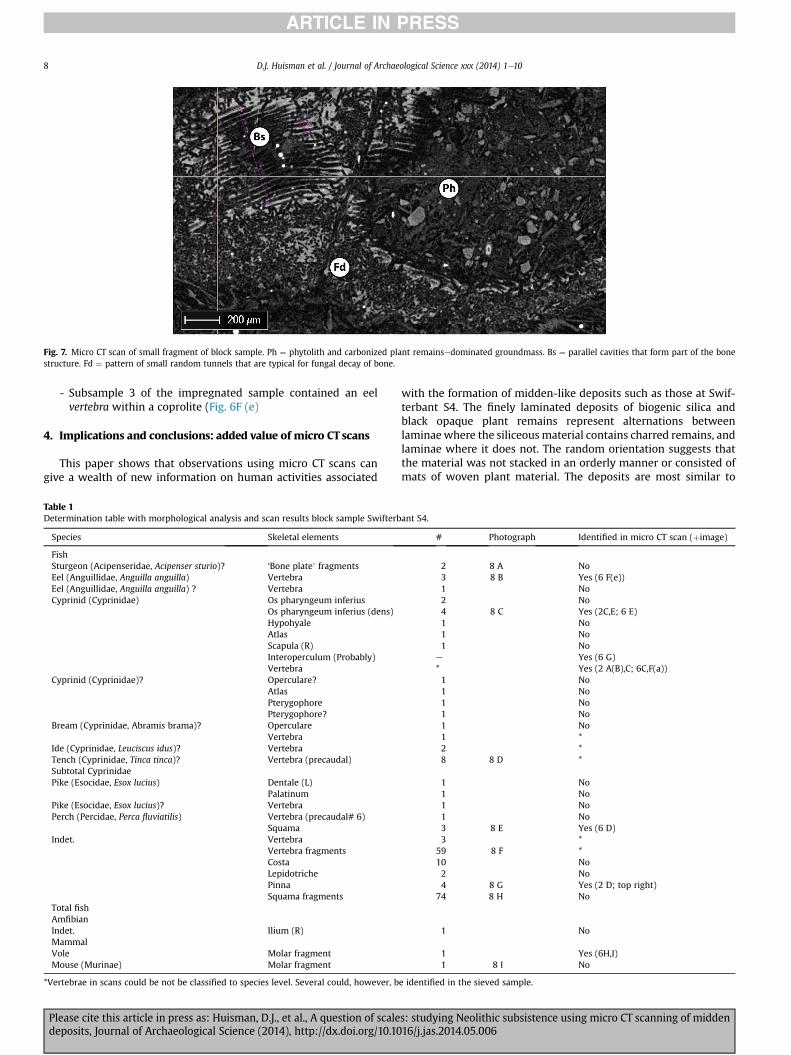
Fig. 7. Micro CT scan of small fragment of block sample. Ph ¼ phytolith and carbonized plant remainsedominated groundmass. Bs ¼ parallel cavities that form part of the bonestructure. Fd ¼ pattern of small random tunnels that are typical for fungal decay of bone.
D.J. Huisman et al. / Journal of Archaeological Science xxx (2014) 1e108
- Subsample 3 of the impregnated sample contained an eelvertebra within a coprolite (Fig. 6F (e)
4. Implications and conclusions: added value of micro CT scans
This paper shows that observations using micro CT scans cangive a wealth of new information on human activities associated
Table 1Determination table with morphological analysis and scan results block sample Swifterb
Species Skeletal elements
FishSturgeon (Acipenseridae, Acipenser sturio)? ‘Bone plate’ fragmentsEel (Anguillidae, Anguilla anguilla) VertebraEel (Anguillidae, Anguilla anguilla) ? VertebraCyprinid (Cyprinidae) Os pharyngeum inferius
Os pharyngeum inferius (dens)HypohyaleAtlasScapula (R)Interoperculum (Probably)Vertebra
Cyprinid (Cyprinidae)? Operculare?AtlasPterygophorePterygophore?
Bream (Cyprinidae, Abramis brama)? OperculareVertebra
Ide (Cyprinidae, Leuciscus idus)? VertebraTench (Cyprinidae, Tinca tinca)? Vertebra (precaudal)Subtotal CyprinidaePike (Esocidae, Esox lucius) Dentale (L)
PalatinumPike (Esocidae, Esox lucius)? VertebraPerch (Percidae, Perca fluviatilis) Vertebra (precaudal# 6)
SquamaIndet. Vertebra
Vertebra fragmentsCostaLepidotrichePinnaSquama fragments
Total fishAmfibianIndet. Ilium (R)MammalVole Molar fragmentMouse (Murinae) Molar fragment
*Vertebrae in scans could be not be classified to species level. Several could, however, b
Please cite this article in press as: Huisman, D.J., et al., A question of scaledeposits, Journal of Archaeological Science (2014), http://dx.doi.org/10.10
with the formation of midden-like deposits such as those at Swif-terbant S4. The finely laminated deposits of biogenic silica andblack opaque plant remains represent alternations betweenlaminaewhere the siliceousmaterial contains charred remains, andlaminae where it does not. The random orientation suggests thatthe material was not stacked in an orderly manner or consisted ofmats of woven plant material. The deposits are most similar to
ant S4.
# Photograph Identified in micro CT scan (þimage)
2 8 A No3 8 B Yes (6 F(e))1 No2 No4 8 C Yes (2C,E; 6 E)1 No1 No1 No
e Yes (6 G)* Yes (2 A(B),C; 6C,F(a))1 No1 No1 No1 No1 No1 *2 *8 8 D *
1 No1 No1 No1 No3 8 E Yes (6 D)3 *
59 8 F *10 No2 No4 8 G Yes (2 D; top right)
74 8 H No
1 No
1 Yes (6H,I)1 8 I No
e identified in the sieved sample.
s: studying Neolithic subsistence using micro CT scanning of midden16/j.jas.2014.05.006
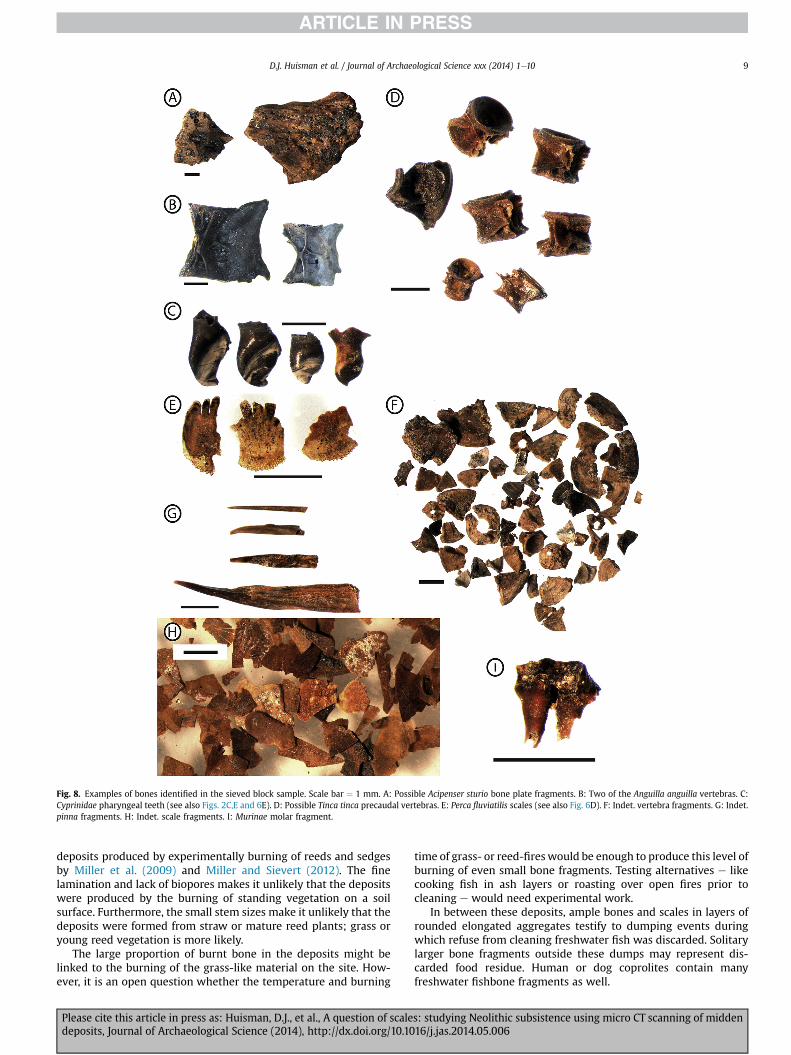
Fig. 8. Examples of bones identified in the sieved block sample. Scale bar ¼ 1 mm. A: Possible Acipenser sturio bone plate fragments. B: Two of the Anguilla anguilla vertebras. C:Cyprinidae pharyngeal teeth (see also Figs. 2C,E and 6E). D: Possible Tinca tinca precaudal vertebras. E: Perca fluviatilis scales (see also Fig. 6D). F: Indet. vertebra fragments. G: Indet.pinna fragments. H: Indet. scale fragments. I: Murinae molar fragment.
D.J. Huisman et al. / Journal of Archaeological Science xxx (2014) 1e10 9
deposits produced by experimentally burning of reeds and sedgesby Miller et al. (2009) and Miller and Sievert (2012). The finelamination and lack of biopores makes it unlikely that the depositswere produced by the burning of standing vegetation on a soilsurface. Furthermore, the small stem sizes make it unlikely that thedeposits were formed from straw or mature reed plants; grass oryoung reed vegetation is more likely.
The large proportion of burnt bone in the deposits might belinked to the burning of the grass-like material on the site. How-ever, it is an open question whether the temperature and burning
Please cite this article in press as: Huisman, D.J., et al., A question of scaledeposits, Journal of Archaeological Science (2014), http://dx.doi.org/10.10
time of grass- or reed-fireswould be enough to produce this level ofburning of even small bone fragments. Testing alternatives e likecooking fish in ash layers or roasting over open fires prior tocleaning e would need experimental work.
In between these deposits, ample bones and scales in layers ofrounded elongated aggregates testify to dumping events duringwhich refuse from cleaning freshwater fish was discarded. Solitarylarger bone fragments outside these dumps may represent dis-carded food residue. Human or dog coprolites contain manyfreshwater fishbone fragments as well.
s: studying Neolithic subsistence using micro CT scanning of midden16/j.jas.2014.05.006
D.J. Huisman et al. / Journal of Archaeological Science xxx (2014) 1e1010
The results of the Swifterbant analyses demonstrate the addedvalue of using micro CT scans in microarchaeological investigationsof middens and other finely stratified archaeological deposits. Formicromorphology, the added value is that targeted cross-sectionsand 3-D images can be made of objects or deposits that arerecognized in thin sections. Identifying bone fragments like verte-brae, scales, gill plates and teeth to species level e virtuallyimpossible in thin section e is feasible using volume rendering and3-D visualization. Since the technique is non-destructive, it ispossible to scan soil samples prior to impregnation for making thinsections. But it is also possible to use impregnated blocks, andtarget specific deposits or layers identified by micromorphology.
When compared with classical archaeozoological analysis ofsieved samples, the added value of micro CT scans lies in providingcontext information, e.g. distinguishing between deposits of cleaningrefuse and meal remnants. In addition, micro CT scanning makes itpossible to observe and identify objects that are too small or toofragmented to turn up in sieved samples e even when sieved at1 mm e such as the fragmented gill plate in Fig. 6G. Finally, theidentification of articulated objectse e.g. cyprinid throat teethe thatwould become separated during sieving may give more informationon the number of individuals (Supplementary material Film II).
Supplementary video related to this article can be found athttp://dx.doi.org/10.1016/j.jas.2014.05.006.
On the other hand, many elements were identified by traditionalsieving and morphological determination that were not observablein the micro CT scans, which shows that micro CT scanning is not aviable replacement of archaeozoological analysis of sieved samples.Rather, the two methods should be seen as complementary, havingonly a partial overlap in their information yield.
The most comprehensive method to date to investigate mid-dens and similar deposits consists of micromorphology in com-bination with microsampling to analyse e.g. phytoliths, spherulitesetc. (E.g. Madella and Lancelotti, 2010; Matthews, 2010; Shillitoet al., 2011a). This approach is sometimes expanded to includechemical analyses (Shillito et al., 2011b; Mentzer and Quade,2013). The use of micro-CT scans can be a valuable addition tothis approach by supplying more extensive microspatial and threedimensional information. Because of the non-destructive nature ofthe analysis, probably the most efficient application would be tomake scans of block samples as the first step. The results of thescans can then be used to guide microsampling e e.g. by targetingspecific features e and to select samples for impregnation andorientations of thin sections. Moreover, the technique would alsoallow for microspatial analyses of impregnated blocks from thinsections taken in the past.
References
Braadbaart, F., Poole, I., 2008. Morphological, chemical and physical changes duringcharcoalification of wood and its relevance to archaeological contexts.J. Archaeol. Sci. 35, 2434e2445.
Please cite this article in press as: Huisman, D.J., et al., A question of scaledeposits, Journal of Archaeological Science (2014), http://dx.doi.org/10.10
Brinkhuizen, D.C., 2006. In: Louwe Kooijmans, L.P., Jongste, P.F.B. (Eds.), Schipluiden,a Neolithic Settlement on the Dutch North Sea Coast c. 3500 cal BC, Leiden.Analecta Praehist. Leidensia 37/38, 449e470.
Clason, A.T., Brinkhuizen, D., 1978. Swifterbant: mammals, birds, fishes (Swifterbantcontribution 8). Helinium XVIII, pp. 69e82.
de Roever, J.P., 2004. . Swifterbant-aardewerk: een analyse van de neolithischenederzettingen bij Swifterbant, 5e millennium voor Christus. PhD-dissertation(Groningen Archaeological Studies 2). University of Groningen, Groningen.
Haneca, K., Deforce, K., Boone, M.N., Van Loo, D., Dierick, M., Van Acker, J., Van DenBulcke, J., 2012. X-Ray Sub-micron tomography as a tool for the study ofarchaeological wood preserved through the corrosion of metal objects.Archaeometry 54 (5), 893e905.
Huisman, D.J., Raemaekers, D.C.M., 2014. Systematic cultivation of the Swifterbantwetlands (The Netherlands). Evidence from Neolithic tillage marks (c.4300e4000 cal. BC). J. Archaeol. Sci. (in press).
Huisman, D.J., Jongmans, A.G., Raemaekers, D.C.M., 2009. Investigating EarlyNeolithic land use in Swifterbant (NL) using micromorphological techniques.Catena 78 (3), 185e197.
Jansen, R.J., Poulus, M., Kotttman, J., de Groot, T., Huisman, D.J., Stoker, J., 2006. CT: anew non-destructive method for visualizing and characterizing ancient Romanglass fragments in situ in blocks of soil. RadioGraphics 26 (6), 1837e1844.
Killfeather, A.A., van der Meer, J.J.M., 2008. Pore size, shape and connectivity in tillsand their relationship to deformation processes. Quat. Sci. Rev. 27, 250e266.
Kranenborg, H., Prummel, W., 2014. The use of domestic and wild animals on S4 (inprep.).
Lanting, J.N., van der Plicht, J., 1999/2000. De 14C-chronologie van de Nederlandsepre- en protohistorie III: Neolithicum. Palaeohistoria 41/42, 1e110.
Madella, M., Lancelotti, C., 2010. Taphonomy and phytoliths: a user manual. Quat.Int. 275, 76e83.
Matthews, W., 2010. Geoarchaeology and taphonomy of plant remains and micro-archaeological residues in early urban environments in the ancient near east.Quat. Int. 214, 98e113.
McBride, R.A., Mercer, G.D., 2012. Assessing damage to archaeological artefacts incompacted soil using microcomputed tomography scanning. Archaeol. Pros-pect. 19, 7e19.
Mentzer, S.M., Quade, J., 2013. Compositional and isotopic analytical methods inarchaeological micromorphology. Geoarchaeology 28, 87e97.
Miller, C.E., Sievert, C., 2012. An experimental micromorphological investigation ofbedding construction in the Middle Stone Age of Sibudu, South Africa.J. Archaeol. Sci. 39, 3039e3051.
Miller, C.E., Conard, N.J., Goldberg, P., Berna, F., 2009. Dumping, sweeping andtrampling: experimental micromorphological analysis of anthropogenicallymodified combustion features. In: Th�ery-Parisot, I., Chabal, L., Costamagno, S.(Eds.), The Taphonomy of Burned Organic Residues and Combustion Features inArchaeological Contexts. Proceedings of the round table, Valbonne, May 27e29,2008, vol. 2, pp. 25e37. P@lethnologie.
Minozzi, S., Giuffra, V., Bagnoli, J., Paribeni, E., Giustini, D., Caramell, D.,Fornaciari, G., 2010. An investigation of Etruscan cremations by computed to-mography (CT). Antiquity 84, 195e201.
Raemaekers, D.C.M., 1999. The articulation of a “New Neolithic”. The meaning of theSwifterbant Culture for the Process of Neolithisation in the Western Part of theNorth European Plain (Archaeological Series Leiden University 3), PhD-disser-tation. Leiden University, Leiden.
Shillito, L.-M., Matthews, W., Bull, I.D., Almond, M.J., 2011a. The microstratigraphy ofmiddens: capturing daily routine in rubbish at Neolithic Çatalh€oyük, Turkey.Antiquity 85 (329), 1024e1038.
Shillito, L.-M., Bull, I.D., Matthews, W., Almond, M.J., Williams, J., Evershed, R.P.,2011b. Biomolecular and micromorphological analysis of suspected faecal de-posits at Neolithic Çatalh€oyük, Turkey. J. Archaeol. Sci. 38, 1869e1877.
Tarplee, M.F.V., van der Meer, J.J.M., Davis, G.R., 2011. The 3D microscopic ‘signature’of strain within glacial sediments revealed using X-ray computed micro-tomography. Quat. Sci. Rev. 30, 3501e3532.
Zacher, G., Santillan, J., Brunke, O., Mayer, T., 2010. 3D microanalysis of geologicalsamples with high-resolution computed tomography. In: Alshibli, K.A.,Reed, A.H. (Eds.), Advances in Computed Tomography for Geomaterials: GEOX.Wiley, Hoboken, pp. 197e204.
s: studying Neolithic subsistence using micro CT scanning of midden16/j.jas.2014.05.006