A Prototype for Cartographic Human Body Analysis
8
Index Terms —Medical applications, Information visualization, Scientific visualization, User interfaces I.INTRODUCTION Medicine is a vast scientific area which major concern is human beings health and welfare. Many computer applications focusing mainly image processing of X-Rays, ultrasound or MRI (Magnetic Resonance Imaging) has been produced. They help doctors to analyze these images, revealing details that sometimes human eyes can not straightforwardly detect. Besides these applications, many others have been created, concerning other important aspects and issues of this scientific area, such as: human body modeling, diagnosis decision support systems or training systems (most in virtual reality and Cave environment). Computer graphics has been the essential key in all these applications or systems. Graphics is one powerful means to information deliverance, but if any advanced graphic application fails in properly processing or treating its input data, all graphic will become worthless. A good visualization pipeline highly depends on what application model is used to convey data into graphics. The medical knowledge field has some distinct characteristics that should be taken into account by any model: it does not deal with data typically present in any business application, because its data belongs to something that is “alive” and has significant morphological and anatomical intrinsic aspects. Any medical software application should merge both the strong potentialities that visualization offers with the capabilities that a well tailored model (for its data and typical medical tasks processing) should introduce [8]. In this article we propose a cartographic oriented model to visualize and analyze human’s body data and present its implemented prototype based on a case of study. Because of its underneath model, algebraic maps operations are implicitly used to perform spatial analysis in human’s body data by the prototype. Scientific and information visualization 3D techniques are used as a common basis to outputs delivering. The results of the prototype allowed us to conclude that the usage of a cartographic oriented model as a basis for a medical application tool might actually introduce a new degree of information insight. This paper is organized as follows. Section 2 contextualizes the choice of the usage and appliance of a cartographic oriented model to our prototype. Section 3 introduces the prototype general architecture, describes its information flow and visualization environment and basic requirements. In this section is also referred the evaluation process that we performed in order to validate our model and assess our prototype. II.BACKGROUND Despite the continuous concern and interest of industry in developing software applications to distinct fields of medicine [6], most of all are in fact, specialized image processing tools, or suffer a lack of a proper application model. In the first category, there are several medical systems, applications or tools, which via standard image processing filters and volume reconstruction techniques, give different visual outputs to doctors based on CT (Computed Tomography), MRI, etc. In the second category, we can find those applications that intend to analyze human’s body data (mainly its anatomical and morphological characteristics) in a very atomic perspective, in the sense that the body is not treated or “saw” as a whole. Each part is independent from the other, and no spatial issue is taken into account whatsoever. The model proposed in this paper takes into concern this relevant issue, and solves this drawback with a cartographic oriented model. A cartographic model is defined as a simplified representation of the Earth’s surface or any celestial body that can be expressed in an analytical form. For many years, the cartography was only associated to the production of analogical maps. However currently its [1] domain grew and other fields of knowledge [5] start to use it as a way to express information [2]. All the procedures associated to cartographic modeling are based on data belonging to two or more maps [7]. These maps are treated as geo-referenced information layers. Each layer must be spatially referenced. The way that they can be combined and analysed is vast and varied. Normally, any combinations of these layers generate a new geo-referenced information layer. A Prototype for a Cartographic Human Body Analysis Elizabeth Carvalho, Adérito Marcos, Maribel Yasmina Santos, João Espregueira-Mendes, University of Minho 1
Transcript of A Prototype for Cartographic Human Body Analysis

Index Terms—Medical applications, Information visualization, Scientific visualization, User interfaces
I.INTRODUCTION
Medicine is a vast scientific area which major concern is human beings health and welfare. Many computer applications focusing mainly image processing of X-Rays, ultrasound or MRI (Magnetic Resonance Imaging) has been produced. They help doctors to analyze these images, revealing details that sometimes human eyes can not straightforwardly detect. Besides these applications, many others have been created, concerning other important aspects and issues of this scientific area, such as: human body modeling, diagnosis decision support systems or training systems (most in virtual reality and Cave environment). Computer graphics has been the essential key in all these applications or systems.
Graphics is one powerful means to information deliverance, but if any advanced graphic application fails in properly processing or treating its input data, all graphic will become worthless. A good visualization pipeline highly depends on what application model is used to convey data into graphics. The medical knowledge field has some distinct characteristics that should be taken into account by any model: it does not deal with data typically present in any business application, because its data belongs to something that is “alive” and has significant morphological and anatomical intrinsic aspects. Any medical software application should merge both the strong potentialities that visualization offers with the capabilities that a well tailored model (for its data and typical medical tasks processing) should introduce [8].
In this article we propose a cartographic oriented model to visualize and analyze human’s body data and present its implemented prototype based on a case of study. Because of its underneath model, algebraic maps operations are implicitly used to perform spatial analysis in human’s body data by the prototype. Scientific and information visualization 3D techniques are used as a common basis to outputs delivering.
The results of the prototype allowed us to conclude that the usage of a cartographic oriented model as a basis for a medical application tool might actually introduce a new degree of information insight.
This paper is organized as follows. Section 2 contextualizes the choice of the usage and appliance of a cartographic oriented model to our prototype. Section 3 introduces the prototype general architecture, describes its information flow and visualization environment and basic requirements. In this section is also referred the evaluation process that we performed in order to validate our model and assess our prototype.
II.BACKGROUND
Despite the continuous concern and interest of industry in developing software applications to distinct fields of medicine [6], most of all are in fact, specialized image processing tools, or suffer a lack of a proper application model. In the first category, there are several medical systems, applications or tools, which via standard image processing filters and volume reconstruction techniques, give different visual outputs to doctors based on CT (Computed Tomography), MRI, etc. In the second category, we can find those applications that intend to analyze human’s body data (mainly its anatomical and morphological characteristics) in a very atomic perspective, in the sense that the body is not treated or “saw” as a whole. Each part is independent from the other, and no spatial issue is taken into account whatsoever. The model proposed in this paper takes into concern this relevant issue, and solves this drawback with a cartographic oriented model.
A cartographic model is defined as a simplified representation of the Earth’s surface or any celestial body that can be expressed in an analytical form. For many years, the cartography was only associated to the production of analogical maps. However currently its [1] domain grew and other fields of knowledge [5] start to use it as a way to express information [2].
All the procedures associated to cartographic modeling are based on data belonging to two or more maps [7]. These maps are treated as geo-referenced information layers. Each layer must be spatially referenced. The way that they can be combined and analysed is vast and varied. Normally, any combinations of these layers generate a new geo-referenced information layer.
A Prototype for a Cartographic Human Body Analysis
Elizabeth Carvalho, Adérito Marcos, Maribel Yasmina Santos, João Espregueira-Mendes, University of Minho
1
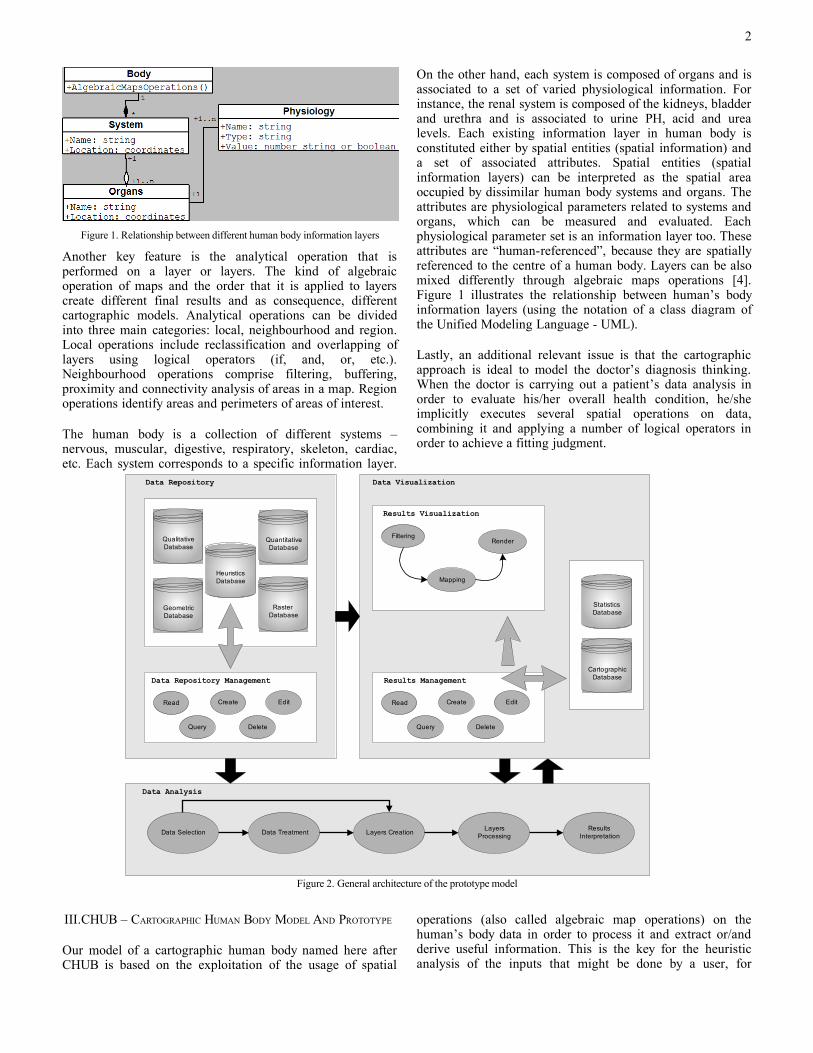
Figure 1. Relationship between different human body information layers
Another key feature is the analytical operation that is performed on a layer or layers. The kind of algebraic operation of maps and the order that it is applied to layers create different final results and as consequence, different cartographic models. Analytical operations can be divided into three main categories: local, neighbourhood and region. Local operations include reclassification and overlapping of layers using logical operators (if, and, or, etc.). Neighbourhood operations comprise filtering, buffering, proximity and connectivity analysis of areas in a map. Region operations identify areas and perimeters of areas of interest.
The human body is a collection of different systems – nervous, muscular, digestive, respiratory, skeleton, cardiac, etc. Each system corresponds to a specific information layer.
On the other hand, each system is composed of organs and is associated to a set of varied physiological information. For instance, the renal system is composed of the kidneys, bladder and urethra and is associated to urine PH, acid and urea levels. Each existing information layer in human body is constituted either by spatial entities (spatial information) and a set of associated attributes. Spatial entities (spatial information layers) can be interpreted as the spatial area occupied by dissimilar human body systems and organs. The attributes are physiological parameters related to systems and organs, which can be measured and evaluated. Each physiological parameter set is an information layer too. These attributes are “human-referenced”, because they are spatially referenced to the centre of a human body. Layers can be also mixed differently through algebraic maps operations [4]. Figure 1 illustrates the relationship between human’s body information layers (using the notation of a class diagram of the Unified Modeling Language - UML).
Lastly, an additional relevant issue is that the cartographic approach is ideal to model the doctor’s diagnosis thinking. When the doctor is carrying out a patient’s data analysis in order to evaluate his/her overall health condition, he/she implicitly executes several spatial operations on data, combining it and applying a number of logical operators in order to achieve a fitting judgment.
Data Analysis
Data Repository
Data Repository Management
Read Create Edit
Query Delete
Qualitative Database
Quantitative Database
Heuristics Database
Geometric Database
Raster Database
Data Selection Data Treatment Layers CreationLayers
ProcessingResults
Interpretation
Data Visualization
Results Management
Read Create Edit
Query Delete
Results Visualization
Filtering
Mapping
Render
Statistics Database
CartographicDatabase
Figure 2. General architecture of the prototype model
III.CHUB – CARTOGRAPHIC HUMAN BODY MODEL AND PROTOTYPE
Our model of a cartographic human body named here after CHUB is based on the exploitation of the usage of spatial
operations (also called algebraic map operations) on the human’s body data in order to process it and extract or/and derive useful information. This is the key for the heuristic analysis of the inputs that might be done by a user, for
2
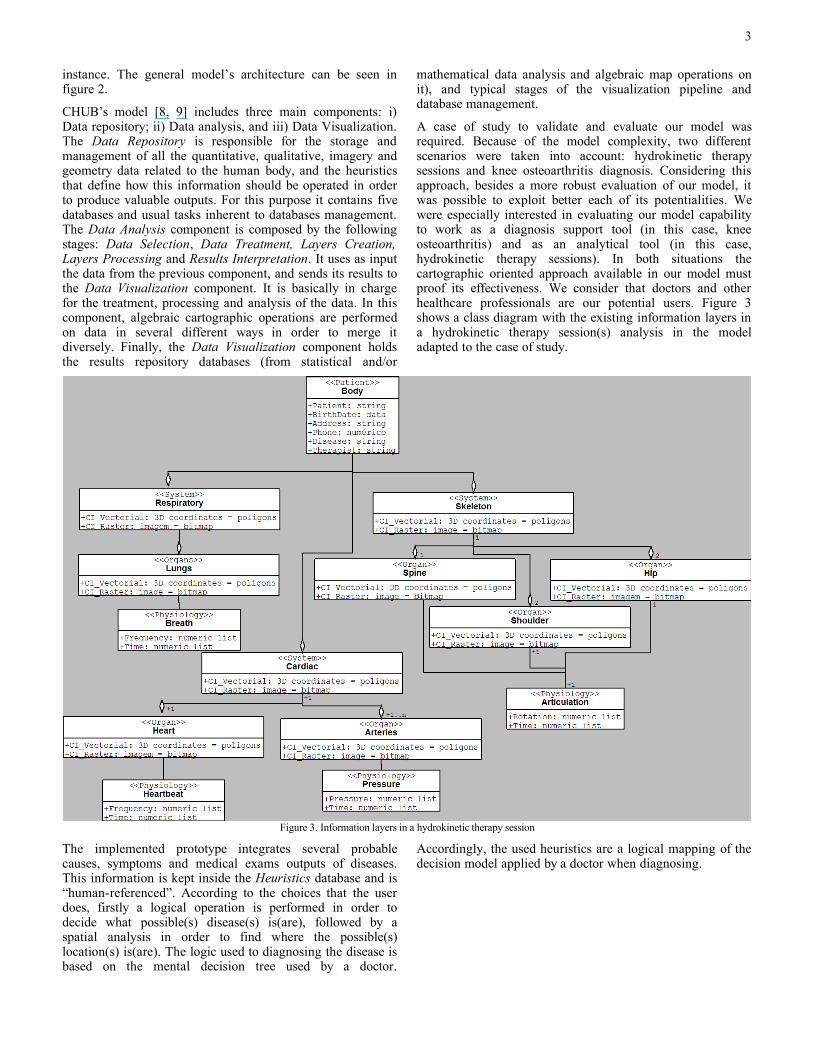
instance. The general model’s architecture can be seen in figure 2.
CHUB’s model [8, 9] includes three main components: i) Data repository; ii) Data analysis, and iii) Data Visualization. The Data Repository is responsible for the storage and management of all the quantitative, qualitative, imagery and geometry data related to the human body, and the heuristics that define how this information should be operated in order to produce valuable outputs. For this purpose it contains five databases and usual tasks inherent to databases management. The Data Analysis component is composed by the following stages: Data Selection, Data Treatment, Layers Creation, Layers Processing and Results Interpretation. It uses as input the data from the previous component, and sends its results to the Data Visualization component. It is basically in charge for the treatment, processing and analysis of the data. In this component, algebraic cartographic operations are performed on data in several different ways in order to merge it diversely. Finally, the Data Visualization component holds the results repository databases (from statistical and/or
mathematical data analysis and algebraic map operations on it), and typical stages of the visualization pipeline and database management.
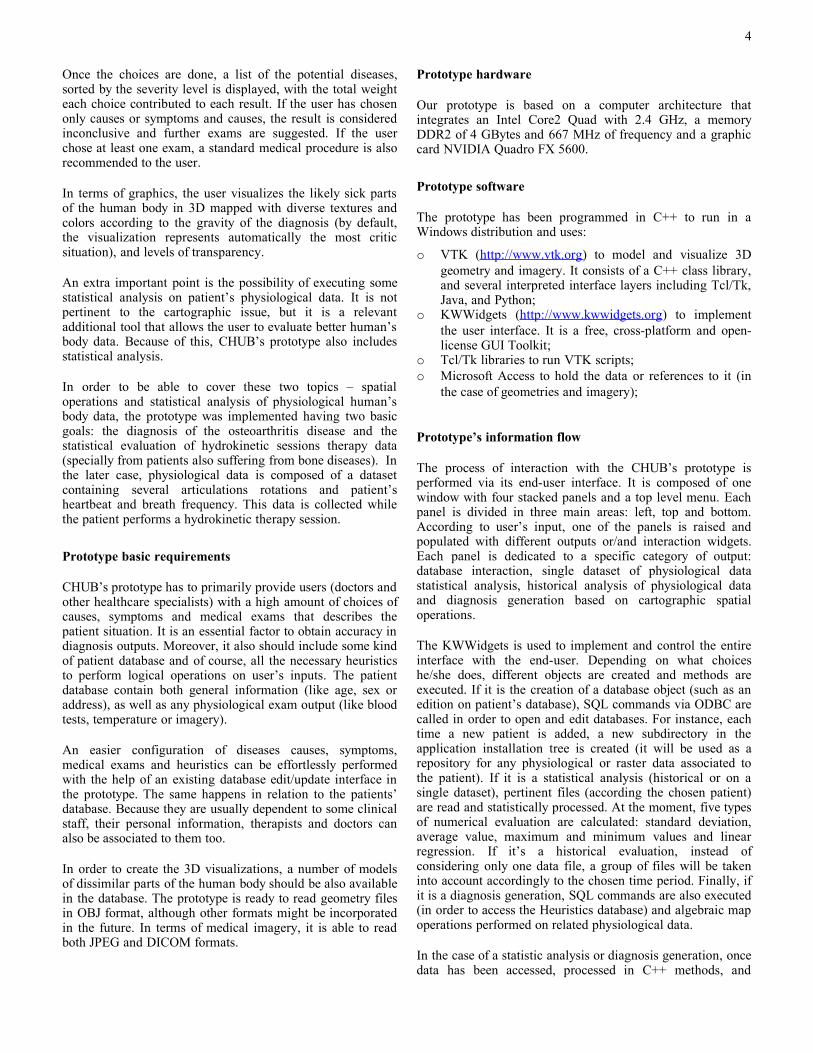
A case of study to validate and evaluate our model was required. Because of the model complexity, two different scenarios were taken into account: hydrokinetic therapy sessions and knee osteoarthritis diagnosis. Considering this approach, besides a more robust evaluation of our model, it was possible to exploit better each of its potentialities. We were especially interested in evaluating our model capability to work as a diagnosis support tool (in this case, knee osteoarthritis) and as an analytical tool (in this case, hydrokinetic therapy sessions). In both situations the cartographic oriented approach available in our model must proof its effectiveness. We consider that doctors and other healthcare professionals are our potential users. Figure 3 shows a class diagram with the existing information layers in a hydrokinetic therapy session(s) analysis in the model adapted to the case of study.
Figure 3. Information layers in a hydrokinetic therapy session
The implemented prototype integrates several probable causes, symptoms and medical exams outputs of diseases. This information is kept inside the Heuristics database and is “human-referenced”. According to the choices that the user does, firstly a logical operation is performed in order to decide what possible(s) disease(s) is(are), followed by a spatial analysis in order to find where the possible(s) location(s) is(are). The logic used to diagnosing the disease is based on the mental decision tree used by a doctor.
Accordingly, the used heuristics are a logical mapping of the decision model applied by a doctor when diagnosing.
3
Once the choices are done, a list of the potential diseases, sorted by the severity level is displayed, with the total weight each choice contributed to each result. If the user has chosen only causes or symptoms and causes, the result is considered inconclusive and further exams are suggested. If the user chose at least one exam, a standard medical procedure is also recommended to the user.
In terms of graphics, the user visualizes the likely sick parts of the human body in 3D mapped with diverse textures and colors according to the gravity of the diagnosis (by default, the visualization represents automatically the most critic situation), and levels of transparency.
An extra important point is the possibility of executing some statistical analysis on patient’s physiological data. It is not pertinent to the cartographic issue, but it is a relevant additional tool that allows the user to evaluate better human’s body data. Because of this, CHUB’s prototype also includes statistical analysis.
In order to be able to cover these two topics – spatial operations and statistical analysis of physiological human’s body data, the prototype was implemented having two basic goals: the diagnosis of the osteoarthritis disease and the statistical evaluation of hydrokinetic sessions therapy data (specially from patients also suffering from bone diseases). In the later case, physiological data is composed of a dataset containing several articulations rotations and patient’s heartbeat and breath frequency. This data is collected while the patient performs a hydrokinetic therapy session.
Prototype basic requirements
CHUB’s prototype has to primarily provide users (doctors and other healthcare specialists) with a high amount of choices of causes, symptoms and medical exams that describes the patient situation. It is an essential factor to obtain accuracy in diagnosis outputs. Moreover, it also should include some kind of patient database and of course, all the necessary heuristics to perform logical operations on user’s inputs. The patient database contain both general information (like age, sex or address), as well as any physiological exam output (like blood tests, temperature or imagery).
An easier configuration of diseases causes, symptoms, medical exams and heuristics can be effortlessly performed with the help of an existing database edit/update interface in the prototype. The same happens in relation to the patients’ database. Because they are usually dependent to some clinical staff, their personal information, therapists and doctors can also be associated to them too.
In order to create the 3D visualizations, a number of models of dissimilar parts of the human body should be also available in the database. The prototype is ready to read geometry files in OBJ format, although other formats might be incorporated in the future. In terms of medical imagery, it is able to read both JPEG and DICOM formats.
Prototype hardware
Our prototype is based on a computer architecture that integrates an Intel Core2 Quad with 2.4 GHz, a memory DDR2 of 4 GBytes and 667 MHz of frequency and a graphic card NVIDIA Quadro FX 5600.
Prototype software
The prototype has been programmed in C++ to run in a Windows distribution and uses:
o VTK (http://www.vtk.org) to model and visualize 3D geometry and imagery. It consists of a C++ class library, and several interpreted interface layers including Tcl/Tk, Java, and Python;
o KWWidgets (http://www.kwwidgets.org) to implement the user interface. It is a free, cross-platform and open-license GUI Toolkit;
o Tcl/Tk libraries to run VTK scripts;o Microsoft Access to hold the data or references to it (in
the case of geometries and imagery);
Prototype’s information flow
The process of interaction with the CHUB’s prototype is performed via its end-user interface. It is composed of one window with four stacked panels and a top level menu. Each panel is divided in three main areas: left, top and bottom. According to user’s input, one of the panels is raised and populated with different outputs or/and interaction widgets. Each panel is dedicated to a specific category of output: database interaction, single dataset of physiological data statistical analysis, historical analysis of physiological data and diagnosis generation based on cartographic spatial operations.
The KWWidgets is used to implement and control the entire interface with the end-user. Depending on what choices he/she does, different objects are created and methods are executed. If it is the creation of a database object (such as an edition on patient’s database), SQL commands via ODBC are called in order to open and edit databases. For instance, each time a new patient is added, a new subdirectory in the application installation tree is created (it will be used as a repository for any physiological or raster data associated to the patient). If it is a statistical analysis (historical or on a single dataset), pertinent files (according the chosen patient) are read and statistically processed. At the moment, five types of numerical evaluation are calculated: standard deviation, average value, maximum and minimum values and linear regression. If it’s a historical evaluation, instead of considering only one data file, a group of files will be taken into account accordingly to the chosen time period. Finally, if it is a diagnosis generation, SQL commands are also executed (in order to access the Heuristics database) and algebraic map operations performed on related physiological data.
In the case of a statistic analysis or diagnosis generation, once data has been accessed, processed in C++ methods, and
4
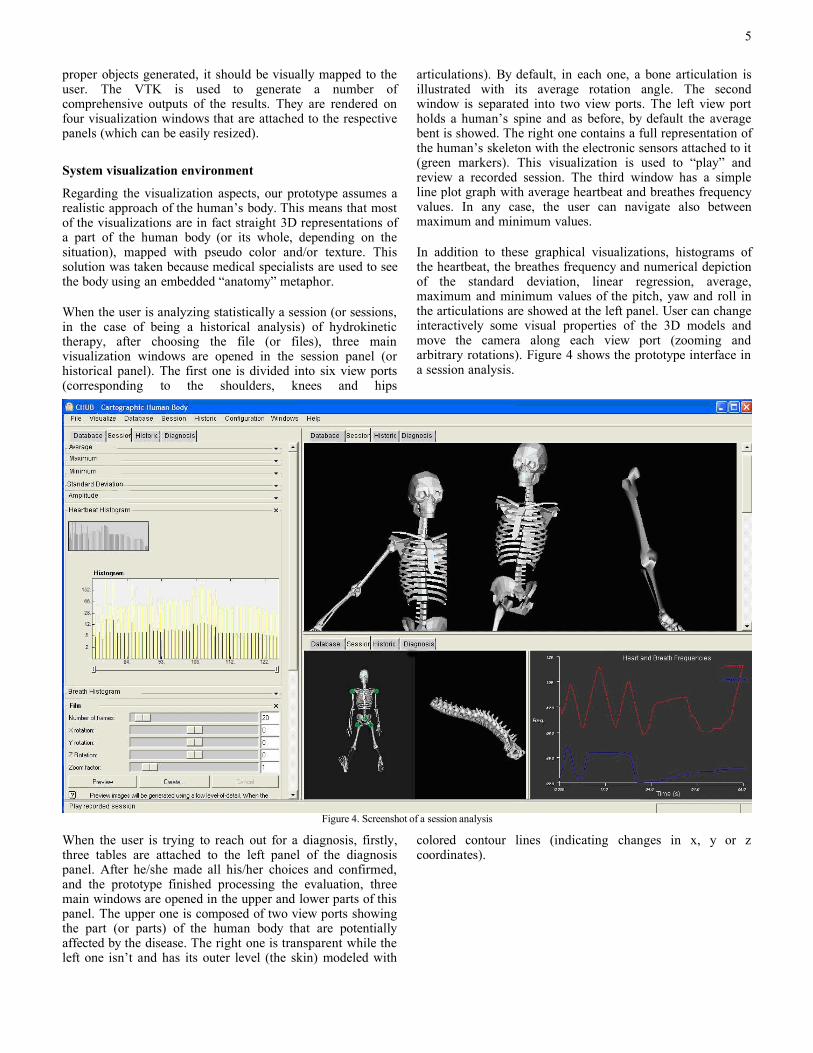
proper objects generated, it should be visually mapped to the user. The VTK is used to generate a number of comprehensive outputs of the results. They are rendered on four visualization windows that are attached to the respective panels (which can be easily resized).
System visualization environment
Regarding the visualization aspects, our prototype assumes a realistic approach of the human’s body. This means that most of the visualizations are in fact straight 3D representations of a part of the human body (or its whole, depending on the situation), mapped with pseudo color and/or texture. This solution was taken because medical specialists are used to see the body using an embedded “anatomy” metaphor.
When the user is analyzing statistically a session (or sessions, in the case of being a historical analysis) of hydrokinetic therapy, after choosing the file (or files), three main visualization windows are opened in the session panel (or historical panel). The first one is divided into six view ports (corresponding to the shoulders, knees and hips
articulations). By default, in each one, a bone articulation is illustrated with its average rotation angle. The second window is separated into two view ports. The left view port holds a human’s spine and as before, by default the average bent is showed. The right one contains a full representation of the human’s skeleton with the electronic sensors attached to it (green markers). This visualization is used to “play” and review a recorded session. The third window has a simple line plot graph with average heartbeat and breathes frequency values. In any case, the user can navigate also between maximum and minimum values.
In addition to these graphical visualizations, histograms of the heartbeat, the breathes frequency and numerical depiction of the standard deviation, linear regression, average, maximum and minimum values of the pitch, yaw and roll in the articulations are showed at the left panel. User can change interactively some visual properties of the 3D models and move the camera along each view port (zooming and arbitrary rotations). Figure 4 shows the prototype interface in a session analysis.
Figure 4. Screenshot of a session analysis
When the user is trying to reach out for a diagnosis, firstly, three tables are attached to the left panel of the diagnosis panel. After he/she made all his/her choices and confirmed, and the prototype finished processing the evaluation, three main windows are opened in the upper and lower parts of this panel. The upper one is composed of two view ports showing the part (or parts) of the human body that are potentially affected by the disease. The right one is transparent while the left one isn’t and has its outer level (the skin) modeled with
colored contour lines (indicating changes in x, y or z coordinates).
5
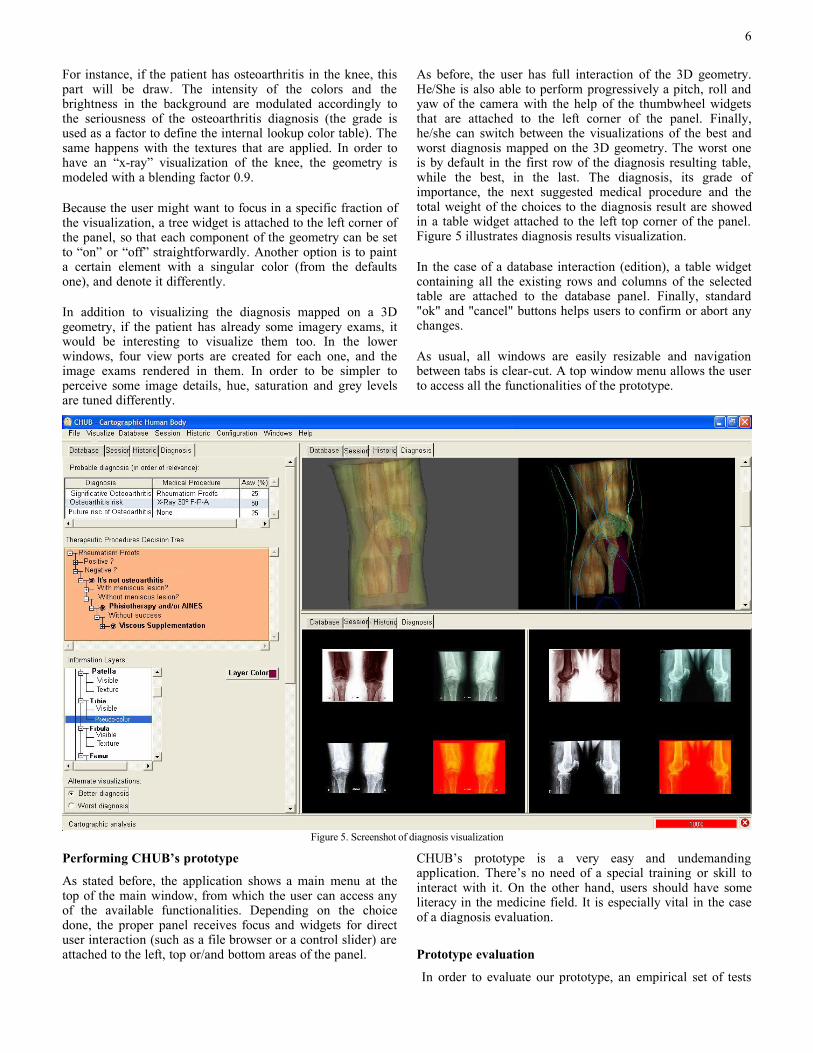
For instance, if the patient has osteoarthritis in the knee, this part will be draw. The intensity of the colors and the brightness in the background are modulated accordingly to the seriousness of the osteoarthritis diagnosis (the grade is used as a factor to define the internal lookup color table). The same happens with the textures that are applied. In order to have an “x-ray” visualization of the knee, the geometry is modeled with a blending factor 0.9.
Because the user might want to focus in a specific fraction of the visualization, a tree widget is attached to the left corner of the panel, so that each component of the geometry can be set to “on” or “off” straightforwardly. Another option is to paint a certain element with a singular color (from the defaults one), and denote it differently.
In addition to visualizing the diagnosis mapped on a 3D geometry, if the patient has already some imagery exams, it would be interesting to visualize them too. In the lower windows, four view ports are created for each one, and the image exams rendered in them. In order to be simpler to perceive some image details, hue, saturation and grey levels are tuned differently.
As before, the user has full interaction of the 3D geometry. He/She is also able to perform progressively a pitch, roll and yaw of the camera with the help of the thumbwheel widgets that are attached to the left corner of the panel. Finally, he/she can switch between the visualizations of the best and worst diagnosis mapped on the 3D geometry. The worst one is by default in the first row of the diagnosis resulting table, while the best, in the last. The diagnosis, its grade of importance, the next suggested medical procedure and the total weight of the choices to the diagnosis result are showed in a table widget attached to the left top corner of the panel. Figure 5 illustrates diagnosis results visualization.
In the case of a database interaction (edition), a table widget containing all the existing rows and columns of the selected table are attached to the database panel. Finally, standard "ok" and "cancel" buttons helps users to confirm or abort any changes.
As usual, all windows are easily resizable and navigation between tabs is clear-cut. A top window menu allows the user to access all the functionalities of the prototype.
Figure 5. Screenshot of diagnosis visualization
Performing CHUB’s prototype
As stated before, the application shows a main menu at the top of the main window, from which the user can access any of the available functionalities. Depending on the choice done, the proper panel receives focus and widgets for direct user interaction (such as a file browser or a control slider) are attached to the left, top or/and bottom areas of the panel.
CHUB’s prototype is a very easy and undemanding application. There’s no need of a special training or skill to interact with it. On the other hand, users should have some literacy in the medicine field. It is especially vital in the case of a diagnosis evaluation.
Prototype evaluation
In order to evaluate our prototype, an empirical set of tests
6
were carried out. These tests were based on the GEM – Generic Evaluation Model [3], proposed by Irène Buvat et al. The GEM includes the notion of hierarchical evaluation, identifies the components which have always to be defined when designing an evaluation protocol and shows the relationships that exist between these components. This model considers that six different levels of evaluation should be attended.
Adapting and applying GEM rules and levels to our situation, we identified six hypotheses that have to be tested and estimated in order to evaluate our model and consequently its prototype. For each of these hypotheses we also defined the observer profile, the input data, the method and tasks to be applied and finally the quality index and a reference for results evaluation. The hypotheses were the following:
o Hypothesis 1 – The appliance of cartographic and spatial operations on human-referenced information layers, allow knee osteoarthritis detection.
o Hypothesis 2 – Besides what is referred in hypothesis 1, we can also properly achieve osteoarthritis diagnosis (severity grade).
o Hypothesis 3 – Cartographic metaphors in results deliverance can help doctors to gain information insight.
o Hypothesis 4 – CHUB can work properly as a diagnosis support tool.
o Hypothesis 5 – CHUB usage actually eases the osteoarthritis knee diagnosis through its algebraic map operations and “human-referenced” data structures.
o Hypothesis 6 – The CHUB can be successfully applied and used for the identification of other illnesses that can molest the knee.
A questionnaire divided into two parts was elaborated. It was completely based on GEM-oriented rules and levels and aimed our hypotheses assessment. Thirty patients, presenting or not symptomatic knee osteoarthritis symptoms, were considered as test bay. Several patients and therapists were ours potential prototype’s users.
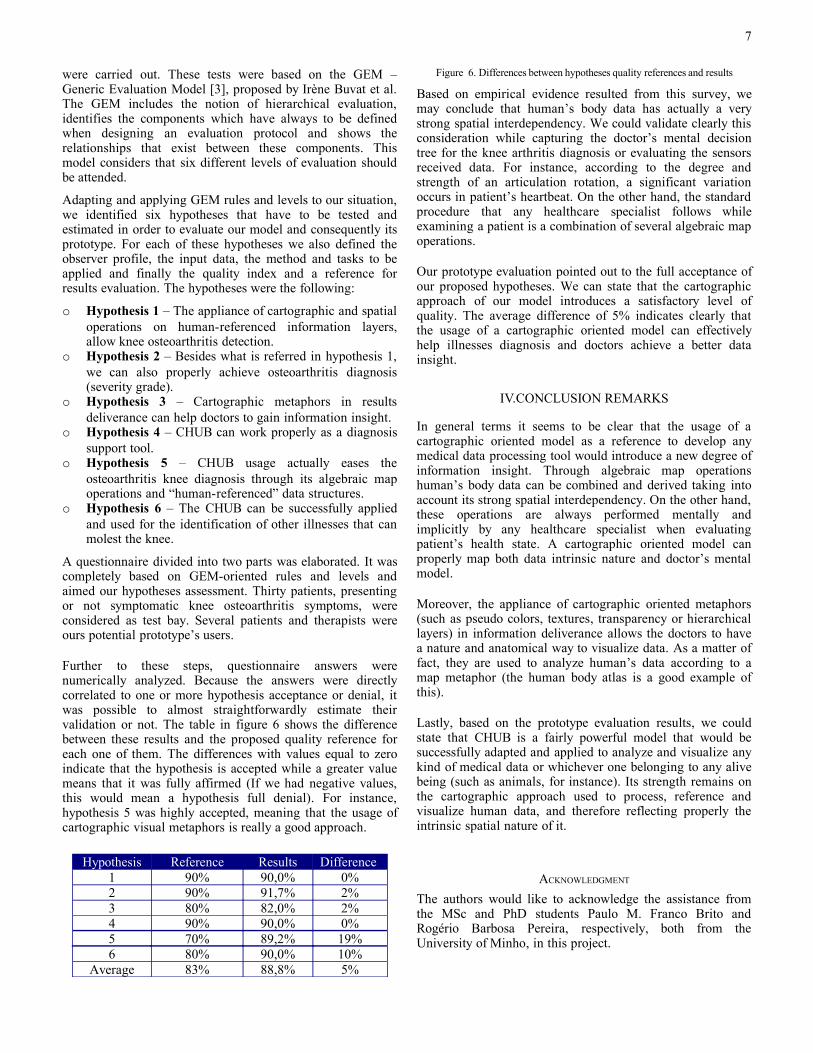
Further to these steps, questionnaire answers were numerically analyzed. Because the answers were directly correlated to one or more hypothesis acceptance or denial, it was possible to almost straightforwardly estimate their validation or not. The table in figure 6 shows the difference between these results and the proposed quality reference for each one of them. The differences with values equal to zero indicate that the hypothesis is accepted while a greater value means that it was fully affirmed (If we had negative values, this would mean a hypothesis full denial). For instance, hypothesis 5 was highly accepted, meaning that the usage of cartographic visual metaphors is really a good approach.
Hypothesis Reference Results Difference1 90% 90,0% 0%2 90% 91,7% 2%3 80% 82,0% 2%4 90% 90,0% 0%5 70% 89,2% 19%6 80% 90,0% 10%
Average 83% 88,8% 5%
Figure 6. Differences between hypotheses quality references and results
Based on empirical evidence resulted from this survey, we may conclude that human’s body data has actually a very strong spatial interdependency. We could validate clearly this consideration while capturing the doctor’s mental decision tree for the knee arthritis diagnosis or evaluating the sensors received data. For instance, according to the degree and strength of an articulation rotation, a significant variation occurs in patient’s heartbeat. On the other hand, the standard procedure that any healthcare specialist follows while examining a patient is a combination of several algebraic map operations.
Our prototype evaluation pointed out to the full acceptance of our proposed hypotheses. We can state that the cartographic approach of our model introduces a satisfactory level of quality. The average difference of 5% indicates clearly that the usage of a cartographic oriented model can effectively help illnesses diagnosis and doctors achieve a better data insight.
IV.CONCLUSION REMARKS
In general terms it seems to be clear that the usage of a cartographic oriented model as a reference to develop any medical data processing tool would introduce a new degree of information insight. Through algebraic map operations human’s body data can be combined and derived taking into account its strong spatial interdependency. On the other hand, these operations are always performed mentally and implicitly by any healthcare specialist when evaluating patient’s health state. A cartographic oriented model can properly map both data intrinsic nature and doctor’s mental model.
Moreover, the appliance of cartographic oriented metaphors (such as pseudo colors, textures, transparency or hierarchical layers) in information deliverance allows the doctors to have a nature and anatomical way to visualize data. As a matter of fact, they are used to analyze human’s data according to a map metaphor (the human body atlas is a good example of this).
Lastly, based on the prototype evaluation results, we could state that CHUB is a fairly powerful model that would be successfully adapted and applied to analyze and visualize any kind of medical data or whichever one belonging to any alive being (such as animals, for instance). Its strength remains on the cartographic approach used to process, reference and visualize human data, and therefore reflecting properly the intrinsic spatial nature of it.
ACKNOWLEDGMENT
The authors would like to acknowledge the assistance from the MSc and PhD students Paulo M. Franco Brito and Rogério Barbosa Pereira, respectively, both from the University of Minho, in this project.
7
REFERENCES
[1] Skupin, A., 2000. From Metaphor to Method: Cartographic Perspectives on Information Visualization. Proceedings IEEE InfoVis 2000, Utah, EUA, pp. 91-97.
[2] Skupin, A., 2002. A Cartographic Approach to Visualizing Conference Abstracts. In IEEE CG&A, Volume 22, Nº 1, pp. 50-58.
[3] Irene Buvat et al., 1999. The need to develop guidelines for evaluation of medical image processing procedures. Procedures of SPIE Medical Imaging 1999, pp. 1466-1477.
[4] Sato, Mitsuru, 2001. Making a Human Body Map. In NatureInterface, nº 4, pp. 56-59.
[5] Peuquet, D. and Kraak, M. 2002, Geobrowsing: Creative Thinking and Knowledge using Geographic Visualization. In Information Visualization, Volume 1, Nº 1, pp. 80-91.
[6] Preim B. and Bartz D., 2007. Visualization in Medicine, Theory, Algorithms and Applications. The Morgan Kaufmann Series in Computer Graphics. Elsevier Editions.
[7] MacEahren, Alan et al., 2005. Exploring Geovisualization. Elsevier Editions, USA.
[8] Carvalho E., Marcos A., Santos Y. M., and Brito P., 2007. Analysing and Visualizing a Human Body Cartographically. In proceedings of the 15º Encontro Português de Computação Gráfica. Lisbon, Portugal, 10-13 October, pp. 1-8.
[9] Carvalho E., Santos Y. M., and Marcos A, 2007. CHUB – Cartographic Human Body. In proceedings of IADIS – Multi Conference on Computer Science and Information Systems, Lisbon, Portugal, 5-7 July, pp. 27-34.
8