Efficiency of natural wood extractives as wood preservatives against termite attack
Upload
independentCategory
view
0download
0
RB Warner
A proposed adjustment for the "old-wood effect".
In Mook, W. & Waterbolk, H (eds), 1990.Proceedings of the 2ndSymposium of 14C &Archaeology, Groningen 1987 (ESP: PACT no, 29),159-172.
pdf made by RW
/' "
Pact 29 - n.1O : R.B. Warner
from:Mook, W. & Waterbolk, H. (eds.),~£2g~ ~ng §~m2~ of l1Q ~
A£gh~~21~L g~2nigg~g 1~~1,~AQT n2~ ~~ (ESF), 1990, 159-172.-
.., A Proposed Adjustmentfor the « Old-Wood Effect»
"
Q-
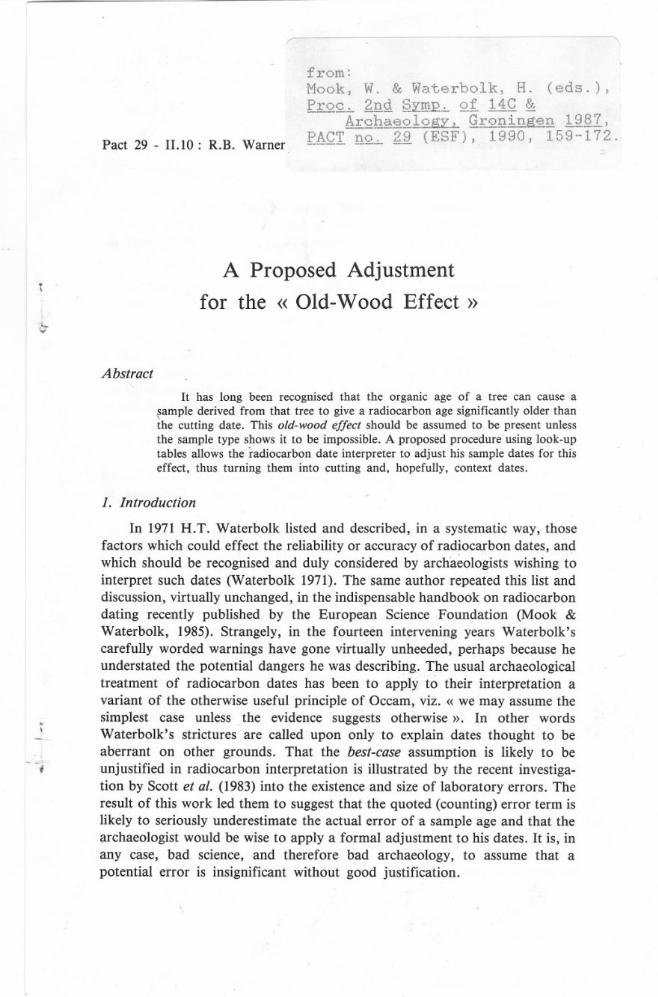
Abstract
It has long been recognised that the organic age of a tree can cause a~ample derived from that tree to give a radiocarbon age significantly older thanthe cutting date. This old-wood effect should be assumed to be present unlessthe sample type shows it to be impossible. A proposed procedure using look-uptables allows the radiocarbon date interpreter to adjust his sample dates for thiseffect, thus turning them into cutting and, hopefully, context dates.
~,,
1. Introduction
In 1971 H.T. Waterbolk listed and described, in a systematic way, thosefactors which could effect the reliability or accuracy of radiocarbon dates, andwhich should be recognised and duly considered by arcnaeologists wishing tointerpret such dates (Waterbolk 1971). The same author repeated this list anddiscussion, virtually unchanged, in the indispensable handbook on radiocarbondating recently published by the European Science Foundation (Mook &Waterbolk, 1985). Strangely, in the fourteen intervening years Waterbolk'scarefully worded warnings have gone virtually unheeded, perhaps because heunderstated the potential dangers he was describing. The usual archaeologicaltreatment of radiocarbon dates has been to apply. to their interpretation avariant of the otherwise useful principle of Occam, viz. « we may assume thesimplest case unless the evidence suggests otherwise ». In other wordsWaterbolk's strictures ar~ called upon only to explain dates thought to beaberrant on other grounds. That the best-case assumption is likely to beunjustified in radiocarbon interpretation is illustrated by the recent investiga-tion by Scott et al. (1983) into the existence and size of laboratory errors. Theresult of this work led them to suggest that the quoted (counting) error term islikely to seriously underestimate the actual error of a sample age and that the~rchaeologist would be wise to apply a formal adjustment to his dates. It is, inany case, bad science, and therefore bad archaeology, to assume that apotential error is insignificant without good justification.
.,j-7
160 R.B. Warner
2. The old-wood effect.
The particular complication to which I wish to draw attention is thatdescribed thus by Waterbolk :
A l4e sample always has, unless contaminated with youngermaterial, a date older than that at which it was buried in the groundand became associated with other objects (1971, 16 n° II,. 198549,6.3.2.).
The most important example of this observation relates to plant matteror plant charcoal, and stems from the quite obvious fact that the sample islikely to have come from any part of a parent tree which itself might havehad a substantial organic age before being cut (I am referring to materialused very soon after cutting, not to relic wood which is another problementirely). I shall use the term old-wood effect for this phenomenon, and shallrefer to those samples demonstrably not exhibiting the effect as short-lifesamples. These will be samples whose sources have lives that are negligible inarchaeological terms (for instance grass, grain and, of course, animal matter)and samples which can be seen to be from recent parts of a longer-lived plant(for instance leaves and twigs). Long-life samples are any samples that cannotbe shown to be short-life samples (including of course samples with thesimple description« charcoal »), which therefore have a likelihood ofsuffering from the old-wood effect.
It is my contention that there is a very high chance that the charcoal (orplant matter) available to the archaeologist will present a substantial old-wood effect. Even the most cursory consideration of the material likely to beavailable to, and used by, early man for burning and building makes anonsense of the assumption, implicit in most archaeological date-interpreta-tion, that charcoal samples are likely to be of short-life types.
3. Examples of the effect
Waterbolk (1971) gave examples of groups of dates which appeared to beconsistent with the premise that a sizeable proportion of the samples weresuffering from the old-wood effect. In particular L' Anse aux Meadows, aViking settlement in Newfoundland, appeared to give a mean charcoal-agesome 130 years older than both the expected age and the mean of the short-life samples. The spread of the charcoal means was also significantly greaterthan their quoted errors would explain. Unfortunately, although the values ofthe old-wood difference given by Waterbolk's examples are virtually the sameas the value we will discover later, and in accord with the principle that theeffect makes the long-life samples too-old, the nature of the contexts(unknown length of occupation) prevents us from placing too much weighton these examples.
'"
-
-""
..
(1*-"
A Proposed Adjustment for the Old-Wood Effect 161
More convincing, although still with contextual problems, is the series ofwell stratified dates from Oldenberg, the contexts being historically dated. AsWillkomm observed (1983) « no value is younger than expected archaeologi-cally » while a substantial number of the dates (but not those from the shortlife samples) are significantly older !han expected (more, that is, than wouldbe expected by statistical variation alone). The one-way-only bias (older), thesize of the bias and its confinement to samples that cannot be shown to be ofshort-life type all show the old-wood effect to be the only reasonableexplanation.
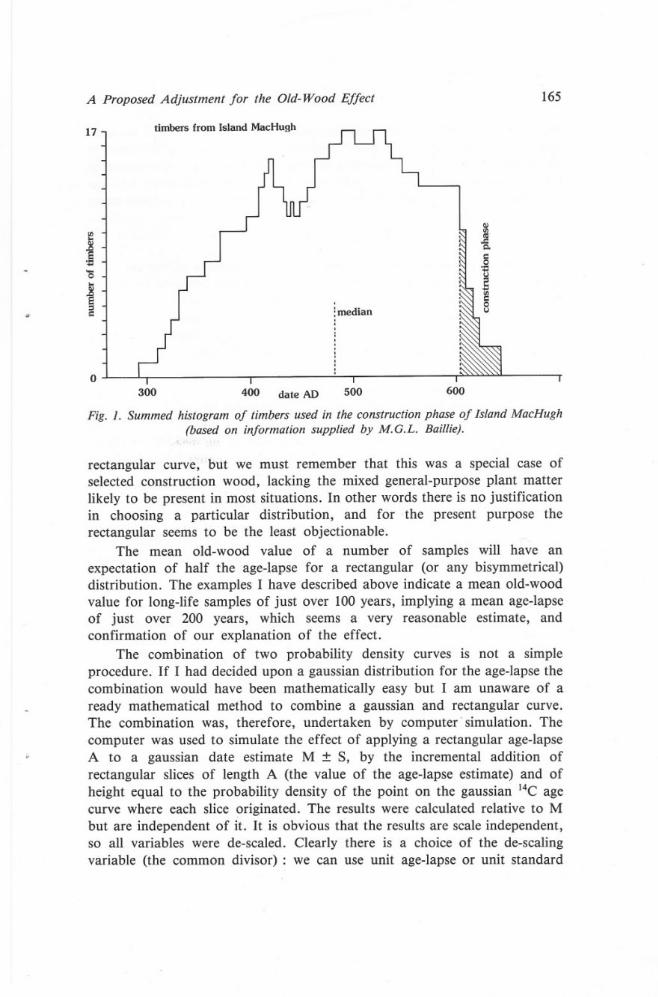
From the Irish crannog (artificial island) of Island MacHugh (Co.Tyrone ; Ivens & Simpson, in press) came a large series of structural timberswhich allowed M. Baillie to ascertain that the cutting and construction took
place over the period between AD 600 and 640 (Baillie, in press). However,he found that the combined span of the timbers extended over a far greaterperiod, from some 300 years before construction. Few of the timberscovered, individually, anything like this span, some having final (but not sap-wood) rings dating to as much as 200 years before their use. But these werenot old timbers, for Baillie has shown that they were produced by the simpleexpedient of splitting larger long-lived trees, all cut immediately before use(see, for a similar example, Eckstein et al., 1984, Fig. 10). In fig. 1 I showthe summed histogram of the real-time spans of all the Island MacHughtimbers, which can be taken to represent roughly the volume-against-time ofthe wood. It will be noted that the median is substantially (about 140 years)earlier than the construction period, and that only 5 070of the area of thehistogram actually falls within the construction phase. In other words, werewe to burn these timbers and randomly sample the charcoal to obtain high-precision radiocarbon dates, we would have very little chance of getting adate-mean within the actual known construction phase Gust under 5 %,about the same chance as a date-mean being more than 250 years too old I).If we were to take ten dates, a more than reasonable number for a singlehorizon on a single site, we would not expect their weighted mean to besignificantly different from the median of the histogram, 140 years earlierthan the date of construction. This particular example, which cannot betaken to be exceptional (see, for instance, Eckstein et al., 1984, Fig. 12),should be salutary, suggesting as it does the very high expectation thatbuilding timbers (which need not be particularly massive) will give anapparent radiocarbon age substantially older than the correct radiocarbon ageof the context.
Our next examples are collections of radiocarbon dates chosen becauseeach relates to a short-period incident and contains both short-life and long-life samples (as I have defined them above). The first is a series of dates froma massacre level at South Cadbury (Somerset, England) believed to have beenthe result of Roman intervention in the middle of the first century A.D. An
162 R.B. Warner
attempt, some years ago, to reconcile the radiocarbon and historicalevidence was not a success (Campbell et al., 1979). Not only did the dates,when calibrated, fail to match the claimed historical date but they wereinternally inconsistent (they fail the test of Ward and Wilson 1978) whichfor a series of radiocarbon dates coming from a horizon of minimalduration was unacceptable. SIXof the samples are of demonstrably short-lifetype and four are of long-life type, the former having a weighted mean of1840 ~ 15 BP and the latter a weighted mean of 1935 ~ 15 BP. Such aselective bias is just what the old-wood effect predicts, and the significantdifference of around 100 years is also close to what we would expect werethis the explanation. The original authors included the old-wood effect intheir list of the possible causes of the discrepancy and even gave a value toit of up to 200 years (Campbell et al., 1979, p. 34).
The second case is that of Navan (Co. Armagh, Ireland), where a largenumber of radiocarbon dates were produced relating to the construction, andalmost immediate destruction, of a very large wooden structure (Lynn, 1986)as well as a dendrochronological date for the construction (Baillie, 1986). Ifwe set up the null hypothesis that there is no need to postulate an old-woodeffect then the dates from a short-time context should be consistent with eachother and with the known date of the event. Also, on this hypothesis, we areentitled to use radiocarbon dates throughout, thus avoiding the extra errorsintroduced by calibration. The known real date of the Navan structure is 95BC, equivalent to a radiocarbon date of 2085 ~ 20 BP (according to thecurve of Stuiver and Pearson, 1986). The Navan samples consisted of four ofshort-life type and seven of long-life type (C. Lynn, pers. comm.), and aswith the case of South Cadbury these are internally inconsistent as well asinconsistent with the known date, negating the null hypothesis. The weightedmean of the short-life samples is 2117 ~ 25 BP, not significantly differentfrom the known date of 2085 ~ 20 BP. On the other hand the weightedmean of the long-life samples, the means of which are all older than themean of the known date, is 2240 ~ 20 BP. This is some 120 radiocarbonyears older than the short-life mean and 155 ~ 28 radiocarbon years earlierthan the known date. The difference is statistically significant, and comple-tely in accord with the explanation of an old-wood effect.
4. The general principle
These examples confirm my general observation and support my claimthat the old-wood effect is not an isolated possibility but is, rather, asignificant probability. Therefore I must propose that:
Unless the sample description or context makes a short-life statuscertain the archaeologist must assume there to be a high chance of asubstantial old-wood effect being present.
"
if
.
",'

~
"
A Proposed Adjustment for the Old-Wood Effect 163
This was clearly the opinion of M. Jope when, in a recent paper (1986),he stressed the advantages of using samples with the best credentials,particularly the status of short-life. However he dismissed all other sampleswith the observation that « no amount of statistical manipulation will yieldcalendric dates of meaningful accuracy out of data from samples that do notmeet these requirements ». In the best of all possible worlds this argument isreasonable, but in the real world the archaeologist is too often forced to usewhat is available to him rather than what he would wish to have. There arealready in existence thousands of radiocarbon dates whose sample criteria arepoor in respect of this particular quality, and which obviously could not bereplaced by better samples without duplicating past excavations. It is alsoquite clear that a substantial proportion of excavations quite simply fail toproduce samples having the short-life quality. It can confidently be predictedthat future excavators will have far more long-life samples available to themthan short-life, and they would be justifiably unwilling to dispense withradiocarbon dating on that account. We might also question the word« meaningful », for the precision required for archaeological work is veryvariable, and what is unacceptable to a historical archaeologist may well bequite acceptable to a prehistorian.
In the face of this problem the archaeologist will have three alternativeresponses available to him, only one of wbich is permissible. The first is toignore the old-wood effect, which is impermissible for the reasons given above.The second response is to dismiss from consideration those dates that show theeffect, which is impermissible on the grounds that there is no way ofobjectively predicting its presence. The third response is to adjust the date toallow for the effect. It is my contention that « statistical manipulation» ispossible, is justifiable, and should be obligatory. I outlined a simple procedurefor this some years ago (Warner, 1916), which now requires to be modified.
5. The age-lapse
The old-wood effect has quantifiable properties: it always makes thesample older than its cutting date, and it has a maximum permitted valuegoverned by the type and location of its parent plant and the nature of thesample. We shall call the estimate of this maximum value the estimated age-lapse for the sample. Now clearly if the sample is a leaf or a twig then theparent type is irrelevant and we can take the age-lapse and old-wood effect tobe insignificant (a short-life sample). If the sample is a small branch (the sap-wood being recognisable) we might be able to count the rings or estimate theorganic age of the whole sample. The old-wood effect is one-third of this,because the average age of a circular disk of wood with uniform thickness oftree-rings is two-thirds of the total age. In this particular case the old-woodeffect has a discrete value and we must simply shift the mean of the sampledate towards the present by that amount.
164 R.B. Warner
This is a trivial but unusual case. The real problem lies with thosesamples, the majority of radiocarbon samples, whose relationship to theoriginal source plant is unspecifiable. Clearly the sample will have come fromwithin a time span between zero and some age-lapse before the cutting date.
The age-lapse value will be a ~roperty of the source plant type, for instance itmay well be 400 years for forest oaks in favourable conditions, yet only 50years for birch trees (the likely values can be obtained from biologists). If theparent type is unknown it must be assumed to be the maximum likely for thecontext. An adjustment to the sample date need only reflect these rathersimple facts in order to turn it into a realistic estimate of the cutting date.
6. The adjustment
We come, therefore, to the method of the adjustment, the « correction»for the potential old-wood effect that will convert sample-dates to cutting-dates. It is obvious that (except in a few rare cases) we cannot simply movethe date upwards, for the age-span is a continuous distribution rather than adiscrete value. There may well be no old-wood effect and by moving the datewe simply reverse the problem. In 1976 I suggested the very simple expedientof placing a span equal to the estimated age-lapse at the mean of the date,spreading the date towards the present by that amount. By this 1976procedure if calibration was desired the conventional 14C age was to becalibrated and the chosen value of the age-lapse added to the upper limit ofthe calibrated range. There is no doubt that the resultant adjusted date-rangereflected the cutting date with a far greater reliability than with noadjustment at all, but as I shall show below this over-simple procedure madethe range estimate far more imprecise than was strictly necessary.
It is not only the estimate of the .date that has a probabilistic nature(which is approximately gaussian when the date is uncalibrated) but also theestimate of the age-lapse. In other words the likelihood of an organic samplehaving a particular old-wood effect value varies throughout the age-lapsespan. As the shape of the probability density curve of the adjusted date willbe that of the age-lapse acting upon that of the 14Cage estimate, and as ourcalculation of probability limits will depend on that shape, we must havesome idea of a likely, or at least acceptable, shape for our age-lapse densitycurve. In 1976 I suggested that a rectangular distribution might be acceptable.It might be argued that other distributions are mote realistic than therectangular in certain circumstances. For instance, we may be able confi-dently to claim that our sample originated in a single tree, and we might feelthat some easy rule, such as a general uniformity of ring width, might apply.In this case the curve shape would be triangular. Unfortunately I am reliablytold (M. Baillie, pers. comm.) that any assumption regarding a predictable orlinear connection between tree-ring width and age is unjustified. The IslandMacHugh histogram of fig. 1 may be held to support the notion of a non-
17
<JJ
~+::
A Proposed Adjustment for the Old-Wood Effect 165
timbers from Island MacHugh
'0
QIle
.g,c:
.9
~.c~0u
~='c: :median
0300 500 600400 date AD
Fig. 1. Summed histogram of timbers used in the construction phase of Island MacHugh(based on information supplied by M.G.L. Baillie).
rectangular curve, but we must remember that this was a special case ofselected construction wood, lacking the mixed general-purpose plant matterlikely to be present in most situations. In other words there is no justificationin choosing a particular distribution, and for the present purpose therectangular seems to be the least objectionable.
The mean old-wood value of a number of samples will have anexpectation of half the age-lapse for a rectangular (or any bisymmetrical)distribution. The examples I have described above indicate a mean old-woodvalue for long-life samples of just over 100 years, implying <lmean age-lapseof just over 200 years, which seems a very reasonable estimate, andconfirmation of our explanation of the effect.
The combination of two probability density curves is not a simpleprocedure. If I had decided upon a gaussian distribution for the age-lapse thecombination would have been mathematically easy but I am unaware of aready mathematical method to combine a gaussian and rectangular curve.The combination was, therefore, undertaken by computer' simulation. Thecomputer was used to simulate the effect of applying a rectangular age-lapseA to a gaussian date estimate M :t S, by the incremental addition ofrectangular slices of length A (the value of the age-lapse estimate) and ofheight equal to the probability density of the point on the gaussian 14C age
curve where each slice ~riginated. The results were calculated relative to Mbut are independent of it. It is obvious that the results are scale independent,so all variables were de-scaled. Clearly there is a choice of the de-scalingvariable (the common divisor) : we can use unit age-lapse or unit standard
166 R.B. Warner
deviation. The latter was chosen, so all results shown in table 1 are relative tounit S. The shape of the adjusted probability density curve was found, aswould be expected, to be symmetrical with its median shifted by the amount ofhalf the age-lapse towards the present from the original mean. When A/S wasvery small (less than 2) the cu~ve was indistinguishable from a gaussian curve
(M-A/2) :t JS2 + A212
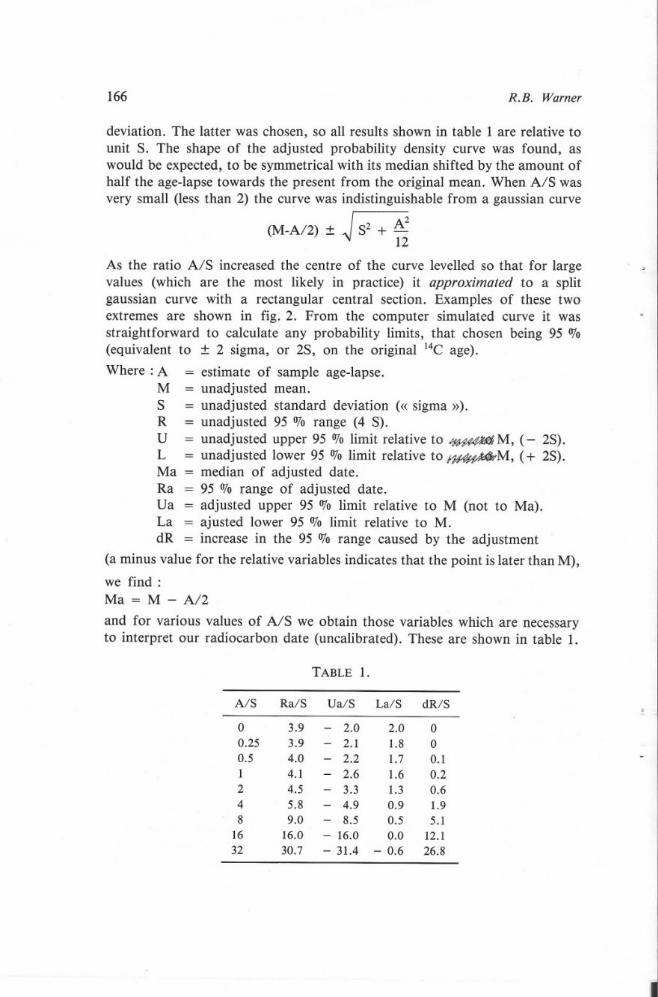
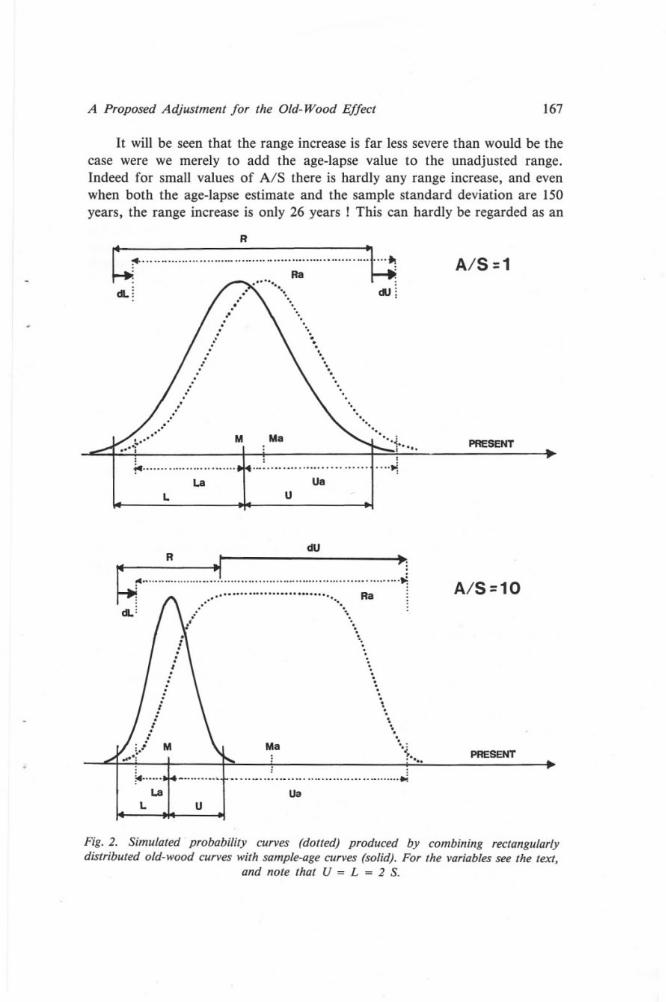
As the ratio A/S increased the centre of the curve levelled so that for largevalues (which are the most likely in practice) it approximated to a splitgaussian curve with a rectangular central section. Examples of these twoextremes are shown in fig. 2. From the computer simulated curve it wasstraightforward to calculate any probability limits, that chosen being 95 %(equivalent to :t 2 sigma, or 2S, on the original 14Cage).
Where: A = estimate of sample age-lapse.M = unadjusted mean.S = unadjusted standard deviation «< sigma »).R = unadjusted 95 % range (4 S).U = unadjusted upper 95 % limit relativeto ~ M, (- 2S).L = unadjusted lower 95 % limit relative to ft#'~M, (+ 2S).Ma = median of adjusted date.Ra = 95 % range of adjusted date.Ua - adjusted upper 95 % limit relative to M (not to Ma).La = ajusted lower 95 % limit relative to M.dR = increase in the 95 % range caused by the adjustment
(a minus value for the relative variables indicates that the point is later than M),we find:Ma = M - A/2
and for various values of A/S we obtain those variables which are necessaryto interpret our radiocarbon date (uncalibrated). These are shown in table 1.
TABLE 1.
A/S Ra/S DaiS La/S dRIS
0 3.9 - 2.0 2.0 00.25 3.9 - 2.1 1.8 00.5 4.0 - 2.2 1.7 0.11 4.1 - 2.6 1.6 0.22 4.5 - 3.3 1.3 0.64 5.8 - 4.9 0.9 1.98 9.0 - 8.5 0.5 5.1
16 16.0 - 16.0 0.0 12.132 30.7 - 31.4 - 0.6 26.8
A Proposed Adjustment for the Old-Wood Effect 167
It will be seen that the range increase is far less severe than would be thecase were we merely to add the age-lapse value to the unadjusted range,Indeed for small values of A/S there is hardly any range increase, and evenwhen both the age-lapse estimate and the sample standard deviation are 150years, the range increase is only 26 years! This can hardly be regarded as an
R
~~ ,.. "'00""" ~:.m... "'1:;. "". .elL ~ .' ' "'" cIJ ~. .", .." '.. ', ., '
... ..... .. ". ... '.. .~ \. .
: ~. .. .. .. .. ., ..,/ "'"
.,.' ""!"...' M Ma ",,:
.."; I ; 1" '"I
nu.'" """"" .u ~~ ..m .......La Ua
L U
~._.: ~ <IJ .; f\ ~~~...::~.:::::'.:::'~:::~::'::::'::""'" , ~elL: ,.' "'" Ra :
I \\'
.....\...
~r... ..Ma
.. :. .--~:. 00"""'..1U
A/S = 1
PRESENT
A/S =10
PRESENT
Fig. 2. Simulated' probability curves (dotted) produced by combining rectangularlydistributed old-wood curves with sample-agecurves (solid). For the variablessee the text,
and note that U = L = 2 S.
168 R.B. Warner
unacceptable decrease in precision by any standards. We also notice that fora given value of the age-lapse the range increase gets smaller as the samplestandard deviation gets larger and finally that while the upper limit movestowards the present, as expected, so does the lower limit, though at a slowerrate, passing the original me<!nwhen A/S = 16. Unfortunately I have notbeen able to discover a theoretical relationship to allow these values (Ra, Uaand La) to be calculated for given values of Sand A. I have, however, foundan empirical connection which gives very close agreement with the simulationover the range of values presented. It is :
D = S * 0.6209 * (A/S)1.1172D is a temporary variable from which we obtain:
Ua = - (L + D)Ra = 2 * (L + D) - ALa = L + D - A
dR = I 2 * D - A I
~
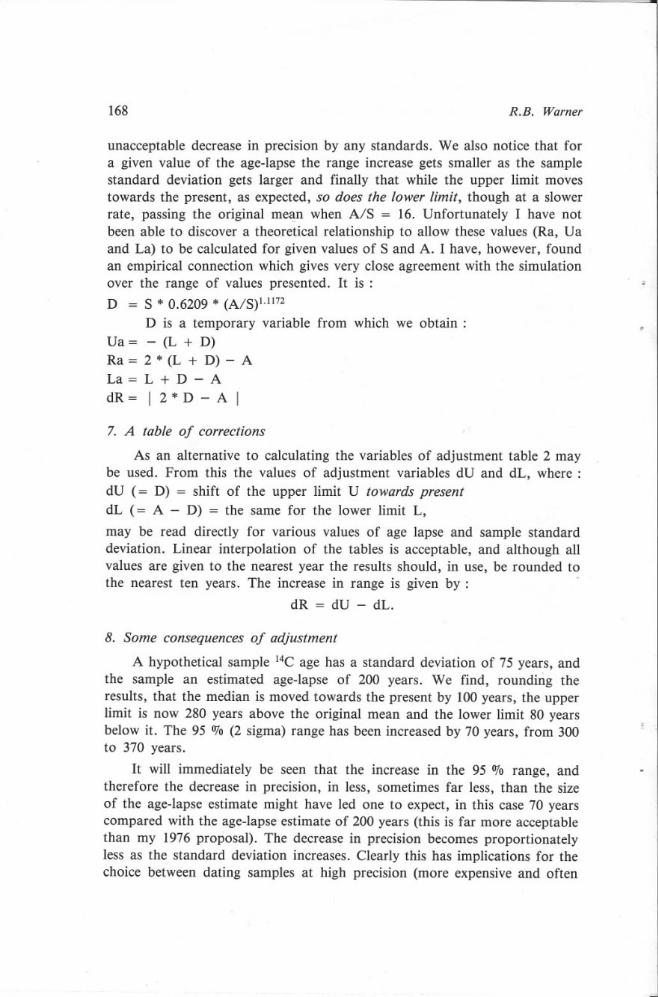
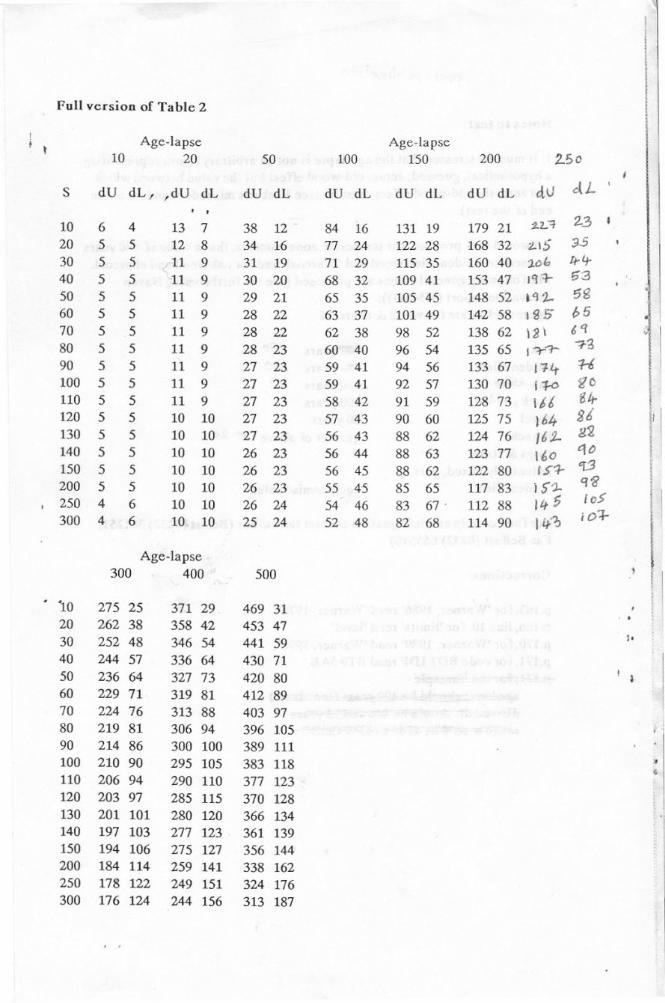
7. A table of corrections
As an alternative to calculating the variables of adjustment table 2 maybe used. From this the values of adjustment variables dU and dL, where:dU (= D) = shift of the upper limit U towards presentdL (= A - D) = the same for the lower limit L,
may be read directly for various values of age lapse and sample standarddeviation. Linear interpolation of the tables is acceptable, and although allvalues are given to the nearest year the results should, in use, be rounded tothe nearest ten years. The increase in range is given by :
dR = dU - dL.
8. Some consequences of adjustment
A hypothetical sample 14C age has a standard deviation of 75 years, andthe sample an estimated age-lapse of 200 years. We find, rounding theresults, that the median is moved towards the present by 100 years, the upperlimit is now 280 years above the original mean and the lower limit 80 yearsbelow it. The 95 0J0(2 sigma) range has been increased by 70 years, from 300to 370 years.
It will immediately be seen that the increase in the 95 0J0 range, andtherefore the decrease in precision, in less, sometimes far less, than the sizeof the age-lapse estimate might have led one to expect, in this case 70 yearscompared with the age-lapse estimate of 200 years (this is far more acceptablethan my 1976 proposal). The decrease in precision becomes proportionatelyless as the standard deviation increases. Clearly this has implications for thechoice between dating samples at high precision (more expensive and often
A Proposed Adjustment for the Old-Wood Effect 169
requiring more material) and lower precision, and for the choice of sampletype between short-life and long-life (which is likely to be commoner). Thechoice is further complicated when an error multiplier is to be applied (Scottet al., 1983), this often being relatively more severe on high precision thanlow precision dates.
It is, for example, not unlikely that a particular context would provideenough short-life material for a low precision date but not enough for a highprecision one (except at very much increased cost). Let us suppose that twosample types are available from a particular context. Let us further suppose a14Cage determination of precision 30 years can be provided on a bulkysample of charcoal whose age-lapse we must estimate at 200 years. Alternati-vely we only have enough twigs to provide a 14Cage with a low precision of70 years, but an age-lapse of zero. If age-lapse could be ignored, as has beenthe usual practice, there would be no contest. The 14Cage ranges would be,respectively, 120 years for the long-life sample and 280 years for the twigs, alarge enough difference to justify the greater cost of the high precision date.But age-lapse must not be ignored, and Jope would advise using only thetwigs. If, on the other hand, we use the adjustment advocated here the rangesbecome 240 and 280 years for the two samples. In this case it may well bedecided to go for the cheaper, and only slightly less precise option.
We should also note that there is little advantage in choosing short-lifesamples when the precision is low for all the dates (for instance if errormultipliers are applied, or if all sample quantities are small). For example, wemay consider two 14Cage determinations with standard deviation 120 years,one with an age-lapse of zero and one with an age-lapse of 200 years. Theranges are 480 and 520 years respectively, which may be considered a minordifference.
9. Calibration and the age-lapse adjustment
The discussion so-far has been on the basis of uncalibrated 14Cages. Asthe old-wood effect is a quality of a sample in real years it is clear thatadjustment for the effect ought to be made to the date after calibration.Preferably this would be done by computer as part of a process ofprobabilistic incremental calibration. But this method of calibration is, atpresent, the subject of debate and not yet to be recommended. Until suchtime as a continuous probabilistic algorithm is agreed, and computerprograms made widely available, I would recommend the following procedure(which gives acceptable results). The radiocarbon date, duly adjusted forlaboratory bias and is~topic fractionation by the laboratory should becalibrated according to an accepted procedure on a recently publishedcalibration curve to obtain a 95 O!o(2 sigma) probability range. It must benoted that some calibration tables, such as that of Stuiver & Pearson (1986,
170 R.B. Warner
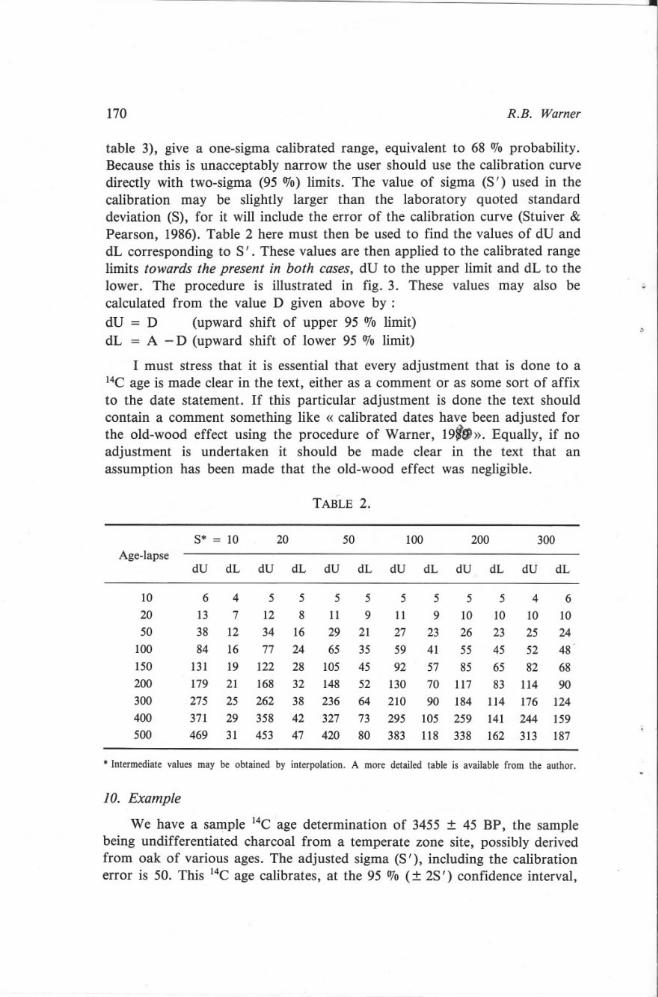
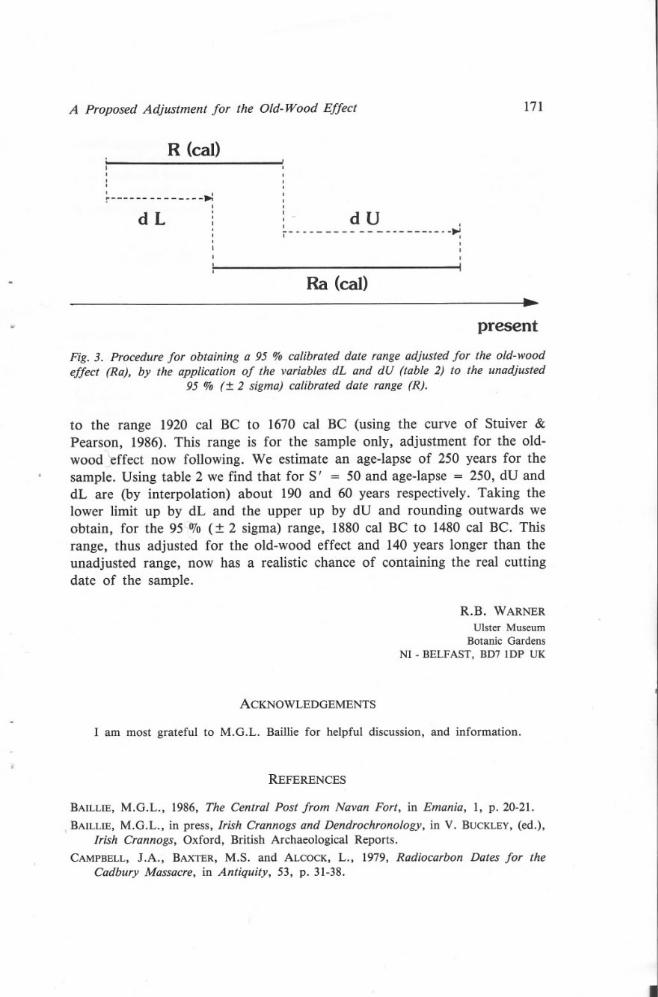
table 3), give a one-sigma calibrated range, equivalent to 68 % probability.Because this is unacceptably narrow the user should use the calibration curvedirectly with two-sigma (95 %) limits. The value of sigma (S') used in thecalibration may be slightly larger than the laboratory quoted standarddeviation (S), for it will include the error of the calibration curve (Stuiver &Pearson, 1986). Table 2 here must then be used to find the values of dU anddL corresponding to S'. These values are then applied to the calibrated rangelimits towards the present in both cases, dU to the upper limit and dL to thelower. The procedure is illustrated in fig. 3. These values may also becalculated from the value D given above by :dU = D (upward shift of upper 95 % limit)dL = A - D (upward shift of lower 95 % limit)
I must stress that it is essential that every adjustment that is done to a14Cage is made clear in the text, either as a comment or as some sort of affixto the date statement. If this particular adjustment is done the text shouldcontain a comment something like « calibrated dates have been adjusted forthe old-wood effect using the procedure of Warner, 19"'». Equally, if noadjustment is undertaken it should be made clear in the text that anassumption has been made that the old-wood effect was negligible.
;
"
* Intermediate values may be obtained by interpolation. A more detailed table is available from the author.
10. Example
We have a sa~ple 14C age determination of 3455 ~ 45 BP, the samplebeing undifferentiated charcoal from a temperate zone site, possibly derivedfrom oak of various ages. The adjusted sigma (S '), including the calibrationerror is 50. This 14C age calibrates, at the 95 % (~ 2S ') confidence interval,
TABLE 2.
S* = 10 20 50 100 200 300
Age-lapsedU dL dU dL dU dL dU dL dU dL dU dL
10 6 4 5 5 5 5 5 5 5 5 4 6
20 13 7 12 8 11 9 11 9 10 10 10 10
50 38 12 34 16 29 21 27 23 26 23 25 24
100 84 16 77 24 65 35 59 41 55 45 52 48
150 131 19 122 28 105 45 92 57 85 65 82 68
200 179 21 168 32 148 52 130 70 117 83 114 90
300 275 25 262 38 236 64 210 90 184 114 176 124
400 371 29 358 42 327 73 295 105 259 141 244 159 ,500 469 31 453 47 420 80 383 118 338 162 313 187
A Proposed Adjustment for the Old-Wood Effect 171
R (cal).IIII
~ :. I,
IIdL
I
: d U _n ~: :,- I
Ra (cal)..
presentFig. 3. Procedurefor obtaining a 95 % calibrateddate range adjusted for the old-woodeffect (Ra), by the application of the variablesdL and dU (table 2) to the unadjusted
95 % (::t2 sigma) calibrated date range (R).
to the range 1920 cal BC to 1670 cal BC (using the curve of Stuiver &Pearson, 1986). This range is for the sample only, adjustment for the old-wood~effect now following. We estimate an age-lapse of 250 years for thesample. Using table 2 we find that for S' = 50 and age-lapse = 250, dU anddL are (by interpolation) about 190 and -60 years respectively. Taking thelower limit up by dL and the upper up by dU and rounding outwards weobtain, for the 95CDJo(:!: 2 sigma) range, 1880 cal BC to 1480 cal BC. Thisrange, thus adjusted for the old-wood effect and 140 years longer than theunadjusted range, now has a realistic chance of containing the real cuttingdate of the sample.
R.B. WARNERUlster Museum
Botanic GardensNI - BELFAST, BD? lDP UK
ACKNOWLEDGEMENTS
I am most grateful to M.G.L. Baillie for helpful discussion, and information.
REFERENCES
BAILLlE, M.G.L., 1986, The Central Post from Navan Fort, in Emania, 1, p. 20-21.
,BAILLlE, M.G.L., in press, Irish Crannogs and Dendrochronology, in V. BUCKLEY,(ed.),Irish Crannogs, Oxford, British Archaeological Reports.
CAMPBELL,l.A., BAXTER,M.S. and ALCOCK, L., 1979, Radiocarbon Dates for theCadbury Massacre, in Antiquity, 53, p. 31-38.
172 R.B. Warner
ECKSTEIN, D., BAILLIE, M.G.L. and EGGER, H., 1984, Dendrochronological Dating(Handbooks for Archaeologists, n° 2). Strasbourg, European Science Foundation.
IYENS,R. and SIMPSON,D.D.A., in press, The Re-excavation of Island MacHugh, in V.BUCKLEY,(ed.), Irish Crannogs, Oxford, British Archaeological Reports.
lOPE, E.M., 1986, Sample Credentials for High-precision l4C Dating, in Radiocarbon, 28(3), p. 1060-1064.
LYNN, C.l., 1986, Navan Fort, in Emania, 1, p. 11-19.
MOOK, W.G. and WATERBOLK,H.T., 1985, Radiocarbon Dating (Handbooks forArchaeologists, n° 3), Strasbourg, EGiOpean Science Foundation.
SCOTT, E.M., BAXTER, M.S. and AITCHISON,T.C., 1983, A Comparative View ofCalibration, in OTTAWAY, B.S. (ed.), Archaeology, Dendrochronology and theRadiocarbon Calibration Curve, Edinburgh, University Press, p. 37-41.
STUIVER,M. and PEARSON,G.W., 1986, High-precision Calibration of the RadiocarbonTime-scale, AD 1950-500 BC, in Radiocarbon, 28 (2B), p. 805-838.
WARD, G.K. and WILSON, S.R., 1978, Procedures for Comparing and CombiningRadiocarbon Age Determinations: a Critique, in Archaeometry, 20 (1), p. 19-31.
WARNER,R.B., 1976, Further Notes for Users of Radiocarbon Dates, in Irish Archaeologi-cal Research Forum, 3 (2), p. 25-44.
WATERBOLK,H.T., 1971, Working with Radiocarbon Dates, in Proceedings of thePrehistoric Society, 37, p. 15-33.
WILLKOMM,H., 1983, The Reliability of Archaeologic Interpretation of l4C Dates, inRadiocarbon, 25 (2), p. 645-646.
;
~
COMMENTS
~5JBecker :
« Formal adjustment» of the so called « old-wood» effect is extremely dangerous: itdepends strongly from the age of the trees, which have been used. In the Mediterraneantree there can be time ranges of 400-500 years, in other cases probably only 10-50 years.Adjustment is only possible, when the age structure of the wood samples is known.
Warner:
The text answers this apparent objection.
."
f°S.t--plA~"~,,T,c}\'\
Notes to text:
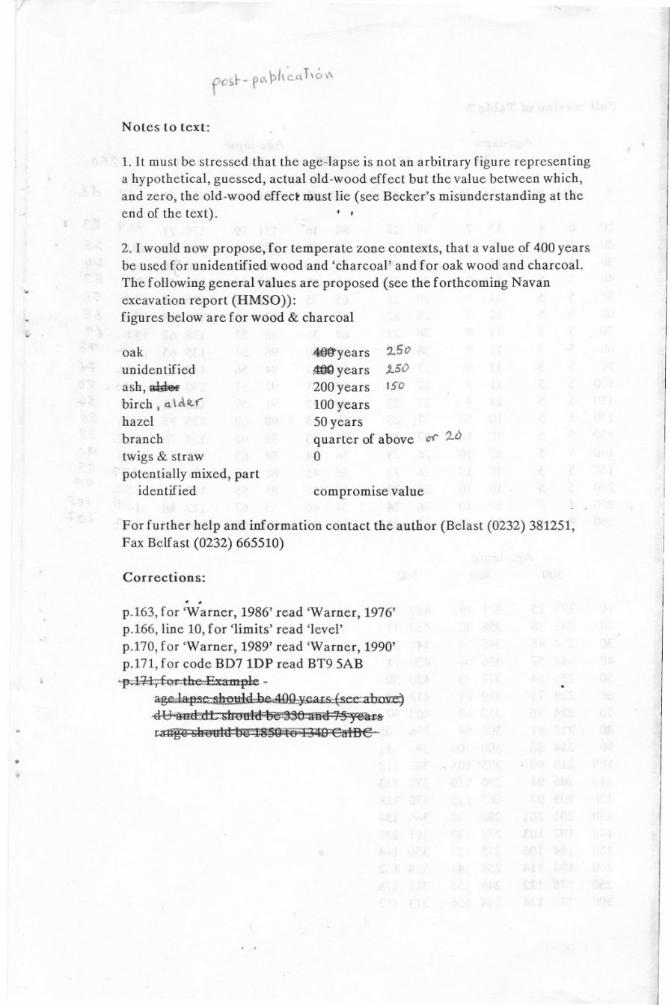
1. It must be stressed that the age-lapse is not an arbitrary figure representinga hypothetical, guessed, actual old-wood effect but the value between which,and zero, the old-wood effect D)ust lie (see Becker's misunderstanding at theend of the text). . .
2. I would now propose, for temperate zone contexts, that a value of 400 years
be used £fr unidentified wood and 'charcoal' and for oak wood and charcoal.The following general values are proposed (see the forthcoming Navanexcavation report (HMSO)):figures below are for wood & charcoal
~
oakunidentified
. ash,~birch I d.\d~("
hazelbranch
twigs & strawpotentially mixed, part
identified
2..50
J..SO15'0
"'years- years200years100 years50 yearsquarter of above0
~ 2b
comeromise value
For further help and information contact the author (Belast (0232) 381251,Fax Belfast (0232) 665510)
Corrections:
p.163,for'VVarner, 1986' read 'VVarner,1976'p.166, line 10, for 'limits' read 'level'p.170, for 'VVarner, 1989' read 'VVarner, 1990'p.l71, for code BD7 1DP read BT9 5AB
'~l;fol th( PA.\I'nr1~-4g~141,f1~c:~b~~Q)""'UJ;;(~I.. ,,1111~~iktd:d:L~h-ttuld-b~ '30 a-a i.5 )~~~ ~~1i1Q bt>IDlIg.,L.lJ~.CalBC
.;;
Full version of Table 2
IAge-lapse Age-lapset t
10 20 50 100 150 200 2-50
S dO dL t t dO dL dO dL dU dL dO dL dO dL clu dL '
. .
179 21 :2.2-":f 2.3 I10 6 4 13 7 38 12 - 84 16 131 1920 5 5 12 8 34 16 77 24 122 28 168 32 2.15 9-5
30 5 5<;:11
9 31 19 71 29 115 35 160 40 lOb trlf-40 5 5 11 9 30 20 68 32 109 41 153 47 JCJ 6"3
50 5 5 11 9 29 21 65 35 105 45 148 52 tCf2- g60 5 5 11 9 28 22 63 37 101 49 142 58 ,gS b570 5 5 11 9 28 22 62 38 98 52 138 62 \ 2 \ 6180 5 5 11 9 28 23 60 40 96 54 135 65 I--:r---r -:r
90 5 5 11 9 27 23 59 41 94 56 133 67 11Lt 1--6
100 5 5 11 9 27 23 59 41 92 57 130 70 11-0 go110 5 5 11 9 27 23 58 42 91 59 128 73 16£ St,.120 5 5 10 10 27 23 57 43 90 60 125 75 }64 Si
ii130 5 5 10 10 27 23 56 43 88 62 124 76 162- g2 I140 5 5 10 10 26 23 56 44 88 63 123 77 160 t:fo I150 5 5 10 10 26 23 56 45 88 62 122 80 r5""1- 't9
!200 5 5 10 10 26 23 55 45 85 65 117 83 i S'J- '1'8
I
250 4 6 10-
67. 112 88 J4- 5 /05I 10 26 24 54 46 83
300 4 6 10 10 25 24 52 48 82 68 114 90 Ill-iO'+
Age-lapse -300 400 500 j
t>
"10 275 25 371 29 469 31 I I, .
20 262 38 358 42 453 4730 252 48 346 54 441 59 1.
40 244 57 336 64 430 7150 236 64 327 73
'420 80 . a
60 229 71 319 81 412 8970 224 76 313 88 403 9780 219 81 306 94 396 105 l
90 214 86 300 100 389 111100 210 90 295 105 383 118 :»
110 206 94 290 110 377 123120 203 97 285 115 370 128130 201 101 280 120 366 134 :"140 197 103 277 123 361 139150 194 106 275 127 356 144200 184 114 259 141 338 162250 178 122 249 151 324 176300 176 124 244 156 313 187
qdJ.\'h~VJ I'D pd:f 2-.01'3
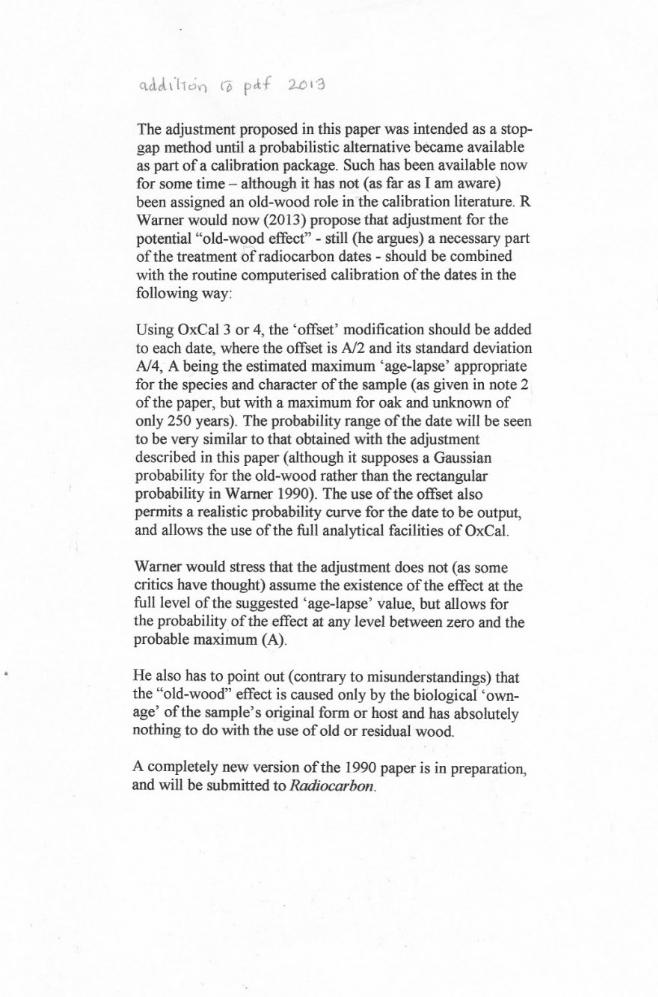
The adjustment proposed in this paper was intended as a stop-gap method until a probabilistic alternative became availableas part of a calibration package. Such has been available nowfor sometime- althoughit hasnot (as far as I am aware)been assigned an old-wood role in-the calibration literature. RWarner would now (2013) propose that adjustment for thepotential "old-wood effect" - still (he argues) a necessary partof the treatment~f radiocarbon dates - should be combinedwith the routine computerised calibration of the dates in thefollowing way:
Using OxCal3 or 4, the 'offset' modification should be addedto each date, where the offset is Al2 and its standard deviationAl4,.A b~eingthe estimated maximum 'age-lapse' appropriatefor the species and character of the sample (as given in note 2of the paper, but with a maximum for oak and unknown ofonly 250 years). The probability range of the date will be seento be very similar to that obtained with the adjustmentdescribed in this paper (although it supposes a Gaussianprobability for the old-wood rather than die rectangularprobability in Warner 1990). The use of the offset alsopermits a realistic probability curve for the date to be output,and allows the use of the full analytical facilities of OxCal.
Warner would stress that the adjustment does not (as somecritics have thought) assume the existence of the effect at thefull level of the suggested 'age-lapse' value, but allows forthe probability of the .effectat any level between zero and theprobable maximum (A).
He also has to point out (contrary to misunderstandings) thatthe "old-wood" effect is caused only by the biological' own-age' of the sample's original form or host and has absolutelynothing to do with the use of old or residual wood.
A completely new version of the 1990 paper is in preparation,and will be submitted to Radiocarbon.
Copyright © 2022 FDOKUMEN