A pragmatic definition of therapeutic synergy suitable for clinically relevant in vitro...
25
A Pragmatic Definition of Therapeutic Synergy Suitable for Clinically Relevant In Vitro Multi-Compound Analyses Muhammad Kashif 1 , Claes Andersson 1 , Magnus ˚ Aberg 1,2 , Peter Nygren 3 ,TobiasSj¨oblom 4 Ulf Hammerling 1 , Rolf Larsson 1 , Mats G. Gustafsson 1,∗ 1 Uppsala University, Dept. of Medical Sciences, Cancer Pharmacology and Computational Medicine, Uppsala University Academic Hospital, SE-751 85 Uppsala, Sweden. 2 Currently at Uppsala University, Dept. of Engineering Sciences, Solid State Physics, P.O. Box 534, SE-75121 Uppsala, Sweden. 3 Department of Radiology, Oncology and Radiation Sciences, Uppsala University, Uppsala, Sweden. 4 Department of Immunology, Genetics and Pathology, Science for Life Laboratory, Uppsala University, Uppsala, Sweden. April 17, 2014 Abstract For decades the standard procedure when screening for candidate anti-cancer drug combinations has been to search for synergy, defined as any positive deviation from trivial cases like when the drugs are regarded as diluted versions of each other (Loewe additivity), independent actions (Bliss independence), or no interaction terms in a response surface model (no interaction). Here we show that this kind of conventional synergy analysis may be completely misleading when the goal is to detect if there is a promising in vitro therapeutic window. Motivated by this result, and the fact that a drug combination offering a promising therapeutic window seldom is interesting if one of its constituent drugs can provide the same window alone, the largely overlooked concept of therapeutic synergy (TS) is reintroduced. In vitro TS is said to occur when the largest therapeutic window obtained by the best drug combination cannot be achieved by any single drug within the concentration range studied. Using this definition of TS we introduce a procedure that enables its use in modern massively parallel experiments supported by a statistical omnibus test for TS designed to avoid the multiple testing problem. Finally we suggest how one may perform TS analysis, via computational predictions of the reference cell responses, when only the target cell responses are available. In conclusion, the conventional error-prone search for promising drug combinations may be improved by replacing conventional (toxicology-rooted) synergy analysis with an analysis focused on (clinically motivated) TS. Keywords : Cancer, Synergy analysis, Combinations, Clinical, AEs models. Financial Support: This project has been partly supported from the Higher Education Commission of Pakistan (MK) as well as by the Swedish Foundation for Strategic Research framework project ”Tools for diagnostics and drug development in cancer” (RBa08-0114). No conflict of interest:There are no actual, potential, or perceived conflict of interest with regard to the manuscript submitted for review. Corresponding author: Mats Gustafsson, Uppsala University, Dept Medical Sciences, Akademiska sjukhuset 751 85 Uppsala Sweden, Phone: 018-611 4241, Fax:018-611 3703, e-mail: [email protected] Word Count 4900, Total number of figures 6 1
-
Upload
independent -
Category
Documents
-
view
1 -
download
0
Transcript of A pragmatic definition of therapeutic synergy suitable for clinically relevant in vitro...

A Pragmatic Definition of Therapeutic Synergy Suitable for Clinically
Relevant In Vitro Multi-Compound Analyses
Muhammad Kashif1, Claes Andersson1, Magnus Aberg1,2, Peter Nygren3, Tobias Sjoblom4
Ulf Hammerling1, Rolf Larsson1, Mats G. Gustafsson1,∗
1Uppsala University, Dept. of Medical Sciences, Cancer Pharmacology and Computational Medicine, Uppsala University Academic Hospital, SE-751 85 Uppsala, Sweden.
2Currently at Uppsala University, Dept. of Engineering Sciences, Solid State Physics, P.O. Box 534, SE-75121 Uppsala, Sweden.
3Department of Radiology, Oncology and Radiation Sciences, Uppsala University, Uppsala, Sweden.
4Department of Immunology, Genetics and Pathology, Science for Life Laboratory, Uppsala University, Uppsala, Sweden.
April 17, 2014
Abstract
For decades the standard procedure when screening for candidate anti-cancer drug combinations has been to search
for synergy, defined as any positive deviation from trivial cases like when the drugs are regarded as diluted versions of
each other (Loewe additivity), independent actions (Bliss independence), or no interaction terms in a response surface
model (no interaction). Here we show that this kind of conventional synergy analysis may be completely misleading when
the goal is to detect if there is a promising in vitro therapeutic window. Motivated by this result, and the fact that a
drug combination offering a promising therapeutic window seldom is interesting if one of its constituent drugs can provide
the same window alone, the largely overlooked concept of therapeutic synergy (TS) is reintroduced. In vitro TS is said
to occur when the largest therapeutic window obtained by the best drug combination cannot be achieved by any single
drug within the concentration range studied. Using this definition of TS we introduce a procedure that enables its use
in modern massively parallel experiments supported by a statistical omnibus test for TS designed to avoid the multiple
testing problem. Finally we suggest how one may perform TS analysis, via computational predictions of the reference
cell responses, when only the target cell responses are available. In conclusion, the conventional error-prone search for
promising drug combinations may be improved by replacing conventional (toxicology-rooted) synergy analysis with an
analysis focused on (clinically motivated) TS.
Keywords: Cancer, Synergy analysis, Combinations, Clinical, AEs models.
Financial Support: This project has been partly supported from the Higher Education Commission of Pakistan (MK) as well as by theSwedish Foundation for Strategic Research framework project ”Tools for diagnostics and drug development in cancer” (RBa08-0114). No conflictof interest:There are no actual, potential, or perceived conflict of interest with regard to the manuscript submitted for review.Corresponding author: Mats Gustafsson, Uppsala University, Dept Medical Sciences, Akademiska sjukhuset 751 85 Uppsala Sweden, Phone:018-611 4241, Fax:018-611 3703, e-mail: [email protected] Count 4900, Total number of figures 6
1

A Pragmatic Definition of Therapeutic Synergy 2
Introduction
Multi-compound treatment of cancer as well as other complex diseases is already a well established practice in clinical
settings. This area has nonetheless attracted mounted interest in recent years due to vast unexplored prospects for future
pharmacotherapeutic gains (1–6). This development is also partly driven by a systems biology perspective acknowledging
that many cellular processes are difficult to control using a single drug compound, and partly by modern high throughput
laboratory equipment that make multi-compound screening fast and cost effective.
One of the bottlenecks in this development is the lack of powerful methods for detection and analysis of useful drug
combinations already at the early stages of the drug development process. Conceptually, the current practice in drug
synergy analysis may be divided into two different strategies (7). The traditional one is to detect deviations from additivity
as suggested by Loewe (8, 9) or from independence as outlined by Bliss (10). The second dominating strategy evaluates
synergy in terms of the estimate of at least one interaction parameter in a response surface model, essentially according to
that introduced by Box (11), estimated directly from data. For reviews of the broad range of already reported approaches
to synergy analysis, see the influential paper by Berenbaum (12), the critical survey by Greco and co-workers (7) and the
mechanistic perspectives provided by Chou (13).
It is worth noting that the current practice in synergy analysis mainly has its intellectual roots in toxicology where the
main aim is to detect synergistic harmful effects of a multi-compound provocation. In that case, it is natural to search for
strong deviations from models of trivial interactions suggesting that something potentially hazardous and mechanistically
interesting occurs. By contrast, in synergy analysis used in pharmacology for drug discovery and development, one is
usually only interested in drug combinations with large therapeutic windows characterized by relatively strong desirable
(therapeutic) effects compared to the associated adverse effects (AEs). Thus, in this pharmacological context the detections
made in a classical synergy analysis are only interesting in the quite uncommon situation when the AEs are negligible
and/or approximately equal for all combinations studied. It thus seems natural and promising to develop an alternative
synergy analysis, clinically and pharmacologically motivated, based on a therapeutic index (TI) that reflects an in vitro
therapeutic window.
Although therapeutic synergy (TS) based on a TI has been explicitly ignored for example in the already mentioned
review by Greco and co-workers (7), its importance has been acknowledged many times in the past (2, 4, 14, 15). The
concept ”therapeutic synergism” was probably introduced for the first time in 1956 by Venditti et al. (16) and is simply
defined to occur whenever a combination treatment provides improved therapy compared with the best-component single-
drug therapy (17–19). The importance of TS was strongly emphasized in a review by Goldin and Mantel the following
year where they wrote (p.635) (20):
”The increasing use of drug combinations in non-therapeutic situations such as in mixtures of insecticides,
fungicides, or other poisons has tended to lead the evaluation of effectiveness of drug combinations in a direction
different from that applicable in the therapeutic case. In place of evaluations in terms of improvement of therapy,
drug combinations were evaluated on the basis of the extent of biological effect produced.”
Seemingly, with few exceptions only, their concern have had little impact on the subsequent development in pharmaco-

A Pragmatic Definition of Therapeutic Synergy 3
logical synergy analysis. Considering that the importance of TS in drug development was stressed already in the 1950s and
that the Carter group developed powerful tools for its analysis and optimization over the subsequent decades (19, 21–26),
we find it quite remarkable that current practices in pharmaceutical synergy analysis are still chained to synergy according
to Loewe, Bliss, and different response surface models. Presently there are very few reports addressing analysis and opti-
mization of TS. One such example is a general approach suggested by Carter and co-workers where optimal concentration
mixtures are found to control the physiological state of individual patients by searching for the maximum of a desirability
function in which therapeutic effects as well as AEs may be embedded (27). Another example is a concentration mixture
optimization method proposed by Curatolo and co-workers where AEs are taken into account explicitly but so far only
results from computer simulations have been reported and the method has practical limitations as it requires estimation
of AE model parameters from real data (28, 29).
The work presented here emerged from the two general conclusions that that classical synergy analyses can be com-
pletely misleading in terms of detecting large therapeutic windows and that the potential of synergy analysis taking AEs
into account is still largely unexplored. Therefore we first present examples demonstrating when classical synergy analysis
would have been completely misleading with respect to the actual presence/absence of a therapeutic window. Then we
introduce a formal definition of TS and present results from a TS analysis supported by an omnibus statistical test de-
signed to circumvent the multiple testing problem which comes with the massively parallel experiments being performed.
Finally we present a first generation of predicted reference cell models which could be used to perform TS when there is
no reference cell model available.
For convenience but without any loss of generality, we have chosen to restrict the synergy analysis to pairs of drugs and
the application in mind is anti-cancer drug development. Below, the ideas are formalized and results from application to
experimental in vitro cell culture drug resistance assays are presented. To illustrate the principle as well as the generality
of the TS approach, in our experiments we were comparing three different pairs of isogenic colorectal cancer cell lines,
each consisting of one (WT) cell line and one genetically modified subtype in which the clinically important mutated
KRAS or BRAF allele had been knocked out (for details see M & M). This means that we are searching for a TS defined
to occur when the clinically challenging WT cell line, the target, is killed while the genetically modified subtype (the
reference) is relatively unaffected. The use of these model pairs instead of more conventional alternatives is intended to
show that the TS concept is not limited to comparing the difference in treatment effect between a non-malignant cell
model and a malignant counterpart; the difference may be defined by any pair consisting of one reference cell model, which
should not be affected by the drug combination, and one clinically challenging target cell model which should be eradicated.
A Pragmatic Definition of Therapeutic Synergy 4
Materials and Methods
Human cell lines
In the combinatorial experiments three pairs of isogenic cell lines were employed. The first pair consists of the human
colorectal carcinoma cell line HCT116 and its variant HCT116KRASwt/- with the only difference being that the mu-
tant KRAS allele has been knocked out. The second pair consists of colon carcinoma cell line RKO and its derivative
RKOBRAFwt/-/- with the only difference being that the mutant BRAF V600E allele has been knocked out. The difference
between the third pair of isogenic cell lines, DLD-1 and its variant DLD-1KRASwt/- , is that the mutant KRAS allele is
knocked out in DLD-1KRASwt/-. The cell lines were obtained from Horizon Discovery Ltd, United Kindom (details about
the cell lines are available from the company website). The cell lines were authenticated by STR (short tandem repeat)
profiling (LGC Standards) by Horizon Discovery Ltd in 2012. No additonal authentication was done by the authors. All
cell lines were cultured in Mc-Coy’s 5a medium supplemented with 10% heat-inactivated fetal bovine serum, 2 mmol/ml
penicillin. These reagents were purchased from Sigma-Aldrich. The cells were cultured at 5% CO2 and 37 ◦C.
Drugs used
A total of 6 drugs used in the presented examples. 5FU and Oxaliplatin purchased from Sigma Aldrich Sweden, whereas
Sorafenib, Erlotinib and Sunitinib were obtained from LC Laboratories. An experimental drug, EIC600, was also used in
experiments.
FMCA based measurement of cytotoxicity
Drug effects on the cells were measured by means of fluorometric microculture cytotoxicity assay (FMCA) (30).
Cell survival is measured by measuring the fluorescence, generated from the hydrolysis of fluorescein diacetate
(FDA) to fluorescein by cells that have their plasma membranes intact after 72 h incubation with the compound.
This means that the assay (implicitly) detects cell death irrespective whether the loss of membrane integrity (cell
death) is preceded for example by apoptosis or necrosis. Compounds are added to the plates in a 2-fold dilution
series by using an Echo 550 acoustic liquid handler (Labcyte Inc). Every plate has wells with medium only that
serve as blank controls, as well as wells with medium and cells but without drugs that serve as growth control
wells. After incubation, wells are washed with PBS and then FDA is added to every well. These plates are
incubated for 40 min with FDA and the fluorescent signal is measured with Fluostar Optima, BMG Technologies,
Germany. The emitted fluorescence from the wells is proportional to the number of living cells in that well. The
measured intensity of the fluorescence is used to calculate the survival index as
S =fsample − fblankfcontrol − fblank
(1)
A Pragmatic Definition of Therapeutic Synergy 5
where fsample denotes the fluorescence signal from the well of the sample, fblank denotes the average fluorescence
signal from the blank wells and fcontrol denotes the average fluorescence signal from the growth control wells.
For an acceptable experiment the ratio of fluorescence signal between growth control wells and empty control
wells must be > 5. Moreover, an assay is only approved when the coefficient of variation, based on the control
wells only, is less than 30%.
Univariate statistical analysis
The two sample Mann-Whitney-Wilcoxon test was used to find significant differences in survival between reference
cells and target cells or between predicted reference cell survival and real target cell survival. The significance
level was set to 5% and in the resulting ”heatmaps” produced, the concentration combinations corresponding
to non-significant differences were displayed in green by simply resetting the observed non-significant difference
by the value zero. All calculations were performed in the statistical programming environment R (31) using the
function wilcox.test available in the package stat.
Standard non-linear least mean squares fitting was used to estimate the two unknown parameters IC50 and
H in the survival model
S(d) =1
1 +(
dIC50
)H(2)
where S(d) denotes the survival at concentration d. IC50 is the IC50 value for the drug considered and H denotes
the Hill coefficient that mainly determines the slope in the resulting graph. The fitting was performed in the
statistical programming environment R (31) using the function nls, available in the package stat, using default
settings.
Test for Therapeutic Synergy
Given our definition of TS (see below), for a single combination TS can be inferred by evaluating if the TI of that
combination is larger than the TI of the best single compound. However, when multiple concentration pairs are
considered in parallel, a large number of replicates are needed to provide enough statistical power for multiplicity
correction. Therefore we instead perform an omnibus (global) test for TS by considering the null hypothesis:
H0 : max(da,db)
T (da, db) ≤ max(d′
a,d′b)∈Msingle
T (d′a, d′b). (3)
Here T (da, db) denotes the TI (formally defined below) for a combination consisting of compound a at con-
centration da and of compound b at concentration db. Moreover Msingle is the set of single concentrations tested,
formally defined as the set Msingle = {(da, db)|da = 0 ∨ db = 0} where ∨ denotes logical OR. Thus, rejecting

A Pragmatic Definition of Therapeutic Synergy 6
H0 will suggest some TS between the compounds. The test statistic employed is w = max(da,db) T (da, db) −
max(d′a,d
′b)∈Msingle
T (d′a, d′b) where T are the observed TIs. The distribution of the test statistic under H0 is
derived computationally using a bootstrap estimate of the replicate error distribution. For more details, see the
supplementary material.
Results
As already mentioned, throughout this result section, either a KRAS or a BRAF knock-out cell line is used as
the reference to be left essentially unaffected while the corresponding WT cell line should be eradicated. This is
in analogy with a more conventional experiment in which a non-malignant cell line would act as the reference cell
and a malignant cell line, of the same or different tissue of origin, would be the target. The use of the isogenic
pairs instead of a more conventional pair, consisting of a ”normal” and a ”cancer” cell line model, is intended
to demonstrate the generality of the TS concept as well as to discover drug combinations being more active
against the clinically challenging mutants than the corresponding WT cell genotypes. All figures are labeled with
concentrations of single drugs used in combination and the unit used is µM.
A Formal Definition of a Pragmatic Therapeutic Index
A TI should, in the form of a single numerical value, quantify the balance between the desired effects in the target
cell line and the costly AEs in the reference cell line. Several formal definitions of the TI are conceivable, in this
work the following one is employed:
Definition of Therapeutic Index: For a concentration combination (da, db) used to treat reference and target
cell models, respectively, let Sr(da, db) denote the survival of the reference cells and St(da, db) denote survival of
the target cells. Then the resulting TI is defined as
T (da, db) = [Sr(da, db)]λ − St(da, db) (4)
where λ is a user defined parameter for weighting the reference cell survival (AE) relative to the desired effect.
The TI, as defined here, has the following convenient properties:
• Regardless of the value of λ, the TI is restricted to the interval [−1, 1] where the left endpoint is reached for
the worst case (Sr = 0, St = 1) and the right endpoint is reached for the ideal case (Sr = 1, St = 0).
• For λ = 1, the ”neutral” (middle) value T = 0 is obtained whenever the concentration combination kills the
A Pragmatic Definition of Therapeutic Synergy 7
same fraction of reference and target cells, that is when Sr = St. Thus, T = 0 may correspond to different
cases like Sr = St = 1 as well as Sr = St = 0.01.
• More generally, for any λ > 1, the ”neutral” value T = 0 is achieved when the fraction of surviving reference
cells is larger than the fraction of surviving target cells.
In all the results presented in this work we used λ = 1 which yields the simplified definition
T (da, db) = Sr(da, db)− St(da, db). (5)
Conventional Synergy Analysis May Be Completely Misleading
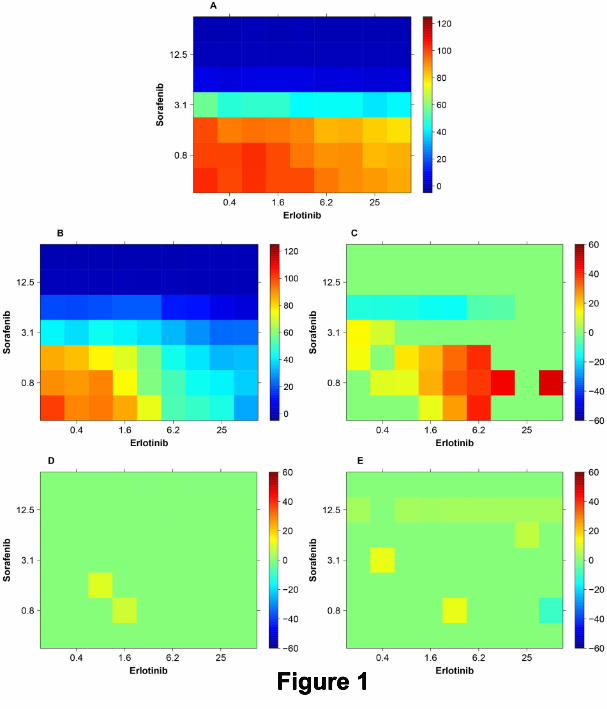
Figure 1 presents a first example of how the TI can be determined and visualized using data obtained directly
from a wet lab experiment. Here TIs are calculated for different concentration combinations of Erlotinib and
Sorafenib. In the panels A and B, survival surfaces (survival indices) are visualized as color coded ”heatmaps”
for the reference cells line (DLD-1KRASwt/-) and the target cell line (DLD-1), respectively, upon treatment with
this combination. The panel C shows the difference between the ”heatmaps” in A and B. The experiment was
performed in tetraplicate and the non-parametric Mann-Whitney-Wilcoxon test was used for each combination.
For all non-significant differences, at the 5% level, the value in the ”heatmap” is set to zero yielding a green square.
Significant positive TIs are colored gradually from yellow to red, according to the colorbar to the right. The most
significant positive TIs are obtained around the concentrations 6.2µM of Erlotinib and 0.8µM of Sorafenib.
These results suggest that at each of the concentration combinations where there is a significant difference,
there is a positive TI (therapeutic window) of potential use. In panel D, the result of a Bliss synergy analysis is
presented. For each concentration combination, a conventional Bliss analysis has been performed and using the
four experimental values available, an associated p-value has been calculated for the null hypothesis that there
is no synergy. Then, in the same way as in panel C, the values for the combinations without significant Bliss
synergy have been set to zero. By comparing panel C and D it is possible to identify those combinations for
which the conventional synergy analysis in panel D is completely misleading. In particular it suggests no synergy
around the most significant positive concentrations in panel C mentioned above. More generally, the Bliss analysis
suggests very limited effects whereas panel C suggests large therapeutic windows (indices) for combinations of
low concentrations of Sorafenib and intermediate concentrations of Erlotinib. Panel E presents Loewe synergy
results that also shows little synergy and therefore also fails to predict the promising TIs in panel C.
Note that although we are presenting the result of 7 × 9 different combinations in one image, each result
and the associated Mann-Whitney-Wilcoxon test should be considered as an isolated independent experimental
result. In other words, Figure 1 displays in one single heatmap the results of a set of independent experiments
A Pragmatic Definition of Therapeutic Synergy 8
in which a single concentration combination has been tested in each of them. Many synergy analyses reported in
the literature only test one or a few concentrations. Hence the p-values calculated and used here have not been
adjusted for multiple testing. As discussed in the next section, when a massively parallel experiment is performed
in which all concentration combinations are measured and evaluated simultaneously to detect if there is TS for
at least one of the concentration combinations, one has do address the multiple testing problem.
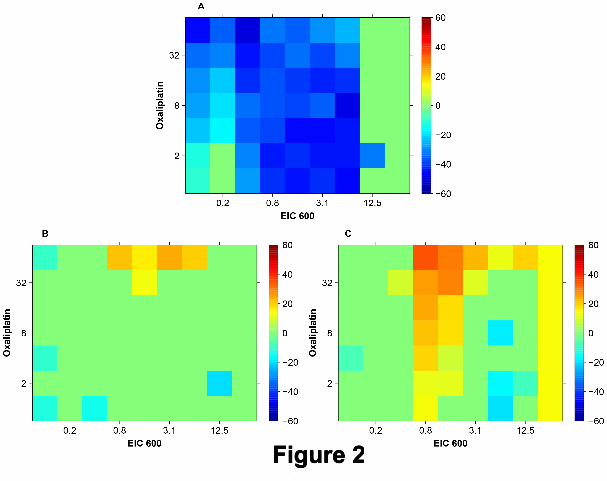
Figure 2 presents a second example where Bliss and Loewe synergy analyses are misleading. Here the TIs in
panel A are calculated based on different concentration combinations of EIC600 and Oxaliplatin exposed to the
cell models DLD-1 and DLD-1KRASwt/-. The results of a Bliss analysis in panel B show a strong isolated spot of
synergy for intermediate concentrations (0.8µM to 6.25µM ) of EIC600 and high concentrations (32µM and 64µM)
of Oxaliplatin. Similar results shown in panel C produced by a Loewe analysis suggest even stronger synergy,
especially in the upper part (EIC600 0.8µM to 3.1µM and Oxaliplatin 8µM to 64µM ). However, according to
panel A there is actually no in vitro therapeutic window at all.
Defining and Employing Therapeutic Synergy
A promising large TI should be of clinical interest only if this large TI is not achievable by any of the individual
drugs alone. When this happens the combination is said to provide a TS. In other words, TS is perceived to occur
for a concentration combination when the desired drug effect relative to the AEs is stronger for that combination
relative to any of the single drug treatments alone within the concentration range studied. This is equivalent to
the already discussed definition of TS, as proposed by Venditti et al. in 1956, considered by the Carter group,
and more recently discussed by Laska and coworkers (32). This definition of TS may be expressed formally as
follows (Note: In this definition the logical operator OR is denoted by ∨) :
Definition of TS: Let T (da, db) denote the TI for concentration combination (da, db). Also let Msingle be the
set of degenerated concentration combinations that contain only one of the drugs at a non-zero concentration:
Msingle = {(da, db)|da = 0 ∨ db = 0}. Then a concentration combination (da, db) is said to cause TS if
T (da, db) > max(d′
a,d′b)∈Msingle
T (d′a, d′b),
that is when its TI has a greater value than the highest achievable therapeutic index using either component drug
alone.
Employing the definition of TS introduced above one is able to go beyond the search for TIs illustrated in
Figures 1 and 2. One example of a resulting TS analysis is shown in Figure 3. Notably, by contrast to Figures 1

A Pragmatic Definition of Therapeutic Synergy 9
and 2, in Figure 3 also single drug responses are included. The spot of TIs at the upper left corner in panel E is
clearly higher than the TI for any single drug concentrations and the omnibus test used (see M & M) is indeed
suggesting that a TS has been detected (p=0.0471).
Also in this figure the color coding is based on individual non-adjusted p-values determined independently for
each concentration combination. However, in addition the omnibus test (see M & M) is also performed to test if
there is at least one concentration combination that provides TS. The main advantage of this omnibus test is that
one can avoid the classical approach of employing adjusted p-values using the Bonferroni correction or similar
which often are too conservative to yield any statistical significance. Thus, in the particular example presented
here the omnibus test rejects the null-hypothesis (p = 0.0471) which suggests that there is synergy for at least
one concentration combination.
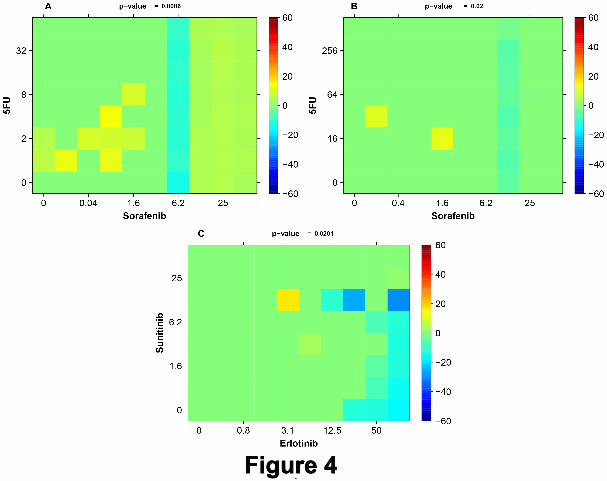
Figure 4 shows a set of additional examples of selected TSs. In panel A the combination of Sorafenib and 5FU
is detected (p = 0.0086) to yield TS with DLD-1 and DLD-1KRASwt/-. The most significant individual TIs are
obtained at around 0.08 µM of Sorafenib and 2 µM of 5FU. Panel B also shows a detected TS (p = 0.02) by the
same combination with RKO as target cells and RKOBRAFwt/-/- as reference cells. Here the two most significant
individual TIs are obtained for 0.02 µM of Sorafenib and 32 µM of 5FU as well as for 1.6 µM of Sorafenib and 16
µM of 5FU. In panel C the cell line models RKO and RKOBRAFwt/-/- produce TS (p=0.0201) with the most
significant individual TIs at 3.1 µM of Erlotinib and 12.5µM of Sunitinib.
Modeling Adverse Drug Effects Using Single Drug Responses
As already shown above, the employment of TI according to equation (5) used here requires access to the survival
(effect) surface describing reference cell toxicities (AEs) for the drug concentration combinations studied. Since
experimental modeling of reference tissue/cells in vitro may be expensive and time consuming, old studies often
lack experimental information about AEs. Therefore in this section we investigate to what extent models for AEs
derived directly from the individual drug concentration-response curves of the target cells studied are practically
useful. To obtain such AE models, first we make a simplifying assumption on how AEs of reference cells are
related to the target cell concentration-response curves. Because many malignant cells divide more rapidly
than non-malignant cells, they typically suffer a worse fare due to treatment. Thus, we propose a model for
reference cell survival that can be derived from the single drug survival function (the concentration-response
curve) of target cells supposing the difference in effect is solely due to the drug being killing cells only whilst
dividing, and that reference cells divide at a lower rate. This assumption can be expressed mathematically as
log[Sr(d)] = α · log[St(d)] or
Sr(d) = [St(d)]α, α ∈ [0, 1] (6)
A Pragmatic Definition of Therapeutic Synergy 10
where Sr(d) and St(d) denote survival of the reference and target cells, respectively, at concentration d. The
parameter α is user defined and should not be confused with the other user defined parameter λ introduced earlier.
Thus, the generality of this model is restricted by the assumption that, for single drug exposures, reference cells
can be regarded as drug resistant target cells with a constant degree of resistance across the entire concentration
range considered, as specified by the parameter α ∈ [0, 1]. At the two interval extremes, α = 0 would correspond
to total cytotoxic resistance in the reference cells, whereas α = 1 would translate to reference cells and target
cells being equally sensitive to cytotoxic action by the single drug treatment. More details about the underlying
probabilistic dynamical model of cytotoxic action in relation to cell growth that can motivate the above equation
is provided in the supplementary material.
Below, we show how one can use the classic Bliss and Loewe models to predict the entire concentration-
response surface. Doing so also add clarification to the relationship between classical synergy analysis and TS. In
particular, classical synergy analysis using either Bliss or Loewe can be regarded as an analysis of TS where one
assumes that the AEs follow either the Bliss or Loewe predictions. Using α = 1, the predicted TI of single drug
is zero for all concentrations. Therefore, in this case the difference between the predicted combination effect and
the observed combination effect will correspond to our measure of TS. However, we also note that using α = 1
for the AE model is contrived, exactly because it implies that none of the drugs tested can provide a positive TI
alone.
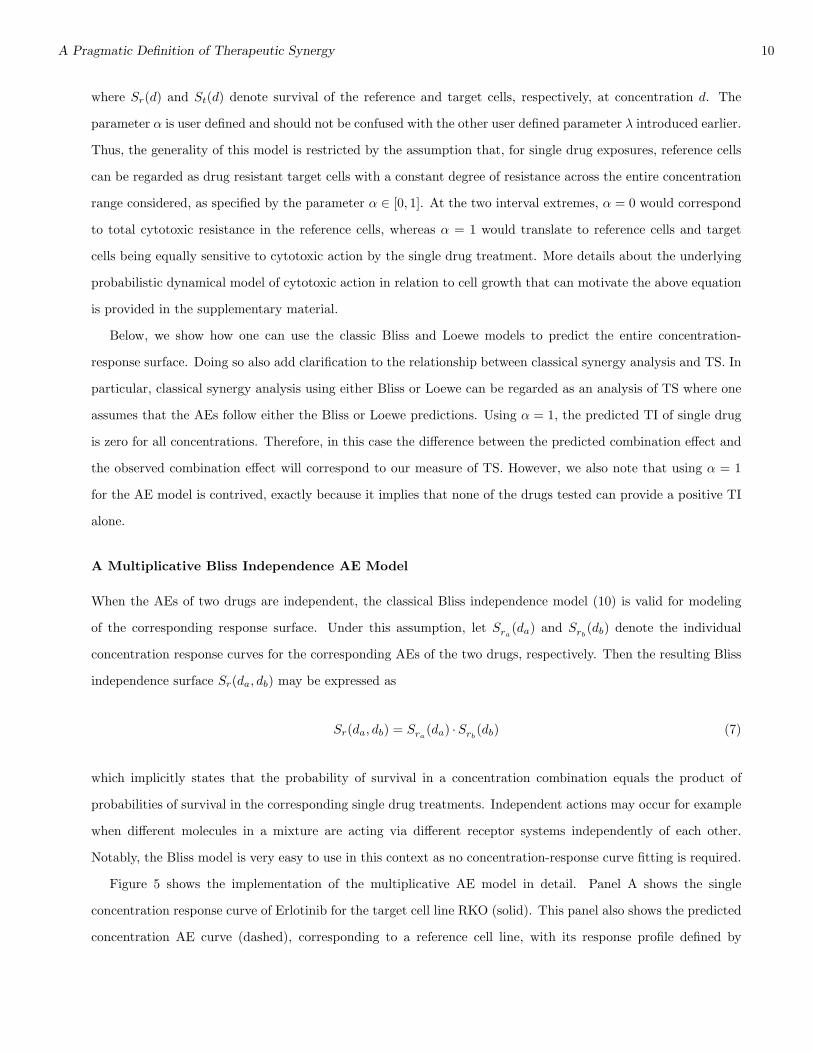
A Multiplicative Bliss Independence AE Model
When the AEs of two drugs are independent, the classical Bliss independence model (10) is valid for modeling
of the corresponding response surface. Under this assumption, let Sra(da) and Srb(db) denote the individual
concentration response curves for the corresponding AEs of the two drugs, respectively. Then the resulting Bliss
independence surface Sr(da, db) may be expressed as
Sr(da, db) = Sra(da) ·Srb(db) (7)
which implicitly states that the probability of survival in a concentration combination equals the product of
probabilities of survival in the corresponding single drug treatments. Independent actions may occur for example
when different molecules in a mixture are acting via different receptor systems independently of each other.
Notably, the Bliss model is very easy to use in this context as no concentration-response curve fitting is required.
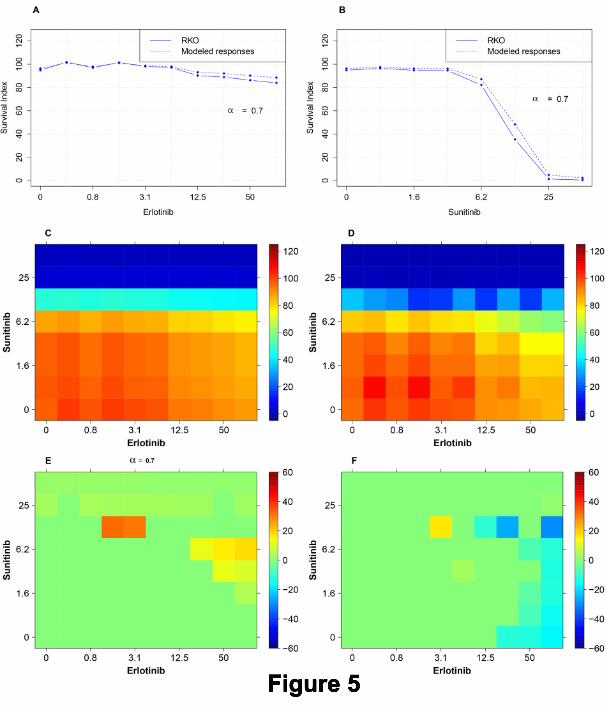
Figure 5 shows the implementation of the multiplicative AE model in detail. Panel A shows the single
concentration response curve of Erlotinib for the target cell line RKO (solid). This panel also shows the predicted
concentration AE curve (dashed), corresponding to a reference cell line, with its response profile defined by

A Pragmatic Definition of Therapeutic Synergy 11
means of equation (6) for α = 0.7 using the concentration response curve for RKO. Similarly, panel B of Figure
5 shows the corresponding results for the drug Sunitinib. In panel C, the modeled surface which was obtained
by means of equation (7), based on the predicted concentration AE curves shown in panels A and B (dashed), is
displayed. Panel D shows the experimental survival index surface for the target cell line RKO. Panel E shows the
predictive TIs obtained by subtracting the ”heatmap” of panel C (predicted survival of reference cells) from the
one in panel D (measured survival of target cells). Finally, panel F shows the experimental TIs obtained using
RKOBRAFwt/-/- as a reference. It can be seen that multiplicative AE model (Panel E) is useful as it contributes
to predicting synergy at spots similar to the positive experimental TIs in Panel F.
A Generally Applicable Additive AE Model
In situations where the drugs to be analyzed have similar and therefore competitive AEs, it is natural to model
the resulting AEs using a Loewe additivity model. Thus the idea is to create a response surface for the AEs
that correspond to Loewe additivity, for each level of survival s ∈ [0, 1]. To achieve this, for each value of s we
simply create a linear segment of the surface between the endpoints (Da(s), 0) and (0, Db(s)) of the standard
linear isobole defined as
daDa(s)
+db
Db(s)= 1. (8)
Here Dx(s) denotes the concentration of drug x ∈ {a, b} at which it yields the survival level s. This equation
may also be expressed more compactly as follows. Let Sra(da) and Srb(db) denote the individual concentration-
response curves for the two drugs, respectively. Using the corresponding inverse functions S−1ra and S−1
rb, one
may write Da(s) = S−1ra (s) and Db(s) = S−1
rb(s). Thus the response surface value Sr(da, db) may now be written
formally as
Sr(da, db) = argmins
∣∣∣∣∣ da
S−1ra (s)
+db
S−1rb (s)
− 1
∣∣∣∣∣ (9)
where the expression argmins J(s), for any function J(s), denotes the value s∗ that minimizes the function J(s).
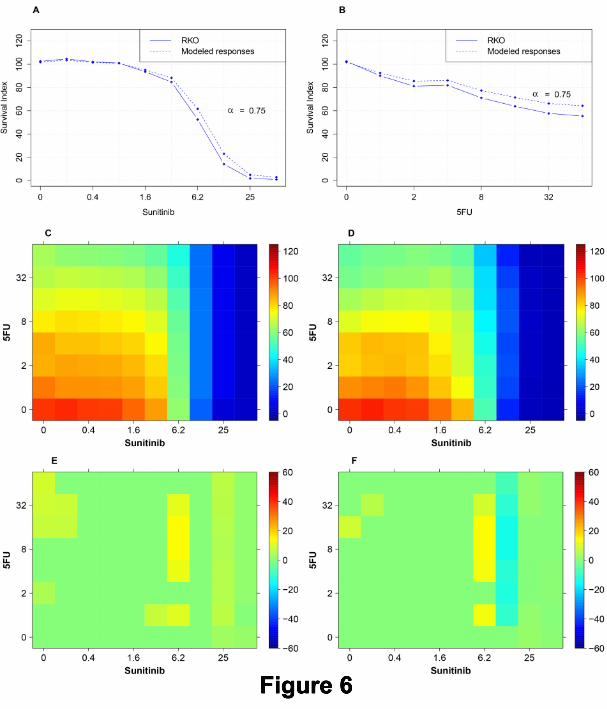
Here the use of this model is explained with an example, see Figure 6 for details.
In panels A and B the single concentration responses of Sunitinib and 5FU in the target cell line RKO are
shown (solid) in both graphs. These single concentration-response curves are used with α = 0.75 to obtain
predicted single concentration responses of Sunitinib and 5FU (dashed curves). After applying standard non-
linear curve fitting (see M & M) to obtain conventional Hill models of the form S(d) = dh
Kh+dh , the corresponding
inverse functions S−1(d) were employed in equation (9) to calculate the corresponding Loewe AE surface shown
in panel C. Panel D is the survival surface produced as a result of treatment of all concentration combinations of
Sunitinib and 5FU with the target cell line model RKO. The predicted TIs are shown in panel E as the difference
A Pragmatic Definition of Therapeutic Synergy 12
between the ”heatmaps” in panels C and D. The most prominent spot of TIs in panel E (mainly at Sunitinib
6.2µM + 5FU 4µM to 32µM) is similar to the actual spot of most significant TIs in panel F.
Some Theoretical Issues
Selection of the parameter α : In the subsections above we show that in the common situation when there are
no results from a reference cell model available for the therapeutic synergy analysis, it can be performed using
concentration-response data for the target cell combined with theoretical models of AE assuming either inde-
pendence (Bliss) and competition (Loewe). This theoretical modeling requires the user to specify the value of
the parameter α that transforms the two concentration-response curves available for the target cell model into
two predicted concentration-response curves that should describe the corresponding responses in the reference
cell model. For values of α on the interval [0, 1] the resulting concentration-response curves are reflecting a cell
line which is more drug resistant than the corresponding target cells. In this work, the parameter values were
selected manually to demonstrate that an appropriate selection may yield quite useful results. How to select an
appropriate value for α automatically based on the dataset available is a non-trivial problem beyond the scope
of this paper. One simple pragmatic procedure would be to build AE models using a set of different values of
the parameter α and then study how consistent the resulting TS analysis becomes across the different values
tested. However, with access to modern laboratory instruments that enable massively parallel measurements it
is relatively fast and cheap to evaluate the combination responses to a reference cell model jointly together with
the same analysis on the target cell model. Therefore, the need for the kind of predicted reference responses
introduced here is expected to continue decreasing.
The parameter value α = 1 yields Bliss and Loewe: As already mentioned, for α = 1 the reference and target cell
models have the same concentration-response curves and the resulting synergy analysis will in fact be equivalent to
a conventional Bliss or Loewe analysis. Since in this special case the difference between the reference cell surface
and the target cell surface is zero for single compound treatment, synergy is identified for any concentration
combination (da, db) satisfying T (da, db) > 0. For example, Bliss synergy occurs whenever the effects exceeds
that predicted from the Bliss model; T (da, db) = SBliss(da, db)− S(da, db) > 0. Consequently, conventional Bliss
synergy is equivalent to TS assuming independent adverse side effects with α = 1. Similarly, synergy analysis
using the competitive AE model and α = 1 identifies the same combinations as a classical Loewe isobologram
analysis. Loewe synergy occurs when for a given combination of drugs a and b in concentrations da and db the
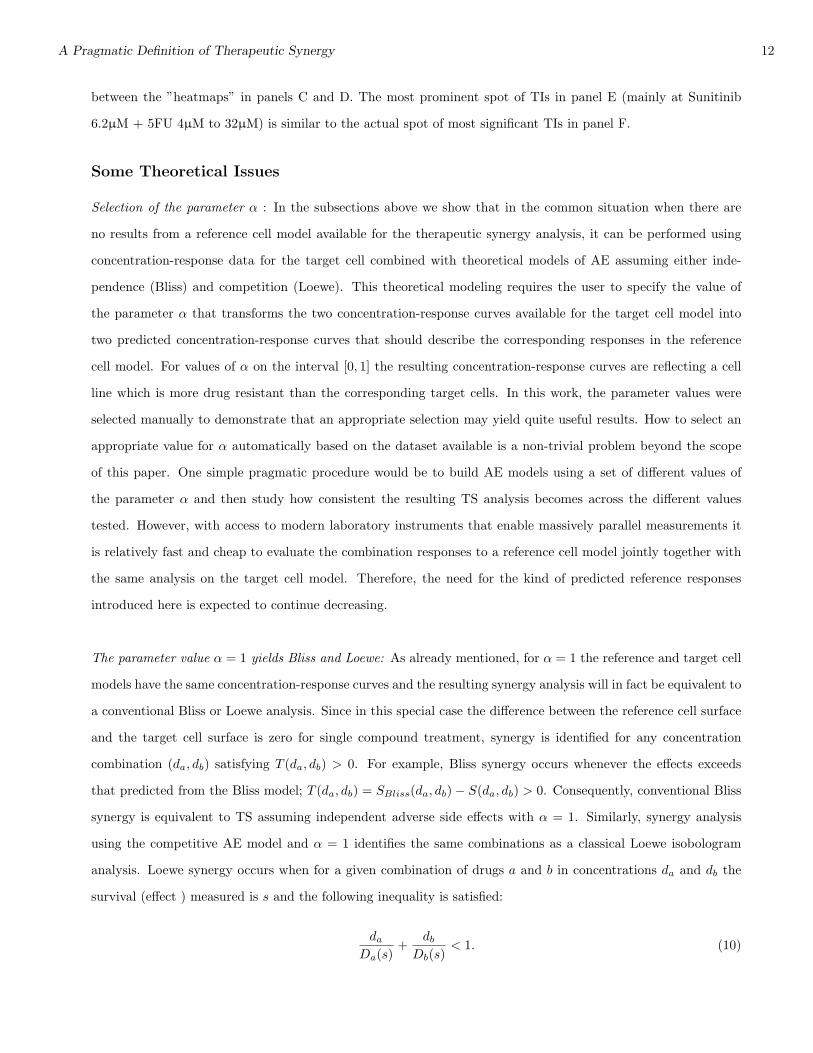
survival (effect ) measured is s and the following inequality is satisfied:
daDa(s)
+db
Db(s)< 1. (10)
A Pragmatic Definition of Therapeutic Synergy 13
As above Da(s) is a function that returns the lowest concentration of drug a needed alone to attain the survival s
(and similarly for Db). Now, suppose a spot (da, db) shows TS using the competitive AE model. This means that
the observed survival s in the target cells is less than the predicted survival s∗ in the reference cells (as predicted
by the model): s < s∗. By definition, the predicted survival s∗ for (da, db) is such that the following equality
holds:
daDa(s∗)
+db
Db(s∗)= 1. (11)
Since s < s∗ and D(s) is a decreasing (monotonic) function of s, it follows that da
Da(s)< da
Da(s∗)(and similarly for
drug b). Thus da
Da(s)+ db
Db(s)< da
Da(s∗)+ db
Db(s∗)= 1 whenever the observed survival in the reference cells is less
than the survival predicted for the reference cells. In other words da
Da(s)+ db
Db(s)< 1 whenever there is (predicted)
TS. In conclusion, using α = 1 and theoretical AE models will identify the same combinations as classical Loewe
or Bliss analysis.
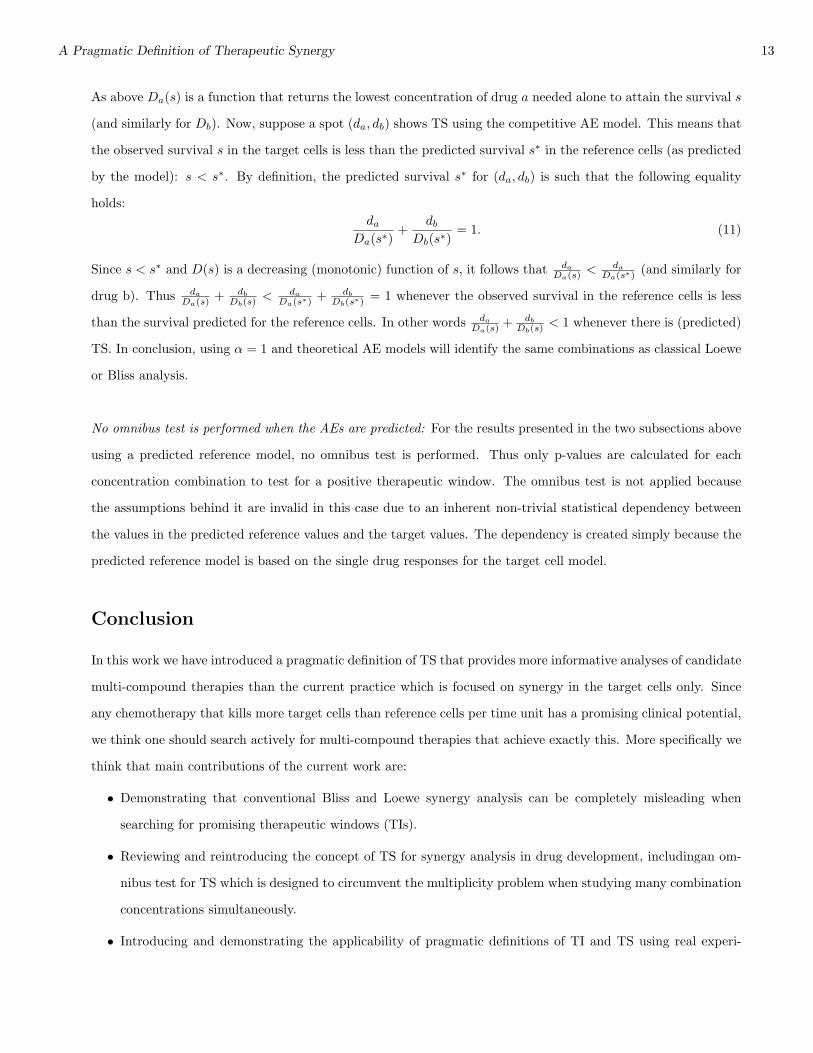
No omnibus test is performed when the AEs are predicted: For the results presented in the two subsections above
using a predicted reference model, no omnibus test is performed. Thus only p-values are calculated for each
concentration combination to test for a positive therapeutic window. The omnibus test is not applied because
the assumptions behind it are invalid in this case due to an inherent non-trivial statistical dependency between
the values in the predicted reference values and the target values. The dependency is created simply because the
predicted reference model is based on the single drug responses for the target cell model.
Conclusion
In this work we have introduced a pragmatic definition of TS that provides more informative analyses of candidate
multi-compound therapies than the current practice which is focused on synergy in the target cells only. Since
any chemotherapy that kills more target cells than reference cells per time unit has a promising clinical potential,
we think one should search actively for multi-compound therapies that achieve exactly this. More specifically we
think that main contributions of the current work are:
• Demonstrating that conventional Bliss and Loewe synergy analysis can be completely misleading when
searching for promising therapeutic windows (TIs).
• Reviewing and reintroducing the concept of TS for synergy analysis in drug development, includingan om-
nibus test for TS which is designed to circumvent the multiplicity problem when studying many combination
concentrations simultaneously.
• Introducing and demonstrating the applicability of pragmatic definitions of TI and TS using real experi-
A Pragmatic Definition of Therapeutic Synergy 14
mental data.
• Showing that conventional Bliss and Loewe synergy analysis may be interpreted as searching for TS under
the often inappropriate assumption that the single drugs do not offer any TIs alone.
• Demonstrating the potential of replacing the true reference cell response surface by a prediction of according
to an AE model.
These contributions make it possible for the first time to perform a proper search for TS in conventional in
vitro drug combination screening projects. In addition, the following two important theoretical and historical
perspectives regarding the problem of synergy analysis are provided in part C of the supplement: ”Conventional
Synergy is Simply a Detected Deviation from a Non-interesting Molecular Interaction” (Supplementary Subsection
C.1), and ”Independent Historical Branches of non-TS Analysis ”(Supplementary Subsection C.2).
Author contributions: MG conceived of the approach, supervised the project, made the first draft and wrote
the final version of the paper together with CA and MK. MG and CA developed the omnibus test employed.
CA developed the theoretical growth model. MK designed and implemented the computational tools needed for
the required data analysis and visualization and finally applied them to produce all the results presented. MK
performed the experiments for the revised version of the manuscript. MA and UH provided important expert as
well as literature inputs. TS provided the human cell line models. PN and RL designed, supervised and provided
the cell survival experiments performed. All authors analyzed the results and contributed to the final version of
the paper.
Acknowledgement: Many thanks to Assoc Prof Elin Lindhagen who was taking part in the very early stages of
this work and to Sharmineh Mansoori, Christina Leek, Lena Lenhammar, and Nasrin Najafi for all the excellent
and skillful experimental work performed. We would also like to thank the anonymous reviewers and the Editor
for their helpful comments which made it possible to significantly improve on the originally manuscript submitted.
Grant Support: This project has been partly supported from the Higher Education Commission of Pakistan
(MK) as well as by the Swedish Foundation for Strategic Research framework project ”Tools for diagnostics and
drug development in cancer” (RBa08-0114).
A Pragmatic Definition of Therapeutic Synergy 15
References
1. Borisy AA, Elliott PJ, Hurst NW, Lee MS, Lehar J, Price ER, et al. Systematic Discovery of Multicomponent
Therapeutics. Proc Natl Acad Sci U S A 2003;100:7977-82.
2. Keith CT, Borisy AA, Stockwell BR. Multicomponent Therapeutics for Networked Systems. Nat Rev Drug
Discov 2005;4:71-8.
3. Dancey JE, Chen HX. Strategies for Optimizing Combinations of Molecularly Targeted Anticancer Agents.
Nat Rev Drug Discov 2006;5:649-59.
4. Fitzgerald JB, Schoeberl B, Nielsen UB, Sorger PK. Systems Biology and Combination Therapy in the Quest
for Clinical Efficacy. Nat Chem Biol 2006;2:458-66.
5. Zimmermann GR, Lehar J, Keith CT. Multi-targetTherapeutics: when the Whole is Greater than the sum
of the Parts. Drug Discov Today 2007;12:34-42.
6. Lehar J, Zimmermann GR, Krueger AS, Molnar RA, Ledell JT, Heilbut AM, et al. Chemical Combination
Effects Predict Connectivity in Biological Systems. Mol Syst Biol 2007;3:80.
7. Greco WR, Bravo G, Parsons JC. The Search for Synergy: a Critical Review from a Response Surface
Perspective. Pharmacol Rev 1995;47:331-85.
8. Loewe S, Muischnek H. Uber Kombinationswirkungen. I. Mitteilung Hilfsmittel der Fragestellung. Arch. Exp.
Path. Pharmakol 1926;114:313-26.
9. Loewe S. The Problem of Synergism and Antagonism of Combined Drugs. Arzneimittelforschung 1953;3:285-
90.
10. Bliss CI. The toxicity of poisons applied jointly, Ann Appl Biol 1939;26:585-615.
11. Box, GEP. The Exploration and Exploitation of Response Surfaces: Some General Considerations and Ex-
amples, Biometrics 1954;10(1):16-60.
12. Berenbaum MC. What is Synergy? Pharmacol Rev 1989;41:93-141.
13. Chou TC. Theoretical Basis, Experimental Design, and Computerized Simulation of Synergism and Antago-
nism in drug Combination Studies. Pharmacol Rev 2006;58(3):621-81.
14. Berenbaum MC, Dale JW. Synergy and antagonism are not synonymous with therapeutic advantage and
disadvantage. J Antimicrob Chemo Ther 1988;21:497-500.
A Pragmatic Definition of Therapeutic Synergy 16
15. Greco WR, Faessel H, Levasseur L. The Search for Cytotoxic Synergy Between Anticancer Agents: a case of
Dorothy and the ruby Slippers? J Natl Cancer Inst 1996;88:699-700.
16. Venditti JM, Humphreys SR, Mantel N, Goldin A. Combined Treatment of Advanced Leukemia (L1210) in
Mice with Amethopterin and 6-Mercaptopurine. J Nat Cancer Inst 1956;17:631-8.
17. Goldin A, Venditti JM, Mantel N, Kline I, and Gang M. Evaluation of Combination Chemotherapy with
Three Drugs. Cancer Res 1968; 28: 950-60.
18. Mantel N. Therapeutic Synergism. Cancer Chemother Rep 1974;4:147-9.
19. Carter WH, Wampler GL, Stablein DM, Campbell ED. Drug Activity and Therapeutic Synergism in Cancer
Treatment. Cancer Res 1982;42:2963-71.
20. Goldin A and Mantel N. The Employment of Combinations of Drugs in the Chemotherapy of Neoplasia: a
Review. Cancer Res 1957;17;635-54.
21. Nelder JA, Mead R. A Simplex Method for Function Minimization. The Computer Journal 1965;7:308-13.
22. Carter WH, Wampler GL, Crews SL, Howells R. On Determining the Levels of Treatment to Optimize the
Probability of a Favorable Response. Cancer Treat Rep 1977;61(5):849-53.
23. Wampler GL, Carter WH, Williams VR. Combination Chemotherapy: Arriving at Optimal Treatment Levels
by Incorporating side Effect Constraints. Cancer Treat Rep 1978;62:333-40.
24. Carter WH, Stablein DM, Wampler GL. An Improved Method for Analyzing Survival Data from Combination
Chemotherapy Experiments. Cancer Res 1979;39:3446-53.
25. Stablein DM, Carter WH, Wampler GL. Confidence Regions for Constrained Optima in Response-surface
Experiments. Biometrics 1983;39:759-63.
26. Carter WH , Wampler GL and Stablein DM. Regression Analysis of Survival Data in Cancer Chemotherapy.
Marcel Dekker, New York, 1983.
27. Shih M, Gennings C, Chinchilli VM, Carter WH. Titrating and Evaluating Multi-drug Regimens Within
Subjects. Stat Med 2003;22(14):2257-79.
28. Zanderigo E, Sartori V, Sveticic G, Bouillon T, Schumacher P, Curatolo M, et al. A New Model for drug
Interactions and Optimal drug Dosing. Conf Proc IEEE Eng Med Biol Soc 2005;3:2353-6.
29. Zanderigo E, Sartori V, Sveticic G, Bouillon T, Schumacher P, Morari M, et al. The Well-being Model: a
New Drug Interaction Model for Positive and Negative Effects. Anesthesiology 2006;104:742-53.
A Pragmatic Definition of Therapeutic Synergy 17
30. Lindhagen E, Nygren P, and Larsson R. The fluorometric microculture cytotoxicity assay. Nat Protoc 2008;
3(8):1364-9.
31. R Development Core Team. R: A Language and Environment for Statistical Computing. R Foundation for
Statistical Computing, Vienna, Austria, ISBN 3-900051-07-0, www.R-project.org, 2011.
32. Laska EM, Meisner M, Tang DI. Classification of the Effectiveness of Combination Treatments. Stat Med
1997;16(19):2211-28.
A Pragmatic Definition of Therapeutic Synergy 18
Figure Legends
Legend: Figure 1
A completely misleading synergy analysis of the combination Erlotinib and Sorafenib. The TI
values for all non-significant concentration combinations are set to zero (green) in the panels C, D and E. All
concentrations are in µM. A: Survival surface (survival indices) of the reference cells (DLD-1KRASwt/-) when
treated with whole range of concentration combination of Erlotinib and Sorafenib. B: Survival surface (survival
indices) of the target cells (DLD-1) with the same combination. C: Therapeutic windows defined as the difference
between the reference in A and the target in B. The surface shows red spot where TIs (therapeutic windows) are
present generally at higer concentrations of Erlotinib and lower concentrations of Sorafenib. D: Quite misleading
results of a classical Bliss synergy analysis, presenting positive TIs only at two spots. E: Quite misleading results
of a classical Loewe synergy analysis that also shows few promising TIs.
Legend: Figure 2
A completely misleading synergy analysis of the combination EIC600 and Oxaliplatin. All TI values
for non-significant concentration combinations are set to zero (green) in all three panels. All concentrations
are in µM. A: Therapeutic windows defined as the difference between the reference (DLD-1KRASwt/-) and the
target (DLD-1). B: Results of a classical Bliss synergy analysis showing a strong spot (yellow/orange) of synergy
contradicting the results in panel A. C: Results of a classical Loewe synergy analysis showing a strong and quite
extended area of synergy contradicting the results in panel A.
Legend: Figure 3
Example of therapeutic synergy. A and B: Single drug concentration response curves of 5FU and Oxaliplatin
for the cell line models HCT116 and HCT116KRASwt/- (concentrations in µM). C and D: HCT116KRASwt/-
and HCT116 survival surfaces when treated with 5FU and Oxaliplatin as well as single drugs. E: The difference
between the HCT116KRASwt/- and HCT116 surfaces in panels A and B. The associated omnibus statistical test
for absence of therapeutic synergy was rejected (p = 0.0471).
Legend: Figure 4
Three examples of detected TS. A: Large TIs achieved by a combination of Sorafenib around 0.08 µM and
of 5FU around 2 µM with DLD-1 and DLD-1KRASwt/- as cell models. B: Same drug combination also shows
large TIs with RKO and RKOBRAFwt/-/- for 0.2 µM of Sorafenib and 32 µM of 5FU as well as for 1.6 µM of
A Pragmatic Definition of Therapeutic Synergy 19
Sorafenib and 16 µM of 5FU. C: The cell models RKO and RKOBRAFwt/-/- show a large TI at the combination
3.1 µM of Erlotinib and 12.5µM of Sunitinib.
Legend: Figure 5
Predicting TIs by means of the multiplicative Bliss independence AE model for the combination
Erlotinib+Sunitinib. A and B: Single concentration responses of drugs Erlotinib and Sunitinib with α = 0.7
used for modeling AE concentration-response curves using the single drug concentration responses in the target
cell line RKO. C: The in silico predicted survival surface for the reference cells obtained using the multiplicative
Bliss independence AE model. D: The survival surface for the target cell line RKO upon treatment with all
concentration combinations of Erlotinib and Sunitinib. E: Predicted TIs, expressed as the difference between C
and D. F: The in vitro TIs obtained using the reference cell line RKOBRAFwt/-/-. One should note that the
multiplicative Bliss independence AE Model has its most prominent spot of TIs at Erlotinib 1.6µM and 3.2µM
+ Sunitinib 12.5µM, which overlaps with the main TI spot in panel F obtained using a real reference model.
Legend: Figure 6
An example of predicted TIs based on an additive AE model for the drug pair Sunitinib+5FU. A:
Real single-compound concentration response curve produced by the target cell line RKO(solid line) and predicted
response curve to model the reference cell line RKOBRAFwt/-/- (dashed line) when treated with Sunitinib. The
responses of reference cells are modeled using RKO responses and the parameter value α = 0.75. B: Real
concentration response curves of 5FU in the target cell model (solid) and predicted curve (dashed) modeling the
response in the reference cells (α = 0.75). C: Predicted survival surface of reference cells obtained using the
additive AE model for all concentration combinations of the drugs Sunitinib and 5FU. D: Survival surface of
the target cells RKO for all concentration combinations studied. E: Surface generated by subtracting panel C
(prediction) from panel D (real data). F: Surface generated by subtracting the surface of the real reference cell
response (RKOBRAFwt/-/-) from the response surface for the target cell line model (RKO). The most prominent
spot of TIs in panel E (mainly at Sunitinib 6.2µM + 5FU at 4µM to 32µM) is similar to the actual spot of TIs
in panel F.