Achalasia: A New Clinically Relevant Classification by High-Resolution Manometry
Upload
khangminh22Category
view
1download
0
Journals Library
DOI 10.3310/hsdr08150
Drivers of ‘clinically unnecessary’ use of emergency and urgent care: the DEUCE mixed-methods study Alicia O’Cathain, Emma Knowles, Jaqui Long, Janice Connell, Lindsey Bishop-Edwards, Rebecca Simpson, Joanne Coster, Linda Abouzeid, Shan Bennett, Elizabeth Croot, Jon M Dickson, Steve Goodacre, Enid Hirst, Richard Jacques, Miranda Phillips, Joanne Turnbull and Janette Turner
Health Services and Delivery ResearchVolume 8 • Issue 15 • March 2020
ISSN 2050-4349


Drivers of ‘clinically unnecessary’ use ofemergency and urgent care: the DEUCEmixed-methods study
Alicia O’Cathain ,1* Emma Knowles ,1 Jaqui Long ,1
Janice Connell ,1 Lindsey Bishop-Edwards ,1
Rebecca Simpson ,1 Joanne Coster ,1 Linda Abouzeid ,2
Shan Bennett ,2 Elizabeth Croot ,1 Jon M Dickson ,3
Steve Goodacre ,1 Enid Hirst ,2 Richard Jacques ,1
Miranda Phillips ,4 Joanne Turnbull 5 andJanette Turner 1
1School of Health and Related Research (ScHARR), University of Sheffield, Sheffield, UK2Sheffield Emergency Care Forum, Sheffield, UK3Academic Unit of Primary Medical Care, University of Sheffield, Sheffield, UK4National Centre for Social Research, London, UK5Health Sciences, University of Southampton, Southampton, UK
*Corresponding author
Declared competing interests of authors: Jon M Dickson reports grants from UCB Pharma Ltd(Slough, UK) outside the submitted work. Steve Goodacre is deputy director of the National Institutefor Health Research (NIHR) Health Technology Assessment (HTA) programme, chairperson of theNIHR HTA Commissioning Committee and a member of the NIHR HTA Funding Board Policy Group.Miranda Phillips reports grants from NIHR during the conduct of the study and grants from The King’sFund, Nuffield Trust and Public Health England outside the submitted work. Joanne Turnbull reportsgrants from the NIHR Health Services and Delivery Research (HSDR) programme for project 14/19/16outside the submitted work.
Published March 2020DOI: 10.3310/hsdr08150
This report should be referenced as follows:
O’Cathain A, Knowles E, Long J, Connell J, Bishop-Edwards L, Simpson R, et al. Drivers of
‘clinically unnecessary’ use of emergency and urgent care: the DEUCE mixed-methods study.
Health Serv Deliv Res 2020;8(15).


Health Services and Delivery Research
ISSN 2050-4349 (Print)
ISSN 2050-4357 (Online)
This journal is a member of and subscribes to the principles of the Committee on Publication Ethics (COPE)(www.publicationethics.org/).
Editorial contact: [email protected]
The full HS&DR archive is freely available to view online at www.journalslibrary.nihr.ac.uk/hsdr. Print-on-demand copies can bepurchased from the report pages of the NIHR Journals Library website: www.journalslibrary.nihr.ac.uk
Criteria for inclusion in the Health Services and Delivery Research journalReports are published in Health Services and Delivery Research (HS&DR) if (1) they have resulted from work for the HS&DRprogramme, and (2) they are of a sufficiently high scientific quality as assessed by the reviewers and editors.
HS&DR programmeThe HS&DR programme funds research to produce evidence to impact on the quality, accessibility and organisation of health andsocial care services. This includes evaluations of how the NHS and social care might improve delivery of services.
For more information about the HS&DR programme please visit the website at https://www.nihr.ac.uk/explore-nihr/funding-programmes/health-services-and-delivery-research.htm
This reportThe research reported in this issue of the journal was funded by the HS&DR programme or one of its preceding programmesas project number 15/136/12. The contractual start date was in February 2017. The final report began editorial review inJune 2019 and was accepted for publication in October 2019. The authors have been wholly responsible for all data collection,analysis and interpretation, and for writing up their work. The HS&DR editors and production house have tried to ensure theaccuracy of the authors’ report and would like to thank the reviewers for their constructive comments on the final reportdocument. However, they do not accept liability for damages or losses arising from material published in this report.
This report presents independent research funded by NIHR. The views and opinions expressed by authors in this publicationare those of the authors and do not necessarily reflect those of the NHS, the NIHR, NETSCC, the HS&DR programme or theDepartment of Health and Social Care. If there are verbatim quotations included in this publication the views and opinionsexpressed by the interviewees are those of the interviewees and do not necessarily reflect those of the authors, those of theNHS, the NIHR, NETSCC, the HS&DR programme or the Department of Health and Social Care.
© Queen’s Printer and Controller of HMSO 2020. This work was produced by O’Cathain et al. under the terms of acommissioning contract issued by the Secretary of State for Health and Social Care. This issue may be freely reproduced forthe purposes of private research and study and extracts (or indeed, the full report) may be included in professional journalsprovided that suitable acknowledgement is made and the reproduction is not associated with any form of advertising.Applications for commercial reproduction should be addressed to: NIHR Journals Library, National Institute for HealthResearch, Evaluation, Trials and Studies Coordinating Centre, Alpha House, University of Southampton Science Park,Southampton SO16 7NS, UK.
Published by the NIHR Journals Library (www.journalslibrary.nihr.ac.uk), produced by Prepress Projects Ltd, Perth, Scotland(www.prepress-projects.co.uk).

Editor-in-Chief of Health Services and Delivery Research and NIHR Journals Library
Professor Ken Stein Professor of Public Health, University of Exeter Medical School, UK
NIHR Journals Library Editors
Professor John Powell Chair of HTA and EME Editorial Board and Editor-in-Chief of HTA and EME journals. Consultant Clinical Adviser, National Institute for Health and Care Excellence (NICE), UK, and Senior Clinical
Professor Andrée Le May
Professor Matthias Beck
Dr Tessa Crilly
Dr Eugenia Cronin Senior Scientific Advisor, Wessex Institute, UK
Dr Peter Davidson
Ms Tara Lamont
Dr Catriona McDaid
Professor William McGuire
Professor Geoffrey Meads Professor of Wellbeing Research, University of Winchester, UK
Professor John Norrie Chair in Medical Statistics, University of Edinburgh, UK
Professor James Raftery
Dr Rob Riemsma
Professor Helen Roberts
Professor Jonathan Ross
Professor Helen Snooks Professor of Health Services Research, Institute of Life Science, College of Medicine, Swansea University, UK
Professor Ken Stein Professor of Public Health, University of Exeter Medical School, UK
Professor Jim Thornton
Professor Martin Underwood
Please visit the website for a list of editors:
Editorial contact:
NIHR Journals Library www.journalslibrary.nihr.ac.uk

Abstract
Drivers of ‘clinically unnecessary’ use of emergency and urgentcare: the DEUCE mixed-methods study
Alicia O’Cathain ,1* Emma Knowles ,1 Jaqui Long ,1 Janice Connell ,1
Lindsey Bishop-Edwards ,1 Rebecca Simpson ,1 Joanne Coster ,1
Linda Abouzeid ,2 Shan Bennett ,2 Elizabeth Croot ,1 Jon M Dickson ,3
Steve Goodacre ,1 Enid Hirst ,2 Richard Jacques ,1 Miranda Phillips ,4
Joanne Turnbull 5 and Janette Turner 1
1School of Health and Related Research (ScHARR), University of Sheffield, Sheffield, UK2Sheffield Emergency Care Forum, Sheffield, UK3Academic Unit of Primary Medical Care, University of Sheffield, Sheffield, UK4National Centre for Social Research, London, UK5Health Sciences, University of Southampton, Southampton, UK
*Corresponding author [email protected]
Background: There is widespread concern about the pressure on emergency and urgent services inthe UK, particularly emergency ambulances, emergency departments and same-day general practitionerappointments. A mismatch between supply and demand has led to interest in what can be termed‘clinically unnecessary’ use of services. This is defined by the research team in this study as ‘patientsattending services with problems that are classified as suitable for treatment by a lower urgencyservice or self-care’. This is a challenging issue to consider because patients may face difficulties whendeciding the best action to take, and different staff may make different judgements about whatconstitutes a legitimate reason for service use.
Objectives: To identify the drivers of ‘clinically unnecessary’ use of emergency ambulances, emergencydepartments and same-day general practitioner appointments from patient and population perspectives.
Design: This was a sequential mixed-methods study with three components: a realist review;qualitative interviews (n = 48) and focus groups (n = 3) with patients considered ‘clinically unnecessary’users of these services, focusing on parents of young children, young adults and people in areas ofsocial deprivation; and a population survey (n = 2906) to explore attitudes towards seeking care forunexpected, non-life-threatening health problems and to identify the characteristics of someone with atendency for ‘clinically unnecessary’ help-seeking.
Results: From the results of the three study components, we found that multiple, interacting driversinfluenced individuals’ decision-making. Drivers could be grouped into symptom related, patient relatedand health service related. Symptom-related drivers were anxiety or need for reassurance, which werecaused by uncertainty about the meaning or seriousness of symptoms; concern about the impact ofsymptoms on daily activities/functioning; and a need for immediate relief of intolerable symptoms,particularly pain. Patient-related drivers were reduced coping capacity as a result of illness, stress orlimited resources; fear of consequences when responsible for another person’s health, particularly a child;and the influence of social networks. Health service-related drivers were perceptions or previousexperiences of services, particularly the attractions of emergency departments; a lack of timely accessto an appropriate general practitioner appointment; and compliance with health service staff’s advice.
DOI: 10.3310/hsdr08150 Health Services and Delivery Research 2020 Vol. 8 No. 15
© Queen’s Printer and Controller of HMSO 2020. This work was produced by O’Cathain et al. under the terms of a commissioning contract issued by the Secretary of Statefor Health and Social Care. This issue may be freely reproduced for the purposes of private research and study and extracts (or indeed, the full report) may be included inprofessional journals provided that suitable acknowledgement is made and the reproduction is not associated with any form of advertising. Applications for commercialreproduction should be addressed to: NIHR Journals Library, National Institute for Health Research, Evaluation, Trials and Studies Coordinating Centre, Alpha House,University of Southampton Science Park, Southampton SO16 7NS, UK.
v
Limitations: Difficulty recruiting patients who had used the ambulance service to the interviews andfocus groups meant that we were not able to add as much as we had anticipated to the limitedevidence base regarding this service.
Conclusions: Patients use emergency ambulances, emergency departments and same-day generalpractitioner appointments when they may not need the level of clinical care provided by these servicesfor a multitude of inter-related reasons that sometimes differ by population subgroup. Some of thesereasons relate to health services, in terms of difficulty accessing general practice leading to use ofemergency departments, and to population-learnt behaviour concerning the positive attributes ofemergency departments, rather than to patient characteristics. Social circumstances, such as complexand stressful lives, influence help-seeking for all three services. Demand may be ‘clinically unnecessary’but completely understandable when service accessibility and patients’ social circumstances are considered.
Future work: There is a need to evaluate interventions, including changing service configuration,strengthening general practice and addressing the stressors that have an impact on people’s copingcapacity. Different subgroups may require different interventions.
Study registration: This study is registered as PROSPERO CRD42017056273.
Funding: This project was funded by the National Institute for Health Research (NIHR) Health Servicesand Delivery Research programme and will be published in full in Health Services and Delivery Research;Vol. 8, No. 15. See the NIHR Journals Library website for further project information.
ABSTRACT
NIHR Journals Library www.journalslibrary.nihr.ac.uk
vi

Contents
List of tables xi
List of figures xiii
Glossary xv
List of abbreviations xvii
Plain English summary xix
Scientific summary xxi
Chapter 1 Background 1High demand for emergency and urgent care 1Definition of ‘clinically unnecessary’ use of services 1‘Clinically unnecessary’ use: a contentious area 1Context of supply–demand mismatch 1Prevalence of ‘clinically unnecessary’ use 2Interventions to address ‘clinically unnecessary’ use 2Research gap 2Conceptual framework 3Aim and objectives 4
Aim 4Objectives 4
Chapter 2 Overview of the study 5Study design 5Setting 5Patient and public involvement 6Project Advisory Group 6Ethics approval: interviews and national survey 6
Chapter 3 Realist review 7Aim and objectives 7Methods 7
Realist synthesis 7Phase 1: developing and refining the programme theories 7Phase 2: testing the programme theories 10
Findings 10Programme theories 10Population subgroups 16Recommended interventions to address ‘clinically unnecessary’ use of services 16
Discussion 18Summary of findings 18Links to existing literature 18Strengths and limitations 18Implications 19Implications for work packages 2 and 3 19
DOI: 10.3310/hsdr08150 Health Services and Delivery Research 2020 Vol. 8 No. 15
© Queen’s Printer and Controller of HMSO 2020. This work was produced by O’Cathain et al. under the terms of a commissioning contract issued by the Secretary of Statefor Health and Social Care. This issue may be freely reproduced for the purposes of private research and study and extracts (or indeed, the full report) may be included inprofessional journals provided that suitable acknowledgement is made and the reproduction is not associated with any form of advertising. Applications for commercialreproduction should be addressed to: NIHR Journals Library, National Institute for Health Research, Evaluation, Trials and Studies Coordinating Centre, Alpha House,University of Southampton Science Park, Southampton SO16 7NS, UK.
vii
Chapter 4 Qualitative interview study of decision-making with three subgroups ofthe population 21Introduction 21Aim 21
Methods 21Service and setting selection 22Identification and recruitment of potentially eligible patients 22Topic guide 25Data collection 26Data analysis 26Reporting guidelines 28
Findings 28Sample size 28Description of interviewees 29Order of presentation of themes 30Parents of young children subgroup 30Young adults subgroup 36Social deprivation subgroup 42Summary of drivers of seeking care from specific services across the three subgroups 48
Discussion 48Summary of findings 48
Chapter 5 Interventions to address drivers of ‘clinically unnecessary’ use 55Aim 55Methods 55
Sample 55Data collection 55Data analysis 56Inclusion of data from interviews 56Reporting guidelines 57
Findings 57Parents of young children subgroup 57Young adults subgroup 59Social deprivation subgroup 61Overview of findings by service 63
Discussion 64Summary of findings 64Link to interventions recommended by authors of articles in work package 1 65Strengths and limitations 65Link to wider literature 66Implications 66
Chapter 6 Survey of general population 67Introduction 67Aim and objectives 67Methods 67
British Social Attitudes Survey 67Developing the questionnaire 68Patient and public involvement workshop 68Questionnaire content 68Analysis 70Reporting guidelines 71
CONTENTS
NIHR Journals Library www.journalslibrary.nihr.ac.uk
viii

Results 72Response rate and non-response bias 72Description of respondents 72Description of vignette responses 73Description of programme theories 75Variation in programme theories by subgroup of the population 80Description of other influences 83Explaining tendency to seek ‘clinically unnecessary’ care 83
Discussion 92Summary of findings 92Links to programme theories 92Links to wider literature 92Strengths and limitations 95Implications 95
Chapter 7 Integration from three work packages 97Introduction 97Methods 97Results 97
Chapter 8 Discussion 99Summary 99Strengths and limitations 99What DEUCE adds to the evidence base 100Implications 100
Changing patient behaviour 100Interventions need to focus on services, not just patient behaviour 101
Priorities for research 101Conclusions 102
Acknowledgements 103
References 107
Appendix 1 Objectives specified in the proposal 117
Appendix 2 Search strategies and terms used in reviews for realist review 119
Appendix 3 Relevance and context appraisal of included qualitative articles 121
Appendix 4 Methodological rigour of included qualitative articles: Critical AppraisalSkills Programme items 131
Appendix 5 Data extraction for included qualitative articles 135
Appendix 6 Programme theories in interviews 169
Appendix 7 Sociodemographic details of focus group attendees 171
DOI: 10.3310/hsdr08150 Health Services and Delivery Research 2020 Vol. 8 No. 15
© Queen’s Printer and Controller of HMSO 2020. This work was produced by O’Cathain et al. under the terms of a commissioning contract issued by the Secretary of Statefor Health and Social Care. This issue may be freely reproduced for the purposes of private research and study and extracts (or indeed, the full report) may be included inprofessional journals provided that suitable acknowledgement is made and the reproduction is not associated with any form of advertising. Applications for commercialreproduction should be addressed to: NIHR Journals Library, National Institute for Health Research, Evaluation, Trials and Studies Coordinating Centre, Alpha House,University of Southampton Science Park, Southampton SO16 7NS, UK.
ix

Appendix 8 NHS Choices advice for symptoms in vignettes 173
Appendix 9 Results of logistic regressions for tendency to make ‘clinicallyunnecessary’ use of a service 175
Appendix 10 Integration grid 245
CONTENTS
NIHR Journals Library www.journalslibrary.nihr.ac.uk
x

List of tables
TABLE 1 The 10 programme theories 11
TABLE 2 Evidence for programme theories 14
TABLE 3 Summary of recommended interventions within qualitative articles inthe review 16
TABLE 4 Source of interviewees 28
TABLE 5 Concerns for which the interviewees sought help, by subgroup and service 29
TABLE 6 Refinement of the programme theories based on the interviews 50
TABLE 7 Comparing interventions recommended by authors of articles in WP1review with the focus group findings 66
TABLE 8 Characteristics of the survey sample (unweighted and weighted) 72
TABLE 9 Percentages of population selecting options for different vignettes 74
TABLE 10 Distribution of variables addressing the 10 programme theories in the survey 76
TABLE 11 Subgroups with higher proportions of the 10 programme theories 80
TABLE 12 Distribution of variables measuring other influences in the survey 83
TABLE 13 Conclusions from testing programme theories in the survey 93
TABLE 14 Final programme theories based on all of the WPs 97
TABLE 15 Relevance and context appraisal of included qualitative articles 122
TABLE 16 Methodological rigour of included qualitative articles: Critical AppraisalSkills Programme items 132
TABLE 17 Data extraction for included qualitative articles 136
TABLE 18 Evidence of programme theories for interview participants 169
TABLE 19 Sociodemographic details of focus group attendees 171
TABLE 20 Variables explaining tendency to call emergency ambulance servicein vignettes 175
TABLE 21 Full model for ambulance 183
TABLE 22 Variables explaining tendency to attend ED for adults in vignettes 187
TABLE 23 Full model for adult ED 195
DOI: 10.3310/hsdr08150 Health Services and Delivery Research 2020 Vol. 8 No. 15
© Queen’s Printer and Controller of HMSO 2020. This work was produced by O’Cathain et al. under the terms of a commissioning contract issued by the Secretary of Statefor Health and Social Care. This issue may be freely reproduced for the purposes of private research and study and extracts (or indeed, the full report) may be included inprofessional journals provided that suitable acknowledgement is made and the reproduction is not associated with any form of advertising. Applications for commercialreproduction should be addressed to: NIHR Journals Library, National Institute for Health Research, Evaluation, Trials and Studies Coordinating Centre, Alpha House,University of Southampton Science Park, Southampton SO16 7NS, UK.
xi

TABLE 24 Variables explaining tendency to attend ED for children in vignettes 198
TABLE 25 Full model for child ED 205
TABLE 26 Variables explaining tendency to attend ED for all in vignettes 208
TABLE 27 Full model for ED all 216
TABLE 28 Variables explaining tendency to attend GP for two adult vignettes 218
TABLE 29 Full model for GP 226
TABLE 30 Variables explaining tendency to contact any of the three services forany vignette 231
TABLE 31 Full model for any service 238
TABLE 32 Adapted triangulation protocol 246
LIST OF TABLES
NIHR Journals Library www.journalslibrary.nihr.ac.uk
xii

List of figures
FIGURE 1 Design of the study 5
FIGURE 2 Summary of search processes and selection and extraction of articles 9
FIGURE 3 Examples of diagrams used for qualitative analysis 27
FIGURE 4 Interventions recommended related to general practice 63
FIGURE 5 Interventions recommended related to WICs 64
FIGURE 6 Interventions recommended related to education and awareness 64
FIGURE 7 Interventions recommended in relation to supporting individuals 65
DOI: 10.3310/hsdr08150 Health Services and Delivery Research 2020 Vol. 8 No. 15
© Queen’s Printer and Controller of HMSO 2020. This work was produced by O’Cathain et al. under the terms of a commissioning contract issued by the Secretary of Statefor Health and Social Care. This issue may be freely reproduced for the purposes of private research and study and extracts (or indeed, the full report) may be included inprofessional journals provided that suitable acknowledgement is made and the reproduction is not associated with any form of advertising. Applications for commercialreproduction should be addressed to: NIHR Journals Library, National Institute for Health Research, Evaluation, Trials and Studies Coordinating Centre, Alpha House,University of Southampton Science Park, Southampton SO16 7NS, UK.
xiii


Glossary
‘Clinically unnecessary’ use When patients do not need the level of clinical care or urgency of careprovided by the service that they contact.
Programme theory In this study, a proposed explanation of patients’ behaviour.
DOI: 10.3310/hsdr08150 Health Services and Delivery Research 2020 Vol. 8 No. 15
© Queen’s Printer and Controller of HMSO 2020. This work was produced by O’Cathain et al. under the terms of a commissioning contract issued by the Secretary of Statefor Health and Social Care. This issue may be freely reproduced for the purposes of private research and study and extracts (or indeed, the full report) may be included inprofessional journals provided that suitable acknowledgement is made and the reproduction is not associated with any form of advertising. Applications for commercialreproduction should be addressed to: NIHR Journals Library, National Institute for Health Research, Evaluation, Trials and Studies Coordinating Centre, Alpha House,University of Southampton Science Park, Southampton SO16 7NS, UK.
xv


List of abbreviations
A&E accident and emergency
BAME Black, Asian and minorityethnic
CI confidence interval
CINAHL Cumulative Index to Nursingand Allied Health Literature
ED emergency department
GP general practitioner
HLQ Health Literacy Questionnaire
IMD Index of Multiple Deprivation
IPA interpretative phenomenologicalanalysis
MIU minor injuries unit
NatCen National Centre for SocialResearch
NIHR National Institute for HealthResearch
NVS Newest Vital Sign
PPI patient and public involvement
SECF Sheffield Emergency CareForum
WIC walk-in centre
WP work package
DOI: 10.3310/hsdr08150 Health Services and Delivery Research 2020 Vol. 8 No. 15
© Queen’s Printer and Controller of HMSO 2020. This work was produced by O’Cathain et al. under the terms of a commissioning contract issued by the Secretary of Statefor Health and Social Care. This issue may be freely reproduced for the purposes of private research and study and extracts (or indeed, the full report) may be included inprofessional journals provided that suitable acknowledgement is made and the reproduction is not associated with any form of advertising. Applications for commercialreproduction should be addressed to: NIHR Journals Library, National Institute for Health Research, Evaluation, Trials and Studies Coordinating Centre, Alpha House,University of Southampton Science Park, Southampton SO16 7NS, UK.
xvii

Plain English summary
The pressure on emergency and urgent care services has led to concern that some patients usethese services for problems that could be treated by a less urgent service (known as ‘clinically
unnecessary’ use).
We wanted to understand why people make ‘clinically unnecessary’ use of ambulances, emergencydepartments and same-day general practitioner appointments, and what might help them makedifferent decisions. We did this in three ways:
1. We reviewed previous research.2. We carried out interviews and focus groups with 53 patients whom health professionals thought
were ‘clinically unnecessary’ users of their service. We focused on parents of young children, youngadults and people in socially deprived areas.
3. We used a national survey of attitudes to seeking care for health problems. This also identifiedthose people most likely to be ‘clinically unnecessary’ users of these services.
We found that people used services for a complex range of reasons that were often connected. Somereasons related to people’s symptoms. These included worrying about how serious symptoms were andwanting reassurance, feeling unable to get on with daily life, needing immediate relief and not wantingto wait any longer for things to get better. Patients’ circumstances also influenced their decisions. Poormental health, stress or isolation could make it difficult to cope with physical symptoms. Some peoplefelt responsible for someone else, particularly children, or were advised by family or friends to attendservices. People’s experiences and perceptions of health services also affected their decisions; theseincluded having difficulty getting a general practitioner appointment quickly enough and beingattracted by the facilities at emergency departments.
When all of these factors were considered, patients’ decisions were often understandable, even ifthose decisions led to ‘clinically unnecessary’ use. These issues could be addressed by strengtheninggeneral practice, improving public education and reducing the wider social stresses that affect people.
DOI: 10.3310/hsdr08150 Health Services and Delivery Research 2020 Vol. 8 No. 15
© Queen’s Printer and Controller of HMSO 2020. This work was produced by O’Cathain et al. under the terms of a commissioning contract issued by the Secretary of Statefor Health and Social Care. This issue may be freely reproduced for the purposes of private research and study and extracts (or indeed, the full report) may be included inprofessional journals provided that suitable acknowledgement is made and the reproduction is not associated with any form of advertising. Applications for commercialreproduction should be addressed to: NIHR Journals Library, National Institute for Health Research, Evaluation, Trials and Studies Coordinating Centre, Alpha House,University of Southampton Science Park, Southampton SO16 7NS, UK.
xix


Scientific summary
Background
In the context of supply not matching demand, policy-makers have expressed concerns about the highlevels of demand for some services that provide emergency and urgent care: emergency ambulances,emergency departments and urgent same-day general practitioner appointments. This mismatch betweensupply and demand has led to interest in what we term the ‘clinically unnecessary’ use of services. This isdefined by the research team in this study as ‘patients attending services with problems that are classifiedas suitable for treatment by a lower urgency service or self-care’; for example, problems that could bedealt with by a general practitioner rather than in an emergency department. It is a challenging issue toconsider because patients may face difficulties deciding on the best action to take, and different staffmay make different judgements about what constitutes a legitimate reason for service use.
Aim
The aim of the study was to identify the key factors (drivers) affecting ‘clinically unnecessary’ use ofemergency ambulances, emergency departments and urgent same-day general practitioner appointmentsfrom patient and population perspectives.
Objectives
The study objectives were to:
1. identify the drivers of ‘clinically unnecessary use’ using a realist review and a qualitativeinterview study
2. understand how different subgroups of the population make decisions about help-seeking using aqualitative interview study
3. identify potential intervention strategies using a focus group study4. measure the prevalence of population views of seeking urgent care, and how these views vary by
circumstances, and by population subgroups, using a population survey5. identify the characteristics of people who have a tendency to make ‘clinically unnecessary’ use of
the ambulance service, emergency departments and general practices using vignettes within apopulation survey.
Design
This was a sequential mixed-methods study with three work packages: a realist review, a qualitativestudy of individual interviews and focus groups with three patient subgroups, and a population survey.
Methods
Realist reviewWe used 32 qualitative studies to develop 10 programme theories (i.e. proposed explanations ofpatients’ behaviour). We tested these programme theories against existing health behaviour theoriesand evidence from 29 quantitative studies.
DOI: 10.3310/hsdr08150 Health Services and Delivery Research 2020 Vol. 8 No. 15
© Queen’s Printer and Controller of HMSO 2020. This work was produced by O’Cathain et al. under the terms of a commissioning contract issued by the Secretary of Statefor Health and Social Care. This issue may be freely reproduced for the purposes of private research and study and extracts (or indeed, the full report) may be included inprofessional journals provided that suitable acknowledgement is made and the reproduction is not associated with any form of advertising. Applications for commercialreproduction should be addressed to: NIHR Journals Library, National Institute for Health Research, Evaluation, Trials and Studies Coordinating Centre, Alpha House,University of Southampton Science Park, Southampton SO16 7NS, UK.
xxi

Qualitative interview studyWe undertook interviews to explore decision-making processes with 48 patients, 16 in each of threesubgroups identified as having high levels of ‘clinically unnecessary’ use: parents of young children,young adults and people living in areas of social deprivation. The interviewees were not aware thathealth professionals considered their contact ‘clinically unnecessary’. We also undertook a focus groupwith patients from each subgroup (total n = 15 participants) to explore potential interventions.
Population surveyWe purchased a 60-item module in the 2018 British Social Attitudes Survey with a representativesample of the British population (n= 2906). We explored attitudes among the population towardsseeking care when faced with an ‘unexpected health problem that was not life threatening’, and theprevalence of the programme theories that we identified in our realist review. In addition, respondentswere presented with vignettes of different health problems and asked to identify the actions that theywould take. This allowed us to identify people who had a tendency to make ‘clinically unnecessary’ useof services and to test the realist review programme theories.
IntegrationWe used an adapted triangulation protocol to compare the findings from each work package. Weclassified explanations for service use under three broad headings: characteristics of symptoms,patients and health services.
Results
Drivers are presented separately in the following sections. These were highly interdependent andmultiple drivers featured in individuals’ decision-making processes.
Drivers related to symptoms
Anxiety and concern about seriousness of symptoms that required reassuranceIn the review, we identified a programme theory that uncertainty about the seriousness of symptomscould cause anxiety, and a related programme theory that this anxiety could be heightened byexperience or knowledge of traumatic events. This anxiety led patients to seek reassurance fromservices. In the interviews, varying degrees of anxiety or concern due to uncertainty about both themeaning and the seriousness of symptoms featured as a key driver in all three subgroups. Someinterviewees had clearly been anxious that a symptom might be serious, whereas others had soughtreassurance that their own conclusion that a symptom was not serious was correct. In the surveythis anxiety explained the tendency to make ‘clinically unnecessary’ use of emergency ambulances(odds ratio 1.6) and general practitioners (odds ratio 2.0).
Inability to get on with daily life and need to return to normal functioningIn the review, we identified a programme theory that patients sought care urgently so that they couldget back to normal and deal with responsibilities such as working or looking after children. Interviewees,particularly young adults, also discussed this issue, describing how their help-seeking was a result of bothactual and anticipated detrimental effects on their functioning. In the survey, increasing numbers of thepopulation wanted to see a doctor or nurse immediately for an unexpected health problem as the effectof the problem on their functioning increased: 9% (262/2906) if there was no detrimental effect onfunctioning, 29% (831/2906) if the problem was affecting sleep and 67% (1938/2906) if they could notwork or look after their family.
Need for immediate symptom reliefIn the review, we identified a programme theory that a perceived need for immediate pain reliefaffected urgent help-seeking behaviour. Interviewees extended this from pain to a range of symptoms
SCIENTIFIC SUMMARY
NIHR Journals Library www.journalslibrary.nihr.ac.uk
xxii

that drove them to contact emergency ambulances and emergency departments. Participants in thesocial deprivation focus group highlighted how an inability to obtain free prescriptions directly from apharmacist could drive them to make contact with services that could provide these.
Waited long enough for things to improveIn the review, we identified a programme theory that patients sought care urgently after they had delayedseeking help from services and had used self-care until they felt that they had to seek treatmentimmediately. This use of self-care, and an unwillingness to delay further when things had not improved,was strongly evident in all subgroups in our interviews, and was sometimes related to frustration withtheir general practitioner’s inability to resolve an ongoing problem.
Drivers related to patients
Inability to cope with health problems due to mental health problems, stressful livesor limited resourcesIn the review, we identified a programme theory that people experiencing long-term stress associatedwith poverty or illness could have difficulty coping with an unexpected health problem and looked forthe least burdensome health-care option. Interviewees discussed stress in their lives caused by a rangeof factors, including long-term health problems, social isolation and difficult work or personal situations.Young adults and people living in socially deprived communities referred to the role of mental healthproblems, such as anxiety and depression, when seeking health care. Although not necessarily mentalhealth service users, they struggled with mental health problems that reduced their capacity to copewith unexpected physical health problems. Young adult focus group participants emphasised thatimprovements in mental health services were needed to address this lack of ability to cope. The surveyresults showed that members of the population who felt overwhelmed when faced with a healthproblem were twice as likely to have a tendency to make ‘clinically unnecessary’ use of an emergencyambulance (odds ratio 2.2) or a general practitioner (odds ratio 1.7). Limited resources were associatedwith a tendency to use emergency ambulance services when ‘clinically unnecessary’ in terms of manualsocial class (odds ratio 3.0), not having a car (odds ratio 2.1) and having low health literacy (1.7). Lowhealth literacy was also an explanation for a tendency to make ‘clinically unnecessary’ use of a generalpractitioner (odds ratio 1.3).
Fear of consequences when responsible for othersIn the review, we identified a programme theory that patients sought care urgently to minimise riskwhen they were responsible for others, particularly vulnerable individuals. In interviews, this was a keydriver for parents of young children, who were concerned that their child’s health could change quicklyand were aware that they were responsible for their child’s well-being. Fear of consequences for youngchildren was also evident in responses to the survey vignettes, which showed that 37–42% of thepopulation had a tendency to make ‘clinically unnecessary’ choices about a sick child, compared with1.5–30% for adult illness or injury.
Compliance with and influence of social networksIn the review, we identified a programme theory that patients followed the advice of trusted others.We discuss later how ‘trusted others’ can be health service staff, but here we discuss the role of socialnetworks. Among interviewees, it was apparent that family, friends and colleagues could sometimesdirect where help was sought. This was sometimes related to recursivity or learnt behaviour in thatothers’ previous positive experiences of emergency departments could affect a patient’s decision toattend an emergency department. In the survey, 56% of the population consulted family and friendswhen deciding whether or not, and where, to seek help.
Subgroups with greater tendency to make ‘clinically unnecessary’ use of servicesWe undertook interviews with three subgroups of people who had been identified as more likely tobe ‘clinically unnecessary’ users: parents of young children, young adults and people from areas of
DOI: 10.3310/hsdr08150 Health Services and Delivery Research 2020 Vol. 8 No. 15
© Queen’s Printer and Controller of HMSO 2020. This work was produced by O’Cathain et al. under the terms of a commissioning contract issued by the Secretary of Statefor Health and Social Care. This issue may be freely reproduced for the purposes of private research and study and extracts (or indeed, the full report) may be included inprofessional journals provided that suitable acknowledgement is made and the reproduction is not associated with any form of advertising. Applications for commercialreproduction should be addressed to: NIHR Journals Library, National Institute for Health Research, Evaluation, Trials and Studies Coordinating Centre, Alpha House,University of Southampton Science Park, Southampton SO16 7NS, UK.
xxiii

deprivation. In the survey, we identified different subgroups who had a greater tendency to make‘clinically unnecessary’ use of services: men (odds ratio 1.5) and people from black, Asian and minorityethnic groups (odds ratio 1.7).
Drivers related to health services
Perceptions or experiences of different health servicesIn the review, we identified a programme theory that ‘clinically unnecessary’ use was driven byperceptions or experiences of services. One aspect of this was that patients were attracted by theemergency department as they felt they would be seen quickly, could undergo diagnostic tests suchas X-rays and would receive expert help. Interviewees in all subgroups valued these attributes ofemergency departments. In the survey, a preference for emergency departments because they offerquick access to tests was a key driver of the tendency to make ‘clinically unnecessary’ use of emergencydepartments (odds ratio 1.7), and 18% of the population viewed emergency department doctors as havinggreater expertise than general practitioners. In the focus groups, parents of young children were attractedby specialists in child health within a paediatric emergency department and wanted a similar paediatricspecialism in general practice.
Another aspect of the attraction of emergency departments was related to recursivity, that is learntbehaviour. There was some evidence that patients’ positive experiences of emergency departments hadled them to use them again or to recommend them to family and friends. In the survey, members ofthe population who felt that undergoing tests validated their decision to use a service had a greatertendency to use an emergency department (odds ratio 1.5).
Another aspect of this was concerns about the quality of primary care. Some interviewees highlightedconcerns about the quality of their general practitioner or the general practitioner out-of-hoursservice, which acted as a driver of their emergency department attendance. In the survey, although10% of the population expressed a lack of confidence in their general practitioner, this did not explainthe tendency to use emergency departments. By contrast, in all three subgroups, some intervieweeswho had consulted their general practitioner for their latest health problem expressed high levels ofsatisfaction with their general practitioner.
Lack of timely access to an appropriate general practitioner appointmentIn the review, we identified a programme theory that people’s use of emergency departments wassometimes driven by their frustration with lack of access to a general practitioner when they had failedto obtain an appointment in the desired timeframe or thought it unlikely that an appointment would beavailable. An additional issue interviewees raised was that some general practitioner appointmentsystems offered a problematic dichotomy of same-day/urgent appointments, which were difficult toobtain, and booked/routine appointments, which often necessitated waiting for many weeks. Focusgroup participants identified the need for a new intervention to simplify appointment systems andmake it possible to see a general practitioner within a few days. By contrast, many of our intervieweesrecruited from general practice described their general practitioner as accessible, highlighting thatfrustration with access to general practitioner appointments was not universal.
Compliance with health service adviceIn the review, we identified a programme theory that patients sometimes used ambulances and emergencydepartments because they were following the advice of health professionals. Interviewees had notalways made the decision to call an ambulance or attend an emergency department themselves but hadbeen directed to do so by health service staff, including general practitioners, during either face-to-faceor telephone consultations.
SCIENTIFIC SUMMARY
NIHR Journals Library www.journalslibrary.nihr.ac.uk
xxiv
Conclusions
‘Clinically unnecessary’ use of emergency and urgent care is of interest when supply fails to matchdemand. Patients use emergency ambulances, emergency departments and same-day generalpractitioner appointments when they do not need the level of clinical care provided by those servicesfor a multitude of inter-related reasons that sometimes differ by population subgroup. Some of thesereasons relate to health services in terms of difficulty accessing general practice leading to use ofemergency departments, and to population-learnt behaviour relating to the positive attributes ofemergency departments, rather than to patient characteristics. Social circumstances, such as havingcomplex and stressful lives, influence help-seeking for all three services. Demand may be ‘clinicallyunnecessary’ yet completely understandable when service accessibility and patients’ socialcircumstances are considered.
Implications for health care
In the context of demand outstripping supply for emergency and urgent care, evidence suggests thatunless supply can be increased:
l There is unlikely to be a single solution to these multiple, inter-related reasons for ‘clinicallyunnecessary’ use of services. Rather, a series of solutions, undertaken concurrently, maybe necessary.
l Changes to health services could reduce ‘clinically unnecessary’ use of emergency departments,in particular by strengthening general practice by improving access to general practitionerappointments within a few days, emergency departments undertaking fewer of the tests thatvalidate ‘clinically unnecessary’ use, and increasing awareness and improving knowledge of theservices offered by alternative providers.
l Patients’ social circumstances play a key role in urgent help-seeking, suggesting that wider publichealth issues that cause stressful lives, limited resources (both financial and in terms of healthliteracy) and mental health problems may increase the ‘clinically unnecessary’ use of ambulances,emergency departments and general practitioners.
Recommendations for research (in priority order)
1. Evaluate new interventions to address ‘clinically unnecessary’ use of emergency ambulances andemergency departments, including interventions that strengthen capacity in primary care, changegeneral practitioner appointment systems, reduce practices in emergency departments thatencourage further ‘clinically unnecessary’ use, improve health literacy, improve population mentalhealth and increase resources for some patient groups.
2. Evaluate new interventions to address ‘clinically unnecessary’ use of general practice, includingeducating people about the role of pharmacies, improving access to free prescriptions viapharmacies and improving people’s confidence to self-manage minor illnesses.
3. Evaluate new interventions tailored to different population subgroups, such as education andsupport aimed at parents of young children.
4. Understand the drivers of ‘clinically unnecessary’ use among other subgroups identified in thesurvey, in particular men and people from black, Asian and minority ethnic groups.
5. Explore why health professionals recommend that patients make use of health services that otherhealth professionals subsequently judge to be ‘clinically unnecessary’.
DOI: 10.3310/hsdr08150 Health Services and Delivery Research 2020 Vol. 8 No. 15
© Queen’s Printer and Controller of HMSO 2020. This work was produced by O’Cathain et al. under the terms of a commissioning contract issued by the Secretary of Statefor Health and Social Care. This issue may be freely reproduced for the purposes of private research and study and extracts (or indeed, the full report) may be included inprofessional journals provided that suitable acknowledgement is made and the reproduction is not associated with any form of advertising. Applications for commercialreproduction should be addressed to: NIHR Journals Library, National Institute for Health Research, Evaluation, Trials and Studies Coordinating Centre, Alpha House,University of Southampton Science Park, Southampton SO16 7NS, UK.
xxv
Study registration
This study is registered as PROSPERO CRD42017056273.
Funding
The project was funded by the National Institute for Health Research (NIHR) Health Services andDelivery Research programme and will be published in full in Health Services and Delivery Research;Vol. 8, No. 15. See the NIHR Journals Library website for further project information.
SCIENTIFIC SUMMARY
NIHR Journals Library www.journalslibrary.nihr.ac.uk
xxvi

Chapter 1 Background
High demand for emergency and urgent care
Internationally, policy-makers, providers of health services and researchers have expressed concernsabout the high demand for emergency ambulance services and emergency departments (EDs).1 Generalpractice, which deals with a large proportion of patients seeking urgent care,2 also suffers from highdemand.3,4 In England, these three services have been identified as under pressure because of bothhigh demand and workforce challenges;5 that is, there are problems with the supply of these servicesas well as with the demand for them.
Definition of ‘clinically unnecessary’ use of services
Researchers have often focused on demand for emergency and urgent care services from patientswho do not need the clinical resources provided by, or the acuity level of, those services;6 for example,ED attenders who could have been treated at their general practice, or patients seeking urgentappointments with their general practitioner (GP) for problems that could have been dealt with usingself-care. A variety of terms have been used in reference to these patients: ‘low acuity conditions’,7,8
‘medically unnecessary’,6,9 ‘unnecessary use’,10 ‘non-urgent’,11–14 triaged as ‘low acuity’,15 ‘potentiallypreventable use’,16 use of emergency care for ‘primary care sensitive conditions’17 and ‘inappropriateusers’.18 In this report, the term ‘clinically unnecessary’ defines use that doctors, nurses and paramedicsassess as not requiring the level or urgency of clinical care provided by their service. That is, ‘clinicallyunnecessary’ users may have clinical needs that could be dealt with by a lower-acuity service. ‘Clinicallyunnecessary’ users can also be frequent users, but these concepts differ. An individual can make‘clinically unnecessary’ use of a service infrequently. The study focuses on ‘clinically unnecessary’ users,some of whom may also be frequent users.
‘Clinically unnecessary’ use: a contentious area
The concept of ‘clinically unnecessary’ use of health services is contentious.19,20 Patients face a moraldilemma when help-seeking, as they may be anxious not only about taking responsibility for their healthbut also about being judged as wasting the time of a service.21,22 Pope et al.’s22 recent study highlightsthe general public’s confusion about the terms ‘emergency’ and ‘urgent’, which problems fall into whichcategory, which services are appropriate to meet them and where the boundary between the categorieslies. The authors emphasise the need for clear, consistent messages from service providers around thesequestions, as well as a more nuanced understanding of how people and communities make decisionsabout service use, as key prerequisites to changing help-seeking behaviour. Additionally, individual staffjudgements about what constitutes a legitimate reason for service use may vary. For example, some staffmay view difficulty getting a routine appointment with a GP as a legitimate reason for using urgent care,whereas others may not.23
Context of supply–demand mismatch
It is also the case that judgements about the clinical necessity of demand may be shaped by the supplyof services.20 Judgements about the necessity of demand become harsher as demand outstrips supply.Indeed, the issue of ‘clinically unnecessary’ demand for emergency and urgent care services may beenseen as relevant only if supply does not keep up with demand.
DOI: 10.3310/hsdr08150 Health Services and Delivery Research 2020 Vol. 8 No. 15
© Queen’s Printer and Controller of HMSO 2020. This work was produced by O’Cathain et al. under the terms of a commissioning contract issued by the Secretary of Statefor Health and Social Care. This issue may be freely reproduced for the purposes of private research and study and extracts (or indeed, the full report) may be included inprofessional journals provided that suitable acknowledgement is made and the reproduction is not associated with any form of advertising. Applications for commercialreproduction should be addressed to: NIHR Journals Library, National Institute for Health Research, Evaluation, Trials and Studies Coordinating Centre, Alpha House,University of Southampton Science Park, Southampton SO16 7NS, UK.
1

Prevalence of ‘clinically unnecessary’ use
The prevalence of ‘clinically unnecessary’ use of emergency and urgent care varies widely dependingon the definition used.14 In a systematic review,14 the prevalence of ED use for non-urgent conditionswas 37%, ranging from 8% to 62% in different studies. Another review identified a range of 5–90%.13
Interventions to address ‘clinically unnecessary’ use
Owing to widespread concern about the pressure on some emergency and urgent care services, aconsiderable amount of research has been undertaken to identify and test interventions to address theproblem. These interventions have taken a variety of forms to target different aspects of the problem.A recent review by Van den Heede and Van de Voorde24 of 23 systematic reviews that specificallyfocused on reducing ED use identified six types of intervention:
l patient education and self-management supportl strengthening primary care services (including improving GP access and providing alternative
primary care options)l pre-hospital diversion strategies, including telephone triagel co-ordination and case managementl introducing barriers to accessl payment from patients.
Despite the large number of primary studies, the authors concluded that evidence is still insufficientfor the effectiveness of any particular intervention, partly because of the heterogeneity of theresearch, including the health-care system context and the target population. They propose that thecomplexity of the problem will require a multifaceted approach, suggesting that this is likely to includethe co-location of GPs and EDs, together with a well-designed and appropriately staffed telephonetriage system, although this solution is not fully evidence based.
Policy-makers in England have taken an organisational intervention approach to manage the demandfor emergency and urgent care services by introducing new services. Telephone advice and triage havebeen introduced via NHS Direct and then NHS 111 and 111 Online to address the lack of awarenessamong the general population about the services available and people’s ability to make judgementsabout which service is best for their problem. Both NHS Direct and NHS 111 were shown to have hadminimal impact on reducing demand for emergency services when they were piloted,25,26 despite NHS111 receiving 17 million calls per year. New alternatives for access to urgent care, such as walk-incentres (WICs), have been introduced to address the issue that a lack of alternatives to urgent caremay increase the use of emergency services. The evidence is mixed about the impact that WICs haveon the use of EDs but, even where the effect has been positive, it has been very small, and the newcentres have increased the overall use of urgent care services.27 Organisational changes underevaluation currently include co-locating GP expertise in EDs. Policy-makers have also focused onimproving population self-management and understanding about where to seek help for differentproblems. For example, the ‘Choose Well’ education campaign informs people about the range ofavailable services, including alternatives to EDs.
Research gap
This study focuses on understanding what drives ‘clinically unnecessary’ demand for three emergency andurgent care services currently under pressure in England. It is important to gain an in-depth understandingfrom patients’ perspectives about why they make decisions that are judged ‘clinically unnecessary’ becausethis may help to develop interventions that reduce demand on overloaded health services.
BACKGROUND
NIHR Journals Library www.journalslibrary.nihr.ac.uk
2
A number of reviews have explored the reasons why people choose to use emergency and urgent careservices, although some of these have not focused specifically on ‘clinically unnecessary’ use. Costeret al.’s28 rapid review of a broad range of studies undertaken mainly in the USA and the UK focusedlargely on EDs and identified six reasons why people used emergency and urgent care:
l lack of access to and/or confidence in primary carel perceptions of urgency or anxiety creating a need for reassurancel recommendations from friends, family members or health-care professionalsl convenience, for example better opening hours or nearer to homel patient socioeconomic factors, such as lower costs to using specific services or unavailability
of transportl perceived need for treatment and investigations available at a hospital only.
A similar set of issues was identified in Kraaijvanger’s29 recent systematic review of reasons whypatients self-refer to EDs. Some overlap with Coster et al.’s28 findings was also identified in Bookeret al.’s17 systematic review of patients’ use of ambulance services for primary care-sensitive conditions.This latter review included the perspectives of health professionals and service managers as well asthat of patients, and identified the following factors:
l poor physical health, including comorbidities and mental healthl personal anxiety and risk managementl health knowledgel caregivers and bystanders encouraging use of ambulances, particularly for childrenl sociodemographic and economic issues, including deprivation and lack of own transportl poor access to primary care.
Although these systematic reviews provide valuable high-quality evidence about the overall use ofhigh-demand emergency and urgent care services, a more detailed exploration is needed of themotivations of patients whom those services have identified as ‘clinically unnecessary’ users. Existingreviews focusing on this issue are limited either because they focus on a single service17,29 or becausethey include health professional perspectives as well as patient perspectives.17 Therefore, there is aneed for a broader review encompassing the range of services providing emergency and urgent carethat specifically explores patients’ perspectives on and reasons for using these services. Realistsynthesis, which focuses on the mechanisms that bring about particular outcomes and the contexts inwhich these processes take place, would complement recent reviews by offering a more in-depth andnuanced understanding of patients’ decision-making in relation to this important issue.
Reviews show that ‘clinically unnecessary’ use of emergency and urgent care differs by populationsubgroup, although the findings are not consistent. There is a need to explore perceptions, experiencesand attitudes by population subgroup. There is also a need to identify potential interventions thatmight address demand. Drivers and solutions may differ by subgroup, so considering different groupsof ‘clinically unnecessary’ users may highlight interventions specific to those groups. Given thatpopulation attitudes can affect demand for emergency and urgent care, exploring these attitudes andhow they differ by subgroup may improve understanding of the drivers of demand.
Conceptual framework
Three conceptual issues are relevant to this study. First, as recommended in a recent evidencereview,30 this study takes an emergency and urgent care system-wide perspective rather than focusingon demand for a single service; the focus is on emergency ambulance, EDs and general practicebecause these services have been identified as suffering from high demand in England. Second, thefocus is on patient and population perceptions of seeking emergency and urgent care rather than on
DOI: 10.3310/hsdr08150 Health Services and Delivery Research 2020 Vol. 8 No. 15
© Queen’s Printer and Controller of HMSO 2020. This work was produced by O’Cathain et al. under the terms of a commissioning contract issued by the Secretary of Statefor Health and Social Care. This issue may be freely reproduced for the purposes of private research and study and extracts (or indeed, the full report) may be included inprofessional journals provided that suitable acknowledgement is made and the reproduction is not associated with any form of advertising. Applications for commercialreproduction should be addressed to: NIHR Journals Library, National Institute for Health Research, Evaluation, Trials and Studies Coordinating Centre, Alpha House,University of Southampton Science Park, Southampton SO16 7NS, UK.
3
the perspectives of health professionals or policy-makers. This is because it is important to gain anin-depth understanding of people’s attitudes and behaviour in order to understand how best to addressthese. Third, the focus is on factors operating at micro (person, family), meso (community) and macro(nation, society) levels. Therefore, an ecological model encompassing these levels shapes the study inthe context of policy, organisational and societal issues affecting people’s decision-making, as well asindividual behaviour.
There is no conceptual model of demand for the emergency and urgent care system as a whole. Threeconceptual models focus on parts of the system. One model encapsulates demand for EDs,31 drawingattention to the role of the health-care system and policy factors, as well as the micro-level factor ofindividual perceptions of severity of illness, quality of care and benefit. A second model of the useof ambulance services for ‘primary care sensitive conditions’ is constructed as an ecological model ofinfrastructure, population and health professional factors.17 A third model of the use of ambulanceservices recognises that the immediate factor of perceived seriousness is influenced by health status,belief in one’s ability to control a situation (self-efficacy), social support and trust in the system,which, in turn, are affected by sociodemographic factors. Rational choice involves weighing up therisks against the benefits and costs of contacting a service, which can be influenced by previousexperience.32 Andersen’s33 model of health service use is also relevant here, explaining the use of allservices, not simply the use of emergency and urgent care. This model highlights the three dynamics ofpredisposing factors (e.g. ethnicity, age and health beliefs), enabling factors (e.g. family support andaccess to health insurance) and both perceived and actual need for health-care services. Together,these models highlight the types and range of factors likely to affect ‘clinically unnecessary’ demand foremergency and urgent care.
Aim and objectives
The study aim and objectives are articulated slightly differently from in the original proposal to clarifythe focus on ‘clinically unnecessary’ demand for three health services offering emergency and urgentcare. Appendix 1 provides the original objectives.
AimThe aim of the study is to identify the drivers of ‘clinically unnecessary’ use of emergency and urgentcare using patient and population perceptions.
Objectives
1. To identify the drivers of ‘clinically unnecessary’ use of emergency and urgent care using a realistreview and qualitative interview study.
2. To understand how different subgroups of the population make decisions about help-seeking usinga qualitative interview study.
3. To identify potential intervention strategies using a focus group study.4. To measure the prevalence of attitudes to seeking urgent care, and how these vary in different
circumstances, and by different subgroups of the population, using a population survey.5. To identify the characteristics of people with a tendency to make ‘clinically unnecessary’ use of
emergency and urgent care, using vignettes within a population survey.
BACKGROUND
NIHR Journals Library www.journalslibrary.nihr.ac.uk
4
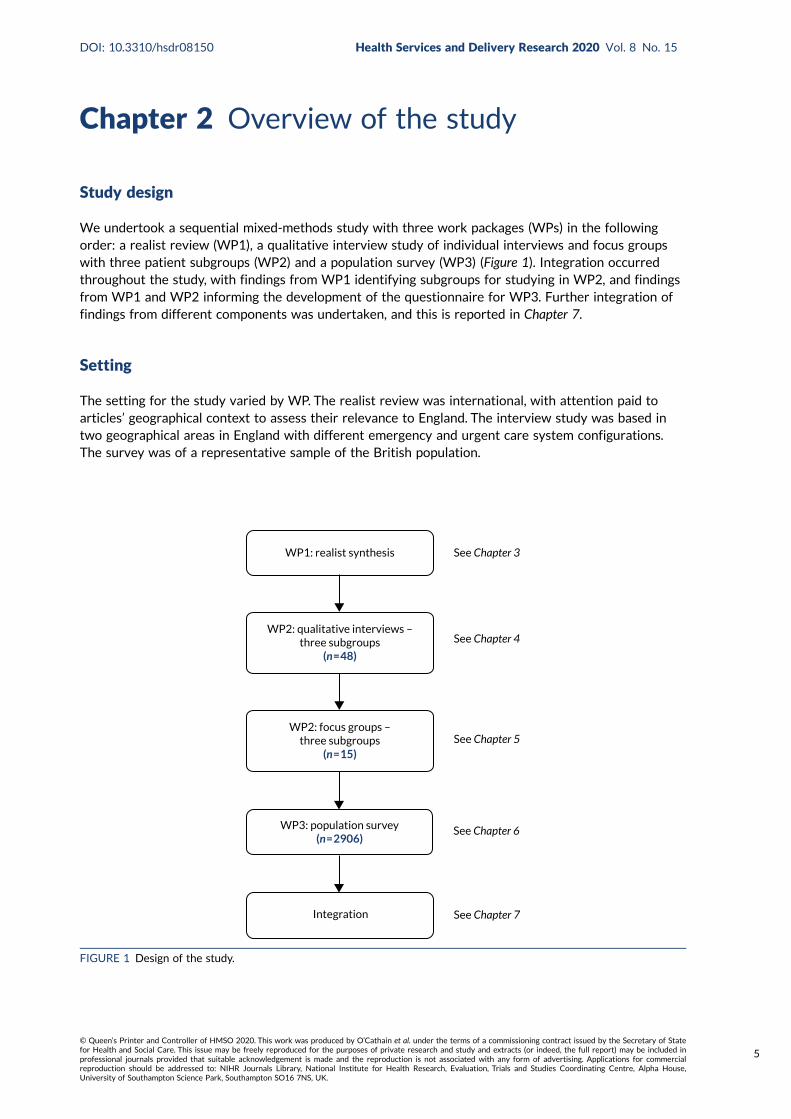
Chapter 2 Overview of the study
Study design
We undertook a sequential mixed-methods study with three work packages (WPs) in the followingorder: a realist review (WP1), a qualitative interview study of individual interviews and focus groupswith three patient subgroups (WP2) and a population survey (WP3) (Figure 1). Integration occurredthroughout the study, with findings from WP1 identifying subgroups for studying in WP2, and findingsfrom WP1 and WP2 informing the development of the questionnaire for WP3. Further integration offindings from different components was undertaken, and this is reported in Chapter 7.
Setting
The setting for the study varied by WP. The realist review was international, with attention paid toarticles’ geographical context to assess their relevance to England. The interview study was based intwo geographical areas in England with different emergency and urgent care system configurations.The survey was of a representative sample of the British population.
See Chapter 3
See Chapter 4
See Chapter 5
See Chapter 6
See Chapter 7Integration
WP3: population survey(n = 2906)
WP2: focus groups –three subgroups
(n = 15)
WP2: qualitative interviews –three subgroups
(n = 48)
WP1: realist synthesis
FIGURE 1 Design of the study.
DOI: 10.3310/hsdr08150 Health Services and Delivery Research 2020 Vol. 8 No. 15
© Queen’s Printer and Controller of HMSO 2020. This work was produced by O’Cathain et al. under the terms of a commissioning contract issued by the Secretary of Statefor Health and Social Care. This issue may be freely reproduced for the purposes of private research and study and extracts (or indeed, the full report) may be included inprofessional journals provided that suitable acknowledgement is made and the reproduction is not associated with any form of advertising. Applications for commercialreproduction should be addressed to: NIHR Journals Library, National Institute for Health Research, Evaluation, Trials and Studies Coordinating Centre, Alpha House,University of Southampton Science Park, Southampton SO16 7NS, UK.
5

Patient and public involvement
Sheffield Emergency Care Forum (SECF) is an established group of members of the public who haveexperience of emergency and urgent care services and who offer patient and public involvement (PPI)to research studies.34 At the planning stage, SECF supported the focus of the study, in particular theproposed focus on the subgroups of parents with young children and young adults. They emphasisedthe need to avoid a judgemental stance in the research and to ensure that interviewees were notaware that they had been selected because they had been deemed to use urgent or emergency careservices unnecessarily. They also recommended offering financial incentives, suggesting that participantsmay be hard to recruit. They were particularly interested in potential solutions, and raised the importanceof education at school about how to make best use of health services.
During the study, three SECF members and co-authors of the report (LA, SB and EH) attended ProjectManagement Group meetings and commented on the evolving findings. Sometimes additional SECFmembers attended these meetings when we were presenting detailed findings. Two SECF representatives(Alice Riddell and Beryl Darlison) were members of the Project Advisory Group. Members of the ProjectManagement Group and the Project Advisory Group were invited to comment on the draft reportand Scientific summary, respectively, and two members (SB and LA) were involved in drafting the PlainEnglish summary.
Patient and public involvement members (LA and SB) contributed to the development of the topicguide and to the interpretation of qualitative data in WP2, via management group meetings and adhoc meetings specifically to discuss emerging findings. We held a large PPI event with members of thewider public to consider the draft survey in WP3. We report details of this event in Chapter 6.
Patient and public involvement members were reimbursed in payment or vouchers in recognition oftheir contribution.
Overall, PPI members provided invaluable input into the study. All of those who were part of theSECF had experience of being involved in research and were confident in contributing to discussionsand providing feedback on written materials. The wider PPI event we held as part of the questionnairedevelopment for WP3 drew on a more diverse group, including members of the public with no previousexperience of research. The success of this event means that we are likely to hold more PPI events ofthis type in the future.
Project Advisory Group
A Project Advisory Group was convened whose members had operational roles in general practice,the ED or the ambulance service (Philip Foster, Matthew Booker, Kirsten Clinton and Andrew Hodge),a commissioning role (Daniel Mason) or expert knowledge of the emergency and urgent care system(Matthew Cooke), or were service users themselves (Alice Riddell and Beryl Darlison). The group waschaired by Matthew Cooke and met four times during the study.
Ethics approval: interviews and national survey
The realist review (WP1) did not require ethics approval. Ethics approval was sought for the qualitativeinterview study (WP2) and this was obtained from London – Brent REC (reference 14/LO/1228). Thepopulation survey (WP3) was conducted by the National Centre for Social Research (NatCen) (London, UK),which obtained ethics approval through its standard procedures.
OVERVIEW OF THE STUDY
NIHR Journals Library www.journalslibrary.nihr.ac.uk
6

Chapter 3 Realist review
Aim and objectives
The aim of this review was to use realist synthesis to identify patients’ perspectives on why they makewhat is judged to be ‘clinically unnecessary’ use of emergency and urgent care services. The objectiveswere to identify:
1. programme theories to explain ‘clinically unnecessary’ use of three emergency and urgentcare services
2. subgroups of the population about whom more research is needed3. interventions recommended by researchers.
Methods
Realist synthesisRealist synthesis was chosen because it enables an understanding of complex social programmes thatinvolve human decisions and actions.35 Although generally used to explore interventions and how theiroutcomes are achieved, realist reviews have been used to study other issues, such as access to care.36,37
Therefore, ‘clinically unnecessary’ use of emergency and urgent care services was considered anappropriate topic for a realist review.
The review had two phases. In the first phase, we developed and refined a set of programme theories(or proposed explanations of patients’ behaviour) that were based on published qualitative research ofpatients’ perspectives on why they use emergency and urgent care services for reasons judged to be‘clinically unnecessary’. We had initially intended to draw on multiple types of information, as is commonin realist reviews,35 but as the intention of the review was to develop programme theories that weregrounded in in-depth patients’ perspectives, we decided to change this approach and to focus only onqualitative journal articles reporting patients’ perspectives. The development of the programme theorieswas also informed by discussions with our Project Management Group. In the second phase of thereview, we tested the programme theories in two ways:
1. Using existing theories of health behaviour, in particular health decision-making, to gain a morein-depth understanding of how these related to this extensive wider literature.
2. Identifying any existing quantitative research that could support or refute these theories.
We registered the proposal with PROSPERO 2017: CRD42017056273. We used the RAMESES (Realistand Meta-narrative Evidence Syntheses: Evolving Standards) reporting guidelines.35
Phase 1: developing and refining the programme theories
The review question and initial theoretical frameworkWe focused on three services: emergency ambulance, EDs and general practice. The research questionwas ‘What are patients’ perspectives of why they make use of services providing emergency andurgent care that is judged subsequently by health professionals to be “clinically unnecessary”?’.
DOI: 10.3310/hsdr08150 Health Services and Delivery Research 2020 Vol. 8 No. 15
© Queen’s Printer and Controller of HMSO 2020. This work was produced by O’Cathain et al. under the terms of a commissioning contract issued by the Secretary of Statefor Health and Social Care. This issue may be freely reproduced for the purposes of private research and study and extracts (or indeed, the full report) may be included inprofessional journals provided that suitable acknowledgement is made and the reproduction is not associated with any form of advertising. Applications for commercialreproduction should be addressed to: NIHR Journals Library, National Institute for Health Research, Evaluation, Trials and Studies Coordinating Centre, Alpha House,University of Southampton Science Park, Southampton SO16 7NS, UK.
7

Realist synthesis allows the initial theoretical framework or rough programme theories to be identifiedin different ways.38 Coster et al.’s28 recent review of the demand for emergency and urgent careoffered a set of potential rough programme theories, but it was based on qualitative and quantitativeresearch of all users of a range of emergency and urgent care services. Because this did not focussolely on those patients who were judged to have made ‘clinically unnecessary’ use of services, wedecided not to use these theories as the basis for developing our programme theories, but rather as atheoretical framework to guide our exploration.
Identifying and selecting primary studies for inclusionAlthough we could have identified our literature through database searches, we decided not to do thisas we were aware of a number of high-quality reviews of demand for emergency and urgent care thatwere likely to include the literature we were seeking. We therefore selected three recently published,complementary reviews that were likely to contain relevant articles about emergency ambulanceservice demand,17 ED demand29 and emergency and urgent care,28,30 together with one ongoing reviewby a member of our team (Joanne Turnbull).39 These reviews focused on demand for emergency andurgent care generally, self-referred ED users or the use of ambulance services for ‘primary caresensitive conditions’. We identified the studies in these four reviews and requested copies of thearticles from their lead authors. In addition, in February 2017 we updated these searches by usingMEDLINE and Google ScholarTM (Google, Inc., Mountain View, CA, USA) to identify material publishedduring 2015 and 2016. Finally, because of a lack of articles identified that focused on ‘clinicallyunnecessary’ use of same-day GP appointments, in April 2017 we undertook specific searches inMEDLINE and Google Scholar for relevant general practice-focused studies from the start of eachdatabase to March 2017. All articles were in English as this was an inclusion criterion of the fourreviews, and we applied this to the updated searches. All countries were included. Figure 2 summarisesthe search processes and the selection of studies, and Appendix 2 provides the search strategies.
Quality appraisalThe nature of realist reviews means that the formal quality assessment process that is associated withother review types is not used.35 The study proposal outlined our intention to assess the relevance,context and methodological rigour of potential literature. As part of this process, the relevance of allliterature identified from the reviews and additional searches was appraised and we included onlyliterature related to ‘clinically unnecessary’ use of our three services. We identified studies as relevantif they focused on ‘appropriate use of services’, ‘non-urgent ED users’, ‘ED users who could be managedin alternative urgent care services’, ‘ambulance users or ED users with primary care conditions’ or ‘serviceuse for minor disorders/ailments’, or when it was established in the paper that a group made high levelsof contact with a service when they could have used alternative services (e.g. ‘use of out-of-hours servicesfor febrile child’). For the qualitative evidence, we then undertook an assessment of how well the contextof each included study was reported (see Appendix 3, Table 15) and assessed the study’s methodologicalrigour using the Critical Appraisal Skills Programme (see Appendix 4, Table 16).40 We had initially statedthat we would exclude studies based on the detail of their reporting of context but not on rigour, but welater decided not to exclude for either reason to ensure that all relevant literature was included. Poorlydescribed context and low methodological rigour tended to coincide, and we took account of these issuesin the analysis so that programme theories were not based solely on poorer-quality articles.
Data extractionFor the qualitative evidence, each article identified in the first search iteration was coded by context(year, country, service and type of user, e.g. not clinically necessary, common user, frequent user) andsubgroup (e.g. young adults). We also identified key themes, which are reported in Appendix 5, Table 17.We then identified provisional context (C) and mechanism (M) chains for the outcome (O) of using ahigher-acuity service than was considered clinically necessary. We defined the mechanism as thetrigger for or driver of the decision, which arose from an ongoing situation that we defined as thecontext. As has been found in other realist reviews, it was often difficult to distinguish context frommechanism41,42 because of the multiple mechanisms operating that were often contexts for further
REALIST REVIEW
NIHR Journals Library www.journalslibrary.nihr.ac.uk
8
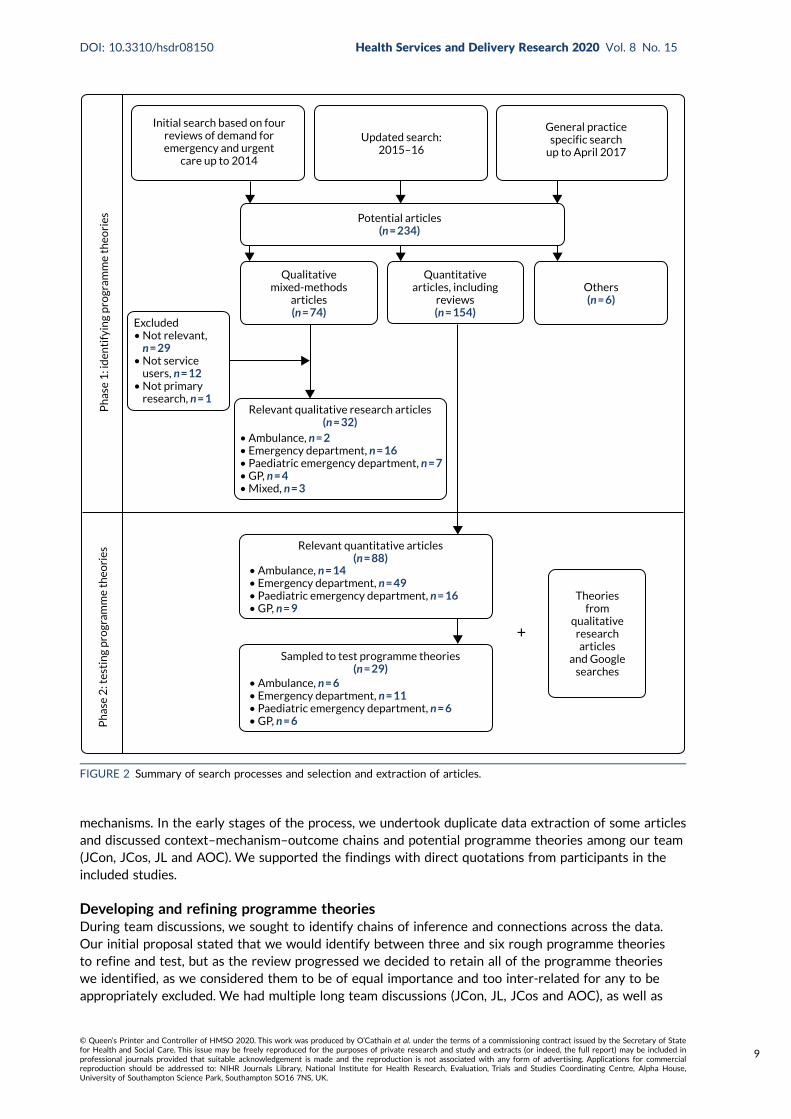
mechanisms. In the early stages of the process, we undertook duplicate data extraction of some articlesand discussed context–mechanism–outcome chains and potential programme theories among our team(JCon, JCos, JL and AOC). We supported the findings with direct quotations from participants in theincluded studies.
Developing and refining programme theoriesDuring team discussions, we sought to identify chains of inference and connections across the data.Our initial proposal stated that we would identify between three and six rough programme theoriesto refine and test, but as the review progressed we decided to retain all of the programme theorieswe identified, as we considered them to be of equal importance and too inter-related for any to beappropriately excluded. We had multiple long team discussions (JCon, JL, JCos and AOC), as well as
Updated search:2015–16
Initial search based on fourreviews of demand foremergency and urgent
care up to 2014
General practicespecific search
up to April 2017
Qualitativemixed-methods
articles(n = 74)
Quantitativearticles, including
reviews(n = 154)
Others(n = 6)
Ph
ase
1: i
den
tify
ing
pro
gram
me
theo
ries
Ph
ase
2: t
esti
ng
pro
gram
me
theo
ries
Theoriesfrom
qualitativeresearcharticles
and Googlesearches
Sampled to test programme theories(n = 29)
Relevant quantitative articles(n = 88)
Excluded• Not relevant, n = 29• Not service users, n = 12• Not primary research, n = 1
Potential articles(n = 234)
• Ambulance, n = 2• Emergency department, n = 16• Paediatric emergency department, n = 7• GP, n = 4• Mixed, n = 3
• Ambulance, n = 14• Emergency department, n = 49• Paediatric emergency department, n = 16• GP, n = 9
• Ambulance, n = 6• Emergency department, n = 11• Paediatric emergency department, n = 6• GP, n = 6
+
Relevant qualitative research articles(n = 32)
FIGURE 2 Summary of search processes and selection and extraction of articles.
DOI: 10.3310/hsdr08150 Health Services and Delivery Research 2020 Vol. 8 No. 15
© Queen’s Printer and Controller of HMSO 2020. This work was produced by O’Cathain et al. under the terms of a commissioning contract issued by the Secretary of Statefor Health and Social Care. This issue may be freely reproduced for the purposes of private research and study and extracts (or indeed, the full report) may be included inprofessional journals provided that suitable acknowledgement is made and the reproduction is not associated with any form of advertising. Applications for commercialreproduction should be addressed to: NIHR Journals Library, National Institute for Health Research, Evaluation, Trials and Studies Coordinating Centre, Alpha House,University of Southampton Science Park, Southampton SO16 7NS, UK.
9
further discussion with the wider team and PPI members in the Project Management Group, to refinethe context–mechanism–outcome chains until we had finalised 10 detailed programme theories. Wefurther developed our understanding by focusing on what created an urgent need to contact a servicewithin each programme theory, and developed six mechanisms across the 10 programme theories toaccount for this urgency. We presented the programme theories at a conference and to our ProjectAdvisory Group for external validation.
Phase 2: testing the programme theoriesIn parallel with the development and refinement of the programme theories, in September 2017Jaqui Long and Alicia O’Cathain began searching for existing theories and conceptual models that wereapplicable to our work using two approaches. Where our included articles referred directly to relevanttheoretical work, these references were followed up by Jaqui Long, who then identified further literaturearound this theory or model, particularly any research applying it to ‘clinically unnecessary’ use ofemergency and urgent care. This approach was used in relation to perceptions of risk, coping under stressand perceptions of service provision. When our literature contained no or few references to theoreticalmaterial related to an evolving programme theory (fear or anxiety, uncertainty, influence of family andfriends), Alicia O’Cathain and Jaqui Long undertook Google searches to identify relevant literature.As part of these searches, a key article was identified43 that integrated three existing theories of howpeople respond to symptoms to create a new model to understand health-related help-seeking behaviour.
In addition to testing the programme theories in relation to existing theoretical material, we exploredthe relationship of these theories to relevant quantitative research. In September 2018, Alicia O’Cathainreviewed the quantitative material from the original searches and purposively sampled recent articlesfocusing on ‘clinically unnecessary’ use of different health services as follows: ambulance (6/14 articles),EDs (11/49), paediatric use of EDs (6/16), and general practice, predominantly GP out-of-hours services(6/9). These articles were read to identify evidence that supported or refuted the programme theories.The evidence was found to consist mostly of cross-sectional surveys of service users labelled ‘clinicallyunnecessary’. There was little research comparing ‘clinically unnecessary’ users with clinically necessaryusers, which might have enabled us to distinguish the mechanisms and contexts associated with ‘clinicallyunnecessary’ use. Even those articles that did explore these differences tested only a limited number ofvariables that were generally not related to our programme theories. Therefore, this process highlightedsignificant gaps in the quantitative evidence.
Findings
Programme theories
Description of the qualitative evidence baseWe included 32 qualitative articles in the review and rated their relevance to the research question.Eighteen were rated 1, directly relevant, and 14 were rated 2, partially relevant (see Appendix 3,Table 15, for details of the relevance ratings). Articles predominantly focused on EDs, either adult/mixed (n = 16) or specialist paediatric (n = 7). Only four studies focused on GP out-of-hours servicesand two focused on emergency ambulance services. No studies considered daytime general practice.Most articles were from the USA (n = 12) or the UK (n = 10), with others from continental Europe(n = 5), Australia, Canada and the Caribbean. Almost all were from high-income countries, althoughsome explored the perspectives of communities with high levels of deprivation in those countries.The health-care context varied widely between countries, particularly in relation to how patients paidfor services.
REALIST REVIEW
NIHR Journals Library www.journalslibrary.nihr.ac.uk
10

Mechanisms and programme theoriesAn overview of our six underlying mechanisms and 10 inter-related programme theories for seeking‘clinically unnecessary’ emergency and urgent care, together with their potential relevance to particularsubgroups, is shown in Table 1.
Testing the programme theoriesThere was considerable support for all of the programme theories from existing theories. Only someof the programme theories were supported by quantitative research, and this was largely fromcross-sectional quantitative studies rather than comparative studies (Table 2).
TABLE 1 The 10 programme theories
Underlying mechanismfor urgency PT label PT detail Subgroups most relevant to
Risk minimisation 1, uncertainty aboutsymptoms causinganxiety
When there is uncertaintyabout symptoms (M) becausethey do not fit with people’sexpectations or experience(e.g. they last longer, are moresevere, are unfamiliar or do notrespond to self-care in theexpected time scale) (C/M), thisincreases the perception thatthe problem may be serious (M)and results in an immediate needto establish what is wrong andreceive reassurance (M). Thisconcern prompts the use of theED (O), where it is perceived thatthe most appropriate resourcesand expertise required to establishcause can be accessed quickly (C),often in the context of a lack oftimely or satisfactory answersfrom primary care services (C)
2, heightenedawareness of risk as aresult of experience orknowledge of traumatichealth events leading toanxiety
When people have experiencedtraumatic health incidents(e.g. delayed help-seekingleading to serious consequences)or are aware of such incidentsexperienced by others or reportedin the media (C), they haveincreased anxiety and awarenessof danger (C/M) and reducedconfidence in their ownjudgement (M). They are thereforeunwilling to take risks when ahealth problem arises (M), leadingthem to seek immediate help andadvice from an expert in the formof emergency care, includingambulance services and EDs (O)
continued
DOI: 10.3310/hsdr08150 Health Services and Delivery Research 2020 Vol. 8 No. 15
© Queen’s Printer and Controller of HMSO 2020. This work was produced by O’Cathain et al. under the terms of a commissioning contract issued by the Secretary of Statefor Health and Social Care. This issue may be freely reproduced for the purposes of private research and study and extracts (or indeed, the full report) may be included inprofessional journals provided that suitable acknowledgement is made and the reproduction is not associated with any form of advertising. Applications for commercialreproduction should be addressed to: NIHR Journals Library, National Institute for Health Research, Evaluation, Trials and Studies Coordinating Centre, Alpha House,University of Southampton Science Park, Southampton SO16 7NS, UK.
11

TABLE 1 The 10 programme theories (continued )
Underlying mechanismfor urgency PT label PT detail Subgroups most relevant to
3, fear of consequenceswhen responsible forothers
When people are in a position ofresponsibility for someone else,they are less willing to take riskswith that person’s health thanwith their own, and they fearthe consequences (e.g. distress/guilt, dismissal, litigation) (M)of not doing ‘the right thing’.This leads them to seek or torecommend seeking urgent care,particularly at the ED (O)
Parents, carers of vulnerableelderly people, people withchronic conditions, healthservice or other serviceprofessionals (e.g. teachers)
Need for speed 4, inability to get onwith daily life
When people are preventedfrom undertaking their normallives, roles or responsibilities(e.g. paid work, childcare) (C),this creates a need to get backto normal quickly (M) and to geton with their lives and dischargetheir responsibilities. Thisprompts their use of urgent care(O) because it can resolve aproblem quickly by being bothmore accessible and moreefficient than alternatives (C)
Parents of young children,people working in jobs whocannot afford or find itdifficult to take time off
5, need for immediatepain relief
When people are in pain ordiscomfort that they findintolerable (C/M), and theybelieve or have experienced thatno primary care appointmentsare available within anacceptable time (C), they seekcare from a more urgent service– usually the ED (O) – becauseof a need to obtain prompt relieffrom their distress (M)
6, waited long enoughfor things to improve
When people delay seekingprimary care treatment(for various reasons includingdeliberation and indecision, costof treatment, lack of transport,complex living situations,mistrust of health services andwork responsibilities) (C), theywait, often while using self-helpmeasures, and hope the situationwill improve or resolve (C).The condition reaches a ‘tippingpoint’ where either it is nolonger tolerable (M) or othercircumstances force a decision(M), and people feel that theycannot wait any longer (M).At this point, if a primary careservice is unavailable to them(C), they feel they have nochoice but to use an emergencyservice (O)
REALIST REVIEW
NIHR Journals Library www.journalslibrary.nihr.ac.uk
12

TABLE 1 The 10 programme theories (continued )
Underlying mechanismfor urgency PT label PT detail Subgroups most relevant to
Low effort required forhelp-seeking
7, stressful lives/cannotcope
When people are alreadyexperiencing significant stressesthat have an impact on theinternal and external resourcesavailable to them (e.g. money,time) (C), they have less capacityto cope with the additionalchallenge of a new or changedhealth problem. Symptoms aretherefore likely to triggeremotional distress, includingfeelings of loss of control andhelplessness (M), leading themto use emergency servicesbecause this is less burdensomethan making an appointmentwith a GP. This is more likely tooccur when people cannot easilyor quickly access a primary careservice (C)
People with lowsocioeconomic status,parents, people who areisolated, people withdemanding work, peoplewith mental health problems
Compliance 8, following advice oftrusted others
When people are anxious orconcerned about a healthproblem and have sought theadvice of trusted others (C) –either those in their socialnetwork (e.g. family) or healthprofessionals (particularlyprimary care staff) – and havebeen advised to seek urgentcare, particularly the ED (M),they are likely to then use thoseemergency services (O)
Availability and qualityof care
9, perceptions or priorexperiences of services
When people have individualexperience or knowledge, orcultural beliefs, about thediffering quality or availability ofprimary and emergency services,such as primary care offeringinadequate diagnosis and care ordiscrimination (US context only),or EDs having better resources,expertise or more thorough care(C), they are likely to chooseemergency care, particularly theED (O), in which they have moretrust and confidence (M)
People previously referredto emergency services byprimary care staff, parents ofyoung children, people withchronic conditions
Frustration with accessto GP
10, poor access to a GP When people are unable toobtain an appointment with aprimary care practitioner (C/M),this can further exacerbatefeelings of anxiety and causepanic (M). Individuals canexperience frustration (M),mistrust (M) and the perceptionof an uncaring service (M),feeling that they have no choice(M) but to contact an emergencyservice (O)
PT, programme theory.
DOI: 10.3310/hsdr08150 Health Services and Delivery Research 2020 Vol. 8 No. 15
© Queen’s Printer and Controller of HMSO 2020. This work was produced by O’Cathain et al. under the terms of a commissioning contract issued by the Secretary of Statefor Health and Social Care. This issue may be freely reproduced for the purposes of private research and study and extracts (or indeed, the full report) may be included inprofessional journals provided that suitable acknowledgement is made and the reproduction is not associated with any form of advertising. Applications for commercialreproduction should be addressed to: NIHR Journals Library, National Institute for Health Research, Evaluation, Trials and Studies Coordinating Centre, Alpha House,University of Southampton Science Park, Southampton SO16 7NS, UK.
13

TABLE 2 Evidence for programme theories
PTEvidence fromqualitative papers
Links to existingtheories/models Evidence from quantitative papers
1, uncertainty aboutsymptoms causinganxiety: ‘I am worriedbecause I do not knowwhat is wrong’
7,44–57 Leventhal et al.:58 commonsense model
Mishel and Braden:59 roleof uncertainty in decision-making
Cross-sectional surveys of ED andGP OOH service users showed thatsome, but not all, were worried oranxious or thought that they had aserious problem60–64
2, heightenedawareness of risk as aresult of experience/knowledge of traumatichealth events leading toanxiety: ‘After whathappened before Idaren’t risk it’
44,47,49,51–53,57,65–69 Leventhal et al.:58 commonsense model
Beck:70 risk society
Pescosolido:71 networkepisode model
–
3, fear of consequenceswhen responsible forothers: ‘In my position,it’s better to be safethan sorry’
45,46,49,50,52,53,57,72,73 Leventhal et al.:58 commonsense model
Beck: risk society70
Dixon-Woods et al.:74
candidacy
Dingwall and Murray:75
categorisation of patients
There was little evidence, only arelated issue of autistic childrenhaving higher rates of non-urgentuse of EDs76
4, inability to get onwith daily life: ‘I needto get back to normal’
56,77 Dingwall:78 illness actionmodel
Leventhal et al.:58 commonsense model
Zola:79 pathways to thedoctor
Beck:70 risk society
This issue was not addressedexplicitly but may have beendescribed as using services forconvenience80
5, need for immediatepain relief: ‘It’s urgentbecause it hurts’
7,45,50,55,56,65,68,77,81–84 Leventhal et al.:58 commonsense model
Andersen:33 behaviouralmodel of health-careutilisation
Beck:70 risk society
–
6, waited long enoughfor things to improve:‘I can’t delay this anylonger, I need to dealwith it now’
7,48,51,54,55,65,67,72,77,81–85 Andersen:33 behaviouralmodel of health-careutilisation
Leventhal et al.:58 commonsense model
Mishel and Braden:59
role of uncertainty indecision-making
Zola: pathways to thedoctor79
Cross-sectional studies showed thatpeople delayed attending servicesand tried to self-manage problems,and that duration of symptomswas an issue for ED users. Usersof ED and GP OOH services hadused over-the-counter remediesbeforehand. In a comparative study,medically unnecessary users of GPOOH had longer-lasting problemsthan medically necessaryusers8,60–62,64,80,86–88
REALIST REVIEW
NIHR Journals Library www.journalslibrary.nihr.ac.uk
14

TABLE 2 Evidence for programme theories (continued )
PTEvidence fromqualitative papers
Links to existingtheories/models Evidence from quantitative papers
7, stressful lives: ‘I justcan’t cope with theillness or making anappointment’
47,49,52,55,66,67,69,73,77,81,83,84 Andersen:33 behaviouralmodel of health-careutilisation
Antonovsky and Sagy:89
sense of coherence/generalised resistanceresources
Dixon-Woods et al.:74
candidacy
Mishel and Braden:59
role of uncertainty indecision-making
People arriving at EDs by ambulanceand classed as non-urgent weremore likely to be homeless and tohave mental health problems.People who were more likely to usean ambulance in a hypotheticalsituation that did not require anambulance had no car or livedalone6,61,90
Against: one review concluded therewas little evidence of an associationbetween coping mechanisms and theuse of EDs, and another concludedthat affluent groups were morelikely to use EDs for minorproblems14,86
8, following advice oftrusted others: ‘That’swhat they said to do,and they know betterthan me’
45–51,54–56,66,68,73,77,82,91,92 Pescosolido:71 networkepisode model
Leventhal et al.:58 commonsense model
Andersen:33 behaviouralmodel of health-careutilisation
Dixon-Woods et al.:74
candidacy
Cross-sectional studies showed thatpeople followed the advice of familyfriends and health professionalswhen attending EDs. It was commonto follow instructions from primarycare staff, with at least one-quarterof ED users referred to an ED by aGP12,14,60–62,64,93
9, perceptions or priorexperiences of services:‘I’ll get a better andfaster service from thehospital/ambulance’
7,45,46,49,50,54,55,57,66–68,72,73,
81–85,91,92,94
Rogers and Nicolaas:95
recursivity
Andersen:33 behaviouralmodel of health-careutilisation
Zimmerman:96 multileveltheory of populationhealth
Nilsen et al.:97 role of habit
Dixon-Woods et al.:74
candidacy
Pescosolido:71 networkepisode model
Cross-sectional studies showed theattraction of the tests available andthe quality of care at EDs, as wellas the ease of getting tests andtreatments and the preference fora specialist within paediatric EDs.Concerns about poor-quality generalpractice were related largely to alack of tests, such as X-rays, andaccessibility8,10,12,15,60,62,86,93
10, poor access to aGP: ‘I can’t get anappointment quicklyenough’
7,45,49,50,56,57,65,66,68,72,73,77,
81,91,98
Andersen:33 behaviouralmodel of health-careutilisation
Cross-sectional studies showedthat perceived or actual difficultyaccessing a GP in the time framerequired by patients affected theiruse of EDs and GP OOH services.Lack of access was sometimesbecause of the time of day, whenprimary care was closed. In somestudies, a sizeable minority ofpatients had attempted tocontact the GP before goingto an ED8,10,12,14,15,62,80,86–88,99–101
OOH, out of hours; PT, programme theory.
DOI: 10.3310/hsdr08150 Health Services and Delivery Research 2020 Vol. 8 No. 15
© Queen’s Printer and Controller of HMSO 2020. This work was produced by O’Cathain et al. under the terms of a commissioning contract issued by the Secretary of Statefor Health and Social Care. This issue may be freely reproduced for the purposes of private research and study and extracts (or indeed, the full report) may be included inprofessional journals provided that suitable acknowledgement is made and the reproduction is not associated with any form of advertising. Applications for commercialreproduction should be addressed to: NIHR Journals Library, National Institute for Health Research, Evaluation, Trials and Studies Coordinating Centre, Alpha House,University of Southampton Science Park, Southampton SO16 7NS, UK.
15

Population subgroupsThe programme theories based on qualitative research were particularly relevant to parents of youngchildren, carers, people living with chronic conditions and people leading complex or stressful lives interms of experiencing isolation or mental health problems. However, the qualitative research focusedexplicitly on parents of young children only. We also read systematic reviews and quantitative articlesin the review and found subgroups highlighted as more likely to be ‘clinically unnecessary’ users.However, we were concerned about this evidence base because it sometimes identified the characteristicsof a cross-sectional study of ‘clinically unnecessary’ users (which may have simply corresponded to thecharacteristics of users) and less commonly compared ‘clinically unnecessary’ with clinically necessaryusers, and the results were not always consistent. There was some evidence that the following subgroupswere more likely to be ‘clinically unnecessary’ users: men, people born outside the country of study,people living in areas of deprivation, people with some clinical complaints, people living a short distancefrom an ED, children, adults aged < 40 years and older people.
Recommended interventions to address ‘clinically unnecessary’ use of servicesJaqui Long reviewed the included qualitative articles to identify and extract specific recommendationsor observations about interventions to address ‘clinically unnecessary’ use of services. We focused onthe qualitative literature to ensure that the recommended interventions were based on an in-depthunderstanding of patients’ decision-making processes. Almost all of the papers contained relevantinformation, with only three making no specific comment about potential interventions. We inductivelyidentified seven broad categories of interventions (Table 3). All of the recommendations came from thearticles’ authors rather than from the study participants.
TABLE 3 Summary of recommended interventions within qualitative articles in the review
Categorya Examples Articles
Provide patienteducation aboutmanagement ofhealth problems andservice use
Clear, consistent advice from health professionals and throughpublic education about self-care, managing non-urgent problemsand preventing exacerbations of existing conditions
Prior agreement between GPs and patients on how to respond toparticular acute problems
Education on use of services: what is an emergency
Education about the capacity and scope of different services
Education about the benefits of continuity of care
Promotion of services available through primary care
48–50,52,54–56,66,68,72,73,81–84,98
Recognise theinfluence of personaland social context ondecision-making
Acknowledge and understand the impact of the following onpeople’s perceptions of a situation and their choice of service,and provide support to overcome barriers where possible:
l anxiety/emotion – can over-ride ‘rational’ knowledgel gap between an individual’s conception of an emergency and
their own problem – meaning of symptomsl social deprivation, complex lives, isolation, long-term health
problems – impacts on priorities and choicesl cultural/social norms and beliefs about health and servicesl prior positive/negative experiences of services or health-care
system as a wholel health professionals’ attitudes – create anxiety, fear of
criticism/blame for inappropriate use or failure to use services,lack of confidence in self-managing
l limited English language – avoidance of telephone bookingand consultation
7,44,48,50–53,55,67–69,73,77,83,85,98
REALIST REVIEW
NIHR Journals Library www.journalslibrary.nihr.ac.uk
16

TABLE 3 Summary of recommended interventions within qualitative articles in the review (continued )
Categorya Examples Articles
Improve primarycare provision,including OOHsupport
Improved quality and efficiency of services
Simplified appointments system
Extended hours/OOH clinics
Open access
Fast-track option for urgent problems
OOH telephone service
Internet/e-mail access
Wider range of services and tests
More co-ordination of care: access to specialist staff
47,49,50,55,56,66,67,72,83,84,91,92,94,98
Make changes to thestructure of careprovision in ED
Locate ED and primary care on the same site
Introduce fast track within ED
Provide specialist open-access clinics for managing exacerbationsof long-term conditions (e.g. asthma)
Triage non-urgent patients to community resources/appointments
Treatment of minor injuries/illnesses by nurse advisers
Provide advocates/social workers for vulnerable patients
Provide specialist co-ordinated care for frequent attenders withmultiple problems
7,49,50,54,69,77,91,92
Improve therelationship betweenprimary care andpatients
Address negative attitudes and behaviour of staff to improvepatient experience
Improve communication regarding appointment systems
Involve/collaborate with patients in service design
Support self-management and build confidence
Provide support for vulnerable patients to navigate and accessservices (e.g. those with low literacy, deprivation, poor health)
50,66,67,83,84,98
New/alternativepatterns of careprovision in thecommunity
Integrate services to assess and manage urgent problems in thecommunity/at home
Provide more urgent care away from ED, including for pain, minortrauma and children’s minor illnesses
Provide a nurse-staffed telephone line for non-urgent callers toemergency ambulance service
49,72,84,91
Reduce primary carereferral to ED
Educate primary care staff on when to refer patients to the ED(only in papers published in USA)
47,66,91
OOH, out of hours.a Ordered by number of articles referring to an intervention.
DOI: 10.3310/hsdr08150 Health Services and Delivery Research 2020 Vol. 8 No. 15
© Queen’s Printer and Controller of HMSO 2020. This work was produced by O’Cathain et al. under the terms of a commissioning contract issued by the Secretary of Statefor Health and Social Care. This issue may be freely reproduced for the purposes of private research and study and extracts (or indeed, the full report) may be included inprofessional journals provided that suitable acknowledgement is made and the reproduction is not associated with any form of advertising. Applications for commercialreproduction should be addressed to: NIHR Journals Library, National Institute for Health Research, Evaluation, Trials and Studies Coordinating Centre, Alpha House,University of Southampton Science Park, Southampton SO16 7NS, UK.
17

Discussion
Summary of findingsUsing qualitative research that was focused largely on EDs, we identified 10 inter-related programmetheories to explain why patients make ‘clinically unnecessary’ use of emergency and urgent care. Theseincluded programme theories related to symptoms (e.g. anxiety due to uncertainty about the seriousnessof symptoms), patients (e.g. need for low treatment-seeking burden, caused by an inability to cope as aresult of complex or stressful lives) and services (e.g. EDs were perceived to offer the desired tests andexpertise when contrasted with primary care, services directed patients to EDs). Multiple mechanismscould operate for an individual. There was considerable support for these programme theories fromexisting theories of health behaviour but little quantitative evidence of the programme theoriesoperating more in ‘clinically unnecessary’ users than in clinically necessary users.
Links to existing literatureSome of our programme theories aligned with the findings in the original reviews from which we identifiedour studies. There were clear links to the following ideas: uncertainty causing anxiety and a need toobtain reassurance to manage risk;17,28,29 a fear of consequences, particularly in relation to children andambulance use;17 the role of stress and social deprivation in driving a need for ease of access to care;17
the influence of others, including professionals, on people’s service use;17,28,29 and consumer satisfaction,expressed positively in relation to EDs offering a range of tests and interventions in one place17,28,29
and negatively in relation to a lack of confidence in GPs28,29 or frustration with a lack of access toprimary care.17,28,29 Wider research on the demand for emergency and urgent care also supported someof the programme theories, in particular highlighting how poor access to GPs is associated with higheruse of EDs for all emergency and urgent care, not just that considered ‘clinically unnecessary’. This linkhas been identified in numerous studies, including a large-scale survey of GP patients in 34 countries.102
The realist review also identified some programme theories that were not evident in the original reviews.In particular, we highlighted the influence of the following on people’s decision-making: the role ofprevious traumatic health events in increasing anxiety, the need for immediate relief of intolerable pain,the concern about returning to normal to fulfil responsibilities such as work or child care, and the senseof a ‘tipping point’ triggering a need for urgent care following a period of self-imposed delay.
Our programme theories did not include a number of issues that were highlighted in other reviews(including our original four) or quantitative research into ‘clinically unnecessary’ use. These issuesincluded convenience in terms of a shorter journey to a particular service;12,15,29,63,103 awareness ofservices;12,87 health knowledge;17 misunderstanding of the role of a service;19,88 differences betweenurban and rural settings;80 lack of a GP;88 a desire to take control;19 and financial considerationsdiscussed within the US literature.29 As these issues did not feature strongly within our includedqualitative literature, they did not form part of our programme theories. We also did not develop aprogramme theory around the role of convenience in patients’ decisions to use emergency and urgentcare, a key issue identified in other research.14,28,29,62,93
Strengths and limitationsThe lengthy and careful process used by the team to develop and refine the programme theories is akey strength of our study. The specific focus on qualitative research ensured that these theories weregrounded in patients’ views and experiences. Linking our programme theories, developed in relation toa particular context of service use, to existing wider theories of health behaviour, also strengthens thereview and its findings. The use of a realist approach enabled us to identify similar findings to previousresearch, but to significantly extend and deepen them by exploring the reasons behind the findings; forexample, it confirmed the importance of anxiety, but also identified why people felt anxious. In additionto supporting existing findings, the review identified new issues driving people’s help-seeking, such as aneed for immediate pain relief and the impact of previous traumatic experiences.
REALIST REVIEW
NIHR Journals Library www.journalslibrary.nihr.ac.uk
18

The review had some limitations. First, the included articles focused largely on the use of EDs.Second, the programme theories are based on qualitative interviews with patients who may have beenconcerned about portraying themselves as responsible and appropriate users of services.20 However,even if this was the case, it is important to understand these representations, and we provide valuableinsights into how patients describe their decision-making. Third, the included studies used a widevariety of definitions of ‘clinically unnecessary’ or ‘non-urgent’ in their recruitment of participants, and,therefore, our programme theories have not been developed in relation to a consistently definedgroup, as is the case in other reviews. Fourth, the included studies did not always provide enoughdetail to give an insight into the interaction of different issues within individuals, or where thisparticular service use was located in an individual’s overall help-seeking journey (e.g. whether or notthey had tried other options). Fifth, the age of many of the included studies meant that very fewreferences were made to online health-care advice, which is being used increasingly as a help-seekingstrategy. Finally, our ability to test the programme theories against the quantitative literature wasconstrained by the limitations of this material, as it frequently did not necessarily measure issues orvariables relevant to our findings.
ImplicationsOur findings highlight how the use of emergency and urgent services that is deemed ‘clinicallyunnecessary’ may be considered reasonable once details of a patient’s situation are fully taken intoaccount. This conclusion of behaviour being rational was also reached in some of the research includedin our review.7,55,62,104 If patients are in fact generally acting rationally, this implies that interventionsneed to focus on educating policy-makers and service providers to better understand patients’ decision-making processes. For example, although a clinician may consider that a patient who has had symptomsfor some weeks does not require urgent care, it is important to understand that it is precisely this durationthat leads the patient to perceive that the situation is urgent. However, although a better understandingmay change clinicians’ judgements, it is important to recognise the wider context of demand outstrippingsupply in many services. In addition to the ‘individual patient perspective’, there is a need to considerinterventions with a view to ensuring that services are sustainable in the future.
The review highlights the importance of the impact of social circumstances on people’s ability to copewith even minor health problems. Interventions to bring about changes in service use by people insuch circumstances may require wide public health approaches, including reductions in poverty,improvements to child-care support and changes in workplaces to reduce the stress caused by beingunable, or feeling unable, to take time off work to seek health care.
An implication for further research is the need to compare the drivers identified here for ‘clinicallyunnecessary’ users and clinically necessary users to identify the size of effect of these drivers and theirvariation in different population subgroups.
Implications for work packages 2 and 3Our review contributed to the selection of subgroups for WP2 (see Chapter 4).
Although data collection and early analysis of the interviews in WP2 was not directly informed bythe findings from WP1, later analysis explored the relationship of the 10 programme theories to theexperiences described by interviewees, including the number and patterns of programme theoriespresent and any refinements of or challenges to them (see Chapter 4, Methods).
We tested the programme theories in the WP3 survey, including at least one item in the questionnairerelating to each programme theory.
DOI: 10.3310/hsdr08150 Health Services and Delivery Research 2020 Vol. 8 No. 15
© Queen’s Printer and Controller of HMSO 2020. This work was produced by O’Cathain et al. under the terms of a commissioning contract issued by the Secretary of Statefor Health and Social Care. This issue may be freely reproduced for the purposes of private research and study and extracts (or indeed, the full report) may be included inprofessional journals provided that suitable acknowledgement is made and the reproduction is not associated with any form of advertising. Applications for commercialreproduction should be addressed to: NIHR Journals Library, National Institute for Health Research, Evaluation, Trials and Studies Coordinating Centre, Alpha House,University of Southampton Science Park, Southampton SO16 7NS, UK.
19


Chapter 4 Qualitative interview study ofdecision-making with three subgroups ofthe population
Introduction
In the WP1 review, we identified that there have been many qualitative studies of ‘clinically unnecessary’users of EDs, but not many studies that focused on users of emergency ambulances or same-day GPappointments. Some of the studies identified were not based on in-depth qualitative analyses. Inaddition, given that drivers may differ by subgroup, not much of the qualitative research focused onspecific subgroups. We concluded that further qualitative research was needed that explored patients’decision-making processes in depth, including their use of these three services, and that focused onspecific subgroups.
Aim
The aim was to identify the drivers of ‘clinically unnecessary’ use of emergency ambulances, EDs andgeneral practice by different subgroups of the population.
Methods
Selecting subgroupsWe planned to select the subgroups using the following criteria:
l those more likely to be ‘clinically unnecessary’ users based on the literaturel those more likely to be ‘clinically unnecessary’ users based on the views of our Project
Advisory Groupl those on whom a lack of qualitative research has been undertaken.
To identify potential subgroups, Emma Knowles and Alicia O’Cathain read reviews and quantitativepapers from the WP1 literature. Articles reported sociodemographic status (age, sex, ethnicity,relationship status), socioeconomic status (income, education level, employment status, housing tenure),presenting clinical complaint, health-care utilisation (registered with a GP, prior use of care, attendanceby day/time, arrival mode) and distance to care. The findings from the literature were sometimesinconsistent, so we used them to identify a list of candidate subgroups to be discussed with our ProjectAdvisory Group. Following consideration of the candidate subgroups, the group identified the followingas of interest to them: people of Eastern European origin, individuals living in socially deprived areas,ambulatory ED patients, parents with young families, young adults and care home residents. Wedecided not to focus on Eastern European people, as an ongoing study was focusing on their help-seeking behaviour relating to urgent care services such as WICs,22 ambulatory ED patients, because wewere interested in three services rather than EDs only, or care home residents, because the decision toseek care was likely to be taken by a third party rather than the patient. The Project Advisory Groupmembers strongly supported focusing on people from socially deprived areas and parents of youngchildren. They identified young adults as an interesting group to study because they viewed this groupas accessing care for convenience. Some relevant qualitative research had been undertaken on thesesubgroups, particularly on parents of young children, but this had been undertaken largely outsidethe UK.
DOI: 10.3310/hsdr08150 Health Services and Delivery Research 2020 Vol. 8 No. 15
© Queen’s Printer and Controller of HMSO 2020. This work was produced by O’Cathain et al. under the terms of a commissioning contract issued by the Secretary of Statefor Health and Social Care. This issue may be freely reproduced for the purposes of private research and study and extracts (or indeed, the full report) may be included inprofessional journals provided that suitable acknowledgement is made and the reproduction is not associated with any form of advertising. Applications for commercialreproduction should be addressed to: NIHR Journals Library, National Institute for Health Research, Evaluation, Trials and Studies Coordinating Centre, Alpha House,University of Southampton Science Park, Southampton SO16 7NS, UK.
21

We decided that our qualitative research should focus on the following three subgroups.
1. Young adults: people aged 18–25 years (later expanded to 18–30 years). Reviews in WP1 identifiedthat younger adults were more likely to be ‘clinically unnecessary’ users of EDs,13,14,86 and a studyof medically unnecessary GP out-of-hours users showed that they were more likely to be aged25–44 years.88 This choice of subgroup was supported later in our study, when a UK-based researchstudy was published showing that those aged 16–44 were more likely to use EDs for non-urgentreasons105 and a media study identified young people aged 18–29 as more likely than older working-agegroups to use EDs and less likely to visit their GP.106 None of the qualitative research identified in ourWP1 review had focused on this subgroup.
2. Socially deprived: people residing in postcodes with an Index of Multiple Deprivation (IMD) score of≤ 3. Reviews in WP1 identified that use of ambulance services for non-urgent conditions was higherin deprived areas17 and that people from deprived communities may prefer to access EDs ratherthan GPs.28 A review of ‘clinically unnecessary’ use of EDs agreed with this,14 but two other reviewsidentified that affluent groups were more likely to be ‘clinically unnecessary’ users of EDs.13,86
Although the evidence was conflicting, our Project Advisory Group members also identified thosewho are socially deprived as ‘clinically unnecessary’ users. A few of our qualitative articles in WP1focused on this subgroup, but these were mainly US based.
3. Parents of young children: parents (aged ≥ 18 years) attending on behalf of a child aged 0–5 years(later expanded to 0–10 years). The odds of being a ‘clinically unnecessary’ ED user were found tobe 1.5 among children aged 0–2 years.107 One-third of children attending EDs in London receivedreassurance only rather than investigations, and researchers concluded that many could have beenmanaged without attending an ED.108 Our Project Advisory Group identified this as an importantgroup to study. However, a number of the qualitative studies identified in our WP1 review focusedon parents of young children attending paediatric EDs, EDs or GP out-of-hours services. We decidedto focus on this subgroup because most of these qualitative studies were US based and so did notapply to the UK.
Service and setting selectionWe focused on the three service settings of emergency ambulance, ED and daytime general practice.In the original proposal we also said that we would work with one WIC to identify people who werenot registered with a GP, if that service was part of the service configuration in that area. However,we did not do this because we focused the study on the three key services currently facing pressuresin the UK.
We recruited interviewees in two geographical areas: Sheffield and Wolverhampton. We chose theseareas because they offered different service configurations and we wanted to consider whether or notthese had an impact on people’s decision-making. Sheffield has a children’s ED but Wolverhamptondoes not, instead using a self-contained section of its main ED. Additionally, Wolverhampton hadrecently introduced a pilot to integrate some general practices with the NHS acute trust (verticalintegration), and we planned to work with a general practice taking part in this pilot.
Identification and recruitment of potentially eligible patientsOur aim was to recruit recent users of emergency ambulances, EDs or same-day GP appointmentswhom clinicians had identified as having made ‘clinically unnecessary’ use of that service, that is, theycould have accessed a lower-acuity service or used self-care to deal with their health problem. We didnot predefine ‘clinically unnecessary’ more specifically but left clinicians to make that decision. Weexcluded patients who had a known history of violence at the service where they had been identified,lacked the capacity to participate in the study, were < 18 years old or were unable to speak English. Whenwe approached patients, we did not inform them that they were considered ‘clinically unnecessary’ usersof the service, and explained the study in terms of wanting to understand how people made decisionsabout getting help when they had a health problem.We based our selection on clinicians’ views of clinicalnecessity. The interviewers were not clinicians and did not make checks at interview. However, when the
QUALITATIVE INTERVIEW STUDY OF DECISION-MAKING WITH THREE SUBGROUPS OF THE POPULATION
NIHR Journals Library www.journalslibrary.nihr.ac.uk
22
interviewers made follow-up contact with emergency ambulance and ED participants, a very small numberhad been admitted to hospital and these people were excluded from the research.
Our intention was to complete 16 interviews for each subgroup, making a total of 48 interviews.The processes of identifying and recruiting patients to the study varied between services, and to alesser extent, between subgroups and geographical areas. Although we had originally anticipated thatrecruitment in each service would take a short time only, a number of challenges meant that the processwas considerably more complex and time-consuming and required significantly greater research teaminput than planned.We struggled to recruit enough parents of young children and enough young adults.To improve recruitment, we extended the age range from 0–5 to 0–10 years for children, and from18–25 to 18–30 years for young adults. Whereas extending the age range for young children resultedin only two additional recruits in the older age bracket (i.e. those > 5 years old), another eight youngadults were recruited by including those aged between 26 and 30 years. These decisions were supportedby the literature, as children included in studies from our realist review were sometimes aged up to16 years,50,53 and young adults included those aged up to 44 years in studies identifying ‘clinicallyunnecessary’ use of EDs.105
Emergency ambulance serviceIn the two ambulance service areas (Sheffield and Wolverhampton), ‘clinically unnecessary’ users weredefined as patients who received only telephone advice or were referred to another service by clinicalstaff, that is cases where an ambulance was not sent. We briefed relevant staff about the study, andthey asked patients before the end of a call if they would be interested in participating in the study andwilling to have their contact details passed to the research team. It was not possible for staff to ascertainwhether or not someone was living in an area of deprivation based on our criteria (i.e. IMD score of 1–3).As a result, staff were asked to invite all patients who were not excluded and to establish the age ofyoung adults and of young children whose parents were calling on their behalf, and the postcodes of allcallers who agreed to be contacted. This information, together with patients’ contact details (usually atelephone number), was telephoned to the research team so that we could check eligibility with regardto deprivation. Once ineligible patients were excluded, a member of the research team attemptedto contact those remaining to explain more about the study and arrange to post or e-mail furtherinformation (for copies of the letter of invitation, participant information sheet and consent form,see the project web page: www.journalslibrary.nihr.ac.uk/programmes/hsdr/1513612/#/; accessed5 February 2020). A follow-up call was made a few days later to find out if the person was still interestedand, if so, to arrange a convenient time for the interview.We confirmed this by letter or e-mail.
We faced considerable challenges in recruiting from the two ambulance service areas. Whereasmanagers were supportive of the study, front-line staff assessing patients were initially unaware of thestudy or their role in it. Owing to the pressured environment of the control centre, which operatestightly structured procedures, it was also challenging to introduce a new element into staff contactwith patients. As a result, the researchers spent considerably more time liaising with front-line staff toestablish effective procedures for patient contact and passing on information, and to keep the study intheir awareness. Despite these measures, recruitment remained difficult, particularly in Sheffield, whereit did not prove possible to establish a successful system for ongoing recruitment. We encounteredspecific difficulties with two subgroups. As ambulances are usually dispatched when a call relates to ayoung child, very few parents of young children were identified to be contacted. Recruitment of youngadults also proved extremely difficult. These difficulties led to the expansion of recruitment from theoriginal Sheffield and Wolverhampton areas to include the whole of South Yorkshire and the entireWest Midlands region.
DOI: 10.3310/hsdr08150 Health Services and Delivery Research 2020 Vol. 8 No. 15
© Queen’s Printer and Controller of HMSO 2020. This work was produced by O’Cathain et al. under the terms of a commissioning contract issued by the Secretary of Statefor Health and Social Care. This issue may be freely reproduced for the purposes of private research and study and extracts (or indeed, the full report) may be included inprofessional journals provided that suitable acknowledgement is made and the reproduction is not associated with any form of advertising. Applications for commercialreproduction should be addressed to: NIHR Journals Library, National Institute for Health Research, Evaluation, Trials and Studies Coordinating Centre, Alpha House,University of Southampton Science Park, Southampton SO16 7NS, UK.
23

Emergency departmentsRecruitment strategies varied between the hospitals involved in the study depending on the way inwhich staff identified relevant patients. A researcher (JL or LBE) was based at each ED for a number ofsessions and liaised with relevant staff to identify potential recruits. Recruitment was generally undertakenduring the ‘in hours’ period, but some attempts were made to recruit over the weekend or during theearly evening.
The definition of ‘clinically unnecessary’ was more complex than that used in the ambulance service,as staff with a triage role were asked to identify patients whom they considered could have used analternative service or self-care to manage their presenting problem, or, if they had used an emergencyambulance to access the ED, could have arrived by another means.
Sheffield emergency departmentDuring each recruitment session, the researcher (JL) was introduced to the nurse in charge andrelevant triage and reception staff by a research nurse, who had briefed the staff about the study.The researcher explained the study and discussed how to establish systems for identifying ‘clinicallyunnecessary’ users of the department. All patients referred to the GP collaborative were considered‘clinically unnecessary’ users of an ED, as were other patients whom triage nurses considered couldhave used a different service or a different mode of transport (i.e. not an emergency ambulance).During the recruitment period, procedures within the department changed to enable reception staffto refer patients with minor injuries directly to a nurse practitioner, and we also approached thesepatients about the study. When a relevant patient was identified, the researcher met them briefly toexplain the study and, if the patient was interested, provide them with written information. If thepatient was eligible, the researcher contacted them a few days later to find out if they were stillinterested and, if so, to arrange a convenient time for an interview.
As with the ambulance service, recruitment took considerably longer than had been anticipated.Although staff were confident that many ‘clinically unnecessary’ patients were visiting the ED, it wasdifficult for them to keep the study in mind and recruitment tended to be through the GP collaborativereferral only, which did not require them to change their existing procedures or to make a difficultdecision about whether or not a patient’s use of the department was appropriate. Some staff wereinitially concerned about including patients who were referred directly to the nurse practitioner, but,as this treatment could also be obtained by going to a WIC or minor injuries unit (MIU), it was agreedthat attendance at a type 1 ED could be considered clinically unnecessary. Including this group ofpatients significantly improved the rate of recruitment, in particular enabling us to recruit the remainingyoung adults.
Sheffield children’s emergency departmentThe researcher (LBE) worked closely with the research nurses in the hospital during the recruitmentperiod. During each recruitment session in which the researcher was present, the research nursesscreened the details of patients who were being triaged and identified parents whom they consideredhad made a ‘clinically unnecessary’ decision to attend the ED with their child. Parents were thenapproached by the researcher and followed up, as described in the previous section.
Wolverhampton emergency departmentFor each recruitment session, the researcher (JL) was introduced to relevant triage and reception staffby a consultant in the ED. Research nurses at the hospital had no involvement in recruitment at thissite. The researcher explained the study and asked staff to give laminated cards to potentially eligiblepatients and direct them to the reception desk, where the researcher was based. When a patient wasidentified, the researcher approached them and followed them up, as described above.
As in the Sheffield ED, although the study was positively received by staff, recruitment was slowerthan expected, with similar problems of triage staff forgetting to mention the study or finding it more
QUALITATIVE INTERVIEW STUDY OF DECISION-MAKING WITH THREE SUBGROUPS OF THE POPULATION
NIHR Journals Library www.journalslibrary.nihr.ac.uk
24

difficult than expected to categorise patients as ‘clinically unnecessary’. Variable shift patterns alsomeant that new staff had to be identified and briefed regularly. Eligibility was frequently confined topatients who were redirected to the independently managed urgent care centre (which treated only alimited range of conditions) and did not include those who were treated in the department. Parents ofyoung children were also initially difficult to identify, as the children’s section of the ED operated veryseparately from the rest of the department. This was addressed by the researcher working directlywith paediatric staff for one recruitment session.
General practitionersThe researchers established links with a particular general practice in each area (LBE in Sheffield andJL in Wolverhampton) that agreed to be recruited to the study. Both general practices were in areas ofsocial deprivation to increase the likelihood of finding participants from this group. We asked GPs andpractice nurses to identify patients whom they considered had made ‘clinically unnecessary’ use ofsame-day/urgent contact, either in a face-to-face consultation or by a telephone call, and whom theybelieved could have managed their problem through either self-care or a routine appointment. Toreduce the impact on GPs’ time, they were not asked to speak to patients about the study but wereasked to pass the patient’s details to a research nurse or the practice manager at the end of theirsession. The research nurse or practice manager then telephoned the patient to ask if they wereinterested in the study and willing to have their contact details passed to the research team. Detailsof potentially eligible patients were then telephoned through to the team, who screened the patientfor eligibility and made contact, as described previously. Different general practices employed slightlydifferent approaches to identifying ‘clinically unnecessary’ users, so the inclusion criteria varied tosome extent between practices as well as between GPs.
As with the other services, recruitment was much slower than anticipated, with a number of difficultiesencountered, especially in Wolverhampton. GPs, particularly those with less experience, found it challengingto categorise patients as ‘clinically unnecessary’, and engagement with the recruitment process variedamong GPs in each practice. Practices also struggled to find time to make the follow-up calls to patientsat certain points. The recruitment of young adults proved particularly challenging, which led to it beingextended to a second practice in Sheffield that had a younger and more affluent demographic.
Topic guideThe qualitative researchers developed a draft of the topic guide. The topic guide was not based onthe programme theories from the WP1 review; it asked about the events leading up to the patient’scontact with the health service from which they were recruited (e.g. advice sought, steps taken). Wealso explored patients’ experiences and perceptions of other services in the emergency and urgent caresystem more generally. Interviewees were also asked if any changes could be made to the currenthealth system that would improve their access to health care. To ensure that the interview questionsdid not convey any sense of judgement about participants’ decisions, we piloted the topic guide withtwo PPI co-authors (LA and SB), who were asked to respond based on either a real or an imaginedexperience of using an emergency or urgent service. Feedback from this process led to some revisionsto the sequence and structure of the questions. The resulting topic guide was in a semistructuredformat, based around nine main questions, each with a number of prompts to minimise the risk ofmissing key information. A brief introduction explained that the purpose of the interview was tounderstand the participants’ process of deciding how and where to seek help for a health problem. Thetopic guide was used flexibly during the interview to enable particular areas of interest to be exploredin more depth (for a copy of the topic guide see the project web page: www.journalslibrary.nihr.ac.uk/programmes/hsdr/1513612/#/; accessed 5 February 2020). At the end of the interview, we askedparticipants to complete demographic information, as well as questions from two domains of theHealth Literacy Questionnaire (HLQ) in preparation for its intended use in the survey aspect of ourwork (see Chapter 6).
DOI: 10.3310/hsdr08150 Health Services and Delivery Research 2020 Vol. 8 No. 15
© Queen’s Printer and Controller of HMSO 2020. This work was produced by O’Cathain et al. under the terms of a commissioning contract issued by the Secretary of Statefor Health and Social Care. This issue may be freely reproduced for the purposes of private research and study and extracts (or indeed, the full report) may be included inprofessional journals provided that suitable acknowledgement is made and the reproduction is not associated with any form of advertising. Applications for commercialreproduction should be addressed to: NIHR Journals Library, National Institute for Health Research, Evaluation, Trials and Studies Coordinating Centre, Alpha House,University of Southampton Science Park, Southampton SO16 7NS, UK.
25
Data collectionThe researchers who had been involved in recruitment (JL and LBE) conducted the interviews; wherepossible, they interviewed the people who they had recruited. Both were experienced female qualitativeresearchers. We tried to conduct interviews within 2 weeks of the health episode to facilitate greaterrecall, but on some occasions difficulties in making contact or arranging a convenient date meant that thiswas not possible. All but one interview took place face to face, usually in the patient’s home. Interviewslasted between 21 and 72 minutes (mean 40.5 minutes). We gave Sheffield-based participants the optionto be interviewed in a meeting room at the University of Sheffield, and offered to pay return taxi faresto avoid any attendance barriers for those on low incomes. For logistical reasons, all Wolverhamptoninterviews took place in the patient’s home. Details of interview locations are available on the projectweb page (www.journalslibrary.nihr.ac.uk/programmes/hsdr/1513612/#/; accessed 5 February 2020).
Data analysisWe audio-recorded each interview and transcribed it verbatim. Transcripts were checked for accuracy.Interviewers added a short summary to each transcript, providing any background information thatwould not be apparent in the transcript and any comments or conversations before or after recording.We uploaded finalised transcripts and summaries into NVivo 12 (QSR International, Warrington, UK),which was used throughout to facilitate data management and retrieval.
Data collection and analysis was an iterative process, with review of early transcripts informing laterinterviews. Members of the research team (EK, JL, LBE and AOC) met regularly to discuss the processand the findings of the analysis. We applied the key principles of interpretative phenomenologicalanalysis (IPA)109,110 to our analysis.
Interpretive phenomenological analysis aims to explore individuals’ lived experience in a particular context,focusing on their perceptions of events and how they make sense of their experience.110 Each individual’scase is analysed as a whole using a predominantly inductive approach, which allows the essence of theirexperience to be identified without imposing a pre-existing framework of understanding.109,110 Theseprinciples clearly reflected the approach that we wanted to take to understanding how interviewees hadcome to a decision regarding help-seeking for their health problem. Although IPA is generally used withsmall sample sizes, it is recognised to offer ‘a set of flexible guidelines’111 and can be adapted for use withlarger samples.109,110 There are a number of instances of the method being used to inform the analysis ofpatients’, carers’ and health-care professionals’ experiences in a range of health-care contexts withsamples of between 17 and 55 people.112–115
In our analysis, we drew on the key principles of IPA while adapting the method to our sample size of48. For each interviewee, we created a memo and a diagram to identify and represent the drivers oftheir decision-making in relation to the incident discussed in the interview. To establish some commonunderstanding and terminology within this process, all members of the team independently read thefirst few transcripts and then met to discuss and reflect on the themes that they had identified. Fourmembers of the research team (EK, JL, LBE and AOC) were involved in this process. Two researcherscreated each memo, acting as either primary or secondary coder. One of the coders was the researcherwho interviewed the participant, which ensured that any contextual factors not in the transcript couldbe taken into account. Primary coders read the transcript, identifying the drivers of (1) seeking healthcare (i.e. why the person made contact with a health service), (2) seeking health care at the servicewhere the person presented (i.e. why they had made contact with a specific health service) and(3) seeking care urgently. In many cases, the same driver influenced more than one aspect of the decision(e.g. reason for seeking health care and reason for seeking care urgently).
We also sought to establish the strength of influence of each driver on the decision-making process bydifferentiating between what we termed ‘primary’ and ‘secondary’ drivers. We defined primary drivers asthose factors that appeared to be key to the interviewee’s decision, that is the things that tipped theminto taking a particular course of action, either whether or not to seek help or to seek help from a
QUALITATIVE INTERVIEW STUDY OF DECISION-MAKING WITH THREE SUBGROUPS OF THE POPULATION
NIHR Journals Library www.journalslibrary.nihr.ac.uk
26
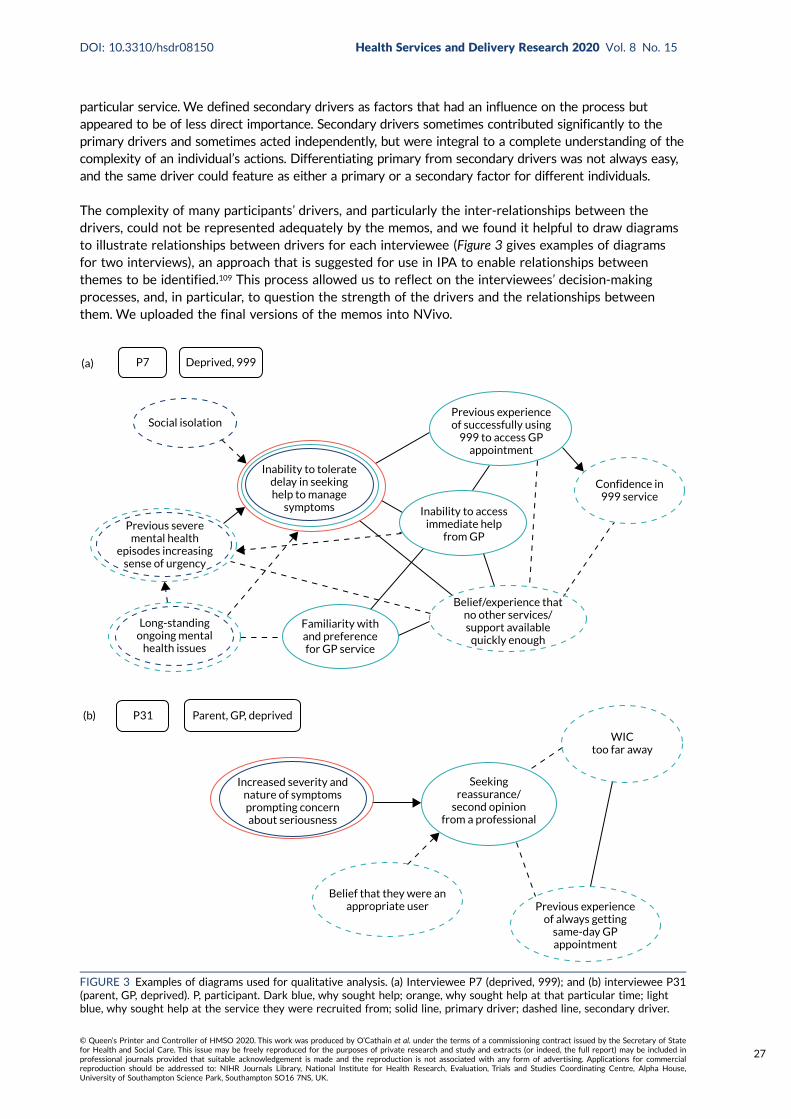
particular service. We defined secondary drivers as factors that had an influence on the process butappeared to be of less direct importance. Secondary drivers sometimes contributed significantly to theprimary drivers and sometimes acted independently, but were integral to a complete understanding of thecomplexity of an individual’s actions. Differentiating primary from secondary drivers was not always easy,and the same driver could feature as either a primary or a secondary factor for different individuals.
The complexity of many participants’ drivers, and particularly the inter-relationships between thedrivers, could not be represented adequately by the memos, and we found it helpful to draw diagramsto illustrate relationships between drivers for each interviewee (Figure 3 gives examples of diagramsfor two interviews), an approach that is suggested for use in IPA to enable relationships betweenthemes to be identified.109 This process allowed us to reflect on the interviewees’ decision-makingprocesses, and, in particular, to question the strength of the drivers and the relationships betweenthem. We uploaded the final versions of the memos into NVivo.
Social isolation
(a)
Long-standingongoing mental
health issues
Previous severemental health
episodes increasingsense of urgency
Familiarity withand preferencefor GP service
Inability to toleratedelay in seekinghelp to manage
symptoms Inability to accessimmediate help
from GP
Confidence in999 service
Previous experienceof successfully using
999 to access GPappointment
Belief/experience thatno other services/support available
quickly enough
P7 Deprived, 999
(b) P31 Parent, GP, deprived
Increased severity andnature of symptomsprompting concernabout seriousness
WICtoo far away
Belief that they were anappropriate user
Seekingreassurance/
second opinionfrom a professional
Previous experienceof always getting
same-day GPappointment
FIGURE 3 Examples of diagrams used for qualitative analysis. (a) Interviewee P7 (deprived, 999); and (b) interviewee P31(parent, GP, deprived). P, participant. Dark blue, why sought help; orange, why sought help at that particular time; lightblue, why sought help at the service they were recruited from; solid line, primary driver; dashed line, secondary driver.
DOI: 10.3310/hsdr08150 Health Services and Delivery Research 2020 Vol. 8 No. 15
© Queen’s Printer and Controller of HMSO 2020. This work was produced by O’Cathain et al. under the terms of a commissioning contract issued by the Secretary of Statefor Health and Social Care. This issue may be freely reproduced for the purposes of private research and study and extracts (or indeed, the full report) may be included inprofessional journals provided that suitable acknowledgement is made and the reproduction is not associated with any form of advertising. Applications for commercialreproduction should be addressed to: NIHR Journals Library, National Institute for Health Research, Evaluation, Trials and Studies Coordinating Centre, Alpha House,University of Southampton Science Park, Southampton SO16 7NS, UK.
27

As WP1 had been partially completed by the time WP2 data collection and analysis began, we hadto consider the most appropriate approach to using the emerging programme theories in the IPA.We considered two alternatives:
1. to use the programme theories to guide the IPA (i.e. read them and use them to inform andstructure the IPA coding)
2. to take an inductive approach to the coding, without reference to the programme theories, andreflect on the programme theories following completion of the definitive memo.
To be consistent with the principles of IPA, it was important to ensure that we focused on theinterviewees’ experiences; therefore, given that we considered it would not be appropriate to approachthe analysis with a predefined structure, we chose the second approach. One of the researchers (JL)was involved in both developing the programme theories and undertaking interviews and analysis, anda second researcher (AOC) was involved in all aspects of the research, so it is likely that knowledge ofthe programme theories influenced the analysis. However, Emma Knowles and Lindsey Bishop-Edwardswere not involved in WP1 and could base their analysis on the interview data only. Towards the end ofthe analysis, we considered the findings in relation to the WP1 programme theories and consideredhow the interviews could be used to refine the programme theories (see Chapter 7).
Reporting guidelinesWe completed the COREQ (Consolidated criteria for reporting qualitative research) reportingguidelines.116
Findings
Sample sizeWe planned to undertake 48 interviews. We identified 130 individuals to take part in the study.Twenty-nine individuals declined to participate and another 53 did not respond to follow-up messagesor were not contactable. We conducted 48 interviews: 37 in Sheffield and 11 in Wolverhampton.
The relatively small number of participants recruited in Wolverhampton did not enable us to carry out theplanned comparison of interviewees’ decision-making between the two emergency and urgent care systems.Interviewees were mainly from EDs and GPs, with few recruited from ambulance services (Table 4).
TABLE 4 Source of interviewees
Service Setting
Subgroup (n)
Total (n)Parents Young adults Social deprivation
Ambulance service(n= 6)
Sheffield 0 0 1 1
West Midlands 1 1 3 5
ED (n= 23) Sheffield (adults only) – 9a 4a 13
Sheffield (children only) 6 – – 6
Wolverhampton 3 0 1 4
General practice(n= 19)
Sheffield (area of deprivation) 4 1 5 10
Sheffield (affluent area) 2 5 – 7
Wolverhampton 0 0 2 2
Total 16 16 16 48
a One patient in this group was recruited from the ED but had arrived by emergency ambulance; therefore, in theanalysis they were considered an unnecessary user of the ambulance service rather than of the ED.
QUALITATIVE INTERVIEW STUDY OF DECISION-MAKING WITH THREE SUBGROUPS OF THE POPULATION
NIHR Journals Library www.journalslibrary.nihr.ac.uk
28
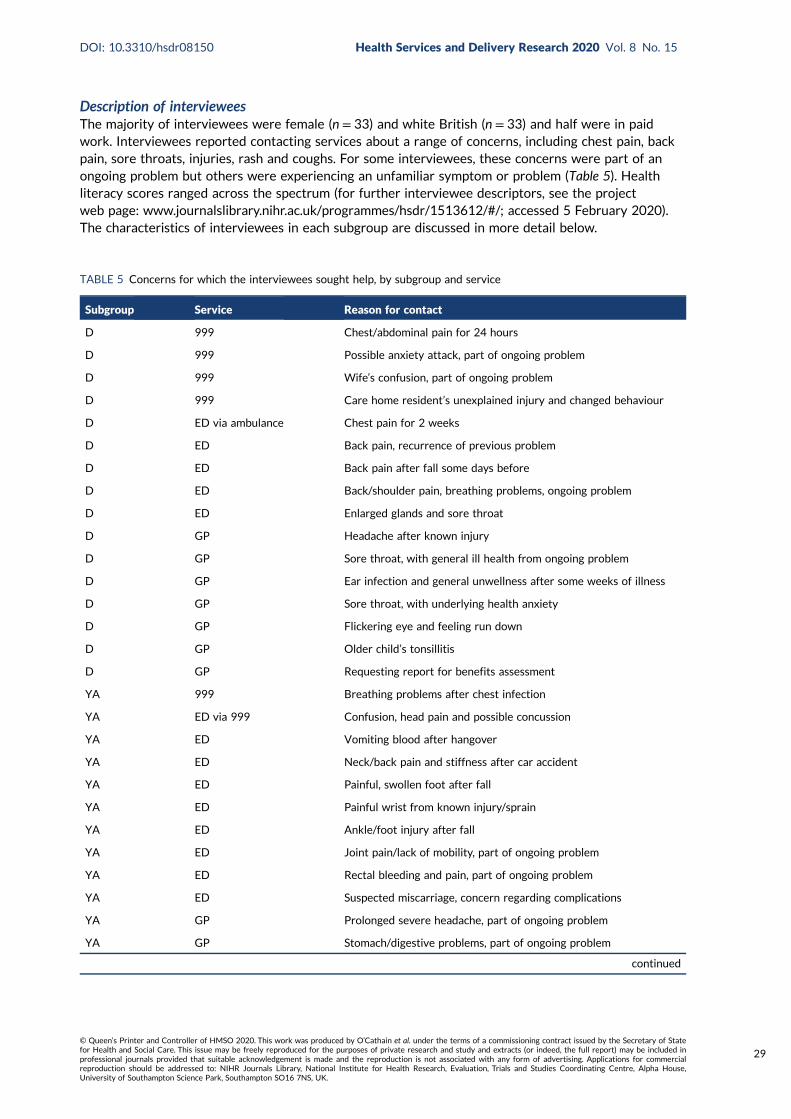
Description of intervieweesThe majority of interviewees were female (n = 33) and white British (n = 33) and half were in paidwork. Interviewees reported contacting services about a range of concerns, including chest pain, backpain, sore throats, injuries, rash and coughs. For some interviewees, these concerns were part of anongoing problem but others were experiencing an unfamiliar symptom or problem (Table 5). Healthliteracy scores ranged across the spectrum (for further interviewee descriptors, see the projectweb page: www.journalslibrary.nihr.ac.uk/programmes/hsdr/1513612/#/; accessed 5 February 2020).The characteristics of interviewees in each subgroup are discussed in more detail below.
TABLE 5 Concerns for which the interviewees sought help, by subgroup and service
Subgroup Service Reason for contact
D 999 Chest/abdominal pain for 24 hours
D 999 Possible anxiety attack, part of ongoing problem
D 999 Wife’s confusion, part of ongoing problem
D 999 Care home resident’s unexplained injury and changed behaviour
D ED via ambulance Chest pain for 2 weeks
D ED Back pain, recurrence of previous problem
D ED Back pain after fall some days before
D ED Back/shoulder pain, breathing problems, ongoing problem
D ED Enlarged glands and sore throat
D GP Headache after known injury
D GP Sore throat, with general ill health from ongoing problem
D GP Ear infection and general unwellness after some weeks of illness
D GP Sore throat, with underlying health anxiety
D GP Flickering eye and feeling run down
D GP Older child’s tonsillitis
D GP Requesting report for benefits assessment
YA 999 Breathing problems after chest infection
YA ED via 999 Confusion, head pain and possible concussion
YA ED Vomiting blood after hangover
YA ED Neck/back pain and stiffness after car accident
YA ED Painful, swollen foot after fall
YA ED Painful wrist from known injury/sprain
YA ED Ankle/foot injury after fall
YA ED Joint pain/lack of mobility, part of ongoing problem
YA ED Rectal bleeding and pain, part of ongoing problem
YA ED Suspected miscarriage, concern regarding complications
YA GP Prolonged severe headache, part of ongoing problem
YA GP Stomach/digestive problems, part of ongoing problem
continued
DOI: 10.3310/hsdr08150 Health Services and Delivery Research 2020 Vol. 8 No. 15
© Queen’s Printer and Controller of HMSO 2020. This work was produced by O’Cathain et al. under the terms of a commissioning contract issued by the Secretary of Statefor Health and Social Care. This issue may be freely reproduced for the purposes of private research and study and extracts (or indeed, the full report) may be included inprofessional journals provided that suitable acknowledgement is made and the reproduction is not associated with any form of advertising. Applications for commercialreproduction should be addressed to: NIHR Journals Library, National Institute for Health Research, Evaluation, Trials and Studies Coordinating Centre, Alpha House,University of Southampton Science Park, Southampton SO16 7NS, UK.
29

Order of presentation of themesWhere possible, for clarity, the drivers of help-seeking are listed in the same order for each subgroup.Some drivers were more important in certain subgroups, in which case these are presented first.
Parents of young children subgroup
Sample characteristicsSixteen parents were recruited, ranging in age from 22 to 42 years (mean 33 years). The samplepredominantly consisted of interviewees with either high or low deprivation IMD scores, rather thanmedium scores. Seven had a score of between 1 and 3 (i.e. indicating that they lived in an area of socialdeprivation, according to our study criteria), whereas another seven had a score of 8–10 (indicatingaffluence). All but two of the interviewees were female and were accessing care for the child in theirrole as the child’s mother. Just over half of the interviewees described themselves as white British,with four identifying as black African or Caribbean, two as other white and one as Asian. Twelveinterviewees indicated that they were married or living as married, and the other four indicated thatthey were single or not married. Parents in the sample had between one and five children, with sixhaving one child. The children in the sample were predominantly at the young end of our age range,with nine aged ≤ 2 years and another four aged 3–5 years, and only two aged > 5 years. Of the16 parents interviewed, one had been recruited following contact with the emergency ambulanceservice, nine had been recruited following contact with an ED and six had been recruited following
TABLE 5 Concerns for which the interviewees sought help, by subgroup and service (continued )
Subgroup Service Reason for contact
YA GP Fatigue and other symptoms for some weeks
YA GP Exacerbation of anxiety, impacting on function
YA GP Needing repeat asthma medication
YA GP Needing contraceptive pill to manage symptoms
P 999 Child’s head injury, not witnessed
P ED Child’s unexplained rash
P ED Child’s raised temperature after previous episode of convulsions
P ED Child’s cough, vomiting mucus and struggling for breath
P ED Child’s cough and vomiting mucus
P ED Child’s vomiting and inflamed tonsils, part of ongoing problem
P ED Child’s prolonged nosebleed, behaviour change
P ED Child’s ear infection
P ED Child’s sore eye, after being generally unwell
P ED Child’s constipation, part of ongoing problem
P GP Child’s rash
P GP Child’s raised temperature, rash and changed behaviour
P GP Child’s cough after being generally unwell including rash
P GP Child’s raised temperature and distress after generally being unwell
P GP Child’s cold, temperature and green phlegm
P GP Child’s prolonged diarrhoea and behaviour change
D, deprived; P, parent; YA, young adult.
QUALITATIVE INTERVIEW STUDY OF DECISION-MAKING WITH THREE SUBGROUPS OF THE POPULATION
NIHR Journals Library www.journalslibrary.nihr.ac.uk
30

contact with a general practice. All but one of the interviewees who were living in areas of deprivationhad used emergency ambulance or EDs, whereas those with higher IMD scores had been recruited fromtheir GP.
Overview of findings for parents of young childrenTwo key drivers were most evident in parents’ decision-making regarding seeking health care: (1) concernsabout the seriousness of symptoms that the child was experiencing and (2) a complex interlinking of asense of responsibility as a parent of a young child and a lower threshold of concern regarding children’shealth. In many cases, these concerns prompted a need for some form of reassurance from a health-careprovider. There was a strong sense of interaction between these drivers, with each potentially triggeringthe other. Although these drivers were most prevalent, a number of other factors were also present andcontributed to the decision to seek care: in particular, the perceptions or experiences of services, theinfluence of others and the timing of the incident.
Concern regarding seriousness of symptomsFor all parents in the sample, concern about their child’s symptoms was a key driver of their decision toseek care. A variety of symptoms were reported, including raised temperature, diarrhoea or constipation,head injury, cough, cold, ear infection, rashes, vomiting, sore eye and prolonged nosebleed. Reflectingprogramme theory 1, uncertainty about symptoms causing anxiety, parents described their concerns interms of unfamiliar symptoms, prolonged or worsening symptoms, or a change in their child’s behaviourthat triggered a belief that the problem might be serious:
I don’t know whether it was affecting his breathing or not but sometimes I felt like he was struggling,while he was coughing, in the breathing. With the cold and a virus, I’m quite confident to say that’s whatit is. So if he is ill with a cold then I wouldn’t ring the GP, to say ‘oh he’s got a cold’. It was the cough thatworried me most with it being either whooping cough, or croup or anything like that. With him being soyoung, it was the cough that worried me, more than anything really.
Participant (P) 25, parent, GP
The type of illness or injury could also exacerbate concerns, with head injury or rashes described asparticularly worrying. Aligned with programme theory 2, heightened awareness of risk as a result ofexperience or knowledge of traumatic health events leading to anxiety, this concern was linked to abelief that these symptoms could escalate quickly and have serious consequences for the child’s health:
[Child] came out in a rash on his thigh and his back and, just under his arm, and because we had been to[place] I thought that it might have been meningitis or something although he has had his jabs, before wewent. It looked sort of like meningitis, same sort of symptoms, bruising, purple and red that’s why wewere really concerned about him.
P20, parent, ED
All three services in the study were used by parents who were concerned about symptoms. The needfor reassurance was a key driver and different services appeared to offer this in different ways. Linkedwith both programme theory 1, uncertainty about symptoms causing anxiety, and, to a lesser degree,programme theory 6, waited long enough for things to improve, some parents’ concerns led them tofeel that they could not delay seeking care any longer and needed some form of reassurance from ahealth-care provider. In a few instances, the inability to delay could be driven by a sense of panic andneed for immediate reassurance, which was evident in the account of the one interviewee who madecontact with the emergency ambulance service. Highlighting the influence of programme theory 7,stressful lives and difficulty coping, the interviewee described how she had discovered her child’searlier injury late in the evening; the fact that she was a single parent of a number of young children
DOI: 10.3310/hsdr08150 Health Services and Delivery Research 2020 Vol. 8 No. 15
© Queen’s Printer and Controller of HMSO 2020. This work was produced by O’Cathain et al. under the terms of a commissioning contract issued by the Secretary of Statefor Health and Social Care. This issue may be freely reproduced for the purposes of private research and study and extracts (or indeed, the full report) may be included inprofessional journals provided that suitable acknowledgement is made and the reproduction is not associated with any form of advertising. Applications for commercialreproduction should be addressed to: NIHR Journals Library, National Institute for Health Research, Evaluation, Trials and Studies Coordinating Centre, Alpha House,University of Southampton Science Park, Southampton SO16 7NS, UK.
31

with no access to a car exacerbated her existing anxiety about her children and prompted her to seekhelp from the only service she perceived that she could access at that particular time of day:
I was thinking ‘oh god, what am I going to do’, so I was thinking the only people that I could think of wasthe ambulance people and thinking I need to tell them, because I can’t go to sleep, and sort it out thenext day, it needs to be sorted today. I need to speak to them just in case with a head injury . . . ‘cause wedon’t know how sharp the thing was [that caused the injury], if it went in, if it was a pin, we don’t know.So, and it could have been something that is dirty you know, loads of things were going through my head.
P11, parent, emergency ambulance
However, the majority of parents experienced a situation less intense than this one, and they expressedtheir need for reassurance in terms of wanting a health-care professional to confirm their feeling thattheir symptoms did not indicate a serious problem rather than because they were concerned that theproblem was serious. In these instances, the GP was frequently interviewees’ preferred service choice.Additionally, some wanted their child to be physically examined, meaning that a telephone-based service(such as NHS 111) would not meet their needs:
[Going to the GP] was going to rule out anything serious, and it was going to give me peace of mind, sothat I didn’t have to worry about it ‘cause as soon as I left that surgery, she’s been checked so it’s like,she’s fine . . . it felt like a big weight had been lifted, almost, which is stupid really isn’t it but yes . . . youjust know somebody who’s qualified has looked at her and has ruled out anything serious.
P32, parent, GP
Many parents in the sample described themselves as well informed about health care or appeared tothe interviewer to be well informed. This was reflected in the higher HLQ scores in this subgroup thanin the other two subgroups. Parents often described administering oral medications, including for pain,in the lead-up to help-seeking, and they generally seemed confident in doing so. They often describeda period of monitoring and self-care prior to seeking help, rather than seeking care on the day thatthe symptoms were first noticed. Aligned with programme theory 6, waited long enough for things toimprove, they became concerned when these strategies did not appear to alleviate the symptoms. Bycontrast, one parent appeared reluctant to medicate her child during the incident, despite using thatmedication previously, and this was consistent with an overall sense during the interview that she haddifficulty absorbing medical information, which may have increased her uncertainty about managingthe situation.
Sense of responsibility as a parent of a young childIn many instances, concern about symptoms and a decision to seek help were affected significantlyby the parent–child relationship in a number of ways. Corresponding to programme theory 3, fearof consequences when responsible for others, some interviewees explicitly identified their specificsense of responsibility as being a parent; this was expressed particularly strongly by one single parentin the sample:
I’m her mother and I’m the only person who can help her so, going back to that panic you know what’sright, but she’s my daughter, so I need to make the right decision.
P29, parent, ED
Parents often described seeking care quickly because they did not want to take risks with their children’shealth. This was often at odds with how they approached decision-making about their own health, forwhich they described ‘putting up with things’ for longer. In addition to the sense of responsibility, therewas an underlying perception that less risk was involved in delaying care for adults than in doing sofor children. Aligned with programme theory 3, fear of consequences when responsible for others,
QUALITATIVE INTERVIEW STUDY OF DECISION-MAKING WITH THREE SUBGROUPS OF THE POPULATION
NIHR Journals Library www.journalslibrary.nihr.ac.uk
32
parents also described how their distress at seeing their child suffering exacerbated their concernsabout symptoms:
I just don’t worry that much about myself when I get ill, like I mean I got a bit ill OK, just take someparacetamols, you know. But when it is [name of child #1] I’m like thinking how she feels or she probablyfeels pain or is she struggling, oh poor girl you know, you want to comfort her, and kiss her andeverything, and you just worry, you want her to get better quickly.
P30, parent, ED
Lower threshold of concern regarding children’s healthClosely connected to the sense of parental responsibility, many participants also described a moregeneral concern about managing their children’s health. In general, parents in the sample did notappear to be excessively anxious to the researchers, but expressed concern or anxiety driven by abelief that there was a need for a lower threshold for seeking help for a child. There was a perceptionthat children’s health could be unpredictable and deteriorate quickly, which could be seen as an aspectof programme theory 2, heightened awareness of risk as a result of experience or knowledge oftraumatic health events leading to anxiety. In one specific instance of this programme theory, a parentwho identified herself as a ‘worrier’ felt that her anxiety had been exacerbated because she knewabout a situation in which a delay in seeking care had resulted in a long-term health problem. Moregenerally, a number of parents described a particular anxiety in relation to babies and young children,as a child’s inability to explain what or how they were feeling increased the sense of uncertaintydescribed above and reflects programme theory 1, uncertainty about symptoms causing anxiety. In thiscontext, some parents noted that they would have taken a different course of action had the problemrelated to an older child. Although the age of the child was a significant factor in increasing the senseof urgency to take action, there was no apparent relationship in our sample between the child’s ageand the parents’ choice of service, with children aged ≤ 2 years going to both the GP and the ED.Being a first-time parent was also not identified as having a significant impact on help-seeking in mostcases. Although six of the parents in the sample had only one child, this was described as significantby only one parent in terms of increasing her concern because of her lack of experience. However, mostof the parents in this group had children aged 3 or 4 years, and so they were not new to the experienceof being a parent. By contrast, one parent whose two children had a wide age gap described feeling theanxiety of being a new parent again and taking her 2-year-old to the ED:
They have 9 years’ difference so [name of child] when she was born was like first, ‘cause I reallyforgot everything.
P30, parent, ED
Aligned with programme theory 7, stressful lives and difficulty coping, a few parents described howongoing health worries about their child had increased their concern and led to their decision to takeaction in relation to this particular incident. These parents described their children being frequently illwith minor problems, or experiencing longer-term health problems; in both circumstances, there wasa sense that this affected the parents’ willingness to wait for the situation to resolve. Highlightinganother aspect of programme theory 7, stressful lives and difficulty coping, one parent described beingill at the same time as her child and how this had affected her sleep. She recognised how this, in turn,had reduced her coping capacity, making the situation feel more urgent.
Perceptions and experiences of health servicesAligned with programme theory 9, perceptions or experiences of services, interviewees’ opinions ofdifferent health services had a significant impact on where they decided to seek help, with positive andnegative views of their general practice being particularly influential. Most parents in the sample whosought care from the GP described their confidence in being able to access a same-day appointment or
DOI: 10.3310/hsdr08150 Health Services and Delivery Research 2020 Vol. 8 No. 15
© Queen’s Printer and Controller of HMSO 2020. This work was produced by O’Cathain et al. under the terms of a commissioning contract issued by the Secretary of Statefor Health and Social Care. This issue may be freely reproduced for the purposes of private research and study and extracts (or indeed, the full report) may be included inprofessional journals provided that suitable acknowledgement is made and the reproduction is not associated with any form of advertising. Applications for commercialreproduction should be addressed to: NIHR Journals Library, National Institute for Health Research, Evaluation, Trials and Studies Coordinating Centre, Alpha House,University of Southampton Science Park, Southampton SO16 7NS, UK.
33

telephone advice for their child as a key factor in their decision-making. This was often based onprevious positive experiences of such access:
In the past if I’ve rung up [the GP] for [name of child], I could ring at 2 o’clock say it’s for my son who’sa toddler and they will ring back within probably 15–20 minutes to get us an appointment, so they’rereally, I’ve never had to do it for myself but with kids especially they’re really good, they will get you inthat day.
P23, parent, GP
Notably, a number of these parents did not believe that they could access an appointment forthemselves in this way, and felt that GPs tended to provide appointments for children because therisks to children’s health were perceived to be greater, suggesting the possible influence of programmetheory 3, fear of consequences when responsible for others, and programme theory 2, heightenedawareness of risk as a result of experience or knowledge of traumatic health events leading to anxiety.Even when appointment access was enhanced for children, these parents highlighted the challengesof booking a GP appointment, particularly because the timing of doing this often coincided with takingchildren to school. However, for other parents, their negative experiences or views about access togeneral practice were significant drivers in their decision to go to an ED. Corresponding with programmetheory 10, frustration with access to a GP, parents described unsuccessfully trying to get a GP appointmenton the occasion in question, as well as previous failed attempts that had created their perception thatno appointments would be available within the time frame required:
They [GP] didn’t have any appointments. Usually if I ring from 8.30 they give me appointment, probablybecause it is a child they give me the same day but it was a bit too late, I called at 10 o’clock as I saidshe felt a little bit better and I thought OK let’s leave it, then I called like at 10 o’clock and they didn’thave any appointments.
P30, parent, ED
In addition to access problems, one interviewee described how a poor relationship with her GP influencedher decision to seek care at an ED. She reported not being satisfied with the care, examinations andtreatment that her daughter had received from the GP on previous occasions, offering no resolution toher ongoing health problems. In another instance, two previous poor experiences of GP out-of-hourscare left an interviewee unwilling to consider using this service again:
. . . if you even go to the GP, they just spend 5 minutes with you, it’s like you don’t feel like you’ve beenheard properly. So I thought if I go to A&E [accident and emergency] they might take it further, andhelp her.
P21, parent, ED
Programme theory 9, perceptions or prior experiences of services, also operated in terms of positiveviews of the ED, whereby parents believed that only a particular service could provide the skills,resources and speed to offer reassurance or resolve their child’s health problem. Parents describedthe ED as having more doctors with greater levels of expertise and specialism, who had access toequipment and were able to carry out investigations:
Interviewer: . . . what was the thing [the ED] could offer over everything else?
P29, parent, ED: To keep [name of child] safe, and offer equipment and medical things, and decisionsthat I couldn’t make for her.
Most of the parents in the sample who had accessed an ED said that they had used it on at least oneprevious occasion, and this positive experience of and familiarity with the ED may have influenced theirdecision to access the ED on the day in question; that is, there was some evidence of recursivity at play.
QUALITATIVE INTERVIEW STUDY OF DECISION-MAKING WITH THREE SUBGROUPS OF THE POPULATION
NIHR Journals Library www.journalslibrary.nihr.ac.uk
34
Influence of othersAlthough family, social networks and health-care professionals did not appear to significantly affectthe decision to seek care among this sample, they did have some influence on where care was sought.Aligned with programme theory 8, following the advice of trusted others, around one-third of thesample appeared to have been directly influenced by someone else when deciding to seek care froma particular service. Most often this was advice to attend an ED, but in one instance an intervieweedescribed following her mother’s advice to seek care at the GP, noting that she trusted her mother’sjudgement because of her mother’s experience of bringing up her and her siblings. Parents in the sampleidentified a range of people who had advised them to attend an ED, including GPs, nursery staff and, inthe case of one man, his wife, who was also a health professional; in some instances more than one sourceof advice was present. The two interviewees who had been advised by a GP to attend an ED had differentexperiences. In one instance, the GP had physically assessed the child and, in advising the intervieweeto attend an ED, had been following advice that they had received from a specialist department at thehospital. That is, the GP was indirectly following advice of a trusted other. The other interviewee, whosechild had an unexplained rash, received advice from a GP over the telephone; highlighting the influenceof programme theory 3, fear of consequences when responsible for others on health-care professionals,the GP advised attendance at an ED because they were unable to confidently rule out the risk ofsomething serious without undertaking a physical examination.
The indirect influence of others was also apparent in nearly half of the sample, highlighting a refinementof programme theory 8, following the advice of trusted others, in terms of the broader influence of socialnetworks. This influence took the form of support or encouragement for interviewees’ decisions, andcame from partners, other family members, a colleague and, in one instance, NHS 111. All intervieweesdescribed or indicated having some form of social support, with most being married or living as married,and others mentioning partners, family members, friends or neighbours in their support network.
In an extension of programme theory 8, following the advice of trusted others, parents discussed howthey generally used the internet to obtain health advice and rule out possible diagnoses. This strategydid not appear to exacerbate their concerns or heighten their anxiety. In relation to the specific incidentbeing discussed during the interview, just one interviewee described that the internet had directlyinfluenced her decision to seek care, having read advice from an NHS online source that recommendedthat a child of her child’s age, with the particular symptoms her child had, should receive medical care.Although this source did not appear to suggest using a particular service, she also considered advicefrom her child’s nursery to attend an ED.
Timing of incidentFor a small number of parents in the sample, the timing of the incident intersected with other concernsto affect their decision about the choice of service. As already noted, the lack of support and resourcesavailable to one parent affected their decision to call an emergency ambulance in the evening. In anotherinstance, a problem late on a Friday afternoon prompted one parent to attend an ED, as they believedthat a GP appointment would be unavailable and were unwilling to use the GP out-of-hours service.In relation to seeking GP care, two parents made contact on a Friday, with both expressing the sensethat this was their last opportunity to contact their own doctor before the weekend. That is, the timingof the episode added to parents’ anxiety levels, leading them to seek care immediately. Neither parentwas averse to contacting other services but felt that seeking care over the weekend could be morecomplicated:
. . . you think if I don’t get in at the doctors before the weekend, we could end up with a pickle over theweekend, so we best get this checked out.
P32, parent, GP
DOI: 10.3310/hsdr08150 Health Services and Delivery Research 2020 Vol. 8 No. 15
© Queen’s Printer and Controller of HMSO 2020. This work was produced by O’Cathain et al. under the terms of a commissioning contract issued by the Secretary of Statefor Health and Social Care. This issue may be freely reproduced for the purposes of private research and study and extracts (or indeed, the full report) may be included inprofessional journals provided that suitable acknowledgement is made and the reproduction is not associated with any form of advertising. Applications for commercialreproduction should be addressed to: NIHR Journals Library, National Institute for Health Research, Evaluation, Trials and Studies Coordinating Centre, Alpha House,University of Southampton Science Park, Southampton SO16 7NS, UK.
35

Young adults subgroup
Sample characteristicsSixteen young adults were recruited, ranging in age from 18 to 30 years (mean 25 years). Mostinterviewees described themselves as white British, with two being Asian (one Chinese and onePakistani). Approximately two-thirds of the young adults were female, and all but one had lived in thecity from which they were recruited for > 1 year, with most living there for > 5 years. The majoritywere occupied full-time as students and/or employed full- or part-time. Three described themselvesas unemployed because of health problems. Five interviewees were recruited from a general practicein an affluent area and were working full- or part-time, whereas the interviewee recruited from anarea of deprivation was unemployed. Half of the sample (n = 8) were living in areas of deprivation(IMD quintile 1 or 2), and, although their child was not the focus of their service contact, four werealso parents. All four parents were from areas of deprivation.
Interviewees sought help for a wide range of reasons, and sometimes included more than one reason.Reasons included pain after injuries (n = 4); exacerbations of chronic or ongoing symptoms, including pain,bleeding, digestive problems, fatigue and anxiety (n = 8); breathing difficulties; suspected concussion;vomiting blood after drinking alcohol; suspected miscarriage; and seeking medication to manageanticipated rather than actual symptoms (n = 2). The interviews focused mostly on contact with an ED(n = 8) or a GP (n = 6), with only two relating to emergency ambulance use. The service contact in thissample seemed to be differentiated by sex and deprivation. All of the men had used the ED or emergencyambulance service, whereas just over half of the women had been recruited after contact with the GP.Almost all of the young adults living in areas of deprivation (7 out of 8) had contacted the ED or emergencyambulance service and only one had contacted the GP; both of the young adults who received carefrom the emergency ambulance service were living in areas of deprivation and were unemployedbecause of long-term health problems, particularly mental health. By contrast, five of the young adultsliving in more affluent areas had used a GP and only three had used the ED.
Overview of findings for young adultsThree drivers were most evident in young adults’ decisions to seek health care: concerns about themeaning/seriousness of the symptoms that they were experiencing; an unwillingness to further delaycare-seeking; and perceptions or experiences of services. Although these drivers were the most significantamong this sample, a number of other factors were also frequently present, notably the influence ofothers, particularly those in their social network, and the impact of poor mental health. Most intervieweesidentified between two and four drivers of their decision to seek care, which were usually interconnected.
Concern about seriousness of symptomsAround half of the sample had sought health care because they had been concerned that theirsymptoms could indicate a serious health problem. This concern aligned clearly with programme theory 1,uncertainty about symptoms causing anxiety, and could be prompted by a number of aspects of theirsituation and experiences. Unfamiliarity with a symptom was a particularly significant trigger, which insome instances was exacerbated by seeking information online:
I was concerned and thinking maybe I had something severely wrong with me or a bit paranoid maybebecause, I mean like the daft decision is searching the symptoms online, and it just freaked me out [. . .]just, all sorts of like, I don’t know, just big stomach issues, something like ulcers or obviously cancer isalways on it.
P3, young adult, ED
Although unfamiliarity with a symptom was a frequent driver among this sample, experiencingrecognisable symptoms could also prompt concern. Although this driver featured less strongly herethan it did in the parent group, it could increase the urgency to seek help, either because it suggested the
QUALITATIVE INTERVIEW STUDY OF DECISION-MAKING WITH THREE SUBGROUPS OF THE POPULATION
NIHR Journals Library www.journalslibrary.nihr.ac.uk
36

return of a previous problem or illness or because the young adult was aware of the serious consequencesthat similar symptoms had had for someone else. That is, programme theory 2, heightened awareness ofrisk as a result of experience or knowledge of traumatic health events leading to anxiety, could contributeto their concerns:
. . . that’s why I rang up, that’s why when [P36]’s head so hurting, and he said it had been for 3 days,and I remembered a story he told me about a girl who had had a headache and went into hospital andthey said it was a migraine, [P36: and they sent her home] and the next few days it wouldn’t go away[P36: and she died, with a bleed on the brain] and then she died of a blood clot.
P36 and girlfriend – both present for interview, young adults, emergency ambulance
The severity of symptoms could be another key trigger of concern, most commonly in relation to injuryrather than illness. Sometimes this was a progressive worsening of pain or other aspects of theproblem despite self-care measures, and it was this worsening that prompted the search for helpbecause it introduced an element of unfamiliarity. On other occasions the severity was immediatelyapparent and was itself sufficient to trigger action:
As I fell off I landed awkwardly on my right ankle and just completely rolled it. And then at that point itfelt – it kind of just went straight away it went really hard – and as dramatic as it sounds I thought therewas a bone sticking out. I couldn’t dare look because it just hurt.
P47, young adult, ED
In instances such as this, anxiety about the nature of the symptoms and their potential seriousnessalso had a clear impact on service choice, in this case (see above) prompting the decision to usethe ED. A similar process was evident for both of the young adults who contacted the emergencyambulance service, when their concern triggered a need for a speedy response that only this servicewas perceived to offer. In all of these decisions, programme theory 1, uncertainty about symptomscausing anxiety, can be seen to operate in combination with programme theory 9, perceptions or priorexperiences of services, to drive both the decision to seek help and the choice of service.
Concern about the severity of symptoms was sometimes accompanied by a desire for reassurance. In anumber of these instances, young adults echoed our sample of parents in describing how they thoughtthat their problem was unlikely to be serious, but wanted to allay their nagging concern:
. . . I was like, I want to make, I want to double check that it is not like a break or a twist or like a tornthing or they are going to put me on stronger medication ‘cause I was in a lot of pain.
P6, young adult, ED
Unwillingness to further delay care-seekingAround half of the young adults in this sample had sought care because they either were unwilling todelay seeking care further or could not tolerate their health problem any longer. This driver, whichaligned with programme theory 6, waited long enough for things to improve, always operated inconjunction with other drivers. In some instances, the other driver was interviewees’ concern aboutthe seriousness of the symptoms, as discussed above, but a number of other factors were also found tocontribute to this sense of urgency. The most common of these in this sample was a concern about theimpact, or the potential impact, of their symptoms on their ability to function, including work, study,child-care responsibilities and leisure activities:
I’ve been feeling under the weather generally for a little while but that particular week I’d just had a reallydifficult week, I couldn’t, I was so tired and fatigued and I couldn’t really eat, do my job properly, so I wasstruggling with driving and just being at work so I wanted to try and get it looked at.
P38, young adult, GP
DOI: 10.3310/hsdr08150 Health Services and Delivery Research 2020 Vol. 8 No. 15
© Queen’s Printer and Controller of HMSO 2020. This work was produced by O’Cathain et al. under the terms of a commissioning contract issued by the Secretary of Statefor Health and Social Care. This issue may be freely reproduced for the purposes of private research and study and extracts (or indeed, the full report) may be included inprofessional journals provided that suitable acknowledgement is made and the reproduction is not associated with any form of advertising. Applications for commercialreproduction should be addressed to: NIHR Journals Library, National Institute for Health Research, Evaluation, Trials and Studies Coordinating Centre, Alpha House,University of Southampton Science Park, Southampton SO16 7NS, UK.
37

This concern about the impact that symptoms could have on functioning corresponds with programmetheory 4, inability to get on with daily life, and was particularly prevalent among the young adultsample. Our findings also offer a refinement of this programme theory by highlighting the influence ofanticipated, rather than actual, impact on interviewees’ decision-making.
In a number of instances, as is apparent in the above interviewee’s account, the concern about theimpact on function did not arise out of an isolated incident of illness or injury, but was part of a longer-term health problem for which they were seeking resolution. In these cases, the decision to seek caregenerally had followed attempts to deal with the problem through self-care, including taking over-the-counter medication, and was also sometimes part of a continuing process of medical consultation.This would seem to be an additional dimension of programme theory 6, waited long enough for thingsto improve, and perhaps an extension of programme theory 10, frustration with access to GP, in that itarose from frustration with the ongoing care from a GP rather than a lack of access to a GP. The issuewas more that the failure of previous help-seeking to resolve the situation had prompted furtheraction to try to deal with the problem:
[I was] really sick of it, really, and just having all these symptoms, and for all these tests that I’ve had tocome back clear. It’s like well there is something wrong with me so it’s not, if it’s not about these foreignbugs or if it’s not about gluten or whatever, there is something wrong. I need to pursue it, and try and findout [what was wrong].
P44, young adult, GP
A need for pain relief was also an important reason why some did not want to delay care, specificallyprompting action at that time. This aligned with programme theory 5, need for immediate pain relief,and, although this was important, it always featured in combination with a range of other factors, as isevidenced in the following account:
. . . the night before I’d had a headache and I woke up and it was even worse, so I just rang them [GP] upand just said you know I can’t, can’t deal with this now. I’ve got a toddler to look after, is there anythingthat I can do now.
P35, young adult, GP
There was also evidence in this sample of issues that could expand programme theory 6, waited longenough for things to improve, into areas that might be judged externally as unacceptable reasons forcontacting services urgently: impatience and lack of organisation. In one instance, a general impatienceand intolerance of waiting was evident in the account of the decision-making process, and in theperson’s behaviour both during recruitment and in the interview. It is likely that this impatiencecontributed to their decision to call an emergency ambulance in this instance.
In two cases, no symptoms were present at the time the interviewee made contact, but familiarity withtheir existing health conditions had prompted them to seek help in the form of obtaining prescribedmedication. One interviewee had run out of essential medication and, unexpectedly, had been unableto access it through the usual route. The other interviewee needed a new prescription so that theycould manage potentially troublesome and distressing symptoms during an upcoming holiday. Thesetwo issues could be viewed as a lack of organisation. However, it might also be the case that, in thefirst situation, programme theory 2, heightened awareness of risk as a result of experience orknowledge of traumatic health events leading to anxiety, was operating in terms of the interviewee’sconcern to avoid a recurrence of symptoms managed by the medication. Programme theory 4, inabilityto get on with daily life, was operating in the second situation, although essential aspects of daily life,such as working or looking after children, were perhaps not affected.
QUALITATIVE INTERVIEW STUDY OF DECISION-MAKING WITH THREE SUBGROUPS OF THE POPULATION
NIHR Journals Library www.journalslibrary.nihr.ac.uk
38
Perceptions and experiences of health servicesInterviewees’ perceptions of different services were a significant driver of their decision-makingin relation to choice of service. Aligning closely with programme theory 9, perceptions or priorexperiences of services, these were both positive and negative and related to a variety of emergencyand urgent care services.
Contact with the emergency ambulance service in this sample was related to its positivecharacteristics. One interviewee described her confidence in the speed and skills of the ambulanceservice to assess and deal with her problem, which was driven partly by previous positive experiences,including the service’s reassurance that she had ‘done the right thing’ (programme theory 9) to call.That is, recursivity was at play in her decision-making based on the positive reinforcement of herprevious decision. She also noted learning subsequently that NHS 111 was able to contact anambulance if this was deemed necessary, and that this would change her future help-seekingbehaviour. Another positive characteristic of the emergency ambulance service was that it was asource of transport, offering a safe, easy and rapid way of getting to hospital.
The majority of interviewees in the sample who sought care in an ED did so because of either a positivebelief that it offered the best and/or most appropriate service or a negative perception that other servicescould not meet their particular needs. Positive characteristics of the ED were that it offered quick accessto help and had a wide range of resources and facilities, and that its doctors and nurses were able todeal with serious problems. Proximity of the ED to their home or workplace was also a secondaryconsideration for a few interviewees who lived within 2 miles of the hospital. One of these interviewees,who lived in an area of deprivation, cited the cost of transport as a factor in their decision to choose theED instead of the WIC; that is, for this interviewee, choosing the ED was a matter not of conveniencebut of cost. This could be aligned with programme theory 7, stressful lives and difficulty coping, in thatlimited financial resources affected decision-making. The influence of proximity of service is not includedin any of the existing programme theories.
In some instances, interviewees’ decisions to contact an ED were framed as resulting from negativefeatures of other services, particularly general practice, where delays or difficulties in access werea particular concern, aligned with programme theory 10, frustration with access to a GP. Negativeperceptions of general practice were related not only to access. Two interviewees had specific difficultieswith their relationship with their GP. One felt that the departure of her previous GP meant that nobodyat the practice understood her complex situation well enough to meet her needs, whereas the other’sprevious negative experience with her GP contributed to her reluctance to contact this service for herparticular symptom. By contrast, all interviewees who had been recruited because they had successfullyobtained care from the GP perceived that general practice was the most appropriate service to addresstheir needs. A range of reasons for this perception was given, including that the GP provided an opportunityto discuss concerns about ongoing or recurrent health problems or to obtain a diagnostic label, as wellas the practice being the only or most appropriate place to obtain repeat prescriptions or to reviewexisting prescribed medication. Some interviewees saw the GP as a trusted source of knowledge, and inone case this was because the interviewee had an established positive relationship with a specific doctor.For this individual, the GP also represented the quickest and most accessible route to help, importantconsiderations that linked with many of the factors explored previously in relation to an unwillingnessto further delay care-seeking (programme theory 6) and the influence of proximity of service onhelp-seeking behaviour.
Experiences of trying to access a GP were sometimes also a significant factor in deciding where toseek care. A few interviewees described how they had attempted to make contact with their GP, buttheir inability to get an appointment or to speak to someone quickly enough had prompted them toseek help elsewhere. This frustration aligned with programme theory 10, frustration with access to aGP, but was also related to programme theory 6, waited long enough for things to improve, becausepeople wanted a same-day GP appointment. Individuals sought a same-day appointment either because
DOI: 10.3310/hsdr08150 Health Services and Delivery Research 2020 Vol. 8 No. 15
© Queen’s Printer and Controller of HMSO 2020. This work was produced by O’Cathain et al. under the terms of a commissioning contract issued by the Secretary of Statefor Health and Social Care. This issue may be freely reproduced for the purposes of private research and study and extracts (or indeed, the full report) may be included inprofessional journals provided that suitable acknowledgement is made and the reproduction is not associated with any form of advertising. Applications for commercialreproduction should be addressed to: NIHR Journals Library, National Institute for Health Research, Evaluation, Trials and Studies Coordinating Centre, Alpha House,University of Southampton Science Park, Southampton SO16 7NS, UK.
39

they wanted to be seen urgently or because they had not been able to book an appointment inadvance that allowed them to attend to their work responsibilities, which then led to a sense of havingwaited long enough. By contrast, two interviewees described their confidence that they could obtainsame-day GP appointments when needed and so they chose this approach to seeking help:
If I’m feeling a bit run down at all, or cold, or my chest is bad then they will get me in, on that same dayregardless ‘cause obviously it’s a bit more of a medical emergency I guess, more urgent . . .
P40, young adult, GP
A lack of awareness of other potentially appropriate services also contributed to the decision-makingprocess. This particularly related to the MIU, which could probably have met the needs of three of theinterviewees who accessed help from the ED but was not considered as an option either by them or bythose who gave them advice.
Influence of othersFor all but three young adults in the sample, other people had some degree of influence on theirdecision to seek care or on the service that they accessed. In a few instances, a direct influence wasevident, corresponding with programme theory 8, following advice of trusted others. Two intervieweeshad been advised by health-care professionals specifically to attend the ED, one during a consultationwith their GP and the other through a contact with NHS 111 as a result of being unable to speak totheir GP:
(. . .) the 111 lady spoke to a nurse that – to get a bit of advice about whether I could go to the walk-incentre, she said you wouldn’t be able to go to the walk-in centre but actually we would say go straight tothe hospital for stuff like that.
P46, young adult, ED
Direction to go a specific service could come from family and friends as well as from healthprofessionals, and this was sometimes based on those others’ experiences. This was particularly thecase for direction to go to an ED, perhaps indicative of social norms about where to seek care forparticular types of health problems. For example, a colleague’s opinion about the diagnostic toolsavailable at an ED (i.e. programme theory 9, perceptions or prior experiences of services) haddetermined where the following interviewee went for care:
I’d knew that one of my colleagues a couple of months ago had done similar thing and sprained it, I askedhim where he went because I didn’t right know, I were gonna go to walk-in centre but then he said‘there’s no point because they don’t do X-rays I don’t think, which you’d need’ so that’s when I wentto [ED].
P45, young adult, ED
(. . .) with it being a year, and I have had other symptoms, I’ve been in hospital because of it, they’retaking that long to get this operation so I think they [partner and mum] were just fed up and they werelike just ‘let’s go to place’ because we could’ve gone into [local town] but they thought, we just thought‘let’s go to [place] where the main thing is because we’re gonna be waiting wherever we go so we might aswell go there’.
P43, young adult, ED
Sometimes the family member or friend made the decision on behalf of the patient if they felt that thepatient was not fit to make it, or they encouraged the patient to take a particular action (as detailedabove). Their influence could also take a more advisory, less directive form; for example, a shareddecision between a young adult with a learning disability and their mother, or support from family,
QUALITATIVE INTERVIEW STUDY OF DECISION-MAKING WITH THREE SUBGROUPS OF THE POPULATION
NIHR Journals Library www.journalslibrary.nihr.ac.uk
40

partner, friends or colleagues for an interviewee’s decision to seek help. A negative example of thistheme was one interviewee’s lack of social support. Their problem occurred late at night, making itdifficult for them to draw on their usual social network, exacerbating their uncertainty and driving anurgent need for reassurance, which led them to call the emergency ambulance service:
I honestly thought I was going to die. I really, really thought I was going to die because I’d never felt likethat in my life. Like I said, being on my own as well, nobody to speak to, nobody to reassure me. It wasjust so scary.
P9, young adult, emergency ambulance
This impact of lack of support due to timing of the incident is not represented explicitly in the programmetheories but could be related to programme theory 7, inability to cope due to stressful lives.
Poor mental health and stressful livesAlthough the majority of young adults presented to a service because of physical concerns, aroundone-third of those in the sample made some reference to also having mental health problems, particularlygeneralised anxiety and depression. These influenced their decision-making in a variety of ways. Oneinterviewee’s acute exacerbation of mental health problems was the direct trigger for help-seeking, withprogramme theory 1, uncertainty about symptoms causing anxiety, evident in her account:
I just didn’t know what was wrong with me at the time it was just really scary . . . I was just frightened ithad just not sort of happened before . . . Just a really heightened sense of fear and the whole sense ofdoom thing was happening and – at the time – it felt very urgent. Yeah I’d, I’d never had it like thatbefore so it’s just totally new.
P39, young adult, GP
Others described a complex interplay between their mental and their physical health. Illustrating thedifficulties described in programme theory 7, stressful lives and inability to cope, interviewees’ ongoingstruggle with mental health negatively affected their ability to function and to cope with the challengesof additional physical symptoms. In a number of instances, this driver could be seen to operate inconjunction with programme theory 1, uncertainty about symptoms causing anxiety, with interviewees’overall increased levels of anxiety prompting a need for urgent help and reassurance about their symptoms.In one case, a more complex need for validation was related to mental health problems:
I’m not always as confident in, what I know I’m feeling and, I know I’m feeling it, but when I go to thedoctors, the hospital and I explain to them and that like no, you are not just like, making it seem worse.It is bad. But we know what you are dealing with and we are going to try and help, so generally that iswhy I go to the hospital, if I ever go. So I need the reassurance that I’m not just like making it seem worsethan it is and that there is something and that they can help.
P6, young adult, ED
Mental health problems could also have an impact on the particular service that interviewees decidedto contact, with programme theory 9, perceptions or prior experiences of services, sometimes evidentin the choice to use the ED or emergency ambulance because of the perception that these serviceswould respond more quickly. A more complex influence was potentially present for one interviewee,whose anxieties made it difficult for her to leave home unaccompanied and may have influenced herdecision to call an emergency ambulance. This is aligned with programme theory 7, stressful lives andinability to cope. In addition to mental health problems acting as drivers of urgent care seeking, andinfluencing which service was contacted, high levels of stress from daily living could also have animpact on the urgency of help-seeking in different ways. First, these could trigger an exacerbation ofexisting physical symptoms to an intolerable level. Second, they could influence which service wascontacted by prompting people to seek a service that they felt did not add to their already high levelsof stress. For example, the interviewee providing the following quotation had unpredictable work
DOI: 10.3310/hsdr08150 Health Services and Delivery Research 2020 Vol. 8 No. 15
© Queen’s Printer and Controller of HMSO 2020. This work was produced by O’Cathain et al. under the terms of a commissioning contract issued by the Secretary of Statefor Health and Social Care. This issue may be freely reproduced for the purposes of private research and study and extracts (or indeed, the full report) may be included inprofessional journals provided that suitable acknowledgement is made and the reproduction is not associated with any form of advertising. Applications for commercialreproduction should be addressed to: NIHR Journals Library, National Institute for Health Research, Evaluation, Trials and Studies Coordinating Centre, Alpha House,University of Southampton Science Park, Southampton SO16 7NS, UK.
41

commitments that made it impossible for them to book appointments very far ahead; therefore, theytook advantage of unscheduled time off to access help via a same-day GP appointment:
. . . just like work relationship, stress you know, all that stuff, so I know that that is what has been makingit a trillion times worse.
P44, young adult, GP
By contrast, depression seemed to decrease one interviewee’s motivation to take action, which mayhave contributed to the fact that the decision to seek help was taken by someone else on their behalf.
Social deprivation subgroup
Sample characteristicsSixteen individuals residing in areas of social deprivation were recruited, ranging in age from 32 to80 years (mean 57 years). The majority of interviewees (n = 9) resided in an area with an IMD scoreof 1 (the highest level of deprivation). All but one interviewee had lived in the city in which werecruited them for > 5 years; the other interviewee had lived in the city for > 1 year. The sample wasevenly split between men and women. Interviewees predominantly identified their ethnicity as white(n = 11); four other interviewees were Asian/Asian British (Kashmiri, Indian, Pakistani and Afghan) andone was black African. Nine interviewees described themselves as married, three separated or divorced,three single and one widowed. Half of this sample were retired (n = 8), with one other describing beingboth retired and working part-time. Four other interviewees were working full-time or part-time, twowere full-time homemakers and one was permanently unemployed.
Of the 16 interviewees, five were recruited following contact with the emergency ambulance service,four were recruited following contact with an ED and seven were recruited following contact with ageneral practice. More people in this subgroup (n = 4) had used an emergency ambulance than in theother subgroups (young adults, n = 2; parents, n = 1), and one had been taken to the ED by ambulancefollowing a call to NHS 111. Concerns prompting contact varied widely across this sample, andincluded chest, abdominal or back pain (n = 4), sometimes as part of an ongoing problem; illness, injuryor confusion of someone they had caring responsibility for (n = 3); ear, throat and eye problems (n = 5),sometimes as part of a longer-term period of ill-health and other times prompted by health anxiety;anxiety attack; and headache after an injury.
Overview of findings for people living in areas of social deprivationThere was no single dominant driver of interviewees’ decision-making about seeking health care. Instead,a number of key drivers were evident, including concerns about the severity of their symptoms, anunwillingness to further delay care-seeking, and their perceptions and experiences of services. Theinfluences of others and of social isolation were also significant drivers for different participants in thissubgroup, together with poor mental health and geographical proximity. Most interviewees in thissample had between two and five drivers, with only one interviewee having a single driver evident intheir decision to seek care. With regard to making contact with a particular service, a lack of access(either perceived or real) or dissatisfaction with general practice were factors for all interviewees in theirdecision to contact either the emergency ambulance service or an ED. Conversely, positive experiences ofgeneral practice, or negative perceptions about urgent care services such as WICs, were the predominantfactors in the decision to access general practice. The influence of others, either within a social networkor health-care professionals, could also determine whether or not an interviewee sought help, or wherehelp was sought from.
Concern regarding seriousness of symptomsSome of the interviewees sought care because they were concerned about physical symptoms. Theydescribed unfamiliar, or worsening, symptoms that they believed might indicate a serious problem;these concerns correspond to programme theory 1, uncertainty about symptoms causing anxiety.
QUALITATIVE INTERVIEW STUDY OF DECISION-MAKING WITH THREE SUBGROUPS OF THE POPULATION
NIHR Journals Library www.journalslibrary.nihr.ac.uk
42

Two interviewees who reported concerns about symptoms had sought care on behalf of anotherperson, and, in both instances, programme theory 3, fear of consequences when responsible for others,was clearly evident. One interviewee was a care home manager and her decision-making had beenclearly influenced by this role. Although concerned that the symptoms and unusual behaviour of aresident could indicate a more serious problem, she had also been driven to act because she felt a dutyof care for the resident and was unwilling to take risks with the health of someone for whom she hadresponsibility. This was exacerbated by her belief, based on her experience of caring for elderly people,that their health is prone to deteriorating quickly. Another interviewee had sought care on behalf ofher teenage daughter, and risk aversion was again apparent. The parent had been unwilling to leaveher child’s symptoms untreated, and had been reluctant to medicate her child unless advised by adoctor, highlighting the role of confidence in medication use, which is not currently encompassed inthe programme theories.
Unwilling to further delay care-seekingFor around half of the interviewees who were living in areas of deprivation, a key driver of seekingcare was their unwillingness to tolerate further delays in doing so. As with the young adults group,this driver, which corresponds to programme theory 6, waited long enough for things to improve, wassometimes also linked to programme theory 5, need for immediate pain relief. Interviewees describedbeing in increasing amounts of pain that could no longer be tolerated, and believing that seeking carecould provide the urgent pain relief that they needed. Interviewees described using self-care strategies toalleviate their pain, but these were perceived as ineffective. In some instances, it appeared that there hadbeen a reluctance to self-administer pain medication, or that there was a lack of medication knowledge,which had limited their use of medication in the period before seeking care. This limited engagement withmedication is not represented in the existing programme theories:
You are in so much pain you just think, you are thinking about the pain all the time . . . [the pain] hadlasted for 24 hours, and I did say to [call handler at 999], you know, I can’t put up with this much longer. . . I thought I’ve put up with it long enough . . . I thought when is it going to end [. . .] I’m not a tabletperson, I’ve got, if I was to try and put a number of tablets that I have taken in my life [aged 70+ years]and if you want to include Rennies, I think it must be, around the hundred mark.
P1, social deprivation, emergency ambulance
There was some evidence that pain also led to increased anxiety about symptoms, which was alignedwith programme theory 1, uncertainty about symptoms causing anxiety, or had a negative impact onthe ability to care for family, which was aligned with programme theory 4, inability to get on with dailylife, both of which acted as further key drivers of care-seeking. An unwillingness to delay care furtherwas an important driver for some of the interviewees who sought care from the emergency ambulanceservice or in the ED. This decision was generally related to unmanageable pain and a need to obtainurgent pain relief, but for one interviewee who was experiencing acute mental health symptoms the999 call was in reaction to needing an immediate response to these symptoms, suggesting a need toextend programme theory 5, need for immediate pain relief, to include a wider range of acute symptoms.This driver did not appear important to those seeking GP care in this sample.
Others’ unwillingness to delay seeking care was related not to pain but to an inability to manage thesymptoms, or the situation, any longer. One interviewee felt that she had delayed seeking care forpersistent symptoms for long enough and had reached a point of wanting to get things sorted that day:
. . . so I tell him I got this infection since 3 or 4 weeks. I was suffering, and I got no appointment, so that’swhy I say it should be (. . .) that’s why I want to go appointment because I’m not well.
P24, social deprivation, GP
DOI: 10.3310/hsdr08150 Health Services and Delivery Research 2020 Vol. 8 No. 15
© Queen’s Printer and Controller of HMSO 2020. This work was produced by O’Cathain et al. under the terms of a commissioning contract issued by the Secretary of Statefor Health and Social Care. This issue may be freely reproduced for the purposes of private research and study and extracts (or indeed, the full report) may be included inprofessional journals provided that suitable acknowledgement is made and the reproduction is not associated with any form of advertising. Applications for commercialreproduction should be addressed to: NIHR Journals Library, National Institute for Health Research, Evaluation, Trials and Studies Coordinating Centre, Alpha House,University of Southampton Science Park, Southampton SO16 7NS, UK.
43

Perceptions and experiences of health servicesThe influence of both positive and negative experiences of services was evident in interviewees’decision-making, aligning clearly with programme theory 9, perceptions or prior experiences ofservices. All interviewees who had made their own decision to access the emergency ambulanceservice or the ED, rather than doing so on advice from a health-care professional, offered a negativeview of some aspect of general practice. Interviewees described trying to make contact with the GPbut the telephone was repeatedly engaged, or that they had made contact with their GP but had notbeen offered care that met their needs or within a timescale that would meet their needs, or that theyhad not attempted to contact their GP because they believed that an appointment would not beavailable. This combination of experiences and perceptions corresponded to programme theory 10,frustration with access to a GP, as well as to programme theory 9:
I phoned the doctors to ask for some medication, I thought probably they may, might have come to seeme ‘cause I couldn’t get to see them, but they are very reluctant now to come out as well, aren’t they?Yes, and probably that would have saved me a visit up to the hospital.
P4, social deprivation, ED
Some interviewees felt that it might take weeks to obtain a GP appointment for a routine problem, andindicated that they would try to obtain a same-day appointment regardless of how urgent they thoughtthe problem was, thereby effectively using ‘urgent’ appointments for more routine health problems.For one interviewee, this course of action appeared to be endorsed by the GP receptionist as a way toaccess their preferred GP, illustrating the role of programme theory 8, following advice of trusted others inthe decision-making process. The process of trying to obtain a same-day GP appointment was discussed,with many interviewees describing how they needed to call the GP surgery first thing in the morning to dothis. For some interviewees this was problematic; for example, if they had taken the decision to seek carelater in the day, by which time they believed, or knew, that no same-day appointments would be available.Others found it difficult to call first thing in the morning while feeling unwell:
I find it very frustrating, that you have to call the GP surgery at half past eight when it opens, because it’sjust a free-for-all. Obviously everybody, everybody rings at the same time and it’s a little bit like a radiophone-in, you know, the fifth caller wins. The phone is just engaged and engaged and engaged so you haveto just constantly keep trying and you can get through at, sometimes at quarter to 9, 15 minutes laterand all the appointments have gone and it’s the first, it’s like you know, trying to buy concert tickets.
P26, social deprivation, GP
Others described an unfamiliar triage system at their GP surgery. Although interviewees were notexplicit about whether or not this was a factor in their opting to contact a different service, it mayhave influenced their decision if they felt that they needed help urgently.
A small number of interviewees expressed dissatisfaction with the care that they received from theirgeneral practice, which may have influenced their decision not to contact a GP; this again correspondedto programme theory 9, perceptions or prior experiences of services. There appeared to be a lack ofconfidence in the care provided, with one interviewee recounting a previous occasion when their GP’sinability to make a clinical diagnosis had given them the perception that the GP had not assessed themproperly, and another describing inconsistency of care because of the use of locum GPs:
. . . at the minute my doctor’s pretty terrible. It’s kind of, he is an old guy, so I don’t know if he is goingthrough health issues, you know he is in his eighties. His wife is absolutely terrible but the less said aboutthat the better . . . they’ve got a lot of locums in, so I’m again, you can’t judge, for me I like to haveconsistency. You know if I’ve had a doctor that has known me for a while, it’s good for me to see him on a
QUALITATIVE INTERVIEW STUDY OF DECISION-MAKING WITH THREE SUBGROUPS OF THE POPULATION
NIHR Journals Library www.journalslibrary.nihr.ac.uk
44
relatively regular basis, if they’ve got a locum it’s a bit like I don’t know who I’m going to be seeing today.They can look at your paperwork and they can look at your medical records but it doesn’t feel the same,do you know what I mean? So it’s been difficult really.
P19, social deprivation, ED
By contrast, all of the interviewees who had used their GP on the occasion in question identified positiveperceptions of their general practice as a key driver of their decision. Interviewees spoke about a rangeof factors that gave them confidence in, and satisfaction with, their general practice: access to the service,the knowledge and professionalism of their GP, the thoroughness of assessment, the ability to receivereassurance and communicate effectively, and their often well-established relationship with their GP:
I think we’ve got an amazing surgery, I noticed it’s been voted one of the top surgeries in last year’s poll. . . You can ring every morning at half past 8 and they answer or somebody will always ring you back. Ifyou explain that you can’t get in until a certain time they try and fit you in at that time. They’re amazing.
P15, social deprivation, GP
I am a worrier about my health . . . the guy [GP] was very understanding, you know in this particularappointment, good bedside manner if you will, he was very reassuring. He examined me and said thatthere was nothing to worry about, but very reassuring, wasn’t vague or ambiguous in what he was saying,he was very to the point. There is nothing wrong you know and that sometimes well, all the time, that’swhat I need to hear if you see what I mean.
P26, social deprivation, GP
Similarly, some interviewees who accessed an ED had a positive view of the service. They felt that anED was more likely than a general practice to offer what they needed on that particular occasion, suchas making a diagnosis when a GP had failed to make one, providing pain relief quicker than a GP could(which links with programme theory 5, need for immediate pain relief), and giving better informationthan a GP that they were dissatisfied with.
There were also negative perceptions about urgent care services such as WICs, NHS 111 andpharmacies, which appeared to particularly influence the interviewees who were recruited into thestudy via general practice, suggesting that these people were less likely to use those services whenseeking health care. Some interviewees were unaware of these services or the facilities that theyprovided, but others felt that they were not appropriate for their clinical needs, had been dissatisfiedafter using them on a previous occasion or had difficulties accessing them.
Influence of othersIn contrast to those experiencing social isolation, other interviewees appeared supported and indicatedthat family members had influenced or supported their decision to seek care or to seek care from aspecific service. This influence corresponds to programme theory 8, following advice of trusted others,although this would need to be modified to recognise the varying degrees of influence of people’ssocial networks. The motivation of family influence could be worry about the symptoms, correspondingwith programme theory 1, uncertainty about symptoms causing anxiety, as well as with programmetheory 3, fear of consequences when responsible for others:
Interviewer: . . . why did your family encourage you to make contact with a health service?
P4, social deprivation, ED: probably the fact that I live on my own, and that I was in pain. I think thatwould probably be the reason. And my granddaughter she works with a lot of elderly people anyway doyou know what I mean and yes ‘oh you should be going . . .’
DOI: 10.3310/hsdr08150 Health Services and Delivery Research 2020 Vol. 8 No. 15
© Queen’s Printer and Controller of HMSO 2020. This work was produced by O’Cathain et al. under the terms of a commissioning contract issued by the Secretary of Statefor Health and Social Care. This issue may be freely reproduced for the purposes of private research and study and extracts (or indeed, the full report) may be included inprofessional journals provided that suitable acknowledgement is made and the reproduction is not associated with any form of advertising. Applications for commercialreproduction should be addressed to: NIHR Journals Library, National Institute for Health Research, Evaluation, Trials and Studies Coordinating Centre, Alpha House,University of Southampton Science Park, Southampton SO16 7NS, UK.
45

Interviewer: So if you’d just been left to your own devices and your daughter hadn’t intervened, what doyou think you would have done, in the next day or whatever?
P4, social deprivation, ED: Just carried on probably with the stronger painkillers.
In other instances, health-care professionals influenced interviewees’ course of action. Some of ourinterviewees had accessed a lower-acuity service prior to contacting the service from which they hadbeen recruited, and around one-third had followed the advice of a health-care professional in thencontacting a higher-acuity service. Aligned with programme theory 8, following advice of trustedothers, one interviewee described how NHS 111 had arranged an emergency ambulance for them,and another explained that NHS 111 had obtained a GP appointment for them after they had triedunsuccessfully to do so themselves. Other interviewees described being given advice from a health-care professional rather than having a contact arranged. One interviewee’s GP suggested that theycould call the emergency ambulance service about their problem and another had been advised by anoptician to contact their GP. In a third instance, general practice surgery staff advised the intervieweeto access their chosen GP by requesting a same-day appointment. Some interviewees found that thisadvice matched their perception of who they should contact, but both interviewees who were assessedby the emergency ambulance service questioned whether this might be a higher-acuity service thannecessary. None of our interviewees received advice from a health-care professional to attend an ED.
Social isolationAlthough for some interviewees in this sample other people had an impact on their decision-making,around one-third appeared to experience varying degrees of social isolation or a lack of support,aligning with programme theory 7, stressful lives, difficulty coping. For some, this was a key driver ofwhy they sought care, but more often it was a secondary driver of their decision-making when seekingcare on that particular occasion. Lack of support related to a general lack of support in their lives frominformal/formal networks, rather than a lack of support specifically at the time of the incident (e.g.being alone at the time or unable to contact a usual provider of support). Those describing a generallack of support tended to be older, ranging in age from 64 to 80 years. Two of these interviewees saidthat they were the main carer for their spouse, with little or no extended family input, whereas theothers lived alone or in sheltered housing. In common, they described having no extended family, ornone living nearby, or a lack of positive interaction with family. Some identified a network of peoplearound them, such as neighbours, but did not describe these people in terms of friendship or support.In some of these individuals the interviewer perceived a sense of loneliness and a desire to connectduring the interview, which had possibly been a reason that they had agreed to take part:
[I have] two [sons] . . . they don’t keep in touch, I’ve not seen them since the divorce [10+ years ago] . . . Iphoned them, they never reply, they don’t reply, they don’t reply to texts or anything, I don’t even know ifthey have got the same number . . . I said I may as well text to the brick wall next door to me, because I’mgetting the same response, if you need me at any time, I’m there and I’ve never heard, very sad really.
P1, social deprivation, emergency ambulance
The lack of support or the social isolation appeared to contribute to some interviewees’ inability tomanage their symptoms any longer, corresponding to programme theory 7, stressful lives and difficultycoping. This programme theory was also evident in the practical impact of isolation for one interviewee,who did not have anyone to offer them transport to the ED and, without having the financial means ofpaying for a taxi, going to the ED by ambulance was seen as the only option.
Some interviewees seemed to perceive that, although a degree of informal or formal support wasavailable, this could not provide the advice or kind of support needed. One interviewee felt that theywere more knowledgeable about health than those in their support network, and another believed thatformal carers would be unable to help within the time frame required, the latter belief potentiallyaligning with programme theory 9, perceptions or prior experiences of services.
QUALITATIVE INTERVIEW STUDY OF DECISION-MAKING WITH THREE SUBGROUPS OF THE POPULATION
NIHR Journals Library www.journalslibrary.nihr.ac.uk
46
Poor mental healthAlthough the primary reason for seeking care related predominantly to physical problems, existingmental health problems were mentioned by half of the sample. Interviewees spoke openly about theirmental health. They described generalised anxiety, specific health anxiety, separation anxiety, panicattacks and agoraphobia, many of which were longstanding problems for which professional care wasbeing accessed. Mental health problems, which could be understood as an aspect of programme theory7, stressful lives and difficulty coping, appeared to influence decision-making in a number of ways.Generalised anxiety could contribute to the urgency required when seeking help, where, for example,the onset of a physical symptom could prompt an underlying anxiety that escalated the need to beassessed by a health-care professional urgently. The duration and the nature of symptoms could alsotrigger or exacerbate health anxiety, prompting a need to seek care to receive reassurance from ahealth-care professional that the problem was not serious. One interviewee, against the advice of herGP, undertook a symptom-related internet search before she sought care, which further added to herhealth anxiety; the information gathered during the internet search led her to believe that the physicalhealth problem could be more serious than she had initially perceived. For some, although they madelight of the situation, it was clear that the physical symptoms instilled a genuine fear about the severityof the problem, aligned with programme theory 1, uncertainty about symptoms causing anxiety:
I just thought I don’t want to die [laughs]. I don’t know, maybe I was taking it a bit too far, but I was, I’venever had anything like this before. So when I have spoken to people afterwards they said ‘oh they’ve hadswollen lymph when they have been ill this that and the other’, but me I was like ‘damn, I don’t like this’you know . . . it was scary for me.
P19, social deprivation, ED
In the case of one interviewee who exhibited significant anxiety in the interview, the relationshipbetween key drivers was particularly complex, with social isolation appearing to feed a general anxiety,and a history of serious health problems being associated with health-related anxiety and a fear ofdeath. The onset of an apparent minor health problem exacerbated these beliefs and the need forurgent help.
When mental health problems were described, care was accessed from all three services in our study.Interviewees who opted to seek care from a GP described having a positive and established relationshipwith their GP (one interviewee described the relationship in terms of a friendship) or perceived that onlya doctor had the clinical skills that would allay their concerns. Their trust in their general practice wasapparent, and the influence of these perceptions corresponds closely to programme theory 9, perceptionsor prior experiences of services:
I’d had a problem with my throat I’d sort of convinced myself that I had a little lump, my throat lookedabnormal when I looked in the mirror. I’d had a sore throat and I was checking around and I thought ‘ohthat doesn’t look right’, so then the way my brain works is, I automatically need some sort of reassurance,obviously the doctors are the best people to do that, professionally. Knowing how I, what I’m like with myworrying about my health, I feel like I instantly need some, some form of reassurance that could onlyreally come from [the GP].
P26, social deprivation, GP
Geographical proximity to a serviceAlthough not a driver for most, two interviewees described the proximity to a particular service as animportant factor in their decision to access it. This factor, which is not represented in existing programmetheories, often worked in combination with other drivers. For example, one interviewee describedneeding to obtain pain relief quickly and, as they lived close to the ED and believed that the ED was anappropriate service for their care, considered themselves to be in too much pain to travel to a servicefurther away. The link between proximity and programme theory 5, need for immediate pain relief, isclearly evident here. Most interviewees lived near a general practice. One interviewee described the
DOI: 10.3310/hsdr08150 Health Services and Delivery Research 2020 Vol. 8 No. 15
© Queen’s Printer and Controller of HMSO 2020. This work was produced by O’Cathain et al. under the terms of a commissioning contract issued by the Secretary of Statefor Health and Social Care. This issue may be freely reproduced for the purposes of private research and study and extracts (or indeed, the full report) may be included inprofessional journals provided that suitable acknowledgement is made and the reproduction is not associated with any form of advertising. Applications for commercialreproduction should be addressed to: NIHR Journals Library, National Institute for Health Research, Evaluation, Trials and Studies Coordinating Centre, Alpha House,University of Southampton Science Park, Southampton SO16 7NS, UK.
47

general practice as being located within 1 minute’s walk from home and described how they bookedappointments in person, rather than over the telephone, such was the convenience of the location.The proximity of the service, combined with these other factors, were significant drivers of why GP carewas sought.
Summary of drivers of seeking care from specific services across the three subgroupsWe focused on why people sought care from different services across the three subgroups.
Among the eight interviewees who were recruited following contact with the emergency ambulanceservice, the key drivers were concern about symptoms or an inability to tolerate symptoms any longer;problems with gaining timely access to a GP; and the influence of others (NHS 111 advised calling 999,a GP advised calling 999, or family made the decision to call 999). Other influences included positiveperceptions about the ambulance service; a lack of financial means to be able to travel to the ED; alack of knowledge of or confidence in lower-acuity services; anxiety prompted by the episode occurringovernight while the participant was alone; or an indication that the decision-maker had a generalimpatience and intolerance of waiting.
Among the 21 interviewees who were recruited following contact with an ED, most drivers related tonegative aspects of general practice: a perceived inability to access timely GP care or dissatisfactionwith GP care. In addition, EDs had characteristics that many interviewees sought, including speedand range of clinical facilities, or were perceived to be able to resolve their problem. Although thefamiliarity with, or proximity to, the ED was not a key driver, it was an influential reason for seekingcare there. Another key driver was the influence of others, including being advised by service providersin general practice, NHS 111 or people in their social network.
All of the 19 participants recruited following contact at a general practice had positive perceptions ofgeneral practice, including having a good relationship with their GP, having good access to GP care interms of the ease with which they could obtain a same-day appointment, the proximity of the practice,having a desire to obtain reassurance from a professional, and having the sense that it was appropriateto contact a GP with their particular health problem. Following the advice of someone else, such asstaff at general practice, NHS 111, an optician, and family and friends, was a key driver of seeking carefrom a GP.
Discussion
Summary of findingsThere was some commonality across the subgroups with respect to decision-making about seekingemergency and urgent care, as well as distinct areas of difference. As might be expected, concernsabout symptoms were prevalent in all subgroups. However, the groups differed in the factors thatprompted or exacerbated these concerns. Parents specifically placed the child at the centre of thisdecision-making, in relation to either their sense of responsibility for the child or their lower thresholdfor tolerating risk concerning the child’s health. Seeking professional care eased parents’ burden ofresponsibility and met a need for reassurance that was a clear and dominant driver in this subgroup,with other factors not having the same amount of influence.
Among young adults and those living in areas of deprivation, concerns about symptoms were alsopresent, but these were driven by, and one of a more diverse range of, factors that influenced theirdecision. An unwillingness to delay seeking care was also expressed more frequently in these groupsthan in the parent sample. This could be driven by a range of factors, including an inability to managethe symptoms, a need for urgent pain relief or, particularly among young adults, a concern aboutthe impact of the symptoms on their functioning, probably reflecting the higher proportion in thisgroup who were working or studying. Poor mental health also influenced decision-making for young
QUALITATIVE INTERVIEW STUDY OF DECISION-MAKING WITH THREE SUBGROUPS OF THE POPULATION
NIHR Journals Library www.journalslibrary.nihr.ac.uk
48

adults and those in the social deprivation sample, and social isolation was another factor for some inthe latter group. Both of these factors may have had an impact on interviewees’ coping capacity andsubsequent decision-making.
All subgroups were heavily influenced in their decisions to make contact with specific services byperceptions or previous experiences of health services. Influences could be positive (i.e. prompting achoice to contact a particular service) or negative (i.e. choosing not to access a specific service). Theinfluence of other people was also apparent in all subgroups, more so on the choice of service ratherthan on the decision to seek care. This influence could come from health-care professionals, but wasmost frequently from interviewees’ social networks, where family members’, friends’ and colleagues’perceptions of services or concerns regarding the seriousness of the symptoms could direct or supporthelp-seeking decisions.
Links to programme theoriesEvidence of all 10 programme theories was found in the interviewees’ accounts and, mirroring thefindings discussed above, some were present more frequently and to varying degrees across thesubgroups (see Appendix 6, Table 18). Reflecting the areas of commonality identified above, threeprogramme theories featured strongly in all three groups: programme theory 1, uncertainty aboutsymptoms causing anxiety, programme theory 8, following advice of trusted others, and programme theory9, perceptions or experiences of services. Parents’ particular concerns regarding their responsibility fortheir child and lower threshold of concern for their child’s health are apparent in the much more frequentevidence in this subgroup of programme theory 3, fear of consequences when responsible for others, andprogramme theory 2, heightened awareness of risk as a result of experience or knowledge of traumatichealth events leading to anxiety. By contrast, programme theory 6, waited long enough for things toimprove, and programme theory 7, stressful lives and difficulty coping, are more apparent in the youngadult and social deprivation subgroups, the latter perhaps reflecting the impact of mental health problemsand social isolation. Young adults’ concerns about the impact of symptoms on their ability to function areevident in the more frequent occurrence in this subgroup of programme theory 4, inability to get on withdaily life. The number and range of programme theories in many of interviewees’ accounts also highlightsthe complexity of individuals’ experiences. Only seven interviewees showed indications for fewer than fourprogramme theories and 10 interviewees had evidence of six or seven of the theories.
Our findings add new insights to the existing programme theories, indicating areas where these needto be refined or extended to more accurately reflect the diversity of experiences in the data (Table 6).Interviewees’ accounts also identify further drivers of their decision-making that are not reflected inthe existing programme theories, particularly in relation to the influence of the timing of the event andthe proximity of services, which suggests that there is a need for additional programme theories.
Links to existing theoriesA number of the existing theories and models explored in the WP1 review are evident in the interviewfindings. For all three subgroups, concern about the seriousness of the symptoms links clearly withLeventhal’s58 self-regulation model, which recognises the importance of both cognitive and emotionaldimensions of the experience of illness. In relation to the cognitive dimension, all of Leventhal’s fivedomains of illness, namely identity (label/name), consequences (including impact on function), timeline(including duration), cause and controllability, can be seen to varying degrees in many aspects ofinterviewees’ accounts of their symptoms. Uncertainty about the meaning of symptoms, which was afrequent concern for interviewees, has been identified by Mishel and Braden59 as having a significantimpact on help-seeking; they also identify the role of social support in coping with uncertainty. All threesubgroups frequently identified the influence of others on their decision-making, and Pescosolido’s71
network episode model, recognising both the direct and the indirect impact of social networks, is evidentin our findings. The role of recursivity95 and candidacy74 is also evident in this context.
DOI: 10.3310/hsdr08150 Health Services and Delivery Research 2020 Vol. 8 No. 15
© Queen’s Printer and Controller of HMSO 2020. This work was produced by O’Cathain et al. under the terms of a commissioning contract issued by the Secretary of Statefor Health and Social Care. This issue may be freely reproduced for the purposes of private research and study and extracts (or indeed, the full report) may be included inprofessional journals provided that suitable acknowledgement is made and the reproduction is not associated with any form of advertising. Applications for commercialreproduction should be addressed to: NIHR Journals Library, National Institute for Health Research, Evaluation, Trials and Studies Coordinating Centre, Alpha House,University of Southampton Science Park, Southampton SO16 7NS, UK.
49

TABLE 6 Refinement of the programme theories based on the interviews
PT developed in WP1Suggested refinements or proposed newtheories from WP2 Suggested revisions
1, uncertainty about symptomscausing anxiety
Degree of vulnerability of person – age – or isthis PT2?
Or someone else’s uncertainty who made thedecision?
Need for validation – is this PT1?
Uncertainty about meaning andseriousness of symptomscausing anxiety
2, heightened awareness of riskas a result of experience orknowledge of traumatic healthevents leading to anxiety
General beliefs about children’s health quicklydeteriorating – or is this PT8 refined? Similarly,elderly people can decline quickly
Previous symptoms – chronic conditions orrecurrent illness – not exactly trauma butincreases concern. Also anticipate return ofsymptoms if run out of medication
Heightened awareness of riskto health as a result of personalexperience or knowledgecausing anxiety
3, fear of consequences whenresponsible for others
Distress at seeing the person they areresponsible for suffering
Duty of care in professional role
Responsibility and/or care forothers causing distress and fearof consequences of not acting
4, inability to get on withdaily life
Anticipated impact on function – trying toavoid a problem
Impatience – less well-defined tasks – or doesthis go in PT6?
Concern about actual oranticipated impact on dailyactivities/functioning
5, need for immediate pain relief Widen to include other acute symptoms(e.g. panic attack/mental health symptoms)
Need for immediate reliefof intolerable/unbearablesymptoms (including pain)
6, waited long enough for thingsto improve
Help-seeking so far has not produced desiredoutcome so try going somewhere else (e.g. GPhas not resolved it)
Impatience, intolerance of waiting
Tipping point
Unwillingness to continuecurrent approach to managingsymptoms (waiting/self-care/help-seeking) due to lack ofresolution of the problem
7, stressful lives Needs to include lack of access to resources(e.g. car, support). This could link to time of dayin some cases
Wider lack of social support, not necessarilyincident-specific – impact on decision-making
Ongoing health worries increasing concern
Own illness affecting coping capacity andmanaging that of someone else
Mental health – additional stress. Can alsochange perception of seriousness PT1 if havehealth anxiety
Stressful work triggering symptoms and alsoneed for easy access to help
Lack of money – affects choice of service
Reduced coping capacity dueto physical and mental illness,stress and/or lack of access toresources
QUALITATIVE INTERVIEW STUDY OF DECISION-MAKING WITH THREE SUBGROUPS OF THE POPULATION
NIHR Journals Library www.journalslibrary.nihr.ac.uk
50

For parents and others in a caring role, the sense of responsibility can be understood partly in relationto Beck’s70 work on the Risk Society, where blame is avoided by acting responsibly, including in relationto health. Dingwall and Murray75 also highlight how children are considered as a different category ofpatient, with an accepted lower threshold for help-seeking. For those experiencing a range of stresses,which is seen in both the young adults and the social deprivation groups, including poor mental healthand social isolation, Antontovsky and Sagy’s89 work recognises how a lack of ‘generalised resistanceresources’ can have an impact on people’s ability to cope with additional challenges, including illness.The overall complexity of drivers, including both individual and contextual factors, is recognised inAndersen’s33 model of health-care utilisation, with later iterations increasingly acknowledging many ofthe social and structural influences on decision-making evident in interviewees’ accounts.
Link to wider literatureThe clear correspondences between our findings and the programme theories developed from therealist review inevitably mean that there is a significant overlap with the literature on which theprogramme theories are based. In particular, our findings support existing qualitative evidence thathighlights the influence of uncertainty about symptoms, fear of consequences when responsiblefor others, need for immediate pain relief, the impact of stressful lives, the advice of others, andperceptions and experiences of services. More recently published work suggests further overlap.
TABLE 6 Refinement of the programme theories based on the interviews (continued )
PT developed in WP1Suggested refinements or proposed newtheories from WP2 Suggested revisions
8, following the advice of trustedothers
Influence of social networks and norms
Support, encouragement and suggestions frompeers, rather than direct advice
Use of internet to obtain health advice andinformation
Directly or indirectly influencedby the advice or support ofothers, including socialnetworks, health-careprofessionals and internetsources
9, perceptions or priorexperiences of services
Can include use of GP for urgent care due topositive experience
reinforced by reassurance from healthprofessional that previous use was right
Or others’ perceptions – link to PT8
Awareness of other services – could expandPT9?
Perceptions, prior experiencesand/or awareness/knowledgeof services
10, frustration with access toa GP
Need to take account of the fact that some ofthem did go to GP
May have repeatedly tried to get appointment,or cannot wait long enough for routine appt
Frustration with inability toaccess an appropriate GPappointment
Location – potentially links to cost or otherresource issues – PT7 at least sometimes
Proximity or ease of access toparticular services
Timing, e.g. Friday, late at night – this links toPT7 and lack of support
Later in the day – no GP appointments left, orperception of PT9
Timing of event creatingperceived, actual or anticipatedunavailability of alternativeservices
Limited engagement with/confidence inmedication use
Lack of knowledge of and/orconfidence to use medication toself-manage symptoms
PT, programme theory.
DOI: 10.3310/hsdr08150 Health Services and Delivery Research 2020 Vol. 8 No. 15
© Queen’s Printer and Controller of HMSO 2020. This work was produced by O’Cathain et al. under the terms of a commissioning contract issued by the Secretary of Statefor Health and Social Care. This issue may be freely reproduced for the purposes of private research and study and extracts (or indeed, the full report) may be included inprofessional journals provided that suitable acknowledgement is made and the reproduction is not associated with any form of advertising. Applications for commercialreproduction should be addressed to: NIHR Journals Library, National Institute for Health Research, Evaluation, Trials and Studies Coordinating Centre, Alpha House,University of Southampton Science Park, Southampton SO16 7NS, UK.
51

Although focusing on different population subgroups, Pope et al.’s22 research found that perceived risk,anxiety and a need for reassurance were common motivations for accessing urgent care services.Similarly, Pope et al.22 also found a heightened sense of risk associated with children and babies,corresponding to Kai’s117 work, published over 20 years ago, which describes parents’ experiences ofmanaging young children’s acute illness. His findings identified parental worry about the nature ofsymptoms, the threat that these symptoms might pose to their child’s health and the responsibilitythat parents felt to keep their child safe, which mirror the accounts of parents in our study. Given thatwe found a number of qualitative articles focusing on children using GP out-of-hours services andpaediatric EDs in our review, we reflected on our additional contribution to knowledge for thissubgroup. We feel that we more clearly identified the difference between people’s behaviour withregard to their own health and their behaviour with regard to the health of their child, how problemswith children’s ongoing health creates an anxiety and unwillingness to wait, how a parent’s own illnesscan have an impact on their coping capacity, and the influence of family on decision-making. Inaddition, in the literature there is a general perception or experience of not being able to access GPappointments or of a dissatisfaction with GPs, but our inclusion of people accessing same-day GPappointments shows the ease of access for some parents of young children.
The evidence from the realist review showed how a range of social and psychological stressors couldhave an impact on individuals’ help-seeking, reducing their coping capacity and increasing their use ofemergency and urgent care. Although poor mental health was identified as one of these stressors,the findings from our interviews suggest that this specific issue was often more dominant and wasfrequently a significant driver of seeking care. Although interviewees’ overall physical and mentalhealth was not explored routinely during the interviews, a number described mental health symptomsfor which they were being treated or seeking treatment through their GP, and a very small numberreported more severe mental health problems. It was clear that, even for those whose problems wereless severe, their symptoms or associated reduced coping capacity were frequently a factor in theirhelp-seeking, although the problem for which they were seeking help was frequently a physical one.
Recent research supports our findings, identifying that those with a mental health diagnosis (classifiedas mild, moderate or severe) are more likely to use EDs than those without a diagnosis, with moresevere problems associated with more frequent visits.118 Other studies from the USA and Australiaidentify increases in both the absolute numbers and the proportion of ED use that were linked to mentalhealth problems,119–121 particularly in adolescents/young adults121–123 and those with lower incomes.119
Although most of this use is for problems requiring urgent attention, Hsia and Niedzwiecki124 alsoidentified that 6.8% of all ‘avoidable visits’ to US EDs were for mental health conditions, and that mooddisorders resulted in the highest proportion of avoidable visits by diagnostic grouping. In relation to theemergency ambulance service, two recent studies in the UK125 and Australia126 identified that approximately10% of calls are related to mental health problems. Both studies emphasise the need for alternativesolutions, particularly more community-based provision, transportation level of < 50% for those withless severe problems126 and high levels of re-attendance.125
Mental health problems have also been found to have an impact on levels of primary care use. Lockettet al.127 found that people with anxiety, depression or bipolar disorder were more likely to use primarycare in New Zealand but were also more likely to report having unmet needs and a less positiveexperience with their GP. Even among those without a diagnosed mental health problem, self-perceivedstress has been found to increase use of primary care, with higher stress levels associated with greaternumbers of people having visited their GP in the past year in a Danish population study.128 Notably, stresswas also associated with greater use of out-of-hours services and, among those with multimorbidity, withdecreased use of chronic care services. This reflects the findings from our interviews, suggesting thatpoor mental health can have am impact on help-seeking behaviour, even when not at a clinicallyrecognised level.
QUALITATIVE INTERVIEW STUDY OF DECISION-MAKING WITH THREE SUBGROUPS OF THE POPULATION
NIHR Journals Library www.journalslibrary.nihr.ac.uk
52

Convenience has been identified as a driver of navigating emergency and urgent care services.22,28
For example, an ED may be perceived as offering more availability or accessibility. Although there wassome evidence of this in our study, convenience did not appear to play a significant part in decision-makingamong our participants. It is possible that interviewees did not want to appear to be inappropriate users ofhealth care, but the researchers also perceived that convenience did not generally seem to be an importantconsideration. A far stronger driver of accessing ED services in our sample was the perceived lack ofaccess to primary care services. This is widely supported in the existing research literature, has beenshared in a patient perspective editorial34 and was evident in the recent NHS GP Patient Survey,129 inwhich around one in five patients (21.6%) reported that they had tried to contact an NHS service in theprevious 12 months when they had wanted to see a GP but could not because their general practicewas closed.
Strengths and limitationsA key strength of this part of the study is the collection of in-depth qualitative data eliciting driversof decision-making among three population subgroups that were identified as having a tendency for‘clinically unnecessary’ use of services. The inclusion in the study of three service settings, in particularsame-day GP appointments, also extends the existing literature in this area, which has until now focusedlargely on ED use, with limited material relating to use of emergency ambulance and GP services. Theprocess of data analysis, particularly the use of the principles of IPA, helped us to identify the complexityof the decision-making process. The findings highlight how, rather than being prompted by one singledriver, an individual’s decision both to seek care and to use a particular service to obtain it is influencedby the interaction of multiple drivers. Providing insights into this complexity is vital in understanding andaddressing ‘clinically unnecessary’ use.
We encountered a number of difficulties with recruitment that had an impact on the compositionof the final sample. Most significantly, despite extending recruitment by a number of months, werecruited considerably fewer participants from the ambulance service than originally planned. Studyset-up meetings led us to feel confident that we could recruit our relatively small sample from the largepool of patients calling the ambulance service and receiving telephone advice only. Initial engagementby staff at the ambulance services was also encouraging, but lessened in one service over time. Staffreported that pressures of demand on the service (we attempted to recruit between the months ofNovember 2017 and June 2018) were a barrier to recruitment, and the lack of a researcher presentregularly on site is also likely to have affected engagement with the study. To address the lower levelsof recruitment via this route, we also recruited a few patients at the ED who had been conveyed byambulance but whose transportation had been considered unnecessary by ED staff. We also encountereddifficulties in recruiting in both the ED and the GP setting in Wolverhampton and, because of timepressure, had to recruit more than half of the overall sample in Sheffield. As a result, it has not beenpossible to make comparisons between two operationally different emergency and urgent care systems.
The study recruitment processes meant that the majority of participants were recruited between 09:00and 18:00, with recruitment from only the emergency ambulance service occurring 24/7 (i.e. 24 hoursper day, 7 days per week). An attempt to recruit at the ED during the weekend was not successful, andwe did not attempt to recruit from this setting overnight. Therefore, there may be some differencesbetween our interviewees and those using the services at other times of the day. For example, the lackof availability of other services or a reduction in social support at night may have an impact on thelevels of anxiety that drive help-seeking.
Participants in the qualitative research were not aware that they had been included in the study becausethey had been identified as ‘clinically unnecessary’ users of a health service; our interest was in thedecision-making that led to this contact. This approach was recommended by PPI members and approvedby the ethics committee. To have been explicit about this with participants at the recruitment phase mayhave had an impact on the study in two ways. First, it may have had a negative impact on recruitmentif potential participants felt that they had been perceived as using health services inappropriately.
DOI: 10.3310/hsdr08150 Health Services and Delivery Research 2020 Vol. 8 No. 15
© Queen’s Printer and Controller of HMSO 2020. This work was produced by O’Cathain et al. under the terms of a commissioning contract issued by the Secretary of Statefor Health and Social Care. This issue may be freely reproduced for the purposes of private research and study and extracts (or indeed, the full report) may be included inprofessional journals provided that suitable acknowledgement is made and the reproduction is not associated with any form of advertising. Applications for commercialreproduction should be addressed to: NIHR Journals Library, National Institute for Health Research, Evaluation, Trials and Studies Coordinating Centre, Alpha House,University of Southampton Science Park, Southampton SO16 7NS, UK.
53

Second, if recruited participants felt that they were being labelled as ‘clinically unnecessary’ users, thismay have affected their openness during the interviews, and, subsequently, the integrity of the data.The presence of the interviewer and the topic being discussed may have affected interviewees’ responses,prompting them to offer more socially acceptable reasons for their decision-making to avoid being judged.This may have been particularly evident for parents wanting to present themselves as ‘good parents’ whowere doing the ‘right thing’ for their child. Although this cannot be ruled out, the researchers did not feelthat it was an issue during the interviews.
Interviewees were recruited for their membership of a particular subgroup, but a significant number alsobelonged to one or even both of the other subgroups. For instance, eight young adults were also livingin areas of deprivation, four of whom were parents. This means that there is some overlap betweenthe subgroups. However, analysis was conducted both on those recruited to a particular subgroup andon those who had the characteristic of that subgroup, and this was not found to significantly influencethe findings.
ImplicationsThe programme theories identified in WP1 were clearly apparent in the three subgroups, and werefined some programme theories based on the interviews reported in this chapter. The drivers werelargely similar across the subgroups but there were differences between subgroups in the strength ofthe drivers. This implies that potential interventions may need to be different for population subgroups.
QUALITATIVE INTERVIEW STUDY OF DECISION-MAKING WITH THREE SUBGROUPS OF THE POPULATION
NIHR Journals Library www.journalslibrary.nihr.ac.uk
54
Chapter 5 Interventions to addressdrivers of ‘clinically unnecessary’ use
Aim
Our aim was to identify patients’ views about potential interventions to reduce ‘clinically unnecessary’ useof emergency and urgent services. The term ‘intervention’ in this context means any initiative that couldchange decision-making about health service use, including reconfiguration of or changes to the deliveryof services as well as campaigns to increase knowledge and awareness of services and service use.
Methods
The design was a focus group study with patients identified as ‘clinically unnecessary’ users to identify,discuss and prioritise potential interventions.We held three focus groups, one with each subgroup.Wesupplemented findings from the focus groups with analysis of recommendations for service improvementsmade by interviewees during individual interviews (see Chapter 4).We reviewed these findings in the lightof recommendations for interventions made in the qualitative literature included in the realist review(see Chapter 3).
SampleOwing to logistical challenges with recruitment and organisation, we recruited focus group participantsin Sheffield only. We considered potential participants eligible if they had been identified as ‘clinicallyunnecessary’ users of an urgent or emergency care service and were a member of one of the threesubgroups identified for the interviews: parents of young children, young adults and people living inareas of deprivation. We used two approaches to recruit participants. First, as the discussion aboutinterventions during the interviews had been very brief, we invited the interviewees to take part in thefocus groups. We approached all of the interviewees to determine their interest in taking part in a focusgroup. We sent participant information sheets and consent forms to those who expressed an interest(see the project web page: www.journalslibrary.nihr.ac.uk/programmes/hsdr/1513612/#/; accessed5 February 2020). Once a date and time had been set, we contacted the participant to confirm theiravailability and attendance. Second, to broaden the range of perspectives, we also sought to recruitadditional patients considered to have made ‘clinically unnecessary’ use of an ED. This was donedifferently depending on the subgroup, as outlined below. We aimed to recruit a total of 24 participants(eight in each group), but owing to recruitment difficulties we were able to recruit only 15 participants.
Additional parents were recruited at Sheffield Children’s Hospital. This was done by a researcher (LBE)attending the hospital on 4 days, totalling approximately 19 hours. Additional people in the young adultand social deprivation subgroups were recruited at the Northern General Hospital ED, with recruitmentfor both groups taking place at the same time. This was done by a researcher (JL) attending the hospitalon 4 occasions for a total of approximately 25 hours.
Data collectionTo develop the topic guide for the focus groups, two researchers (EK and LBE) reviewed the interviewtranscripts, particularly the responses to a concluding question about the changes in service provisionthat participants would like to see to make it easier to access health care (see the project web page:www.journalslibrary.nihr.ac.uk/programmes/hsdr/1513612/#/; accessed 5 February 2020). The topicguide was structured in two sections. In the first section, questions encouraged a general discussionabout positive and negative perceptions and experiences of the emergency ambulance service, the ED
DOI: 10.3310/hsdr08150 Health Services and Delivery Research 2020 Vol. 8 No. 15
© Queen’s Printer and Controller of HMSO 2020. This work was produced by O’Cathain et al. under the terms of a commissioning contract issued by the Secretary of Statefor Health and Social Care. This issue may be freely reproduced for the purposes of private research and study and extracts (or indeed, the full report) may be included inprofessional journals provided that suitable acknowledgement is made and the reproduction is not associated with any form of advertising. Applications for commercialreproduction should be addressed to: NIHR Journals Library, National Institute for Health Research, Evaluation, Trials and Studies Coordinating Centre, Alpha House,University of Southampton Science Park, Southampton SO16 7NS, UK.
55
and the GP. In the second section, participants were invited to offer and discuss potential reasons forusing particular services and to suggest interventions or alternatives that might help individuals todecide to use a different, lower-acuity service or to try self-care. In this section, the focus was onparticipants’ views of how others in their subgroup (i.e. parents of young children or young adults)might respond rather than on their own individual behaviour. The exception to this was the socialdeprivation group, as noted below. Focus groups lasted approximately 2.5 hours, including a breakfor refreshments.
The parents focus group was held at a university building on a weekday morning; this time was basedon a consensus from potential participants and to allow parents to take older children to school ifnecessary. The young adults focus group was held at a university building in the late afternoon/earlyevening of a weekday; this time was selected to suit the participants’ commitments, primarily work orstudy. The focus group of people from socially deprived communities was held in a university buildingon a weekday morning to suit the participants’ availability. As participants were not aware that theirinclusion was on the basis of their IMD score, the discussion explored participants’ own views and theirperceptions of the wider population, rather than asking specifically about people living in sociallydeprived communities.
Two experienced female researchers facilitated each focus group (EK and JL/LBE). Refreshments wereoffered on arrival, and participants completed and signed consent forms (see the project web page:www.journalslibrary.nihr.ac.uk/programmes/hsdr/1513612/#/; accessed 5 February 2020). Oneresearcher (EK) facilitated each focus group, keeping the discussion on track and probing further whenappropriate. The other researcher (JL/LBE) supported this process by taking notes and joining thediscussion if she felt that a particular aspect of the discussion could be expanded on. The discussionwas digitally recorded. Detailed notes were made during each focus group about the interventions thatparticipants highlighted during discussion. Towards the end of discussion, these interventions wereshared with the group, who were asked if they could prioritise the interventions that they consideredwere most likely to change decision-making among those in their specific subgroup.
Data analysisFollowing each focus group, the assistant moderator created a document based on the notes madeduring the discussion, in particular the specific positive and negative points relating to each service:ED, GP and out-of-hours provision, WIC, emergency ambulance service, NHS 111 and pharmacies. Inaddition, the interventions identified and prioritised by the focus group participants in the second partof the discussion were written up and, as the purpose of the focus groups was to identify specificinterventions that could change decision-making, this list of recommendations and priorities formedthe primary data for the analysis. These topics formed the themes for the analysis, and, owing to thenature of the data, formal coding within NVivo was not undertaken. Each focus group recording wasalso transcribed verbatim and checked by a member of the team prior to analysis. The transcripts wereread by the researchers and used to support or challenge the analysis of the primary data, and toidentify illustrative quotations. Analysis was undertaken by two researchers (EK and JL), initially foreach focus group and then across the three groups, exploring the similarities and differences in theirrecommendations and priorities in relation to each service and other wider interventions. Thisinformation was then used to identify issues and recommendations specific to each service, and inrelation to education, awareness and support.
Inclusion of data from interviewsDuring the interviews (see Chapter 4), interviewees referred to difficulties that they experienced orperceived in using different health services. They also identified specific changes in service provisionthat might make it easier for them to access health care differently. Although this did not specificallyfocus on interventions to encourage interviewees to change their choice of service, it did identify barriersto using particular services that could influence their decision-making process. All data relating to thistopic were coded in NVivo to an overarching code of ‘Interventions which may have changed the
INTERVENTIONS TO ADDRESS DRIVERS OF ‘CLINICALLY UNNECESSARY’ USE
NIHR Journals Library www.journalslibrary.nihr.ac.uk
56
decision-making’, with a number of specific subcodes also identified. Researchers reviewed this codeto identify areas of concern, with the data divided by subgroup and by service. Twenty-four participantsmade one or more recommendation: 10 parents, nine young adults and five interviewees from sociallydeprived communities. These recommendations were used to supplement the data from the focusgroups rather than be considered as a separate source; there was considerable overlap in the findingsat least partly because the majority of focus groups participants had also participated in the interviews.
Reporting guidelinesWe completed the COREQ reporting guidelines.116
Findings
Five parents took part in the first focus group; three had taken part in an interview and two had beenrecruited specifically for the focus group. Six young adults took part in the second focus group; fourhad taken part in an interview and two had been recruited specifically for the focus group. Five peopleliving in socially deprived communities were booked to attend the third focus group, but one did notarrive and could not be contacted, so four people took part in the discussion. Three had taken part inan interview and one had been recruited specifically for the focus group. Sociodemographic details arereported in Appendix 7, Table 19.
Parents of young children subgroupRecommendations made by this group were tailored more to their particular situation (i.e. as parents)than those that were made by the other two groups, and often focused on child-specific service changes.
Changes in service provisionThe group viewed improvements to GP provision as key, which was also echoed in the interview data.Better availability of GP appointments was a key priority, with interview participants identifying anumber of specific suggestions, including more weekend, early morning and evening appointments,quicker access to appointments for non-urgent problems (i.e. within a few days rather than a numberof weeks) and the ability to book appointments further ahead (e.g. 2–3 months). Focus group parentsalso considered that there should be prioritisation of urgent appointments for children, a pointechoed by interview participants, who variously suggested specific appointments, telephone calls ordrop-in sessions for children. Six-monthly GP appointments for children were also suggested, providingregular opportunities to discuss health concerns, gain knowledge and reassurance, and build a helpfulrelationship with an expert in child health.
In relation to accessing appointments, the group described diverse experiences, with some reportingthat their GP ‘always sees my children on that day’ [focus group (FG) P3] and others describing thefrustration of repeatedly trying to book an appointment:
They tell you to call at 8:30 for my GP. You call, by the time it’s 9 o’clock they’ll be like ‘Oh sorry, we’reout of . . . appointments’ and then, they’re all ‘Call in tomorrow’ you do the same thing for the wholeweek and then I’m like ‘Oh yeah . . . can I book it for next week?’ and they’ll be like ‘Oh no, there’s noappointments, call in on the day’. It’s just always ‘Call in on the day’ [agreement from group] and younever find one.
P4, parent, FG
Interview participants echoed these frustrations, which were heightened by the fact that the phone-intime was often when they were taking children to school. Suggestions for improvement included anonline or app-based booking system for same-day GP appointments and/or call-back requests, andthe ability to book an urgent appointment for the next day rather than have to telephone repeatedlyeach morning.
DOI: 10.3310/hsdr08150 Health Services and Delivery Research 2020 Vol. 8 No. 15
© Queen’s Printer and Controller of HMSO 2020. This work was produced by O’Cathain et al. under the terms of a commissioning contract issued by the Secretary of Statefor Health and Social Care. This issue may be freely reproduced for the purposes of private research and study and extracts (or indeed, the full report) may be included inprofessional journals provided that suitable acknowledgement is made and the reproduction is not associated with any form of advertising. Applications for commercialreproduction should be addressed to: NIHR Journals Library, National Institute for Health Research, Evaluation, Trials and Studies Coordinating Centre, Alpha House,University of Southampton Science Park, Southampton SO16 7NS, UK.
57

Recognising that parents’ sense of urgency, combined with the lack of access to GP appointments, mayprompt them to use the ED, locating a GP service at the ED was recommended, allowing non-urgentproblems to be dealt with via another route, which would also reduce demand on local GPs. Thespecialist skills available in the ED were also seen to be a significant driver of parents’ decision-making,particularly in the context of there being a children’s hospital in the city, with one parent observingthat ‘if your kids are seen by a paediatrician, a specialist (. . .) I feel more you know, more safe’ (P1 FG).Therefore, the group recommended introducing specialist GPs for children, based either in a generalpractice or in a WIC, suggesting that parents’ greater confidence in the skills of these professionalscould reduce their perceived need to use the ED. This suggestion was also made by an interviewparticipant who did not take part in the focus group, and this seems to have been based on theirexperience in their country of origin. Interview participants also highlighted the need for betterinformation about how to access urgent GP appointments out of hours or when no same-day GPappointments are available, together with increasing out-of-hours capacity to avoid attending anED because of lack of GP appointments.
Focus group parents identified a number of other service changes that could potentially reduce thepressure that GPs were under. An increased role for pharmacists was suggested, including offeringfollow-up appointments. Some parent-specific changes to the WIC were also identified, many of whichfocused on minimising the length of the visit when bringing young children for treatment. Theseincluded having a priority system for children, having a separate WIC for children, reducing waitingtimes and introducing an appointment system to avoid the need to sit in a waiting room with an illchild for long periods. The location of the current WIC was seen as problematic, with the groupsuggesting that a more child-friendly location, and the introduction of local centres rather than onecentral service, could encourage greater use. Interview participants also recommended an increase inthe number of WICs, enabling people to drop in and guarantee being seen at a convenient location.
More broadly, the group saw increased support, particularly for first-time parents, as essential,including more proactive engagement by health visitors and other community services, and offeringparenting lessons in schools. The group also felt that there was a need to improve patient experienceacross the services and highlighted that a specific priority should be to offer language assistance atother services apart from the ED, as this could be a significant determinant of where to seek help:
. . . I don’t think they had anybody that would translate at certain GPs but in the A&E there’s alwayssomebody (. . .) ‘cause there’s Somali doctors and there’s so many different doctors and nurses, so I thinkthat’s why A&E’s more helpful.
P4, parent, FG
Education/awarenessImproving publicity about the alternatives to emergency and urgent care was seen as important,including promoting the GP out-of-hours service; encouraging the use of NHS 111 and emphasising itsvalue in increasing parents’ health knowledge; and highlighting the knowledge, training and skills ofpharmacists and their role in offering advice:
Explain what advice and what they [pharmacists] can actually offer advice on. Do they know aboutrashes? Do they know about different temperatures? Do they know about the actual symptoms of whatmy child is getting? Or do they – I don’t really know what they can fully offer, apart from just generaladvice on ‘Do I use this medicine or do I use this medicine?’
P3, parent, FG
Promoting the services offered by family centres was also seen as important in facilitating access toadditional resources to help parents gain the skills and confidence to manage their children’s health.
INTERVENTIONS TO ADDRESS DRIVERS OF ‘CLINICALLY UNNECESSARY’ USE
NIHR Journals Library www.journalslibrary.nihr.ac.uk
58
Young adults subgroup
Changes in service provisionThe key service priority identified by this group was the need to significantly improve mental healthprovision, a concern that may have been driven by at least half of the group having experiencedsignificant mental health problems, as well as the prevalence of such issues in their friendship groups.Improvements in the range, quality and speed of access to mental health services were seen asimportant aspects of this, with the current gaps in provision leaving people with no option but to useother services, particularly at times of crisis. Lack of appropriate mental health support was also seen tohave an impact on decision-making about physical illness, making them likely either to inappropriatelydelay seeking help or to ‘panic and try to grab out for every service’ (FG P12). In this context, thegroup suggested that a specific mental health ED should be introduced to provide urgent specialistsupport and advice, significantly improving patients’ experience and reducing pressure on the main ED(which patients are currently advised to use in crisis):
. . . it doesn’t seem like maybe the best use of the time for the people in A&E because they can’t really doanything really that practical to help, but also the person who’s feeling that way to be sat in there forhow many hours to just go home again at the end of it.
P10, young adult, FG
Better support for mental health distress was also highlighted by interview participants, whoemphasised the need to improve the quality and speed of access to mental health services, and howthe current lack of provision contributed to increased use of the ED. The need for a more sympatheticresponse from clinical and reception general practice staff over the telephone was also suggested,together with clearer information on how to access immediate support.
Reflecting the concerns raised by parents, easier access to GP appointments was highlighted asimportant in encouraging people to reduce their use of the ED, with more availability of appointmentsoutside working hours (i.e. early mornings, evenings and weekends) being a particular issue:
I think my GP does one day, where it’s like a late opening I think. But that’s no good if they’re all bookedup, so then it’s like you’re going back into the week cycle aren’t you, waiting for the next appointment.
P13, young adult, FG
Interview participants also focused on the need for improvements to GP provision, including havingextended opening hours, more same-day appointments and shorter waiting times for non-urgentappointments, introducing drop-in sessions and using a triage system to prioritise urgent cases. Atext-reminder system for medication reviews was seen as valuable in preventing urgent appointments.
A number of uses of online technology were proposed by this focus group. One GP-related initiativewas the establishment of an online database of GP appointments available across the city, whichwould allow people to travel to another practice to access a convenient appointment:
(. . .) particularly if younger people are more able to travel around that if they could somehow make,sharing of notes a little bit easier, and maybe people could, opt to travel to get an appointment, ratherthan going to their same GP and also it prevents, empty appointments going wasted [agreement].
P12, young adult, FG
Other proposed online interventions included improving the accessibility of GP services by usingSkypeTM (Microsoft Corporation, Redmond, WA, USA) or online GP consultations, although not all ofthe interviewees favoured this option. Views were also mixed on other internet-based consultation
DOI: 10.3310/hsdr08150 Health Services and Delivery Research 2020 Vol. 8 No. 15
© Queen’s Printer and Controller of HMSO 2020. This work was produced by O’Cathain et al. under the terms of a commissioning contract issued by the Secretary of Statefor Health and Social Care. This issue may be freely reproduced for the purposes of private research and study and extracts (or indeed, the full report) may be included inprofessional journals provided that suitable acknowledgement is made and the reproduction is not associated with any form of advertising. Applications for commercialreproduction should be addressed to: NIHR Journals Library, National Institute for Health Research, Evaluation, Trials and Studies Coordinating Centre, Alpha House,University of Southampton Science Park, Southampton SO16 7NS, UK.
59

services, particularly in terms of potential health and privacy/confidentiality risks. However, extendingNHS 111, a service known to be credible, to include an online chat facility was seen as having thepotential to increase use of this service, particularly among younger people, although the detailedquestioning process was identified as a barrier by some.
Young adults taking part in interviews also made suggestions relating to other services, although thesewere a small proportion of the total. As in the parents group, increasing the number of local WICs wasseen as important in improving access to this service. Additionally, co-locating GP and ED provisionwas recommended, which would enable people to be readily transferred to the service mostappropriate to meet their needs.
Education/awarenessThe importance of education and awareness raising was a key focus in this group, with significantlymore recommendations relating to this rather than to changes in service provision. There was a strongfeeling that many people, including young adults, were unaware of the services available and whatthese can offer, thus making appropriate decision-making difficult. In particular, the group consideredthat raising awareness of the range and scope of alternative services, including NHS 111, MIUs, WICsand pharmacies, was a key priority:
I think a lot of the problem is people don’t know these things exist, or don’t know what they’re for, and sothey know A&E exists, they know something’s wrong, they just go to A&E because it’s probably fine. Somepeople I think are under the impression that you can’t walk in to A&E, that you have to be ambulanced inso the only way to get to A&E is by ambulance. And I just feel like there needs to be more education andpublicity and, ‘These things exist, here’s how you can access them [pauses] there you go’.
P10, young adult, FG
Promoting NHS 111 on social media, in television adverts and by other routes was recommended,including gaining celebrity endorsement. Interview participants also echoed the need for greaterpublicity of NHS 111. Those in the focus group emphasised the importance of placing publicity innon-clinical locations, noting that ‘most posters about medical services are in the hospital when youare already waiting for one service’ (P15 FG), at which point it is too late to inform people. Specifically,they recommended promoting MIUs as an alternative to the ED, focusing on locations where peopleare more likely to need this service such as gyms or sports facilities. Increasing awareness of theskills and knowledge of pharmacists, and promoting their role in providing advice, was also highlightedas important in potentially reducing GP use in particular. Specifically, the group recommended that GPsand other practice staff advise patients whose needs could have been addressed by pharmacistsabout this option for future consultations.
Considering the issue on a wider level, the group felt that there was a need for education aroundwhat constitutes an emergency or urgent health problem, as this lack of understanding obviously hasan impact on people’s decision-making. The importance of beginning the process of education inschools was emphasised, in terms of informing children about what should be considered anemergency and about the appropriate use of different health services:
P12 FG: I think like the more we’ve talked about it the more like educating in school seem the mostplausible [agreement] because we keep going, ‘Oh, more publicity, more publicity’ there’s only so muchmoney in the NHS anyway and it’s, you can’t just throw it out for every single service all the timecan you?
P11 FG: It’s just starting people young isn’t it? [agreement] getting them educated.
INTERVENTIONS TO ADDRESS DRIVERS OF ‘CLINICALLY UNNECESSARY’ USE
NIHR Journals Library www.journalslibrary.nihr.ac.uk
60
An app or another online resource to help decision-making was also seen as a key tool to supportchange in service use, helping people decide on when and how to use different services:
(. . .) mainly directing to the right kind of place. Like if there could be some sort of red flag system of like,‘Oh you’ve got that symptoms, that’s serious’. You know for people who’ve got a cold and like automaticallyworry that they’ve maybe got meningitis or something, like some sort of, ‘Have you got any of these threesymptoms that would indicate meningitis?’ [agreement] OK, you do? Then yes, you do need a GPappointment. Yes, you do need to go to A&E.
P10, young adult, FG
Addressing the problem of inappropriate use, the group suggested raising awareness of the cost ofservice use and missed appointments, and explored the issue of penalties for misuse, although theyacknowledged the difficulties that prevented this being a viable option. Finally, encouraging people totake more responsibility for their own health was emphasised, as this would ultimately lead to lessservice use overall. Returning to the concern around mental health, the group felt that improvingmental health literacy was a priority, enabling people to identify and address their symptoms beforethey need urgent or emergency help.
Social deprivation subgroup
Service provisionIn common with the other subgroups, accessibility and availability of GP appointments was highlightedas a key priority in changing decision-making. In relation to access, a number of participants reporteddifficulties in either getting through to their practice to make an appointment or being able to access atimely appointment once they did get through to their practice, leaving them feeling that they had nooption but to use another service:
You either go there or you wait to phone your GP then you don’t get through so in the end you go toA&E. Then you’re getting worse so you might as well just go.
P9, social deprivation, FG
Reflecting the concerns raised by young adults, both the focus group and the interview participantsemphasised the need for more appointments outside normal office hours and greater availability ofappointments within a few days of making contact, rather than the current dichotomy of same-dayappointments or waiting several weeks. Summing up a problem experienced by many, one interviewparticipant highlighted how this dichotomy prompted her to leave things until they became urgentrather than book an appointment for some weeks ahead, by which time the problem may have resolved.Interview participants focused almost exclusively on issues relating to general practice and made a widerange of suggestions for improvement, including having drop-in appointments for children; reviewingthe current same-day appointment booking system, including offering the option to book a next-dayurgent appointment rather than having to telephone each day; being able to book appointments inperson rather than over the telephone, which was important for those not confident about speakingEnglish; having greater continuity of care from an individual GP; being able to speak directly to a doctorabout a problem rather than communication being mediated by reception staff; having priorityappointments for elderly people; and removing the triage system so that appointments could beallocated on request rather than being based on potentially inaccurate information.
One recommendation made in the focus group to reduce the use of GPs was increasing theprescribing role of pharmacists, which could particularly have an impact on those who obtain theirprescriptions free of charge:
. . . it sounds really mercenary but some of time, because I get my prescriptions free, I’m over 60, I thinkI’m going to pharmacist but then, whatever they prescribe you, you’ve got to pay for. And you can go to
DOI: 10.3310/hsdr08150 Health Services and Delivery Research 2020 Vol. 8 No. 15
© Queen’s Printer and Controller of HMSO 2020. This work was produced by O’Cathain et al. under the terms of a commissioning contract issued by the Secretary of Statefor Health and Social Care. This issue may be freely reproduced for the purposes of private research and study and extracts (or indeed, the full report) may be included inprofessional journals provided that suitable acknowledgement is made and the reproduction is not associated with any form of advertising. Applications for commercialreproduction should be addressed to: NIHR Journals Library, National Institute for Health Research, Evaluation, Trials and Studies Coordinating Centre, Alpha House,University of Southampton Science Park, Southampton SO16 7NS, UK.
61

your doctor and you can get on prescription and I know that sounds really awful (. . .) but that is one ofthings that goes through me mind (. . .) I’m sure it would be for a lot of these people who are, if they’re onbenefits they get free prescriptions anyway don’t they but I certainly think that is a stumbling block forsome people, ‘Why should I pay when I can get it free?’
P8, social deprivation, FG
Improvements to the consultation space in pharmacies were also seen as essential in this context,with privacy being a particular concern.
Although NHS 111 was valued, and promoting it more widely was seen as a priority, changes toimprove the NHS 111 service were considered a prerequisite. In particular, echoing concerns raised byyoung adults, the group felt that there was a need to streamline the assessment process, with staffable to access patients’ clinical records so that they could avoid the lengthy questioning that currentlydiscouraged people from using the service:
I think where it’s fallen down is, there’s a boring, protracted rigmarole whereby you’ve got to speak tosomebody for 10 minutes and give your details and your favourite colour and everything before you canactually get to the point of the call. If they, you know, streamlined that service and made it more efficientthen I think that would be a viable option.
P7, social deprivation, FG
Similarly, although increasing the number of WICs was recommended, there was a perception that the skilland specialism of practitioners based in them needed to be improved if people were to have sufficientconfidence in this service for it to become an alternative to the ED. Combining the accessibility of WICswith the quality of GP services was also identified by interview participants.
Perhaps reflecting poorer availability of their own transport, access was a key concern in this group,potentially driving the recommendation to co-locate a wide range of services within a number of localcentres, such as the ED, WICs, MIUs, general practices and baby clinics.
. . . instead of just having one central minor injuries, whatever, A&E, you know, Sheffield’s a big city, peoplehave to travel from really far places, you know, so we could have something as (name) said east, west,north and south (. . .) So it would be really good to have something like that around the city where youhave so many services at one building.
P9, social deprivation, FG
However, the group also highlighted the widespread confusion about the range and scope of differentservices available, and the consequent difficulty of making an informed decision. Rather than promotingthis diversity, one suggestion was to significantly simplify provision to offer only the familiar, more clearlydelineated services of the GP and ED and thereby reduce the complexity of decision-making.
Education and awarenessAs noted in the previous section, the group considered it a priority to address the widespreadconfusion about when and how different services should be used, in particular by raising awareness ofwhat each health service can offer, including the type and severity of conditions it can deal with, andwhen and how it can be accessed. In particular, the need to raise awareness of the NHS 111 servicewas emphasised to enable it to be promoted as an alternative source of advice when a GP appointmentcould not be accessed, with one participant observing:
. . . there’s only four of us and we’ve all got individual ideas. Like to me it’s just an out-of-hours service. Iwouldn’t dream of calling it [NHS 111] in the day, if your GP’s open (. . .) We’ve all got such different, it’sjust amazing for such a small group (. . .) So if four of us have got our own opinions, you can imagine what40 would have. So it certainly needs something to get people a lot more aware of.
P8, social deprivation, FG
INTERVENTIONS TO ADDRESS DRIVERS OF ‘CLINICALLY UNNECESSARY’ USE
NIHR Journals Library www.journalslibrary.nihr.ac.uk
62

Promoting the role of pharmacies was also mentioned. Echoing comments made by the young adults’group, the need to raise awareness about service use in non-clinical locations was highlighted, ratherthan this being done at a point when individuals had already made a decision about where to seek care:
. . . it seems like closing the stable door after the horse has bolted because you’re already there (. . .) butalso a lot of people are worried when they’re in waiting rooms and I don’t think it’s necessarily the besttime to be reading things. I mean you’re not at your most perceptive, when you’re about to go into anappointment that you’re concerned about, so I think that more needs to be done to get people beforethey’re in that situation.
P7, social deprivation, FG
Concern and frustration were also expressed about the misuse of services, prompting the group torecommend greater education to encourage people to take responsibility for managing their health,and to also consider applying penalties to ‘repeat offenders’, although the highly problematic natureof this was also acknowledged.
Overview of findings by serviceAlthough the analysis focused on exploring the perspectives of the different subgroups, it became clearthat there was significant overlap in their recommendations relating to particular services and approaches.We drew diagrams to clearly identify these areas of overlap and the distinctive perspectives of eachsubgroup (see Figures 4–7). The largest number of recommendations related to changes in general practice.Figure 4 highlights how all three subgroups emphasised that improving access to GP appointmentswas key to reducing the use of higher-acuity services, and each group also made at least one otherrecommendation. Figure 5 highlights how WICs were discussed in some detail, with both parents andparticipants from socially deprived areas making recommendations.
Other services were discussed in less detail, but there was a consensus across the groups that therewas a need to better promote services that could provide alternatives to the emergency ambulanceservice, ED or urgent GP appointments. In particular, all groups highlighted raising awareness of therole of pharmacists and encouraging the use of NHS 111 as part of a broader recommendation topublicise and clarify the scope of each service and how and when it can be accessed. As can be seen inFigure 6, education and raising awareness was a shared area of concern, but a particular focus amongthe young adults subgroup.
ParentsYoung adultsSocial deprivationGeneral
practice
Specialist GPsfor children
Prioritise urgentappointment for
children
Improved availability of GPappointments, including
extended opening hours andmore apppointments within
a few days
Access to available GPappointments at other
practices in the city
Skype/onlineconsultants
6-monthlyappointments
for children
Improvements to appointmentbooking process, including easierto get through on the telephone
FIGURE 4 Interventions recommended related to general practice. Bold outlines denote the priority recommendation.
DOI: 10.3310/hsdr08150 Health Services and Delivery Research 2020 Vol. 8 No. 15
© Queen’s Printer and Controller of HMSO 2020. This work was produced by O’Cathain et al. under the terms of a commissioning contract issued by the Secretary of Statefor Health and Social Care. This issue may be freely reproduced for the purposes of private research and study and extracts (or indeed, the full report) may be included inprofessional journals provided that suitable acknowledgement is made and the reproduction is not associated with any form of advertising. Applications for commercialreproduction should be addressed to: NIHR Journals Library, National Institute for Health Research, Evaluation, Trials and Studies Coordinating Centre, Alpha House,University of Southampton Science Park, Southampton SO16 7NS, UK.
63

The final area of intervention around which there was considerable shared interest was the need toencourage and support people to take responsibility for managing their own and their family’s health.As shown in Figure 7, both young adults and parents of young children had a number of specificrecommendations relating to this topic.
Discussion
Summary of findingsParticipants in the focus groups and interviews presented a clear picture of their experiences andviews about emergency and urgent care services, and what action could be taken to increase the useof alternative services. Although each subgroup focused their concerns on specific issues and needs,there were also many areas of agreement about where interventions should be focused. In particular,for parents of young children, services needed to offer quick access and have appropriate knowledge
ParentsYoung adultsSocial deprivation
Priority treatmentof children
Introduce an appointmentssystem to avoid long wait
with ill child
More parent- andchild-friendly locations
Improve skill level andspecialism of staff
Co-locate range of serviceswithin centre,
e.g. WIC, ED, GP, MIU
More centres in local areasrather than just a single
central one – improve access
Separate children’sWIC
WICs
FIGURE 5 Interventions recommended related to WICs. Bold outlines denote the priority recommendation.
ParentsYoung adultsSocial deprivation
Education about difference betweenurgent/emergency/minor
Education in schools about healthseeking decision-making and
service use
Decision-making app to helpwith service choice for different
symptoms
GPs to advise use of pharmacistafter ‘inappropriate’ consultation
Educationand
awareness
Increase awarenessof how much
services cost to run
Promote familycentres and what
they offer
Use of social mediato promote services
Targeting health information innon-clinical settings
Promotion of alternative services,including how and when to use them:
NHS 111, pharmacists, WIC, MIU, GP OOH
FIGURE 6 Interventions recommended related to education and awareness. Bold outlines denote the priorityrecommendation. OOH, out of hours.
INTERVENTIONS TO ADDRESS DRIVERS OF ‘CLINICALLY UNNECESSARY’ USE
NIHR Journals Library www.journalslibrary.nihr.ac.uk
64
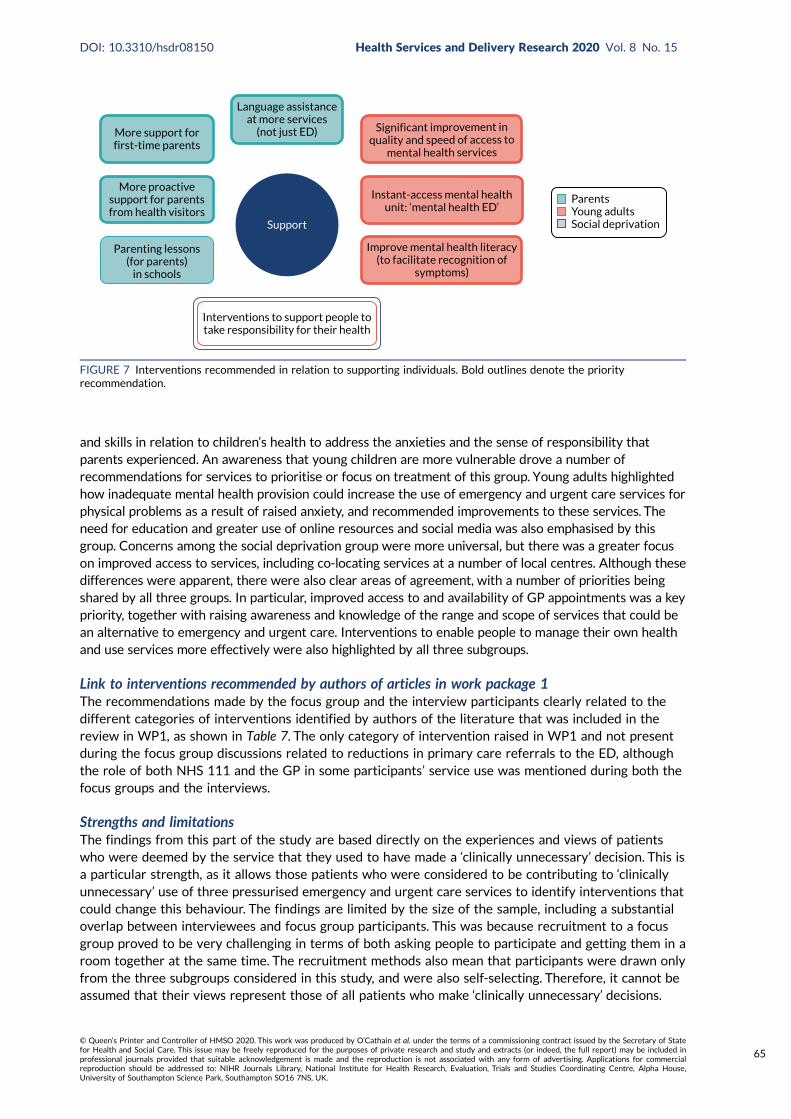
and skills in relation to children’s health to address the anxieties and the sense of responsibility thatparents experienced. An awareness that young children are more vulnerable drove a number ofrecommendations for services to prioritise or focus on treatment of this group. Young adults highlightedhow inadequate mental health provision could increase the use of emergency and urgent care services forphysical problems as a result of raised anxiety, and recommended improvements to these services. Theneed for education and greater use of online resources and social media was also emphasised by thisgroup. Concerns among the social deprivation group were more universal, but there was a greater focuson improved access to services, including co-locating services at a number of local centres. Although thesedifferences were apparent, there were also clear areas of agreement, with a number of priorities beingshared by all three groups. In particular, improved access to and availability of GP appointments was a keypriority, together with raising awareness and knowledge of the range and scope of services that could bean alternative to emergency and urgent care. Interventions to enable people to manage their own healthand use services more effectively were also highlighted by all three subgroups.
Link to interventions recommended by authors of articles in work package 1The recommendations made by the focus group and the interview participants clearly related to thedifferent categories of interventions identified by authors of the literature that was included in thereview in WP1, as shown in Table 7. The only category of intervention raised in WP1 and not presentduring the focus group discussions related to reductions in primary care referrals to the ED, althoughthe role of both NHS 111 and the GP in some participants’ service use was mentioned during both thefocus groups and the interviews.
Strengths and limitationsThe findings from this part of the study are based directly on the experiences and views of patientswho were deemed by the service that they used to have made a ‘clinically unnecessary’ decision. This isa particular strength, as it allows those patients who were considered to be contributing to ‘clinicallyunnecessary’ use of three pressurised emergency and urgent care services to identify interventions thatcould change this behaviour. The findings are limited by the size of the sample, including a substantialoverlap between interviewees and focus group participants. This was because recruitment to a focusgroup proved to be very challenging in terms of both asking people to participate and getting them in aroom together at the same time. The recruitment methods also mean that participants were drawn onlyfrom the three subgroups considered in this study, and were also self-selecting. Therefore, it cannot beassumed that their views represent those of all patients who make ‘clinically unnecessary’ decisions.
ParentsYoung adultsSocial deprivation
Language assistanceat more services
(not just ED)More support forfirst-time parents
More proactivesupport for parentsfrom health visitors
Parenting lessons(for parents)
in schools
Interventions to support people totake responsibility for their health
Improve mental health literacy(to facilitate recognition of
symptoms)
Instant-access mental healthunit: ‘mental health ED’
Significant improvement inquality and speed of access to
mental health services
Support
FIGURE 7 Interventions recommended in relation to supporting individuals. Bold outlines denote the priorityrecommendation.
DOI: 10.3310/hsdr08150 Health Services and Delivery Research 2020 Vol. 8 No. 15
© Queen’s Printer and Controller of HMSO 2020. This work was produced by O’Cathain et al. under the terms of a commissioning contract issued by the Secretary of Statefor Health and Social Care. This issue may be freely reproduced for the purposes of private research and study and extracts (or indeed, the full report) may be included inprofessional journals provided that suitable acknowledgement is made and the reproduction is not associated with any form of advertising. Applications for commercialreproduction should be addressed to: NIHR Journals Library, National Institute for Health Research, Evaluation, Trials and Studies Coordinating Centre, Alpha House,University of Southampton Science Park, Southampton SO16 7NS, UK.
65
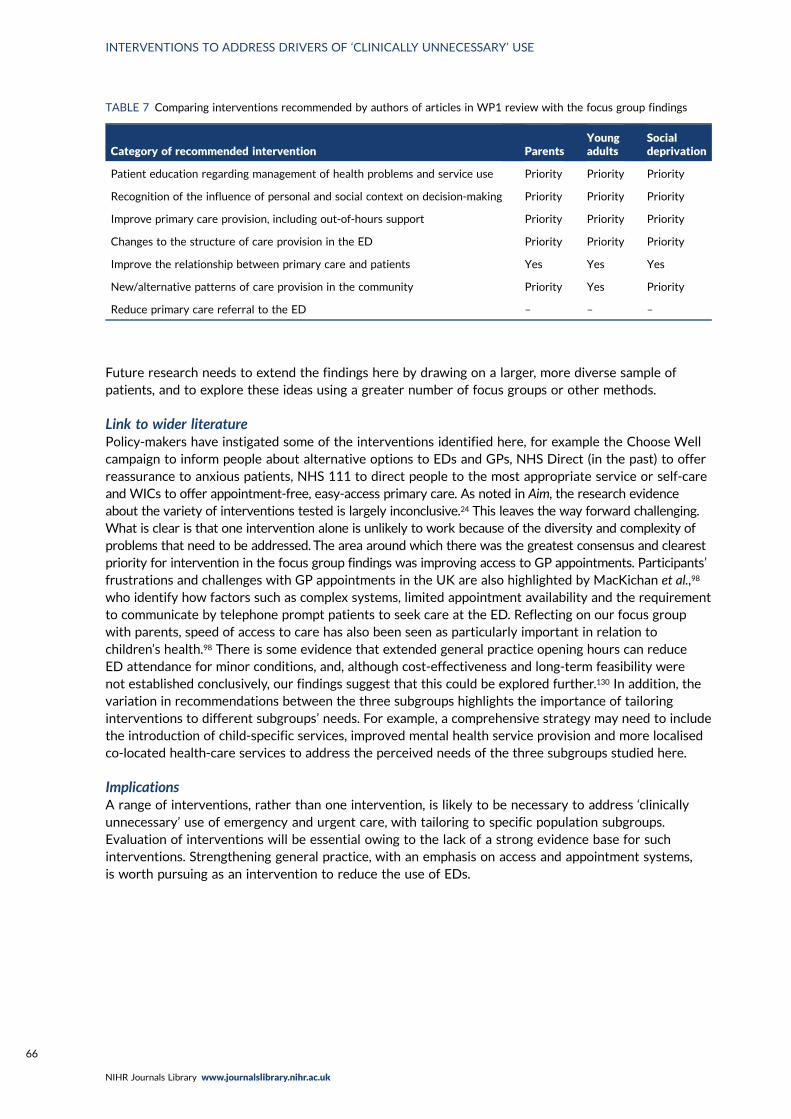
Future research needs to extend the findings here by drawing on a larger, more diverse sample ofpatients, and to explore these ideas using a greater number of focus groups or other methods.
Link to wider literaturePolicy-makers have instigated some of the interventions identified here, for example the Choose Wellcampaign to inform people about alternative options to EDs and GPs, NHS Direct (in the past) to offerreassurance to anxious patients, NHS 111 to direct people to the most appropriate service or self-careand WICs to offer appointment-free, easy-access primary care. As noted in Aim, the research evidenceabout the variety of interventions tested is largely inconclusive.24 This leaves the way forward challenging.What is clear is that one intervention alone is unlikely to work because of the diversity and complexity ofproblems that need to be addressed. The area around which there was the greatest consensus and clearestpriority for intervention in the focus group findings was improving access to GP appointments. Participants’frustrations and challenges with GP appointments in the UK are also highlighted by MacKichan et al.,98
who identify how factors such as complex systems, limited appointment availability and the requirementto communicate by telephone prompt patients to seek care at the ED. Reflecting on our focus groupwith parents, speed of access to care has also been seen as particularly important in relation tochildren’s health.98 There is some evidence that extended general practice opening hours can reduceED attendance for minor conditions, and, although cost-effectiveness and long-term feasibility werenot established conclusively, our findings suggest that this could be explored further.130 In addition, thevariation in recommendations between the three subgroups highlights the importance of tailoringinterventions to different subgroups’ needs. For example, a comprehensive strategy may need to includethe introduction of child-specific services, improved mental health service provision and more localisedco-located health-care services to address the perceived needs of the three subgroups studied here.
ImplicationsA range of interventions, rather than one intervention, is likely to be necessary to address ‘clinicallyunnecessary’ use of emergency and urgent care, with tailoring to specific population subgroups.Evaluation of interventions will be essential owing to the lack of a strong evidence base for suchinterventions. Strengthening general practice, with an emphasis on access and appointment systems,is worth pursuing as an intervention to reduce the use of EDs.
TABLE 7 Comparing interventions recommended by authors of articles in WP1 review with the focus group findings
Category of recommended intervention ParentsYoungadults
Socialdeprivation
Patient education regarding management of health problems and service use Priority Priority Priority
Recognition of the influence of personal and social context on decision-making Priority Priority Priority
Improve primary care provision, including out-of-hours support Priority Priority Priority
Changes to the structure of care provision in the ED Priority Priority Priority
Improve the relationship between primary care and patients Yes Yes Yes
New/alternative patterns of care provision in the community Priority Yes Priority
Reduce primary care referral to the ED – – –
INTERVENTIONS TO ADDRESS DRIVERS OF ‘CLINICALLY UNNECESSARY’ USE
NIHR Journals Library www.journalslibrary.nihr.ac.uk
66

Chapter 6 Survey of general population
Introduction
Population attitudes and beliefs can shape the use of emergency and urgent care services. For example,leading researchers have concluded that policies to reduce demand for emergency ambulances need toaddress population opinions and attitudes,1 and researchers have attempted to reduce demand forambulances by using mass media campaigns to change population attitudes and behaviour.131
Researchers have undertaken population surveys to explore population attitudes towards emergencyand urgent health services.132 They sometimes use vignettes within these population surveys to identifythe characteristics of those who have a tendency to make ‘clinically unnecessary’ use of emergency andurgent health services.6,133,134
Aim and objectives
Our aim was to explore population attitudes and beliefs about seeking urgent care. The objectives were:
1. to measure the prevalence of population perceptions of seeking urgent care, and how these vary indifferent circumstances, and by different population subgroups
2. to identify the characteristics of people with a tendency to make ‘clinically unnecessary’ use ofemergency and urgent care using vignettes.
Methods
British Social Attitudes SurveyThe design was a cross-sectional general population survey undertaken by NatCen. NatCen conductsan annual survey in Britain, the British Social Attitudes Survey, to measure social attitudes. It designsthe survey to yield a representative sample of adults aged ≥ 18 years.
In 2018, NatCen undertook a multistage design in three stages. First, it selected 395 postcode sectors,with probability proportional to the number of addresses in each sector. Prior to selection, all sectorswere stratified by region, population density and percentage owner-occupied. These sectors coveredGreat Britain but not Northern Ireland, which is part of the UK. Second, it selected 26 addresses ineach sector to produce 10,270 addresses. Third, interviewers called at each address and listed all thoseaged ≥ 18 years before randomly selecting one adult to interview. For practical reasons, the samplewas confined to those living in private households, thus excluding people living in institutions. In 2018,the sample was divided into four parts, with each part (of around 1000 respondents) being nationallyrepresentative in its own right. The University of Sheffield used funding from the National Institute forHealth Research (NIHR) to purchase a set of questions in three parts of the survey, that is, a samplesize of around 3000. We chose this sample size because it offered sufficient statistical power forsubgroup analyses.
The main mode of administration was face-to-face computer-assisted interview. Before an interviewer calledat an address, a letter was sent to each selected household informing residents that an interviewer wouldvisit and giving an unconditional financial incentive of a voucher. Interviewers then visited and completedmost of the questionnaire face to face. A minority of questions were asked through a self-completedquestionnaire, which was then collected by the interviewer or posted by the respondent. Data collectionwas undertaken from July to November 2018.
DOI: 10.3310/hsdr08150 Health Services and Delivery Research 2020 Vol. 8 No. 15
© Queen’s Printer and Controller of HMSO 2020. This work was produced by O’Cathain et al. under the terms of a commissioning contract issued by the Secretary of Statefor Health and Social Care. This issue may be freely reproduced for the purposes of private research and study and extracts (or indeed, the full report) may be included inprofessional journals provided that suitable acknowledgement is made and the reproduction is not associated with any form of advertising. Applications for commercialreproduction should be addressed to: NIHR Journals Library, National Institute for Health Research, Evaluation, Trials and Studies Coordinating Centre, Alpha House,University of Southampton Science Park, Southampton SO16 7NS, UK.
67

Developing the questionnaireIn 2018, the full British Attitudes Survey questionnaire covered a range of topics, such as attitudes towelfare, health, housing and education. Sociodemographic questions that were asked as part of thewider questionnaire were available for analysis in our study. We purchased a 60-item module exploringpopulation views of seeking urgent care. The module used language that members of the public couldunderstand, asking about seeking help for ‘unexpected health problems that were not life-threatening’.Items included three pairs of vignettes, questions related to the 10 programme theories from WP1 andattitudes towards the use of emergency and urgent care services. The module was based on findingsfrom the WP1 realist review, literature about the use of emergency and urgent care in general, earlyfindings from the WP2 qualitative study and a workshop with 13 members of the public at whichpotential questions were presented and discussed in small groups (see the next section). NatCenundertook two consecutive pilots of draft questionnaires on around 50 members of the public prior tofinalising the questionnaire.
Patient and public involvement workshopIn the original proposal we planned to develop the content of the questionnaire at a PPI event with20 members of the public; we held an event in January 2018. The event was designed to provide feedbackon some of the questions that we were intending to use as part of the survey, and on the health literacyinstruments that we were considering incorporating into the questionnaire. We publicised the event viaexisting PPI networks and on flyers placed in a variety of locations, including the local WIC and EDwaiting rooms. The flyers identified the purpose of the event (to contribute to development of contentof a national survey), the date and venue of the event, and that attendees would receive refreshmentson the day along with a £30 shopping voucher. We invited interested members of the public to contacta researcher (EK) to obtain further details about the event. We asked those who confirmed that theywould attend a small number of demographic questions to allow us to include a diverse range of people.Twenty members of the general public confirmed their attendance. On the night before the event,heavy snowfall occurred, and this resulted in fewer people at the event than anticipated. Thirteenmembers of the general public spent a day looking at different sections of the proposed questionnaire.A member of the research team (EK, AOC, LBE) facilitated discussion in three smaller groups. In eachgroup, people tried to complete sections of the draft questionnaire and then discussed the content.We tested two ways of measuring health literacy. The conclusions included:
l Our planned way of measuring health literacy was off-putting because it felt like a test. An alternative,measuring subjective views of health literacy, was preferred.
l People did not like the use of names in vignettes and were frustrated by the lack of information inthe vignettes, but also liked the shorter vignettes.
l People were concerned that asking why they ticked ‘go to an ED’ for the vignettes would make thisstand out as an option and alter later vignette answers.
l People did not like having a long list of questions to complete using the same response set andasked us to use shorter sets of questions.
We redrafted the questionnaire after this event and sent it to NatCen for piloting.
Questionnaire contentA copy of the final questionnaire is available on the project web page (www.journalslibrary.nihr.ac.uk/programmes/hsdr/1513612/#/; accessed 5 February 2020). There were four sets of questions:
1. sociodemographic characteristics2. vignettes to measure tendency to use higher-acuity services than clinically necessary3. ten programme theories from the WP1 realist review4. other issues from the literature influencing ‘clinically unnecessary’ demand.
SURVEY OF GENERAL POPULATION
NIHR Journals Library www.journalslibrary.nihr.ac.uk
68
Sociodemographic characteristicsNatCen collect a range of characteristics of respondents within the British Social Attitudes Survey.We considered the effects of:
l sociodemographics – age, sex, ethnicity, region, household with children aged < 5 years, deprivationas measured using the IMD, social class and rurality
l resources – car ownership and access to internetl health – long-term limiting illness and general health
Deprivation and rurality were not asked about in the questionnaire but were added to our data set byNatCen from background information held for sampling purposes.
VignettesVignettes used in emergency and urgent care population surveys have varied in terms of whether theyfocus on a third party or ask an individual to say what they would do, the amount of detail in thevignettes, and the potential seriousness of the problems addressed within them.6,134,135 For example,some focus on chest pain and finding a lump,135 whereas others focus on less serious issues of an anklesprain/bruise on leg after a fall and a child with a cold.6
In the proposal we said that we would construct three vignettes: one in which care is neededimmediately from an urgent care service (e.g. NHS 111, GP in hours same day, GP out of hours, WIC),one in which care is needed from a GP within a few days for a non-urgent problem and one in whichself-care could be undertaken. In practice we constructed three pairs of vignettes, with a half of thesample receiving the same three vignettes. This allowed us to assess the effect of different symptomsand different times at which events occurred. We constructed these vignettes with clinical input fromSteve Goodacre, who is an academic ED consultant, and Jon Dickson, who is an academic GP. Our PPImembers and attendees at our large PPI event commented on the evolving versions of these vignettes.
We focused the vignettes on minor health problems. We identified a pair of illness vignettes with anexpected action of self-care or pharmacy. We identified use of an emergency ambulance, ED or GP as‘clinically unnecessary’:
l Illness 1: imagine you have had a cough and sore throat for 3 days.l Illness 2: imagine you have had diarrhoea and vomiting for 2 days.
We identified a pair of injury vignettes where we expected respondents to contact a GP, contact anurgent care service such as an urgent care centre or a MIU, self-care or use a pharmacy. We identifieduse of an emergency ambulance or ED as ‘clinically unnecessary’:
l Injury 1: imagine you have fallen and have a very painful rib. It is 8.30 in the evening.l Injury 2: imagine you have had back pain for 2 weeks and have not been able to sleep.
We identified a pair of child vignettes where we expected respondents to contact a GP in or out ofhours, contact an urgent care service such as a WIC, self-care or use a pharmacy. We identified use ofan emergency ambulance or ED as ‘clinically unnecessary’:
l Child 1: imagine your young child or a young child in your care has a high temperature and criedthroughout yesterday and last night. Today, which is a Saturday, you do not think the child has improved.
l Child 2: imagine your young child or a young child in your care has a high temperature and criedthroughout yesterday and last night.Today, which is aWednesday, you do not think the child has improved.
We explored these symptoms on the NHS Choices website and this validated our conclusions about theclinically recommended actions to take. In the case of all of these symptoms, NHS Choices confirmed theyare unlikely to be serious and that self-care is usually adequate.We show summaries of the advice offeredby NHS Choices in Appendix 8. The response options offered for each vignette are shown in the questionnaire
DOI: 10.3310/hsdr08150 Health Services and Delivery Research 2020 Vol. 8 No. 15
© Queen’s Printer and Controller of HMSO 2020. This work was produced by O’Cathain et al. under the terms of a commissioning contract issued by the Secretary of Statefor Health and Social Care. This issue may be freely reproduced for the purposes of private research and study and extracts (or indeed, the full report) may be included inprofessional journals provided that suitable acknowledgement is made and the reproduction is not associated with any form of advertising. Applications for commercialreproduction should be addressed to: NIHR Journals Library, National Institute for Health Research, Evaluation, Trials and Studies Coordinating Centre, Alpha House,University of Southampton Science Park, Southampton SO16 7NS, UK.
69

available on the project web page (www.journalslibrary.nihr.ac.uk/programmes/hsdr/1513612/#/; accessed5 February 2020). In the proposal we said that if a respondent selected an emergency service we would askwhy. However, attendees at our wider PPI event and NatCen expressed concern about this because it mighthave alerted respondents to what was considered to be a right or wrong answer.
Ten programme theories from work package 1 realist reviewWe included questions to measure aspects of the 10 programme theories identified in WP1.We struggledto construct questions that measured some of the programme theories (see Results, Description ofprogramme theories).
Other influencesSome issues in the literature did not become programme theories but we felt that they were importantenough to be included in the questionnaire:
l Awareness of services because it appeared in articles in the review.l Recursivity, in that patients learn to attend services because services have sanctioned previous
decisions,68 because it is a relatively new issue identified in emergency care literature.l Health literacy because it is a relatively new issue identified in the emergency care literature. In the
proposal we highlighted that researchers in the USA were studying the effect of low health literacyon ED use and developing interventions to address this.136 Although health literacy is associatedwith social class and educational attainment, 29% of people attending EDs for non-urgent issueshave a college education and low health literacy.137 We explored the use of two validatedinstruments to assess health literacy: Newest Vital Sign (NVS) and HLQ. We had originally intendedto use the NVS in the first pilot because Duell et al.138 undertook a systematic review of measuringhealth literacy in a clinical environment and found that using the NVS was the most acceptableapproach. We identified an alternative because of concerns expressed by NatCen about NVS. TheHLQ was developed and validated in Australia139 and consists of nine domains of health literacy. Weselected two five-item domains most relevant to our study: domain 6, ‘ability to actively engage withhealth-care providers’ (we labelled this ABILITY), and domain 9, ‘understand health information wellenough to know what to do’ (we labelled this UNDERSTAND). Its strengths were that it addressedtwo aspects of health literacy and was preferred over the NVS at the PPI event, and the attendeesat the wider PPI event found it very easy to complete.
We also wanted to take account of the following:
l Recent use of health care because people recently using a service may be more likely to base theiranswers on experience. We used the question from the General Practitioner Patient Survey 2017140
and adapted it to ask about emergency ambulance and ED use as well as general practice.l Beliefs about overuse of services because we were interested in whether or not the population
shared views about ‘clinically unnecessary’ use of services.
Analysis
WeightingNatCen uses a robust sampling and weighting method, with weights applied for unequal selectionprobabilities and non-response and then calibration weights. Therefore, it enables analysts to makegeneralisations to the population at large. NatCen produced separate weights for interviewer-administeredquestions and self-completed questions because of differential response rates:
l We used both unweighted and weighted data when presenting descriptions of variables and simplebivariate analyses.
l We used unweighted data in the logistic regressions because we could not undertake this typeof regression in SPSS (IBM Corporation, Armonk, NY, USA) or Stata (Stata Press, College Station,TX, USA) using weights.
SURVEY OF GENERAL POPULATION
NIHR Journals Library www.journalslibrary.nihr.ac.uk
70

Description of attitudes and tendencyWe summarised the responses to questions to display the prevalence of population attitudes. Thisincluded a summary of responses to each pair of vignettes, comparing responses to show how differentcharacteristics, such as symptoms, age and day of the week, affected tendency.
Differences by subgroupsWe compared items related to the 10 programme theories by different sociodemographic characteristicsusing chi-squared tests. We limited this testing to variables related to the three subgroups from WP2(young adults, parents of young children, deprivation levels) and a subgroup identified commonly in ourprogramme theories in WP1 (presence of chronic conditions).
Explaining the tendency to make ‘clinically unnecessary’ use of servicesWe considered fitting a multinomial model comparing ambulance, ED and GP use with pharmacy/self-care, but were concerned about the difficulty of interpreting the results of multinomial analyses.Instead, we undertook a logistic regression on a series of binary comparisons. We considered thetendency to make ‘clinically unnecessary’ use of six health services: emergency ambulance, ED adults,ED children, ED all, GP and any service. We divided ED into adult and child because of the radicallydifferent answers to the child and adult vignettes. We wanted to do this for the ambulance analysisalso, but the numbers were too small. We created binary variables based on whether or not therespondents chose ‘clinically unnecessary’ options in the vignettes. In the proposal, we planned tomeasure the proportion of people selecting a higher or lower level of care recommended for eachscenario. In practice we selected only a higher level of care because of our focus on ‘clinicallyunnecessary’ demand.
We undertook a logistic regression comparing those ticking ‘clinically unnecessary’ options for a vignettewith those who did not. We used SPSS version 25. First, we conducted a univariate analysis on each ofthe binary tendency outcomes, testing 54 independent variables. We then tested only the significantindependent variables in a complete-case multivariable logistic regression using backwards eliminationwith a cut-off point of 0.05 for selection.We calculated the number of events per variable: the number ofevents divided by the number of degrees of freedom required to represent all of the variables in the model.The events per variable need to be at least 10 and preferably 20 for reliable parameter estimation. If fewerthan this, there is an increased risk of overfitting of the models. Backwards elimination has advantagesover forward selection when variables are correlated.141 We collapsed some categories of some variablesfor the regression where numbers were small. We present odds ratios and 95% confidence intervals (CIs).
Once we had our final multivariable regressions we tested for multicolinearity by calculatinggeneralised variance inflation factors using the statistical package R (The R Foundation for StatisticalComputing, Vienna, Austria). We could not use SPSS because this software calculates variance inflationfactors for linear regressions only. The variance inflation factors for each of the six regressions rangedfrom 1 to 1.7, well within the limit of < 5, indicating that multicolinearity was not at play.
We took the final multivariate regressions and tested whether or not the results depended on whichvignettes were completed. We tested interactions between factors in each final regression and the twosamples that completed different vignettes (cough/rib/Saturday and vomiting/back/Wednesday).
Missing dataAs the number of missing data was small (apart from the missing values for self completion questions),missing data were treated as missing and no methods of imputation were used. However, in somecases, missing data were recoded as a category ‘missing’ to increase the sample size in the analysis.
Reporting guidelinesWe completed the STROBE (STrengthening the Reporting of OBservational studies in Epidemiology)reporting guidelines.142
DOI: 10.3310/hsdr08150 Health Services and Delivery Research 2020 Vol. 8 No. 15
© Queen’s Printer and Controller of HMSO 2020. This work was produced by O’Cathain et al. under the terms of a commissioning contract issued by the Secretary of Statefor Health and Social Care. This issue may be freely reproduced for the purposes of private research and study and extracts (or indeed, the full report) may be included inprofessional journals provided that suitable acknowledgement is made and the reproduction is not associated with any form of advertising. Applications for commercialreproduction should be addressed to: NIHR Journals Library, National Institute for Health Research, Evaluation, Trials and Studies Coordinating Centre, Alpha House,University of Southampton Science Park, Southampton SO16 7NS, UK.
71

Results
Response rate and non-response biasThe overall survey response was 42%, with 2906 respondents completing our module during face-to-faceadministration. In total, 79% of those interviewed returned the self-completed part of the questionnaire,that is, 2309 individuals. There was non-response bias for the self-completion questionnaire compared withthe face-to-face interview. People from black, Asian and minority ethnic (BAME) groups, people with fewereducational qualifications and people with lower levels of political interest were less likely to return it.
Description of respondentsWe describe respondents in Table 8. We show the distribution of respondents based on both weightedand unweighted data. Among the subgroups relevant to our study (see WP2), 169 respondents wereaged 18–24 years, 300 respondents were living in households with children aged < 5 years (a proxy forparents of young children) and 576 were living in the most deprived quintile.
TABLE 8 Characteristics of the survey sample (unweighted and weighted)
VariableNumbers (%)unweighted Weighted (%) Source Numbers missing
Age group (years)
18–24 169 (5.8) 11 IA 5
25–34 384 (13.2) 17
35–44 467 (16.1) 16
45–54 469 (16.1) 18
55–64 508 (17.5) 16
65–74 499 (17.2) 13
≥ 75 405 (13.9) 10
Sex
Male 1257 (43.3) 48 IA –
Female 1649 (56.7) 52
Ethnicity
White origin 2572 (88.5) 85 IA –
BAME 334 (11.5) 15
Region
North 474 (16.3) 16 IA –
Midlands 796 (27.3) 25
South 957 (32.9) 32
London 395 (13.6) 14
Wales 132 (4.5) 5
Scotland 264 (9.1) 9
Households with children aged < 5 years
0 2591 (89.6) 88 IA 15
≥ 1 300 (10.4) 12
Social class
I 214 (7.6) 7.5 IA 92
II 1039 (36.9) 36
III (non-manual) 569 (20.2) 21
SURVEY OF GENERAL POPULATION
NIHR Journals Library www.journalslibrary.nihr.ac.uk
72

Description of vignette responsesEach respondent completed three vignettes. Respondents could tick more than one option when answeringeach vignette. All options are shown in Table 9. Those ticking more than one option were asked which wouldbe their first action. A minority of respondents selected more than one option (between 12% and 27%,depending on the vignette). Self-care was a commonly selected first option when ticking more than oneoption for some of the vignettes: 60% for the cough vignette, 44% for the diarrhoea and vomiting vignetteand 25% for the injuries vignettes. Calling NHS 111 was a common first option when ticking more thanone option for the child vignettes: 38% for the Saturday vignette and 23% for the Wednesday vignette.
TABLE 8 Characteristics of the survey sample (unweighted and weighted) (continued )
VariableNumbers (%)unweighted Weighted (%) Source Numbers missing
III (manual) 416 (14.8) 15
IV/V 524 (18.6) 19
Armed forces 52 (1.8) 2
Social deprivation (IMD quintiles)
1 (most deprived) 576 (19.8) 22 IA –
2 545 (18.8) 20
3 536 (18.4) 18
4 638 (22.0) 20
5 (affluent) 611 (21.0) 20
Urban–rural categorisation
Urban 2241 (77.1) 80 IA –
Rural 665 (22.9) 20
Access to internet
Yes 2542 (87.5) 91 IA –
No 364 (12.5) 9
Car ownership
0 428 (14.7) 13 IA 995 not asked butincluded in variableas not known
≥ 1 1478 (50.9) 52
Not known 1000 (34.4) 35
Long-term limiting illness
None 1766 (60.8) 64 IA –
Non-limiting 586 (20.2) 19
Limiting 541 (18.6) 16
Don’t know, refusal 13 (0.4) 0.4
General health
Excellent 223 (9.7) 11 SC 597
Very good 725 (31.4) 31
Good 799 (34.6) 35
Fair 360 (15.6) 15
Poor 163 (7.1) 6
Can’t choose/not answered 39 (1.7) 2
IA, interviewer administered; SC, self-completed.
DOI: 10.3310/hsdr08150 Health Services and Delivery Research 2020 Vol. 8 No. 15
© Queen’s Printer and Controller of HMSO 2020. This work was produced by O’Cathain et al. under the terms of a commissioning contract issued by the Secretary of Statefor Health and Social Care. This issue may be freely reproduced for the purposes of private research and study and extracts (or indeed, the full report) may be included inprofessional journals provided that suitable acknowledgement is made and the reproduction is not associated with any form of advertising. Applications for commercialreproduction should be addressed to: NIHR Journals Library, National Institute for Health Research, Evaluation, Trials and Studies Coordinating Centre, Alpha House,University of Southampton Science Park, Southampton SO16 7NS, UK.
73

TABLE 9 Percentages of population selecting options for different vignettesa
Option selected
Adult illness, n (%) Adult injury, n (%) Child illness, n (%)
Any,(N= 2906)b
n (%)Cough(N= 1471)
Diarrhoeaand vomiting(N= 1435)
Sore rib(N= 1471)
Back pain(N= 1435)
Saturday(N= 1471)
Wednesday(N= 1435)
Call 999 for an ambulance 4 (0.3) 22 (1.5) 79 (5) 13 (1) 129 (9) 120 (8) 328 (11)
Go to A&E 17 (1.2) 73 (5) 366 (25) 89 (6) 504 (34) 445 (31) 1216 (42)
Contact a GP includingGP OOH
320 (22) 641 (45) 174 (12) 1001 (70) 417 (28) 718 (50) 1972 (68)c
Another NHS service(e.g. pharmacist)
262 (18) 260 (18) 278 (19) 247 (17) 354 (24) 270 (19) 1223 (42)
Call urgent telephonehelpline, NHS 111
42 (3) 229 (16) 326 (22) 93 (6) 439 (30) 302 (21) 1088 (37)
Self-care 1026 (70) 693 (48) 379 (26) 279 (19) 45 (3) 43 (3) 1882 (65)
None of these options 45 14 71 30 8 16 160
Refusal/don’t know/missing 10 7 11 8 18 13 34
Percentage of respondentsticking ‘clinicallyunnecessary’ options
23% 49% 30% 7% 42% 37% 64%
OOH, out of hours.a Based on unweighted data.b Multiple options could be selected so percentages add to > 100.c Some of these are included in any service analysis.Bold indicates ‘clinically unnecessary’ options selected.
When identifying respondents with a tendency to seek ‘clinically unnecessary’ care, we selected thoseticking a service used at any point in their help-seeking rather than their first option.
Propensities for taking different actions differed by vignette (see Table 9). Tendency varied bysymptom, and to some extent by time: cough (23%), diarrhoea and vomiting (49%), rib (30%), back pain(7%), child illness on a Saturday (42%) and child illness on a Wednesday (37%). The key findings were:
l The two adult illness vignettes had different responses. The ‘clinically unnecessary’ options wereambulance service, ED and GP. Diarrhoea and vomiting resulted in a much higher tendency for ‘clinicallyunnecessary’ use than a cough (49% vs. 23%). This was the case for all services: ambulance, ED and GP.
l The two adult injury vignettes also had different responses. The ‘clinically unnecessary’ options wereambulance service and ED. Sore rib resulted in a much higher tendency for ‘clinically unnecessary’ usethan back pain (30% vs. 7%). The need for an X-ray may have been in people’s minds when respondingto the rib vignette, even though NHS Choices says that an X-ray may not be needed (see Appendix 8).
l The two child vignettes resulted in surprisingly similar answers. The ‘clinically unnecessary’ optionswere ambulance service and ED. The difference between the percentage of respondents ticking‘clinically unnecessary’ options for the Saturday and Wednesday vignettes was 42% versus 37%,with respondents more likely to try another service or call NHS 111 on a Saturday.
l The proportion of ‘clinically unnecessary’ use was considerably higher among responses to the childvignettes than among responses to the adult ones, with considerable use of emergency ambulancefor the child vignettes (8% to 9%). This fits with our programme theory ‘fear of consequences whenresponsible for others’ (see WP1) and our qualitative research showing that parents feel highanxiety about symptoms in children (see WP2).
l Calling NHS 111 was a commonly chosen option: between 3% and 30% of respondents ticked thisoption depending on the vignette.
l Only a small proportion of respondents (5%) ticked a ‘clinically unnecessary’ option for all threevignettes that were presented to them. We had considered undertaking a logistic regression on thisgroup, but the numbers were too small.
SURVEY OF GENERAL POPULATION
NIHR Journals Library www.journalslibrary.nihr.ac.uk
74
Description of programme theoriesOperationalising some of the programme theories was difficult, but the variables used to explore eachprogramme theory are shown Table 10. The key findings for each programme theory were:
l Programme theory 1, uncertainty and anxiety about seriousness. We asked two questions toaddress this programme theory. Fourteen per cent of respondents were very likely to worry thatpain was a sign of something serious and 4% were not confident about deciding when to see adoctor and when to self-care. The latter question had a large number of missing values because itwas self-completed.
l Programme theory 2, previous traumatic event. We asked one question to address this programmetheory. Twenty-four per cent of respondents had not gone to the doctors at first for a previousproblem and it had turned out to be serious.
l Programme theory 3, responsibility for others. We measured this by asking about adult and childvignettes and showed that respondents had a higher tendency select ‘clinically unnecessary’ optionsin response to the child vignettes. We could not include this in the logistic regressions later in theanalysis so this programme theory was not tested further.
l Programme theory 4, need to get back to normal functioning/daily living. We asked three questionsrelated to this programme theory. There was strong support for this programme theory in that anincreasing percentage of people would contact a doctor or nurse immediately depending onwhether or not and how a health problem affected daily activities, from 9% if the problem was notaffecting daily activities to 67% if it was affecting an ability to attend to responsibilities of lookingafter family or going to work. There was an issue about how to represent this in the logisticregressions. We decided not to use these three variables in the logistic regression but to computetwo new variables from these three questions to identify people who would contact a doctor ornurse only if they lost sleep or if they could not fulfil their responsibilities around family or work.
l Programme theory 5, need for pain relief. We asked three questions about whether or notrespondents would worry if a problem was serious if they had pain, whether or not they would seeka doctor urgently if they were in pain, and whether or not they would take medication if in pain.None of these questions directly addressed the issue of seeking care for pain relief. We felt that thefirst question measured programme theory 1, uncertainty and anxiety about seriousness of theproblem, so we included it in programme theory 1. On reflection, we felt that the second questionwas too generic and might simply be another way of measuring tendency to make ‘clinicallyunnecessary’ use of services. Eighteen per cent of respondents reported that they would be unlikelyto take medication for that pain. We used this variable with the rationale that people who did nottake medication might seek pain relief from services.
l Programme theory 6, delayed long enough. We asked one question to address this, concerningwhether or not people wanted to see a doctor straight away once they had made the decision toget help; 22% of respondents strongly agreed with this. On reflection, we had concerns about theextent to which this question addressed the programme theory because it did not include delayingseeking health care. We decided not to use it in the logistic regression because we felt that it wasmeasuring a more generic issue than the one we had tried to measure.
l Programme theory 7, stressful lives leading to difficulty coping and need for low-burden services.We asked two sets of questions to address this programme theory. The first focused on stress andability to cope, and the second focused on the burden attached to seeking care. We asked threequestions about stressful lives and coping: 14% of respondents felt overwhelmed when faced withan unexpected health problem, 10% generally found their lives very stressful, and 12% probably hadno one to look after them if they were ill. Two of these questions had a large number of missingvalues owing self-completion. We asked six questions related to burden of seeking care and foundthat, for example, 36% preferred services without appointments.
l Programme theory 8, compliance with family or friends. We asked one question about how likelypeople would be to check with family or friends about the action that they should take; 19% ofrespondents were very likely to do this.
DOI: 10.3310/hsdr08150 Health Services and Delivery Research 2020 Vol. 8 No. 15
© Queen’s Printer and Controller of HMSO 2020. This work was produced by O’Cathain et al. under the terms of a commissioning contract issued by the Secretary of Statefor Health and Social Care. This issue may be freely reproduced for the purposes of private research and study and extracts (or indeed, the full report) may be included inprofessional journals provided that suitable acknowledgement is made and the reproduction is not associated with any form of advertising. Applications for commercialreproduction should be addressed to: NIHR Journals Library, National Institute for Health Research, Evaluation, Trials and Studies Coordinating Centre, Alpha House,University of Southampton Science Park, Southampton SO16 7NS, UK.
75
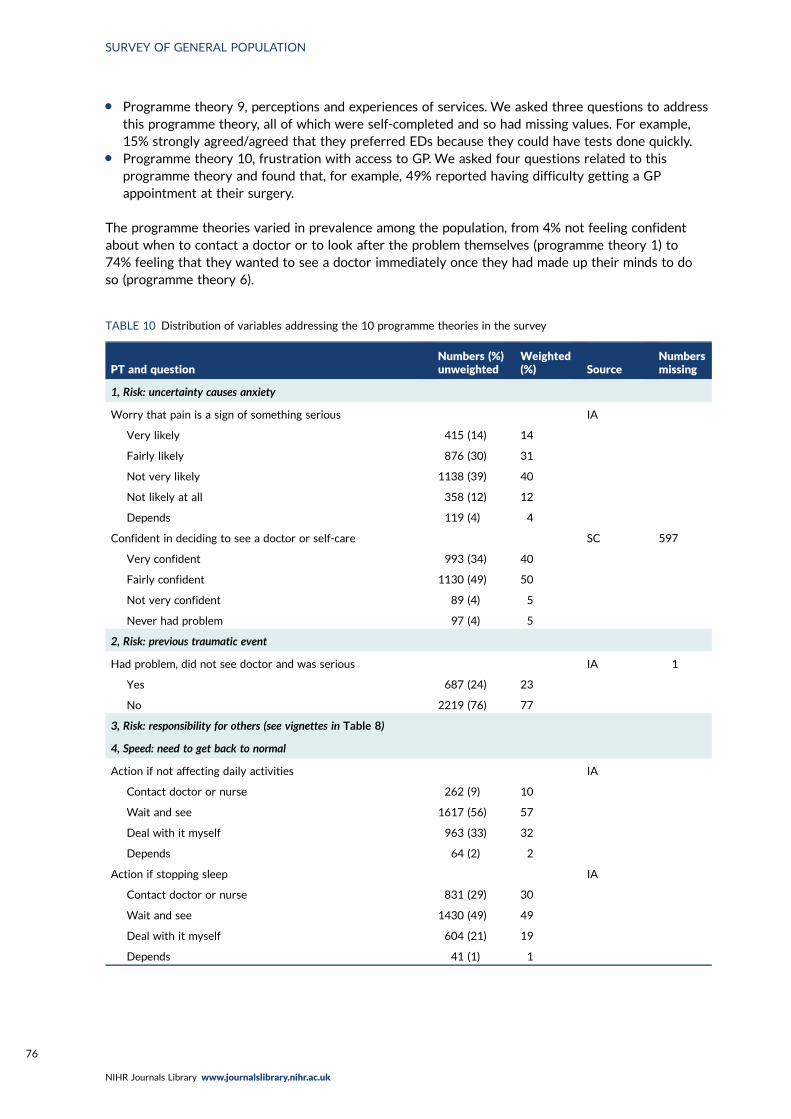
l Programme theory 9, perceptions and experiences of services. We asked three questions to addressthis programme theory, all of which were self-completed and so had missing values. For example,15% strongly agreed/agreed that they preferred EDs because they could have tests done quickly.
l Programme theory 10, frustration with access to GP. We asked four questions related to thisprogramme theory and found that, for example, 49% reported having difficulty getting a GPappointment at their surgery.
The programme theories varied in prevalence among the population, from 4% not feeling confidentabout when to contact a doctor or to look after the problem themselves (programme theory 1) to74% feeling that they wanted to see a doctor immediately once they had made up their minds to doso (programme theory 6).
TABLE 10 Distribution of variables addressing the 10 programme theories in the survey
PT and questionNumbers (%)unweighted
Weighted(%) Source
Numbersmissing
1, Risk: uncertainty causes anxiety
Worry that pain is a sign of something serious IA
Very likely 415 (14) 14
Fairly likely 876 (30) 31
Not very likely 1138 (39) 40
Not likely at all 358 (12) 12
Depends 119 (4) 4
Confident in deciding to see a doctor or self-care SC 597
Very confident 993 (34) 40
Fairly confident 1130 (49) 50
Not very confident 89 (4) 5
Never had problem 97 (4) 5
2, Risk: previous traumatic event
Had problem, did not see doctor and was serious IA 1
Yes 687 (24) 23
No 2219 (76) 77
3, Risk: responsibility for others (see vignettes in Table 8)
4, Speed: need to get back to normal
Action if not affecting daily activities IA
Contact doctor or nurse 262 (9) 10
Wait and see 1617 (56) 57
Deal with it myself 963 (33) 32
Depends 64 (2) 2
Action if stopping sleep IA
Contact doctor or nurse 831 (29) 30
Wait and see 1430 (49) 49
Deal with it myself 604 (21) 19
Depends 41 (1) 1
SURVEY OF GENERAL POPULATION
NIHR Journals Library www.journalslibrary.nihr.ac.uk
76

TABLE 10 Distribution of variables addressing the 10 programme theories in the survey (continued )
PT and questionNumbers (%)unweighted
Weighted(%) Source
Numbersmissing
Action if affecting family or work IA
Contact doctor or nurse 1938 (67) 69
Wait and see 736 (25) 25
Deal with it myself 143 (5) 5
Depends 89 (3) 2
Sleep Computedfor DEUCE
Do not see doctor 2010 (69)
See doctor if sleep loss 634 (22)
See doctor if other loss 262 (9)
Work Computedfor DEUCE
Do not see doctor 935 (32)
See doctor if work loss 1709 (59)
See doctor if other loss 262 (9)
5, Speed: need to seek pain relief
See a doctor urgently for pain IA
Very likely 294 (10) 10
Fairly likely 691 (24) 25
Not very likely 1269 (44) 43
Not at all likely 554 (19) 18
Depends 98 (3) 3
Likely to take medication to stop the pain IA
Very likely 1081 (37) 37
Fairly likely 1257 (43) 44
Not very likely 376 (13) 13
Not at all likely 135 (5) 5
Depends 57 (2) 2
6, Speed: waited long enough
Once I’ve made a decision I want to see the doctorstraightaway
IA
Strongly agree 629 (22) 21
Agree 1525 (53) 53
Neither 400 (14) 14
Disagree/strongly disagree 352 (12) 11
7a, Stressful lives
Overwhelmed when have health problem SC 597
Strongly agree/agree 314 (14) 17
Neither 537 (23) 24
Disagree 872 (38) 35
continued
DOI: 10.3310/hsdr08150 Health Services and Delivery Research 2020 Vol. 8 No. 15
© Queen’s Printer and Controller of HMSO 2020. This work was produced by O’Cathain et al. under the terms of a commissioning contract issued by the Secretary of Statefor Health and Social Care. This issue may be freely reproduced for the purposes of private research and study and extracts (or indeed, the full report) may be included inprofessional journals provided that suitable acknowledgement is made and the reproduction is not associated with any form of advertising. Applications for commercialreproduction should be addressed to: NIHR Journals Library, National Institute for Health Research, Evaluation, Trials and Studies Coordinating Centre, Alpha House,University of Southampton Science Park, Southampton SO16 7NS, UK.
77

TABLE 10 Distribution of variables addressing the 10 programme theories in the survey (continued )
PT and questionNumbers (%)unweighted
Weighted(%) Source
Numbersmissing
Strongly disagree/disagree 487 (17) 20
Never had problem 99 (4) 4
Find life stressful IA
Very 297 (10) 10
Quite 637 (22) 24
A bit 1316 (45) 46
Not at all 637 (22) 20
Don’t know 19 (1) 1
Someone to care for them if they are ill SC 597
Definitely 1240 (54) 54
Probably 697 (30) 31
Probably not 280 (12) 10
Don’t know 92 (4) 5
7b, Low burden
Can take time off work to see GP IA
Yes 1078 (37) 41
Yes but not easy 275 (10) 10
No 127 (4) 5
N/A or missing 1426 (49) 44
Travel to ED IA
Very difficult 610 (21) 19
Neither 269 (9) 10
Fairly easy 1172 (40) 42
Very easy 855 (29) 30
Opening hours a problem SC 597
Strongly agree/agree 603 (26) 27
Neither 608 (26) 26
Disagree/strongly disagree 1098 (48) 46
Prefer no appointments SC 597
Strongly agree/agree 825 (36) 36
Neither 799 (35) 34
Disagree/strongly disagree 685 (30) 30
Want convenient times SC 597
Strongly agree/agree 1348 (58) 59
Neither 708 (31) 30
Disagree/strongly disagree 253 (11) 11
Willing to wait in waiting room IA
Strongly agree/agree 2351 (81) 80
Neither 194 (7) 7
Disagree/strongly disagree 361 (12) 13
SURVEY OF GENERAL POPULATION
NIHR Journals Library www.journalslibrary.nihr.ac.uk
78

TABLE 10 Distribution of variables addressing the 10 programme theories in the survey (continued )
PT and questionNumbers (%)unweighted
Weighted(%) Source
Numbersmissing
8, Compliance with family/friends
Check with family and friends for what to do IA
Very likely 554 (19) 21
Fairly likely 1061 (37) 39
Not very likely 746 (26) 24
Not at all likely 545 (19) 17
9, Perceptions and experiences of services
Prefer ED: I can get tests done quickly SC 597
Strongly agree/agree 353 (15) 17
Neither 797 (35) 35
Strongly disagree/disagree 1159 (50) 48
ED doctors know more than GPs SC 597
Strongly agree/agree 418 (18) 19
Neither 1041 (45) 45
Strongly disagree/disagree 850 (37) 36
No confidence in GP SC 597
Strongly agree 76 (3) 4
Agree 165 (7) 7
Neither 446 (19) 20
Disagree 1008 (44) 43
Strongly disagree 538 (23) 22
Other 76 (3) 3
10, Frustration with access to GP
Hard to get GP appointment at my surgery SC 597
Strongly agree/agree 1137 (49) 51
Neither 353 (15) 16
Disagree/strongly disagree 819 (36) 33
Registered with GP IA 1
Yes 2840 (98) 97
No 65 (2) 3
Work or looking after family makes it difficult to see GP SC 597
Strongly agree/agree 410 (18) 21
Neither 455 (20) 21
Strongly disagree/disagree 1197 (52) 50
N/A 247 (11) 8
Believe people use ED because they cannot get GPappointment
IA
Strongly agree/agree 2441 (84) 83
Neither 339 (12) 12
Disagree/strongly disagree 126 (4) 5
IA, interviewer administered; N/A, not applicable; PT, programme theory; SC, self-complete.
DOI: 10.3310/hsdr08150 Health Services and Delivery Research 2020 Vol. 8 No. 15
© Queen’s Printer and Controller of HMSO 2020. This work was produced by O’Cathain et al. under the terms of a commissioning contract issued by the Secretary of Statefor Health and Social Care. This issue may be freely reproduced for the purposes of private research and study and extracts (or indeed, the full report) may be included inprofessional journals provided that suitable acknowledgement is made and the reproduction is not associated with any form of advertising. Applications for commercialreproduction should be addressed to: NIHR Journals Library, National Institute for Health Research, Evaluation, Trials and Studies Coordinating Centre, Alpha House,University of Southampton Science Park, Southampton SO16 7NS, UK.
79
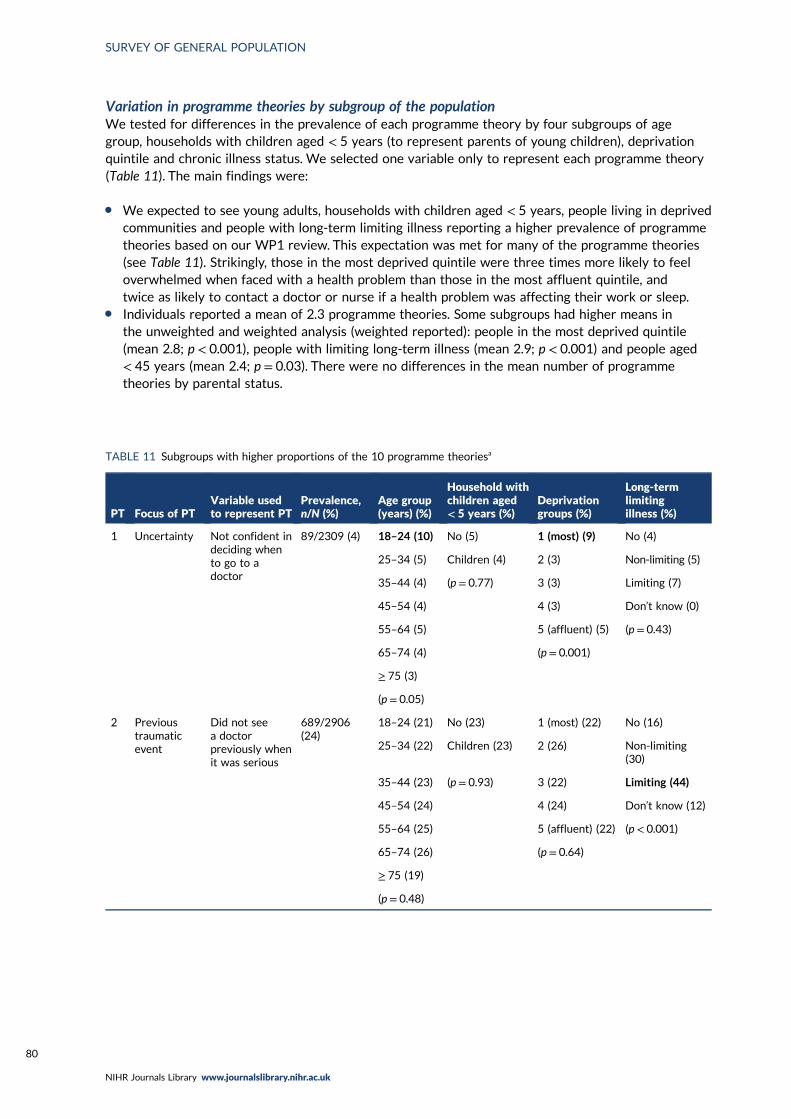
Variation in programme theories by subgroup of the populationWe tested for differences in the prevalence of each programme theory by four subgroups of agegroup, households with children aged < 5 years (to represent parents of young children), deprivationquintile and chronic illness status. We selected one variable only to represent each programme theory(Table 11). The main findings were:
l We expected to see young adults, households with children aged < 5 years, people living in deprivedcommunities and people with long-term limiting illness reporting a higher prevalence of programmetheories based on our WP1 review. This expectation was met for many of the programme theories(see Table 11). Strikingly, those in the most deprived quintile were three times more likely to feeloverwhelmed when faced with a health problem than those in the most affluent quintile, andtwice as likely to contact a doctor or nurse if a health problem was affecting their work or sleep.
l Individuals reported a mean of 2.3 programme theories. Some subgroups had higher means inthe unweighted and weighted analysis (weighted reported): people in the most deprived quintile(mean 2.8; p < 0.001), people with limiting long-term illness (mean 2.9; p < 0.001) and people aged< 45 years (mean 2.4; p = 0.03). There were no differences in the mean number of programmetheories by parental status.
TABLE 11 Subgroups with higher proportions of the 10 programme theoriesa
PT Focus of PTVariable usedto represent PT
Prevalence,n/N (%)
Age group(years) (%)
Household withchildren aged< 5 years (%)
Deprivationgroups (%)
Long-termlimitingillness (%)
1 Uncertainty Not confident indeciding whento go to adoctor
89/2309 (4) 18–24 (10) No (5) 1 (most) (9) No (4)
25–34 (5) Children (4) 2 (3) Non-limiting (5)
35–44 (4) (p = 0.77) 3 (3) Limiting (7)
45–54 (4) 4 (3) Don’t know (0)
55–64 (5) 5 (affluent) (5) (p = 0.43)
65–74 (4) (p = 0.001)
≥ 75 (3)
(p = 0.05)
2 Previoustraumaticevent
Did not seea doctorpreviously whenit was serious
689/2906(24)
18–24 (21) No (23) 1 (most) (22) No (16)
25–34 (22) Children (23) 2 (26) Non-limiting(30)
35–44 (23) (p = 0.93) 3 (22) Limiting (44)
45–54 (24) 4 (24) Don’t know (12)
55–64 (25) 5 (affluent) (22) (p < 0.001)
65–74 (26) (p = 0.64)
≥ 75 (19)
(p = 0.48)
SURVEY OF GENERAL POPULATION
NIHR Journals Library www.journalslibrary.nihr.ac.uk
80

TABLE 11 Subgroups with higher proportions of the 10 programme theoriesa (continued )
PT Focus of PTVariable usedto represent PT
Prevalence,n/N (%)
Age group(years) (%)
Household withchildren aged< 5 years (%)
Deprivationgroups (%)
Long-termlimitingillness (%)
3 Fear ofconsequences
999 or ED for achild but not foradult illnessvignette
1148/2906(40)
18–24 (31) No (40) 1 (most) (45) No (37)
25–34 (36) Children (33) 2 (42) Non-limiting (40)
35–44 (34) (p = 0.02) 3 (35) Limiting (49)
45–54 (42) 4 (40) Don’t know (18)
55–64 (46) 5 (affluent) (35) (p < 0.001)
65–74 (46) (p = 0.006)
≥ 75 (43)
(p < 0.001)
4 Back tonormal
Would go todoctor if losingsleep or workonly
262/2906 (9) 18–24 (11) No (9) 1 (most) (18) No (10)
25–34 (10) Children (13) 2 (8) Non-limiting (6)
35–44 (10) (p = 0.03) 3 (8) Limiting (11)
45–54 (8) 4 (8) Don’t know(15)
55–64 (8) 5 (affluent) (7) (p = 0.04)
65–74 (6) (p < 0.001)
≥ 75 (14)
(p = 0.10)
5 Pain relief Try to see adoctor urgentlywith painwithout takingmedication
104/2906 (4) 18–24 (2) No (4) 1 (most) (2) No (4)
25–34 (4) Children (4) 2 (4) Non-limiting (3)
35–44 (5) (p = 0.81) 3 (4) Limiting (3)
45–54 (3) 4 (4) Don’t know (0)
55–64 (4) 5 (affluent) (4) (p = 0.76)
65–74 (3) (p = 0.48)
≥ 75 (5)
(p = 0.30)
6 Delayed longenough
Once I’ve madeup my mind Iwant to seethe doctorimmediately
2154/2906(74)
18–24 (70) No (74) 1 (most) (78) No (76)
25–34 (73) Children (75) 2 (70) Non-limiting(71)
35–44 (76) (p = 0.89) 3 (70) Limiting (75)
45–54 (73) 4 (77) Don’t know (31)
55–64 (77) 5 (affluent) (77) (p = 0.002)
65–74 (75) (p = 0.009)
≥ 75 (77)
(p = 0.41)
continued
DOI: 10.3310/hsdr08150 Health Services and Delivery Research 2020 Vol. 8 No. 15
© Queen’s Printer and Controller of HMSO 2020. This work was produced by O’Cathain et al. under the terms of a commissioning contract issued by the Secretary of Statefor Health and Social Care. This issue may be freely reproduced for the purposes of private research and study and extracts (or indeed, the full report) may be included inprofessional journals provided that suitable acknowledgement is made and the reproduction is not associated with any form of advertising. Applications for commercialreproduction should be addressed to: NIHR Journals Library, National Institute for Health Research, Evaluation, Trials and Studies Coordinating Centre, Alpha House,University of Southampton Science Park, Southampton SO16 7NS, UK.
81

TABLE 11 Subgroups with higher proportions of the 10 programme theoriesa (continued )
PT Focus of PTVariable usedto represent PT
Prevalence,n/N (%)
Age group(years) (%)
Household withchildren aged< 5 years (%)
Deprivationgroups (%)
Long-termlimitingillness (%)
7 Stressful lives Overwhelmedwhen have anunexpectedhealth problem
314/2309(15)
18–24 (17) No (15) 1 (most) (25) No (14)
25–34 (22) Children (21) 2 (19) Non-limiting (12)
35–44 (19) (p = 0.04) 3 (13) Limiting (24)
45–54 (12) 4 (12) Don’t know(45)
55–64 (15) 5 (affluent) (8) (p < 0.001)
65–74 (12) (p < 0.001)
≥ 75 (10)
(p = 0.003)
8 Compliancewith advice
Check withfamily andfriends
554/2906(19)
18–24 (28) No (20) 1 (most) (26) No (20)
25–34 (26) Children (26) 2 (23) Non-limiting (21)
35–44 (23) (p = 0.02) 3 (17) Limiting (22)
45–54 (15) 4 (18) Don’t know (9)
55–64 (17) 5 (affluent) (18) (p = 0.62)
65–74 (17) (p = 0.02)
≥ 75 (17)
(p < 0.001)
9 Perceptionsand priorexperiencesof care
Preference forED due to tests
353/2309(15)
18–24 (21) No (16) 1 (most) (26) No (17)
25–34 (18) Children (19) 2 (19) Non-limiting (13)
35–44 (20) (p = 0.28) 3 (13) Limiting (19)
45–54 (12) 4 (11) Don’t know (0)
55–64 (16) 5 (affluent) (12) (p = 0.20)
65–74 (12) (p < 0.001)
≥ 75 (17)
(p = 0.07)
10 Frustrationwith GPaccess
Hard to get GPappointment
1137/2309(49)
18–24 (54) No (49) 1 (most) (57) No (17)
25–34 (53) Children (63) 2 (52) Non-limiting (13)
35–44 (55) (p < 0.001) 3 (50) Limiting (19)
45–54 (54) 4 (48) Don’t know (0)
55–64 (50) 5 (affluent) (47) (p = 0.07)
65–74 (43) (p = 0.07)
≥ 75 (42)
(p = 0.02)
PT, programme theory.a Groups in bold have higher prevalence of programme theories. Weighted analysis shown. Distribution shown
if p < 0.10.
SURVEY OF GENERAL POPULATION
NIHR Journals Library www.journalslibrary.nihr.ac.uk
82

Description of other influencesThe distribution of other influences is shown in Table 12. The key findings were:
l Awareness of services. We asked six questions related to awareness of services. Four questionsshowed that a small percentage of respondents lacked confidence in knowing the range of NHSservices that they could use (10%), knowing when services are open or how they can easily find thisout (9%), and especially knowing what tests could be undertaken in different NHS services (22%)and how to contact a GP out of hours (18%). We also asked two questions about using the internetto diagnose problems or to find out what action to take; 49% were not likely to look things upon the internet to see what the problem was and 58% were not likely to use it to see what to do.This large proportion of non-internet users for health has implications for new digital NHS services,such as 111 Digital.
l Recursivity. We asked one question to address learnt behaviour; 54% of people felt that they wereright to contact a service if that service carried out tests on them.
l Health literacy. The full range of health literacy scores were seen for both domains.l Recent use of services. We asked people if they had used the three services recently for themselves
or for someone else (e.g. calling 999 to request an ambulance for their elderly parent). Recent usevaried by service: 15% had used the ambulance service within the past 12 months, 14% had used anED and 83% had used a GP in their practice.
l Overuse of services. We asked three questions about this: one about each service. The majority ofrespondents agreed or strongly agreed that the three services were used by people who did notneed them. Only a small percentage disagreed or strongly disagreed about this (3%, 3% and 9% forambulance, ED and GP, respectively). NatCen recommended that we ask a question to counterbalancethese three questions. We asked if respondents felt that people were reluctant to use an ED for anurgent problem; 46% of respondents agreed, highlighting that people perceive that both overuse andunderuse of services may be seen as a problem.
Explaining tendency to seek ‘clinically unnecessary’ careWe present the regressions explaining the tendency to contact six services: emergency ambulance, EDadult, ED child, ED all, GP and any of these services. We present a univariate analysis first, followed bya multivariable analysis. Below, we display variables by groups representing similar concepts becauseone variable within a group might be selected instead of another correlated variable.
TABLE 12 Distribution of variables measuring other influences in the survey
Influence and questionNumbers (%)unweighted
Numbers (%)weighted Source
Numbersmissing
Awareness of services
Know the range of NHS services to use IA 1
Very confident 1436 (49) 48
Fairly confident 1189 (41) 42
Can find out when NHS services are open IA 1
Very confident 1487 (51) 51
Fairly confident 1163 (40) 40
Not/not at all 255 (9) 9
Can find out what tests are available at different NHS services IA 1
Very confident 963 (33) 32
Fairly confident 1307 (45) 45
Not at all 635 (22) 22
continued
DOI: 10.3310/hsdr08150 Health Services and Delivery Research 2020 Vol. 8 No. 15
© Queen’s Printer and Controller of HMSO 2020. This work was produced by O’Cathain et al. under the terms of a commissioning contract issued by the Secretary of Statefor Health and Social Care. This issue may be freely reproduced for the purposes of private research and study and extracts (or indeed, the full report) may be included inprofessional journals provided that suitable acknowledgement is made and the reproduction is not associated with any form of advertising. Applications for commercialreproduction should be addressed to: NIHR Journals Library, National Institute for Health Research, Evaluation, Trials and Studies Coordinating Centre, Alpha House,University of Southampton Science Park, Southampton SO16 7NS, UK.
83

TABLE 12 Distribution of variables measuring other influences in the survey (continued )
Influence and questionNumbers (%)unweighted
Numbers (%)weighted Source
Numbersmissing
How to contact GP OOH IA 1
Very confident 1338 (46) 44
Fairly confident 1056 (36) 37
Not very confident 389 (13) 15
Not at all confident 122 (4) 4
Look on internet to see what the problem is IA
Very likely 667 (23) 24
Fairly likely 797 (27) 30
Not very likely 472 (16) 17
Not at all likely 940 (32) 29
(Never had problem) 30 (1) 1
Look on internet to decide what to do IA
Very likely 428 (15) 15
Fairly likely 752 (26) 28
Not very likely 680 (23) 26
Not at all likely 1016 (35) 30
(Never had problem) 30 (1) 1
Recursivity
If tests are done I was right to contact the service SC 597
Strongly agree/agree 1236 (54) 52
Neither 793 (34) 36
Disagree/strongly disagree 280 (12) 12
Health literacy
Ability to communicate (mean, SD and range) 3.9, SD 0.66(range 1–5)
SC 637
Understand information (mean and range) 4.0, SD 0.64(range 1–5)
SC 637
Recent use of services for self or someone else
Ambulance use IA 1
Never 1349 (46) 46
≥ 12 months 1108 (38) 38
< 12 months 448 (15) 16
Ambulance frequent user IA 1
0–3 times in 12 months 2842 (98) 98
≥ 3 times in 12 months 64 (2) 2
ED use IA 1
Never 411 (14) 15
≥ 12 months 1478 (51) 49
6–12 months 366 (13) 13
3–6 months 234 (8) 9
< 3 months 416 (14) 15
SURVEY OF GENERAL POPULATION
NIHR Journals Library www.journalslibrary.nihr.ac.uk
84

Tendency to call the emergency ambulance service (adult or child)A total of 11% (328/2906) of respondents ticked ‘call an ambulance’ for any of the six vignettes. In aunivariate analysis respondents had a higher tendency to call an ambulance if any of the followingapplied (see Appendix 9, Table 20):
l sociodemographic characteristics – male, BAMEl resources – social classes III manual/IV/V, most deprived communities, no personal access to the
internet, no carl health – in fair/poor health, with limiting long-term illnessl programme theories – worry if in pain (programme theory 1), if losing sleep or loss of daily activities
(programme theory 4), if overwhelmed when faced with health problem (programme theory 7), donot have someone to care for them when they are ill (programme theory 7), find it difficult to travelto the ED (programme theory 7), prefer service with no appointments (programme theory 7), preferthe ED for getting tests done quickly (programme theory 9), think ED doctors know more than GPs(programme theory 9) and have no confidence in their GP (programme theory 9)
TABLE 12 Distribution of variables measuring other influences in the survey (continued )
Influence and questionNumbers (%)unweighted
Numbers (%)weighted Source
Numbersmissing
ED frequent user IA 1
0–3 times in 12 months 2738 (94) 94
≥ 3 times in 12 months 167 (6) 6
Contacted GP IA 1
Never 65 (2) 3
≥ 12 months 454 (16) 16
6–12 months 484 (17) 17
3–6 months 518 (18) 18
< 3 months 1384 (48) 46
Perceptions of service overuse
Too many use ambulance when not needed IA
Strongly agree/agree 2516 (87) 86
Neither 313 (11) 11
Disagree/strongly disagree 77 (3) 3
Too many use ED when not needed IA
Strongly agree/agree 2515 (87) 86
Neither 291 (10) 10
Disagree/strongly disagree 100 (3) 4
Too many use GP when not needed IA
Strongly agree/agree 2082 (72) 70
Neither 577 (20) 20
Disagree/strongly disagree 247 (8) 9
Reluctance to use ED with urgent problem IA
Strongly agree/agree 1348 (46) 48
Neither 734 (25) 25
Disagree/strongly disagree 824 (28) 28
IA, interviewer administered; OOH, out of hours; SC, self-complete.
DOI: 10.3310/hsdr08150 Health Services and Delivery Research 2020 Vol. 8 No. 15
© Queen’s Printer and Controller of HMSO 2020. This work was produced by O’Cathain et al. under the terms of a commissioning contract issued by the Secretary of Statefor Health and Social Care. This issue may be freely reproduced for the purposes of private research and study and extracts (or indeed, the full report) may be included inprofessional journals provided that suitable acknowledgement is made and the reproduction is not associated with any form of advertising. Applications for commercialreproduction should be addressed to: NIHR Journals Library, National Institute for Health Research, Evaluation, Trials and Studies Coordinating Centre, Alpha House,University of Southampton Science Park, Southampton SO16 7NS, UK.
85

l awareness of services – not confident about finding out when NHS services are open, unlikely tolook up on the internet what a problem is or what to do about it
l recursivity – feeling that if tests are undertaken they were right to contact a servicel health literacy – low levels of understanding information and ability to engage with
health professionalsl recent service use – recent use of ambulance, frequent use of ambulance, frequent use of EDl attitudes to overuse of services – disagree that too many people use EDs and GPs when
not needed.
There were some unusual findings:
l People who did not have work or family responsibilities that made seeing their GP difficult had ahigher tendency to call an ambulance.
l People who disagreed that people use an ED because they cannot get a GP appointment were morelikely to call an ambulance.
Based on a complete-case analysis of 2203 out of 2906 (76%) of the data set, the full model containingall of the statistically significant variables identified above is given in Appendix 9, Table 21. The eventsper variable was 8.7 (235/27), showing that there was some risk of overfitting within this model.The following variables made an independent contribution in a multivariable analysis, with the followinggroups having a higher tendency to contact an emergency ambulance (see Appendix 9, Table 21):
l sociodemographic characteristics – male, BAME, social class III manuall resources – households with no car, no personal access to the internetl programme theories – programme theory 1, people who worry that a pain is sign of something serious,
and programme theory 7, people who feel overwhelmed when they have an unexpected health problem.Findings for programme theory 8 and programme theory 10 were not straightforward. People whowere fairly likely to check with family and friends had a lower tendency than those who were not likelyto do this; this finding was not similar for those ticking very likely, as might be expected. Programmetheory 10, work or looking after family make it difficult to see a GP, was the opposite of what mightbe expected, in that people who did not face this problem had a higher tendency to contact theambulance service
l health literacy – people with low understanding of informationl recent service use – people who have used an emergency ambulance, particularly in the past year.
All six vignettes were included here, but the tendency to call an ambulance was dominated by the childvignettes in that around three-quarters of those with this tendency had ticked a child vignette. Therewere no statistically significant interactions between the samples completing the cough/rib/Saturdayand the samples completing the vomiting/back pain/Wednesday vignettes.
In summary, the key findings were:
l The two child vignettes dominated the tendency to call an ambulance.l A large number of variables related to people having low resources, including social class, low
health literacy and feeling overwhelmed when faced with a health problem.l Lack of a car featured here, indicating that an ambulance may act as transportation to an ED for
people with low resources.l People who had used the ambulance recently had a higher tendency to select it in the vignettes.
This could be explained by someone having an ongoing health problem or by learnt behaviour inthat having used it once, they feel happier to use it again.
SURVEY OF GENERAL POPULATION
NIHR Journals Library www.journalslibrary.nihr.ac.uk
86

Tendency to attend an emergency department for an adultIn total, 18% (512/2906) of respondents ticked ‘go to an ED’ for any of the four adult vignettes. In aunivariate analysis respondents had a higher tendency to go to an ED for adults if any of the followingapplied (see Appendix 9, Table 22):
l sociodemographic characteristics – male, BAME, social classes III manual/IV/V, most deprivedquintile, urban areas
l resources – nonel health – nonel programme theories – very likely to worry that pain was a sign of something serious (programme
theory 1), lost functioning of daily living such as work or sleep (programme theory 4), overwhelmedwhen they have health problem (programme theory 7), very likely to check with family or friends ifthey are ill (programme theory 8), prefer EDs because can get tests done quickly (programme theory 9)and think ED doctors know more than GPs (programme theory 9)
l awareness of services – nonel recursivity – if tests are done they were right to go to a servicel health literacy – nonel recent service use – recent and frequent use of EDl overuse of services – think that too many people use ambulance and ED.
Based on a complete-case analysis of 2309 out of 2906 (80%) of the data set, the full model containingall of the statistically significant variables identified above is given in Appendix 9, Table 23. The eventsper variable was 32.4 (389/12), showing that there was little risk of overfitting for this model. Thefollowing variables made an independent contribution in a multivariable analysis, with the followinggroups more likely to have a tendency to contact an ED for an adult (see Appendix 9, Table 23):
l sociodemographic characteristics – male, BAMEl programme theories – loss of functioning, specifically work (programme theory 4), prefer EDs
because can get tests done quickly (programme theory 9)l recursivity – think that if tests are done they were right to go to a servicel beliefs about overuse – if people do not think there is a problem with too much use of EDs and do
not think people are reluctant to use an ED.
Four vignettes were included here, but the tendency to attend an ED was dominated by the painful ribvignettes in that around two-thirds of those with a tendency had ticked the rib vignette. There wasonly one statistically significant interaction between the samples completing the cough/rib/Saturdayand those completing the vomiting/back pain/Wednesday vignettes in the final model. This occurredwith ethnic group (p = 0.012). People from BAME communities were more likely to tick ‘clinicallyunnecessary’ options for the cough/rib/Saturday vignettes than white people. White people weremore likely to tick ‘clinically unnecessary’ options for the cough/rib/Saturday vignettes than for thediarrhoea/back/Wednesday vignettes. People from BAME communities were slightly less likely to tick‘clinically unnecessary’ options for the diarrhoea/back/Wednesday vignettes than white people wereto tick ‘clinically unnecessary’ options for the cough/rib/Saturday vignettes. Interactions should beinterpreted with caution.
When the binary comparison was limited to those ticking attending an ED compared with thoseselecting lower levels of care only, the results were very similar. All of the variables in the originalmodel featured in this model except programme theory 4, loss of functioning. There were someadditional variations by geographical region (no specific region was statistically significantly different):programme theory 1, pain is a sign of something serious, and that too many people call 999 whenthey do not need to.
DOI: 10.3310/hsdr08150 Health Services and Delivery Research 2020 Vol. 8 No. 15
© Queen’s Printer and Controller of HMSO 2020. This work was produced by O’Cathain et al. under the terms of a commissioning contract issued by the Secretary of Statefor Health and Social Care. This issue may be freely reproduced for the purposes of private research and study and extracts (or indeed, the full report) may be included inprofessional journals provided that suitable acknowledgement is made and the reproduction is not associated with any form of advertising. Applications for commercialreproduction should be addressed to: NIHR Journals Library, National Institute for Health Research, Evaluation, Trials and Studies Coordinating Centre, Alpha House,University of Southampton Science Park, Southampton SO16 7NS, UK.
87

In summary, the key findings were:
l There was evidence of the influence of preference for EDs, getting positive feedback about thevalidity of contacting a service if tests are undertaken by that service and beliefs that EDs arenot overused.
Tendency to attend an emergency department for a childIn total, 33% (949/2906) of respondents ticked ‘go to an ED’ for any of the two child vignettes. In aunivariate analysis respondents had a higher tendency to an ED for a child if any of the followingapplied (see Appendix 9, Table 24):
l sociodemographic characteristics – aged 55–74 years, male, BAME, Wales and Scotlandl resources – nonel health – nonel programme theories – previous traumatic event (programme theory 2), sleep loss (programme
theory 4), loss of work (programme theory 4), not very likely to take medication (programme theory 5),prefer no appointments (programme theory 7), willing to wait in the waiting room if it means beingseen that day (programme theory 7) and prefer an ED because get tests more quickly (programmetheory 9)
l awareness of services – nonel recursivity – tests are carried out then think it was right to contact the servicel recent service use – used ED recentlyl beliefs about overuse of services – believe too many people use ED when not needed.
There were some unusual findings:
l Households with children aged < 5 years had a lower tendency to go to an ED for children.l In the responses to look up on the internet to find out what to do, the ‘missing’ category is
statistically significant.
Based on a complete-case analysis of 2304 out of 2906 (79%) of the data set, the full model containingall of the statistically significant variables identified above is given in Appendix 9, Table 25. The eventsper variable was 44.4 (754/17), showing that there was little risk of overfitting for this model. Thefollowing variables made an independent contribution in a multivariable analysis, with the followinggroups more likely to have a tendency to contact an ED for a child (see Appendix 9, Table 25):
l sociodemographic characteristics – aged 45–74 years, male, BAME, Wales and Scotlandl programme theories – willing to wait in the waiting room if it means being seen that day
(programme theory 7), prefer ED because get tests more quickly (programme theory 9).
Two vignettes were included here: the tendency to attend an ED was evenly distributed across theWednesday and Saturday child vignettes. There were no statistically significant interactions betweenthe samples completing the two child vignettes in the final model.
When the binary comparison was limited to those ticking attending an ED compared with thoseselecting lower levels of care only, the results were very similar. All the variables in the original modelfeatured in this model. There were some additional variables of looking on the internet to decide whatto do and thinking that too many people go the ED.
In summary, the key findings were:
l The attraction of the ED is prominent here for allowing same-day contact and access to tests.l The high tendency in Wales and Scotland to attend an ED is difficult to explain.
SURVEY OF GENERAL POPULATION
NIHR Journals Library www.journalslibrary.nihr.ac.uk
88
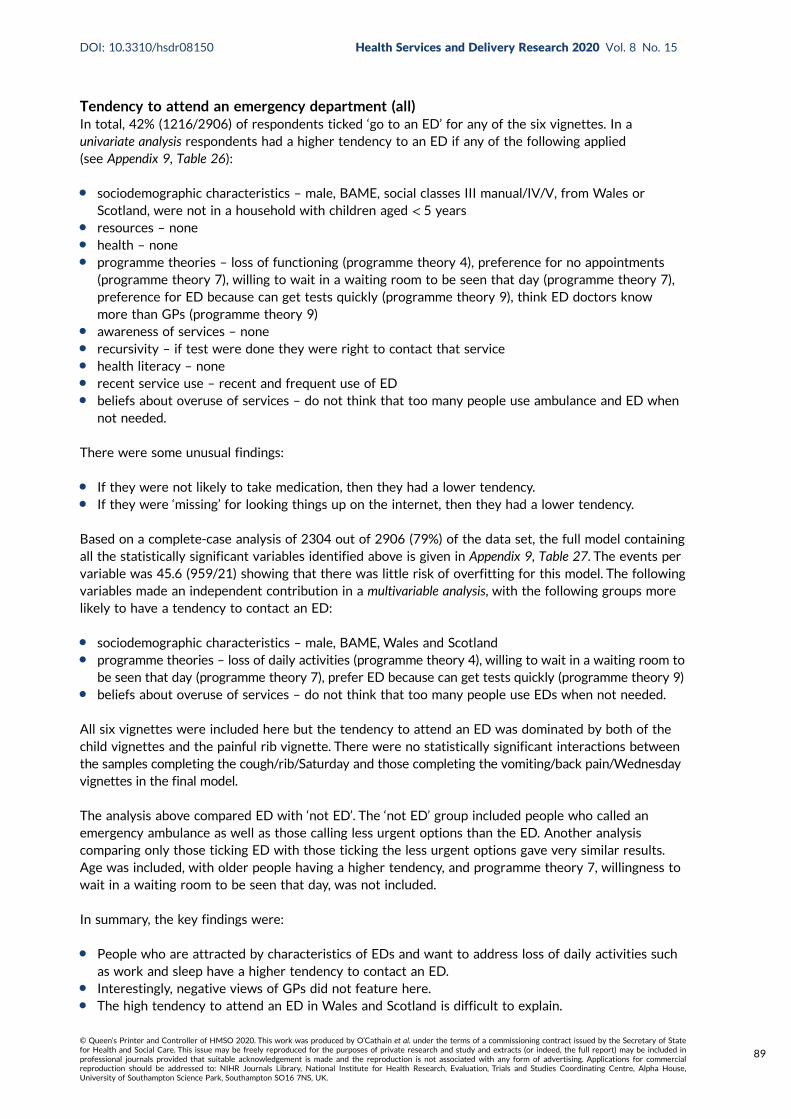
Tendency to attend an emergency department (all)In total, 42% (1216/2906) of respondents ticked ‘go to an ED’ for any of the six vignettes. In aunivariate analysis respondents had a higher tendency to an ED if any of the following applied(see Appendix 9, Table 26):
l sociodemographic characteristics – male, BAME, social classes III manual/IV/V, from Wales orScotland, were not in a household with children aged < 5 years
l resources – nonel health – nonel programme theories – loss of functioning (programme theory 4), preference for no appointments
(programme theory 7), willing to wait in a waiting room to be seen that day (programme theory 7),preference for ED because can get tests quickly (programme theory 9), think ED doctors knowmore than GPs (programme theory 9)
l awareness of services – nonel recursivity – if test were done they were right to contact that servicel health literacy – nonel recent service use – recent and frequent use of EDl beliefs about overuse of services – do not think that too many people use ambulance and ED when
not needed.
There were some unusual findings:
l If they were not likely to take medication, then they had a lower tendency.l If they were ‘missing’ for looking things up on the internet, then they had a lower tendency.
Based on a complete-case analysis of 2304 out of 2906 (79%) of the data set, the full model containingall the statistically significant variables identified above is given in Appendix 9, Table 27. The events pervariable was 45.6 (959/21) showing that there was little risk of overfitting for this model. The followingvariables made an independent contribution in a multivariable analysis, with the following groups morelikely to have a tendency to contact an ED:
l sociodemographic characteristics – male, BAME, Wales and Scotlandl programme theories – loss of daily activities (programme theory 4), willing to wait in a waiting room to
be seen that day (programme theory 7), prefer ED because can get tests quickly (programme theory 9)l beliefs about overuse of services – do not think that too many people use EDs when not needed.
All six vignettes were included here but the tendency to attend an ED was dominated by both of thechild vignettes and the painful rib vignette. There were no statistically significant interactions betweenthe samples completing the cough/rib/Saturday and those completing the vomiting/back pain/Wednesdayvignettes in the final model.
The analysis above compared ED with ‘not ED’. The ‘not ED’ group included people who called anemergency ambulance as well as those calling less urgent options than the ED. Another analysiscomparing only those ticking ED with those ticking the less urgent options gave very similar results.Age was included, with older people having a higher tendency, and programme theory 7, willingness towait in a waiting room to be seen that day, was not included.
In summary, the key findings were:
l People who are attracted by characteristics of EDs and want to address loss of daily activities suchas work and sleep have a higher tendency to contact an ED.
l Interestingly, negative views of GPs did not feature here.l The high tendency to attend an ED in Wales and Scotland is difficult to explain.
DOI: 10.3310/hsdr08150 Health Services and Delivery Research 2020 Vol. 8 No. 15
© Queen’s Printer and Controller of HMSO 2020. This work was produced by O’Cathain et al. under the terms of a commissioning contract issued by the Secretary of Statefor Health and Social Care. This issue may be freely reproduced for the purposes of private research and study and extracts (or indeed, the full report) may be included inprofessional journals provided that suitable acknowledgement is made and the reproduction is not associated with any form of advertising. Applications for commercialreproduction should be addressed to: NIHR Journals Library, National Institute for Health Research, Evaluation, Trials and Studies Coordinating Centre, Alpha House,University of Southampton Science Park, Southampton SO16 7NS, UK.
89

Tendency to call a general practitionerIn total, 33% (961/2906) of respondents ticked ‘go to GP’ for the two adult illness vignettes. In aunivariate analysis respondents had a higher tendency to contact a GP if any of the following applied(see Appendix 9, Table 28):
l sociodemographic characteristics – aged over 65 years, BAME, different regions/countries of Britainincluding Wales, Scotland and London
l resources – no car, no access to internetl health – fair/poor health and with limiting long-term illnessl programme theories – likely to worry that pain was sign of something serious (programme theory 1),
not confident in deciding to see a doctor or self-care (programme theory 1), loss of functioning for dailyactivities (programme theory 4), feeling overwhelmed when faced with health problems (programmetheory 7), travel to ED difficult (programme theory 7), prefer no appointments (programme theory 7),willing to wait in waiting room if can be seen that day (programme theory 7), very likely to checkwith family or friends about what to do (programme theory 8), prefer ED for quick tests (programmetheory 9), registered with a GP (opposite of programme theory 10)
l awareness of services – not confident in finding out when services are open, not confident in howto contact GP out of hours, would not look up on the internet about what to do about ahealth problem
l recursivity – if tests are done they feel right to contact that servicel health literacy – people with low health literacyl recent service use – frequent ambulance use, recent use of GPl beliefs about overuse of services – do not think too many people use GP when do not need to,
think people are reluctant to use EDs.
Based on a complete-case analysis of 2264 out of 2906 (78%) of the data set, the full model containingall of the statistically significant variables identified above is displayed in Appendix 9, Table 29. Theevents per variable was 24.9 (746/30), showing that there was little risk of overfitting for this model.The following variables made an independent contribution in a multivariable analysis, with the followinggroups more likely to have a tendency to contact a GP (see Appendix 9, Table 29):
l sociodemographic characteristics – > 75 years old, BAME, Wales and Scotland and south of Englandl programme theories – worry that pain is a sign of something serious (programme theory 1), feeling
overwhelmed when faced with a health problem (programme theory 7), ease of access to GP(opposite of programme theory 10)
l recursivity – if tests are done then right to contact that servicel health literacy – people with low health literacy in terms of understanding informationl recent service use – recent use of GP but the variable does show consistent pattern.
Only two vignettes were included here, with a tendency to contact a GP dominated by the diarrhoea/vomiting vignette in that two-thirds of people with a tendency for ‘clinically unnecessary’ use of aGP ticked this vignette rather than the cough vignette. There were only two statistically significantinteractions by vignette in the final model. The first was with age (p = 0.013) but none of the interactionlevels was statistically significant. The second was with people who thought that having tests was a signthat they were right to attend a service (recursivity). People who experienced recursivity were muchmore likely to tick the cough/rib/Saturday vignettes than people not experiencing recursivity. People whodid not experience recursivity were more likely to not experience it for the diarrhoea/back/Wednesdayvignettes than for the cough/rib/Saturday vignettes. People who experienced recursivity were morelikely to do so for diarrhoea/back/Wednesday vignettes than were those not experiencing it for cough/rib/Saturday vignettes. Caution is needed when interpreting interactions.
The analysis above compared GP with ‘not GP’. The ‘not GP’ group included people who ticked anemergency ambulance or attendance at an ED, as well as those calling less urgent options than ED.
SURVEY OF GENERAL POPULATION
NIHR Journals Library www.journalslibrary.nihr.ac.uk
90

Another analysis comparing only those ticking GP with those ticking the less urgent options of anotherNHS service, NHS 111 or self-care gave a similar regression. Region was replaced by BAME and thebelief that too many people use GPs.
In summary, the key findings were:
l Older people, people with low health literacy and who feel overwhelmed when faced with a healthproblem, and people who do not have access difficulties to general practice, have a higher tendencyto use a GP.
Tendency to make any ‘clinically unnecessary’ demand for any serviceIn total, 66% (1841/2906) of respondents ticked a ‘clinically unnecessary’ option for any of the sixvignettes. In a univariate analysis respondents had a higher tendency to do this if any of the followingapplied (see Appendix 9, Table 30):
l sociodemographic characteristics –aged > 65 years, male, BAME, social classes III non-manual–V,London or Scotland, not living in households with children aged < 5 years
l resources – no car, no personal access to the internetl health – poor health, limiting long-term illnessl programme theories – worry that pain is a sign of something serious (programme theory 1), never
had to decide about seeing a doctor (programme theory 1), loss of functioning in daily activities(programme theory 4), likely to take medication if in pain (opposite of programme theory 5),overwhelmed when have a health problem (programme theory 7), do not know if someone wouldcare for them if ill (programme theory 7), find it difficult to travel to an ED (opposite of programmetheory 7), prefer services with no appointments (programme theory 7), willing to wait in waitingroom if seen that day (programme theory 7), check with family or friends for what to do(programme theory 8), prefer EDs for access to quick tests (programme theory 9), believe that EDdoctors know more than GPs (programme theory 9), registered at GP (programme theory 10),family and work do not make it difficult to see GP (opposite of programme theory 10)
l awareness of services – not confident in finding out when NHS services are open, not confident inknowing how to contact GP out of hours, unlikely to look up on the internet what a problem is orwhat to do about it
l recursivity – if tests are carried out then this validates service usel health literacy – lower health literacy levels for understanding information and ability to
communicate with health professionalsl recent service use – frequent ED user, recent user of GPl beliefs about overuse of services – too many people use ED and GP, think that people are reluctant
to use EDs.
Based on a complete-case analysis of 2297 out of 2906 (79%) of the data set, the full model containingall of the statistically significant variables identified above is given in Appendix 9, Table 31. The eventsper variable was 22.6 (859/38), showing that there was little risk of overfitting for this model. Thefollowing variables made an independent contribution in a multivariable analysis, with the followinggroups more likely to have a tendency to make ‘clinically unnecessary’ use of services (see Appendix 9,Table 31):
l sociodemographic characteristics – aged 65–74 years, male, BAMEl health – limiting long-term illnessl programme theories – worry pain is a sign of something serious (programme theory 1), loss of
functioning of daily activities (programme theory 4), overwhelmed when faced with a healthproblem (programme theory 7), prefer ED because get test quickly (programme theory 9), work andlooking after family does not make it difficult to see a GP (opposite of programme theory 10)
DOI: 10.3310/hsdr08150 Health Services and Delivery Research 2020 Vol. 8 No. 15
© Queen’s Printer and Controller of HMSO 2020. This work was produced by O’Cathain et al. under the terms of a commissioning contract issued by the Secretary of Statefor Health and Social Care. This issue may be freely reproduced for the purposes of private research and study and extracts (or indeed, the full report) may be included inprofessional journals provided that suitable acknowledgement is made and the reproduction is not associated with any form of advertising. Applications for commercialreproduction should be addressed to: NIHR Journals Library, National Institute for Health Research, Evaluation, Trials and Studies Coordinating Centre, Alpha House,University of Southampton Science Park, Southampton SO16 7NS, UK.
91

l awareness of services – not confident in contacting GP out of hours, unlikely to look up on theinternet what to do about a health problem
l recursivity – if tests are done then this validates service usel recent service use – recent use of GP.
All six vignettes were included here but the back pain vignette did not feature strongly in this analysiscompared with other vignettes. There was only one statistically significant interaction between thesamples completing the cough/rib/Saturday and those completing the vomiting/back pain/Wednesdayvignettes in the final model. People were likely to experience recursivity than not for the cough/rib/Saturday vignettes. People were more likely not to experience recursivity for the diarrhoea/back/Wednesday than for the cough/rib/Saturday vignettes. People were more likely to experiencerecursivity for the diarrhoea/back/Wednesday vignettes than not experience it for the cough/rib/Saturday vignettes. Caution is needed when interpreting interactions.
In summary, the key findings were:
l Many of the variables from the individual service analyses appeared within the univariate andmultivariable analyses for tendency to contact any service.
Discussion
Summary of findingsThe vignettes elicited different responses, with the tendency for ‘clinically unnecessary’ use of servicesvarying between 7% and 49%. In particular, respondents had a higher tendency for ‘clinicallyunnecessary’ use of services for the child vignettes than the adult vignettes, supporting programmetheory 3, responsibility for others. The prevalence of the 10 programme theories from WP1 variedwithin the population. Most programme theories varied by the population subgroups tested, withyoung adults, parents of young children, people living in deprived communities and people with chronicconditions more likely to display a number of the programme theories. Individuals from deprivedcommunities and those with chronic conditions reported greater numbers of programme theories.Surprisingly, these subgroups did not feature in the tendency models. Subgroups of the population thatdid appear consistently as having a higher tendency for ‘clinically unnecessary’ use of services in thetendency models were older people, male people and people from BAME communities. Programmetheories commonly explaining ‘clinically unnecessary’ use included programme theory 1, uncertainty,programme theory 4, inability to get on with daily life, programme theory 7, stressful lives and inabilityto cope, and programme theory 9, perceptions of quality of services where the attraction of EDsfeatured. There was evidence of recursivity at play, where people learnt that attending a service wasthe right thing to do. Low health literacy was associated with a tendency for ‘clinically unnecessary’ useof ambulances and general practice.
Links to programme theoriesThe survey results strongly supported four of the programme theories (Table 13): uncertainty ofsymptoms causing anxiety (programme theory 1), inability to get on with daily life (programme theory 4),stressful lives causing difficulty coping (programme theory 7) and the attraction of EDs (programmetheory 9). Surprisingly, frustration with access to a GP appointment (programme theory 10) was not aprominent issue.
Links to wider literatureTo our knowledge, few population surveys have been undertaken related to this topic. Our results aresupported by the three population survey-based studies that we found. A population survey of 1256people in Australia showed that 21% had used EDs in the previous year (compared with 35% of ourpopulation who were asked if they had attended for themselves or someone else); that decisions were
SURVEY OF GENERAL POPULATION
NIHR Journals Library www.journalslibrary.nihr.ac.uk
92

TABLE 13 Conclusions from testing programme theories in the survey
PT developed in WP1 Revised PT after WP2Support for programme theoryafter WP3 Conclusion
1, Uncertainty aboutsymptoms causing anxiety
Uncertainty aboutmeaning and seriousnessof symptoms causinganxiety
Different symptoms addressed invignettes but the level of certaintyrespondents had about thesesymptoms was not measured
Each symptom elicited differentpropensities so shows effect ofsymptoms on decision-making
In total, 14% likely to worry thatpain is serious. Young adults aged18–24 years three times more likelythan older adults and deprived twiceas likely as affluent to think this.More likely to call ambulance(univariate and multivariable), attendED for adult (univariate) and attendGP (univariate and multivariable)
Important PTaffecting use ofambulance, EDand GP
2, Heightened awarenessof risk as a result ofexperience or knowledgeof traumatic health eventsleading to anxiety
Heightened awareness ofrisk to health as a resultof personal experienceor knowledge causinganxiety
In total, 24% of population havemissed a serious event. Peoplewith a chronic condition are threetimes more likely than those withoutto report this
More likely to attend ED for child(univariate)
Limited support
3, Fear of consequenceswhen responsible forothers
Responsibility and/or carefor others causing distressand fear of consequencesof not acting
Difference between options chosenfor adult and child vignettes. Aged55–74 years, people without smallchildren, most deprived and peoplewith chronic condition more likely totake ‘clinically unnecessary’ option
Could not be measured in logisticregression
Not adequatelytested
4, Inability to get on withdaily life
Concern about actual oranticipated impact ondaily activities/functioning
Any symptom affecting daily activitysuch as work or family responsibilitiesmakes people go to doctor or nurse
People with small children morelikely and most deprived people atleast twice as likely to have thisprogramme theory
More likely to call ambulance(univariate), ED adult (univariate andmultivariable), ED child (univariate)and GP (univariate)
Important PTaffecting use ofambulance, EDand GP
5, Need for immediatepain relief
Need for immediate reliefof intolerable/unbearablesymptoms (including pain)
Not measured well. 18% ofpopulation would not takemedication if in pain. No subgroupdifferences
More likely to attend ED for a child(univariate)
Not adequatelytested
continued
DOI: 10.3310/hsdr08150 Health Services and Delivery Research 2020 Vol. 8 No. 15
© Queen’s Printer and Controller of HMSO 2020. This work was produced by O’Cathain et al. under the terms of a commissioning contract issued by the Secretary of Statefor Health and Social Care. This issue may be freely reproduced for the purposes of private research and study and extracts (or indeed, the full report) may be included inprofessional journals provided that suitable acknowledgement is made and the reproduction is not associated with any form of advertising. Applications for commercialreproduction should be addressed to: NIHR Journals Library, National Institute for Health Research, Evaluation, Trials and Studies Coordinating Centre, Alpha House,University of Southampton Science Park, Southampton SO16 7NS, UK.
93
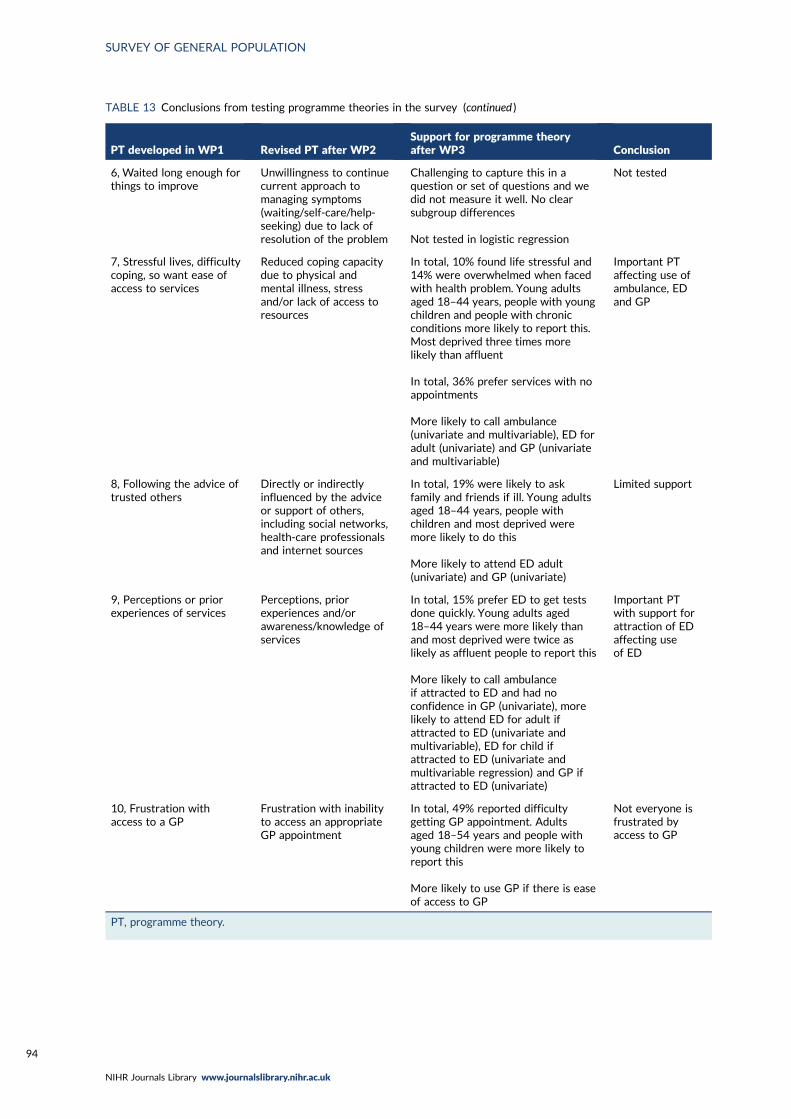
TABLE 13 Conclusions from testing programme theories in the survey (continued )
PT developed in WP1 Revised PT after WP2Support for programme theoryafter WP3 Conclusion
6, Waited long enough forthings to improve
Unwillingness to continuecurrent approach tomanaging symptoms(waiting/self-care/help-seeking) due to lack ofresolution of the problem
Challenging to capture this in aquestion or set of questions and wedid not measure it well. No clearsubgroup differences
Not tested in logistic regression
Not tested
7, Stressful lives, difficultycoping, so want ease ofaccess to services
Reduced coping capacitydue to physical andmental illness, stressand/or lack of access toresources
In total, 10% found life stressful and14% were overwhelmed when facedwith health problem. Young adultsaged 18–44 years, people with youngchildren and people with chronicconditions more likely to report this.Most deprived three times morelikely than affluent
In total, 36% prefer services with noappointments
More likely to call ambulance(univariate and multivariable), ED foradult (univariate) and GP (univariateand multivariable)
Important PTaffecting use ofambulance, EDand GP
8, Following the advice oftrusted others
Directly or indirectlyinfluenced by the adviceor support of others,including social networks,health-care professionalsand internet sources
In total, 19% were likely to askfamily and friends if ill. Young adultsaged 18–44 years, people withchildren and most deprived weremore likely to do this
More likely to attend ED adult(univariate) and GP (univariate)
Limited support
9, Perceptions or priorexperiences of services
Perceptions, priorexperiences and/orawareness/knowledge ofservices
In total, 15% prefer ED to get testsdone quickly. Young adults aged18–44 years were more likely thanand most deprived were twice aslikely as affluent people to report this
More likely to call ambulanceif attracted to ED and had noconfidence in GP (univariate), morelikely to attend ED for adult ifattracted to ED (univariate andmultivariable), ED for child ifattracted to ED (univariate andmultivariable regression) and GP ifattracted to ED (univariate)
Important PTwith support forattraction of EDaffecting useof ED
10, Frustration withaccess to a GP
Frustration with inabilityto access an appropriateGP appointment
In total, 49% reported difficultygetting GP appointment. Adultsaged 18–54 years and people withyoung children were more likely toreport this
More likely to use GP if there is easeof access to GP
Not everyone isfrustrated byaccess to GP
PT, programme theory.
SURVEY OF GENERAL POPULATION
NIHR Journals Library www.journalslibrary.nihr.ac.uk
94

made by health-care professionals in one-third of cases and by others in one-fifth (aligning with ourprogramme theory 8, compliance with the advice of trusted others); and that they attended because ofthe severity of their condition, because they could not find alternatives and because they felt that theywould receive better care there (aligning with programme theory 9, perceptions of quality of care).132
The majority of our respondents felt that too many people use emergency services and generalpractice when they do not need to (87% and 72%, respectively). In 2003, a survey in a single UKgeneral practice identified a similarly high percentage of the population (66%) who felt that people useEDs or GPs inappropriately.135
Our vignette results were similar to those of a vignette study of unnecessary ambulance use in Japan,where respondents were more likely to select the option of calling an emergency ambulance if theywere male, elderly, did not have a car and were not hesitant about using ambulances.6 The authorsestimated that socioeconomic factors increased unnecessary ambulance use by an estimated 10–20%.6
Although this was not a population survey, the results were also similar to those of a cross-sectionalsurvey of over 900 ambulance users compared with those arriving at an ED themselves in Australia,which showed that ambulance users had higher self-rated sense of urgency, felt that the problem wasserious, were in pain, felt that the ambulance service was for everyone regardless of the severity of theproblem, and had used an ambulance in the past 6 months.1 Reasons for using an ambulance includedthe urgency and severity of their condition, requiring special care, not having a car and financialconcerns.1 This reflects our findings that a lack of a car and socioeconomic issues affect ‘clinicallyunnecessary’ use of ambulances.
The role of anxiety in help-seeking has also been found in a vignette study, although the vignetteaddressed a much more serious issue of finding a lump and so did not explore the types of symptomsthat we were interested in.135
Strengths and limitationsThe survey was of a representative sample of the British population and, to our knowledge, is the firstsurvey of population attitudes to emergency and urgent care in Britain. The response rate of 42% islower than historical survey response rates, but is not unusual for similar health surveys undertakenin the UK. There are always issues with non-response bias in surveys; weighting was undertaken toaddress this for some of the analyses reported here. Weighting made little difference to the findings.The vignette approach used in the survey has not been used extensively when exploring population orpatient perceptions in the field of emergency and urgent care research and is a useful way of testinga wide range of factors. However, it had some limitations. It identified tendency rather than actual‘clinically unnecessary’ use of services and people may act differently in practice. For example, peoplemay believe that their access to a GP appointment is poor but may be able to obtain a GP appointmentwhen needed in practice, or they may believe that they would have no problem accessing a timelyGP appointment but be surprised and frustrated when trying to do so for a specific health problem.We were unable to test two of the programme theories in the logistic regressions of the vignettes:programme theory 3, responsibility for others, and programme theory 6, waited long enough for thingsto improve. Finally, the ambulance model suffered from overfitting.
ImplicationsThere was considerable support for four of the programme theories related to symptoms, personalcircumstances and service characteristics, and other factors such as sociodemographic and personalcharacteristics (male, BAME, low health literacy) and service-related characteristics (recursivity). Thishighlights that multiple interventions are likely to be necessary because factors operate at a symptom,patient and service level.
DOI: 10.3310/hsdr08150 Health Services and Delivery Research 2020 Vol. 8 No. 15
© Queen’s Printer and Controller of HMSO 2020. This work was produced by O’Cathain et al. under the terms of a commissioning contract issued by the Secretary of Statefor Health and Social Care. This issue may be freely reproduced for the purposes of private research and study and extracts (or indeed, the full report) may be included inprofessional journals provided that suitable acknowledgement is made and the reproduction is not associated with any form of advertising. Applications for commercialreproduction should be addressed to: NIHR Journals Library, National Institute for Health Research, Evaluation, Trials and Studies Coordinating Centre, Alpha House,University of Southampton Science Park, Southampton SO16 7NS, UK.
95


Chapter 7 Integration from threework packages
Introduction
Integration has been carried out throughout this sequential mixed-methods study. The realist review(WP1) informed the subgroups selected for the qualitative interview study (WP2) and the interpretationof the findings in WP2. Findings from WP1 and WP2 informed the content of the WP3 population survey.It is also important to bring together findings from all of the WPs to identify overall learning aboutdrivers of demand for ‘clinically unnecessary’ use of emergency and urgent care.
Methods
We used an adapted triangulation protocol143 to bring together the key findings from each componentof the study and to identify the overarching conclusions and recommendations from the whole study.First, we identified drivers and other key findings from each study component. Then we presented findingsthat were related to the same driver/factor from each component on the same page and consideredhow the findings converged, complemented each other or disagreed, or where there was no findingfrom a component when we might have expected one.
We also took the opportunity to refine the programme theories developed in WP1 after consideringthe findings from WP2 and WP3.
Results
The integration grid is shown in Appendix 10, Table 32. After constructing the grid, we considered thetypes of drivers and decided to summarise the findings as symptom related, patient related and healthservice related.
The final programme theories with support from all three WPs are displayed in Table 14. Programmetheory 10, frustration with poor access to a GP, has been included despite it not being supportedstrongly in the WP3 vignette analysis because it played such as powerful role in the WP2 interviews.
TABLE 14 Final programme theories based on all of the WPs
PT label PT detail
1, Uncertainty aboutsymptoms causing anxiety
When there is uncertainty about the meaning and seriousness of symptoms (M) becausethey do not fit with people’s expectations or prior experience (e.g. they last longer, aremore severe, are unfamiliar or do not respond to self-care in the expected timescale)(C/M), this increases anxiety about the perceived risk (M) and an immediate need toestablish what is wrong and obtain reassurance (M). This concern prompts the use of theambulance, ED and GP (O), where it is perceived that the most appropriate resources andexpertise required to establish cause can be accessed quickly (C). The ED is used in thecontext of timely or satisfactory answers not having been received from primary careservices (C)
continued
DOI: 10.3310/hsdr08150 Health Services and Delivery Research 2020 Vol. 8 No. 15
© Queen’s Printer and Controller of HMSO 2020. This work was produced by O’Cathain et al. under the terms of a commissioning contract issued by the Secretary of Statefor Health and Social Care. This issue may be freely reproduced for the purposes of private research and study and extracts (or indeed, the full report) may be included inprofessional journals provided that suitable acknowledgement is made and the reproduction is not associated with any form of advertising. Applications for commercialreproduction should be addressed to: NIHR Journals Library, National Institute for Health Research, Evaluation, Trials and Studies Coordinating Centre, Alpha House,University of Southampton Science Park, Southampton SO16 7NS, UK.
97

TABLE 14 Final programme theories based on all of the WPs (continued )
PT label PT detail
4, Inability to get on withdaily life
When people are prevented from undertaking their normal lives, roles or responsibilities(e.g. paid work, child care) (C), or anticipate that this may occur, this creates a need to getback to normal quickly (M), to get on with their lives and discharge their responsibilities.This prompts use of ambulance, ED or GP (O) because the service can resolve a problemquickly by being accessible and efficient (C)
7, Stressful lives/cannotcope
When people are already experiencing significant stresses due to physical or mentalillness, stress or lack of access to resources (e.g. money, time) (C) they have less capacityto cope with the additional challenge of a new or changed health problem. Symptoms are,therefore, likely to trigger emotional distress, including feelings of loss of control andhelplessness (M), leading them to use services with lower burden of access
9, Perceptions or priorexperiences of services
When people have individual experience or knowledge, or cultural beliefs, about thediffering quality or availability of primary and emergency services, or lack of awareness ofthe range of services available, they are likely to choose emergency care, particularly theED (O), which they see as having the tests and expertise necessary (C)
10, Poor access to a GP When people are unable to obtain an appointment with a primary care practitioner (C/M),this can further exacerbate feelings of anxiety and cause panic (M). Individuals canexperience feelings of frustration (M), mistrust (M), and the perception of an uncaringservice (M), feeling that they have no other choice (M) but to contact an emergencyservice (O)
PT, programme theory.
INTEGRATION FROM THREE WORK PACKAGES
NIHR Journals Library www.journalslibrary.nihr.ac.uk
98

Chapter 8 Discussion
We have discussed findings at the end of each chapter. Here we provide discussion of key pointsacross the whole study.
Summary
In the review we identified 10 drivers of ‘clinically unnecessary’ use of ambulances, EDs and generalpractice that were further expanded in the interview study and tested in the survey. Multiple, interactingdrivers operated in individuals’ decision-making, which could be grouped into symptom-related drivers,patient-related drivers and health service-related drivers. Symptom-related drivers included anxiety or theneed for reassurance caused by uncertainty about the seriousness of symptoms, concern about the impactof symptoms on daily activities and a need for immediate relief of intolerable symptoms, particularly pain.Patient-related drivers included reduced coping capacity due to illness, stress or limited resources; fearof consequences when responsible for another person’s health, particularly children; and the influence ofsocial networks. Health service-related drivers included perceptions, prior experiences and awareness ofdifferent services, lack of timely access to a GP appointment, and compliance with health service staff’sadvice to attend an ED.We do not know if these drivers differed between ‘clinically unnecessary’ users andthose who attended services and were classed as ‘clinically unnecessary’.
Strengths and limitations
The study had five strengths. First, we undertook a more in-depth piece of research than much of theprevious work in the area, including an in-depth synthesis of previous research, an in-depth analysis ofqualitative research and quantitative testing of a wide range of potential drivers. Second, we focusedon a range of services facing considerable demand in England currently: emergency ambulances, EDsand urgent daytime general practice. The inclusion of emergency ambulances and general practiceenabled us to explore drivers that had previously been generated largely from the experience of EDusers. Third, we focused fully on patient and population perceptions to understand the issues fromtheir perspectives. Fourth, the sequential approach allowed each WP to inform the next. In our reviewwe found that many studies did not always provide enough detail to give an insight into the interaction ofdifferent issues in individuals’ lives, or where particular service use was located in their overall help-seekingjourney. Using the principles of IPA for the analysis of the interview data provided depth in describing userbehaviour, demonstrating the complexity of decision-making. Fifth, the focus on ‘clinically unnecessary’users’ views of interventions to address their behaviour is a new addition to the evidence base.
There were three limitations. First, the study did not add as much to the evidence base about use ofambulance services as planned. There were few relevant articles included in the review and we struggledto recruit these users to our qualitative component. Booker’s19 review, encompassing patient and healthprofessional perspectives, still offers the most in-depth understanding of ‘clinically unnecessary’ use ofambulance services. However, our testing of factors affecting the tendency to use emergency ambulancesis an excellent contribution to the ambulance service evidence base. Second, we recruited fewer patientsto our qualitative component from one of the two geographical areas in our study and so were unable toundertake our planned comparison between two, operationally different, emergency and urgent caresystems. Third, it was challenging to measure some of our programme theories in our survey.
DOI: 10.3310/hsdr08150 Health Services and Delivery Research 2020 Vol. 8 No. 15
© Queen’s Printer and Controller of HMSO 2020. This work was produced by O’Cathain et al. under the terms of a commissioning contract issued by the Secretary of Statefor Health and Social Care. This issue may be freely reproduced for the purposes of private research and study and extracts (or indeed, the full report) may be included inprofessional journals provided that suitable acknowledgement is made and the reproduction is not associated with any form of advertising. Applications for commercialreproduction should be addressed to: NIHR Journals Library, National Institute for Health Research, Evaluation, Trials and Studies Coordinating Centre, Alpha House,University of Southampton Science Park, Southampton SO16 7NS, UK.
99

What DEUCE adds to the evidence base
In summary:
l We synthesised the existing evidence and produced a comprehensive set of programme theoriesthat identify the factors at play when patients make use of services providing emergency and urgentcare that is judged to be ‘clinically unnecessary’. We have tested these programme theories usingqualitative and quantitative methodologies and established a refined set of programme theoriesbuilt on this evidence. Some of these programme theories were new, such as the way in whichdelaying seeking care using self-care adds to the urgency of help-seeking.
l The evidence used in the realist review was largely non-UK based and largely focused on EDs. Wehave added UK specific evidence and considered a wider part of the emergency care system byfocusing on ambulance and GP use as well as ED use.
l Our qualitative interview study has added to the existing evidence base by focusing on twosubgroups of users in whom there is little qualitative research (young adults and people fromsocially deprived communities) or little qualitative research undertaken in the UK (parents of youngchildren). We found that a number of factors often occur during an individual help-seeking episodeand together interact to determine whether or not a service will be used and, if so, which service.
l We highlighted the extent to which social circumstances related to complex lives, stress, lack ofresources and mental health affect help-seeking behaviour. This was a programme theory from therealist review, was shown to be a driver during our interviews with young adults and people livingin socially deprived communities, and was identified as a consistent factor explaining a tendency tomake ‘clinically unnecessary’ use of ambulances, EDs and general practice in our survey vignettes.
l The existing evidence base on interventions to address demand for EDs is largely inconclusive. Inour qualitative research we identified a range of potential interventions. An important interventionfor patients was improving access to GPs and the GP appointment systems that determine access.However, patients’ views on improving the quality and location of alternative services such as WICsand prescriptions/pharmacy highlight the variation in recommendations among the three subgroupsand the importance of tailoring interventions to specific subgroups.
Implications
Changing patient behaviourA 2013 policy document144 set out a vision for supporting the population to facilitate self-care. Six yearson, our study shows that, although people are active in undertaking self-care when faced with an urgentproblem, many reach a point at which they perceive that care is needed from a higher-acuity healthservice than necessary. Understanding how people arrive at a decision to seek care, and why theychoose a particular service from which to seek it, is an important consideration for the NHS as it plansthe configuration of services to meet the needs of the population.
Our study found that patients’ social circumstances play a key role in shaping decision-making. Some of thepopulation may be affected by a complex set of social circumstances that combine, or work in isolation, tohave an impact on their coping abilities and decision-making. This may be particularly challenging when aperson is experiencing an acute episode of illness. Reducing this complexity is challenging, but it is clearthat this complexity is a strong driver of ‘clinically unnecessary’ use of GPs, EDs and the ambulance service.
There are likely to be groups of people who are habitually labelled as seeking ‘clinically unnecessary’ use ofemergency and urgent care, for example people who have difficulty coping (see programme theory 7).It is also highly likely that any individual may be labelled as making ‘clinically unnecessary’ use of emergencyand urgent care at some point in their life because, for example, a specific symptom or circumstancecauses high levels of anxiety. Interventions will need to consider both of these scenarios.
DISCUSSION
NIHR Journals Library www.journalslibrary.nihr.ac.uk
100

Interventions need to focus on services, not just patient behaviourSome patients try to take a route through the system of care that is commensurate with their clinicalneed by contacting their GP before attending an ED. However, it appears that GPs and other services(such as NHS 111) advise some patients to go a higher-acuity service. Our study focused on patientdecision-making, rather than attempting to understand the decision-making process from a health-careprofessional perspective. Interventions will be needed to focus on this contribution to demand.
Emergency and urgent care services are under sustained pressure in terms of supply of workforce as wellas demand from patients. Increasing workforces may reduce concerns about demand for services. A keyconsideration here is general practice. Some patients in our study used same-day GP appointments becauseof ease of access, the location and a perception that the general practice was the best place to seek care.However, others used EDs after they had attempted to use their general practice but found themselvesfrustrated by the system of either obtaining a same-day appointment or having to wait > 7 days for aroutine appointment. Strengthening general practice by improving access to appointments with a GP might,therefore, alleviate some of the ‘clinically unnecessary’ demand on EDs. Recent evidence of the fallingnumber of GPs relative to the size of the population, and a disproportionate workload faced by GPs indeprived areas,145 may have ongoing implications for patient access to general practice appointments andthe use of higher-acuity services than necessary.
Some people felt that urgent care alternatives introduced to improve patient choice and access tocare, such as WICs, MIUs and NHS 111, were not acceptable. Uncertainty about service provision,dissatisfaction based on previous experiences and a perception that the service was inferior (whencompared with higher-acuity services) contributed to a reluctance to use these services. Improvementsin these services could change patient behaviour.
Strengthening primary care and improving urgent care alternatives could have some impact on thedemand for EDs, but it is unlikely to alleviate all ‘clinically unnecessary’ demand because some patientsfeel strongly that they need the facilities offered by ED, particularly X-rays. Service reconfigurationmay, therefore, be required to offer X-rays in other services or it may be necessary to educate thepopulation about when these facilities are unlikely to be necessary (e.g. for a rib injury).
Our interview participants were identified by service providers as making ‘clinically unnecessary’contact with a particular service. However, interviewees did not describe this view being shared duringthe clinician–patient encounter. Health services themselves may reinforce ‘clinically unnecessary’ useby offering tests or reassuring patients that ‘they have done the right thing’ by making contact withthem. If the clinician thinks that a patient could have used a lower-acuity service, then communicatingthis to the patient may help them to make better decisions in the future and avoid validating serviceuse that may perpetuate further ‘clinically unnecessary’ use by both the individual and those in theirsocial network. We understand the challenges of doing this in terms of the time it might take for busyclinicians, but it could be explored as a potential intervention to reduce ‘clinically unnecessary’ use.
Priorities for research
We identified a number of opportunities for further research:
1. Patients who had been labelled as making ‘clinically unnecessary’ use of services identified anumber of interventions that had the potential to change the behaviour of patients seeking care foran urgent health problem. New interventions addressing ‘clinically unnecessary’ use of emergencyambulances and EDs should be evaluated. These include interventions that strengthen capacity inprimary care, change GP appointment systems, reduce practices in EDs that encourage further‘clinically unnecessary’ use, improve health literacy, improve population mental health and increaselow resources in the population.
DOI: 10.3310/hsdr08150 Health Services and Delivery Research 2020 Vol. 8 No. 15
© Queen’s Printer and Controller of HMSO 2020. This work was produced by O’Cathain et al. under the terms of a commissioning contract issued by the Secretary of Statefor Health and Social Care. This issue may be freely reproduced for the purposes of private research and study and extracts (or indeed, the full report) may be included inprofessional journals provided that suitable acknowledgement is made and the reproduction is not associated with any form of advertising. Applications for commercialreproduction should be addressed to: NIHR Journals Library, National Institute for Health Research, Evaluation, Trials and Studies Coordinating Centre, Alpha House,University of Southampton Science Park, Southampton SO16 7NS, UK.
101

2. Evaluate new interventions to address ‘clinically unnecessary’ use of general practice, includingeducating the population about pharmacies, improving access to free prescriptions in pharmaciesand improving patients’ confidence in self-managing minor illnesses.
3. Evaluate new interventions tailored to different population subgroups, such as education andsupport aimed at parents of young children.
4. Understand drivers of ‘clinically unnecessary’ use for other subgroups identified in the survey, inparticular men and BAME groups.
5. Some service users described that they had been signposted to higher-acuity services by generalpractice or by urgent care services such as NHS 111. Service users were not in a position to offer aview on why this occurred. Seeking health-care professionals’ perspectives on this would be helpfulin understanding how this driver could be best addressed.
Conclusions
‘Clinically unnecessary’ use of emergency and urgent care is of interest when supply fails to matchdemand. Patients use emergency ambulances, EDs and same-day GP appointments when they do notneed the level of clinical care provided by those services for a multitude of inter-related reasons thatsometimes differ by population subgroup. Some of these reasons relate to health services in terms ofdifficulty accessing general practice leading to use of EDs, and population-learnt behaviour concerningthe positive attributes of EDs, rather than to patient characteristics. Social circumstances, such ascomplex and stressful lives, limited resources, the need to attend to responsibilities such as family andwork, and parental anxiety, influence help-seeking behaviour in relation to all three services. Demandmay be ‘clinically unnecessary’ but completely understandable when general practice accessibility andpatients’ social circumstances are considered.
DISCUSSION
NIHR Journals Library www.journalslibrary.nihr.ac.uk
102
Acknowledgements
We would like to thank everyone who took part in our PPI activities for the insights they gave,and the members of our Project Advisory Group, chaired by Professor Matthew Cooke, for their
help and advice.
We are enormously grateful to the NHS organisations that agreed to be study sites, the staff whofacilitated our access to potential study participants and the patients who participated in ourqualitative research.
We acknowledge the role of NatCen in designing and delivering the survey. We thank the surveyparticipants who completed the questionnaire.
We acknowledge the support of the NIHR Clinical Research Network.
We thank Sue Ridgway and Veronica Fibisan for the administrative support provided during the study.
Contributions of authors
Alicia O’Cathain (https://orcid.org/0000-0003-4033-506X) (Professor of Health Services Research)was the principal investigator with oversight of all aspects of the study. She designed the study,contributed to all WPs and led WP1 and WP3. She wrote the first draft of Chapters 1–3 and Chapters 6and 7.
Emma Knowles (https://orcid.org/0000-0003-3372-1245) (Senior Research Fellow) was the studymanager. A co-applicant, she contributed to the initial design of the study, led WP2, supported thedevelopment of the survey instrument in WP3, led the PPI workshop, and wrote the first draft ofChapters 4 and 8.
Jaqui Long (https://orcid.org/0000-0002-6889-6195) (Research Associate) tested and refined theprogramme theories in WP1, contributed to data collection and analysis in WP2, wrote the first draftof Chapter 5 and contributed significantly to the writing of other chapters.
Janice Connell (https://orcid.org/0000-0003-4609-3911) (Research Associate) led the data extractionand development of the programme theories in WP1, and contributed to writing Chapter 3.
Lindsey Bishop-Edwards (https://orcid.org/0000-0002-2136-5557) (Research Associate) contributedto the data collection in WP2 and early stages of analysis before commencing maternity leave inNovember 2018.
Rebecca Simpson (https://orcid.org/0000-0003-1677-5938) (Research Associate) undertook theanalysis of WP3 data.
Joanne Coster (https://orcid.org/0000-0002-0599-4222) (Research Fellow) was a co-applicant,contributing to searches, selection and early analysis of articles included in WP1.
Linda Abouzeid (https://orcid.org/0000-0003-4215-7367) (PPI member) was a co-applicant,appraising findings throughout the study, especially the analysis of WP2. She contributed to thePlain English summary.
DOI: 10.3310/hsdr08150 Health Services and Delivery Research 2020 Vol. 8 No. 15
© Queen’s Printer and Controller of HMSO 2020. This work was produced by O’Cathain et al. under the terms of a commissioning contract issued by the Secretary of Statefor Health and Social Care. This issue may be freely reproduced for the purposes of private research and study and extracts (or indeed, the full report) may be included inprofessional journals provided that suitable acknowledgement is made and the reproduction is not associated with any form of advertising. Applications for commercialreproduction should be addressed to: NIHR Journals Library, National Institute for Health Research, Evaluation, Trials and Studies Coordinating Centre, Alpha House,University of Southampton Science Park, Southampton SO16 7NS, UK.
103

Shan Bennett (https://orcid.org/0000-0001-5597-3254) (PPI member) was a co-applicant,appraising findings throughout the study, especially the analysis of WP2. She contributed to thePlain English summary.
Elizabeth Croot (https://orcid.org/0000-0002-3666-6264) (Senior Research Fellow) was a co-applicant,advising on the WP1 realist synthesis.
Jon M Dickson (https://orcid.org/0000-0002-1361-2714) (Senior Clinical Lecturer) was a co-applicant,contributing to the design of the vignettes in WP3.
Steve Goodacre (https://orcid.org/0000-0003-0803-8444) (Professor of Emergency Medicine) was aco-applicant, contributing to the design of the vignettes in WP3.
Enid Hirst (https://orcid.org/0000-0003-2230-5123) (PPI member) designed the PPI workshop andcontributed to interpretation of the findings.
Richard Jacques (https://orcid.org/0000-0001-6710-5403) (Lecturer) was a co-applicant, advising onthe analysis of WP3.
Miranda Phillips (https://orcid.org/0000-0001-6318-2233) (Research Director) was a co-applicant,contributing to the design of the questionnaire in WP3 and leading the British Social Attitudes survey.
Joanne Turnbull (https://orcid.org/0000-0002-5006-4438) (Senior Research Fellow) was aco-applicant, advising on how our project complemented and learnt from an ongoing NIHR project in arelated field.
Janette Turner (https://orcid.org/0000-0003-3884-7875) (Reader in Emergency and Urgent CareResearch) was a co-applicant, advising on how our project findings related to the evidence base andcurrent policy initiatives.
All authors attended project management meetings to discuss the findings of each WP, and commentedon the draft report.
Approvals
Ethics approval was sought for the qualitative interview study (WP2) and approval obtained fromLondon – Brent REC (reference 14/LO/1228). The population survey (WP3) was conducted by NatCenand it obtained ethics approval through its standard procedures.
Publications
NatCen published a report of its 2019 British Social Attitudes survey in July 2019. The findings fromour module of the survey were published separately in August 2019 focusing on aspects of seekingemergency and urgent care that complement rather than repeat the findings reported here.
Curtice J, Clery E, Perry J, Phillips M, Rahim N. Emergency Care: What do Attitudes Tell us About Demandfor Services and how it Might be Reduced? London: The National Centre for Social Research; 2019.
ArticlesO’Cathain A, Connell J, Long J, Coster J. ‘Clinically unnecessary’ use of emergency and urgent care:a realist review of patients’ decision making. Health Expect 2020;23:19–40.
ACKNOWLEDGEMENTS
NIHR Journals Library www.journalslibrary.nihr.ac.uk
104

O’Cathain A, Simpson R, Phillips M, Dickson J. Tendency to contact general practice instead of selfcare: population vignette study in Britain. BJGP Open 2020; in press.
Oral conference presentationsO’Cathain A, Connell J, Long J, Coster J. Understanding why Patients Make Clinically Unnecessary Use ofEmergency and Urgent Care Services. HSRUK Conference 2018, 4–5 July 2018, Nottingham, UK.
Long J, Knowles EL, Bishop-Edwards, L, O’Cathain A. Interventions to Improve Service Use and Self-careDecision-Making in Patients Making Clinically Unnecessary Use of Urgent and Emergency Care. HSRUKConference 2019, 2–3 July 2019, Manchester, UK.
O’Cathain A, Simpson R, Knowles EL, Phillips M. The Propensity to Make Clinically Unnecessary Use ofEmergency Departments: A Vignette Study. HSRUK Conference 2019, 2–3 July 2019, Manchester, UK.
Data-sharing statement
Any queries or data requests should be submitted to the corresponding author for consideration.Access to available anonymised data may be granted following review. NatCen makes the data fromthe British Social Attitudes survey available using its own data-sharing processes.
DOI: 10.3310/hsdr08150 Health Services and Delivery Research 2020 Vol. 8 No. 15
© Queen’s Printer and Controller of HMSO 2020. This work was produced by O’Cathain et al. under the terms of a commissioning contract issued by the Secretary of Statefor Health and Social Care. This issue may be freely reproduced for the purposes of private research and study and extracts (or indeed, the full report) may be included inprofessional journals provided that suitable acknowledgement is made and the reproduction is not associated with any form of advertising. Applications for commercialreproduction should be addressed to: NIHR Journals Library, National Institute for Health Research, Evaluation, Trials and Studies Coordinating Centre, Alpha House,University of Southampton Science Park, Southampton SO16 7NS, UK.
105


References
1. Toloo GS, FitzGerald GJ, Aitken PJ, Ting JY, McKenzie K, Rego J, Enraght-Moony E.Ambulance use is associated with higher self-rated illness seriousness: user attitudes andperceptions. Acad Emerg Med 2013;20:576–83. https://doi.org/10.1111/acem.12149
2. O’Cathain A, Knowles E, Munro J, Nicholl J. Exploring the effect of changes to serviceprovision on the use of unscheduled care in England: population surveys. BMC Health Serv Res2007;7:61. https://doi.org/10.1186/1472-6963-7-61
3. Hobbs FDR, Bankhead C, Mukhtar T, Stevens S, Perera-Salazar R, Holt T, et al. Clinical workloadin UK primary care: a retrospective analysis of 100 million consultations in England, 2007–14.Lancet 2016;387:2323–30. https://doi.org/10.1016/S0140-6736(16)00620-6
4. Iacobucci G. GPs forced to turn away patients because of winter pressures. BMJ 2018;360:k81.https://doi.org/10.1136/bmj.k81
5. Kay I. Ambulance Quality Indicators. London: NHS England; 2011–2017. URL: www.england.nhs.uk/statistics/statistical-work-areas/ambulance-quality-indicators/ (accessed 6 December 2017).
6. Kawakami C, Ohshige K, Kubota K, Tochikubo O. Influence of socioeconomic factors onmedically unnecessary ambulance calls. BMC Health Serv Res 2007;7:120. https://doi.org/10.1186/1472-6963-7-120
7. Durand AC, Palazzolo S, Tanti-Hardouin N, Gerbeaux P, Sambuc R, Gentile S. Nonurgentpatients in emergency departments: rational or irresponsible consumers? Perceptions ofprofessionals and patients. BMC Res Notes 2012;5:525. https://doi.org/10.1186/1756-0500-5-525
8. Farion KJ, Wright M, Zemek R, Neto G, Karwowska A, Tse S, et al. Understanding low-acuityvisits to the pediatric emergency department. PLOS ONE 2015;10:e0128927. https://doi.org/10.1371/journal.pone.0128927
9. Patterson PD, Baxley EG, Probst JC, Hussey JR, Moore CG. Medically unnecessary emergencymedical services (EMS) transports among children ages 0 to 17 years. Matern Child Health J2006;10:527–36. https://doi.org/10.1007/s10995-006-0127-6
10. Faulkner D, Law J. The ‘unnecessary’ use of emergency departments by older people:findings from hospital data, hospital staff and older people. Aust Health Rev 2015;39:544–51.https://doi.org/10.1071/AH14185
11. Allen L, Cummings J. Emergency department use among Hispanic Adults: the role ofacculturation. Med Care 2016;54:449–56. https://doi.org/10.1097/MLR.0000000000000511
12. Atenstaedt R, Gregory J, Price-Jones C, Newman J, Roberts L, Turner J. Why do patientswith nonurgent conditions present to the emergency department despite the availabilityof alternative services? Eur J Emerg Med 2015;22:370–3. https://doi.org/10.1097/MEJ.0000000000000224
13. Durand AC, Gentile S, Devictor B, Palazzolo S, Vignally P, Gerbeaux P, Sambuc R. ED patients:how nonurgent are they? Systematic review of the emergency medicine literature. Am J EmergMed 2011;29:333–45. https://doi.org/10.1016/j.ajem.2010.01.003
14. Uscher-Pines L, Pines J, Kellermann A, Gillen E, Mehrotra A. Deciding to visit the emergencydepartment for non-urgent conditions: a systematic review of the literature. Am J Manag Care2013;19:47–59.
DOI: 10.3310/hsdr08150 Health Services and Delivery Research 2020 Vol. 8 No. 15
© Queen’s Printer and Controller of HMSO 2020. This work was produced by O’Cathain et al. under the terms of a commissioning contract issued by the Secretary of Statefor Health and Social Care. This issue may be freely reproduced for the purposes of private research and study and extracts (or indeed, the full report) may be included inprofessional journals provided that suitable acknowledgement is made and the reproduction is not associated with any form of advertising. Applications for commercialreproduction should be addressed to: NIHR Journals Library, National Institute for Health Research, Evaluation, Trials and Studies Coordinating Centre, Alpha House,University of Southampton Science Park, Southampton SO16 7NS, UK.
107
15. Cheek C, Allen P, Shires L, Parry D, Ruigrok M. Low-acuity presentations to regionalemergency departments: what is the issue? Emerg Med Australas 2016;28:145–52.https://doi.org/10.1111/1742-6723.12526
16. Schumacher JR, Hall AG, Davis TC, Arnold CL, Bennett RD, Wolf MS, Carden DL.Potentially preventable use of emergency services: the role of low health literacy. Med Care2013;51:654–8. https://doi.org/10.1097/MLR.0b013e3182992c5a
17. Booker MJ, Shaw AR, Purdy S. Why do patients with ‘primary care sensitive’ problems accessambulance services? A systematic mapping review of the literature. BMJ Open 2015;5:e007726.https://doi.org/10.1136/bmjopen-2015-007726
18. Bell C. Does Peppa Pig encourage inappropriate use of primary care resources? BMJ2017;359:j5397. https://doi.org/10.1136/bmj.j5397
19. Booker MJ, Purdy S, Shaw ARG. Seeking ambulance treatment for ‘primary care’ problems:a qualitative systematic review of patient, carer and professional perspectives. BMJ Open2017;7:e016832. https://doi.org/10.1136/bmjopen-2017-016832
20. Llanwarne N, Newbould J, Burt J, Campbell JL, Roland M. Wasting the doctor’s time?A video-elicitation interview study with patients in primary care. Soc Sci Med2017;176:113–22. https://doi.org/10.1016/j.socscimed.2017.01.025
21. Goode J, Greatbatch D, O’Cathain A, Luff D, Hanlon G, Strangleman T. Risk and theresponsible health consumer: the problematics of entitlement among callers to NHS Direct.Crit Soc Policy 2004;24:210–32. https://doi.org/10.1177/0261018304041951
22. Pope C, McKenna G, Turnbull J, Prichard J, Rogers A. Navigating and making sense of urgentand emergency care processes and provision. Health Expect 2019;22:435–43. https://doi.org/10.1111/hex.12866
23. Greenfield G, Ignatowicz A, Gnani S, Bucktowonsing M, Ladbrooke T, Millington H, et al.Staff perceptions on patient motives for attending GP-led urgent care centres in London: aqualitative study. BMJ Open 2016;6:e007683. https://doi.org/10.1136/bmjopen-2015-007683
24. Van den Heede K, Van de Voorde C. Interventions to reduce emergency departmentutilisation: a review of reviews. Health Policy 2016;120:1337–49. https://doi.org/10.1016/j.healthpol.2016.10.002
25. Munro J, Nicholl J, O’Cathain A, Knowles E. Impact of NHS direct on demand for immediatecare: observational study. BMJ 2000;321:150–3. https://doi.org/10.1136/bmj.321.7254.150
26. Turner J, O’Cathain A, Knowles E, Nicholl J. Impact of the urgent care telephone serviceNHS 111 pilot sites: a controlled before and after study. BMJ Open 2013;3:e003451.https://doi.org/10.1136/bmjopen-2013-003451
27. Arain M, Campbell MJ, Nicholl JP. Impact of a GP-led walk-in centre on NHS emergencydepartments. Emerg Med J 2015;32:295–300. https://doi.org/10.1136/emermed-2013-202410
28. Coster JE, Turner JK, Bradbury D, Cantrell A. Why do people choose emergency and urgentcare services? A rapid review utilizing a systematic literature search and narrative synthesis.Acad Emerg Med 2017;24:1137–49. https://doi.org/10.1111/acem.13220
29. Kraaijvanger N, van Leeuwen H, Rijpsma D, Edwards M. Motives for self-referral to theemergency department: a systematic review of the literature. BMC Health Serv Res2016;16:685. https://doi.org/10.1186/s12913-016-1935-z
30. Turner J, Coster J, Chambers D, Cantrell A, Phung V, Knowles E, et al. What evidence is thereon the effectiveness of different models of delivering urgent care? A rapid review. Health ServDeliv Res 2015;3(43). https://doi.org/10.3310/hsdr03430
REFERENCES
NIHR Journals Library www.journalslibrary.nihr.ac.uk
108

31. He J, Hou XY, Toloo S, Patrick JR, Fitz Gerald G. Demand for hospital emergencydepartments: a conceptual understanding. World J Emerg Med 2011;2:253–61. https://doi.org/10.5847/wjem.j.1920-8642.2011.04.002
32. Toloo S, FitzGerald G, Aitken P, Ting J, Tippett V, Chu K. Emergency Health Services: Demandand Service Delivery Models. Monograph 1: Literature Review and Activity Trends. Brisbane, QLD:Queensland University of Technology; 2011.
33. Andersen RM. Revisiting the behavioral model and access to medical care: does it matter?J Health Soc Behav 1995;36:1–10. https://doi.org/10.2307/2137284
34. Weber EJ, Hirst E, Marsh M. The patient’s dilemma: attending the emergency departmentwith a minor illness. BMJ 2017;357:j1941. https://doi.org/10.1136/bmj.j1941
35. Wong G, Greenhalgh T, Westhorp G, Buckingham J, Pawson R. RAMESES publicationstandards: realist syntheses. BMC Med 2013;11:21. https://doi.org/10.1186/1741-7015-11-21
36. Bunn F, Goodman C, Reece Jones P, Russell B, Trivedi D, Sinclair A, et al. What works forwhom in the management of diabetes in people living with dementia: a realist review.BMC Med 2017;15:141. https://doi.org/10.1186/s12916-017-0909-2
37. Ford JA, Wong G, Jones AP, Steel N. Access to primary care for socioeconomicallydisadvantaged older people in rural areas: a realist review. BMJ Open 2016;6:e010652.https://doi.org/10.1136/bmjopen-2015-010652
38. Shearn K, Allmark P, Piercy H, Hirst J. Building realist program theory for large complexand messy interventions. Int J Qual Methods 2017;16:1–11. https://doi.org/10.1177/1609406917741796
39. Turnbull J, McKenna G, Prichard J, Rogers A, Crouch R, Lennon A, Pope C. Sense-makingstrategies and help-seeking behaviours associated with urgent care services: a mixed-methodsstudy. Health Serv Deliv Res 2019;7(26). https://doi.org/10.3310/hsdr07260
40. Critical Appraisal Skills Programme. CASP Qualitative Checklist. 2019. URL: https://casp-uk.net/casp-tools-checklists/ (accessed 17 May 2019).
41. Dalkin SM, Greenhalgh J, Jones D, Cunningham B, Lhussier M. What’s in a mechanism?Development of a key concept in realist evaluation. Implement Sci 2015;10:49. https://doi.org/10.1186/s13012-015-0237-x
42. Shaw J, Gray CS, Baker GR, Denis JL, Breton M, Gutberg J, et al.Mechanisms, contexts andpoints of contention: operationalizing realist-informed research for complex health interventions.BMC Med Res Methodol 2018;18:178. https://doi.org/10.1186/s12874-018-0641-4
43. Wyke S, Adamson J, Dixon D, Hunt K. Consultation and illness behaviour in response tosymptoms: a comparison of models from different disciplinary frameworks and suggestionsfor future research directions. Soc Sci Med 2013;86:79–87. https://doi.org/10.1016/j.socscimed.2013.03.007
44. Becker G, Janson-Bjerklie S, Benner P, Slobin K, Ferketich S. The dilemma of seeking urgentcare: asthma episodes and emergency service use. Soc Sci Med 1993;37:305–13.https://doi.org/10.1016/0277-9536(93)90262-3
45. Brousseau DC, Nimmer MR, Yunk NL, Nattinger AB, Greer A. Nonurgent emergency-departmentcare: analysis of parent and primary physician perspectives. Pediatrics 2011;127:e375–81.https://doi.org/10.1542/peds.2010-1723
46. Calnan M. Managing ‘minor’ disorders: pathways to a hospital accident and emergencydepartment. Sociol Health Illn 1983;5:149–67. https://doi.org/10.1111/1467-9566.ep10491503
DOI: 10.3310/hsdr08150 Health Services and Delivery Research 2020 Vol. 8 No. 15
© Queen’s Printer and Controller of HMSO 2020. This work was produced by O’Cathain et al. under the terms of a commissioning contract issued by the Secretary of Statefor Health and Social Care. This issue may be freely reproduced for the purposes of private research and study and extracts (or indeed, the full report) may be included inprofessional journals provided that suitable acknowledgement is made and the reproduction is not associated with any form of advertising. Applications for commercialreproduction should be addressed to: NIHR Journals Library, National Institute for Health Research, Evaluation, Trials and Studies Coordinating Centre, Alpha House,University of Southampton Science Park, Southampton SO16 7NS, UK.
109

47. Chin NP, Goepp JG, Malia T, Harris L, Poordabbagh A. Nonurgent use of a pediatricemergency department: a preliminary qualitative study. Pediatr Emerg Care 2006;22:22–7.https://doi.org/10.1097/01.pec.0000195756.74328.21
48. de Bont EG, Loonen N, Hendrix DA, Lepot JM, Dinant GJ, Cals JW. Childhood fever: a qualitativestudy on parents’ expectations and experiences during general practice out-of-hours careconsultations. BMC Fam Pract 2015;16:131. https://doi.org/10.1186/s12875-015-0348-0
49. Fieldston ES, Alpern ER, Nadel FM, Shea JA, Alessandrini EA. A qualitative assessment ofreasons for nonurgent visits to the emergency department: parent and health professionalopinions. Pediatr Emerg Care 2012;28:220–5. https://doi.org/10.1097/PEC.0b013e318248b431
50. Guttman N, Zimmerman DR, Nelson MS. The many faces of access: reasons for medicallynonurgent emergency department visits. J Health Polit Policy Law 2003;28:1089–120.https://doi.org/10.1215/03616878-28-6-1089
51. Hopton J, Hogg R, McKee I. Patients’ accounts of calling the doctor out of hours: qualitativestudy in one general practice. BMJ 1996;313:991–4. https://doi.org/10.1136/bmj.313.7063.991
52. Houston AM, Pickering AJ. ‘Do I don’t I call the doctor’: a qualitative study of parentalperceptions of calling the GP out-of-hours. Health Expect 2000;3:234–42. https://doi.org/10.1046/j.1369-6513.2000.00109.x
53. Hugenholtz M, Bröer C, van Daalen R. Apprehensive parents: a qualitative study ofparents seeking immediate primary care for their children. Br J Gen Pract 2009;59:173–9.https://doi.org/10.3399/bjgp09X394996
54. McGuigan T, Watson P. Non-urgent attendance at emergency departments. Emerg Nurse2010;18:34–8. https://doi.org/10.7748/en.18.6.34.s18
55. Shaw EK, Howard J, Clark EC, Etz RS, Arya R, Tallia AF. Decision-making processes of patientswho use the emergency department for primary care needs. J Health Care Poor Underserved2013;24:1288–305. https://doi.org/10.1353/hpu.2013.0140
56. Stafford V, Greenhalgh S, Davidson I. Why do patients with simple mechanical back pain seekurgent care? Physiotherapy 2014;100:66–72. https://doi.org/10.1016/j.physio.2013.08.001
57. Woolfenden S, Ritchie J, Hanson R, Nossar V. Parental use of a paediatric emergencydepartment as an ambulatory care service. Aust N Z J Public Health 2000;24:204–6.https://doi.org/10.1111/j.1467-842x.2000.tb00144.x
58. Leventhal H, Brissette I, Leventhal E. The Common-sense Model of Self-regulation of Healthand Illness. In Cameron L, Leventhal H, editors. The Self-regulation of Health and IllnessBehaviour. London: Routledge; 2003. pp. 42–65.
59. Mishel MH, Braden CJ. Uncertainty. A mediator between support and adjustment. West J Nurs Res1987;9:43–57. https://doi.org/10.1177/019394598700900106
60. Freed GL, Allen AR, Turbitt E, Nicolas C, Oakley E. Parent perspectives and reasons for lowerurgency paediatric presentations to emergency departments. Emerg Med Australas2016;28:211–15. https://doi.org/10.1111/1742-6723.12544
61. Kallestrup P, Bro F. Parents’ beliefs and expectations when presenting with a febrile child atan out-of-hours general practice clinic. Br J Gen Pract 2003;53:43–4.
62. Walsh M. The health belief model and use of accident and emergency services by the generalpublic. J Adv Nurs 1995;22:694–9. https://doi.org/10.1046/j.1365-2648.1995.22040694.x
REFERENCES
NIHR Journals Library www.journalslibrary.nihr.ac.uk
110
63. Watson MC, Ferguson J, Barton GR, Maskrey V, Blyth A, Paudyal V, et al. A cohort studyof influences, health outcomes and costs of patients’ health-seeking behaviour for minorailments from primary and emergency care settings. BMJ Open 2015;5:e006261.https://doi.org/10.1136/bmjopen-2014-006261
64. Williams A, O’Rourke P, Keogh S. Making choices: why parents present to the emergencydepartment for non-urgent care. Arch Dis Child 2009;94:817–20. https://doi.org/10.1136/adc.2008.149823
65. Ahl C, Nyström M, Jansson L. Making up one’s mind: – patients’ experiences of calling anambulance. Accid Emerg Nurs 2006;14:11–19. https://doi.org/10.1016/j.aaen.2005.10.002
66. Berry A, Brousseau D, Brotanek JM, Tomany-Korman S, Flores G. Why do parents bringchildren to the emergency department for nonurgent conditions? A qualitative study.Ambul Pediatr 2008;8:360–7. https://doi.org/10.1016/j.ambp.2008.07.001
67. Capp R, Kelley L, Ellis P, Carmona J, Lofton A, Cobbs-Lomax D, D’Onofrio G. Reasons forfrequent emergency department use by Medicaid enrollees: a qualitative study. Acad Emerg Med2016;23:476–81. https://doi.org/10.1111/acem.12952
68. Hunter C, Chew-Graham C, Langer S, Stenhoff A, Drinkwater J, Guthrie E, Salmon P. Aqualitative study of patient choices in using emergency health care for long-term conditions:the importance of candidacy and recursivity. Patient Educ Couns 2013;93:335–41.https://doi.org/10.1016/j.pec.2013.06.001
69. Olsson M, Hansagi H. Repeated use of the emergency department: qualitative study of thepatient’s perspective. Emerg Med J 2001;18:430–4. https://doi.org/10.1136/emj.18.6.430
70. Beck U. Risk Society: Towards a New Modernity. London: SAGE Publications Ltd; 1992.
71. Pescosolido B. Beyond rational choice: the social dynamics of how people seek help.Am J Sociol 1992;97:1096–138. https://doi.org/10.1086/229863
72. Agarwal S, Banerjee J, Baker R, Conroy S, Hsu R, Rashid A, et al. Potentially avoidableemergency department attendance: interview study of patients’ reasons for attendance.Emerg Med J 2012;29:e3. https://doi.org/10.1136/emermed-2011-200585
73. Booker MJ, Simmonds RL, Purdy S. Patients who call emergency ambulances for primary careproblems: a qualitative study of the decision-making process. Emerg Med J 2014;31:448–52.https://doi.org/10.1136/emermed-2012-202124
74. Dixon-Woods M, Cavers D, Agarwal S, Annandale E, Arthur A, Harvey J, et al. Conducting acritical interpretive synthesis of the literature on access to healthcare by vulnerable groups.BMC Med Res Methodol 2006;6:35. https://doi.org/10.1186/1471-2288-6-35
75. Dingwall R, Murray T. Categorization in accident departments: ‘good’ patients, ‘bad’ patientsand ‘children’. Sociol Health Illn 1983;5:127–48. https://doi.org/10.1111/1467-9566.ep10491496
76. Deavenport-Saman A, Lu Y, Smith K, Yin L. Do children with autism overutilize the emergencydepartment? Examining visit urgency and subsequent hospital admissions. Matern Child Health J2016;20:306–14. https://doi.org/10.1007/s10995-015-1830-y
77. Koziol-McLain J, Price DW, Weiss B, Quinn AA, Honigman B. Seeking care for nonurgentmedical conditions in the emergency department: through the eyes of the patient. J Emerg Nurs2000;26:554–63. https://doi.org/10.1067/men.2000.110904
78. Dingwall R. Aspects of Illness (Medicine in Society). Farnham: Ashgate Publishing; 2001.
79. Zola IK. Pathways to the doctor-from person to patient. Soc Sci Med 1973;7:677–89.https://doi.org/10.1016/0037-7856(73)90002-4
DOI: 10.3310/hsdr08150 Health Services and Delivery Research 2020 Vol. 8 No. 15
© Queen’s Printer and Controller of HMSO 2020. This work was produced by O’Cathain et al. under the terms of a commissioning contract issued by the Secretary of Statefor Health and Social Care. This issue may be freely reproduced for the purposes of private research and study and extracts (or indeed, the full report) may be included inprofessional journals provided that suitable acknowledgement is made and the reproduction is not associated with any form of advertising. Applications for commercialreproduction should be addressed to: NIHR Journals Library, National Institute for Health Research, Evaluation, Trials and Studies Coordinating Centre, Alpha House,University of Southampton Science Park, Southampton SO16 7NS, UK.
111

80. Hodgins MJ, Wuest J. Uncovering factors affecting use of the emergency department for lessurgent health problems in urban and rural areas. Can J Nurs Res 2007;39:78–102.
81. Mostajer Haqiqi A, Bedos C, Macdonald ME. The emergency department as a ‘last resort’:why parents seek care for their child’s nontraumatic dental problems in the emergency room.Community Dent Oral Epidemiol 2016;44:493–503. https://doi.org/10.1111/cdoe.12239
82. Keizer Beache S, Guell C. Non-urgent accident and emergency department use as a sociallyshared custom: a qualitative study. Emerg Med J 2016;33:47–51. https://doi.org/10.1136/emermed-2014-204039
83. Neill SJ, Jones CH, Lakhanpaul M, Roland DT, Thompson MJ. Parents’ help-seeking behavioursduring acute childhood illness at home: a contribution to explanatory theory. J Child HealthCare 2016;20:77–86. https://doi.org/10.1177/1367493514551309
84. Wilkin H, Cohen E, Tannebaum M. How low-income residents decide between emergencyand primary health care for non-urgent treatment. Howard J Commun 2012;23:157–74.https://doi.org/10.1080/10646175.2012.667725
85. Goepp JG, Chin NP, Massad J, Edwards LA. Pediatric emergency department outreach:solving medical problems or revealing community solutions? J Health Care Poor Underserved2004;15:522–9. https://doi.org/10.1353/hpu.2004.0060
86. Carret ML, Fassa AC, Domingues MR. Inappropriate use of emergency services: a systematicreview of prevalence and associated factors. Cad Saude Publica 2009;25:7–28. https://doi.org/10.1590/S0102-311X2009000100002
87. Diserens L, Egli L, Fustinoni S, Santos-Eggimann B, Staeger P, Hugli O. Emergency departmentvisits for non-life-threatening conditions: evolution over 13 years in a Swiss urban teachinghospital. Swiss Med Wkly 2015;145:w14123. https://doi.org/10.4414/smw.2015.14123
88. Keizer E, Smits M, Peters Y, Huibers L, Giesen P, Wensing M. Contacts with out-of-hoursprimary care for nonurgent problems: patients’ beliefs or deficiencies in healthcare? BMC FamPract 2015;16:157. https://doi.org/10.1186/s12875-015-0376-9
89. Antonovsky H, Sagy S. The development of a sense of coherence and its impact on responsesto stress situations. J Soc Psychol 1986;126:213–25.
90. Durant E, Fahimi J. Factors associated with ambulance use among patients with low-acuityconditions. Prehosp Emerg Care 2012;16:329–37. https://doi.org/10.3109/10903127.2012.670688
91. Howard MS, Davis BA, Anderson C, Cherry D, Koller P, Shelton D. Patients’ perspective onchoosing the emergency department for nonurgent medical care: a qualitative study exploringone reason for overcrowding. J Emerg Nurs 2005;31:429–35. https://doi.org/10.1016/j.jen.2005.06.023
92. Lawson CC, Carroll K, Gonzalez R, Priolo C, Apter AJ, Rhodes KV. ‘No other choice’: reasonsfor emergency department utilization among urban adults with acute asthma. Acad Emerg Med2014;21:1–8. https://doi.org/10.1111/acem.12285
93. Penson R, Coleman P, Mason S, Nicholl J. Why do patients with minor or moderate conditionsthat could be managed in other settings attend the emergency department? Emerg Med J2012;29:487–91. https://doi.org/10.1136/emj.2010.107276
94. Goeman DP, Aroni RA, Sawyer SM, Stewart K, Thien FC, Abramson MJ, Douglass JA. Back formore: a qualitative study of emergency department reattendance for asthma. Med J Aust2004;180:113–17. https://doi.org/10.5694/j.1326-5377.2004.tb05831.x
REFERENCES
NIHR Journals Library www.journalslibrary.nihr.ac.uk
112

95. Rogers A, Nicolaas G. Understanding the patterns and processes of primary care use:a combined quantitative and qualitative approach. Sociol Res Online 1998;3:1–13.https://doi.org/10.5153/sro.192
96. Zimmerman FJ. Habit, custom, and power: a multi-level theory of population health. Soc SciMed 2013;80:47–56. https://doi.org/10.1016/j.socscimed.2012.12.029
97. Nilsen P, Roback K, Broström A, Ellström PE. Creatures of habit: accounting for the role ofhabit in implementation research on clinical behaviour change. Implement Sci 2012;7:53.https://doi.org/10.1186/1748-5908-7-53
98. MacKichan F, Brangan E, Wye L, Checkland K, Lasserson D, Huntley A, et al. Why do patientsseek primary medical care in emergency departments? An ethnographic exploration of access togeneral practice. BMJ Open 2017;7:e013816. https://doi.org/10.1136/bmjopen-2016-013816
99. Drummond N, McConnachie A, O’Donnell C, Moffat K, Wilson P, Ross S. Social variationin reasons for contacting general practice out-of-hours: implications for daytime serviceprovision? Br J Gen Pract 2000;50:460–4.
100. Thornton V, Fogarty A, Jones P, Ragaban N, Simpson C. Why do patients self-present toMiddlemore Hospital Emergency Department? N Z Med J 2014;127:19–30.
101. Zhou Y, Abel G, Warren F, Roland M, Campbell J, Lyratzopoulos G. Do difficulties in accessingin-hours primary care predict higher use of out-of-hours GP services? Evidence from anEnglish National Patient Survey. Emerg Med J 2015;32:373–8. https://doi.org/10.1136/emermed-2013-203451
102. van den Berg MJ, van Loenen T, Westert GP. Accessible and continuous primary care mayhelp reduce rates of emergency department use. An international survey in 34 countries.Fam Pract 2016;33:42–50. https://doi.org/10.1093/fampra/cmv082
103. Benahmed N, Laokri S, Zhang WH, Verhaeghe N, Trybou J, Cohen L, et al. Determinants ofnonurgent use of the emergency department for pediatric patients in 12 hospitals in Belgium.Eur J Pediatr 2012;171:1829–37. https://doi.org/10.1007/s00431-012-1853-y
104. Moll van Charante EP, ter Riet G, Bindels P. Self-referrals to the A.E department duringout-of-hours: patients’ motives and characteristics. Patient Educ Couns 2008;70:256–65.https://doi.org/10.1016/j.pec.2007.10.012
105. O’Keeffe C, Mason S, Jacques R, Nicholl J. Characterising non-urgent users of the emergencydepartment (ED): a retrospective analysis of routine ED data. PLOS ONE 2018;13:e0192855.https://doi.org/10.1371/journal.pone.0192855
106. Butcher B. Sex, drugs and A&E: 10 charts on how the under-30s use the NHS. BBC News,21 June 2018. URL: www.bbc.co.uk/news/uk-44456571 (accessed 25 February 2020).
107. McHale P, Wood S, Hughes K, Bellis MA, Demnitz U, Wyke S. Who uses emergencydepartments inappropriately and when – a national cross-sectional study using a monitoringdata system. BMC Med 2013;11:258. https://doi.org/10.1186/1741-7015-11-258
108. Viner RM, Blackburn F, White F, Mannie R, Parr T, Nelson S, et al. The impact of out-of-hospital models of care on paediatric emergency department presentations. Arch Dis Child2018;103:128–36. https://doi.org/10.1136/archdischild-2017-313307
109. Smith J, Jarman M, Osborn M. Doing Interpretative Phenomenological Analysis. In Murray M,Chamberlain K, editors. Qualitative Health Psychology: Theories and Methods. London: SAGEPublications Ltd; 1999. pp. 218–40. https://doi.org/10.4135/9781446217870.n14
DOI: 10.3310/hsdr08150 Health Services and Delivery Research 2020 Vol. 8 No. 15
© Queen’s Printer and Controller of HMSO 2020. This work was produced by O’Cathain et al. under the terms of a commissioning contract issued by the Secretary of Statefor Health and Social Care. This issue may be freely reproduced for the purposes of private research and study and extracts (or indeed, the full report) may be included inprofessional journals provided that suitable acknowledgement is made and the reproduction is not associated with any form of advertising. Applications for commercialreproduction should be addressed to: NIHR Journals Library, National Institute for Health Research, Evaluation, Trials and Studies Coordinating Centre, Alpha House,University of Southampton Science Park, Southampton SO16 7NS, UK.
113

110. Smith J. Reflecting on the development of interpretative phenomenological analysis and itscontribution to qualitative research in psychology. Qual Res Psychol 2004;1:39–54.
111. Pietkiewicz I, Smith J. A practical guide to using interpretative phenomenological analysis inqualitative research psychology. Psychol J 2014;20:7–14. https://doi.org/10.14691/CPPJ.20.1.7
112. Collins A, McLachlan SA, Philip J. Initial perceptions of palliative care: an exploratoryqualitative study of patients with advanced cancer and their family caregivers. Palliat Med2017;31:825–32. https://doi.org/10.1177/0269216317696420
113. Kelly CA, O’Brien MR. Difficult decisions: an interpretative phenomenological analysis studyof healthcare professionals’ perceptions of oxygen therapy in palliative care. Palliat Med2015;29:950–8. https://doi.org/10.1177/0269216315584864
114. McCann TV, Lubman DI, Boardman G, Flood M. Affected family members’ experience of,and coping with, aggression and violence within the context of problematic substance use:a qualitative study. BMC Psychiatry 2017;17:209. https://doi.org/10.1186/s12888-017-1374-3
115. Rifshana F, Breheny M, Taylor J, Ross K. The parental experience of caring for a childwith type 1 diabetes. J Child Fam Stud 2017;26:3226–36. https://doi.org/10.1007/s10826-017-0806-5
116. Tong A, Sainsbury P, Craig J. Consolidated criteria for reporting qualitative research (COREQ):a 32-item checklist for interviews and focus groups. Int J Qual Health C 2007;19:349–57.https://doi.org/10.1093/intqhc/mzm042
117. Kai J. What worries parents when their preschool children are acutely ill, and why:a qualitative study. BMJ 1996;313:983–6. https://doi.org/10.1136/bmj.313.7063.983
118. Niedzwiecki MJ, Sharma PJ, Kanzaria HK, McConville S, Hsia RY. Factors associated withemergency department use by patients with and without mental health diagnoses. JAMA NetwOpen 2018;1:e183528. https://doi.org/10.1001/jamanetworkopen.2018.3528
119. Ballou S, Mitsuhashi S, Sankin LS, Petersen TS, Zubiago J, Lembo C, et al. Emergencydepartment visits for depression in the United States from 2006 to 2014. Gen Hosp Psychiatry2019;59:14–19. https://doi.org/10.1016/j.genhosppsych.2019.04.015
120. Hooker EA, Mallow PJ, Oglesby MM. Characteristics and trends of emergency departmentvisits in the United States (2010-2014). J Emerg Med 2019;56:344–51. https://doi.org/10.1016/j.jemermed.2018.12.025
121. Perera J, Wand T, Bein KJ, Chalkley D, Ivers R, Steinbeck KS, et al. Presentations to NSWemergency departments with self-harm, suicidal ideation, or intentional poisoning, 2010–2014.Med J Aust 2018;208:348–53. https://doi.org/10.5694/mja17.00589
122. Hiscock H, Neely RJ, Lei S, Freed G. Paediatric mental and physical health presentations toemergency departments, Victoria, 2008-15. Med J Aust 2018;208:343–8. https://doi.org/10.5694/mja17.00434
123. Kalb LG, Stapp EK, Ballard ED, Holingue C, Keefer A, Riley A. Trends in psychiatric emergencydepartment visits among youth and young adults in the US. Pediatrics 2019;143:e20182192.https://doi.org/10.1542/peds.2018-2192
124. Hsia RY, Niedzwiecki M. Avoidable emergency department visits: a starting point. Int J QualHealth Care 2017;29:642–5. https://doi.org/10.1093/intqhc/mzx081
125. Duncan EAS, Best C, Dougall N, Skar S, Evans J, Corfield AR, et al. Epidemiology of emergencyambulance service calls related to mental health problems and self harm: a national recordlinkage study. Scand J Trauma Resusc Emerg Med 2019;27:34. https://doi.org/10.1186/s13049-019-0611-9
REFERENCES
NIHR Journals Library www.journalslibrary.nihr.ac.uk
114

126. Roggenkamp R, Andrew E, Nehme Z, Cox S, Smith K. Descriptive analysis of mental health-related presentations to emergency medical services. Prehosp Emerg Care 2018;22:399–405.https://doi.org/10.1080/10903127.2017.1399181
127. Lockett H, Lai J, Tuason C, Jury A, Fergusson D. Primary healthcare utilisation among adults withmood and anxiety disorders: an analysis of the New Zealand Health Survey. J Prim Health Care2018;10:68–75. https://doi.org/10.1071/HC17077
128. Prior A, Vestergaard M, Larsen KK, Fenger-Grøn M. Association between perceived stress,multimorbidity and primary care health services: a Danish population-based cohort study.BMJ Open 2018;8:e018323. https://doi.org/10.1136/bmjopen-2017-018323
129. NHS England. GP Patient Survey 2018. London: NHS England; 2018. URL: www.england.nhs.uk/statistics/2018/08/09/gp-patient-survey-2018/ (accessed 7 October 2019).
130. Whittaker W, Anselmi L, Kristensen SR, Lau YS, Bailey S, Bower P, et al. Associations betweenextending access to primary care and emergency department visits: a difference-in-differencesanalysis. PLOS Med 2016;13:e1002113. https://doi.org/10.1371/journal.pmed.1002113
131. Borg K, Wright B, Sannen L, Dumas D, Walker T, Bragge P. Ambulances are for emergencies:shifting attitudes through a research-informed behaviour change campaign. Health Res Policy Syst2019;17:31. https://doi.org/10.1186/s12961-019-0430-5
132. FitzGerald G, Toloo GS, Aitken P, Keijzers G, Scuffham P. Public use and perceptions ofemergency departments: a population survey. Emerg Med Australas 2015;27:336–42.https://doi.org/10.1111/1742-6723.12420
133. Adamson J, Ben-Shlomo Y, Chaturvedi N, Donovan J. Ethnicity, socio-economic position andgender–do they affect reported health-care seeking behaviour? Soc Sci Med 2003;57:895–904.https://doi.org/10.1016/S0277-9536(02)00458-6
134. Kirkby HM, Roberts LM. Inappropriate 999 calls: an online pilot survey. Emerg Med J2012;29:141–6. https://doi.org/10.1136/emj.2010.092346
135. Adamson J, Ben-ShlomoY, Chaturvedi N, Donovan J. Exploring the impact of patient views on‘appropriate’ use of services and help seeking: amixedmethod study. Br J Gen Pract 2009;59:e226–33.https://doi.org/10.3399/bjgp09X453530
136. Schumacher J, Hendry P, Hall A, Lutz B, Carden D. EMF-250 An emergency department-to-homeintervention to improve patient activation. Ann Emerg Med 2014;64:S89–90. https://doi.org/10.1016/j.annemergmed.2014.07.277
137. Morrison AK, Schapira MM, Gorelick MH, Hoffmann RG, Brousseau DC. Low caregiver healthliteracy is associated with higher pediatric emergency department use and nonurgent visits.Acad Pediatr 2014;14:309–14. https://doi.org/10.1016/j.acap.2014.01.004
138. Duell P, Wright D, Renzaho AM, Bhattacharya D. Optimal health literacy measurement forthe clinical setting: a systematic review. Patient Educ Couns 2015;98:1295–307. https://doi.org/10.1016/j.pec.2015.04.003
139. Osborne RH, Batterham RW, Elsworth GR, Hawkins M, Buchbinder R. The groundedpsychometric development and initial validation of the Health Literacy Questionnaire (HLQ).BMC Public Health 2013;13:658. https://doi.org/10.1186/1471-2458-13-658
140. NHS England. GP Patient Survey – Technical Annex. London: NHS England; 2017.
141. Chatterjee S, Price B. Regression Analysis by Example. New York, NY: John Wiley and Sons;1977.
DOI: 10.3310/hsdr08150 Health Services and Delivery Research 2020 Vol. 8 No. 15
© Queen’s Printer and Controller of HMSO 2020. This work was produced by O’Cathain et al. under the terms of a commissioning contract issued by the Secretary of Statefor Health and Social Care. This issue may be freely reproduced for the purposes of private research and study and extracts (or indeed, the full report) may be included inprofessional journals provided that suitable acknowledgement is made and the reproduction is not associated with any form of advertising. Applications for commercialreproduction should be addressed to: NIHR Journals Library, National Institute for Health Research, Evaluation, Trials and Studies Coordinating Centre, Alpha House,University of Southampton Science Park, Southampton SO16 7NS, UK.
115

142. von Elm E, Altman DG, Egger M, Pocock SJ, Gøtzsche PC, Vandenbroucke JP. Strengtheningthe reporting of observational studies in epidemiology (STROBE) statement: guidelines forreporting observational studies. BMJ 2007;335:806. https://doi.org/10.1136/bmj.39335.541782.A
143. Farmer T, Robinson K, Elliott SJ, Eyles J. Developing and implementing a triangulationprotocol for qualitative health research. Qual Health Res 2006;16:377–94. https://doi.org/10.1177/1049732305285708
144. NHS England. Transforming Urgent and Emergency Care Services in England. Urgent and EmergencyCare Review. End of Phase 1 Report. London: NHS England; 2013.
145. Gershlick B, Fisher R. A Worrying Cycle of Pressure for GPs in Deprived Areas. London:The Health Foundation; 2019.
146. Ahl C, Nyström M. To handle the unexpected – the meaning of caring in pre-hospitalemergency care. Int Emerg Nurs 2012;20:33–41. https://doi.org/10.1016/j.ienj.2011.03.001
147. Goeman DP, Aroni RA, Stewart K, Sawyer SM, Thien FC, Abramson MJ, Douglass JA. Patients’views of the burden of asthma: a qualitative study. Med J Aust 2002;177:295–9.
REFERENCES
NIHR Journals Library www.journalslibrary.nihr.ac.uk
116
Appendix 1 Objectives specified inthe proposal
The objectives specified in the proposal were to:
1. identify drivers of demand for urgent care from the range of emergency, urgent and routine healthservices available, in particular the drivers of the propensity to seek care from a higher-acuityservice than is clinically necessary (evidence synthesis and qualitative interview study)
2. understand how different subgroups of the population make decisions about help-seeking to informpotential intervention strategies (evidence synthesis, qualitative interview study and generalpopulation survey)
3. measure the prevalence of public attitudes towards seeking urgent care, and how these vary indifferent circumstances and by different subgroups of the population (general population survey).
DOI: 10.3310/hsdr08150 Health Services and Delivery Research 2020 Vol. 8 No. 15
© Queen’s Printer and Controller of HMSO 2020. This work was produced by O’Cathain et al. under the terms of a commissioning contract issued by the Secretary of Statefor Health and Social Care. This issue may be freely reproduced for the purposes of private research and study and extracts (or indeed, the full report) may be included inprofessional journals provided that suitable acknowledgement is made and the reproduction is not associated with any form of advertising. Applications for commercialreproduction should be addressed to: NIHR Journals Library, National Institute for Health Research, Evaluation, Trials and Studies Coordinating Centre, Alpha House,University of Southampton Science Park, Southampton SO16 7NS, UK.
117


Appendix 2 Search strategies and termsused in reviews for realist review
Coster et al.28 searched MEDLINE, EMBASE, The Cochrane Library, Web of Science™ (ClarivateAnalytics, Philadelphia, PA, USA) and CINAHL (Cumulative Index to Nursing and Allied Health
Literature) from 1995 to 2016. Keywords related to emergency and urgent care services, healthservice demand and factors relating to rising demand. The search terms included ambulance, ED,appropriate care, utilization and urgent care.
Kraaijvanger et al.29 searched MEDLINE, EMBASE, The Cochrane Library, CINAHL and PubMed up toFebruary 2015. Searches used a combination of the following terms: ED, self-referred, referral, walk-in,motives and reasons. Studies were included if participants were self-referred to the ED.
Booker et al.17 searched MEDLINE, EMBASE, PsycINFO, Web of Science and CINAHL from 1980 toJune 2014. Search terms related to ‘primary care sensitive clinical conditions’ and ‘health care fromambulance services’ were used. Readers are referred to the PROSPERO register for details, althoughspecific search terms are not included in the register. The ‘primary care-related’ aspects of includedpapers required explicit reference to terms related to primary care or family medicine, or focused onsome of a list of indicator presentations.
Turnbull et al.39 searched policy and published research MEDLINE, EMBASE, Web of Science, CINAHLand PsycINFO from 1990 to 2017; their search only included articles up to 2016 at the time theyshared their database with us in February 2017. The strategy combined terms relating to urgent careand non-urgent use of emergency care services and terms relating to patient experiences, for examplepatient help-seeking and decision-making.
DOI: 10.3310/hsdr08150 Health Services and Delivery Research 2020 Vol. 8 No. 15
© Queen’s Printer and Controller of HMSO 2020. This work was produced by O’Cathain et al. under the terms of a commissioning contract issued by the Secretary of Statefor Health and Social Care. This issue may be freely reproduced for the purposes of private research and study and extracts (or indeed, the full report) may be included inprofessional journals provided that suitable acknowledgement is made and the reproduction is not associated with any form of advertising. Applications for commercialreproduction should be addressed to: NIHR Journals Library, National Institute for Health Research, Evaluation, Trials and Studies Coordinating Centre, Alpha House,University of Southampton Science Park, Southampton SO16 7NS, UK.
119


Appendix 3 Relevance and contextappraisal of included qualitative articles
DOI: 10.3310/hsdr08150 Health Services and Delivery Research 2020 Vol. 8 No. 15
© Queen’s Printer and Controller of HMSO 2020. This work was produced by O’Cathain et al. under the terms of a commissioning contract issued by the Secretary of Statefor Health and Social Care. This issue may be freely reproduced for the purposes of private research and study and extracts (or indeed, the full report) may be included inprofessional journals provided that suitable acknowledgement is made and the reproduction is not associated with any form of advertising. Applications for commercialreproduction should be addressed to: NIHR Journals Library, National Institute for Health Research, Evaluation, Trials and Studies Coordinating Centre, Alpha House,University of Southampton Science Park, Southampton SO16 7NS, UK.
121

TABLE 15 Relevance and context appraisal of included qualitative articles
Authors and yearof publication
Relevancecode
Definition of sample/participants asdescribed in the paper, and wheredescription(s) can be found(title/abstract/methods) Service Comments
Adequacy of description of key aspectsof context
ServiceGeographicalsetting
Demographicdetails
Agarwal et al.,201272
1 Title: ‘Potentially avoidable ED attendance’
Abstract: ‘could have been managed in analternative service’
Methods: ‘Suitable to be cared for in analternative urgent care provider serviceincluding primary care’/’attending the EDwith urgent care needs that could bemanaged in other urgent care environmentslocally’
ED, two-thirdsarriving byambulance
‘Non-urgent’ defined toinclude referral of relativelyserious problems (e.g. chestpain, collapse) to a centrestaffed by doctors, nurses andemergency practitioners
Yes No Yes
Ahl et al. 200665 1 Methods: ‘had used ambulance care withinthe past 3 months . . . selected in order toachieve a large variation in . . . emergencypriorities and medical diagnosis’
Background of 2012 paper: ‘pre-hospital caresituations that are not defined as traumaticor life threatening’
Ambulance – Yes Poor Poor
APPENDIX
3
NIH
RJournals
Library
www.jo
urnalslib
rary.nihr.ac.u
k
122
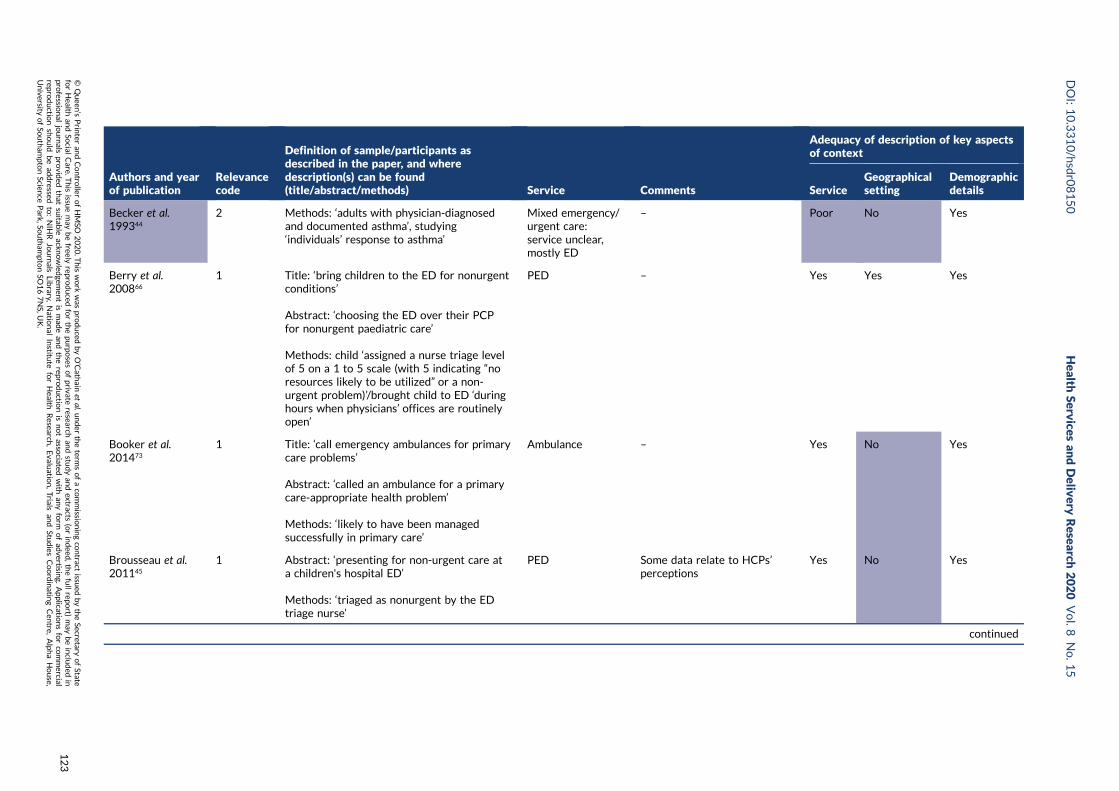
Authors and yearof publication
Relevancecode
Definition of sample/participants asdescribed in the paper, and wheredescription(s) can be found(title/abstract/methods) Service Comments
Adequacy of description of key aspectsof context
ServiceGeographicalsetting
Demographicdetails
Becker et al.199344
2 Methods: ‘adults with physician-diagnosedand documented asthma’, studying‘individuals’ response to asthma’
Mixed emergency/urgent care:service unclear,mostly ED
– Poor No Yes
Berry et al.200866
1 Title: ‘bring children to the ED for nonurgentconditions’
Abstract: ‘choosing the ED over their PCPfor nonurgent paediatric care’
Methods: child ‘assigned a nurse triage levelof 5 on a 1 to 5 scale (with 5 indicating “noresources likely to be utilized” or a non-urgent problem)’/brought child to ED ‘duringhours when physicians’ offices are routinelyopen’
PED – Yes Yes Yes
Booker et al.201473
1 Title: ‘call emergency ambulances for primarycare problems’
Abstract: ‘called an ambulance for a primarycare-appropriate health problem’
Methods: ‘likely to have been managedsuccessfully in primary care’
Ambulance – Yes No Yes
Brousseau et al.201145
1 Abstract: ‘presenting for non-urgent care ata children's hospital ED’
Methods: ‘triaged as nonurgent by the EDtriage nurse’
PED Some data relate to HCPs’perceptions
Yes No Yes
continued
DOI:10.3310/hsdr08150
Health
Servicesan
dDelivery
Research
2020
Vol.8
No.1
5
©Queen
’sPrin
teran
dContro
llerofHMSO
2020.T
hiswork
was
produced
byO’Cath
ainet
al.under
theterm
sofaco
mmissio
ningco
ntract
issued
bytheSecretary
ofState
forHealth
andSo
cialCare.T
his
issuemay
befreely
reproduced
forthepu
rposes
ofprivate
researchan
dstu
dyan
dextracts
(orindeed
,thefullrepo
rt)may
beinclu
ded
inpro
fessional
journals
provid
edthat
suitab
leackn
owled
gemen
tis
mad
ean
dtherepro
ductio
nis
notasso
ciatedwith
anyform
ofad
vertising.
Applicatio
nsforco
mmercial
reproductio
nshould
bead
dressed
to:NIH
RJournals
Library,
Natio
nal
Institu
teforHealth
Research
,Evalu
ation,Trials
and
Studies
Coordinatin
gCen
tre,Alph
aHouse,
University
ofSo
utham
ptonScien
cePark,So
utham
ptonSO
167NS,U
K.
123

TABLE 15 Relevance and context appraisal of included qualitative articles (continued )
Authors and yearof publication
Relevancecode
Definition of sample/participants asdescribed in the paper, and wheredescription(s) can be found(title/abstract/methods) Service Comments
Adequacy of description of key aspectsof context
ServiceGeographicalsetting
Demographicdetails
Calnan 198346 1 Methods: ‘minor condition . . . according toboth the level of medical skill needed to treatthe complaint and the facilities available totreat the condition’ – minor cuts ‘requiringcleaning and dressing only which could becarried out by a [nurse] alone’ – and minorillnesses ‘complaints of a non-traumaticnature which could have been treated bya GP’
ED – Yes No No
Capp et al. 201667 2 Abstract: ‘Frequent ED users’ (4–18 visits inpast year, if most visits not for mental healthor substance abuse reasons)
ED Sample participating in RCT‘to improve[e] primary careutilization’
Yes Yes Yes
Chin et al. 200647 1 Title: ‘Nonurgent use of a PED’
Abstract: ‘presenting to a PED for nonacutecare’
Methods: ‘in the PED whose visits were oflow acuity as defined as score of 5 on 5point Emergency Severity Index’
PED Some data relate to HCPs’perceptions
Poor Poor Yes
de Bont et al.201548
2 Methods: ‘presenting to the GP OOH centrewith a febrile child under the age of 12’
OOH – deliveredby co-op
– Yes Yes Yes
Durand et al.20127
1 Title: ‘Nonurgent patients in ED’
Methods: ‘triaged as nonurgent upon theirarrival to the ED by the triage nurse’,nonurgent defined as ‘problem could betaken care of by primary care physician’
ED Some data relate to HCPs’perceptions
Yes No Yes
Fieldston et al.201249
2 Title: ‘Nonurgent visits to the ED’
Methods: exploring and describing ‘reasonsfor nonurgent pediatric ED visitsindependent of a particular ED visit’
PED Some data relate to HCPs’perceptions
Poor Yes Yes
APPENDIX
3
NIH
RJournals
Library
www.jo
urnalslib
rary.nihr.ac.u
k
124

Authors and yearof publication
Relevancecode
Definition of sample/participants asdescribed in the paper, and wheredescription(s) can be found(title/abstract/methods) Service Comments
Adequacy of description of key aspectsof context
ServiceGeographicalsetting
Demographicdetails
Goeman et al.200494
2 Title: ‘ED reattendance for asthma’
Methods: people with asthma not controlledby their current therapy who ‘reattendedemergency departments within 12 months’
ED Part of a larger sample whereothers did not reattend
Yes Poor Yes
Goepp et al.200485
2 Results: families from ‘among residentsof the East Baltimore neighbour-hoods’(area with high poverty levels)
Conclusions: ‘low-income patients, especiallythose belonging to minority groups’
Health service use,particularly PED
Some data ethnographicobservations and communitysupport workers’ perceptionsand experiences
Yes Poor Poor
Guttman et al.200350
1 Title: ‘Medically nonurgent ED visits’
Methods: visit ‘considered medicallynonurgent’ by ED triage staff’
Adult and PED – Yes Poor Yes
Mostajer Haqiqiet al. 201681
1 Abstract: parents of child under 10 ‘seekingcare for nontraumatic dental problems in theED’ of a paediatric hospital
PED – Yes Yes Yes
Hopton et al.199651
2 Abstract: adults (or calling on behalf ofanother adult) or parents ‘who called theirdoctors out of hours’
OOH – deliveredby general practice
– Yes Yes Poor
Houston andPickering 200052
2 Methods: parents of child under 10; threecategories sampled: ‘Frequent users . . . usedthe service twice or more in the previous6 months or four times or more in theprevious year . . . One-off callers . . . one ormore call in the past 6 months and none inthe prior 3 years’
‘Non-callers . . . not used the service in theprevious 3 years’
OOH – deliveredby general practice
– Yes Yes Yes
continued
DOI:10.3310/hsdr08150
Health
Servicesan
dDelivery
Research
2020
Vol.8
No.1
5
©Queen
’sPrin
teran
dContro
llerofHMSO
2020.T
hiswork
was
produced
byO’Cath
ainet
al.under
theterm
sofaco
mmissio
ningco
ntract
issued
bytheSecretary
ofState
forHealth
andSo
cialCare.T
his
issuemay
befreely
reproduced
forthepu
rposes
ofprivate
researchan
dstu
dyan
dextracts
(orindeed
,thefullrepo
rt)may
beinclu
ded
inpro
fessional
journals
provid
edthat
suitab
leackn
owled
gemen
tis
mad
ean
dtherepro
ductio
nis
notasso
ciatedwith
anyform
ofad
vertising.
Applicatio
nsforco
mmercial
reproductio
nshould
bead
dressed
to:NIH
RJournals
Library,
Natio
nal
Institu
teforHealth
Research
,Evalu
ation,Trials
and
Studies
Coordinatin
gCen
tre,Alph
aHouse,
University
ofSo
utham
ptonScien
cePark,So
utham
ptonSO
167NS,U
K.
125
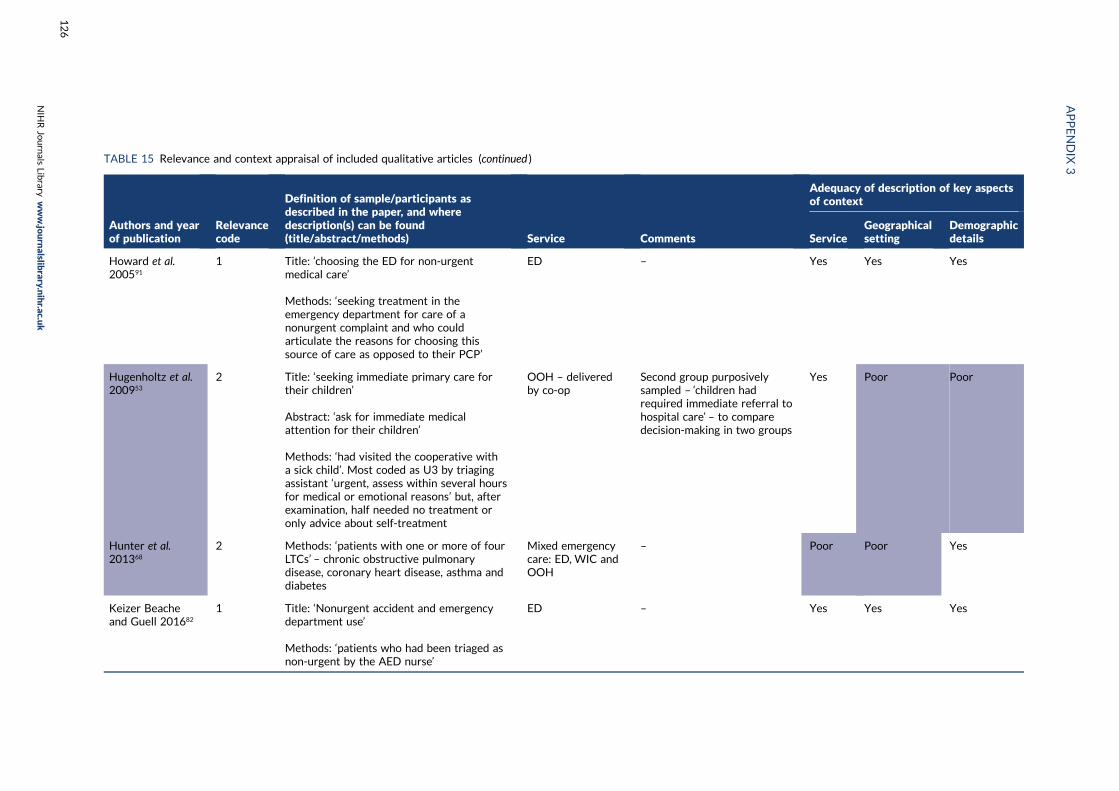
TABLE 15 Relevance and context appraisal of included qualitative articles (continued )
Authors and yearof publication
Relevancecode
Definition of sample/participants asdescribed in the paper, and wheredescription(s) can be found(title/abstract/methods) Service Comments
Adequacy of description of key aspectsof context
ServiceGeographicalsetting
Demographicdetails
Howard et al.200591
1 Title: ‘choosing the ED for non-urgentmedical care’
Methods: ‘seeking treatment in theemergency department for care of anonurgent complaint and who couldarticulate the reasons for choosing thissource of care as opposed to their PCP’
ED – Yes Yes Yes
Hugenholtz et al.200953
2 Title: ‘seeking immediate primary care fortheir children’
Abstract: ‘ask for immediate medicalattention for their children’
Methods: ‘had visited the cooperative witha sick child’. Most coded as U3 by triagingassistant ‘urgent, assess within several hoursfor medical or emotional reasons’ but, afterexamination, half needed no treatment oronly advice about self-treatment
OOH – deliveredby co-op
Second group purposivelysampled – ‘children hadrequired immediate referral tohospital care’ – to comparedecision-making in two groups
Yes Poor Poor
Hunter et al.201368
2 Methods: ‘patients with one or more of fourLTCs’ – chronic obstructive pulmonarydisease, coronary heart disease, asthma anddiabetes
Mixed emergencycare: ED, WIC andOOH
– Poor Poor Yes
Keizer Beacheand Guell 201682
1 Title: ‘Nonurgent accident and emergencydepartment use’
Methods: ‘patients who had been triaged asnon-urgent by the AED nurse’
ED – Yes Yes Yes
APPENDIX
3
NIH
RJournals
Library
www.jo
urnalslib
rary.nihr.ac.u
k
126

Authors and yearof publication
Relevancecode
Definition of sample/participants asdescribed in the paper, and wheredescription(s) can be found(title/abstract/methods) Service Comments
Adequacy of description of key aspectsof context
ServiceGeographicalsetting
Demographicdetails
Koziol-McLainet al. 200077
1 Title: ‘Seeking care for nonurgent medicalconditions in the ED’
Methods: ‘discharged from the ED; and . . .triaged as nonurgent upon their arrival inthe ED . . . based on a triage category ofgreater than 2 (triage categories range from1 (life threatening) to 4)’
ED – Yes Poor Poor
Lawson et al.201492
2 Methods: ‘patients with documentedhistories of asthma who were presentingwith . . . asthma, shortness of breath, cough,or chest pain’
ED – Yes Poor Yes
MacKichan et al.201798
1 Methods: ‘Patients who had self-referredto the ED, who attended the ED duringGP practice opening hours, who had noinvestigations while at the ED and/or weredischarged with “advice/guidance only”’
ED Some data ethnographicobservations and staffexperiences
Yes Yes Yes
McGuigan andWatson 201054
1 Title: ‘Nonurgent attendance at EDs’
Methods: ‘non-urgent attenders whohad been recorded as “self-referral” byreceptionists at . . . ED . . . for whom the EDwas the first choice for care’
ED – Poor No No
Neill et al. 201683 2 Abstract: ‘parents of children under fiveyears, from a range of socioeconomic groups’
Methods: ‘parents in communities withdiffering social, economic and ethnic profiles’
Health service use – Yes Yes Yes
continued
DOI:10.3310/hsdr08150
Health
Servicesan
dDelivery
Research
2020
Vol.8
No.1
5
©Queen
’sPrin
teran
dContro
llerofHMSO
2020.T
hiswork
was
produced
byO’Cath
ainet
al.under
theterm
sofaco
mmissio
ningco
ntract
issued
bytheSecretary
ofState
forHealth
andSo
cialCare.T
his
issuemay
befreely
reproduced
forthepu
rposes
ofprivate
researchan
dstu
dyan
dextracts
(orindeed
,thefullrepo
rt)may
beinclu
ded
inpro
fessional
journals
provid
edthat
suitab
leackn
owled
gemen
tis
mad
ean
dtherepro
ductio
nis
notasso
ciatedwith
anyform
ofad
vertising.
Applicatio
nsforco
mmercial
reproductio
nshould
bead
dressed
to:NIH
RJournals
Library,
Natio
nal
Institu
teforHealth
Research
,Evalu
ation,Trials
and
Studies
Coordinatin
gCen
tre,Alph
aHouse,
University
ofSo
utham
ptonScien
cePark,So
utham
ptonSO
167NS,U
K.
127
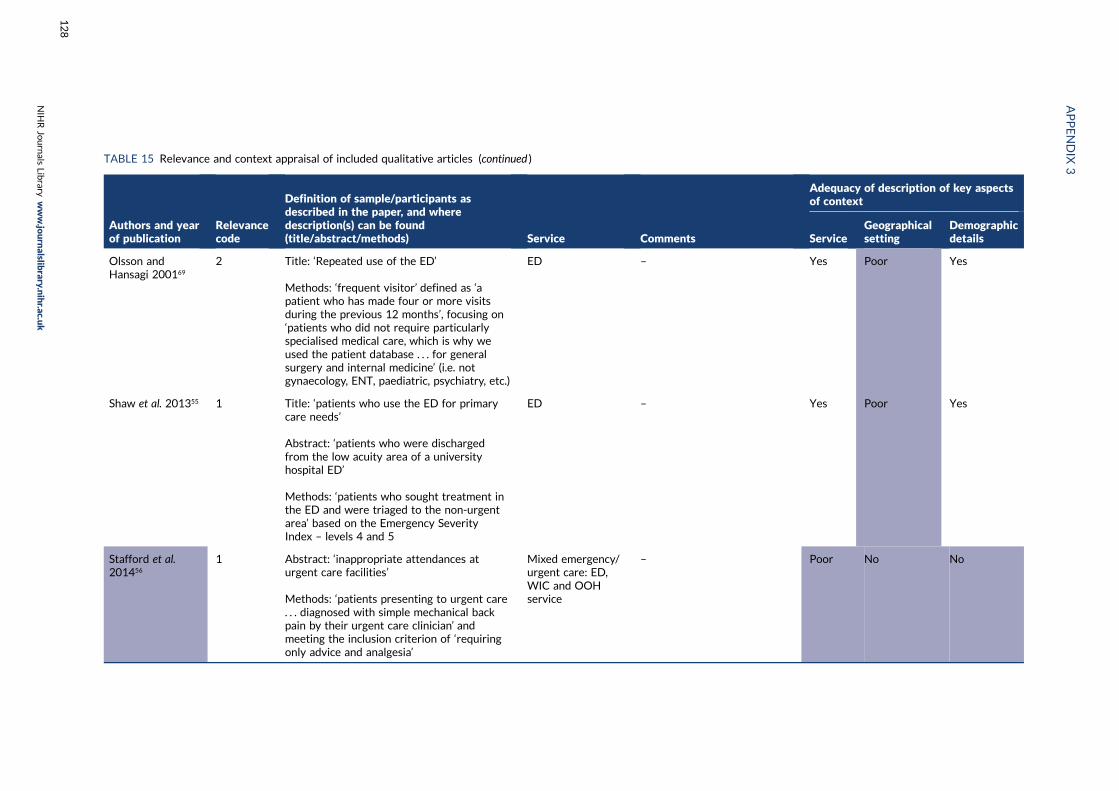
TABLE 15 Relevance and context appraisal of included qualitative articles (continued )
Authors and yearof publication
Relevancecode
Definition of sample/participants asdescribed in the paper, and wheredescription(s) can be found(title/abstract/methods) Service Comments
Adequacy of description of key aspectsof context
ServiceGeographicalsetting
Demographicdetails
Olsson andHansagi 200169
2 Title: ‘Repeated use of the ED’
Methods: ‘frequent visitor’ defined as ‘apatient who has made four or more visitsduring the previous 12 months’, focusing on‘patients who did not require particularlyspecialised medical care, which is why weused the patient database . . . for generalsurgery and internal medicine’ (i.e. notgynaecology, ENT, paediatric, psychiatry, etc.)
ED – Yes Poor Yes
Shaw et al. 201355 1 Title: ‘patients who use the ED for primarycare needs’
Abstract: ‘patients who were dischargedfrom the low acuity area of a universityhospital ED’
Methods: ‘patients who sought treatment inthe ED and were triaged to the non-urgentarea’ based on the Emergency SeverityIndex – levels 4 and 5
ED – Yes Poor Yes
Stafford et al.201456
1 Abstract: ‘inappropriate attendances aturgent care facilities’
Methods: ‘patients presenting to urgent care. . . diagnosed with simple mechanical backpain by their urgent care clinician’ andmeeting the inclusion criterion of ‘requiringonly advice and analgesia’
Mixed emergency/urgent care: ED,WIC and OOHservice
– Poor No No
APPENDIX
3
NIH
RJournals
Library
www.jo
urnalslib
rary.nihr.ac.u
k
128

Authors and yearof publication
Relevancecode
Definition of sample/participants asdescribed in the paper, and wheredescription(s) can be found(title/abstract/methods) Service Comments
Adequacy of description of key aspectsof context
ServiceGeographicalsetting
Demographicdetails
Wilkin et al.201284
2 Methods: members of a local communitywith ‘the second highest rates of calls to 911’according to hospital data. Some of theparticipants ‘were identified as 911 users ina previous research project’
ED – No Yes Yes
Woolfenden et al.200057
1 Title: ‘use of a paediatric ED as anambulatory care service’
Methods: ‘parents of children who presentedwith non-urgent illnesses to a tertiary PED’
PED – Yes No Poor
HCP, health-care professional; OOH, out-of-hours primary care provision; PC, primary care; PED, paediatric emergency department.NotesShaded boxes indicate aspects of context that are not adequately described. Where two or more aspects are shaded, the author/title column is also shaded to indicate that the paperhas significant weaknesses in its description of context factors.Relevance coding. 1: directly relevant, all papers included – aim relates to non-clinically necessary use; sample identified as non-clinically necessary users of urgent/emergencyservice. 2: partially relevant, all papers included – aim relates to non-clinically necessary use; sample identified as a group who tend to use urgent/emergency services when notclinically necessary (frequent users, people with long-term conditions, parents of young children, people with low social status), but not specifically non-urgent use in this instance.
DOI:10.3310/hsdr08150
Health
Servicesan
dDelivery
Research
2020
Vol.8
No.1
5
©Queen
’sPrin
teran
dContro
llerofHMSO
2020.T
hiswork
was
produced
byO’Cath
ainet
al.under
theterm
sofaco
mmissio
ningco
ntract
issued
bytheSecretary
ofState
forHealth
andSo
cialCare.T
his
issuemay
befreely
reproduced
forthepu
rposes
ofprivate
researchan
dstu
dyan
dextracts
(orindeed
,thefullrepo
rt)may
beinclu
ded
inpro
fessional
journals
provid
edthat
suitab
leackn
owled
gemen
tis
mad
ean
dtherepro
ductio
nis
notasso
ciatedwith
anyform
ofad
vertising.
Applicatio
nsforco
mmercial
reproductio
nshould
bead
dressed
to:NIH
RJournals
Library,
Natio
nal
Institu
teforHealth
Research
,Evalu
ation,Trials
and
Studies
Coordinatin
gCen
tre,Alph
aHouse,
University
ofSo
utham
ptonScien
cePark,So
utham
ptonSO
167NS,U
K.
129


Appendix 4 Methodological rigour ofincluded qualitative articles: CriticalAppraisal Skills Programme items
DOI: 10.3310/hsdr08150 Health Services and Delivery Research 2020 Vol. 8 No. 15
© Queen’s Printer and Controller of HMSO 2020. This work was produced by O’Cathain et al. under the terms of a commissioning contract issued by the Secretary of Statefor Health and Social Care. This issue may be freely reproduced for the purposes of private research and study and extracts (or indeed, the full report) may be included inprofessional journals provided that suitable acknowledgement is made and the reproduction is not associated with any form of advertising. Applications for commercialreproduction should be addressed to: NIHR Journals Library, National Institute for Health Research, Evaluation, Trials and Studies Coordinating Centre, Alpha House,University of Southampton Science Park, Southampton SO16 7NS, UK.
131

TABLE 16 Methodological rigour of included qualitative articles: Critical Appraisal Skills Programme items
Authors and yearof publication
Quality appraisal
1: Clearaim?
2: Qualitativemethodappropriate?
3: Designappropriateto aims?
4: Recruitmentstrategyappropriateto aims?
5: Datacollectionaddressedresearchissue?
6: Researcher/participantrelationshipconsidered?
7: Ethicsissuesconsidered?
8: Analysissufficientlyrigorous?
9: Clearfindings?
10: Researchvaluable?(New insights?Links to existingliterature?Links to policy/practice? Furtherresearch?Transferabilityof findings?)
Agarwal et al. 201272 Yes Yes Yes Yes Yes Can’t tell Yes Yes Yes Yes
aAhl et al. 200665 Yes Yes Yes Can’t tell Yes Yes Yes Yes Yes Yes
Becker et al. 199344 Yes Yes Yes Can’t tell Yes Can’t tell Can’t tell Can’t tell Yes Yes
Berry et al. 200866 Yes Yes Yes Yes Yes Can’t tell Yes Yes Yes Yes
Booker et al. 201473 Yes Yes Yes Yes Yes Yes Yes Yes Yes Yes
Brousseau et al.201145
Yes Yes Yes Yes Yes Can’t tell Yes Can’t tell Yes Yes
Calnan 198346 Yes Yes Yes Yes Yes Can’t tell Can’t tell Can’t tell Yes Limited
Capp et al. 201667 Yes Yes Yes Yes Yes Yes Yes Yes Limited Limited
Chin et al. 200647 Yes Yes Yes Can’t tell Yes Can’t tell Yes Can’t tell Limited Yes
de Bont et al. 201548 Yes Yes Yes Yes Yes Yes Yes Yes Yes Yes
Durand et al. 20127 Yes Yes Yes Yes Yes Can’t tell Yes Yes Yes Yes
Fieldston et al.201249
Yes Yes Yes Can’t tell Yes Can’t tell Can’t tell Can’t tell Limited Yes
bGoeman et al.200494
Yes Yes Yes Yes Yes Can’t tell Yes Yes Limited Yes
Goepp et al. 200485 Yes Yes Yes Yes Yes Yes Yes Can’t tell Yes Yes
APPENDIX
4
NIH
RJournals
Library
www.jo
urnalslib
rary.nihr.ac.u
k
132

Authors and yearof publication
Quality appraisal
1: Clearaim?
2: Qualitativemethodappropriate?
3: Designappropriateto aims?
4: Recruitmentstrategyappropriateto aims?
5: Datacollectionaddressedresearchissue?
6: Researcher/participantrelationshipconsidered?
7: Ethicsissuesconsidered?
8: Analysissufficientlyrigorous?
9: Clearfindings?
10: Researchvaluable?(New insights?Links to existingliterature?Links to policy/practice? Furtherresearch?Transferabilityof findings?)
Guttman et al. 200350 Yes Yes Yes Yes Yes Can’t tell Can’t tell Yes Yes Yes
Mostajer Haqiqi et al.201681
Yes Yes Yes Yes Yes Can’t tell Yes Yes Yes Yes
Hopton et al. 199651 Yes Yes Yes Yes Yes Yes Can’t tell Can’t tell Yes Yes
Houston andPickering 200052
Yes Yes Yes Yes Yes Can’t tell Can’t tell Can’t tell Yes Yes
Howard et al. 200591 Yes Yes Yes Yes Yes Can’t tell Yes Yes Yes Yes
Hugenholtz et al.200953
Yes Yes Yes Yes Yes Yes Can’t tell Can’t tell Yes Yes
Hunter et al. 201368 Yes Yes Yes Yes Yes Yes Yes Yes Yes Yes
Keizer Beache andGuell 201682
Yes Yes Yes Yes Yes Yes Yes Yes Yes Yes
Koziol-McLain et al.200077
Yes Yes Yes Yes Yes Can’t tell Yes Can’t tell Yes Yes
Lawson et al. 201492 Yes Yes Yes Yes Yes Can’t tell Yes Yes Limited Yes
MacKichan et al.201798
Yes Yes Yes Yes Yes Can’t tell Yes Yes Yes Yes
McGuigan andWatson 201054
Yes Yes Yes Yes Can’t tell Can’t tell Yes Can’t tell Limited Limited
Neill et al. 201683 Yes Yes Yes Can’t tell Yes Can’t tell Yes Yes Yes Yes
continued
DOI:10.3310/hsdr08150
Health
Servicesan
dDelivery
Research
2020
Vol.8
No.1
5
©Queen
’sPrin
teran
dContro
llerofHMSO
2020.T
hiswork
was
produced
byO’Cath
ainet
al.under
theterm
sofaco
mmissio
ningco
ntract
issued
bytheSecretary
ofState
forHealth
andSo
cialCare.T
his
issuemay
befreely
reproduced
forthepu
rposes
ofprivate
researchan
dstu
dyan
dextracts
(orindeed
,thefullrepo
rt)may
beinclu
ded
inpro
fessional
journals
provid
edthat
suitab
leackn
owled
gemen
tis
mad
ean
dtherepro
ductio
nis
notasso
ciatedwith
anyform
ofad
vertising.
Applicatio
nsforco
mmercial
reproductio
nshould
bead
dressed
to:NIH
RJournals
Library,
Natio
nal
Institu
teforHealth
Research
,Evalu
ation,Trials
and
Studies
Coordinatin
gCen
tre,Alph
aHouse,
University
ofSo
utham
ptonScien
cePark,So
utham
ptonSO
167NS,U
K.
133

TABLE 16 Methodological rigour of included qualitative articles: Critical Appraisal Skills Programme items (continued )
Authors and yearof publication
Quality appraisal
1: Clearaim?
2: Qualitativemethodappropriate?
3: Designappropriateto aims?
4: Recruitmentstrategyappropriateto aims?
5: Datacollectionaddressedresearchissue?
6: Researcher/participantrelationshipconsidered?
7: Ethicsissuesconsidered?
8: Analysissufficientlyrigorous?
9: Clearfindings?
10: Researchvaluable?(New insights?Links to existingliterature?Links to policy/practice? Furtherresearch?Transferabilityof findings?)
Olsson and Hansagi200169
Yes Yes Yes Yes Yes Yes Yes Yes Yes Yes
Shaw et al. 201355 Yes Yes Yes Yes Yes Can’t tell Yes Yes Yes Yes
Stafford et al. 201456 Yes Yes Yes Can’t tell Yes Can’t tell Yes Yes Yes Yes
Wilkin et al. 201284 Yes Yes Yes Yes Yes Can’t tell Can’t tell Yes Yes Yes
Woolfenden et al.200057
Yes Yes Yes Can’t tell Yes Can’t tell Can’t tell Can’t tell Limited Limited
a Additional methodological information obtained from Ahl and Nyström.146
b Additional methodological information obtained from Goeman et al. 2002.147
NotesShading indicates areas identified as ‘can’t tell’ or ‘limited'. Where two or more of the key methodological areas (identified in light blue in the top row) are shaded, the author columnis shaded in purple to indicate the paper has key areas of weakness.KeyYes, at least adequate information provided to have some confidence that research has been carried out appropriately; can’t tell, insufficient information provided to be confidentthat research has been carried out appropriately/well in this area. Limited, reporting of findings limited in extent and/or depth.
APPENDIX
4
NIH
RJournals
Library
www.jo
urnalslib
rary.nihr.ac.u
k
134

Appendix 5 Data extraction for includedqualitative articles
DOI: 10.3310/hsdr08150 Health Services and Delivery Research 2020 Vol. 8 No. 15
© Queen’s Printer and Controller of HMSO 2020. This work was produced by O’Cathain et al. under the terms of a commissioning contract issued by the Secretary of Statefor Health and Social Care. This issue may be freely reproduced for the purposes of private research and study and extracts (or indeed, the full report) may be included inprofessional journals provided that suitable acknowledgement is made and the reproduction is not associated with any form of advertising. Applications for commercialreproduction should be addressed to: NIHR Journals Library, National Institute for Health Research, Evaluation, Trials and Studies Coordinating Centre, Alpha House,University of Southampton Science Park, Southampton SO16 7NS, UK.
135

TABLE 17 Data extraction for included qualitative articles
Authors, yearof publicationand country Service
Stated aim/objective, plusadditional text where thisprovides justification forinclusion of the paper
Data collectionmethod; numberof participants
Identified subgroupand degree of focusin paper Key themes/issues identified
Formal theoriesexplicitly named intext and informingmethods and/ordiscussion
Agarwal et al.2012, UK72
ED and urgent carecentre; two-thirdsarriving viaambulance
To explore the reasons forattendance at the ED bypatients who could havebeen managed in analternative service
Semistructuredinterviews; 23 adultpatients and/or theircarers
LTCs – mentionedbriefly in findings
l Anxiety/concern regardingpresenting problem – belief itneeded to be dealt withquickly, and familiarity withED services
l Unable to access generalpractice: no appointments, outof hours, too long to wait,difficult to get to
l Perceptions of efficacy of theED: already being treatedthere, more thoroughinvestigation
l Lack of alternative pathways todeal with problem: otherservices unable to cope withproblem, or had transferredthem to ED
–
APPENDIX
5
NIH
RJournals
Library
www.jo
urnalslib
rary.nihr.ac.u
k
136

Authors, yearof publicationand country Service
Stated aim/objective, plusadditional text where thisprovides justification forinclusion of the paper
Data collectionmethod; numberof participants
Identified subgroupand degree of focusin paper Key themes/issues identified
Formal theoriesexplicitly named intext and informingmethods and/ordiscussion
aAhl et al. 2006,Sweden65
Ambulance,including pre-hospital care
To analyse and describepatients’ experiences relatedto the decision to call anambulance and when waitingfor it to arrive:
The issue of inappropriateuse of ambulance transport[. . .] To further understandwhether or not patients useambulance care in aninappropriate manner
Exploratoryinterviews; 20 adultpatients
No 1. Making up one’s mind: majordecision, others often involved –
situation experienced asintolerable, must get immediatehelp; someone else points outurgency of need; realising thatother options have beenexhausted after trying to manageon their own; overcominghesitancy; ambulance fastest,most safe and secure form oftransport, enabling immediateaccess to care; emphasising theneed for care, including to others
2. Waiting for help: experiencingthe wait as long; desireimmediate help; alone with one’sfeelings – anxious, afraid,neglected, lonely; avoiding/handing over responsibility –
feeling of relief; sense of safetyand trust
Morse and O’Brien:impact of suddenillness on ability tocommunicate –
mentioned indiscussion
Becker et al.1993, USA44
Mixed emergency/urgent care: rangeof services unclear,mostly ED
To study the significantvariables related toindividuals’ response toasthma:
. . . an ethos (. . .) surroundsED use by asthma patients. . . Eighty-five percent of allvisits to EDs have beenfound to be for non-life-threatening reasons . . . staffmay regard persons whoselives do not appear to bein danger as wastingtheir time
Monthlysemistructuredinterviews (×3) andsymptom diary;95 adult patients
LTC (asthma) – focusof the paper
l Confrontation with health care:
Two major themes related tocontrol shaped individuals’experience of their asthma:self-reliance and self-mastery
l Unpredictability of thecondition: affected efforts tocontrol, created uncertainty;nervous, threatened orirritated; memory of previoussevere/unexpected episodesshaped future responses
–
continued
DOI:10.3310/hsdr08150
Health
Servicesan
dDelivery
Research
2020
Vol.8
No.1
5
©Queen
’sPrin
teran
dContro
llerofHMSO
2020.T
hiswork
was
produced
byO’Cath
ainet
al.under
theterm
sofaco
mmissio
ningco
ntract
issued
bytheSecretary
ofState
forHealth
andSo
cialCare.T
his
issuemay
befreely
reproduced
forthepu
rposes
ofprivate
researchan
dstu
dyan
dextracts
(orindeed
,thefullrepo
rt)may
beinclu
ded
inpro
fessional
journals
provid
edthat
suitab
leackn
owled
gemen
tis
mad
ean
dtherepro
ductio
nis
notasso
ciatedwith
anyform
ofad
vertising.
Applicatio
nsforco
mmercial
reproductio
nshould
bead
dressed
to:NIH
RJournals
Library,
Natio
nal
Institu
teforHealth
Research
,Evalu
ation,Trials
and
Studies
Coordinatin
gCen
tre,Alph
aHouse,
University
ofSo
utham
ptonScien
cePark,So
utham
ptonSO
167NS,U
K.
137

TABLE 17 Data extraction for included qualitative articles (continued )
Authors, yearof publicationand country Service
Stated aim/objective, plusadditional text where thisprovides justification forinclusion of the paper
Data collectionmethod; numberof participants
Identified subgroupand degree of focusin paper Key themes/issues identified
Formal theoriesexplicitly named intext and informingmethods and/ordiscussion
l Discovering the limits ofcontrol; learning to identifymarkers of danger; extendingboundaries of control throughmedication use; trying to avoiduse of health-care system
l The decision to seekmedicaltreatment; previous experiencesof being criticised for attendingtoo early or delaying use ofservices; identifying a pointwhen help needed; jugglingassessment of the conditionwith other responsibilities,desire for self-reliance, andfear of death; questioningknowledge of professionals andeffectiveness of treatment
Dilemma of seeking urgent care:
l Narrow definitions in healthcare → balancing delaying toolong with seeking help toosoon, fear of judgement
l Cultural assumption ofpersonal responsibility forillness → stigma and blamefor unpredictable episodes;but services fail to cure ormanage illness effectively
APPENDIX
5
NIH
RJournals
Library
www.jo
urnalslib
rary.nihr.ac.u
k
138

Authors, yearof publicationand country Service
Stated aim/objective, plusadditional text where thisprovides justification forinclusion of the paper
Data collectionmethod; numberof participants
Identified subgroupand degree of focusin paper Key themes/issues identified
Formal theoriesexplicitly named intext and informingmethods and/ordiscussion
Berry et al.,2008, USA66
PED To identify parents’ reasonsfor choosing the ED overtheir PCP for non-urgentpaediatric care
Semistructuredethnographicinterviews;31 families(37 parents) ofchildren (age limitnot specified)
Parents: focus ofthe paper
l Problems with primary careprovider: long wait forappointment; frustration withnegative attitudes of staff atPCP office; communicationproblems with staff abouthow to get appointments;unhelpful, confusingexplanations, strong accents
l Referral by the PCP: told tocome to ED by staff orother services
l Advantages of the ED: efficient,faster service; ED resourcesincluding tests and X-rays;convenience of walk-inaspect; quality of care andconfidence in care – morethorough; PED expertise withchildren, more child-friendly
l Parent education:most PCPshad not provided anyinformation on signs to look forto know when to go to ED,urgent vs. non-urgentconditions
Andersen and Adaybehavioural model ofhealth-care utilisation:interview schedulebased on this, but notexplored in thediscussion
continued
DOI:10.3310/hsdr08150
Health
Servicesan
dDelivery
Research
2020
Vol.8
No.1
5
©Queen
’sPrin
teran
dContro
llerofHMSO
2020.T
hiswork
was
produced
byO’Cath
ainet
al.under
theterm
sofaco
mmissio
ningco
ntract
issued
bytheSecretary
ofState
forHealth
andSo
cialCare.T
his
issuemay
befreely
reproduced
forthepu
rposes
ofprivate
researchan
dstu
dyan
dextracts
(orindeed
,thefullrepo
rt)may
beinclu
ded
inpro
fessional
journals
provid
edthat
suitab
leackn
owled
gemen
tis
mad
ean
dtherepro
ductio
nis
notasso
ciatedwith
anyform
ofad
vertising.
Applicatio
nsforco
mmercial
reproductio
nshould
bead
dressed
to:NIH
RJournals
Library,
Natio
nal
Institu
teforHealth
Research
,Evalu
ation,Trials
and
Studies
Coordinatin
gCen
tre,Alph
aHouse,
University
ofSo
utham
ptonScien
cePark,So
utham
ptonSO
167NS,U
K.
139

TABLE 17 Data extraction for included qualitative articles (continued )
Authors, yearof publicationand country Service
Stated aim/objective, plusadditional text where thisprovides justification forinclusion of the paper
Data collectionmethod; numberof participants
Identified subgroupand degree of focusin paper Key themes/issues identified
Formal theoriesexplicitly named intext and informingmethods and/ordiscussion
Booker et al.2014, UK73
Ambulance To explore and understandpatient and carer decision-making around calling anambulance for primarycare-appropriate healthproblems
Semistructuredinterviews; 16 adultpatients or carers ofadults
No Main theme: patient andcarer anxiety in urgent caredecision-making
Subthemes:
l Perceptions of ambulance-basedurgent care: perceived ascompetent to deal withanything; looking to servicefor rapid assessment, decision-making and signposting
l Perceptions of community-basedcare: cannot provide the helpneeded, especially by telephone;OOH service seen as limited
l Influences of previous urgent careexperiences in decision making;interpersonal factors: priornegative experiences with otherservices – wasting time, beingreferred on, unable to accessGP, transport difficulties
l Patient and carer anxiety anddecision-making: need forurgent reassurance, sometimesas a result of health-careprofessionals’ adviceon telephone
l Interpersonal factors and theassessment of risk in decision-making: others often involved,particularly carers – less likelyto take risks, may drive personto do what carer thinks
–
APPENDIX
5
NIH
RJournals
Library
www.jo
urnalslib
rary.nihr.ac.u
k
140

Authors, yearof publicationand country Service
Stated aim/objective, plusadditional text where thisprovides justification forinclusion of the paper
Data collectionmethod; numberof participants
Identified subgroupand degree of focusin paper Key themes/issues identified
Formal theoriesexplicitly named intext and informingmethods and/ordiscussion
Brousseau et al.2011, USA45
PED To better understandparental decisions to seekcare for their children andphysician perceptions ofparents’ decisions to seeknon-urgent ED care
In-depth interviewsof 26 parents within20 PCPs; children’sage limit not specified
Parents: focus ofthe paper
l The need for immediatereassurance that theirchildren are safe from harm iscritical to parents’ decisions:looking for answers thatsatisfied worry; telephonediagnosis not as reliable;ED seen as superior, somedissatisfied with PCP;reassurance more importantthan cost
l PCP offices lack specific testsand treatments that parentsand physicians believe maybe necessary regardless ofwhether they are actuallyneeded: ED seen as equippedto handle everything
l Discrepancies exist betweenPCP and parent perceptionsof adequate communicationand access: parents did notthink they were giveneducation about appropriateED use, although PCPsconsidered they did; parentsdid not feel they were seenas quickly as they wanted,although PCPs felt that theywere accessible
l Non-urgent ED visits are notperceived as a significantenough breach in continuity ofcare to warrant significantconcern
–
continued
DOI:10.3310/hsdr08150
Health
Servicesan
dDelivery
Research
2020
Vol.8
No.1
5
©Queen
’sPrin
teran
dContro
llerofHMSO
2020.T
hiswork
was
produced
byO’Cath
ainet
al.under
theterm
sofaco
mmissio
ningco
ntract
issued
bytheSecretary
ofState
forHealth
andSo
cialCare.T
his
issuemay
befreely
reproduced
forthepu
rposes
ofprivate
researchan
dstu
dyan
dextracts
(orindeed
,thefullrepo
rt)may
beinclu
ded
inpro
fessional
journals
provid
edthat
suitab
leackn
owled
gemen
tis
mad
ean
dtherepro
ductio
nis
notasso
ciatedwith
anyform
ofad
vertising.
Applicatio
nsforco
mmercial
reproductio
nshould
bead
dressed
to:NIH
RJournals
Library,
Natio
nal
Institu
teforHealth
Research
,Evalu
ation,Trials
and
Studies
Coordinatin
gCen
tre,Alph
aHouse,
University
ofSo
utham
ptonScien
cePark,So
utham
ptonSO
167NS,U
K.
141

TABLE 17 Data extraction for included qualitative articles (continued )
Authors, yearof publicationand country Service
Stated aim/objective, plusadditional text where thisprovides justification forinclusion of the paper
Data collectionmethod; numberof participants
Identified subgroupand degree of focusin paper Key themes/issues identified
Formal theoriesexplicitly named intext and informingmethods and/ordiscussion
Calnan 1983,UK46
ED A comparison of theprocesses involved in thedecision to seek medical carefor sufferers with differenttypes of complaint:
Explanations of patient useof the hospital accident andemergency departmenthave, until recently, beencoloured by provider’sconceptions of how theservice ought to be used.Emphasis has been placedon examining why patientsdid not go to their GP
Semistructuredinterviews; 575 adultpatients
No l Illness behaviour of patients with‘minor’ cuts: decision madequickly, usually straightforward– visible problem, sometimesfamiliar, known cause, mostlyaccidental; influenced by depthof cut, blood loss, part of body,child involved, need forparticular treatment (e.g.tetanus, stitching); influence ofothers (e.g. authority figures,social network), sense ofresponsibility for individual;balancing family commitmentswith personal needs; decisionto use ED not PCP more likelyto be made if outside home ormade by others; lack of GPavailability and facilities to treat
l Illness behaviour of patients withminor illness: more complexdecision – often did not knowwhat was wrong as a resultof unfamiliar/unexplained/persistent symptoms; healthhistory sometimes gave insight;more likely to have tried tocontact GP than those withcuts, but often referred to EDby PCP staff, could not wait forappointment, not satisfied withtreatment or had no access toGP; other people excludingclose family less influential indecision-making
Bloor, drawing onSchutz’s work(not referenced inCalnan’s paper)re ‘systems ofrelevance and theattribution ofmeaning’ – differencesin cognitive processbetween novel androutine decision-making: explored indiscussion
APPENDIX
5
NIH
RJournals
Library
www.jo
urnalslib
rary.nihr.ac.u
k
142

Authors, yearof publicationand country Service
Stated aim/objective, plusadditional text where thisprovides justification forinclusion of the paper
Data collectionmethod; numberof participants
Identified subgroupand degree of focusin paper Key themes/issues identified
Formal theoriesexplicitly named intext and informingmethods and/ordiscussion
Capp et al.2016, USA67
ED To clarify from the patient’sperspective why adultMedicaid enrollees who wantto receive care co-ordinationservices to improve primarycare utilisation frequentlyuse the ED
Secondary analysisof one- to two-pageinterview summariesfrom RCT; 100 adultpatients
Deprivation: adultswith active Medicaidinsurance – focus ofthe paper
l Negative personalexperiences with the health-care system, especially PCP:lack of continuity, not listenedto, treated differently becausehad state insurance – negativecomments, made to feela nuisance
l Challenges associated withhaving low socioeconomicstatus: managing complexliving situation a priority overhealth concerns; hard toremember appointments;transportation a barrier toPCP; some lived close to EDor called an ambulance
l Significant mental andphysical chronic diseaseburden: most had chronicillness; no preventative care,responded when problem orexacerbation arose, and thenunable to access PCP quicklyenough; past and recenttraumatic life events leadingto anxiety/depression
–
continued
DOI:10.3310/hsdr08150
Health
Servicesan
dDelivery
Research
2020
Vol.8
No.1
5
©Queen
’sPrin
teran
dContro
llerofHMSO
2020.T
hiswork
was
produced
byO’Cath
ainet
al.under
theterm
sofaco
mmissio
ningco
ntract
issued
bytheSecretary
ofState
forHealth
andSo
cialCare.T
his
issuemay
befreely
reproduced
forthepu
rposes
ofprivate
researchan
dstu
dyan
dextracts
(orindeed
,thefullrepo
rt)may
beinclu
ded
inpro
fessional
journals
provid
edthat
suitab
leackn
owled
gemen
tis
mad
ean
dtherepro
ductio
nis
notasso
ciatedwith
anyform
ofad
vertising.
Applicatio
nsforco
mmercial
reproductio
nshould
bead
dressed
to:NIH
RJournals
Library,
Natio
nal
Institu
teforHealth
Research
,Evalu
ation,Trials
and
Studies
Coordinatin
gCen
tre,Alph
aHouse,
University
ofSo
utham
ptonScien
cePark,So
utham
ptonSO
167NS,U
K.
143

TABLE 17 Data extraction for included qualitative articles (continued )
Authors, yearof publicationand country Service
Stated aim/objective, plusadditional text where thisprovides justification forinclusion of the paper
Data collectionmethod; numberof participants
Identified subgroupand degree of focusin paper Key themes/issues identified
Formal theoriesexplicitly named intext and informingmethods and/ordiscussion
Chin et al.2006, USA47
PED To understand patterns ofdecision making amongfamilies presenting to a PEDfor non-acute care and tounderstand PED staffresponses
In-depthsemistructuredinterviews; 12 familycaregivers of child(age limit notspecified) (and 19 EDand paediatric EDstaff members)
Parents/caregivers:focus of the paper.Also deprivation –
fromPCPs inmedicallyunderservedareas(inner city andrural):unintentional butnotedas finding
l Patients were referred to thePED for non-urgent care byPCP office: not their choice,mostly puzzled and unhappy
l Outlier case: one personopportunistically capturing anepisodic acute event; anxietyheightened by own healthexperience
l Complexities of poverty andcompeting priorities: managingmultiple responsibilities withfew resources – ED referraladded to problem; own needsdid not match systempriorities; primary caresystem complex and inflexible,easier to use ED
l Mistrust: seen in previousstudy in relation to PCP, butnot major theme here; somereservations about lack ofunderstanding of black/whitedifferences in beliefs aboutchild nutrition; lack ofsensitivity to other issues
–
APPENDIX
5
NIH
RJournals
Library
www.jo
urnalslib
rary.nihr.ac.u
k
144

Authors, yearof publicationand country Service
Stated aim/objective, plusadditional text where thisprovides justification forinclusion of the paper
Data collectionmethod; numberof participants
Identified subgroupand degree of focusin paper Key themes/issues identified
Formal theoriesexplicitly named intext and informingmethods and/ordiscussion
de Bont et al.2015, theNetherlands48
OOH – deliveredby co-op
To explore experiences ofparents when having visitedGP OOH services with theirfebrile child
Semistructuredinterviews; 20parents of childunder 12 years old
Parents: focus ofthe paper
l Cautiously seeking care:additional symptoms orproblems prompt contact;initially wait then definitedecision to seek care; GP hadno time, problem OOHgreater worry at night whenunable to monitor easily
l Discrepancy between rationalityand emotion: anxiety increaseswith temperature – seen asindictor of illness severity;emotions take over; durationof symptoms important;parents of older childrenless anxious
l Expecting reassurance from aprofessional: that they werecaring correctly; wanting toknow cause, nothing serious;physical examinationimportant and GP expertise,not expecting medication;different doctor providessecond opinion, used toseeing different people
l A need for consistent, reliableinformation: consulting othersincluding internet beforeseeking help but not beingreassured; would valuewritten information from GPfor managing on anotheroccasion, but needs to befrom reliable source
–
continued
DOI:10.3310/hsdr08150
Health
Servicesan
dDelivery
Research
2020
Vol.8
No.1
5
©Queen
’sPrin
teran
dContro
llerofHMSO
2020.T
hiswork
was
produced
byO’Cath
ainet
al.under
theterm
sofaco
mmissio
ningco
ntract
issued
bytheSecretary
ofState
forHealth
andSo
cialCare.T
his
issuemay
befreely
reproduced
forthepu
rposes
ofprivate
researchan
dstu
dyan
dextracts
(orindeed
,thefullrepo
rt)may
beinclu
ded
inpro
fessional
journals
provid
edthat
suitab
leackn
owled
gemen
tis
mad
ean
dtherepro
ductio
nis
notasso
ciatedwith
anyform
ofad
vertising.
Applicatio
nsforco
mmercial
reproductio
nshould
bead
dressed
to:NIH
RJournals
Library,
Natio
nal
Institu
teforHealth
Research
,Evalu
ation,Trials
and
Studies
Coordinatin
gCen
tre,Alph
aHouse,
University
ofSo
utham
ptonScien
cePark,So
utham
ptonSO
167NS,U
K.
145
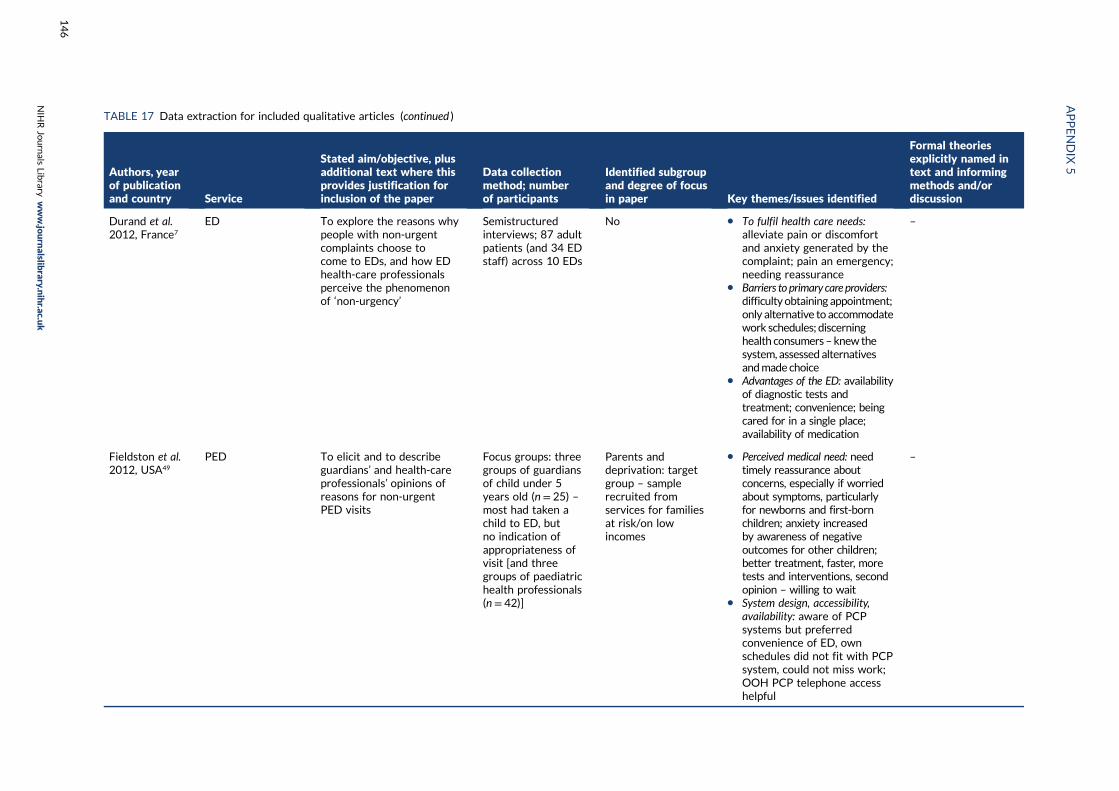
TABLE 17 Data extraction for included qualitative articles (continued )
Authors, yearof publicationand country Service
Stated aim/objective, plusadditional text where thisprovides justification forinclusion of the paper
Data collectionmethod; numberof participants
Identified subgroupand degree of focusin paper Key themes/issues identified
Formal theoriesexplicitly named intext and informingmethods and/ordiscussion
Durand et al.2012, France7
ED To explore the reasons whypeople with non-urgentcomplaints choose tocome to EDs, and how EDhealth-care professionalsperceive the phenomenonof ‘non-urgency’
Semistructuredinterviews; 87 adultpatients (and 34 EDstaff) across 10 EDs
No l To fulfil health care needs:alleviate pain or discomfortand anxiety generated by thecomplaint; pain an emergency;needing reassurance
l Barriers to primary care providers:difficultyobtaining appointment;only alternative to accommodatework schedules; discerninghealth consumers–knew thesystem, assessed alternativesandmade choice
l Advantages of the ED: availabilityof diagnostic tests andtreatment; convenience; beingcared for in a single place;availability of medication
–
Fieldston et al.2012, USA49
PED To elicit and to describeguardians’ and health-careprofessionals’ opinions ofreasons for non-urgentPED visits
Focus groups: threegroups of guardiansof child under 5years old (n = 25) –most had taken achild to ED, butno indication ofappropriateness ofvisit [and threegroups of paediatrichealth professionals(n= 42)]
Parents anddeprivation: targetgroup – samplerecruited fromservices for familiesat risk/on lowincomes
l Perceived medical need: needtimely reassurance aboutconcerns, especially if worriedabout symptoms, particularlyfor newborns and first-bornchildren; anxiety increasedby awareness of negativeoutcomes for other children;better treatment, faster, moretests and interventions, secondopinion – willing to wait
l System design, accessibility,availability: aware of PCPsystems but preferredconvenience of ED, ownschedules did not fit with PCPsystem, could not miss work;OOH PCP telephone accesshelpful
–
APPENDIX
5
NIH
RJournals
Library
www.jo
urnalslib
rary.nihr.ac.u
k
146
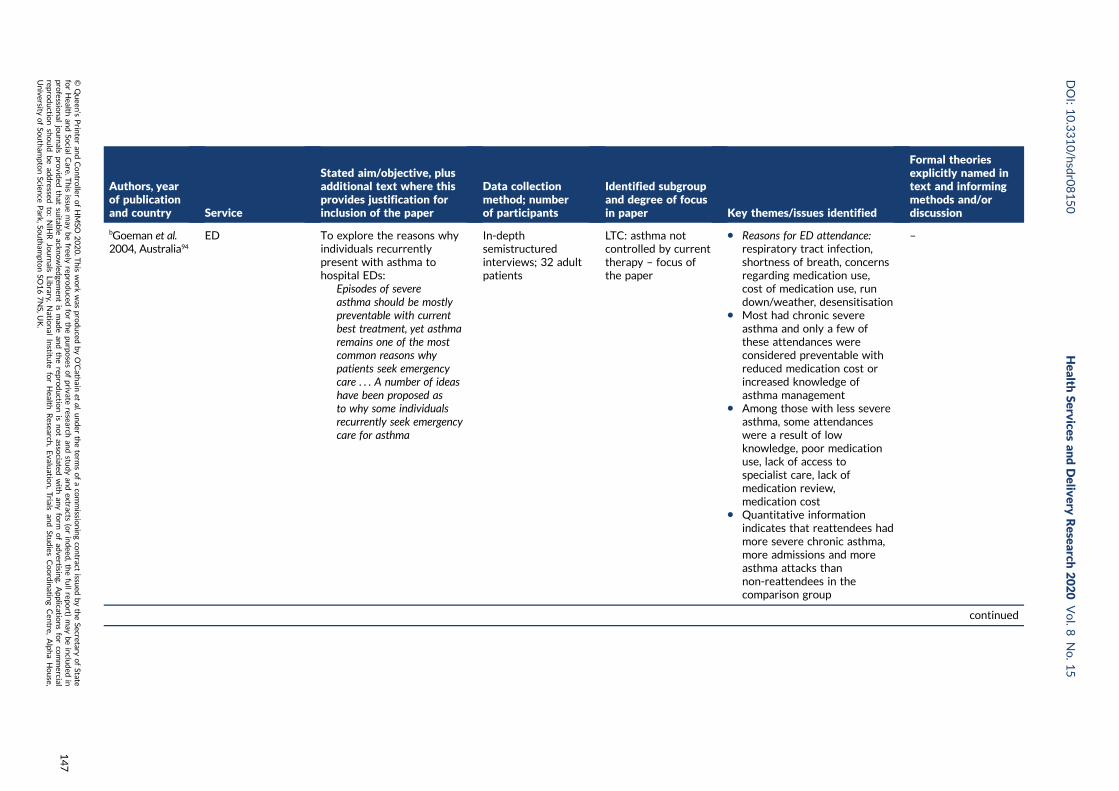
Authors, yearof publicationand country Service
Stated aim/objective, plusadditional text where thisprovides justification forinclusion of the paper
Data collectionmethod; numberof participants
Identified subgroupand degree of focusin paper Key themes/issues identified
Formal theoriesexplicitly named intext and informingmethods and/ordiscussion
bGoeman et al.2004, Australia94
ED To explore the reasons whyindividuals recurrentlypresent with asthma tohospital EDs:
Episodes of severeasthma should be mostlypreventable with currentbest treatment, yet asthmaremains one of the mostcommon reasons whypatients seek emergencycare . . . A number of ideashave been proposed asto why some individualsrecurrently seek emergencycare for asthma
In-depthsemistructuredinterviews; 32 adultpatients
LTC: asthma notcontrolled by currenttherapy – focus ofthe paper
l Reasons for ED attendance:respiratory tract infection,shortness of breath, concernsregarding medication use,cost of medication use, rundown/weather, desensitisation
l Most had chronic severeasthma and only a few ofthese attendances wereconsidered preventable withreduced medication cost orincreased knowledge ofasthma management
l Among those with less severeasthma, some attendanceswere a result of lowknowledge, poor medicationuse, lack of access tospecialist care, lack ofmedication review,medication cost
l Quantitative informationindicates that reattendees hadmore severe chronic asthma,more admissions and moreasthma attacks thannon-reattendees in thecomparison group
–
continued
DOI:10.3310/hsdr08150
Health
Servicesan
dDelivery
Research
2020
Vol.8
No.1
5
©Queen
’sPrin
teran
dContro
llerofHMSO
2020.T
hiswork
was
produced
byO’Cath
ainet
al.under
theterm
sofaco
mmissio
ningco
ntract
issued
bytheSecretary
ofState
forHealth
andSo
cialCare.T
his
issuemay
befreely
reproduced
forthepu
rposes
ofprivate
researchan
dstu
dyan
dextracts
(orindeed
,thefullrepo
rt)may
beinclu
ded
inpro
fessional
journals
provid
edthat
suitab
leackn
owled
gemen
tis
mad
ean
dtherepro
ductio
nis
notasso
ciatedwith
anyform
ofad
vertising.
Applicatio
nsforco
mmercial
reproductio
nshould
bead
dressed
to:NIH
RJournals
Library,
Natio
nal
Institu
teforHealth
Research
,Evalu
ation,Trials
and
Studies
Coordinatin
gCen
tre,Alph
aHouse,
University
ofSo
utham
ptonScien
cePark,So
utham
ptonSO
167NS,U
K.
147

TABLE 17 Data extraction for included qualitative articles (continued )
Authors, yearof publicationand country Service
Stated aim/objective, plusadditional text where thisprovides justification forinclusion of the paper
Data collectionmethod; numberof participants
Identified subgroupand degree of focusin paper Key themes/issues identified
Formal theoriesexplicitly named intext and informingmethods and/ordiscussion
Goepp et al.2004, USA85
Service usedecisions,particularly PED
Low acuity use of EDs isoften viewed as misuse orabuse. We designed aprogram to help usersaccess servicesmore efficiently
Participatoryaction model andethnographicstudy: observation,interviews, groups; 90families (interviewsand focus groups withworkers)
Deprivation andparents: families onlow income, minoritygroups
Initially designed a programmeusing lay community workersto educate families about thehealth-care system and measurechange in use of PCP and PED
Negative reaction fromparticipants and recognitionof their needs led to changeto qualitative methods tounderstand factors drivingpeople’s health-seekingbehaviour in order to educatehealth-care professionals.Findings of ethnographicevaluation:
l Fear and suspicion of health-care providers and system –
experiences of discriminationand humiliation; hospitalsdangerous, may performsecret medical experiments
l Differing definitions of health –
standard biomedicalmeasures, for exampleimmunisation did not matchfamilies’ perceived needwhere housing, food,employment and safety werepriorities; ED preferredbecause of timing and accessissues, shorter waiting times –decision about service notmade in relation to acuityof illness
–
APPENDIX
5
NIH
RJournals
Library
www.jo
urnalslib
rary.nihr.ac.u
k
148

Authors, yearof publicationand country Service
Stated aim/objective, plusadditional text where thisprovides justification forinclusion of the paper
Data collectionmethod; numberof participants
Identified subgroupand degree of focusin paper Key themes/issues identified
Formal theoriesexplicitly named intext and informingmethods and/ordiscussion
l Systems complexity – demandsof living with poverty abarrier to efficient use ofhealth care, appointmentsmissed owing to otherpriorities; ED offered easyaccess any time, no need tomake appointment or beblamed for missing them;size of hospitals and clinicsintimidating, feel lost andunwelcome
l Value of liaisons – supportworkers helped break downbarriers of trust andcomplexity, support tonavigate systems
Guttman et al.2003, USA50
ED and PED To identify reasons formedically non-urgent EDvisits from the users’perspective and to identifythrough their reasons whatmay have prompted themto use the ED for medicalcare they could haveostensibly received inprimary care sites
Structured interviewprotocol with open-ended questions andscaled items regardingdecision; 331 parents/guardians of child upto 18 years old and77 adult patients
Parents: majority ofthe data relate tothis group, although11 out of 12 themeswere found in bothgroups
1. Conceptions of needs:
l Relief from pain or discomfort –especially when a child, paincan be seen as an emergency
l Reassurance – that condition isnot dangerous or at risk ofdeterioration, not at fault,especially for children
l Official approval – to undertakeparticular activities (e.g. holiday)
l Caretaker responsibility – do nottake chances with child, evenwhen situation does not seeman emergency; seek help whensymptoms persist, especially atweekends; parents also seekhelp for self so that they cancare for their child
–
continued
DOI:10.3310/hsdr08150
Health
Servicesan
dDelivery
Research
2020
Vol.8
No.1
5
©Queen
’sPrin
teran
dContro
llerofHMSO
2020.T
hiswork
was
produced
byO’Cath
ainet
al.under
theterm
sofaco
mmissio
ningco
ntract
issued
bytheSecretary
ofState
forHealth
andSo
cialCare.T
his
issuemay
befreely
reproduced
forthepu
rposes
ofprivate
researchan
dstu
dyan
dextracts
(orindeed
,thefullrepo
rt)may
beinclu
ded
inpro
fessional
journals
provid
edthat
suitab
leackn
owled
gemen
tis
mad
ean
dtherepro
ductio
nis
notasso
ciatedwith
anyform
ofad
vertising.
Applicatio
nsforco
mmercial
reproductio
nshould
bead
dressed
to:NIH
RJournals
Library,
Natio
nal
Institu
teforHealth
Research
,Evalu
ation,Trials
and
Studies
Coordinatin
gCen
tre,Alph
aHouse,
University
ofSo
utham
ptonScien
cePark,So
utham
ptonSO
167NS,U
K.
149

TABLE 17 Data extraction for included qualitative articles (continued )
Authors, yearof publicationand country Service
Stated aim/objective, plusadditional text where thisprovides justification forinclusion of the paper
Data collectionmethod; numberof participants
Identified subgroupand degree of focusin paper Key themes/issues identified
Formal theoriesexplicitly named intext and informingmethods and/ordiscussion
l Recourse, second opinion andreferral – especially when notsatisfied with PCP consultation,treatment, advice; wantingreferral to specialist
l Financial – lack of insurance;no regular doctor, recentlymoved, out of town, nowhereelse to go
2. Conceptions of appropriateness:
l Worrisome condition – anythingcausing concern is appropriate,especially for children
l After-hours office services –ED appropriate when PCPunavailable; accommodateswork schedules
l Perceived unavailability oftimely appointments in primarycare settings – schedulingdifficulties, long waits,cannot tolerate delay; noappointment needed for ED;especially for public clinicusers
3. Preference:
l General preference – ED close,familiar, trusted, used asprimary care site
APPENDIX
5
NIH
RJournals
Library
www.jo
urnalslib
rary.nihr.ac.u
k
150

Authors, yearof publicationand country Service
Stated aim/objective, plusadditional text where thisprovides justification forinclusion of the paper
Data collectionmethod; numberof participants
Identified subgroupand degree of focusin paper Key themes/issues identified
Formal theoriesexplicitly named intext and informingmethods and/ordiscussion
l Facilities and staff – tests,medications; one-stop healthcare; better doctors; treatedwith more respect; somecultural and educationalvariation around these factors
l Shorter wait – comparedwith PCP
Develop a typology thatmaps congruence betweenconceptualisation of emergencyand user’s own reason againstuser’s preference for ED toidentify four types of user:‘no alternative’/‘prefer theED’/‘would rather go elsewhere’/‘ED is the best option for anemergency’
MostajerHaqiqi et al.2016, Canada81
PED To explore the reasons thatlead parents to select the EDover a dental clinic for theirchild’s non-traumatic dentalproblem
Semistructuredinterviews; 15parents of a childunder 10 years old
Parents: focus ofthe paper
1. Family-related barriers:
l Parents’ understanding of oralhealth (wait and see attitude,lay diagnosis)
l Parents’ socioeconomicchallenges – balancing care forchild with other demandsincluding irregular/long hours,dental problems not priority
2. Provider-related barriers:
l Poor access to dental care –limited for children; dentistreferred families to the hospitalowing to complex/multiple
Grembowski: dentalcare process model:used as conceptualframework for study
continued
DOI:10.3310/hsdr08150
Health
Servicesan
dDelivery
Research
2020
Vol.8
No.1
5
©Queen
’sPrin
teran
dContro
llerofHMSO
2020.T
hiswork
was
produced
byO’Cath
ainet
al.under
theterm
sofaco
mmissio
ningco
ntract
issued
bytheSecretary
ofState
forHealth
andSo
cialCare.T
his
issuemay
befreely
reproduced
forthepu
rposes
ofprivate
researchan
dstu
dyan
dextracts
(orindeed
,thefullrepo
rt)may
beinclu
ded
inpro
fessional
journals
provid
edthat
suitab
leackn
owled
gemen
tis
mad
ean
dtherepro
ductio
nis
notasso
ciatedwith
anyform
ofad
vertising.
Applicatio
nsforco
mmercial
reproductio
nshould
bead
dressed
to:NIH
RJournals
Library,
Natio
nal
Institu
teforHealth
Research
,Evalu
ation,Trials
and
Studies
Coordinatin
gCen
tre,Alph
aHouse,
University
ofSo
utham
ptonScien
cePark,So
utham
ptonSO
167NS,U
K.
151

TABLE 17 Data extraction for included qualitative articles (continued )
Authors, yearof publicationand country Service
Stated aim/objective, plusadditional text where thisprovides justification forinclusion of the paper
Data collectionmethod; numberof participants
Identified subgroupand degree of focusin paper Key themes/issues identified
Formal theoriesexplicitly named intext and informingmethods and/ordiscussion
problems or child’s behaviour(crying, fear), hospital the lastresort; dentist unavailability –
closed, long waitl Poor quality of dental care –
perceived lack of patience withchildren, lack of competency
3. Satisfaction with care providedat the hospital – will not consultprivate dentists again
Hopton et al.1996, UK51
OOH: delivered bygeneral practice
To investigate patients’accounts of calling thedoctor OOH:
Alongside the debate aboutfactors influencing demandfor out of hours care isdebate about theappropriateness of thedemand. [. . .] Despite thisevidence and calls forpatient education as ameans of tacklingincreasing demand andinappropriate use, patients’perspectives on out ofhours calls havebeen neglected
Semistructuredinterviews; 23 adultpatients or calling onbehalf of an adultand 23 parentsof child under16 years old
Deprivation: productof geographical areawhere research wascarried out – area ofhigh deprivation
l Symptoms: ideas about normaland abnormal illness, includingseverity, unrelieved, unexplained,combination, sudden onset, longduration, high temperature inchild, behaviour
l Context of call: concerns aboutspecific illness; caller’sfeelings – panic, distress;responsibility for others –especially children; previousattempts to manage theproblem, including self-care,lay and professional advice,wait and see then takingaction; failing to get anappointment; lack ofmedication in house
l Previous experiences of healthservices and health professionals:past frights when things more
–
APPENDIX
5
NIH
RJournals
Library
www.jo
urnalslib
rary.nihr.ac.u
k
152

Authors, yearof publicationand country Service
Stated aim/objective, plusadditional text where thisprovides justification forinclusion of the paper
Data collectionmethod; numberof participants
Identified subgroupand degree of focusin paper Key themes/issues identified
Formal theoriesexplicitly named intext and informingmethods and/ordiscussion
serious than expected; currentconcerns about other illness;lack of confidence in healthprofessionals, feeling not takenseriously; previous medicalsuccesses prompt quickeraction now
l Outcome of calls: mostlyprescription, referred tohospital; result affected viewof future actions – mostwould do the same again
Houston andPickering 2000,UK52
OOH: delivered bygeneral practice
To investigate how parentsuse the GP OOH service:
The apparent increasein out-of-hours GPconsultations is a source ofconsiderable concern anddebate. The underlyingpremise of much of thisconcern is that many ofthese calls are unnecessary
In-depthsemistructuredinterviews; 29families of childunder 10 years old
Parents: focus ofthe paper
l Belief in self-management:desire to cope and takeresponsibility for child
l Strategies for managingchildhood illness: range ofapproaches, includingtemperature, medication
l Responsibility and fear ofmaking the wrong decisions:wanting to do the right thing,feeling ill-equipped to manage,especially as new parent
l A real dilemma: whether ornot to call doctor, aware ofdemands on service, but wantto do right thing for child
l Calling the doctor: call triggeredby combination of emotionalresponse and particularsituation; linked to previousexperiences of persistent callsleading to eventual help; loss ofconfidence in own strategies
Antonovsky: workregarding copingmechanisms andSense of Coherence:explored in resultsand discussion
continued
DOI:10.3310/hsdr08150
Health
Servicesan
dDelivery
Research
2020
Vol.8
No.1
5
©Queen
’sPrin
teran
dContro
llerofHMSO
2020.T
hiswork
was
produced
byO’Cath
ainet
al.under
theterm
sofaco
mmissio
ningco
ntract
issued
bytheSecretary
ofState
forHealth
andSo
cialCare.T
his
issuemay
befreely
reproduced
forthepu
rposes
ofprivate
researchan
dstu
dyan
dextracts
(orindeed
,thefullrepo
rt)may
beinclu
ded
inpro
fessional
journals
provid
edthat
suitab
leackn
owled
gemen
tis
mad
ean
dtherepro
ductio
nis
notasso
ciatedwith
anyform
ofad
vertising.
Applicatio
nsforco
mmercial
reproductio
nshould
bead
dressed
to:NIH
RJournals
Library,
Natio
nal
Institu
teforHealth
Research
,Evalu
ation,Trials
and
Studies
Coordinatin
gCen
tre,Alph
aHouse,
University
ofSo
utham
ptonScien
cePark,So
utham
ptonSO
167NS,U
K.
153
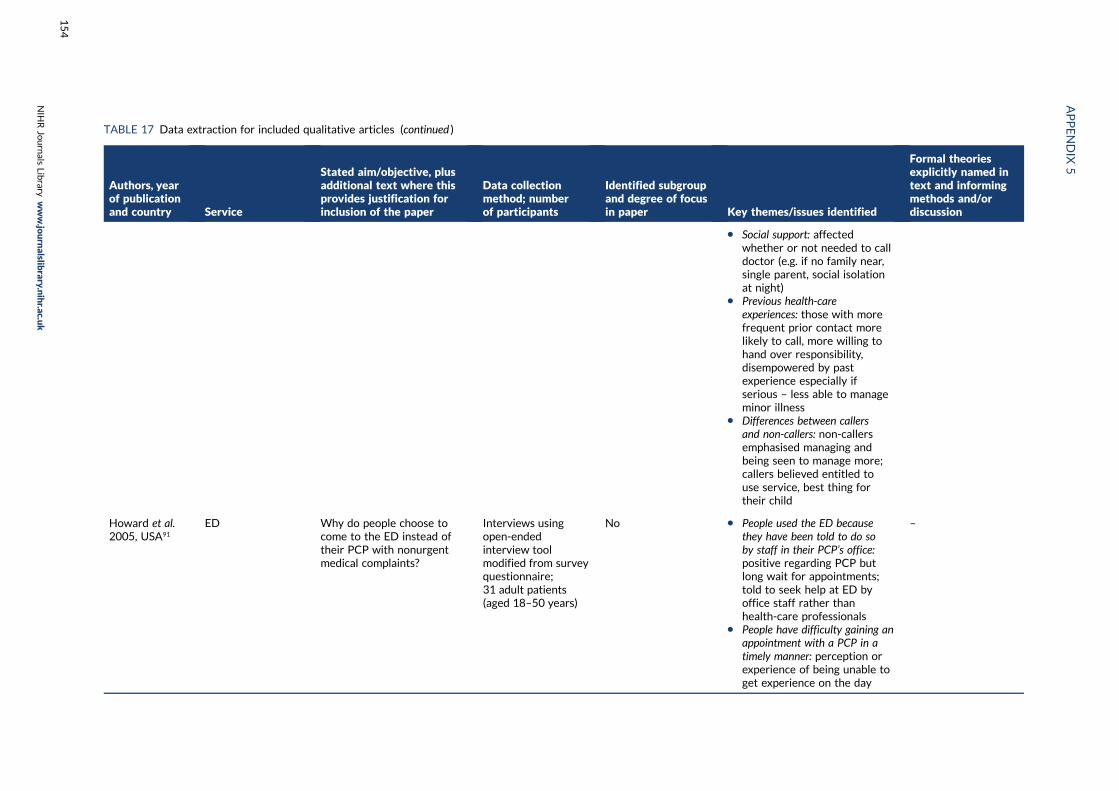
TABLE 17 Data extraction for included qualitative articles (continued )
Authors, yearof publicationand country Service
Stated aim/objective, plusadditional text where thisprovides justification forinclusion of the paper
Data collectionmethod; numberof participants
Identified subgroupand degree of focusin paper Key themes/issues identified
Formal theoriesexplicitly named intext and informingmethods and/ordiscussion
l Social support: affectedwhether or not needed to calldoctor (e.g. if no family near,single parent, social isolationat night)
l Previous health-careexperiences: those with morefrequent prior contact morelikely to call, more willing tohand over responsibility,disempowered by pastexperience especially ifserious – less able to manageminor illness
l Differences between callersand non-callers: non-callersemphasised managing andbeing seen to manage more;callers believed entitled touse service, best thing fortheir child
Howard et al.2005, USA91
ED Why do people choose tocome to the ED instead oftheir PCP with nonurgentmedical complaints?
Interviews usingopen-endedinterview toolmodified from surveyquestionnaire;31 adult patients(aged 18–50 years)
No l People used the ED becausethey have been told to do soby staff in their PCP’s office:positive regarding PCP butlong wait for appointments;told to seek help at ED byoffice staff rather thanhealth-care professionals
l People have difficulty gaining anappointment with a PCP in atimely manner: perception orexperience of being unable toget experience on the day
–
APPENDIX
5
NIH
RJournals
Library
www.jo
urnalslib
rary.nihr.ac.u
k
154

Authors, yearof publicationand country Service
Stated aim/objective, plusadditional text where thisprovides justification forinclusion of the paper
Data collectionmethod; numberof participants
Identified subgroupand degree of focusin paper Key themes/issues identified
Formal theoriesexplicitly named intext and informingmethods and/ordiscussion
they called; PCP not in or notopen, leave messages andlong wait for reply
l Time played a factor inevery response given by theparticipants: hard to getappointment; long wait inoffice then only seen for veryshort time; having to schedulework around appointment;needing to see doctor on theday if off sick so can get backto work quickly; child care anissue; cannot sit in doctors forages with kids
Hugenholtzet al. 2009, theNetherlands53
OOH: deliveredby co-op
To gain insight into thehealth-seeking behaviourof parents who ask forimmediate medical attentionfor their children:
Data from GP co-operatives. . . show that children makemore use of OOH care thanmembers of other agegroups, although the healthproblems . . . are less urgentfrom a medical pointof view
Semistructuredinterviews;27 parents of child upto 16 years old –
19 with minor illness;eight requiringimmediate referralto hospital
Parents: focus ofthe paper
l Knowledge of parents andtheir actions at home: usedexisting knowledge of child’sbehaviour and appearance todetermine they were sick –
deviation from norm was firstsign something wrong; useddiagnostic procedures beforecontacting for help – fever aparticular concern/trigger
l The turning point: most hadthought of medical diagnosisbefore calling; sought helpwhen felt incapable to handlesituation – symptomsworsening/alarming/inexplicable, child’s discomfort,own approach failed; intuitionimportant; seeking contactbecame the only way to getrelief from worry
Beck; Giddens – RiskSociety: explored indiscussion
continued
DOI:10.3310/hsdr08150
Health
Servicesan
dDelivery
Research
2020
Vol.8
No.1
5
©Queen
’sPrin
teran
dContro
llerofHMSO
2020.T
hiswork
was
produced
byO’Cath
ainet
al.under
theterm
sofaco
mmissio
ningco
ntract
issued
bytheSecretary
ofState
forHealth
andSo
cialCare.T
his
issuemay
befreely
reproduced
forthepu
rposes
ofprivate
researchan
dstu
dyan
dextracts
(orindeed
,thefullrepo
rt)may
beinclu
ded
inpro
fessional
journals
provid
edthat
suitab
leackn
owled
gemen
tis
mad
ean
dtherepro
ductio
nis
notasso
ciatedwith
anyform
ofad
vertising.
Applicatio
nsforco
mmercial
reproductio
nshould
bead
dressed
to:NIH
RJournals
Library,
Natio
nal
Institu
teforHealth
Research
,Evalu
ation,Trials
and
Studies
Coordinatin
gCen
tre,Alph
aHouse,
University
ofSo
utham
ptonScien
cePark,So
utham
ptonSO
167NS,U
K.
155

TABLE 17 Data extraction for included qualitative articles (continued )
Authors, yearof publicationand country Service
Stated aim/objective, plusadditional text where thisprovides justification forinclusion of the paper
Data collectionmethod; numberof participants
Identified subgroupand degree of focusin paper Key themes/issues identified
Formal theoriesexplicitly named intext and informingmethods and/ordiscussion
l Not wanting to take a risk: didnot trust situation, ownfeelings a trigger to seek help;worry about leaving things toolong in case something serious,do not take a risk, go toooften rather than not enough;seeking examination andreassurance rather thantreatment, want to knowwhat’s wrong, rule out seriousillness; risk avoidance part ofparental role – child important,have to watch closely,responsible for getting helpon time, stand up for theirchildren
Hunter et al.2013, UK68
Mixed emergencycare: ED, OOH andWIC
To elaborate on theprocesses by which patientswith long-term conditionschoose between availableoptions for care in responseto a health crisis, to informthe development of futurepolicy and guidance onmodifying emergencycare use:
. . . health policy in manycountries seeks to constrainand shape patients’ caredecisions in order to ensurethat the service accessedreflects the level ofmedical need
Semistructuredinterviews; 50 adultpatients
LTC (asthma/chronicobstructive pulmonarydisease/coronaryheart disease/diabetes): focus ofthe paper
1. Patients framed instances ofemergency care as unavoidable:reluctant to use, do not want tobe a burden, no other optionbecause of seriousness of problem
2. Previous experiences shapefuture emergency care use:
l Negotiating and establishingurgency – base future decisionson previous experiences andresponses of social networkand health-care professionals,decision sanctioned or madeby someone else
l Prioritising technologicalexpertise over establishedrelationships in times of crisis –
Dixon-Woods:candidacy
Rogers, Hassell andNicolaas: recursivity–discussion framedaround theseconcepts (Rogerset al. consider howpeople’s experienceof service useinfluences futurehelp-seeking, butdo not actuallyconceptualise it as‘recursivity’, and thisword is not in thebook’s index)
APPENDIX
5
NIH
RJournals
Library
www.jo
urnalslib
rary.nihr.ac.u
k
156

Authors, yearof publicationand country Service
Stated aim/objective, plusadditional text where thisprovides justification forinclusion of the paper
Data collectionmethod; numberof participants
Identified subgroupand degree of focusin paper Key themes/issues identified
Formal theoriesexplicitly named intext and informingmethods and/ordiscussion
emergency care services havefacilities not available inprimary care; disease-specificcare also better in specialistclinics; WIC/OOH provisiondo not provide benefits of EDor of GP, so not preferred
l Judging accessibility of services –range of barriers tounscheduled access toprimary care, mostlyorganisational – appointmentsystems, transport/travel,long waits
Keizer Beacheand Guell 2016,St Vincent andthe Grenadines82
ED To explore attitudes ofnon-urgent accident andemergency departmentpatients in a middle incomehealth-care setting and tounderstand how and whythey decide to seekemergency care and resistusing primary care facilities
Semistructuredinterviews; 12 adultpatients
No l Habitual use of the ED: adefault process rather than adeliberate decision, seen asgeneral societal behaviour;encouraged by family,friends, colleagues
l Systemic encouragement ofthe use of the ED: limitedscheduling and hoursof primary care clinicsreinforced used of ED, alsolack of diagnostic facilities;referred to ED by clinic staff
l Deliberate use of the ED: somemaking active choice to use;transport, convenience;seriousness of complaint;positive previous experience –
quality of care, time available
Andersen model ofhealth service use:informed interviewguide and mentionedin discussion
Nilsen et al: role ofhabit in decision-making; Zimmermanmultilevel theory ofpopulation health:role of habit, customand power indecision-making –
explored indiscussion
continued
DOI:10.3310/hsdr08150
Health
Servicesan
dDelivery
Research
2020
Vol.8
No.1
5
©Queen
’sPrin
teran
dContro
llerofHMSO
2020.T
hiswork
was
produced
byO’Cath
ainet
al.under
theterm
sofaco
mmissio
ningco
ntract
issued
bytheSecretary
ofState
forHealth
andSo
cialCare.T
his
issuemay
befreely
reproduced
forthepu
rposes
ofprivate
researchan
dstu
dyan
dextracts
(orindeed
,thefullrepo
rt)may
beinclu
ded
inpro
fessional
journals
provid
edthat
suitab
leackn
owled
gemen
tis
mad
ean
dtherepro
ductio
nis
notasso
ciatedwith
anyform
ofad
vertising.
Applicatio
nsforco
mmercial
reproductio
nshould
bead
dressed
to:NIH
RJournals
Library,
Natio
nal
Institu
teforHealth
Research
,Evalu
ation,Trials
and
Studies
Coordinatin
gCen
tre,Alph
aHouse,
University
ofSo
utham
ptonScien
cePark,So
utham
ptonSO
167NS,U
K.
157

TABLE 17 Data extraction for included qualitative articles (continued )
Authors, yearof publicationand country Service
Stated aim/objective, plusadditional text where thisprovides justification forinclusion of the paper
Data collectionmethod; numberof participants
Identified subgroupand degree of focusin paper Key themes/issues identified
Formal theoriesexplicitly named intext and informingmethods and/ordiscussion
Koziol-McLainet al. 2000,USA77
ED To gain an understanding ofthe context in which patientschoose to seek health care inan ED:
The policy goal of shiftingnonurgent visits from theED to nonemergency healthcare settings is commonlydevised, planned andimplemented withoutconsidering patients’perspectives
Unstructuredinterviews; 30 adults
Uninsured patients:can we assumedeprivation?
Toughing it out: putting up withthings before going to ED
Symptoms overwhelming self-caremeasures: mostly use of over-the-counter medicines; decisionmade when problem began tohave an impact on function
Calling a friend: seeking supportand advice from friends andrelatives, especially mothers
Nowhere else to go: could notaccess non-emergency care;being referred to ED by otherhealth-care providers
Convenience: work schedules,child care and transportationbarriers affecting choice of ED
Malone: ED’s hiddenrole as almshouse(giving social care)impacted by changingservice context(higher volume andacuity in ED,medicalisation ofproblems, lesscommunity supportservices) → frequentusers seen asproblem rather thansystem – paperframed around this
Cassel; Sacks: impactof illness on wholeself, contrasted withmedical approach oftreating a symptom
APPENDIX
5
NIH
RJournals
Library
www.jo
urnalslib
rary.nihr.ac.u
k
158
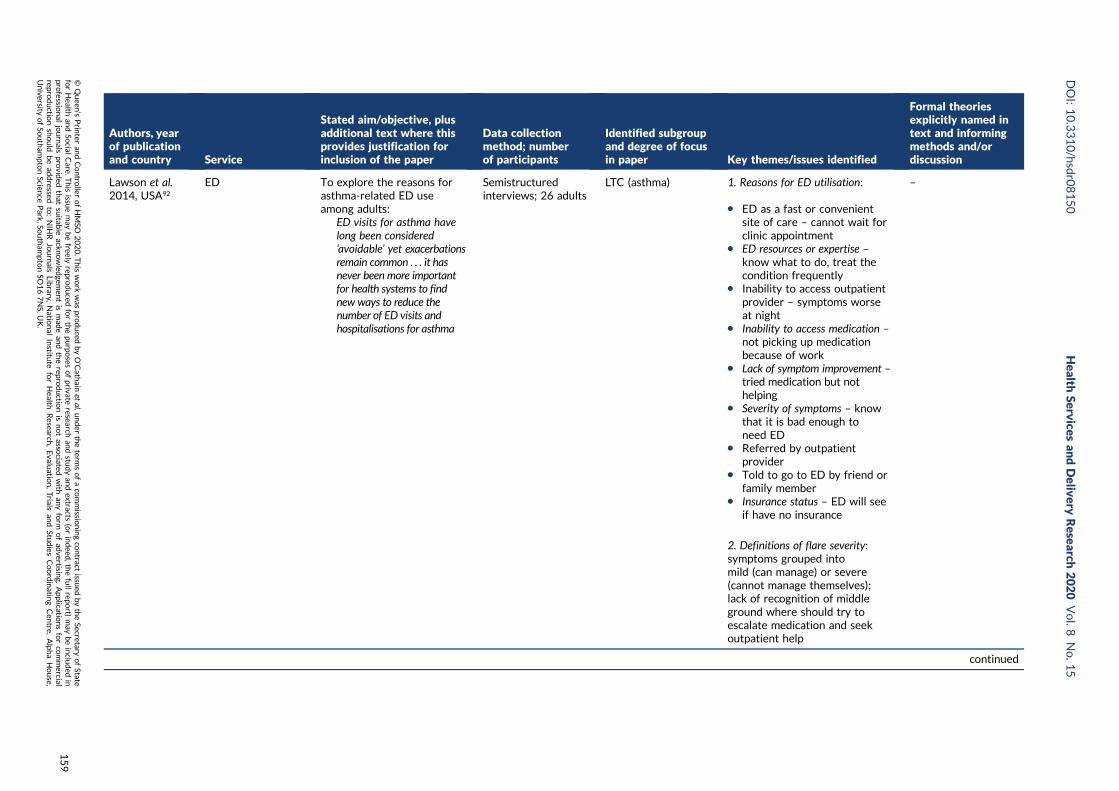
Authors, yearof publicationand country Service
Stated aim/objective, plusadditional text where thisprovides justification forinclusion of the paper
Data collectionmethod; numberof participants
Identified subgroupand degree of focusin paper Key themes/issues identified
Formal theoriesexplicitly named intext and informingmethods and/ordiscussion
Lawson et al.2014, USA92
ED To explore the reasons forasthma-related ED useamong adults:
ED visits for asthma havelong been considered‘avoidable’ yet exacerbationsremain common . . . it hasnever been more importantfor health systems to findnew ways to reduce thenumber of ED visits andhospitalisations for asthma
Semistructuredinterviews; 26 adults
LTC (asthma) 1. Reasons for ED utilisation:
l ED as a fast or convenientsite of care – cannot wait forclinic appointment
l ED resources or expertise –
know what to do, treat thecondition frequently
l Inability to access outpatientprovider – symptoms worseat night
l Inability to access medication –
not picking up medicationbecause of work
l Lack of symptom improvement –tried medication but nothelping
l Severity of symptoms – knowthat it is bad enough toneed ED
l Referred by outpatientprovider
l Told to go to ED by friend orfamily member
l Insurance status – ED will seeif have no insurance
2. Definitions of flare severity:symptoms grouped intomild (can manage) or severe(cannot manage themselves);lack of recognition of middleground where should try toescalate medication and seekoutpatient help
–
continued
DOI:10.3310/hsdr08150
Health
Servicesan
dDelivery
Research
2020
Vol.8
No.1
5
©Queen
’sPrin
teran
dContro
llerofHMSO
2020.T
hiswork
was
produced
byO’Cath
ainet
al.under
theterm
sofaco
mmissio
ningco
ntract
issued
bytheSecretary
ofState
forHealth
andSo
cialCare.T
his
issuemay
befreely
reproduced
forthepu
rposes
ofprivate
researchan
dstu
dyan
dextracts
(orindeed
,thefullrepo
rt)may
beinclu
ded
inpro
fessional
journals
provid
edthat
suitab
leackn
owled
gemen
tis
mad
ean
dtherepro
ductio
nis
notasso
ciatedwith
anyform
ofad
vertising.
Applicatio
nsforco
mmercial
reproductio
nshould
bead
dressed
to:NIH
RJournals
Library,
Natio
nal
Institu
teforHealth
Research
,Evalu
ation,Trials
and
Studies
Coordinatin
gCen
tre,Alph
aHouse,
University
ofSo
utham
ptonScien
cePark,So
utham
ptonSO
167NS,U
K.
159
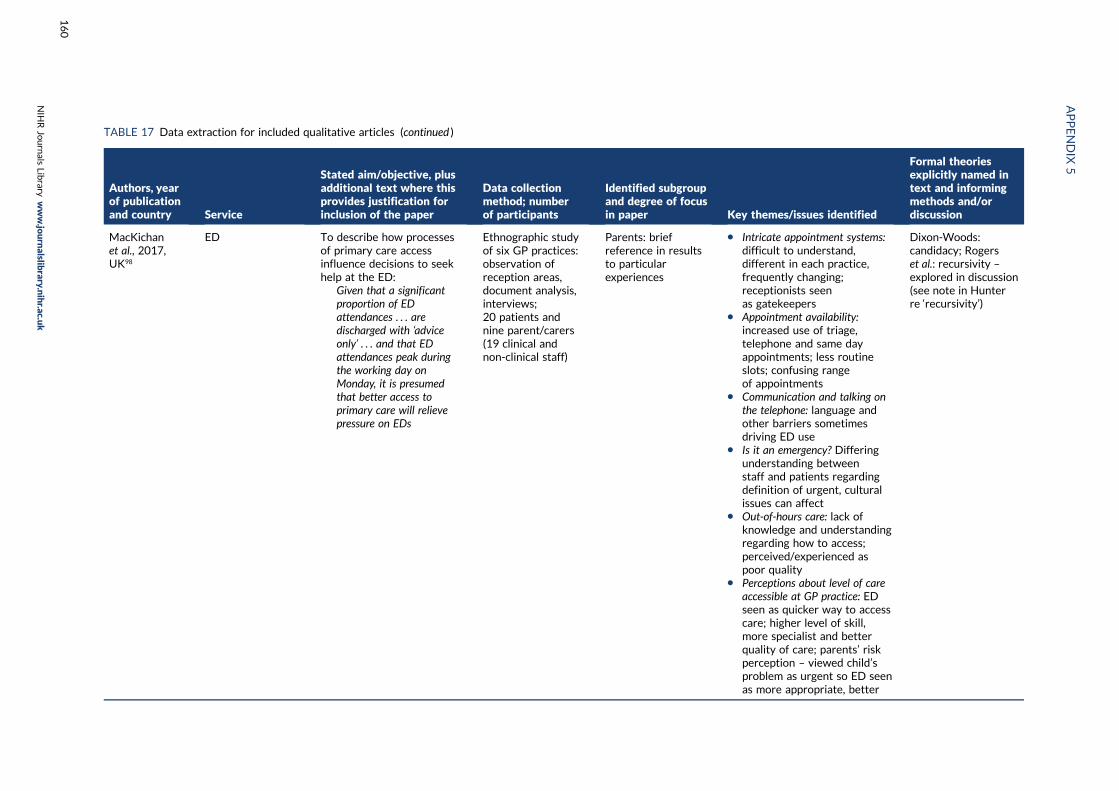
TABLE 17 Data extraction for included qualitative articles (continued )
Authors, yearof publicationand country Service
Stated aim/objective, plusadditional text where thisprovides justification forinclusion of the paper
Data collectionmethod; numberof participants
Identified subgroupand degree of focusin paper Key themes/issues identified
Formal theoriesexplicitly named intext and informingmethods and/ordiscussion
MacKichanet al., 2017,UK98
ED To describe how processesof primary care accessinfluence decisions to seekhelp at the ED:
Given that a significantproportion of EDattendances . . . aredischarged with ‘adviceonly’ . . . and that EDattendances peak duringthe working day onMonday, it is presumedthat better access toprimary care will relievepressure on EDs
Ethnographic studyof six GP practices:observation ofreception areas,document analysis,interviews;20 patients andnine parent/carers(19 clinical andnon-clinical staff)
Parents: briefreference in resultsto particularexperiences
l Intricate appointment systems:difficult to understand,different in each practice,frequently changing;receptionists seenas gatekeepers
l Appointment availability:increased use of triage,telephone and same dayappointments; less routineslots; confusing rangeof appointments
l Communication and talking onthe telephone: language andother barriers sometimesdriving ED use
l Is it an emergency? Differingunderstanding betweenstaff and patients regardingdefinition of urgent, culturalissues can affect
l Out-of-hours care: lack ofknowledge and understandingregarding how to access;perceived/experienced aspoor quality
l Perceptions about level of careaccessible at GP practice: EDseen as quicker way to accesscare; higher level of skill,more specialist and betterquality of care; parents’ riskperception – viewed child’sproblem as urgent so ED seenas more appropriate, better
Dixon-Woods:candidacy; Rogerset al.: recursivity –
explored in discussion(see note in Hunterre ‘recursivity’)
APPENDIX
5
NIH
RJournals
Library
www.jo
urnalslib
rary.nihr.ac.u
k
160

Authors, yearof publicationand country Service
Stated aim/objective, plusadditional text where thisprovides justification forinclusion of the paper
Data collectionmethod; numberof participants
Identified subgroupand degree of focusin paper Key themes/issues identified
Formal theoriesexplicitly named intext and informingmethods and/ordiscussion
McGuigan andWatson 2010,UK54
ED To discover the factorsinfluencing patient decisionsto attend EDs for non-urgenttreatment
Short, semistructuredtelephone interviews(mean length3 minutes); 196 adults
No Reasons for attendance:
l Regarded their conditions asserious and in need of urgentattention
l Could not obtainappointments with GP
l Had been advised to do so by,for example, families, friends,pharmacists, health-carehelpline advisers orGP receptionists
l Expected their GP to sendthem to ED anyway
l Knew nowhere else to gofor help
l Were not registered witha GP
l Lived near an EDl Type of illness/injury (soft-
tissue injuries largest group)and duration of symptoms(lasting longer than expected)
l Diagnostics (especially X-rays) –expectation of need for testsavailable only at the ED
Zola: five triggers forseeking help when illor injured
continued
DOI:10.3310/hsdr08150
Health
Servicesan
dDelivery
Research
2020
Vol.8
No.1
5
©Queen
’sPrin
teran
dContro
llerofHMSO
2020.T
hiswork
was
produced
byO’Cath
ainet
al.under
theterm
sofaco
mmissio
ningco
ntract
issued
bytheSecretary
ofState
forHealth
andSo
cialCare.T
his
issuemay
befreely
reproduced
forthepu
rposes
ofprivate
researchan
dstu
dyan
dextracts
(orindeed
,thefullrepo
rt)may
beinclu
ded
inpro
fessional
journals
provid
edthat
suitab
leackn
owled
gemen
tis
mad
ean
dtherepro
ductio
nis
notasso
ciatedwith
anyform
ofad
vertising.
Applicatio
nsforco
mmercial
reproductio
nshould
bead
dressed
to:NIH
RJournals
Library,
Natio
nal
Institu
teforHealth
Research
,Evalu
ation,Trials
and
Studies
Coordinatin
gCen
tre,Alph
aHouse,
University
ofSo
utham
ptonScien
cePark,So
utham
ptonSO
167NS,U
K.
161

TABLE 17 Data extraction for included qualitative articles (continued )
Authors, yearof publicationand country Service
Stated aim/objective, plusadditional text where thisprovides justification forinclusion of the paper
Data collectionmethod; numberof participants
Identified subgroupand degree of focusin paper Key themes/issues identified
Formal theoriesexplicitly named intext and informingmethods and/ordiscussion
Neill et al.2016, UK83
Service usedecisions
To examine how parents ofchildren aged under 5 yearsfrom a range of socioeconomicgroups use information tomake decisions during acutechildhood illness at home:
Consultation rates forchildren are rising, yet littleis known about factors thatinfluence parents’ help-seeking behaviours . . .
Professional and politicalsolutions have not reduceddemand; thereforecollaborative approaches . . .are now needed to improveparents’ access to information
Ongoing epidemiologicalresearch aims to identifythose most likely to consult,so interventions can betargeted at these groups.This must be balanced withconcerns about discouragingservice use by children whoneed urgent care
Focus groups andinterviews; 27parents from SouthAsia, travelling andwhite Britishcommunities
Parents: focus ofthe paper
l Effect of the nature of thechild’s illness on help seeking:child’s distress, symptomduration or unfamiliarityimportant, fear of seriousillness
l Experience and knowledge andtheir influence on help-seeking:instinct/experience important;more concern in first-timeparents; previous failure torecognise serious illness canundermine confidence; somejust worry more
l Social support and its impact onhelp-seeking behaviours: valueof social networks – Travelling/South Asian people are mostlikely ask their parents, whiteBritish people ask family whoare HCPs or lay experts;other resources used to checklegitimacy of using healthservices; single parents’logistical problems accessinghelp; timing of day/weekaffects decision
–
APPENDIX
5
NIH
RJournals
Library
www.jo
urnalslib
rary.nihr.ac.u
k
162

Authors, yearof publicationand country Service
Stated aim/objective, plusadditional text where thisprovides justification forinclusion of the paper
Data collectionmethod; numberof participants
Identified subgroupand degree of focusin paper Key themes/issues identified
Formal theoriesexplicitly named intext and informingmethods and/ordiscussion
l Access to health services:difficulty getting GPappointments leads to use ofother services; NHS Directused to check legitimacy ofhelp-seeking; talking toreceptionists a barrier,especially with language;WICs not valued – nocontinuity, unwilling toprescribe, refer back to GP
l Trust in service providerand effect on help-seekingbehaviour: affected by existingrelationship and experiences;loss of trust when illnessmissed, lack of examination,ineffective treatment,conflicting into, not answeringquestions, referring on
l Social expectations and influenceon parents’ help-seekingbehaviour: wanting to do theright thing for child and inthe eyes of health-careprofessionals and society –feeling inferior to doctors,being labelled as inappropriateuser, worry about beingcriticised, not taken seriouslyin future
continued
DOI:10.3310/hsdr08150
Health
Servicesan
dDelivery
Research
2020
Vol.8
No.1
5
©Queen
’sPrin
teran
dContro
llerofHMSO
2020.T
hiswork
was
produced
byO’Cath
ainet
al.under
theterm
sofaco
mmissio
ningco
ntract
issued
bytheSecretary
ofState
forHealth
andSo
cialCare.T
his
issuemay
befreely
reproduced
forthepu
rposes
ofprivate
researchan
dstu
dyan
dextracts
(orindeed
,thefullrepo
rt)may
beinclu
ded
inpro
fessional
journals
provid
edthat
suitab
leackn
owled
gemen
tis
mad
ean
dtherepro
ductio
nis
notasso
ciatedwith
anyform
ofad
vertising.
Applicatio
nsforco
mmercial
reproductio
nshould
bead
dressed
to:NIH
RJournals
Library,
Natio
nal
Institu
teforHealth
Research
,Evalu
ation,Trials
and
Studies
Coordinatin
gCen
tre,Alph
aHouse,
University
ofSo
utham
ptonScien
cePark,So
utham
ptonSO
167NS,U
K.
163

TABLE 17 Data extraction for included qualitative articles (continued )
Authors, yearof publicationand country Service
Stated aim/objective, plusadditional text where thisprovides justification forinclusion of the paper
Data collectionmethod; numberof participants
Identified subgroupand degree of focusin paper Key themes/issues identified
Formal theoriesexplicitly named intext and informingmethods and/ordiscussion
Olsson andHansagi 2001,Sweden69
ED To explore what lies behindrepeated ED use from thepatients’ own perspectives:
A subgroup of patients makefrequent use of hospital EDs,thereby accounting for asubstantial portion of the totalnumber of visits to thesefacilities . . .
Repeated visits may frustratethe staff . . . as these patients’complaints are often judged asnon-urgent and inappropriatefor ED care
In-depth interviews;10 adult patients
Deprivation notdeliberately targetedbut sample ‘all . . .outside or on theperiphery of thelabour market . . .working lives . . .severely disruptedby their healthproblems’
Key points:
l Symptoms are perceived as athreat to life and to autonomy –fear of dying; previous trauma(own or in others) triggeringincreased concern; trying tomaintain autonomy but feelingof powerlessness forcinghelp-seeking
l Struggles with adverse lifecircumstances – scarceresources, health problems,poor support, precarioussituations
l Needing frequent helpassociated with feelings ofinferiority – wanting help-seeking to be respected,satisfaction with care reducedwhen feel their use isclassified as inappropriate orwhen symptoms are belittled
l Occasional referrals topsychiatrist do not seem tolead to any continuoustreatment or change inhelp-seeking behaviour
Brief exploration ofhow patients’presentation of theirproblems and matchwith the servicesprovided affectsstaff attitudes andhow well needs aremet. Referencesinclude Dingwall:categorisation of‘good patients, badpatients and children’
APPENDIX
5
NIH
RJournals
Library
www.jo
urnalslib
rary.nihr.ac.u
k
164

Authors, yearof publicationand country Service
Stated aim/objective, plusadditional text where thisprovides justification forinclusion of the paper
Data collectionmethod; numberof participants
Identified subgroupand degree of focusin paper Key themes/issues identified
Formal theoriesexplicitly named intext and informingmethods and/ordiscussion
Shaw et al.2013, USA55
ED Exploring the decision-making processes to use theED for non-urgent needs ofmedically underservedpatients
Semistructuredinterviews; 30 adultpatients
No: half unemployedbut no discussion ofdeprivation
Two subgroups: with and withoutknowledge of alternatives
1. No knowledge of alternativeprimary care options: no PCP;belief that ED available only ifhad no insurance
2. Knowledge of alternatives:
l instructed by a medicalprofessional – specialistsand PCP
l access barriers to regular sourceof care – PCP closed, noappointment in time, longwait at clinic, negativepast experiences
l perceived racial issues –discomfort as no other patientsfrom own racial background;perceived to provide care forimmigrants that is assumed tobe poorer quality
l defining health-care need as anemergency requiring immediateattention – different places fordifferent needs, ED mostappropriate in this situation
l transportation/location – mosthad no car, proximity toservice important
l cost of care – if no insurancePCP require payment upfront,ED bill afterwards; balancingED costs with future costs toown well-being
Andersen: behaviouralmodel of health servicesuse – explored andelaborated in discussion
continued
DOI:10.3310/hsdr08150
Health
Servicesan
dDelivery
Research
2020
Vol.8
No.1
5
©Queen
’sPrin
teran
dContro
llerofHMSO
2020.T
hiswork
was
produced
byO’Cath
ainet
al.under
theterm
sofaco
mmissio
ningco
ntract
issued
bytheSecretary
ofState
forHealth
andSo
cialCare.T
his
issuemay
befreely
reproduced
forthepu
rposes
ofprivate
researchan
dstu
dyan
dextracts
(orindeed
,thefullrepo
rt)may
beinclu
ded
inpro
fessional
journals
provid
edthat
suitab
leackn
owled
gemen
tis
mad
ean
dtherepro
ductio
nis
notasso
ciatedwith
anyform
ofad
vertising.
Applicatio
nsforco
mmercial
reproductio
nshould
bead
dressed
to:NIH
RJournals
Library,
Natio
nal
Institu
teforHealth
Research
,Evalu
ation,Trials
and
Studies
Coordinatin
gCen
tre,Alph
aHouse,
University
ofSo
utham
ptonScien
cePark,So
utham
ptonSO
167NS,U
K.
165

TABLE 17 Data extraction for included qualitative articles (continued )
Authors, yearof publicationand country Service
Stated aim/objective, plusadditional text where thisprovides justification forinclusion of the paper
Data collectionmethod; numberof participants
Identified subgroupand degree of focusin paper Key themes/issues identified
Formal theoriesexplicitly named intext and informingmethods and/ordiscussion
Stafford et al.2014, UK56
Mixed emergency/urgent care: ED,WIC OOH service
To explore why patients withsimple mechanical back painseek urgent care
Semistructuredinterviews; 11 adultpatients
Simple mechanicalback pain: focus ofthe paper
l GP access: unsuccessful ingetting an appointment;directed to urgent care;surgery closed
l Pain and analgesia: painintensity, desire forquick relief
l Impaired function: walking,daily living, child care –
distress motivatinghelp-seeking
l Different: unlike previousepisodes; prompted fear,frustration, anger andpessimism
l Concern that something wrongl Investigation: wanting further
examination to prove there isa problem or to understandproblem
l Third party: advised to useurgent care by health-careprofessionals or family; usethis route directly onsubsequent occasions
l Repeat visits: continue togo back even though notsatisfied with outcomes
–
APPENDIX
5
NIH
RJournals
Library
www.jo
urnalslib
rary.nihr.ac.u
k
166

Authors, yearof publicationand country Service
Stated aim/objective, plusadditional text where thisprovides justification forinclusion of the paper
Data collectionmethod; numberof participants
Identified subgroupand degree of focusin paper Key themes/issues identified
Formal theoriesexplicitly named intext and informingmethods and/ordiscussion
Wilkin et al.2012, USA84
ED What factors influenceresidents’ [in a low-incomeurban community] decisionsto use emergency versusprimary care?
Community forumdiscussions; threegroups of 12–21adults from areawith high 911 use(only someparticipantsidentified as 911users)
Deprivation:community with lowsocioeconomicstatus, poor health –
focus of the paper
l Knowledge related to usingemergency versus primaryhealth care options:understanding the conceptof emergency but hard todistinguish in a real situation
l Available health care services:knowledgeable about localservices, but did not thinkthey could meet their needsbecause of lack of specialists
l Attitudes about emergency andprimary health care: frustrationwith PCP referrals out ofarea; long waiting times forappointments and to be seen(also at ED); poor customerservice in clinics – publicdiscussion of personalmatters, rudeness, judgement
l Barriers to primary care:affordability of health careespecially if lack of insurance;complex paperwork forreduced-price health care;transportation difficultiesleading to missed PCPappointments, no awarenessof free transport services
–
continued
DOI:10.3310/hsdr08150
Health
Servicesan
dDelivery
Research
2020
Vol.8
No.1
5
©Queen
’sPrin
teran
dContro
llerofHMSO
2020.T
hiswork
was
produced
byO’Cath
ainet
al.under
theterm
sofaco
mmissio
ningco
ntract
issued
bytheSecretary
ofState
forHealth
andSo
cialCare.T
his
issuemay
befreely
reproduced
forthepu
rposes
ofprivate
researchan
dstu
dyan
dextracts
(orindeed
,thefullrepo
rt)may
beinclu
ded
inpro
fessional
journals
provid
edthat
suitab
leackn
owled
gemen
tis
mad
ean
dtherepro
ductio
nis
notasso
ciatedwith
anyform
ofad
vertising.
Applicatio
nsforco
mmercial
reproductio
nshould
bead
dressed
to:NIH
RJournals
Library,
Natio
nal
Institu
teforHealth
Research
,Evalu
ation,Trials
and
Studies
Coordinatin
gCen
tre,Alph
aHouse,
University
ofSo
utham
ptonScien
cePark,So
utham
ptonSO
167NS,U
K.
167

TABLE 17 Data extraction for included qualitative articles (continued )
Authors, yearof publicationand country Service
Stated aim/objective, plusadditional text where thisprovides justification forinclusion of the paper
Data collectionmethod; numberof participants
Identified subgroupand degree of focusin paper Key themes/issues identified
Formal theoriesexplicitly named intext and informingmethods and/ordiscussion
Woolfendenet al. 2000,Australia57
PED Explored the parentalattitudes, perceptions andbeliefs that play a role in theuse of a tertiary PED when achild has a non-urgent illness
In-depthsemistructuredinterviews;25 parents ofchildren (age rangenot specified, sampleincludes up to 14)
Parents – focus ofthe paper
l Parental triage: factorsinfluencing interpretation ofseverity – fever, breathing,pain, vomiting, change ofsymptoms, lack of resolutionwith treatment, age, firstchild, medical history
l Expertise: PED seen as havinggreater knowledge, training,experience, child-specific;setting more child-friendly;feeling helpless, guilty,stressed; responsibility torelieve suffering; greaterconfidence as children older
l Access: lack of acceptable localhealth care, especially out ofhours; own GP unavailable;prefer PED even when localservices accessible
l Parental expectations:dissatisfied with local services –poor communication, feelingrushed, not treated asindividuals, inconsistent orunclear explanation andadvice; seeking reassurancefrom expert
–
HCP, health-care provider; LTC, long-term condition; OOH, out of hours; PCP, primary care provider; PED, paediatric emergency department.a Ahl and Nyström146 provided additional information relating to the same study, particularly methods and sample.b The 2002 Goeman et al.147 paper provided additional information relating to the same study, particularly methods and sample.
APPENDIX
5
NIH
RJournals
Library
www.jo
urnalslib
rary.nihr.ac.u
k
168

Appendix 6 Programme theoriesin interviews
TABLE 18 Evidence of programme theories for interview participants
Participants
Programme theory
1 2 3 4 5 6 7 8 9 10
Parents
11 – 999
13 – ED
14 – ED
17 – GP
18 – ED
20 – ED
21 – ED
23 – GP
25 – GP
29 – ED
30 – ED
31 – GP
32 – GP
33 – ED
42 – GP
48 – ED
Young adults
3 – ED
5 – ED
6 – ED
9 – 999
34 – GP
35 – GP
36 – ED
37 – ED
38 – GP
39 – GP
40 – GP
43 – ED
44 – GP
continued
DOI: 10.3310/hsdr08150 Health Services and Delivery Research 2020 Vol. 8 No. 15
© Queen’s Printer and Controller of HMSO 2020. This work was produced by O’Cathain et al. under the terms of a commissioning contract issued by the Secretary of Statefor Health and Social Care. This issue may be freely reproduced for the purposes of private research and study and extracts (or indeed, the full report) may be included inprofessional journals provided that suitable acknowledgement is made and the reproduction is not associated with any form of advertising. Applications for commercialreproduction should be addressed to: NIHR Journals Library, National Institute for Health Research, Evaluation, Trials and Studies Coordinating Centre, Alpha House,University of Southampton Science Park, Southampton SO16 7NS, UK.
169

TABLE 18 Evidence of programme theories for interview participants (continued )
Participants
Programme theory
1 2 3 4 5 6 7 8 9 10
45 – ED
46 – ED
47 – ED
Deprived communities
1 – 999
2 – ED
4 – ED
7 – 999
8 – 999
10 – 999
12 – GP
15 – GP
16 – GP
19 – ED
22 – GP
24 – GP
26 – GP
27 – ED
28 – GP
41 – ED
Purple shading, clear evidence of PT; blue shading, indications/inference that PT is present.
APPENDIX 6
NIHR Journals Library www.journalslibrary.nihr.ac.uk
170

Appendix 7 Sociodemographic details offocus group attendees
TABLE 19 Sociodemographic details of focus group attendees
Characteristic
Focus group attendees (n)
Total (n)Parents Young adults Socially deprived
Sex
Male 0 2 2 4
Female 5 4 2 11
Age (years)
18–20 0 1 0 1
21–30 2 5 0 7
31–40 2 0 1 3
41–50 0 0 0 0
51–60 0 0 1 1
≥ 60 0 0 2 2
Missing data 1 0 0 1
Length of residence in city (years)
< 1 0 0 0 0
1–5 1 4 0 5
> 5 3 2 4 9
Missing data 1 0 0 1
Ethnicity
White British 1 5 3 9
White other 1 0 0 1
Black British 0 0 1 1
Black African 1 0 0 1
Chinese 0 1 0 1
Pakistani 1 0 0 1
Missing data 1 0 0 1
Marital status
Married/living as married 3 1 2 6
Separated/divorced 0 0 1 1
Single/not married 1 5 1 7
Missing data 1 0 0 1
Children?
Yes 5 0 3 8
No 0 6 1 7
continued
DOI: 10.3310/hsdr08150 Health Services and Delivery Research 2020 Vol. 8 No. 15
© Queen’s Printer and Controller of HMSO 2020. This work was produced by O’Cathain et al. under the terms of a commissioning contract issued by the Secretary of Statefor Health and Social Care. This issue may be freely reproduced for the purposes of private research and study and extracts (or indeed, the full report) may be included inprofessional journals provided that suitable acknowledgement is made and the reproduction is not associated with any form of advertising. Applications for commercialreproduction should be addressed to: NIHR Journals Library, National Institute for Health Research, Evaluation, Trials and Studies Coordinating Centre, Alpha House,University of Southampton Science Park, Southampton SO16 7NS, UK.
171

TABLE 19 Sociodemographic details of focus group attendees (continued )
Characteristic
Focus group attendees (n)
Total (n)Parents Young adults Socially deprived
Employment status
Working full time 0 2 1 3
Working part time 3 2a 2a 7a
Homemaker full time 1 0 0 1
Retired 0 0 1a 1a
Student (full time) 0 3a 0 3a
Missing data 1 0 0 1
a One young adult was working part-time and a full-time student; one person in the deprived group was retired andworking part time.
APPENDIX 7
NIHR Journals Library www.journalslibrary.nihr.ac.uk
172

Appendix 8 NHS Choices advice forsymptoms in vignettes
Below we summarise what NHS Choices says about the six symptoms that we used in our vignettes.
Cough
URL: www.nhs.uk/conditions/cough (accessed 25 February 2020)
They go away in 3 weeks and there is no need to see a GP.
A pharmacist can help.
See a GP only if you have chest pain, it’s hard to breathe or you have had it for > 3 weeks.
Diarrhoea and vomiting
URL: www.nhs.uk/conditions/diarrhoea-and-vomiting/ (accessed 25 February 2020)
Common in adults, children and babies.
Usually treat it at home.
Take paracetamol but check the leaflet before giving to a child.
Diarrhoea usually stops within 5–7 days and vomiting usually stops in 1 or 2 days.
A pharmacist can help.
Call NHS 111 for children under some circumstances.
Go to A&E if have sudden severe headache or vomit blood.
Bruised ribs
URL: www.nhs.uk/conditions/broken-or-bruised-ribs/ (accessed 25 February 2020)
Ribs cannot be easily splinted or supported like other bones, so they are usually left to heal naturally.
There’s often no need for an X-ray.
Take painkillers.
Call NHS 111 if not improved in a few weeks or if you have a high temperature.
Call 999 or go to A&E if caused by a serious accident or coughing up blood.
DOI: 10.3310/hsdr08150 Health Services and Delivery Research 2020 Vol. 8 No. 15
© Queen’s Printer and Controller of HMSO 2020. This work was produced by O’Cathain et al. under the terms of a commissioning contract issued by the Secretary of Statefor Health and Social Care. This issue may be freely reproduced for the purposes of private research and study and extracts (or indeed, the full report) may be included inprofessional journals provided that suitable acknowledgement is made and the reproduction is not associated with any form of advertising. Applications for commercialreproduction should be addressed to: NIHR Journals Library, National Institute for Health Research, Evaluation, Trials and Studies Coordinating Centre, Alpha House,University of Southampton Science Park, Southampton SO16 7NS, UK.
173

Back pain
URL: www.nhs.uk/conditions/back-pain/ (accessed 25 February 2020)
It is very common and normally improves within a few weeks or months.
Usually not serious and will get better over time.
Take painkillers.
Get help if pain does not start to improve in a few weeks, pain stops day-to-day activities, pain issevere and getting worse or struggling to cope.
Contact GP or NHS 111 if have numbness in buttocks, a high temperature or if it started after aserious accident.
Fever in children
URL: www.nhs.uk/conditions/fever-in-children/ (accessed 25 February 2020)
High temperature is very common in young children.
You can usually look after your child or baby at home. The temperature should go down over 3 or4 days.
Give them paracetamol or ibuprofen depending on their age.
See GP if child is under 3 months old and has a temperature of ≥ 38 °C, 3–6 months with temperature of≥ 39 °C, has rash, high temperature has lasted > 5 days, is not their usual self or has high temperaturethat does not come down with drugs.
It’s quite rare for fever to be a sign of anything serious but call 999 or go to A&E if the child has a rashthat does not fade, has a stiff neck or has a weak high-pitched cry that is not their normal cry.
Call NHS 111 if cannot speak to GP and do not know what to do.
APPENDIX 8
NIHR Journals Library www.journalslibrary.nihr.ac.uk
174

Appendix 9 Results of logistic regressionsfor tendency to make ‘clinicallyunnecessary’ use of a service
TABLE 20 Variables explaining tendency to call emergency ambulance service in vignettes
Variable
Univariate Final multivariable model
Odds ratio(95% CI) n p-value
Odds ratio(95% CI) p-value
Sociodemographic characteristics
Age (years) 0.000
18–24 1 169
25–34 0.9 (0.5 to 1.6) 384
35–44 0.8 (0.4 to 1.4) 467
45–54 0.6 (0.3 to 1.1) 469
55–64 0.9 (0.5 to 1.6) 508
65–74 1.3 (0.8 to 2.3) 499
≥ 75 1.6 (0.9 to 2.8) 405
Sex 0.018 0.015
Female 1 1649 1
Male 1.3 (1.1 to 1.7) 1257 1.5 (1.1 to 2.0)
Ethnicity 0.000 0.005
White 1 2572 1
BAME 2.0 (1.5 to 2.7) 334 1.9 (1.2 to 3.0)
Social class 0.000 0.004
I 1 214 1
II 1.7 (0.9 to 3.3) 1039 1.6 (0.7 to 3.6)
III non-manual 2.0 (0.98 to 3.95) 569 1.3 (0.5 to 3.0)
III manual 4.3 (2.2 to 8.6) 416 3.0 (1.3 to 7.1)
IV and V 4.5 (2.3 to 8.9) 524 2.0 (0.8 to 4.6)
Armed forces 2.2 (0.7 to 6.6) 52 1.1 (0.2 to 3.0)
Deprivation 0.000
5 (affluent) 1 611
4 1.0 (0.6 to 1.4) 638
3 1.0 (0.7 to 1.5) 536
2 1.5 (1.0 to 2.2) 545
1 (most deprived) 1.8 (1.3 to 2.6) 576
continued
DOI: 10.3310/hsdr08150 Health Services and Delivery Research 2020 Vol. 8 No. 15
© Queen’s Printer and Controller of HMSO 2020. This work was produced by O’Cathain et al. under the terms of a commissioning contract issued by the Secretary of Statefor Health and Social Care. This issue may be freely reproduced for the purposes of private research and study and extracts (or indeed, the full report) may be included inprofessional journals provided that suitable acknowledgement is made and the reproduction is not associated with any form of advertising. Applications for commercialreproduction should be addressed to: NIHR Journals Library, National Institute for Health Research, Evaluation, Trials and Studies Coordinating Centre, Alpha House,University of Southampton Science Park, Southampton SO16 7NS, UK.
175

TABLE 20 Variables explaining tendency to call emergency ambulance service in vignettes (continued )
Variable
Univariate Final multivariable model
Odds ratio(95% CI) n p-value
Odds ratio(95% CI) p-value
Rurality 0.087
Rural 1 665
Urban 1.3 (0.96 to 1.7) 2241
Region 0.473
North England 1 474
Midlands 0.9 (0.6 to 1.3) 794
South England 0.9 (0.6 to 1.2) 957
London 1.3 (0.8 to 2.0) 285
Wales 1.0 (0.6 to 1.9) 132
Scotland 0.9 (0.5 to 1.4) 264
In household with children aged < 5 years old 0.119
No 1 2591
Yes 0.7 (0.5 to 1.1) 300
Resources available
Car ownership 0.000 0.000
≥ 1 car 1 1478 1
No car 3.3 (2.4 to 4.4) 428 2.1 (1.4 to 3.2)
Missing 1.4 (1.0 to 1.8) 1000 1.7 (1.2 to 2.4)
Personal access to the internet 0.000 0.004
Yes 1 2542 1
No 2.9 (2.2 to 3.8) 364 1.8 (1.2 to 2.6)
Health
General health 0.000
Excellent 1 223
Very good 0.7 (0.4 to 1.3) 725
Good 1.1 (0.7 to 1.9) 799
Fair 2.2 (1.3 to 3.8) 360
Poor 2.3 (1.2 to 4.2) 163
Can’t choose 2.2 (0.9 to 5.7) 39
Missing/not included 597
Long-term limiting illness 0.000
None 1 1766
Non-limiting 1.3 (0.96 to 1.7) 586
Limiting 2.0 (1.6 to 2.7) 541
APPENDIX 9
NIHR Journals Library www.journalslibrary.nihr.ac.uk
176
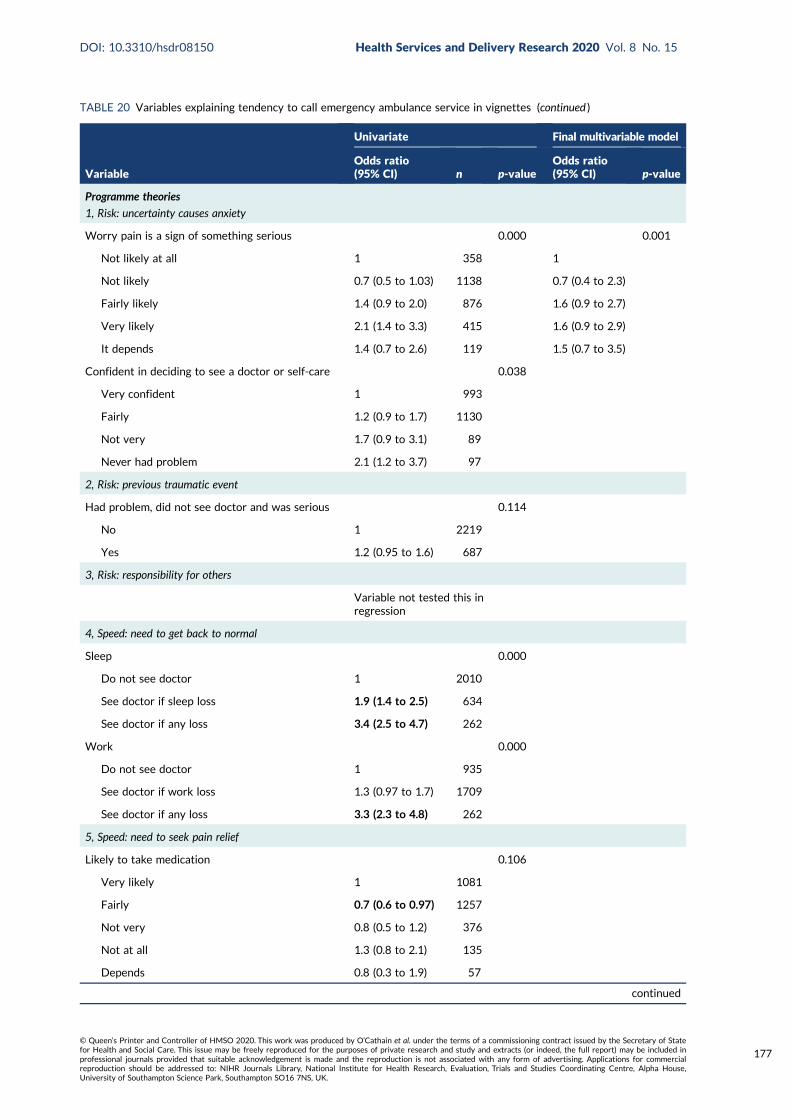
TABLE 20 Variables explaining tendency to call emergency ambulance service in vignettes (continued )
Variable
Univariate Final multivariable model
Odds ratio(95% CI) n p-value
Odds ratio(95% CI) p-value
Programme theories
1, Risk: uncertainty causes anxiety
Worry pain is a sign of something serious 0.000 0.001
Not likely at all 1 358 1
Not likely 0.7 (0.5 to 1.03) 1138 0.7 (0.4 to 2.3)
Fairly likely 1.4 (0.9 to 2.0) 876 1.6 (0.9 to 2.7)
Very likely 2.1 (1.4 to 3.3) 415 1.6 (0.9 to 2.9)
It depends 1.4 (0.7 to 2.6) 119 1.5 (0.7 to 3.5)
Confident in deciding to see a doctor or self-care 0.038
Very confident 1 993
Fairly 1.2 (0.9 to 1.7) 1130
Not very 1.7 (0.9 to 3.1) 89
Never had problem 2.1 (1.2 to 3.7) 97
2, Risk: previous traumatic event
Had problem, did not see doctor and was serious 0.114
No 1 2219
Yes 1.2 (0.95 to 1.6) 687
3, Risk: responsibility for others
Variable not tested this inregression
4, Speed: need to get back to normal
Sleep 0.000
Do not see doctor 1 2010
See doctor if sleep loss 1.9 (1.4 to 2.5) 634
See doctor if any loss 3.4 (2.5 to 4.7) 262
Work 0.000
Do not see doctor 1 935
See doctor if work loss 1.3 (0.97 to 1.7) 1709
See doctor if any loss 3.3 (2.3 to 4.8) 262
5, Speed: need to seek pain relief
Likely to take medication 0.106
Very likely 1 1081
Fairly 0.7 (0.6 to 0.97) 1257
Not very 0.8 (0.5 to 1.2) 376
Not at all 1.3 (0.8 to 2.1) 135
Depends 0.8 (0.3 to 1.9) 57
continued
DOI: 10.3310/hsdr08150 Health Services and Delivery Research 2020 Vol. 8 No. 15
© Queen’s Printer and Controller of HMSO 2020. This work was produced by O’Cathain et al. under the terms of a commissioning contract issued by the Secretary of Statefor Health and Social Care. This issue may be freely reproduced for the purposes of private research and study and extracts (or indeed, the full report) may be included inprofessional journals provided that suitable acknowledgement is made and the reproduction is not associated with any form of advertising. Applications for commercialreproduction should be addressed to: NIHR Journals Library, National Institute for Health Research, Evaluation, Trials and Studies Coordinating Centre, Alpha House,University of Southampton Science Park, Southampton SO16 7NS, UK.
177

TABLE 20 Variables explaining tendency to call emergency ambulance service in vignettes (continued )
Variable
Univariate Final multivariable model
Odds ratio(95% CI) n p-value
Odds ratio(95% CI) p-value
6, Speed: waited long enough
Variable not included
7a, Stressful lives
Overwhelmed when have health problem 0.000
Strongly disagree 1 487 0.000 1
Disagree 1.3 (0.8 to 2.0) 872 1.1 (0.6 to 1.7)
Neither 3.1 (2.0 to 4.9) 537 2.3 (1.4 to 3.8)
Strongly agree/agree 4.4 (2.7 to 7.0) 314 2.2 (1.3 to 3.8)
Never had problem 1.4 (0.6 to 3.3) 99 1.5 (0.6 to 3.6)
Find life stressful 0.095
No 1 637
A bit 0.8 (0.6 to 1.1) 1316
Quite 0.9 (0.6 to 1.2) 637
Very 1.4 (0.9 to 2.1) 297
Don’t know 0.9 (0.2 to 3.8) 19
Someone to care for them if they are ill 0.000
Definitely 1 1240
Probably 1.0 (0.7 to 1.3) 697
Probably not 1.6 (1.1 to 2.3) 280
Don’t know 2.9 (1.7 to 4.9) 92
Can take time off work for GP 0.000
Yes 1 1078
Yes but not easy 0.7 (0.4 to 1.2) 275
No 1.0 (0.5 to 2.0) 127
Not applicable/missing 2.2 (1.7 to 2.9) 1426
7b, Low burden
Travel to ED 1 0.000
Very difficult 0.7 (0.5 to 1.1) 610
Neither 0.6 (0.4 to 0.7) 269
Fairly easy 0.4 (0.3 to 0.6) 1172
Very easy 1 855
Opening hours a problem 0.009
Disagree/strongly disagree 1 1098
Neither 1.6 (1.2 to 2.2) 608
Strongly agree/agree 1.1 (0.8 to 1.5) 603
APPENDIX 9
NIHR Journals Library www.journalslibrary.nihr.ac.uk
178

TABLE 20 Variables explaining tendency to call emergency ambulance service in vignettes (continued )
Variable
Univariate Final multivariable model
Odds ratio(95% CI) n p-value
Odds ratio(95% CI) p-value
Prefer no appointments 0.000
Disagree/strongly disagree 1 685
Neither 1.3 (0.9 to 1.8) 799
Strongly agree/agree 1.9 (1.3 to 2.7) 825
Want convenient times 0.905
Disagree/strongly disagree 1 253
Neither 1.0 (0.6 to 1.5) 708
Strongly agree/agree 0.9 (0.6 to 1.4) 1348
Willing to wait in waiting room 0.170
Disagree/strongly disagree 1 361
Neither 1.0 (0.5 to 1.8) 194
Strongly agree/agree 1.3 (0.9 to 1.9) 2351
8, Compliance with family/friends
Check with family and friends for what to do 0.010 0.022
Not very likely 1 545 1
Not likely 0.8 (0.5 to 1.1) 746 0.9 (0.5 to 1.3)
Fairly likely 0.7 (0.5 to 0.98) 1061 0.6 (0.4 to 0.9)
Very likely 1.2 (0.8 to 1.6) 554 1.1 (0.7 to 1.8)
9, Views of services
Prefer ED for quick tests 0.000
Disagree/strongly disagree 1 1159
Neither 1.9 (1.4 to 2.6) 797
Strongly agree/agree 2.8 (2.0 to 4.0) 353
Missing, self-complete 0
Doctors know more at ED 0.001
Disagree/strongly disagree 1 850
Neither 1.5 (1.1 to 2.1) 1041
Strongly agree/agree 2.0 (1.4 to 2.9) 418
Missing, self-complete 0
No confidence in GP 0.203
Strongly disagree 1 538
Disagree 1.3 (0.9 to 1.9) 1008
Neither 1.6 (1.0 to 2.4) 446
Agree 1.8 (1.1 to 3.1) 165
Strongly agree 1.3 (0.6 to 2.9) 76
continued
DOI: 10.3310/hsdr08150 Health Services and Delivery Research 2020 Vol. 8 No. 15
© Queen’s Printer and Controller of HMSO 2020. This work was produced by O’Cathain et al. under the terms of a commissioning contract issued by the Secretary of Statefor Health and Social Care. This issue may be freely reproduced for the purposes of private research and study and extracts (or indeed, the full report) may be included inprofessional journals provided that suitable acknowledgement is made and the reproduction is not associated with any form of advertising. Applications for commercialreproduction should be addressed to: NIHR Journals Library, National Institute for Health Research, Evaluation, Trials and Studies Coordinating Centre, Alpha House,University of Southampton Science Park, Southampton SO16 7NS, UK.
179

TABLE 20 Variables explaining tendency to call emergency ambulance service in vignettes (continued )
Variable
Univariate Final multivariable model
Odds ratio(95% CI) n p-value
Odds ratio(95% CI) p-value
Don’t know 2.2 (0.9 to 5.4) 42
Missing 1.9 (0.7 to 5.3) 34
Missing, self-complete 0
10, Frustration with access to GP
Hard to get GP appointment 0.543
Disagree/strongly disagree 1 819
Neither 1.2 (0.8 to 1.7) 353
Strongly agree/agree 1.0 (0.8 to 1.3) 1137
Missing, self-complete 0
Registered with GP 0.329
Yes 1 2840
No 0.6 (0.3 to 1.6) 65
Work or looking after family makes it difficult tosee GP
0.000 0.000
Disagree/strongly disagree 1 1197 1
Neither 1.3 (0.9 to 1.8) 455 1.0 (0.7 to 1.4)
Strongly agree/agree 0.5 (0.3 to 0.8) 410 0.4 (0.2 to 0.6)
Not applicable 1.6 (1.1 to 2.4) 247 1.4 (0.9 to 2.2)
Believe people use ED because can’t get GPappointment
0.021
Strongly agree/agree 1 2441
Neither 1.2 (0.9 to 1.8) 339
Disagree/strongly disagree 1.9 (1.2 to 3.0) 126
Awareness of services
Know range of NHS services to use 0.573
Very confident 1 1436
Fairly confident 1.1 (0.9 to 1.4) 1189
Not confident/not at all 1.0 (0.7 to 1.6) 280
Can find out when NHS services are open 0.048
Very confident 1 1487
Fairly confident 1.2 (0.96 to 1.6) 1163
Not confident/not at all 1.6 (1.1 to 2.3) 255
Can find out what test available at services 0.440
Very confident 1 963
Fairly confident 0.8 (0.7 to 1.1) 1307
Not confident/not at all 0.96 (0.7 to 1.3) 635
APPENDIX 9
NIHR Journals Library www.journalslibrary.nihr.ac.uk
180

TABLE 20 Variables explaining tendency to call emergency ambulance service in vignettes (continued )
Variable
Univariate Final multivariable model
Odds ratio(95% CI) n p-value
Odds ratio(95% CI) p-value
How to contact GP OOH 0.716
Very 1 1338
Fairly 1.1 (0.8 to 1.4) 1056
Not very confident 1.1 (0.7 to 1.5) 389
Not at all 1.3 (0.8 to 2.3) 122
Will look up on the internet to see what to do 0.000
Very likely 1 428
Fairly likely 0.7 (0.5 to 1.1) 752
Not very likely 1.0 (0.7 to 1.5) 680
Not at all 1.6 (1.1 to 2.3) 1016
Missing 1.0 (0.3 to 3.4) 30
Will look up on the internet to decide whatproblem is
0.000
Very likely 1 667
Fairly likely 0.7 (0.5 to 0.9) 797
Not very likely 0.9 (0.6 to 1.3) 472
Not at all 1.5 (1.1 to 2.1) 940
Missing 0.9 (0.3 to 3.1) 30
Recursivity
If tests are done I was right to make contact 0.000
Disagree/strongly disagree 1 280
Neither 1.1 (0.7 to 1.8) 793
Strongly agree/agree 1.9 (1.2 to 3.0) 1236
Missing, self-complete 0
Health literacy
Lower health literacy compared with higher healthliteracy – understand information
2.1 (1.8 to 2.6) 2269 0.000 1.7 (1.3 to 2.0) 0.000
Lower health literacy compared with higher healthliteracy – ability to communicate
1.7 (1.4 to 2.0) 2269 0.000
Recent use of health care
Ambulance use 0.000 0.000
Never 1 1349 1
≥ 12 months 1.2 (0.9 to 1.6) 1108 1.4 (1.0 to 1.9)
< 12 months 2.2 (1.6 to 3.0) 448 2.5 (1.7 to 3.8)
Ambulance frequent user 0.002
< 3 times 1 2842
≥ 3 times in 12 months 2.7 (1.5 to 4.8) 64
continued
DOI: 10.3310/hsdr08150 Health Services and Delivery Research 2020 Vol. 8 No. 15
© Queen’s Printer and Controller of HMSO 2020. This work was produced by O’Cathain et al. under the terms of a commissioning contract issued by the Secretary of Statefor Health and Social Care. This issue may be freely reproduced for the purposes of private research and study and extracts (or indeed, the full report) may be included inprofessional journals provided that suitable acknowledgement is made and the reproduction is not associated with any form of advertising. Applications for commercialreproduction should be addressed to: NIHR Journals Library, National Institute for Health Research, Evaluation, Trials and Studies Coordinating Centre, Alpha House,University of Southampton Science Park, Southampton SO16 7NS, UK.
181
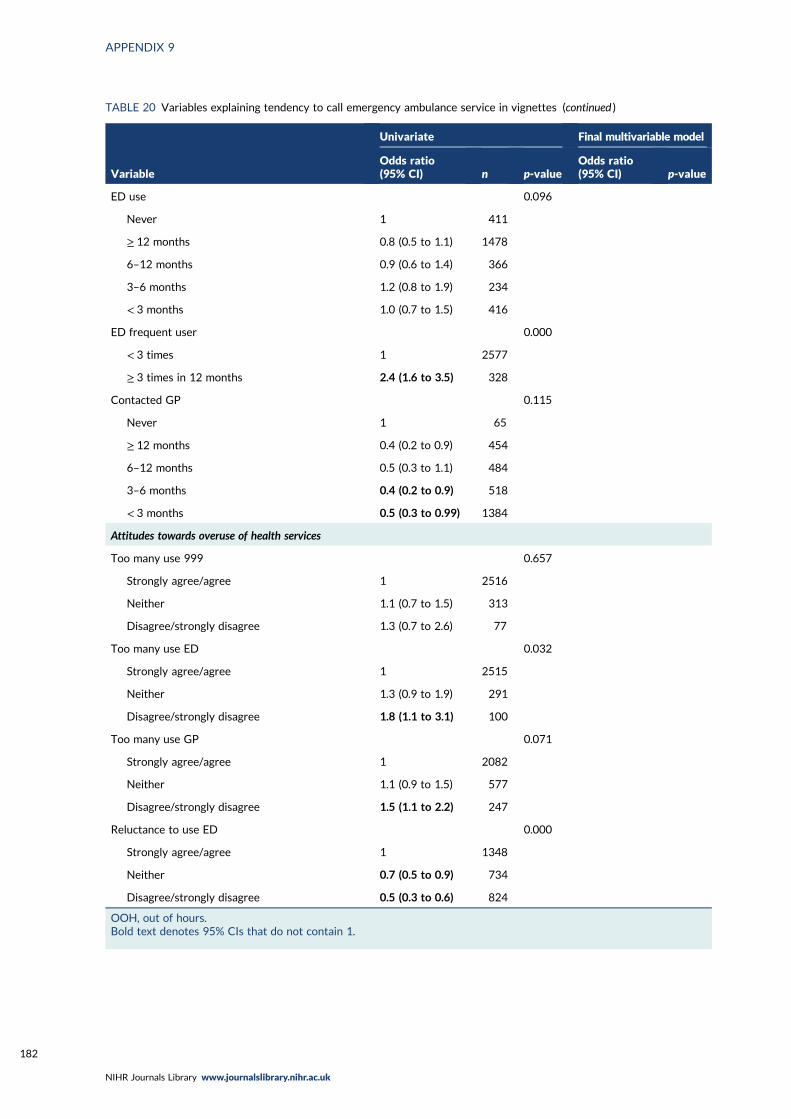
TABLE 20 Variables explaining tendency to call emergency ambulance service in vignettes (continued )
Variable
Univariate Final multivariable model
Odds ratio(95% CI) n p-value
Odds ratio(95% CI) p-value
ED use 0.096
Never 1 411
≥ 12 months 0.8 (0.5 to 1.1) 1478
6–12 months 0.9 (0.6 to 1.4) 366
3–6 months 1.2 (0.8 to 1.9) 234
< 3 months 1.0 (0.7 to 1.5) 416
ED frequent user 0.000
< 3 times 1 2577
≥ 3 times in 12 months 2.4 (1.6 to 3.5) 328
Contacted GP 0.115
Never 1 65
≥ 12 months 0.4 (0.2 to 0.9) 454
6–12 months 0.5 (0.3 to 1.1) 484
3–6 months 0.4 (0.2 to 0.9) 518
< 3 months 0.5 (0.3 to 0.99) 1384
Attitudes towards overuse of health services
Too many use 999 0.657
Strongly agree/agree 1 2516
Neither 1.1 (0.7 to 1.5) 313
Disagree/strongly disagree 1.3 (0.7 to 2.6) 77
Too many use ED 0.032
Strongly agree/agree 1 2515
Neither 1.3 (0.9 to 1.9) 291
Disagree/strongly disagree 1.8 (1.1 to 3.1) 100
Too many use GP 0.071
Strongly agree/agree 1 2082
Neither 1.1 (0.9 to 1.5) 577
Disagree/strongly disagree 1.5 (1.1 to 2.2) 247
Reluctance to use ED 0.000
Strongly agree/agree 1 1348
Neither 0.7 (0.5 to 0.9) 734
Disagree/strongly disagree 0.5 (0.3 to 0.6) 824
OOH, out of hours.Bold text denotes 95% CIs that do not contain 1.
APPENDIX 9
NIHR Journals Library www.journalslibrary.nihr.ac.uk
182

TABLE 21 Full model for ambulance
Variables Significance Exp(B)
95% CI for Exp(B)
Lower Upper
Age of respondent(grouped) < 7 category > dv 0.542
Age of respondent(grouped) < 7 category > dv(1) 0.286 1.650 0.657 4.143
Age of respondent(grouped) < 7 category > dv(2) 0.880 1.075 0.418 2.765
Age of respondent(grouped) < 7 category > dv(3) 0.730 1.180 0.462 3.015
Age of respondent(grouped) < 7 category > dv(4) 0.342 1.551 0.628 3.833
Age of respondent(grouped) < 7 category > dv(5) 0.171 1.910 0.756 4.823
Age of respondent(grouped) < 7 category > dv(6) 0.321 1.640 0.618 4.353
Sex of respondent(1) 0.017 0.664 0.475 0.930
Limiting long term condition or disability dv 0.602
Limiting long term condition or disability dv(1) 0.484 1.157 0.769 1.743
Limiting long term condition or disability dv(2) 0.701 0.911 0.567 1.465
Respondent: social class [pre-SOC2000] best estimate dv 0.016
Respondent: social class [pre-SOC2000] best estimate dv(1) 0.300 1.588 0.662 3.811
Respondent: social class [pre-SOC2000] best estimate dv(2) 0.616 1.267 0.503 3.194
Respondent: social class [pre-SOC2000] best estimate dv(3) 0.020 2.938 1.184 7.290
Respondent: social class [pre-SOC2000] best estimate dv(4) 0.106 2.110 0.854 5.213
Respondent: social class [pre-SOC2000] best estimate dv(5) 0.724 1.328 0.275 6.423
IMD_ALL 0.253
IMD_ALL(1) 0.128 1.451 0.899 2.344
IMD_ALL(2) 0.477 1.209 0.716 2.040
IMD_ALL(3) 0.887 1.038 0.618 1.745
IMD_ALL(4) 0.074 1.621 0.955 2.751
DV To which of these racial groups do you consider you belong?(compressed)(1)
0.009 1.938 1.176 3.194
When did you last see or speak to the 999 ambulance service(for yourself or someone else)?
0.000
When did you last see or speak to the 999 ambulance service(for yourself or someone else)?(1)
0.005 0.551 0.362 0.839
When did you last see or speak to the 999 ambulance service(for yourself or someone else)?(2)
0.000 0.399 0.259 0.614
Do you personally have internet access at home/work/elsewhere or ona smartphone/tablet/mobile device?(1)
0.177 1.389 0.862 2.239
For unexpected non-life-threatening health problem, how likely is it youwould . . . look on the internet to decide what the problem might be
0.191
For unexpected non-life-threatening health problem, how likely is it youwould . . . look on the internet to decide what the problem might be(1)
0.027 0.519 0.290 0.929
For unexpected non-life-threatening health problem, how likely is it youwould . . . look on the internet to decide what the problem might be(2)
0.115 0.568 0.281 1.147
For unexpected non-life-threatening health problem, how likely is it youwould . . . look on the internet to decide what the problem might be(3)
0.629 0.809 0.343 1.909
continued
DOI: 10.3310/hsdr08150 Health Services and Delivery Research 2020 Vol. 8 No. 15
© Queen’s Printer and Controller of HMSO 2020. This work was produced by O’Cathain et al. under the terms of a commissioning contract issued by the Secretary of Statefor Health and Social Care. This issue may be freely reproduced for the purposes of private research and study and extracts (or indeed, the full report) may be included inprofessional journals provided that suitable acknowledgement is made and the reproduction is not associated with any form of advertising. Applications for commercialreproduction should be addressed to: NIHR Journals Library, National Institute for Health Research, Evaluation, Trials and Studies Coordinating Centre, Alpha House,University of Southampton Science Park, Southampton SO16 7NS, UK.
183
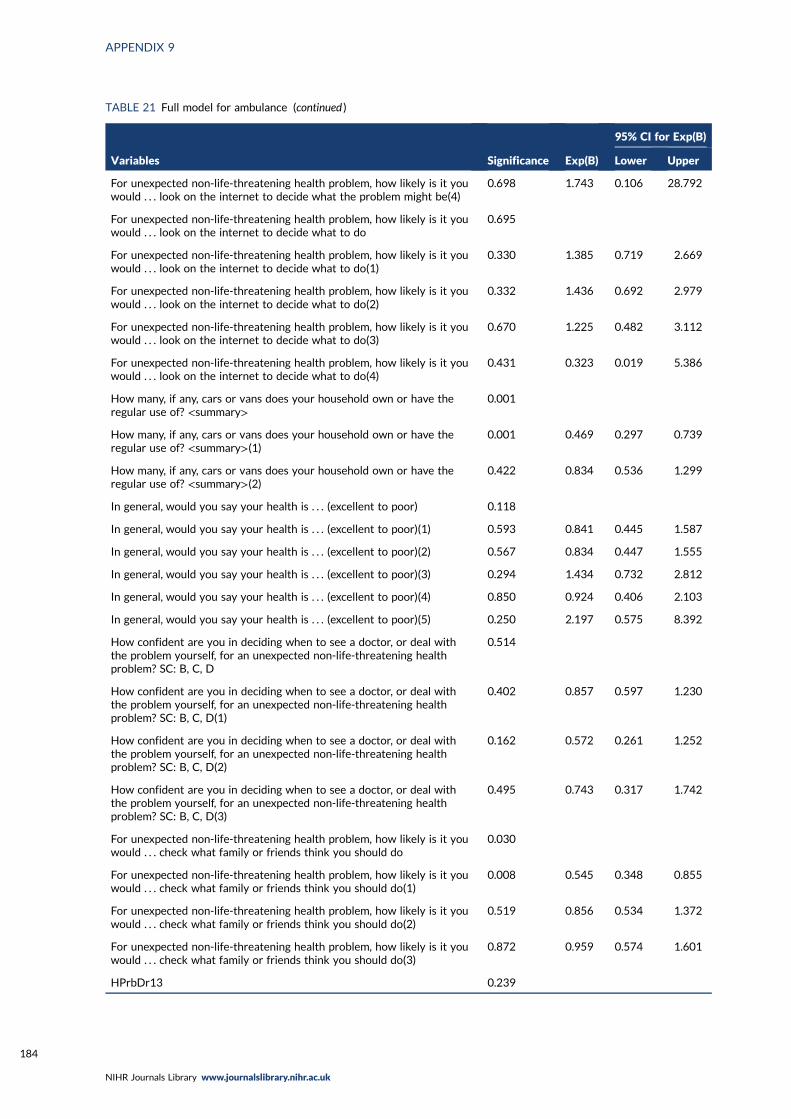
TABLE 21 Full model for ambulance (continued )
Variables Significance Exp(B)
95% CI for Exp(B)
Lower Upper
For unexpected non-life-threatening health problem, how likely is it youwould . . . look on the internet to decide what the problem might be(4)
0.698 1.743 0.106 28.792
For unexpected non-life-threatening health problem, how likely is it youwould . . . look on the internet to decide what to do
0.695
For unexpected non-life-threatening health problem, how likely is it youwould . . . look on the internet to decide what to do(1)
0.330 1.385 0.719 2.669
For unexpected non-life-threatening health problem, how likely is it youwould . . . look on the internet to decide what to do(2)
0.332 1.436 0.692 2.979
For unexpected non-life-threatening health problem, how likely is it youwould . . . look on the internet to decide what to do(3)
0.670 1.225 0.482 3.112
For unexpected non-life-threatening health problem, how likely is it youwould . . . look on the internet to decide what to do(4)
0.431 0.323 0.019 5.386
How many, if any, cars or vans does your household own or have theregular use of? <summary>
0.001
How many, if any, cars or vans does your household own or have theregular use of? <summary>(1)
0.001 0.469 0.297 0.739
How many, if any, cars or vans does your household own or have theregular use of? <summary>(2)
0.422 0.834 0.536 1.299
In general, would you say your health is . . . (excellent to poor) 0.118
In general, would you say your health is . . . (excellent to poor)(1) 0.593 0.841 0.445 1.587
In general, would you say your health is . . . (excellent to poor)(2) 0.567 0.834 0.447 1.555
In general, would you say your health is . . . (excellent to poor)(3) 0.294 1.434 0.732 2.812
In general, would you say your health is . . . (excellent to poor)(4) 0.850 0.924 0.406 2.103
In general, would you say your health is . . . (excellent to poor)(5) 0.250 2.197 0.575 8.392
How confident are you in deciding when to see a doctor, or deal withthe problem yourself, for an unexpected non-life-threatening healthproblem? SC: B, C, D
0.514
How confident are you in deciding when to see a doctor, or deal withthe problem yourself, for an unexpected non-life-threatening healthproblem? SC: B, C, D(1)
0.402 0.857 0.597 1.230
How confident are you in deciding when to see a doctor, or deal withthe problem yourself, for an unexpected non-life-threatening healthproblem? SC: B, C, D(2)
0.162 0.572 0.261 1.252
How confident are you in deciding when to see a doctor, or deal withthe problem yourself, for an unexpected non-life-threatening healthproblem? SC: B, C, D(3)
0.495 0.743 0.317 1.742
For unexpected non-life-threatening health problem, how likely is it youwould . . . check what family or friends think you should do
0.030
For unexpected non-life-threatening health problem, how likely is it youwould . . . check what family or friends think you should do(1)
0.008 0.545 0.348 0.855
For unexpected non-life-threatening health problem, how likely is it youwould . . . check what family or friends think you should do(2)
0.519 0.856 0.534 1.372
For unexpected non-life-threatening health problem, how likely is it youwould . . . check what family or friends think you should do(3)
0.872 0.959 0.574 1.601
HPrbDr13 0.239
APPENDIX 9
NIHR Journals Library www.journalslibrary.nihr.ac.uk
184

TABLE 21 Full model for ambulance (continued )
Variables Significance Exp(B)
95% CI for Exp(B)
Lower Upper
HPrbDr13(1) 0.221 1.259 0.870 1.822
HPrbDr13(2) 0.109 1.573 0.904 2.735
My work or looking after my family makes it difficult to see a GP SC:B, C, D
0.006
My work or looking after my family makes it difficult to see a GP SC:B, C, D(1)
0.004 2.516 1.341 4.720
My work or looking after my family makes it difficult to see a GP SC:B, C, D(2)
0.001 2.732 1.498 4.983
My work or looking after my family makes it difficult to see a GP SC:B, C, D(3)
0.001 3.336 1.632 6.820
For unexpected non-life-threatening pain, how likely is it you would . . .worry that it is a sign of something serious
0.001
For unexpected non-life-threatening pain, how likely is it you would . . .worry that it is a sign of something serious(1)
0.621 1.120 0.714 1.757
For unexpected non-life-threatening pain, how likely is it you would . . .worry that it is a sign of something serious(2)
0.003 0.488 0.302 0.790
For unexpected non-life-threatening pain, how likely is it you would . . .worry that it is a sign of something serious(3)
0.345 0.739 0.394 1.385
For unexpected non-life-threatening pain, how likely is it you would . . .worry that it is a sign of something serious(4)
0.541 1.291 0.569 2.929
How easy or difficult would you find it to travel to an accident andemergency department (A&E)?
0.266
How easy or difficult would you find it to travel to an accident andemergency department (A&E)?(1)
0.593 0.849 0.465 1.548
How easy or difficult would you find it to travel to an accident andemergency department (A&E)?(2)
0.459 1.164 0.779 1.740
How easy or difficult would you find it to travel to an accident andemergency department (A&E)?(3)
0.301 0.778 0.483 1.253
The opening hours for some NHS services are a problem for me SC:B, C, D
0.196
The opening hours for some NHS services are a problem for me SC:B, C, D(1)
0.508 1.163 0.744 1.818
The opening hours for some NHS services are a problem for me SC:B, C, D(2)
0.348 0.814 0.529 1.252
I prefer NHS services where I don’t need to make an appointment SC:B, C, D
0.500
I prefer NHS services where I don’t need to make an appointment SC:B, C, D(1)
0.258 0.801 0.545 1.177
I prefer NHS services where I don’t need to make an appointment SC:B, C, D(2)
0.889 0.970 0.636 1.481
Do you have family, friends or a partner who could look after them ifhave an unexpected non-life-threatening health problem? SC: B, C, D
0.353
Do you have family, friends or a partner who could look after them ifhave an unexpected non-life-threatening health problem? SC: B, C, D(1)
0.422 0.856 0.585 1.252
continued
DOI: 10.3310/hsdr08150 Health Services and Delivery Research 2020 Vol. 8 No. 15
© Queen’s Printer and Controller of HMSO 2020. This work was produced by O’Cathain et al. under the terms of a commissioning contract issued by the Secretary of Statefor Health and Social Care. This issue may be freely reproduced for the purposes of private research and study and extracts (or indeed, the full report) may be included inprofessional journals provided that suitable acknowledgement is made and the reproduction is not associated with any form of advertising. Applications for commercialreproduction should be addressed to: NIHR Journals Library, National Institute for Health Research, Evaluation, Trials and Studies Coordinating Centre, Alpha House,University of Southampton Science Park, Southampton SO16 7NS, UK.
185
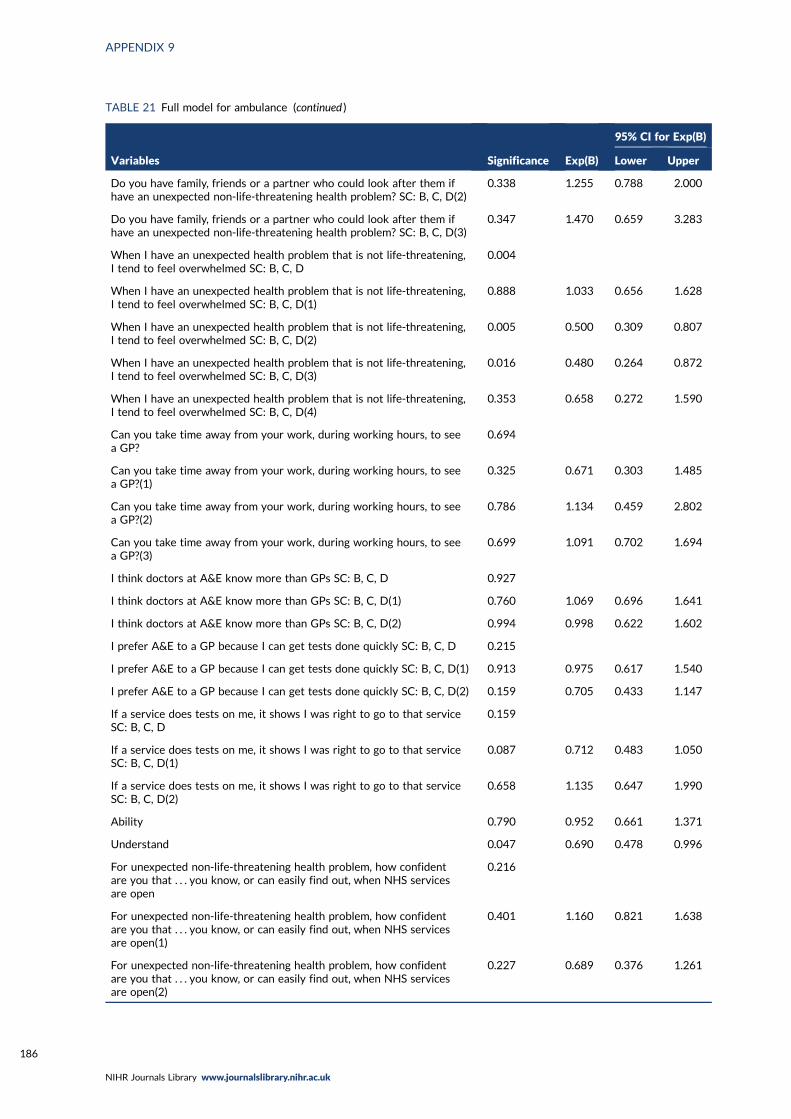
TABLE 21 Full model for ambulance (continued )
Variables Significance Exp(B)
95% CI for Exp(B)
Lower Upper
Do you have family, friends or a partner who could look after them ifhave an unexpected non-life-threatening health problem? SC: B, C, D(2)
0.338 1.255 0.788 2.000
Do you have family, friends or a partner who could look after them ifhave an unexpected non-life-threatening health problem? SC: B, C, D(3)
0.347 1.470 0.659 3.283
When I have an unexpected health problem that is not life-threatening,I tend to feel overwhelmed SC: B, C, D
0.004
When I have an unexpected health problem that is not life-threatening,I tend to feel overwhelmed SC: B, C, D(1)
0.888 1.033 0.656 1.628
When I have an unexpected health problem that is not life-threatening,I tend to feel overwhelmed SC: B, C, D(2)
0.005 0.500 0.309 0.807
When I have an unexpected health problem that is not life-threatening,I tend to feel overwhelmed SC: B, C, D(3)
0.016 0.480 0.264 0.872
When I have an unexpected health problem that is not life-threatening,I tend to feel overwhelmed SC: B, C, D(4)
0.353 0.658 0.272 1.590
Can you take time away from your work, during working hours, to seea GP?
0.694
Can you take time away from your work, during working hours, to seea GP?(1)
0.325 0.671 0.303 1.485
Can you take time away from your work, during working hours, to seea GP?(2)
0.786 1.134 0.459 2.802
Can you take time away from your work, during working hours, to seea GP?(3)
0.699 1.091 0.702 1.694
I think doctors at A&E know more than GPs SC: B, C, D 0.927
I think doctors at A&E know more than GPs SC: B, C, D(1) 0.760 1.069 0.696 1.641
I think doctors at A&E know more than GPs SC: B, C, D(2) 0.994 0.998 0.622 1.602
I prefer A&E to a GP because I can get tests done quickly SC: B, C, D 0.215
I prefer A&E to a GP because I can get tests done quickly SC: B, C, D(1) 0.913 0.975 0.617 1.540
I prefer A&E to a GP because I can get tests done quickly SC: B, C, D(2) 0.159 0.705 0.433 1.147
If a service does tests on me, it shows I was right to go to that serviceSC: B, C, D
0.159
If a service does tests on me, it shows I was right to go to that serviceSC: B, C, D(1)
0.087 0.712 0.483 1.050
If a service does tests on me, it shows I was right to go to that serviceSC: B, C, D(2)
0.658 1.135 0.647 1.990
Ability 0.790 0.952 0.661 1.371
Understand 0.047 0.690 0.478 0.996
For unexpected non-life-threatening health problem, how confidentare you that . . . you know, or can easily find out, when NHS servicesare open
0.216
For unexpected non-life-threatening health problem, how confidentare you that . . . you know, or can easily find out, when NHS servicesare open(1)
0.401 1.160 0.821 1.638
For unexpected non-life-threatening health problem, how confidentare you that . . . you know, or can easily find out, when NHS servicesare open(2)
0.227 0.689 0.376 1.261
APPENDIX 9
NIHR Journals Library www.journalslibrary.nihr.ac.uk
186

TABLE 21 Full model for ambulance (continued )
Variables Significance Exp(B)
95% CI for Exp(B)
Lower Upper
I think too many people use A&E when they do not need to 0.639
I think too many people use A&E when they do not need to(1) 0.648 0.879 0.505 1.529
I think too many people use A&E when they do not need to(2) 0.428 1.390 0.616 3.140
Many people use A&E because they cannot get a GP appointment easily 0.207
Many people use A&E because they cannot get a GP appointmenteasily(1)
0.157 1.443 0.868 2.397
Many people use A&E because they cannot get a GP appointmenteasily(2)
0.220 1.579 0.761 3.275
Many people are reluctant to use A&E when they have an urgent healthproblem
0.121
Many people are reluctant to use A&E when they have an urgent healthproblem(1)
0.466 0.864 0.583 1.280
Many people are reluctant to use A&E when they have an urgent healthproblem(2)
0.040 0.660 0.444 0.981
Constant 0.823 0.808
TABLE 22 Variables explaining tendency to attend ED for adults in vignettes
Variables
Univariate Final multivariable model
Odds ratio(95% CI) n p-value
Odds ratio(95% CI) p-value
Sociodemographic characteristics
Age (years) 0.977
18–24 1 169
25–34 1.0 (0.6 to 1.5) 384
35–44 1.0 (0.6 to 1.5) 467
45–54 0.9 (0.6 to 1.4) 469
55–64 0.9 (0.6 to 1.4) 508
65–74 0.9 (0.7 to 1.5) 499
≥ 75 0.8 (0.6 to 1.5) 405
Sex 0.001 1 0.015
Female 1 1649
Male 1.4 (1.1 to 1.7) 1257 1.3 (1.0 to 1.6)
Ethnicity < 0.001 0.003
White 1 2572 1
BAME 2.1 (1.6 to 2.7) 334 1.7 (1.2 to 2.4)
continued
DOI: 10.3310/hsdr08150 Health Services and Delivery Research 2020 Vol. 8 No. 15
© Queen’s Printer and Controller of HMSO 2020. This work was produced by O’Cathain et al. under the terms of a commissioning contract issued by the Secretary of Statefor Health and Social Care. This issue may be freely reproduced for the purposes of private research and study and extracts (or indeed, the full report) may be included inprofessional journals provided that suitable acknowledgement is made and the reproduction is not associated with any form of advertising. Applications for commercialreproduction should be addressed to: NIHR Journals Library, National Institute for Health Research, Evaluation, Trials and Studies Coordinating Centre, Alpha House,University of Southampton Science Park, Southampton SO16 7NS, UK.
187

TABLE 22 Variables explaining tendency to attend ED for adults in vignettes (continued )
Variables
Univariate Final multivariable model
Odds ratio(95% CI) n p-value
Odds ratio(95% CI) p-value
Social class 0.034
I 1 214
II 1.6 (1.0 to 2.5) 1039
III non-manual 1.6 (0.97 to 2.5) 569
III manual 2.0 (1.2 to 3.3) 416
IV and V 1.8 (1.1 to 2.9) 524
Armed forces 2.9 (1.4 to 6.1) 52
Deprivation 0.051
5 (affluent) 1 611
4 1.0 (0.7 to 1.3) 638
3 0.9 (0.7 to 1.3) 536
2 1.0 (0.7 to 1.3) 545
1 (most deprived) 1.4 (1.0 to 1.8) 576
Rurality 0.004
Rural 1 665
Urban 1.4 (1.1 to 1.8) 2241
Region 0.09
North England 1 474
Midlands 1.0 (0.7 to 1.3) 794
South England 0.9 (0.7 to 1.2) 957
London 1.4 (0.95 to 2.0) 285
Wales 1.4 (0.9 to 2.3) 132
Scotland 1.2 (0.8 to 1.8) 264
In household with children aged < 5 years old 0.503
No 1 2591
Yes 1.1 (0.8 to 1.5) 300
Resources available
Car ownership 1 0.561
≥ 1 cars 1.2 (0.9 to 1.5) 1478
No car 1.1 (0.9 to 1.3) 428
Missing 1 1000
Personal access to internet 0.393
Yes 1 2542
No 1.1 (0.9 to 1.5) 364
APPENDIX 9
NIHR Journals Library www.journalslibrary.nihr.ac.uk
188

TABLE 22 Variables explaining tendency to attend ED for adults in vignettes (continued )
Variables
Univariate Final multivariable model
Odds ratio(95% CI) n p-value
Odds ratio(95% CI) p-value
Health
General health 0.775
Excellent 1 223
Very good 0.8 (0.5 to 1.2) 725
Good 1.0 (0.6 to 1.4) 799
Fair 1.0 (0.6 to 1.5) 360
Poor 0.9 (0.5 to 1.5) 163
Can’t choose 0.8 (0.3 to 2.1) 39
Missing/not included 0
Long-term limiting illness 0.549
None 1 1766
Non-limiting 0.9 (0.7 to 1.1) 586
Limiting 1.0 (0.8 to 1.3) 541
Don’t know 0.8 (0.2 to 3.8) 13
Programme theories
1, Risk: uncertainty causes anxiety
Worry pain is a sign of something serious < 0.001
Not likely at all 1 358
Not likely 1.1 (0.8 to 1.6) 1138
Fairly likely 1.4 (0.97 to 1.9) 876
Very likely 2.0 (1.4 to 2.9) 415
It depends 0.9 (0.5 to 1.6) 119
Confident in deciding to see a doctor or self-care 0.283
Very confident 1 993
Fairly confident 1.2 (0.98 to 1.5) 1130
Not very confident 1.4 (0.8 to 2.4) 89
Never had problem 1.1 (0.6 to 1.9) 97
2, Risk: previous traumatic event
Had problem, did not see doctor and was serious 0.562
No 1 2219
Yes 0.9 (0.7 to 1.2) 687
3, Risk: responsibility for others
continued
DOI: 10.3310/hsdr08150 Health Services and Delivery Research 2020 Vol. 8 No. 15
© Queen’s Printer and Controller of HMSO 2020. This work was produced by O’Cathain et al. under the terms of a commissioning contract issued by the Secretary of Statefor Health and Social Care. This issue may be freely reproduced for the purposes of private research and study and extracts (or indeed, the full report) may be included inprofessional journals provided that suitable acknowledgement is made and the reproduction is not associated with any form of advertising. Applications for commercialreproduction should be addressed to: NIHR Journals Library, National Institute for Health Research, Evaluation, Trials and Studies Coordinating Centre, Alpha House,University of Southampton Science Park, Southampton SO16 7NS, UK.
189

TABLE 22 Variables explaining tendency to attend ED for adults in vignettes (continued )
Variables
Univariate Final multivariable model
Odds ratio(95% CI) n p-value
Odds ratio(95% CI) p-value
4, Speed: need to get back to normal
Sleep < 0.001
Do not see doctor 1 2010
See doctor if sleep loss 1.9 (1.5 to 2.4) 634
See doctor if any loss 1.8 (1.3 to 2.5) 262
Work
Do not see doctor 1 935 < 0.001 1 0.037
See doctor if work loss 1.6 (1.3 to 2.0) 1709 1.4 (1.1 to 1.8)
See doctor if any loss 2.1 (1.5 to 2.9) 262 1.3 (0.9 to 2.1)
5, Speed: need to seek pain relief
Likely to take medication 0.162
Very likely 1 1081
Fairly likely 0.8 (0.6 to 0.99) 1257
Not very likely 0.9 (0.7 to 1.3) 376
Not at all likely 0.6 (0.4 to 1.1) 135
Depends 0.8 (0.4 to 1.6) 57
6, Speed: waited long enough
7a, Stressful lives
Overwhelmed when have health problem 0.005
Strongly disagree 1 487
Disagree 1.4 (1.0 to 2.0) 872
Neither 1.8 (1.3 to 2.5) 537
Strongly agree/agree 1.9 (1.3 to 2.8) 314
Never had problem 1.3 (0.7 to 2.4) 99
Find life stressful 0.192
No 1 637
A bit 1.2 (0.97 to 1.6) 1316
Quite 1.0 (0.7 to 1.3) 637
Very 1.1 (0.8 to 1.6) 297
Don’t know 0.6 (0.1 to 2.7) 19
Someone to care for them if they are ill 0.165
Definitely 1 1240
Probably 0.8 (0.6 to 0.97) 697
Probably not 0.9 (0.6 to 1.2) 280
Don’t know 1.0 (0.6 to 1.8) 92
APPENDIX 9
NIHR Journals Library www.journalslibrary.nihr.ac.uk
190
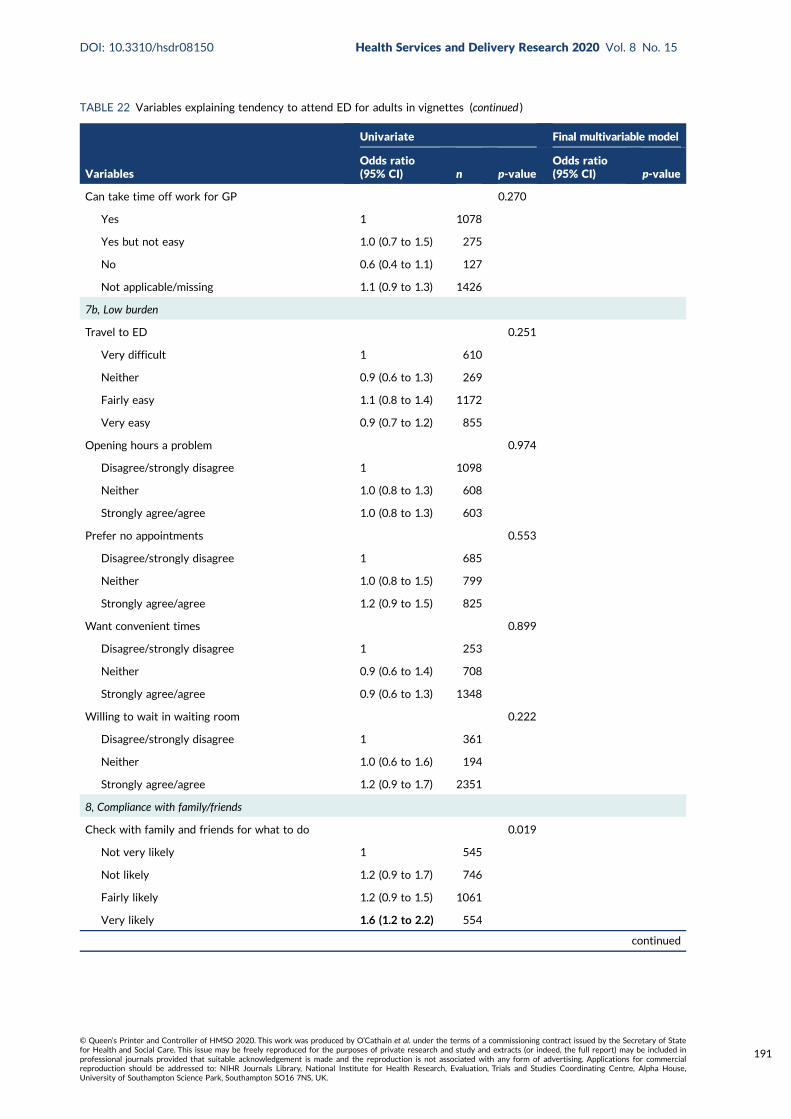
TABLE 22 Variables explaining tendency to attend ED for adults in vignettes (continued )
Variables
Univariate Final multivariable model
Odds ratio(95% CI) n p-value
Odds ratio(95% CI) p-value
Can take time off work for GP 0.270
Yes 1 1078
Yes but not easy 1.0 (0.7 to 1.5) 275
No 0.6 (0.4 to 1.1) 127
Not applicable/missing 1.1 (0.9 to 1.3) 1426
7b, Low burden
Travel to ED 0.251
Very difficult 1 610
Neither 0.9 (0.6 to 1.3) 269
Fairly easy 1.1 (0.8 to 1.4) 1172
Very easy 0.9 (0.7 to 1.2) 855
Opening hours a problem 0.974
Disagree/strongly disagree 1 1098
Neither 1.0 (0.8 to 1.3) 608
Strongly agree/agree 1.0 (0.8 to 1.3) 603
Prefer no appointments 0.553
Disagree/strongly disagree 1 685
Neither 1.0 (0.8 to 1.5) 799
Strongly agree/agree 1.2 (0.9 to 1.5) 825
Want convenient times 0.899
Disagree/strongly disagree 1 253
Neither 0.9 (0.6 to 1.4) 708
Strongly agree/agree 0.9 (0.6 to 1.3) 1348
Willing to wait in waiting room 0.222
Disagree/strongly disagree 1 361
Neither 1.0 (0.6 to 1.6) 194
Strongly agree/agree 1.2 (0.9 to 1.7) 2351
8, Compliance with family/friends
Check with family and friends for what to do 0.019
Not very likely 1 545
Not likely 1.2 (0.9 to 1.7) 746
Fairly likely 1.2 (0.9 to 1.5) 1061
Very likely 1.6 (1.2 to 2.2) 554
continued
DOI: 10.3310/hsdr08150 Health Services and Delivery Research 2020 Vol. 8 No. 15
© Queen’s Printer and Controller of HMSO 2020. This work was produced by O’Cathain et al. under the terms of a commissioning contract issued by the Secretary of Statefor Health and Social Care. This issue may be freely reproduced for the purposes of private research and study and extracts (or indeed, the full report) may be included inprofessional journals provided that suitable acknowledgement is made and the reproduction is not associated with any form of advertising. Applications for commercialreproduction should be addressed to: NIHR Journals Library, National Institute for Health Research, Evaluation, Trials and Studies Coordinating Centre, Alpha House,University of Southampton Science Park, Southampton SO16 7NS, UK.
191

TABLE 22 Variables explaining tendency to attend ED for adults in vignettes (continued )
Variables
Univariate Final multivariable model
Odds ratio(95% CI) n p-value
Odds ratio(95% CI) p-value
9, Views of services
Prefer ED for quick tests < 0.001 0.003
Disagree/strongly disagree 1 1159 1
Neither 1.3 (0.99 to 1.6) 797 1.2 (0.9 to 1.5)
Strongly agree/agree 2.2 (1.5 to 2.7) 353 1.7 (1.3 to 2.3)
Missing, self-complete 0
Doctors know more at ED 0.007
Disagree/strongly disagree 1 850
Neither 1.4 (1.1 to 1.8) 1041
Strongly agree/agree 1.6 (1.1 to 2.1) 418
Missing, self-complete 0
No confidence in GP 0.186
Strongly disagree 1 538
Disagree 1.2 (0.9 to 1.6) 1088
Neither 1.6 (1.1 to 2.2) 446
Agree 1.4 (0.9 to 2.2) 165
Strongly agree 0.9 (0.4 to 1.9) 76
Don’t know 1.7 (0.8 to 3.6) 42
Missing 1.0 (0.4 to 2.8) 34
Missing, self-complete 0
10, Frustration with access to GP
Hard to get GP appointment 0.636
Disagree/strongly disagree 1 819
Neither 1.0 (0.7 to 1.4) 353
Strongly agree/agree 0.9 (0.7 to 1.1) 1137
Missing, self-complete 0
Registered with GP 0.611
Yes 1 2840
No 1.2 (0.6 to 2.2) 65
Work or looking after family makes it difficult tosee GP
0.138
Disagree/strongly disagree 1 1197
Neither 1.1 (0.8 to 1.5) 455
Strongly agree/agree 0.7 (0.5 to 1.0) 410
Not applicable 0.9 (0.6 to 1.3) 247
APPENDIX 9
NIHR Journals Library www.journalslibrary.nihr.ac.uk
192
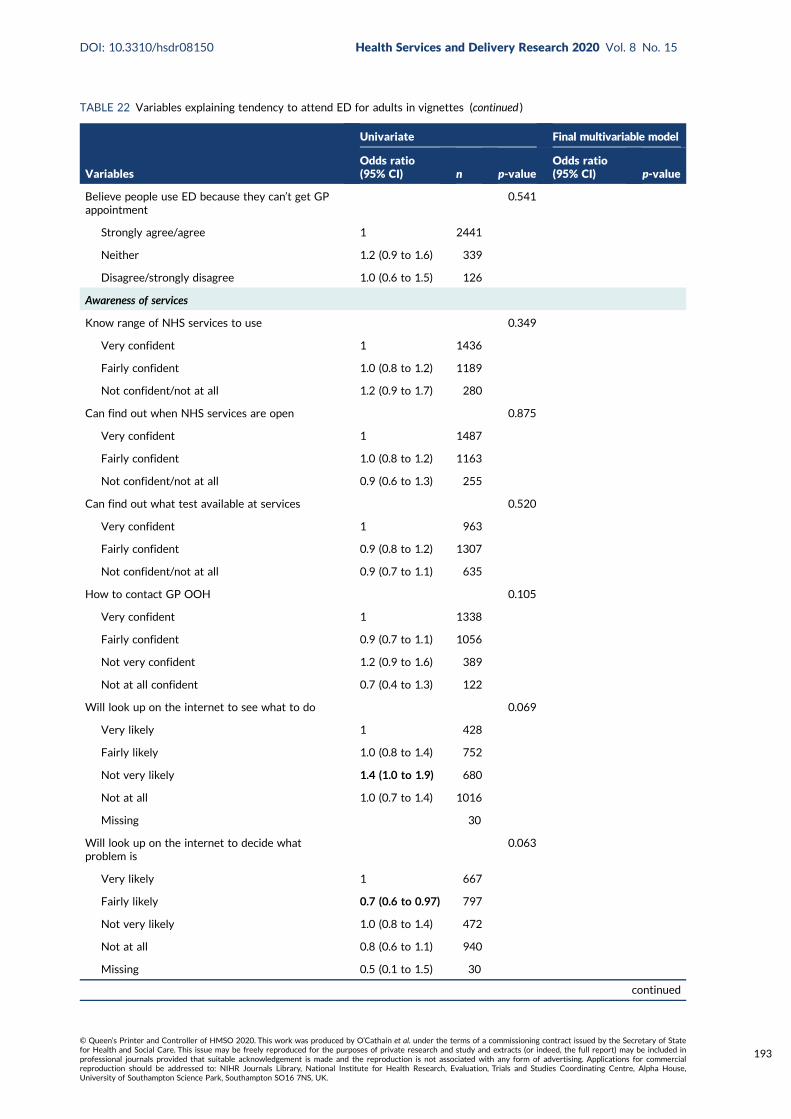
TABLE 22 Variables explaining tendency to attend ED for adults in vignettes (continued )
Variables
Univariate Final multivariable model
Odds ratio(95% CI) n p-value
Odds ratio(95% CI) p-value
Believe people use ED because they can’t get GPappointment
0.541
Strongly agree/agree 1 2441
Neither 1.2 (0.9 to 1.6) 339
Disagree/strongly disagree 1.0 (0.6 to 1.5) 126
Awareness of services
Know range of NHS services to use 0.349
Very confident 1 1436
Fairly confident 1.0 (0.8 to 1.2) 1189
Not confident/not at all 1.2 (0.9 to 1.7) 280
Can find out when NHS services are open 0.875
Very confident 1 1487
Fairly confident 1.0 (0.8 to 1.2) 1163
Not confident/not at all 0.9 (0.6 to 1.3) 255
Can find out what test available at services 0.520
Very confident 1 963
Fairly confident 0.9 (0.8 to 1.2) 1307
Not confident/not at all 0.9 (0.7 to 1.1) 635
How to contact GP OOH 0.105
Very confident 1 1338
Fairly confident 0.9 (0.7 to 1.1) 1056
Not very confident 1.2 (0.9 to 1.6) 389
Not at all confident 0.7 (0.4 to 1.3) 122
Will look up on the internet to see what to do 0.069
Very likely 1 428
Fairly likely 1.0 (0.8 to 1.4) 752
Not very likely 1.4 (1.0 to 1.9) 680
Not at all 1.0 (0.7 to 1.4) 1016
Missing 30
Will look up on the internet to decide whatproblem is
0.063
Very likely 1 667
Fairly likely 0.7 (0.6 to 0.97) 797
Not very likely 1.0 (0.8 to 1.4) 472
Not at all 0.8 (0.6 to 1.1) 940
Missing 0.5 (0.1 to 1.5) 30
continued
DOI: 10.3310/hsdr08150 Health Services and Delivery Research 2020 Vol. 8 No. 15
© Queen’s Printer and Controller of HMSO 2020. This work was produced by O’Cathain et al. under the terms of a commissioning contract issued by the Secretary of Statefor Health and Social Care. This issue may be freely reproduced for the purposes of private research and study and extracts (or indeed, the full report) may be included inprofessional journals provided that suitable acknowledgement is made and the reproduction is not associated with any form of advertising. Applications for commercialreproduction should be addressed to: NIHR Journals Library, National Institute for Health Research, Evaluation, Trials and Studies Coordinating Centre, Alpha House,University of Southampton Science Park, Southampton SO16 7NS, UK.
193

TABLE 22 Variables explaining tendency to attend ED for adults in vignettes (continued )
Variables
Univariate Final multivariable model
Odds ratio(95% CI) n p-value
Odds ratio(95% CI) p-value
Recursivity
If tests are done I was right to make contact 0.005 0.05
Disagree/strongly disagree 1 280 1
Neither 1.4 (0.9 to 2.1) 793 1.2 (0.8 to 1.8)
Strongly agree/agree 1.7 (1.2 to 2.6) 1236 1.5 (1.0 to 2.3)
Missing, self-complete 0
Health literacy
Lower health literacy compared with higherhealth literacy – understand information
1.1 (0.97 to 1.4) 2269 0.108
Lower health literacy compared with higherhealth literacy – ability to communicate
1.0 (0.9 to 1.2) 2269 0.884
Recent use of health care 0.436
Ambulance use
Never 1 1349
≥ 12 months 0.9 (0.8 to 1.1) 1108
< 12 months 1.1 (0.8 to 1.5) 448
Ambulance frequent user 0.366
< 3 times 1 2842
≥ 3 times in 12 months 1.3 (0.7 to 2.4) 64
ED use < 0.001
Never 1 411
≥ 12 months 1.0 (0.7 to 1.3) 1478
6–12 months 1.2 (0.8 to 1.8) 366
3–6 months 2.0 (1.4 to 3.0) 234
< 3 months 1.3 (0.9 to 1.9) 416
ED frequent user < 0.001
< 3 times 1 2738
≥ 3 times in 12 months 2.2 (1.6 to 3.2) 167
Contacted GP 0.544
Never 1 65
≥ 12 months 1.2 (0.6 to 2.6) 454
6–12 months 1.2 (0.6 to 2.5) 484
3–6 months 1.4 (0.7 to 2.9) 518
< 3 months 1.4 (0.7 to 2.9) 1384
APPENDIX 9
NIHR Journals Library www.journalslibrary.nihr.ac.uk
194

TABLE 22 Variables explaining tendency to attend ED for adults in vignettes (continued )
Variables
Univariate Final multivariable model
Odds ratio(95% CI) n p-value
Odds ratio(95% CI) p-value
Attitudes towards overuse of health services
Too many use 999 0.001
Strongly agree/agree 1 2516
Neither 1.7 (1.3 to 2.2) 313
Disagree/strongly disagree 1.4 (0.8 to 2.5) 77
Too many use ED < 0.001 < 0.001
Strongly agree/agree 1 2515 1
Neither 1.5 (1.1 to 2.1) 291 1.4 (1.0 to 2.0)
Disagree/strongly disagree 2.6 (1.7 to 4.0) 100 3.1 (1.9 to 5.3)
Too many use GP 0.541
Strongly agree/agree 1 2441
Neither 1.2 (0.9 to 1.6) 339
Disagree/strongly disagree 1.0 (0.6 to 1.5) 126
Reluctance to use ED 0.028 0.012
Strongly agree/agree 1 1348 1
Neither 1.4 (1.1 to 1.7) 734 1.5 (1.1 to 2.0)
Disagree/strongly disagree 1.1 (0.8 to 1.4) 824 1.3 (1.0 to 1.7)
OOH, out of hours.Bold text denotes 95% CIs that do not contain 1.
TABLE 23 Full model for adult ED
Variables Significance Exp(B)
95% CI for Exp(B)
Lower Upper
Sex of respondent(1) 0.031 0.765 0.600 0.976
Respondent: social class [pre-SOC2000] best estimate dv 0.421
Respondent: social class [pre-SOC2000] best estimate dv(1) 0.122 1.542 0.890 2.670
Respondent: social class [pre-SOC2000] best estimate dv(2) 0.105 1.617 0.904 2.894
Respondent: social class [pre-SOC2000] best estimate dv(3) 0.048 1.836 1.006 3.351
Respondent: social class [pre-SOC2000] best estimate dv(4) 0.176 1.512 0.831 2.750
Respondent: social class [pre-SOC2000] best estimate dv(5) 0.097 2.320 0.860 6.263
IMD_ALL 0.421
IMD_ALL(1) 0.069 0.701 0.477 1.029
IMD_ALL(2) 0.392 0.846 0.577 1.241
continued
DOI: 10.3310/hsdr08150 Health Services and Delivery Research 2020 Vol. 8 No. 15
© Queen’s Printer and Controller of HMSO 2020. This work was produced by O’Cathain et al. under the terms of a commissioning contract issued by the Secretary of Statefor Health and Social Care. This issue may be freely reproduced for the purposes of private research and study and extracts (or indeed, the full report) may be included inprofessional journals provided that suitable acknowledgement is made and the reproduction is not associated with any form of advertising. Applications for commercialreproduction should be addressed to: NIHR Journals Library, National Institute for Health Research, Evaluation, Trials and Studies Coordinating Centre, Alpha House,University of Southampton Science Park, Southampton SO16 7NS, UK.
195

TABLE 23 Full model for adult ED (continued )
Variables Significance Exp(B)
95% CI for Exp(B)
Lower Upper
IMD_ALL(3) 0.263 0.806 0.552 1.177
IMD_ALL(4) 0.658 0.919 0.633 1.336
DV To which of these racial groups do you consider you belong?(compressed)(1)
0.020 0.635 0.432 0.932
UrbRur_ALL(1) 0.211 0.828 0.617 1.113
When did you last see or speak to an accident and emergencydepartment (A&E) (for yourself or someone else)?
0.558
When did you last see or speak to an accident and emergencydepartment (A&E) (for yourself or someone else)?(1)
0.300 1.285 0.799 2.066
When did you last see or speak to an accident and emergencydepartment (A&E) (for yourself or someone else)?(2)
0.830 0.953 0.617 1.473
When did you last see or speak to an accident and emergencydepartment (A&E) (for yourself or someone else)?(3)
0.577 0.907 0.643 1.279
When did you last see or speak to an accident and emergencydepartment (A&E) (for yourself or someone else)?(4)
0.627 0.895 0.572 1.400
For unexpected non-life-threatening health problem, how likely is it youwould . . . check what family or friends think you should do
0.314
For unexpected non-life-threatening health problem, how likely is it youwould . . . check what family or friends think you should do(1)
0.066 0.734 0.528 1.020
For unexpected non-life-threatening health problem, how likely is it youwould . . . check what family or friends think you should do(2)
0.355 0.848 0.598 1.202
For unexpected non-life-threatening health problem, how likely is it youwould . . . check what family or friends think you should do(3)
0.522 0.882 0.600 1.296
HPrbDr13 0.047
HPrbDr13(1) 0.014 1.404 1.071 1.840
HPrbDr13(2) 0.429 1.207 0.757 1.926
For unexpected non-life-threatening pain, how likely is it you would . . .worry that it is a sign of something serious
0.735
For unexpected non-life-threatening pain, how likely is it you would . . .worry that it is a sign of something serious(1)
0.233 0.802 0.557 1.153
For unexpected non-life-threatening pain, how likely is it you would . . .worry that it is a sign of something serious(2)
0.215 0.794 0.551 1.144
For unexpected non-life-threatening pain, how likely is it you would . . .worry that it is a sign of something serious(3)
0.589 0.877 0.546 1.411
For unexpected non-life-threatening pain, how likely is it you would . . .worry that it is a sign of something serious(4)
0.400 0.743 0.372 1.483
When I have an unexpected health problem that is not life-threatening,I tend to feel overwhelmed SC: B, C, D
0.376
When I have an unexpected health problem that is not life-threatening,I tend to feel overwhelmed SC: B, C, D(1)
0.907 0.978 0.668 1.432
When I have an unexpected health problem that is not life-threatening,I tend to feel overwhelmed SC: B, C, D(2)
0.921 0.981 0.676 1.424
APPENDIX 9
NIHR Journals Library www.journalslibrary.nihr.ac.uk
196

TABLE 23 Full model for adult ED (continued )
Variables Significance Exp(B)
95% CI for Exp(B)
Lower Upper
When I have an unexpected health problem that is not life-threatening,I tend to feel overwhelmed SC: B, C, D(3)
0.120 0.703 0.452 1.096
When I have an unexpected health problem that is not life-threatening,I tend to feel overwhelmed SC: B, C, D(4)
0.590 0.836 0.435 1.605
I think doctors at A&E know more than GPs SC: B, C, D 0.415
I think doctors at A&E know more than GPs SC: B, C, D(1) 0.643 1.082 0.776 1.507
I think doctors at A&E know more than GPs SC: B, C, D(2) 0.537 0.892 0.620 1.283
I prefer A&E to a GP because I can get tests done quickly SC: B, C, D 0.067
I prefer A&E to a GP because I can get tests done quickly SC: B, C, D(1) 0.057 0.709 0.497 1.011
I prefer A&E to a GP because I can get tests done quickly SC: B, C, D(2) 0.023 0.662 0.464 0.945
If a service does tests on me, it shows I was right to go to that serviceSC: B, C, D
0.155
If a service does tests on me, it shows I was right to go to that serviceSC: B, C, D(1)
0.144 0.823 0.634 1.069
If a service does tests on me, it shows I was right to go to that serviceSC: B, C, D(2)
0.117 0.711 0.464 1.089
I think too many people call 999 for an ambulance when they do notneed to
0.038
I think too many people call 999 for an ambulance when they do notneed to(1)
0.018 1.621 1.085 2.423
I think too many people call 999 for an ambulance when they do notneed to(2)
0.521 0.779 0.363 1.671
I think too many people use A&E when they do not need to 0.005
I think too many people use A&E when they do not need to(1) 0.542 1.144 0.743 1.762
I think too many people use A&E when they do not need to(2) 0.001 2.927 1.525 5.616
I think too many people go to their GP when they do not need to 0.727
I think too many people go to their GP when they do not need to(1) 0.510 1.110 0.814 1.514
I think too many people go to their GP when they do not need to(2) 0.759 0.931 0.592 1.466
Many people are reluctant to use A&E when they have an urgenthealth problem
0.028
Many people are reluctant to use A&E when they have an urgenthealth problem(1)
0.019 1.420 1.059 1.905
Many people are reluctant to use A&E when they have an urgenthealth problem(2)
0.033 1.356 1.024 1.795
Constant 0.038 0.398
DOI: 10.3310/hsdr08150 Health Services and Delivery Research 2020 Vol. 8 No. 15
© Queen’s Printer and Controller of HMSO 2020. This work was produced by O’Cathain et al. under the terms of a commissioning contract issued by the Secretary of Statefor Health and Social Care. This issue may be freely reproduced for the purposes of private research and study and extracts (or indeed, the full report) may be included inprofessional journals provided that suitable acknowledgement is made and the reproduction is not associated with any form of advertising. Applications for commercialreproduction should be addressed to: NIHR Journals Library, National Institute for Health Research, Evaluation, Trials and Studies Coordinating Centre, Alpha House,University of Southampton Science Park, Southampton SO16 7NS, UK.
197

TABLE 24 Variables explaining tendency to attend ED for children in vignettes
Variable
Univariate Final multivariable model
Odds ratio(95% CI) n p-value
Odds ratio(95% CI) p-value
Sociodemographic characteristics
Age (years) < 0.001 < 0.001
18–24 1 169 1
25–34 1.0 (0.6 to 1.4) 384 0.9 (0.6 to 1.5)
35–44 1.0 (0.6 to 1.4) 467 1.1 (0.7 to 1.7)
45–54 1.4 (0.9 to 2.1) 469 1.6 (1.0 to 2.5)
55–64 1.7 (1.1 to 2.4) 508 1.9 (1.2 to 3.0)
65–74 1.6 (1.1 to 2.3) 499 1.7 (1.1 to 2.7)
≥ 75 1.1 (0.7 to 1.6) 405 1.1 (0.7 to 1.8)
Sex 0.002 0.007
Female 1 1649 1
Male 1.3 (1.1 to 1.5) 1257 1.3 (1.1 to 1.5)
Ethnicity 0.038 0.003
White 1 2572 1
BAME 1.3 (1.0 to 1.6) 334 1.6 (1.2 to 2.3)
Social class 0.072
I 1 214
II 1.0 (0.7 to 1.4) 1039
III non-manual 0.9 (0.6 to 1.3) 569
III manual 1.3 (0.9 to 1.8) 416
IV and V 1.2 (0.9 to 1.7) 524
Armed forces 1.0 (0.5 to 1.8) 52
Deprivation 0.357
5 (affluent) 1 611
4 1.2 (0.9 to 1.5) 638
3 1.0 (0.8 to 1.3) 536
2 1.0 (0.8 to 1.3) 545
1 (most deprived) 1.2 (0.9 to 1.5) 576
Rurality 0.988
Rural 1 665
Urban 1.0 (0.8 to 1.2) 2241
Region < 0.001 < 0.001
North England 1 474 1
Midlands 1.1 (0.9 to 1.4) 794 1.1 (0.9 to 1.5)
South England 1.0 (0.8 to 1.2) 957 1.0 (0.7 to 1.2)
London 1.0 (0.7 to 1.4) 285 0.8 (0.5 to 1.1)
APPENDIX 9
NIHR Journals Library www.journalslibrary.nihr.ac.uk
198

TABLE 24 Variables explaining tendency to attend ED for children in vignettes (continued )
Variable
Univariate Final multivariable model
Odds ratio(95% CI) n p-value
Odds ratio(95% CI) p-value
Wales 2.0 (1.3 to 2.9) 132 1.9 (1.2 to 3.0)
Scotland 1.7 (1.2 to 2.3) 264 1.7 (1.2 to 2.4)
In household with children aged < 5 years old 0.01
No 1 2591
Yes 0.7 (0.5 to 0.9) 300
Resources available
Car ownership 1 0.652
≥ 1 cars 0.9 (0.7 to 1.1) 1478
No car 1.0 (0.8 to 1.2) 428
Missing 1 1000
Personal access to the internet 0.643
Yes 1 2542
No 0.9 (0.7 to 1.2) 364
Health 0.378
General health
Excellent 1 223
Very good 1.1 (0.8 to 1.5) 725
Good 1.0 (0.7 to 1.3) 799
Fair 1.2 (0.8 to 1.7) 360
Poor 1.3 (0.8 to 2.0) 163
Can’t choose 0.7 (0.3 to 1.6) 39
Missing/not included 1 597
Long-term limiting illness 0.129
None 1 1766
Non-limiting 1.1 (0.9 to 1.4) 586
Limiting 1.2 (0.99 to 1.5) 541
Don’t know 0.4 (0.1 to 1.8) 13
Programme theories
1, Risk: uncertainty causes anxiety
Worry pain is a sign of something serious 0.998
Not likely at all 1 358
Not likely 1.0 (0.8 to 1.3) 1138
Fairly likely 1.0 (0.8 to 1.3) 876
Very likely 1.0 (0.8 to 1.4) 415
It depends 1.0 (0.6 to 1.5) 119
continued
DOI: 10.3310/hsdr08150 Health Services and Delivery Research 2020 Vol. 8 No. 15
© Queen’s Printer and Controller of HMSO 2020. This work was produced by O’Cathain et al. under the terms of a commissioning contract issued by the Secretary of Statefor Health and Social Care. This issue may be freely reproduced for the purposes of private research and study and extracts (or indeed, the full report) may be included inprofessional journals provided that suitable acknowledgement is made and the reproduction is not associated with any form of advertising. Applications for commercialreproduction should be addressed to: NIHR Journals Library, National Institute for Health Research, Evaluation, Trials and Studies Coordinating Centre, Alpha House,University of Southampton Science Park, Southampton SO16 7NS, UK.
199
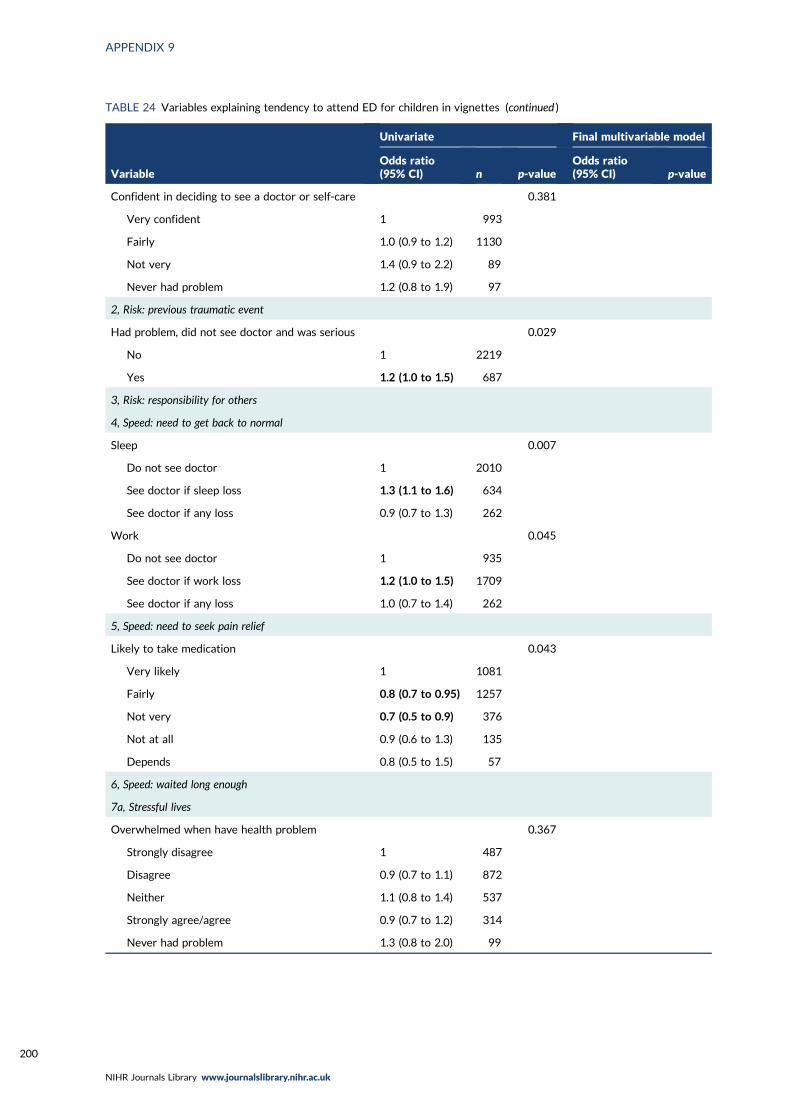
TABLE 24 Variables explaining tendency to attend ED for children in vignettes (continued )
Variable
Univariate Final multivariable model
Odds ratio(95% CI) n p-value
Odds ratio(95% CI) p-value
Confident in deciding to see a doctor or self-care 0.381
Very confident 1 993
Fairly 1.0 (0.9 to 1.2) 1130
Not very 1.4 (0.9 to 2.2) 89
Never had problem 1.2 (0.8 to 1.9) 97
2, Risk: previous traumatic event
Had problem, did not see doctor and was serious 0.029
No 1 2219
Yes 1.2 (1.0 to 1.5) 687
3, Risk: responsibility for others
4, Speed: need to get back to normal
Sleep 0.007
Do not see doctor 1 2010
See doctor if sleep loss 1.3 (1.1 to 1.6) 634
See doctor if any loss 0.9 (0.7 to 1.3) 262
Work 0.045
Do not see doctor 1 935
See doctor if work loss 1.2 (1.0 to 1.5) 1709
See doctor if any loss 1.0 (0.7 to 1.4) 262
5, Speed: need to seek pain relief
Likely to take medication 0.043
Very likely 1 1081
Fairly 0.8 (0.7 to 0.95) 1257
Not very 0.7 (0.5 to 0.9) 376
Not at all 0.9 (0.6 to 1.3) 135
Depends 0.8 (0.5 to 1.5) 57
6, Speed: waited long enough
7a, Stressful lives
Overwhelmed when have health problem 0.367
Strongly disagree 1 487
Disagree 0.9 (0.7 to 1.1) 872
Neither 1.1 (0.8 to 1.4) 537
Strongly agree/agree 0.9 (0.7 to 1.2) 314
Never had problem 1.3 (0.8 to 2.0) 99
APPENDIX 9
NIHR Journals Library www.journalslibrary.nihr.ac.uk
200

TABLE 24 Variables explaining tendency to attend ED for children in vignettes (continued )
Variable
Univariate Final multivariable model
Odds ratio(95% CI) n p-value
Odds ratio(95% CI) p-value
Find life stressful 0.770
No 1 637
A bit 1.0 (0.8 to 1.2) 1316
Quite 0.9 (0.7 to 1.2) 637
Very 0.9 (0.7 to 1.2) 297
Don’t know 0.5 (0.2 to 1.6) 19
Someone to care for them if they are ill 0.979
Definitely 1 1240
Probably 1.0 (0.8 to 1.2) 697
Probably not 1.0 (0.8 to 1.4) 280
Don’t know 0.9 (0.6 to 1.5) 92
Can take time off work for GP 0.627
Yes 1 1078
Yes but not easy 1.0 (0.8 to 1.3) 275
No 0.8 (0.6 to 1.3) 127
Not applicable/missing 1.1 (0.9 to 1.3) 1426
7b, Low burden
Travel to ED 0.554
Very difficult 1 610
Neither 0.9 (0.7 to 1.2) 269
Fairly easy 0.9 (0.7 to 1.1) 1172
Very easy 0.9 (0.7 to 1.1) 855
Opening hours a problem 0.084
Disagree/strongly disagree 1 1098
Neither 1.3 (1.0 to 1.6) 608
Strongly agree/agree 1.0 (0.8 to 1.3) 603
Prefer no appointments 0.005
Disagree/strongly disagree 1 685
Neither 1.2 (0.9 to 1.4) 799
Strongly agree/agree 1.4 (1.1 to 1.8) 825
Want convenient times 0.847
Disagree/strongly disagree 1 253
Neither 1.1 (0.7 to 1.4) 708
Strongly agree/agree 1.0 (0.7 to 1.3) 1348
continued
DOI: 10.3310/hsdr08150 Health Services and Delivery Research 2020 Vol. 8 No. 15
© Queen’s Printer and Controller of HMSO 2020. This work was produced by O’Cathain et al. under the terms of a commissioning contract issued by the Secretary of Statefor Health and Social Care. This issue may be freely reproduced for the purposes of private research and study and extracts (or indeed, the full report) may be included inprofessional journals provided that suitable acknowledgement is made and the reproduction is not associated with any form of advertising. Applications for commercialreproduction should be addressed to: NIHR Journals Library, National Institute for Health Research, Evaluation, Trials and Studies Coordinating Centre, Alpha House,University of Southampton Science Park, Southampton SO16 7NS, UK.
201

TABLE 24 Variables explaining tendency to attend ED for children in vignettes (continued )
Variable
Univariate Final multivariable model
Odds ratio(95% CI) n p-value
Odds ratio(95% CI) p-value
Willing to wait in waiting room < 0.001 0.029
Disagree/strongly disagree 1 361 1
Neither 0.7 (0.5 to 1.1) 194 0.8 (0.5 to 1.2)
Strongly agree/agree 1.4 (1.1 to 1.8) 2351 1.3 (0.96 to 1.7)
8, Compliance with family/friends
Check with family and friends for what to do 0.171
Not very likely 1 545
Not likely 0.9 (0.7 to 1.2) 746
Fairly likely 0.8 (0.6 to 1.0) 1061
Very likely 0.9 (0.7 to 1.1) 554
9, Views of services
Prefer ED for quick tests 0.001 0.003
Disagree/strongly disagree 1 1159 1
Neither 1.2 (1.0 to 1.5) 797 1.2 (0.99 to 1.5)
Strongly agree/agree 1.6 (1.2 to 2.0) 353 1.5 (1.2 to 2.0)
Missing, self-complete 0
Doctors know more at ED 0.118
Disagree/strongly disagree 1 850
Neither 1.2 (0.99 to 1.5) 1041
Strongly agree/agree 1.2 (0.96 to 1.6) 418
Missing, self-complete 0
No confidence in GP 0.847
Strongly disagree 1 538
Disagree 0.9 (0.7 to 1.1) 1008
Neither 0.9 (0.7 to 1.1) 446
Agree 0.9 (0.6 to 1.3) 165
Strongly agree 1.0 (0.6 to 1.6) 76
Don’t know 0.7 (0.4 to 1.5) 42
Missing 0.8 (0.4 to 1.6) 34
Missing, self-complete 0
10, Frustration with access to GP
Hard to get GP appointment 0.905
Disagree/strongly disagree 1 819
Neither 1.0 (0.7 to 1.3) 353
Strongly agree/agree 1.0 (0.9 to 1.2) 1137
Missing, self-complete 0
APPENDIX 9
NIHR Journals Library www.journalslibrary.nihr.ac.uk
202
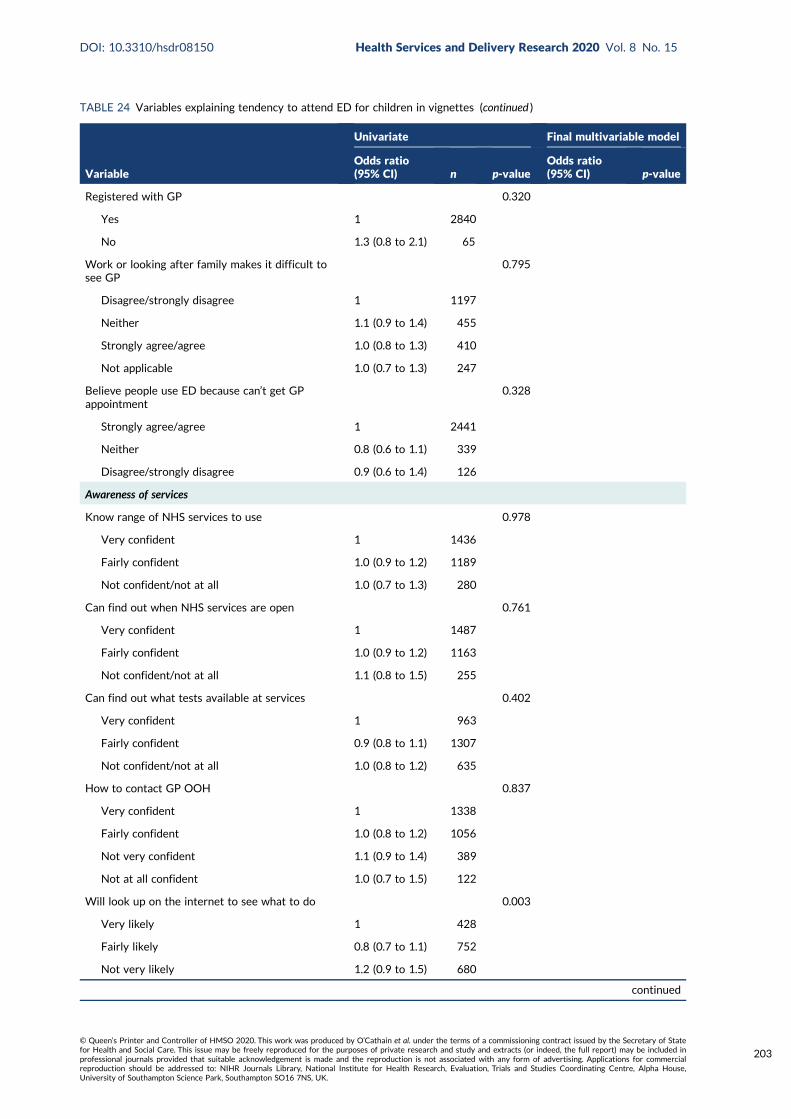
TABLE 24 Variables explaining tendency to attend ED for children in vignettes (continued )
Variable
Univariate Final multivariable model
Odds ratio(95% CI) n p-value
Odds ratio(95% CI) p-value
Registered with GP 0.320
Yes 1 2840
No 1.3 (0.8 to 2.1) 65
Work or looking after family makes it difficult tosee GP
0.795
Disagree/strongly disagree 1 1197
Neither 1.1 (0.9 to 1.4) 455
Strongly agree/agree 1.0 (0.8 to 1.3) 410
Not applicable 1.0 (0.7 to 1.3) 247
Believe people use ED because can’t get GPappointment
0.328
Strongly agree/agree 1 2441
Neither 0.8 (0.6 to 1.1) 339
Disagree/strongly disagree 0.9 (0.6 to 1.4) 126
Awareness of services
Know range of NHS services to use 0.978
Very confident 1 1436
Fairly confident 1.0 (0.9 to 1.2) 1189
Not confident/not at all 1.0 (0.7 to 1.3) 280
Can find out when NHS services are open 0.761
Very confident 1 1487
Fairly confident 1.0 (0.9 to 1.2) 1163
Not confident/not at all 1.1 (0.8 to 1.5) 255
Can find out what tests available at services 0.402
Very confident 1 963
Fairly confident 0.9 (0.8 to 1.1) 1307
Not confident/not at all 1.0 (0.8 to 1.2) 635
How to contact GP OOH 0.837
Very confident 1 1338
Fairly confident 1.0 (0.8 to 1.2) 1056
Not very confident 1.1 (0.9 to 1.4) 389
Not at all confident 1.0 (0.7 to 1.5) 122
Will look up on the internet to see what to do 0.003
Very likely 1 428
Fairly likely 0.8 (0.7 to 1.1) 752
Not very likely 1.2 (0.9 to 1.5) 680
continued
DOI: 10.3310/hsdr08150 Health Services and Delivery Research 2020 Vol. 8 No. 15
© Queen’s Printer and Controller of HMSO 2020. This work was produced by O’Cathain et al. under the terms of a commissioning contract issued by the Secretary of Statefor Health and Social Care. This issue may be freely reproduced for the purposes of private research and study and extracts (or indeed, the full report) may be included inprofessional journals provided that suitable acknowledgement is made and the reproduction is not associated with any form of advertising. Applications for commercialreproduction should be addressed to: NIHR Journals Library, National Institute for Health Research, Evaluation, Trials and Studies Coordinating Centre, Alpha House,University of Southampton Science Park, Southampton SO16 7NS, UK.
203

TABLE 24 Variables explaining tendency to attend ED for children in vignettes (continued )
Variable
Univariate Final multivariable model
Odds ratio(95% CI) n p-value
Odds ratio(95% CI) p-value
Not at all 1.1 (0.9 to 1.4) 1016
Missing 0.3 (0.1 to 0.9) 30
Will look up on the internet to decide whatproblem is
0.143
Very likely 1 667
Fairly likely 0.9 (0.7 to 1.1) 797
Not very likely 1.1 (0.8 to 1.4) 472
Not at all 1.1 (0.9 to 1.3) 940
Missing 0.4 (0.2 to 1.1) 30
Recursivity
If tests are done I was right to make contact 0.037
Disagree/strongly disagree 1 280
Neither 1.1 (0.8 to 1.5) 793
Strongly agree/agree 1.3 (0.99 to 1.8) 1236
Missing, self-complete 0
Health literacy
Lower health literacy compared with higher healthliteracy – understand information
0.9 (0.8 to 1.1) 2269 0.469
Lower health literacy compared with higher healthliteracy – ability to communicate
0.9 (0.8 to 1.1) 2269 0.332
Recent use of health care
Ambulance use 0.781
Never 1 1349
≥ 12 months 1.1 (0.9 to 1.2) 1108
< 12 months 1.1 (0.9 to 1.3) 448
Ambulance frequent user 0.429
< 3 times 1 2842
≥ 3 times in 12 months 0.8 (0.5 to 1.4) 64
ED use 0.027
Never 1 411
≥ 12 months 1.3 (1.0 to 1.6) 1478
6–12 months 1.3 (0.96 to 1.8) 366
3–6 months 1.3 (0.9 to 1.9) 234
< 3 months 1.6 (1.2 to 2.2) 416
ED frequent user 0.278
< 3 times 1 1959
≥ 3 times in 12 months 1.2 (0.9 to 1.7) 949
APPENDIX 9
NIHR Journals Library www.journalslibrary.nihr.ac.uk
204
TABLE 24 Variables explaining tendency to attend ED for children in vignettes (continued )
Variable
Univariate Final multivariable model
Odds ratio(95% CI) n p-value
Odds ratio(95% CI) p-value
Contacted GP 0.322
Never 1 65
≥ 12 months 1.7 (0.9 to 3.1) 454
6–12 months 1.5 (0.8 to 2.7) 484
3–6 months 1.7 (0.95 to 3.2) 518
< 3 months 1.6 (0.9 to 2.9) 1384
Attitudes towards overuse of health services
Too many use 999 0.126
Strongly agree/agree 1 2516
Neither 1.3 (1.0 to 1.6) 313
Disagree/strongly disagree 1.2 (0.8 to 2.0) 77
Too many use ED 0.038
Strongly agree/agree 1 2515
Neither 1.3 (1.0 to 1.7) 291
Disagree/strongly disagree 1.3 (0.9 to 2.0) 100
Too many use GP 0.890
Strongly agree/agree 1 2082
Neither 1.0 (0.9 to 1.3) 577
Disagree/strongly disagree 1.0 (0.7 to 1.3) 247
Reluctance to use ED 0.495
Strongly agree/agree 1 1348
Neither 1.1 (0.9 to 1.3) 734
Disagree/strongly disagree 1.1 (0.9 to 1.4) 824
OOH, out of hours.Bold text denotes 95% CIs that do not contain 1.
TABLE 25 Full model for child ED
Variables Significance Exp(B)
95% CI for Exp(B)
Lower Upper
Age of respondent(grouped) < 7 category > dv 0.000
Age of respondent(grouped) < 7 category > dv(1) 0.905 0.970 0.590 1.595
Age of respondent(grouped) < 7 category > dv(2) 0.641 1.119 0.697 1.796
Age of respondent(grouped) < 7 category > dv(3) 0.028 1.671 1.056 2.645
Age of respondent(grouped) < 7 category > dv(4) 0.002 2.038 1.291 3.218
Age of respondent(grouped) < 7 category > dv(5) 0.008 1.873 1.179 2.975
continued
DOI: 10.3310/hsdr08150 Health Services and Delivery Research 2020 Vol. 8 No. 15
© Queen’s Printer and Controller of HMSO 2020. This work was produced by O’Cathain et al. under the terms of a commissioning contract issued by the Secretary of Statefor Health and Social Care. This issue may be freely reproduced for the purposes of private research and study and extracts (or indeed, the full report) may be included inprofessional journals provided that suitable acknowledgement is made and the reproduction is not associated with any form of advertising. Applications for commercialreproduction should be addressed to: NIHR Journals Library, National Institute for Health Research, Evaluation, Trials and Studies Coordinating Centre, Alpha House,University of Southampton Science Park, Southampton SO16 7NS, UK.
205

TABLE 25 Full model for child ED (continued )
Variables Significance Exp(B)
95% CI for Exp(B)
Lower Upper
Age of respondent(grouped) < 7 category > dv(6) 0.378 1.251 0.760 2.060
Sex of respondent(1) 0.019 0.801 0.666 0.964
DV To which of these racial groups do you consider you belong?(compressed)(1)
0.003 1.656 1.181 2.321
2007 version: Government office region 0.001
2007 version: Government office region(1) 0.299 1.164 0.874 1.549
2007 version: Government office region(2) 0.782 0.962 0.729 1.268
2007 version: Government office region(3) 0.293 0.804 0.536 1.207
2007 version: Government office region(4) 0.006 1.883 1.195 2.968
2007 version: Government office region(5) 0.006 1.684 1.163 2.438
Number of Respondents children in HH aged 0–4yrs – dv(1) 0.816 0.957 0.661 1.386
When did you last see or speak to an accident and emergencydepartment (A&E) (for yourself or someone else)?
0.232
When did you last see or speak to an accident and emergencydepartment (A&E) (for yourself or someone else)?(1)
0.533 0.881 0.592 1.312
When did you last see or speak to an accident and emergencydepartment (A&E) (for yourself or someone else)?(2)
0.466 0.879 0.622 1.242
When did you last see or speak to an accident and emergencydepartment (A&E) (for yourself or someone else)?(3)
0.180 0.831 0.634 1.089
When did you last see or speak to an accident and emergencydepartment (A&E) (for yourself or someone else)?(4)
0.020 0.654 0.457 0.937
For unexpected non-life-threatening health problem, how likely is it youwould . . . look on the internet to decide what to do
0.047
For unexpected non-life-threatening health problem, how likely is it youwould . . . look on the internet to decide what to do(1)
0.118 0.781 0.574 1.064
For unexpected non-life-threatening health problem, how likely is it youwould . . . look on the internet to decide what to do(2)
0.599 1.086 0.799 1.474
For unexpected non-life-threatening health problem, how likely is it youwould . . . look on the internet to decide what to do(3)
0.810 0.964 0.713 1.303
For unexpected non-life-threatening health problem, how likely is it youwould . . . look on the internet to decide what to do(4)
0.068 0.234 0.049 1.115
Have you ever had a health problem where you did not go to see adoctor at first and it turned out to be serious?(1)
0.273 0.888 0.719 1.098
HPrbDr13 0.154
HPrbDr13(1) 0.091 1.194 0.972 1.467
HPrbDr13(2) 0.830 0.960 0.658 1.399
For unexpected non-life-threatening pain, how likely is it you would . . .take medication to stop the pain
0.182
For unexpected non-life-threatening pain, how likely is it you would . . .take medication to stop the pain(1)
0.281 0.893 0.728 1.097
APPENDIX 9
NIHR Journals Library www.journalslibrary.nihr.ac.uk
206
TABLE 25 Full model for child ED (continued )
Variables Significance Exp(B)
95% CI for Exp(B)
Lower Upper
For unexpected non-life-threatening g pain, how likely is it you would. . . take medication to stop the pain(2)
0.016 0.689 0.509 0.934
For unexpected non-life-threatening pain, how likely is it you would . . .take medication to stop the pain(3)
0.447 0.836 0.528 1.325
For unexpected non-life-threatening pain, how likely is it you would . . .take medication to stop the pain(4)
0.785 1.104 0.542 2.246
For unexpected non-life-threatening pain, how likely is it you would . . .worry that it is a sign of something serious
0.563
For unexpected non-life-threatening pain, how likely is it you would . . .worry that it is a sign of something serious(1)
0.178 1.231 0.910 1.665
For unexpected non-life-threatening pain, how likely is it you would . . .worry that it is a sign of something serious(2)
0.248 1.190 0.886 1.599
For unexpected non-life-threatening pain, how likely is it you would . . .worry that it is a sign of something serious(3)
0.321 1.209 0.831 1.761
For unexpected non-life-threatening pain, how likely is it you would . . .worry that it is a sign of something serious(4)
0.132 1.522 0.881 2.629
I prefer NHS services where I don’t need to make an appointment SC:B, C, D
0.348
I prefer NHS services where I don’t need to make an appointment SC:B, C, D(1)
0.312 0.891 0.713 1.114
I prefer NHS services where I don’t need to make an appointment SC:B, C, D(2)
0.164 0.845 0.666 1.071
For unexpected non-life-threatening health problem . . . I’m willing towait a few hours in a waiting room if it means I can be seen that day
0.096
For unexpected non-life-threatening health problem . . . I’m willing towait a few hours in a waiting room if it means I can be seen that day(1)
0.055 0.660 0.432 1.010
For unexpected non-life-threatening health problem... I’m willing to waita few hours in a waiting room if it means I can be seen that day(2)
0.233 0.837 0.625 1.121
I prefer A&E to a GP because I can get tests done quickly SC: B, C, D 0.019
I prefer A&E to a GP because I can get tests done quickly SC: B, C, D(1) 0.210 0.835 0.631 1.106
I prefer A&E to a GP because I can get tests done quickly SC: B, C, D(2) 0.008 0.690 0.525 0.907
If a service does tests on me, it shows I was right to go to that serviceSC: B, C, D
0.438
If a service does tests on me, it shows I was right to go to that serviceSC: B, C, D(1)
0.199 0.872 0.708 1.075
If a service does tests on me, it shows I was right to go to that serviceSC: B, C, D(2)
0.730 0.947 0.695 1.290
I think too many people use A&E when they do not need to 0.047
I think too many people use A&E when they do not need to(1) 0.023 1.433 1.052 1.952
I think too many people use A&E when they do not need to(2) 0.257 1.358 0.800 2.306
Constant 0.090 0.561
DOI: 10.3310/hsdr08150 Health Services and Delivery Research 2020 Vol. 8 No. 15
© Queen’s Printer and Controller of HMSO 2020. This work was produced by O’Cathain et al. under the terms of a commissioning contract issued by the Secretary of Statefor Health and Social Care. This issue may be freely reproduced for the purposes of private research and study and extracts (or indeed, the full report) may be included inprofessional journals provided that suitable acknowledgement is made and the reproduction is not associated with any form of advertising. Applications for commercialreproduction should be addressed to: NIHR Journals Library, National Institute for Health Research, Evaluation, Trials and Studies Coordinating Centre, Alpha House,University of Southampton Science Park, Southampton SO16 7NS, UK.
207

TABLE 26 Variables explaining tendency to attend ED for all in vignettesa
Variable
Univariate Final multivariable model
Odds ratio(95% CI) n p-value
Odds ratio(95% CI) p-value
Sociodemographic characteristics
Age (years) 0.001 < 0.001
18–24 1 169 1
25–34 0.8 (0.6 to 1.2) 384 0.8 (0.5 to 1.2)
35–44 0.8 (0.6 to 1.2) 467 0.9 (0.6 to 1.4)
45–54 1.2 (0.8 to 1.7) 469 1.3 (0.9 to 2.0)
55–64 1.3 (0.9 to 1.8) 508 1.4 (0.9 to 2.1)
65–74 1.3 (0.9 to 1.8) 499 1.4 (0.9 to 2.1)
≥ 75 0.9 (0.6 to 1.3) 405 1.0 (0.6 to 1.5)
Sex < 0.001 0.001
Female 1 1649 1
Male 1.4 (1.2 to 1.6) 1257 1.4 (1.1 to 1.6)
Ethnicity 0.001 0.005
White 1 2572 1
BAME 1.5 (1.2 to 1.8) 334 1.5 (1.1 to 2.0)
Social class 0.027
I 1 214
II 1.2 (0.8 to 1.6) 1039
III non-manual 1.2 (0.9 to 1.6) 569
III manual 1.6 (1.1 to 2.2) 416
IV and V 1.5 (1.1 to 2.1) 524
Armed forces 1.3 (0.7 to 2.4) 52
Deprivation 0.183
5 (affluent)
4
3
2
1 (most deprived)
Rurality 0.201
Rural
Urban
Region 0.001 < 0.001
North England 1 474 1
Midlands 0.9 (0.7 to 1.2) 794 0.9 (0.7 to 1.2)
South England 0.8 (0.7 to 1.0) 957 0.8 (0.6 to 1.0)
APPENDIX 9
NIHR Journals Library www.journalslibrary.nihr.ac.uk
208

TABLE 26 Variables explaining tendency to attend ED for all in vignettesa (continued )
Variable
Univariate Final multivariable model
Odds ratio(95% CI) n p-value
Odds ratio(95% CI) p-value
London 1.0 (0.7 to 1.3) 285 0.8 (0.5 to 1.1)
Wales 1.6 (1.1 to 2.3) 132 1.6 (1.0 to 2.5)
Scotland 1.4 (1.0 to 1.9) 264 1.4 (0.95 to 1.9)
In household with children aged < 5 years old 0.041
No 1 2591
Yes 0.8 (0.6 to 0.99) 300
Resources available
Car ownership 0.424
≥ 1 cars
No car
Missing
Personal access to the internet 0.706
Yes
No
Health
General health 0.489
Excellent
Very good
Good
Fair
Poor
Can’t choose
Missing/not included
Long-term limiting illness 0.075
None
Non-limiting
Limiting
Don’t know
Programme theories
1, Risk: uncertainty causes anxiety
Worry pain is a sign of something serious 0.071
Not likely at all
Not likely
Fairly likely
Very likely
It depends
continued
DOI: 10.3310/hsdr08150 Health Services and Delivery Research 2020 Vol. 8 No. 15
© Queen’s Printer and Controller of HMSO 2020. This work was produced by O’Cathain et al. under the terms of a commissioning contract issued by the Secretary of Statefor Health and Social Care. This issue may be freely reproduced for the purposes of private research and study and extracts (or indeed, the full report) may be included inprofessional journals provided that suitable acknowledgement is made and the reproduction is not associated with any form of advertising. Applications for commercialreproduction should be addressed to: NIHR Journals Library, National Institute for Health Research, Evaluation, Trials and Studies Coordinating Centre, Alpha House,University of Southampton Science Park, Southampton SO16 7NS, UK.
209

TABLE 26 Variables explaining tendency to attend ED for all in vignettesa (continued )
Variable
Univariate Final multivariable model
Odds ratio(95% CI) n p-value
Odds ratio(95% CI) p-value
Confident in deciding to see a doctor or self-care 0.316
Very confident
Fairly
Not very
Never had problem
2, Risk: previous traumatic event
Had problem, did not see doctor and was serious 0.170
No
Yes
3, Risk: responsibility for others
4, Speed: need to get back to normal
Sleep < 0.001
Do not see doctor 1 2010
See doctor if sleep loss 1.5 (1.3 to 1.8) 634
See doctor if any loss 1.2 (0.9 to 1.5) 262
Work 0.002 0.04
Do not see doctor 1 935 1
See doctor if work loss 1.3 (1.1 to 1.6) 1709 1.3 (1.0 to 1.5)
See doctor if any loss 1.3 (1.0 to 1.7) 262 1.1 (0.8 to 1.6)
5, Speed: need to seek pain relief
Likely to take medication 0.050
Very likely 1 1081
Fairly 0.8 (0.7 to 0.95) 1257
Not very 0.8 (0.6 to 0.97) 376
Not at all 0.8 (0.6 to 1.1) 135
Depends 0.7 (0.4 to 1.2) 57
6, Speed: waited long enough
7a, Stressful lives
Overwhelmed when have health problem 0.263
Strongly disagree
Disagree
Neither
Strongly agree/agree
Never had problem
APPENDIX 9
NIHR Journals Library www.journalslibrary.nihr.ac.uk
210

TABLE 26 Variables explaining tendency to attend ED for all in vignettesa (continued )
Variable
Univariate Final multivariable model
Odds ratio(95% CI) n p-value
Odds ratio(95% CI) p-value
Find life stressful 0.286
No
A bit
Quite
Very
Don’t know
Someone to care for them if they are ill 0.374
Definitely
Probably
Probably not
Don’t know
Can take time off work for GP 0.281
Yes
Yes but not easy
No
Not applicable/missing
7b, Low burden
Travel to ED 0.521
Very difficult
Neither
Fairly easy
Very easy
Opening hours a problem 0.143
Disagree/strongly disagree
Neither
Strongly agree/agree
Prefer no appointments 0.005
Disagree/strongly disagree 1 685
Neither 1.2 (0.9 to 1.4) 799
Strongly agree/agree 1.4 (1.1 to 1.7) 825
Want convenient times 0.875
Disagree/strongly disagree
Neither
Strongly agree/agree
continued
DOI: 10.3310/hsdr08150 Health Services and Delivery Research 2020 Vol. 8 No. 15
© Queen’s Printer and Controller of HMSO 2020. This work was produced by O’Cathain et al. under the terms of a commissioning contract issued by the Secretary of Statefor Health and Social Care. This issue may be freely reproduced for the purposes of private research and study and extracts (or indeed, the full report) may be included inprofessional journals provided that suitable acknowledgement is made and the reproduction is not associated with any form of advertising. Applications for commercialreproduction should be addressed to: NIHR Journals Library, National Institute for Health Research, Evaluation, Trials and Studies Coordinating Centre, Alpha House,University of Southampton Science Park, Southampton SO16 7NS, UK.
211

TABLE 26 Variables explaining tendency to attend ED for all in vignettesa (continued )
Variable
Univariate Final multivariable model
Odds ratio(95% CI) n p-value
Odds ratio(95% CI) p-value
Willing to wait in waiting room < 0.001 0.012
Disagree/strongly disagree 1 361 1
Neither 0.7 (0.5 to 1.0) 194 0.7 (0.4 to 1.1)
Strongly agree/agree 1.3 (1.1 to 1.7) 2351 1.2 (0.9 to 1.5)
8, Compliance with family/friends
Check with family and friends for what to do 0.112
Not very likely
Not likely
Fairly likely
Very likely
9, Views of services
Prefer ED for quick tests < 0.001 < 0.001
Disagree/strongly disagree 1 1159 1
Neither 1.3 (1.1 to 1.6) 797 1.3 (1.0 to 1.5)
Strongly agree/agree 1.8 (1.4 to 2.3) 353 1.7 (1.4 to 2.2)
Missing, self-complete 0
Doctors know more at ED 0.029
Disagree/strongly disagree 1 850
Neither 1.2 (1.0 to 1.5) 1041
Strongly agree/agree 1.3 (1.0 to 1.7) 418
Missing, self-complete 0
No confidence in GP 0.925
Strongly disagree
Disagree
Neither
Agree
Strongly agree
Don’t know
Missing
Missing, self-complete
10, Frustration with access to GP
Hard to get GP appointment 0.994
Disagree/strongly disagree
Neither
APPENDIX 9
NIHR Journals Library www.journalslibrary.nihr.ac.uk
212
TABLE 26 Variables explaining tendency to attend ED for all in vignettesa (continued )
Variable
Univariate Final multivariable model
Odds ratio(95% CI) n p-value
Odds ratio(95% CI) p-value
Strongly agree/agree
Missing, self-complete 0
Registered with GP 0.958
Yes
No
Work or looking after family makes it difficult tosee GP
0.246
Disagree/strongly disagree
Neither
Strongly agree/agree
Not applicable
Believe people use ED because can’t get GPappointment
0.710
Strongly agree/agree
Neither
Disagree/strongly disagree
Awareness of services 0.887
Know range of NHS services to use
Very confident
Fairly confident
Not confident/not at all
Can find out when NHS services are open 0.825
Very confident
Fairly confident
Not confident/not at all
Can find out what tests available at services 0.483
Very confident
Fairly confident
Not confident/not at all
How to contact GP OOH 0.546
Very
Fairly
Not very confident
Not at all
continued
DOI: 10.3310/hsdr08150 Health Services and Delivery Research 2020 Vol. 8 No. 15
© Queen’s Printer and Controller of HMSO 2020. This work was produced by O’Cathain et al. under the terms of a commissioning contract issued by the Secretary of Statefor Health and Social Care. This issue may be freely reproduced for the purposes of private research and study and extracts (or indeed, the full report) may be included inprofessional journals provided that suitable acknowledgement is made and the reproduction is not associated with any form of advertising. Applications for commercialreproduction should be addressed to: NIHR Journals Library, National Institute for Health Research, Evaluation, Trials and Studies Coordinating Centre, Alpha House,University of Southampton Science Park, Southampton SO16 7NS, UK.
213

TABLE 26 Variables explaining tendency to attend ED for all in vignettesa (continued )
Variable
Univariate Final multivariable model
Odds ratio(95% CI) n p-value
Odds ratio(95% CI) p-value
Will look up on the internet to see what to do 0.001
Very likely 1 428
Fairly likely 0.8 (0.7 to 1.1) 752
Not very likely 1.1 (0.9 to 1.5) 680
Not at all 1.0 (0.8 to 1.3) 1016
Missing 0.3 (0.1 to 0.9) 30
Will look up on the internet to decide whatproblem is
0.035
Very likely 1 667
Fairly likely 0.8 (0.7 to 1.0) 797
Not very likely 1.1 (0.8 to 1.3) 472
Not at all 1.0 (0.8 to 1.2) 940
Missing 0.4 (0.2 to 0.9) 30
Recursivity
If tests are done I was right to make contact 0.002
Disagree/strongly disagree 1 280
Neither 1.1 (0.9 to 1.5) 793
Strongly agree/agree 1.5 (1.1 to 1.9) 1236
Missing, self-complete 0
Health literacy
Lower health literacy compared with higher healthliteracy – understand information
0.995
Lower health literacy compared with higher healthliteracy – ability to communicate
0.291
Recent use of health care
Ambulance use 0.473
Never
≥ 12 months
< 12 months
Ambulance frequent user 0.755
< 3 times
≥ 3 times in 12 months
ED use 0.009
Never 1 411
≥ 12 months 1.2 (0.97 to 1.5) 416
APPENDIX 9
NIHR Journals Library www.journalslibrary.nihr.ac.uk
214

TABLE 26 Variables explaining tendency to attend ED for all in vignettesa (continued )
Variable
Univariate Final multivariable model
Odds ratio(95% CI) n p-value
Odds ratio(95% CI) p-value
6–12 months 1.3 (0.99 to 1.8) 234
3–6 months 1.6 (1.2 to 2.3) 366
< 3 months 1.5 (1.2 to 2.0) 1478
ED frequent user 0.001
< 3 times 1 2738
≥ 3 times in 12 months 1.7 (1.3 to 2.4) 167
Contacted GP 0.345
Never
≥ 12 months
6–12 months
3–6 months
< 3 months
Attitudes towards overuse of health services
Too many use 999 0.039
Strongly agree/agree 1 2516
Neither 1.3 (1.1 to 1.7) 313
Disagree/strongly disagree 1.2 (0.8 to 1.9) 77
Too many use ED 0.003 0.003
Strongly agree/agree 1 2515 1
Neither 1.4 (1.1 to 1.8) 291 1.4 (1.0 to 1.9)
Disagree/strongly disagree 1.6 (1.1 to 2.5) 100 2.0 (1.2 to 3.4)
Too many use GP 0.357
Strongly agree/agree
Neither
Disagree/strongly disagree
Reluctance to use ED 0.236
Strongly agree/agree
Neither
Disagree/strongly disagree
OOH, out of hours.a Completed only where p < 0.05.Bold text denotes 95% CIs that do not contain 1.
DOI: 10.3310/hsdr08150 Health Services and Delivery Research 2020 Vol. 8 No. 15
© Queen’s Printer and Controller of HMSO 2020. This work was produced by O’Cathain et al. under the terms of a commissioning contract issued by the Secretary of Statefor Health and Social Care. This issue may be freely reproduced for the purposes of private research and study and extracts (or indeed, the full report) may be included inprofessional journals provided that suitable acknowledgement is made and the reproduction is not associated with any form of advertising. Applications for commercialreproduction should be addressed to: NIHR Journals Library, National Institute for Health Research, Evaluation, Trials and Studies Coordinating Centre, Alpha House,University of Southampton Science Park, Southampton SO16 7NS, UK.
215

TABLE 27 Full model for ED all
Variables Significance Exp(B)
95% CI for Exp(B)
Lower Upper
Age of respondent(grouped) < 7 category > dv 0.002
Age of respondent(grouped) < 7 category > dv(1) 0.387 0.802 0.486 1.322
Age of respondent(grouped) < 7 category > dv(2) 0.658 0.897 0.554 1.452
Age of respondent(grouped) < 7 category > dv(3) 0.172 1.389 0.867 2.224
Age of respondent(grouped) < 7 category > dv(4) 0.155 1.407 0.879 2.252
Age of respondent(grouped) < 7 category > dv(5) 0.169 1.395 0.868 2.242
Age of respondent(grouped) < 7 category > dv(6) 0.877 0.961 0.580 1.593
Sex of respondent(1) 0.003 0.754 0.625 0.910
Respondent: social class [pre-SOC2000] best estimate dv 0.430
Respondent: social class [pre-SOC2000] best estimate dv(1) 0.676 1.081 0.752 1.554
Respondent: social class [pre-SOC2000] best estimate dv(2) 0.369 1.196 0.809 1.769
Respondent: social class [pre-SOC2000] best estimate dv(3) 0.169 1.337 0.884 2.021
Respondent: social class [pre-SOC2000] best estimate dv(4) 0.136 1.357 0.909 2.027
Respondent: social class [pre-SOC2000] best estimate dv(5) 0.884 1.062 0.471 2.395
DV To which of these racial groups do you consider you belong?(compressed)(1)
0.014 1.536 1.091 2.161
2007 version: Government office region 0.004
2007 version: Government office region(1) 0.515 0.913 0.694 1.201
2007 version: Government office region(2) 0.127 0.814 0.625 1.060
2007 version: Government office region(3) 0.809 0.954 0.652 1.397
2007 version: Government office region(4) 0.046 1.586 1.009 2.493
2007 version: Government office region(5) 0.068 1.411 0.975 2.041
Number of Respondents children in HH aged 0–4yrs – dv(1) 0.756 0.946 0.666 1.343
When did you last see or speak to an accident and emergencydepartment (A&E) (for yourself or someone else)?
0.323
When did you last see or speak to an accident and emergencydepartment (A&E) (for yourself or someone else)?(1)
0.720 1.073 0.729 1.581
When did you last see or speak to an accident and emergencydepartment (A&E) (for yourself or someone else)?(2)
0.591 0.912 0.651 1.277
When did you last see or speak to an accident and emergencydepartment (A&E) (for yourself or someone else)?(3)
0.381 0.888 0.682 1.158
When did you last see or speak to an accident and emergencydepartment (A&E) (for yourself or someone else)?(4)
0.071 0.726 0.513 1.028
For unexpected non-life-threatening health problem, how likely is it youwould . . . look on the internet to decide what the problem might be
0.844
For unexpected non-life-threatening health problem, how likely is it youwould . . . look on the internet to decide what the problem might be(1)
0.400 0.871 0.630 1.202
For unexpected non-life-threatening health problem, how likely is it youwould . . . look on the internet to decide what the problem might be(2)
0.375 0.840 0.570 1.236
For unexpected non-life-threatening health problem, how likely is it youwould . . . look on the internet to decide what the problem might be(3)
0.561 0.867 0.536 1.403
APPENDIX 9
NIHR Journals Library www.journalslibrary.nihr.ac.uk
216

TABLE 27 Full model for ED all (continued )
Variables Significance Exp(B)
95% CI for Exp(B)
Lower Upper
For unexpected non-life-threatening health problem, how likely is it youwould . . . look on the internet to decide what the problem might be(4)
0.600 1.703 0.233 12.435
For unexpected non-life-threatening health problem, how likely is it youwould . . . look on the internet to decide what to do
0.138
For unexpected non-life-threatening health problem, how likely is it youwould . . . look on the internet to decide what to do(1)
0.726 0.937 0.649 1.351
For unexpected non-life-threatening health problem, how likely is it youwould . . . look on the internet to decide what to do(2)
0.198 1.298 0.873 1.929
For unexpected non-life-threatening health problem, how likely is it youwould . . . look on the internet to decide what to do(3)
0.622 1.137 0.683 1.892
For unexpected non-life-threatening health problem, how likely is it youwould . . . look on the internet to decide what to do(4)
0.199 0.251 0.030 2.072
HPrbDr13 0.080
HPrbDr13(1) 0.028 1.250 1.024 1.526
HPrbDr13(2) 0.702 1.074 0.745 1.549
For unexpected non-life-threatening pain, how likely is it you would . . .take medication to stop the pain
0.538
For unexpected non-life-threatening pain, how likely is it you would . . .take medication to stop the pain(1)
0.154 0.865 0.708 1.056
For unexpected non-life-threatening pain, how likely is it you would . . .take medication to stop the pain(2)
0.180 0.823 0.618 1.094
For unexpected non-life-threatening pain, how likely is it you would . . .take medication to stop the pain(3)
0.425 0.837 0.542 1.295
For unexpected non-life-threatening pain, how likely is it you would . . .take medication to stop the pain(4)
0.884 1.052 0.535 2.065
I prefer NHS services where I don’t need to make an appointment SC:B, C, D
0.560
I prefer NHS services where I don’t need to make an appointment SC:B, C, D(1)
0.420 0.914 0.734 1.138
I prefer NHS services where I don’t need to make an appointment SC:B, C, D(2)
0.314 0.888 0.705 1.119
For unexpected non-life threatening health problem . . . I’m willing towait a few hours in a waiting room if it means I can be seen that day
0.061
For unexpected non-life threatening health problem . . . I’m willing towait a few hours in a waiting room if it means I can be seen that day(1)
0.021 0.615 0.406 0.930
For unexpected non-life threatening health problem . . . I’m willing towait a few hours in a waiting room if it means I can be seen that day(2)
0.447 0.899 0.683 1.183
I think doctors at A&E know more than GPs SC: B, C, D 0.791
I think doctors at A&E know more than GPs SC: B, C, D(1) 0.590 1.075 0.827 1.397
I think doctors at A&E know more than GPs SC: B, C, D(2) 0.499 1.102 0.832 1.458
I prefer A&E to a GP because I can get tests done quickly SC: B, C, D 0.002
I prefer A&E to a GP because I can get tests done quickly SC: B, C, D(1) 0.048 0.744 0.556 0.997
I prefer A&E to a GP because I can get tests done quickly SC: B, C, D(2) 0.000 0.594 0.444 0.795
continued
DOI: 10.3310/hsdr08150 Health Services and Delivery Research 2020 Vol. 8 No. 15
© Queen’s Printer and Controller of HMSO 2020. This work was produced by O’Cathain et al. under the terms of a commissioning contract issued by the Secretary of Statefor Health and Social Care. This issue may be freely reproduced for the purposes of private research and study and extracts (or indeed, the full report) may be included inprofessional journals provided that suitable acknowledgement is made and the reproduction is not associated with any form of advertising. Applications for commercialreproduction should be addressed to: NIHR Journals Library, National Institute for Health Research, Evaluation, Trials and Studies Coordinating Centre, Alpha House,University of Southampton Science Park, Southampton SO16 7NS, UK.
217

TABLE 27 Full model for ED all (continued )
Variables Significance Exp(B)
95% CI for Exp(B)
Lower Upper
If a service does tests on me, it shows I was right to go to that serviceSC: B, C, D
0.210
If a service does tests on me, it shows I was right to go to that serviceSC: B, C, D(1)
0.103 0.844 0.689 1.035
If a service does tests on me, it shows I was right to go to that serviceSC: B, C, D(2)
0.254 0.839 0.621 1.134
I think too many people call 999 for an ambulance when they do notneed to
0.121
I think too many people call 999 for an ambulance when they do notneed to(1)
0.048 1.407 1.003 1.974
I think too many people call 999 for an ambulance when they do notneed to(2)
0.774 0.915 0.498 1.680
I think too many people use A&E when they do not need to 0.057
I think too many people use A&E when they do not need to(1) 0.164 1.277 0.905 1.802
I think too many people use A&E when they do not need to(2) 0.033 1.865 1.050 3.312
Constant 0.929 1.033
TABLE 28 Variables explaining tendency to attend GP for two adult vignettesa
Variables
Univariate Final multivariable model
Odds ratio(95% CI) n p-value
Odds ratio(95% CI) p-value
Sociodemographic characteristics
Age (years) < 0.001 < 0.001
18–24 1 169 1
25–34 1.0 (0.7 to 1.5) 384 1.0 (0.6 to 1.5)
35–44 1.0 (0.7 to 1.5) 467 0.9 (0.6 to 1.4)
45–54 0.9 (0.6 to 1.3) 469 0.8 (0.5 to 1.3)
55–64 1.1 (0.8 to 1.7) 508 1.3 (0.8 to 2.0)
65–74 1.5 (1.0 to 2.1) 499 1.3 (0.8 to 2.0)
≥ 75 1.9 (1.3 to 2.8) 405 1.8 (1.1 to 2.9)
Sex 0.09
Female
Male
Ethnicity < 0.001 < 0.001
White 1 2572 1
BAME 1.6 (1.3 to 2.1) 334 2.1 (1.5 to 2.9)
APPENDIX 9
NIHR Journals Library www.journalslibrary.nihr.ac.uk
218

TABLE 28 Variables explaining tendency to attend GP for two adult vignettesa (continued )
Variables
Univariate Final multivariable model
Odds ratio(95% CI) n p-value
Odds ratio(95% CI) p-value
Social class 0.302
I
II
III non-manual
III manual
IV and V
Armed forces
Deprivation 0.571
5 (affluent)
4
3
2
1 (most deprived)
Rurality 0.784
Rural
Urban
Region 0.010 0.026
North England 1 474 1
Midlands 1.1 (0.8 to 1.4) 794 1.1 (0.8 to 1.4)
South England 1.3 (1.0 to 1.6) 957 1.4 (1.0 to 1.8)
London 1.5 (1.1 to 1.0) 285 1.3 (0.9 to 1.9)
Wales 1.5 (1.0 to 2.3) 132 1.7 (1.0 to 2.7)
Scotland 1.5 (1.1 to 2.1) 264 1.7 (1.1 to 2.4)
In household with children aged < 5 years old 0.341
No
Yes
Resources available
Car ownership 0.010
≥ 1 cars 1 1478
No car 1.4 (1.1 to 1.8) 428
Missing 1.1 (0.9 to 1.3) 1000
Personal access to the internet < 0.001
Yes 1 2542
No 1.7 (1.3 to 2.1) 364
continued
DOI: 10.3310/hsdr08150 Health Services and Delivery Research 2020 Vol. 8 No. 15
© Queen’s Printer and Controller of HMSO 2020. This work was produced by O’Cathain et al. under the terms of a commissioning contract issued by the Secretary of Statefor Health and Social Care. This issue may be freely reproduced for the purposes of private research and study and extracts (or indeed, the full report) may be included inprofessional journals provided that suitable acknowledgement is made and the reproduction is not associated with any form of advertising. Applications for commercialreproduction should be addressed to: NIHR Journals Library, National Institute for Health Research, Evaluation, Trials and Studies Coordinating Centre, Alpha House,University of Southampton Science Park, Southampton SO16 7NS, UK.
219
TABLE 28 Variables explaining tendency to attend GP for two adult vignettesa (continued )
Variables
Univariate Final multivariable model
Odds ratio(95% CI) n p-value
Odds ratio(95% CI) p-value
Health
General health 0.003
Excellent 1 223
Very good 1.0 (0.7 to 1.4) 725
Good 1.3 (0.9 to 1.8) 799
Fair 1.4 (1.0 to 2.0) 360
Poor 1.8 (1.2 to 2.8) 163
Can’t choose 2.4 (1.2 to 4.7) 39
Missing/not included 1 597
Long-term limiting illness 0.032
None 1 1766
Non-limiting 1.0 (0.8 to 1.2) 586
Limiting 1.3 (1.1 to 1.6) 541
Don’t know 1.3 (0.4 to 4.1) 13
Programme theories
1, Risk: uncertainty causes anxiety
Worry pain is a sign of something serious < 0.001 < 0.001
Not likely at all 1 358 1
Not likely 1.4 (1.0 to 1.8) 1138 1.3 (0.9 to 1.8)
Fairly likely 1.9 (1.5 to 2.6) 876 1.8 (1.3 to 2.5)
Very likely 2.8 (2.1 to 3.9) 415 2.0 (1.4 to 3.0)
It depends 1.2 (0.8 to 2.0) 119 1.2 (0.6 to 2.1)
Confident in deciding to see a doctor or self-care 0.029
Very confident 1 993
Fairly 1.2 (1.0 to 1.4) 1130
Not very 1.2 (0.8 to 1.9) 89
Never had problem 1.8 (1.2 to 2.8) 97
2, Risk: previous traumatic event
Had problem, did not see doctor and was serious 0.767
No
Yes
3, Risk: responsibility for others
4, Speed: need to get back to normal
Sleep < 0.001
Do not see doctor 1 2010
See doctor if sleep loss 1.7 (1.4 to 2.0) 634
See doctor if any loss 2.2 (1.7 to 2.8) 262
APPENDIX 9
NIHR Journals Library www.journalslibrary.nihr.ac.uk
220
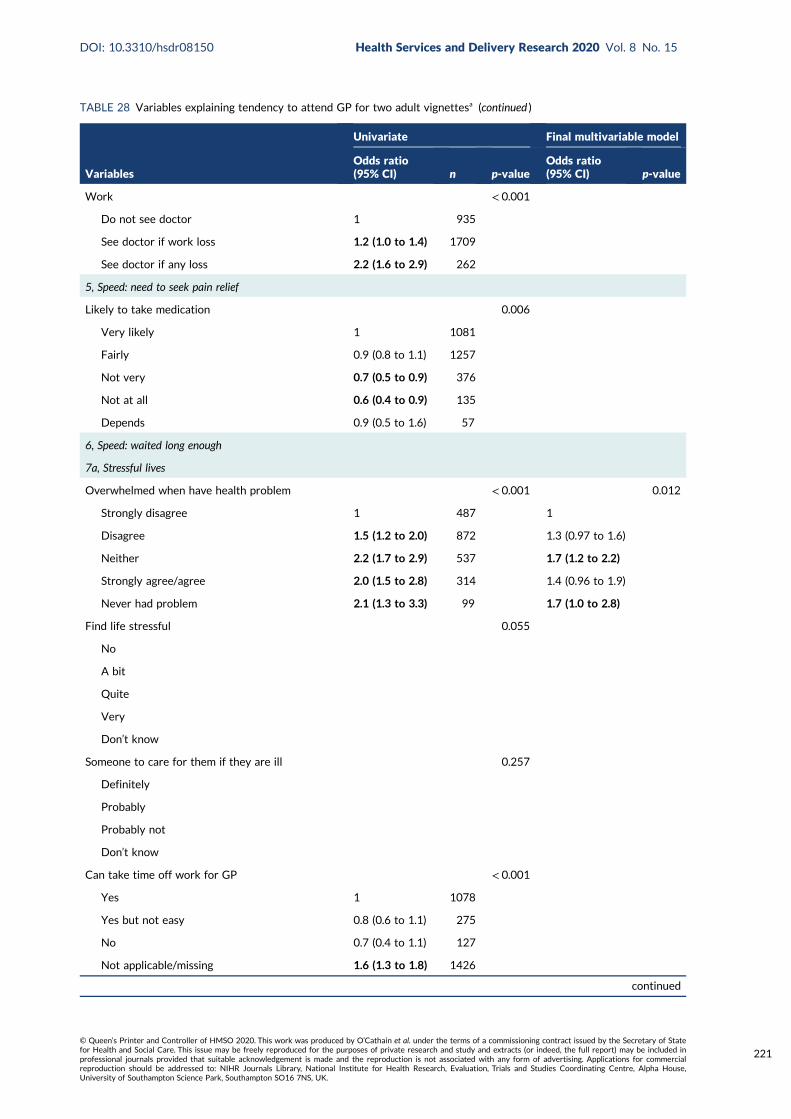
TABLE 28 Variables explaining tendency to attend GP for two adult vignettesa (continued )
Variables
Univariate Final multivariable model
Odds ratio(95% CI) n p-value
Odds ratio(95% CI) p-value
Work < 0.001
Do not see doctor 1 935
See doctor if work loss 1.2 (1.0 to 1.4) 1709
See doctor if any loss 2.2 (1.6 to 2.9) 262
5, Speed: need to seek pain relief
Likely to take medication 0.006
Very likely 1 1081
Fairly 0.9 (0.8 to 1.1) 1257
Not very 0.7 (0.5 to 0.9) 376
Not at all 0.6 (0.4 to 0.9) 135
Depends 0.9 (0.5 to 1.6) 57
6, Speed: waited long enough
7a, Stressful lives
Overwhelmed when have health problem < 0.001 0.012
Strongly disagree 1 487 1
Disagree 1.5 (1.2 to 2.0) 872 1.3 (0.97 to 1.6)
Neither 2.2 (1.7 to 2.9) 537 1.7 (1.2 to 2.2)
Strongly agree/agree 2.0 (1.5 to 2.8) 314 1.4 (0.96 to 1.9)
Never had problem 2.1 (1.3 to 3.3) 99 1.7 (1.0 to 2.8)
Find life stressful 0.055
No
A bit
Quite
Very
Don’t know
Someone to care for them if they are ill 0.257
Definitely
Probably
Probably not
Don’t know
Can take time off work for GP < 0.001
Yes 1 1078
Yes but not easy 0.8 (0.6 to 1.1) 275
No 0.7 (0.4 to 1.1) 127
Not applicable/missing 1.6 (1.3 to 1.8) 1426
continued
DOI: 10.3310/hsdr08150 Health Services and Delivery Research 2020 Vol. 8 No. 15
© Queen’s Printer and Controller of HMSO 2020. This work was produced by O’Cathain et al. under the terms of a commissioning contract issued by the Secretary of Statefor Health and Social Care. This issue may be freely reproduced for the purposes of private research and study and extracts (or indeed, the full report) may be included inprofessional journals provided that suitable acknowledgement is made and the reproduction is not associated with any form of advertising. Applications for commercialreproduction should be addressed to: NIHR Journals Library, National Institute for Health Research, Evaluation, Trials and Studies Coordinating Centre, Alpha House,University of Southampton Science Park, Southampton SO16 7NS, UK.
221

TABLE 28 Variables explaining tendency to attend GP for two adult vignettesa (continued )
Variables
Univariate Final multivariable model
Odds ratio(95% CI) n p-value
Odds ratio(95% CI) p-value
7b, Low burden
Travel to ED < 0.001
Very difficult 1 620
Neither 1.0 (0.7 to 1.3) 269
Fairly easy 0.8 (0.6 to 0.97) 1172
Very easy 0.6 (0.4 to 0.7) 855
Opening hours a problem 0.423
Disagree/strongly disagree
Neither
Strongly agree/agree
Prefer no appointments 0.017
Disagree/strongly disagree 1 685
Neither 1.1 (0.9 to 1.4) 799
Strongly agree/agree 1.4 (1.1 to 1.7) 825
Want convenient times 0.549
Disagree/strongly disagree
Neither
Strongly agree/agree
Willing to wait in waiting room < 0.001
Disagree/strongly disagree 1 361
Neither 1.4 (0.97 to 2.1) 194
Strongly agree/agree 1.7 (1.3 to 2.2) 2351
8, Compliance with family/friends
Check with family and friends for what to do < 0.001
Not very likely 1 545
Not likely 1.3 (0.99 to 1.6) 746
Fairly likely 1.4 (1.1 to 1.8) 1061
Very likely 1.8 (1.4 to 2.3) 554
9, Views of services
Prefer ED for quick tests 0.013
Disagree/strongly disagree 1 1159
Neither 1.2 (1.0 to 1.5) 797
Strongly agree/agree 1.4 (1.1 to 1.8) 353
Missing, self-complete
APPENDIX 9
NIHR Journals Library www.journalslibrary.nihr.ac.uk
222

TABLE 28 Variables explaining tendency to attend GP for two adult vignettesa (continued )
Variables
Univariate Final multivariable model
Odds ratio(95% CI) n p-value
Odds ratio(95% CI) p-value
Doctors know more at ED 0.392
Disagree/strongly disagree
Neither
Strongly agree/agree
Missing, self-complete
No confidence in GP 0.652
Strongly disagree
Disagree
Neither
Agree
Strongly agree
Don’t know
Missing
Missing, self-complete
10, Frustration with access to GP
Hard to get GP appointment 0.689
Disagree/strongly disagree
Neither
Strongly agree/agree
Missing, self-complete
Registered with GP 0.038
Yes 1 2840
No 0.5 (0.3 to 0.99) 65
Work or looking after family makes it difficult tosee GP
0.003 0.027
Disagree/strongly disagree 1 1197 1
Neither 1.0 (0.8 to 1.2) 455 0.8 (0.6 to 1.0)
Strongly agree/agree 0.6 (0.5 to 0.8) 410 0.7 (0.5 to 0.9)
Not applicable 1.1 (0.8 to 1.4) 247 0.8 (0.6 to 1.1)
Believe people use ED because can’t get GPappointment
0.901
Strongly agree/agree
Neither
Disagree/strongly disagree
continued
DOI: 10.3310/hsdr08150 Health Services and Delivery Research 2020 Vol. 8 No. 15
© Queen’s Printer and Controller of HMSO 2020. This work was produced by O’Cathain et al. under the terms of a commissioning contract issued by the Secretary of Statefor Health and Social Care. This issue may be freely reproduced for the purposes of private research and study and extracts (or indeed, the full report) may be included inprofessional journals provided that suitable acknowledgement is made and the reproduction is not associated with any form of advertising. Applications for commercialreproduction should be addressed to: NIHR Journals Library, National Institute for Health Research, Evaluation, Trials and Studies Coordinating Centre, Alpha House,University of Southampton Science Park, Southampton SO16 7NS, UK.
223
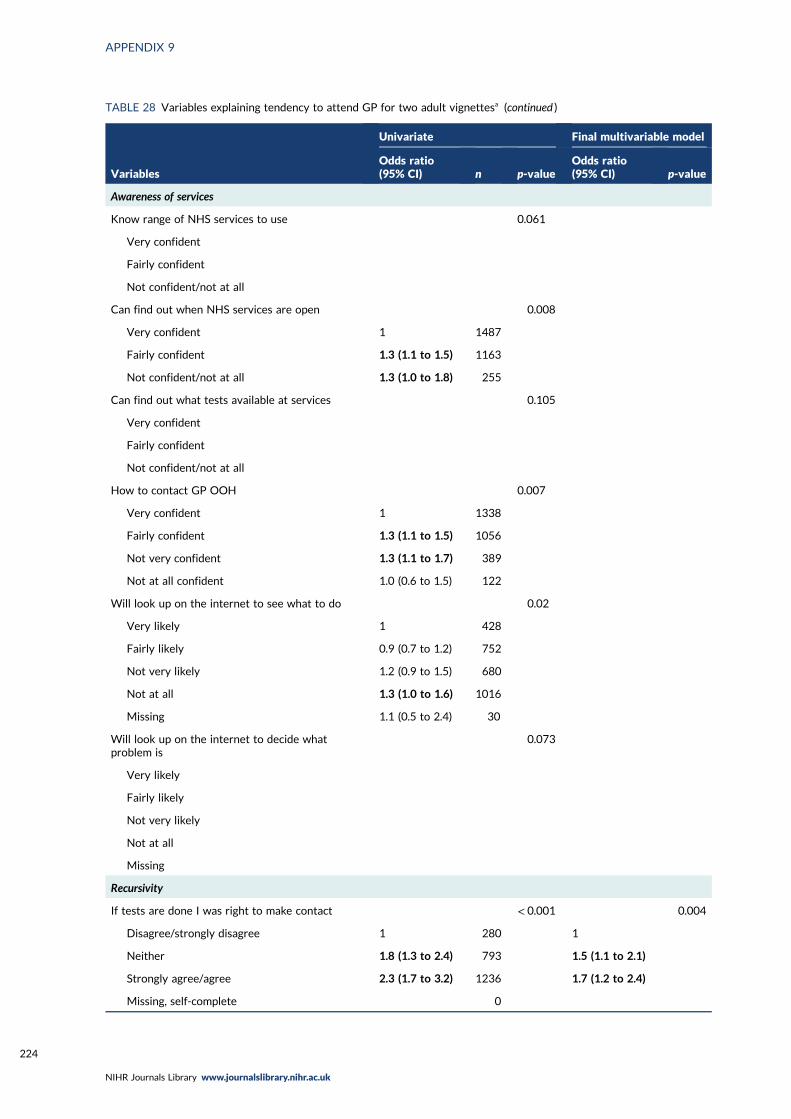
TABLE 28 Variables explaining tendency to attend GP for two adult vignettesa (continued )
Variables
Univariate Final multivariable model
Odds ratio(95% CI) n p-value
Odds ratio(95% CI) p-value
Awareness of services
Know range of NHS services to use 0.061
Very confident
Fairly confident
Not confident/not at all
Can find out when NHS services are open 0.008
Very confident 1 1487
Fairly confident 1.3 (1.1 to 1.5) 1163
Not confident/not at all 1.3 (1.0 to 1.8) 255
Can find out what tests available at services 0.105
Very confident
Fairly confident
Not confident/not at all
How to contact GP OOH 0.007
Very confident 1 1338
Fairly confident 1.3 (1.1 to 1.5) 1056
Not very confident 1.3 (1.1 to 1.7) 389
Not at all confident 1.0 (0.6 to 1.5) 122
Will look up on the internet to see what to do 0.02
Very likely 1 428
Fairly likely 0.9 (0.7 to 1.2) 752
Not very likely 1.2 (0.9 to 1.5) 680
Not at all 1.3 (1.0 to 1.6) 1016
Missing 1.1 (0.5 to 2.4) 30
Will look up on the internet to decide whatproblem is
0.073
Very likely
Fairly likely
Not very likely
Not at all
Missing
Recursivity
If tests are done I was right to make contact < 0.001 0.004
Disagree/strongly disagree 1 280 1
Neither 1.8 (1.3 to 2.4) 793 1.5 (1.1 to 2.1)
Strongly agree/agree 2.3 (1.7 to 3.2) 1236 1.7 (1.2 to 2.4)
Missing, self-complete 0
APPENDIX 9
NIHR Journals Library www.journalslibrary.nihr.ac.uk
224

TABLE 28 Variables explaining tendency to attend GP for two adult vignettesa (continued )
Variables
Univariate Final multivariable model
Odds ratio(95% CI) n p-value
Odds ratio(95% CI) p-value
Health literacy
Lower health literacy compared with higher healthliteracy – understand information
1.4 (1.2 to 1.6) 2269 < 0.001 1.24 (1.1 to 1.4) 0.005
Lower health literacy compared with higher healthliteracy – ability to communicate
1.2 (1.0 to 1.3) 2269 0.013
Recent use of health care
Ambulance use 0.618
Never
≥ 12 months
< 12 months
Ambulance frequent user 0.040
< 3 times 1 2842
≥ 3 times in 12 months 1.7 (1.0 to 2.8) 64
ED use 0.006
Never 1 411
≥ 12 months 0.7 (0.5 to 0.8) 1478
6–12 months 0.6 (0.5 to 0.9) 366
3–6 months 0.7 (0.5 to 0.98) 234
< 3 months 0.8 (0.6 to 1.0) 416
ED frequent user 0.072
< 3 times
≥ 3 times in 12 months
Contacted GP < 0.001 0.016
≥ 12 months 1 1
Never 1.0 (0.6 to 1.8) 1.0 (0.5 to 2.1)
6–12 months 1.5 (1.1 to 2.0) 1.5 (1.1 to 2.1)
3–6 months 1.2 (0.9 to 1.6) 0.9 (0.7 to 1.3)
< 3 months 1.6 (1.3 to 2.1) 1.3 (0.98 to 1.7)
Attitudes towards overuse of health services
Too many use 999 0.571
Strongly agree/agree
Neither
Disagree/strongly disagree
Too many use ED 0.097
Strongly agree/agree
Neither
Disagree/strongly disagree
continued
DOI: 10.3310/hsdr08150 Health Services and Delivery Research 2020 Vol. 8 No. 15
© Queen’s Printer and Controller of HMSO 2020. This work was produced by O’Cathain et al. under the terms of a commissioning contract issued by the Secretary of Statefor Health and Social Care. This issue may be freely reproduced for the purposes of private research and study and extracts (or indeed, the full report) may be included inprofessional journals provided that suitable acknowledgement is made and the reproduction is not associated with any form of advertising. Applications for commercialreproduction should be addressed to: NIHR Journals Library, National Institute for Health Research, Evaluation, Trials and Studies Coordinating Centre, Alpha House,University of Southampton Science Park, Southampton SO16 7NS, UK.
225

TABLE 28 Variables explaining tendency to attend GP for two adult vignettesa (continued )
Variables
Univariate Final multivariable model
Odds ratio(95% CI) n p-value
Odds ratio(95% CI) p-value
Too many use GP < 0.001
Strongly agree/agree 1 2082
Neither 1.3 (1.1 to 1.7) 577
Disagree/strongly disagree 1.5 (1.1 to 1.9) 247
Reluctance to use ED 0.022
Strongly agree/agree 1 1348
Neither 0.9 (0.7 to 1.0) 734
Disagree/strongly disagree 0.8 (0.6 to 0.9) 824
OOH, out of hours.a Completed only where p < 0.05.
TABLE 29 Full model for GP
Variables Sig. Exp(B)
95% CI for Exp(B)
Lower Upper
Age of respondent(grouped) < 7 category > dv 0.053
Age of respondent(grouped) < 7 category > dv(1) 0.654 1.116 0.689 1.808
Age of respondent(grouped) < 7 category > dv(2) 0.952 0.985 0.612 1.588
Age of respondent(grouped) < 7 category > dv(3) 0.900 0.969 0.599 1.569
Age of respondent(grouped) < 7 category > dv(4) 0.091 1.501 0.938 2.402
Age of respondent(grouped) < 7 category > dv(5) 0.274 1.309 0.808 2.120
Age of respondent(grouped) < 7 category > dv(6) 0.049 1.695 1.003 2.866
Limiting long-term condition or disability dv 0.902
Limiting long-term condition or disability dv(1) 0.578 0.930 0.721 1.200
Limiting long-term condition or disability dv(2) 0.884 1.024 0.748 1.402
Limiting long-term condition or disability dv(3) 0.734 1.377 0.218 8.708
DV To which of these racial groups do you consider you belong?(compressed)(1)
0.001 1.845 1.306 2.607
2007 version: Government office region 0.045
2007 version: Government office region(1) 0.753 1.050 0.775 1.422
2007 version: Government office region(2) 0.034 1.370 1.024 1.832
2007 version: Government office region(3) 0.263 1.264 0.839 1.904
2007 version: Government office region(4) 0.039 1.669 1.026 2.715
2007 version: Government office region(5) 0.030 1.545 1.043 2.291
When did you last see or speak to an accident and emergencydepartment (A&E) (for yourself or someone else)?
0.678
APPENDIX 9
NIHR Journals Library www.journalslibrary.nihr.ac.uk
226
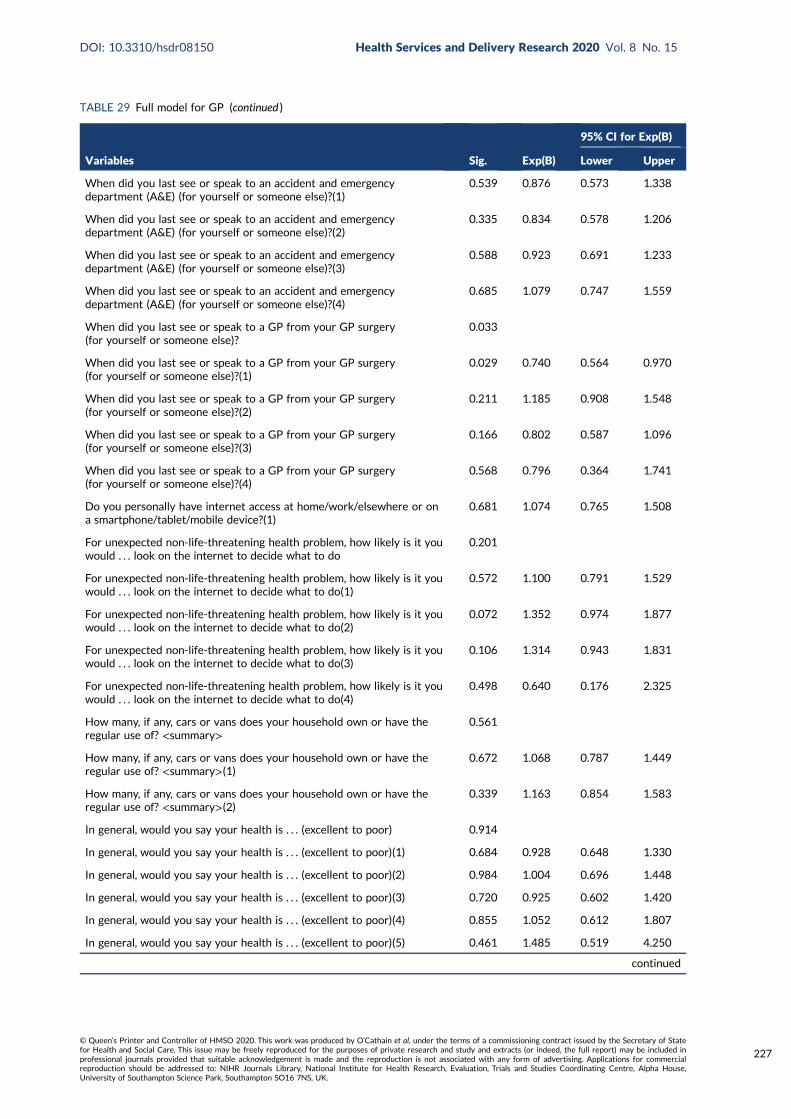
TABLE 29 Full model for GP (continued )
Variables Sig. Exp(B)
95% CI for Exp(B)
Lower Upper
When did you last see or speak to an accident and emergencydepartment (A&E) (for yourself or someone else)?(1)
0.539 0.876 0.573 1.338
When did you last see or speak to an accident and emergencydepartment (A&E) (for yourself or someone else)?(2)
0.335 0.834 0.578 1.206
When did you last see or speak to an accident and emergencydepartment (A&E) (for yourself or someone else)?(3)
0.588 0.923 0.691 1.233
When did you last see or speak to an accident and emergencydepartment (A&E) (for yourself or someone else)?(4)
0.685 1.079 0.747 1.559
When did you last see or speak to a GP from your GP surgery(for yourself or someone else)?
0.033
When did you last see or speak to a GP from your GP surgery(for yourself or someone else)?(1)
0.029 0.740 0.564 0.970
When did you last see or speak to a GP from your GP surgery(for yourself or someone else)?(2)
0.211 1.185 0.908 1.548
When did you last see or speak to a GP from your GP surgery(for yourself or someone else)?(3)
0.166 0.802 0.587 1.096
When did you last see or speak to a GP from your GP surgery(for yourself or someone else)?(4)
0.568 0.796 0.364 1.741
Do you personally have internet access at home/work/elsewhere or ona smartphone/tablet/mobile device?(1)
0.681 1.074 0.765 1.508
For unexpected non-life-threatening health problem, how likely is it youwould . . . look on the internet to decide what to do
0.201
For unexpected non-life-threatening health problem, how likely is it youwould . . . look on the internet to decide what to do(1)
0.572 1.100 0.791 1.529
For unexpected non-life-threatening health problem, how likely is it youwould . . . look on the internet to decide what to do(2)
0.072 1.352 0.974 1.877
For unexpected non-life-threatening health problem, how likely is it youwould . . . look on the internet to decide what to do(3)
0.106 1.314 0.943 1.831
For unexpected non-life-threatening health problem, how likely is it youwould . . . look on the internet to decide what to do(4)
0.498 0.640 0.176 2.325
How many, if any, cars or vans does your household own or have theregular use of? <summary>
0.561
How many, if any, cars or vans does your household own or have theregular use of? <summary>(1)
0.672 1.068 0.787 1.449
How many, if any, cars or vans does your household own or have theregular use of? <summary>(2)
0.339 1.163 0.854 1.583
In general, would you say your health is . . . (excellent to poor) 0.914
In general, would you say your health is . . . (excellent to poor)(1) 0.684 0.928 0.648 1.330
In general, would you say your health is . . . (excellent to poor)(2) 0.984 1.004 0.696 1.448
In general, would you say your health is . . . (excellent to poor)(3) 0.720 0.925 0.602 1.420
In general, would you say your health is . . . (excellent to poor)(4) 0.855 1.052 0.612 1.807
In general, would you say your health is . . . (excellent to poor)(5) 0.461 1.485 0.519 4.250
continued
DOI: 10.3310/hsdr08150 Health Services and Delivery Research 2020 Vol. 8 No. 15
© Queen’s Printer and Controller of HMSO 2020. This work was produced by O’Cathain et al. under the terms of a commissioning contract issued by the Secretary of Statefor Health and Social Care. This issue may be freely reproduced for the purposes of private research and study and extracts (or indeed, the full report) may be included inprofessional journals provided that suitable acknowledgement is made and the reproduction is not associated with any form of advertising. Applications for commercialreproduction should be addressed to: NIHR Journals Library, National Institute for Health Research, Evaluation, Trials and Studies Coordinating Centre, Alpha House,University of Southampton Science Park, Southampton SO16 7NS, UK.
227

TABLE 29 Full model for GP (continued )
Variables Sig. Exp(B)
95% CI for Exp(B)
Lower Upper
How confident are you in deciding when to see a doctor, or deal withthe problem yourself, for an unexpected non-life-threatening healthproblem? SC: B, C, D
0.563
How confident are you in deciding when to see a doctor, or deal withthe problem yourself, for an unexpected non-life-threatening healthproblem? SC: B, C, D(1)
0.213 0.871 0.701 1.082
How confident are you in deciding when to see a doctor, or deal withthe problem yourself, for an unexpected non-life-threatening healthproblem? SC: B, C, D(2)
0.497 0.835 0.497 1.405
How confident are you in deciding when to see a doctor, or deal withthe problem yourself, for an unexpected non-life-threatening healthproblem? SC: B, C, D(3)
0.789 1.076 0.629 1.839
For unexpected non-life-threatening health problem, how likely is it youwould . . . check what family or friends think you should do
0.376
For unexpected non-life-threatening health problem, how likely is it youwould . . . check what family or friends think you should do(1)
0.592 0.927 0.703 1.222
For unexpected non-life-threatening health problem, how likely is it youwould . . . check what family or friends think you should do(2)
0.210 0.824 0.608 1.116
For unexpected non-life-threatening health problem, how likely is it youwould . . . check what family or friends think you should do(3)
0.118 0.763 0.543 1.071
HPrbDr13 0.471
HPrbDr13(1) 0.330 1.112 0.898 1.379
HPrbDr13(2) 0.279 1.232 0.844 1.798
My work or looking after my family makes it difficult to see a GP SC:B, C, D
0.056
My work or looking after my family makes it difficult to see a GP SC:B, C, D(1)
0.563 1.106 0.786 1.556
My work or looking after my family makes it difficult to see a GP SC:B, C, D(2)
0.027 1.408 1.041 1.906
My work or looking after my family makes it difficult to see a GP SC:B, C, D(3)
0.707 1.083 0.715 1.640
For unexpected non-life-threatening pain, how likely is it you would . . .take medication to stop the pain
0.568
For unexpected non-life-threatening pain, how likely is it you would . . .take medication to stop the pain(1)
0.979 0.997 0.802 1.239
For unexpected non-life-threatening pain, how likely is it you would . . .take medication to stop the pain(2)
0.309 0.850 0.621 1.163
For unexpected non-life-threatening pain, how likely is it you would . . .take medication to stop the pain(3)
0.184 0.698 0.412 1.185
For unexpected non-life-threatening pain, how likely is it you would . . .take medication to stop the pain(4)
0.791 1.105 0.530 2.304
For unexpected non-life-threatening pain, how likely is it you would . . .worry that it is a sign of something serious
0.014
For unexpected non-life-threatening pain, how likely is it you would . . .worry that it is a sign of something serious(1)
0.318 0.857 0.632 1.161
For unexpected non-life-threatening pain, how likely is it you would . . .worry that it is a sign of something serious(2)
0.007 0.657 0.485 0.890
APPENDIX 9
NIHR Journals Library www.journalslibrary.nihr.ac.uk
228
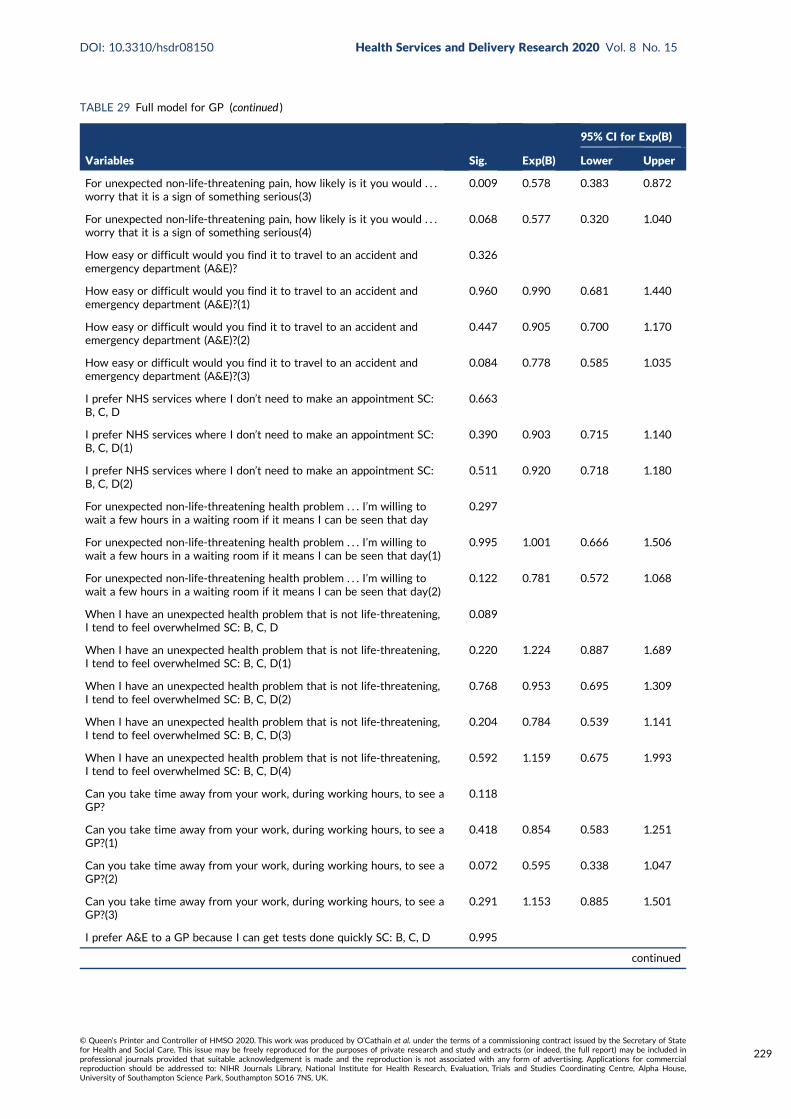
TABLE 29 Full model for GP (continued )
Variables Sig. Exp(B)
95% CI for Exp(B)
Lower Upper
For unexpected non-life-threatening pain, how likely is it you would . . .worry that it is a sign of something serious(3)
0.009 0.578 0.383 0.872
For unexpected non-life-threatening pain, how likely is it you would . . .worry that it is a sign of something serious(4)
0.068 0.577 0.320 1.040
How easy or difficult would you find it to travel to an accident andemergency department (A&E)?
0.326
How easy or difficult would you find it to travel to an accident andemergency department (A&E)?(1)
0.960 0.990 0.681 1.440
How easy or difficult would you find it to travel to an accident andemergency department (A&E)?(2)
0.447 0.905 0.700 1.170
How easy or difficult would you find it to travel to an accident andemergency department (A&E)?(3)
0.084 0.778 0.585 1.035
I prefer NHS services where I don’t need to make an appointment SC:B, C, D
0.663
I prefer NHS services where I don’t need to make an appointment SC:B, C, D(1)
0.390 0.903 0.715 1.140
I prefer NHS services where I don’t need to make an appointment SC:B, C, D(2)
0.511 0.920 0.718 1.180
For unexpected non-life-threatening health problem . . . I’m willing towait a few hours in a waiting room if it means I can be seen that day
0.297
For unexpected non-life-threatening health problem . . . I’m willing towait a few hours in a waiting room if it means I can be seen that day(1)
0.995 1.001 0.666 1.506
For unexpected non-life-threatening health problem . . . I’m willing towait a few hours in a waiting room if it means I can be seen that day(2)
0.122 0.781 0.572 1.068
When I have an unexpected health problem that is not life-threatening,I tend to feel overwhelmed SC: B, C, D
0.089
When I have an unexpected health problem that is not life-threatening,I tend to feel overwhelmed SC: B, C, D(1)
0.220 1.224 0.887 1.689
When I have an unexpected health problem that is not life-threatening,I tend to feel overwhelmed SC: B, C, D(2)
0.768 0.953 0.695 1.309
When I have an unexpected health problem that is not life-threatening,I tend to feel overwhelmed SC: B, C, D(3)
0.204 0.784 0.539 1.141
When I have an unexpected health problem that is not life-threatening,I tend to feel overwhelmed SC: B, C, D(4)
0.592 1.159 0.675 1.993
Can you take time away from your work, during working hours, to see aGP?
0.118
Can you take time away from your work, during working hours, to see aGP?(1)
0.418 0.854 0.583 1.251
Can you take time away from your work, during working hours, to see aGP?(2)
0.072 0.595 0.338 1.047
Can you take time away from your work, during working hours, to see aGP?(3)
0.291 1.153 0.885 1.501
I prefer A&E to a GP because I can get tests done quickly SC: B, C, D 0.995
continued
DOI: 10.3310/hsdr08150 Health Services and Delivery Research 2020 Vol. 8 No. 15
© Queen’s Printer and Controller of HMSO 2020. This work was produced by O’Cathain et al. under the terms of a commissioning contract issued by the Secretary of Statefor Health and Social Care. This issue may be freely reproduced for the purposes of private research and study and extracts (or indeed, the full report) may be included inprofessional journals provided that suitable acknowledgement is made and the reproduction is not associated with any form of advertising. Applications for commercialreproduction should be addressed to: NIHR Journals Library, National Institute for Health Research, Evaluation, Trials and Studies Coordinating Centre, Alpha House,University of Southampton Science Park, Southampton SO16 7NS, UK.
229

TABLE 29 Full model for GP (continued )
Variables Sig. Exp(B)
95% CI for Exp(B)
Lower Upper
I prefer A&E to a GP because I can get tests done quickly SC: B, C, D(1) 0.917 1.016 0.756 1.366
I prefer A&E to a GP because I can get tests done quickly SC: B, C, D(2) 0.934 1.013 0.754 1.360
Are you registered with a GP?(1) 0.810 0.911 0.429 1.938
If a service does tests on me, it shows I was right to go to that serviceSC: B, C, D
0.040
If a service does tests on me, it shows I was right to go to that serviceSC: B, C, D(1)
0.349 0.901 0.725 1.120
If a service does tests on me, it shows I was right to go to that serviceSC: B, C, D(2)
0.012 0.640 0.452 0.905
Ability 0.999 1.000 0.797 1.255
Understand 0.242 0.868 0.686 1.100
For unexpected non-life-threatening health problem, how confident areyou that . . . you know, or can easily find out, when NHS services areopen
0.928
For unexpected non-life-threatening health problem, how confident areyou that . . . you know, or can easily find out, when NHS services areopen(1)
0.756 0.964 0.763 1.218
For unexpected non-life-threatening health problem, how confident areyou that . . . you know, or can easily find out, when NHS services areopen(2)
0.919 1.021 0.687 1.517
For unexpected non-life-threatening health problem, how confident areyou that . . . you know, or can easily find out, how to contact GP out ofhours
0.256
For unexpected non-life-threatening health problem, how confident areyou that . . . you know, or can easily find out, how to contact GP out ofhours(1)
0.053 1.269 0.996 1.616
For unexpected non-life-threatening health problem, how confident areyou that . . . you know, or can easily find out, how to contact GP out ofhours(2)
0.188 1.246 0.898 1.730
For unexpected non non-life-threatening health problem, how confidentare you that . . . you know, or can easily find out, how to contact GP outof hours(3)
0.778 1.081 0.629 1.859
I think too many people go to their GP when they do not need to 0.137
I think too many people go to their GP when they do not need to(1) 0.058 1.261 0.992 1.604
I think too many people go to their GP when they do not need to(2) 0.364 1.177 0.828 1.673
Many people are reluctant to use A&E when they have an urgenthealth problem
0.780
Many people are reluctant to use A&E when they have an urgenthealth problem(1)
0.814 0.972 0.765 1.234
Many people are reluctant to use A&E when they have an urgenthealth problem(2)
0.481 0.921 0.733 1.158
Constant 0.449 0.659
APPENDIX 9
NIHR Journals Library www.journalslibrary.nihr.ac.uk
230

TABLE 30 Variables explaining tendency to contact any of the three services for any vignettea
Variables
Univariate Final multivariable model
Odds ratio(95% CI) n p-value
Odds ratio(95% CI) p-value
Sociodemographic characteristics
Age (years) < 0.001 < 0.001
18–24 1 169 1
25–34 0.8 (0.5 to 1.1) 384 0.8 (0.5 to 1.2)
35–44 0.7 (0.5 to 0.97) 467 0.6 (0.4 to 1.0)
45–54 0.9 (0.7 to 1.4) 469 1.1 (0.7 to 1.6)
55–64 1.2 (0.8 to 1.7) 508 1.3 (0.8 to 2.0)
65–74 1.5 (1.1 to 2.2) 499 1.6 (1.0 to 2.5)
≥ 75 1.3 (0.9 to 1.9) 405 1.2 (0.7 to 1.9)
Sex < 0.001 < 0.001
Female 1 1649 1
Male 1.4 (1.2 to 1.6) 1257 1.5 (1.2 to 1.8)
Ethnicity < 0.001 < 0.001
White 1 2572 1
BAME 2.2 (1.7 to 2.9) 334 2.6 (1.8 to 3.8)
Social class < 0.001
I 1 214
II 1.2 (0.9 to 1.6) 1039
III non-manual 1.5 (1.1 to 2.0) 569
III manual 2.0 (1.4 to 2.8) 416
IV and V 1.8 (1.3 to 2.5) 524
Armed forces 1.2 (0.7 to 2.3) 52
Deprivation 0.585
5 (affluent)
4
3
2
1 (most deprived)
Rurality 0.505
Rural
Urban
Region 0.003
North England 1 474
Midlands 1.0 (0.8 to 1.3) 794
South England 1.1 (0.8 to 1.3) 957
continued
DOI: 10.3310/hsdr08150 Health Services and Delivery Research 2020 Vol. 8 No. 15
© Queen’s Printer and Controller of HMSO 2020. This work was produced by O’Cathain et al. under the terms of a commissioning contract issued by the Secretary of Statefor Health and Social Care. This issue may be freely reproduced for the purposes of private research and study and extracts (or indeed, the full report) may be included inprofessional journals provided that suitable acknowledgement is made and the reproduction is not associated with any form of advertising. Applications for commercialreproduction should be addressed to: NIHR Journals Library, National Institute for Health Research, Evaluation, Trials and Studies Coordinating Centre, Alpha House,University of Southampton Science Park, Southampton SO16 7NS, UK.
231

TABLE 30 Variables explaining tendency to contact any of the three services for any vignettea (continued )
Variables
Univariate Final multivariable model
Odds ratio(95% CI) n p-value
Odds ratio(95% CI) p-value
London 1.5 (1.1 to 2.1) 285
Wales 1.4 (0.9 to 2.1) 132
Scotland 1.6 (1.2 to 2.2) 264
In household with children aged < 5 years old 0.006
No 1 2591
Yes 0.7 (0.6 to 0.9) 300
Resources available
Car ownership 0.002
≥ 1 cars 1 1478
No car 1.5 (1.2 to 1.9) 428
Missing 1.1 (0.9 to 1.3) 1000
Personal access to the internet < 0.001
Yes 1 2542
No 1.7 (1.4 to 2.2) 364
Health
General health < 0.001
Excellent 1 223
Very good 0.9 (0.6 to 1.1) 725
Good 1.0 (0.8 to 1.4) 799
Fair 1.4 (0.97 to 2.0) 360
Poor 1.6 (1.0 to 2.4) 163
Can’t choose 1.6 (0.7 to 3.3) 39
Missing/not included 1
Long-term limiting illness < 0.001 0.001
None 1 1766 1
Non-limiting 0.9 (0.8 to 1.1) 586 0.8 (0.7 to 1.1)
Limiting 1.6 (1.3 to 2.0) 541 1.5 (1.1 to 2.0)
Don’t know 0.5 (0.2 to 1.6) 13 0.5 (0.1 to 2.6)
Programme theories
1, Risk: uncertainty causes anxiety
Worry pain is a sign of something serious < 0.001 0.026
Not likely at all 1 358 1
Not likely 1.1 (0.9 to 1.4) 1138 1.0 (0.8 to 1.4)
Fairly likely 1.5 (1.2 to 1.9) 876 1.3 (0.95 to 1.8)
Very likely 2.5 (1.8 to 3.4) 415 1.6 (1.1 to 2.4)
It depends 119 1.3 (0.8 to 2.3)
APPENDIX 9
NIHR Journals Library www.journalslibrary.nihr.ac.uk
232
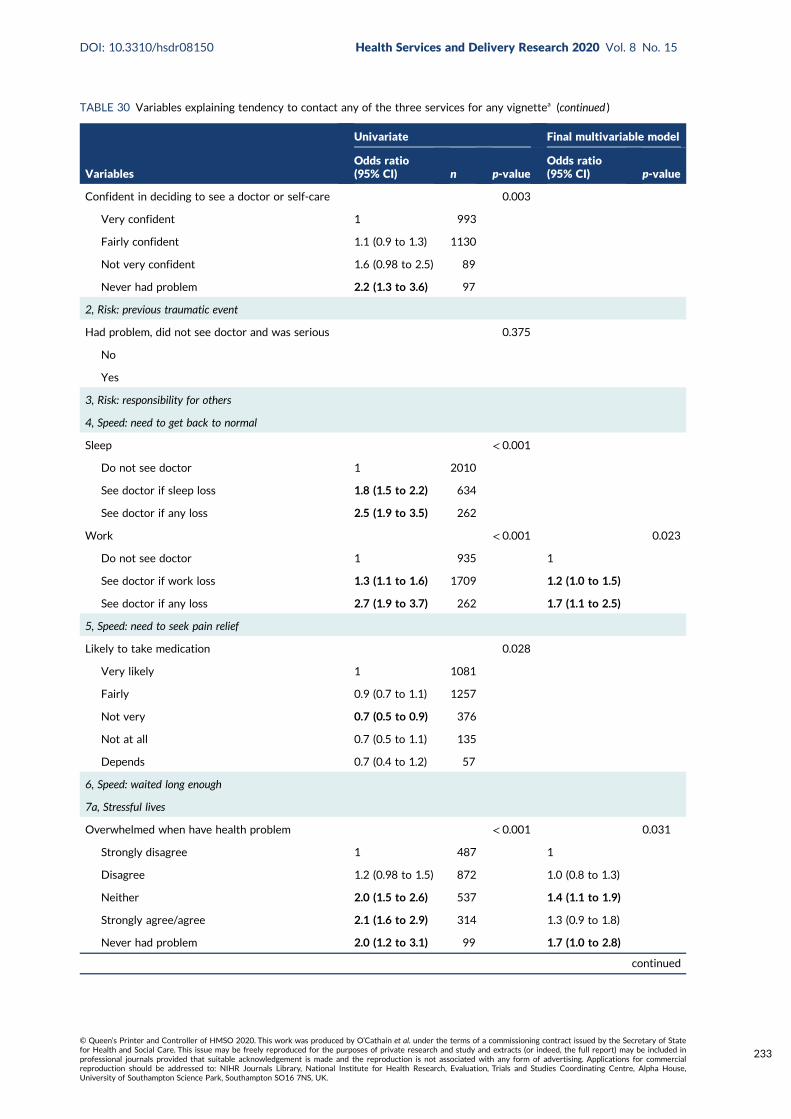
TABLE 30 Variables explaining tendency to contact any of the three services for any vignettea (continued )
Variables
Univariate Final multivariable model
Odds ratio(95% CI) n p-value
Odds ratio(95% CI) p-value
Confident in deciding to see a doctor or self-care 0.003
Very confident 1 993
Fairly confident 1.1 (0.9 to 1.3) 1130
Not very confident 1.6 (0.98 to 2.5) 89
Never had problem 2.2 (1.3 to 3.6) 97
2, Risk: previous traumatic event
Had problem, did not see doctor and was serious 0.375
No
Yes
3, Risk: responsibility for others
4, Speed: need to get back to normal
Sleep < 0.001
Do not see doctor 1 2010
See doctor if sleep loss 1.8 (1.5 to 2.2) 634
See doctor if any loss 2.5 (1.9 to 3.5) 262
Work < 0.001 0.023
Do not see doctor 1 935 1
See doctor if work loss 1.3 (1.1 to 1.6) 1709 1.2 (1.0 to 1.5)
See doctor if any loss 2.7 (1.9 to 3.7) 262 1.7 (1.1 to 2.5)
5, Speed: need to seek pain relief
Likely to take medication 0.028
Very likely 1 1081
Fairly 0.9 (0.7 to 1.1) 1257
Not very 0.7 (0.5 to 0.9) 376
Not at all 0.7 (0.5 to 1.1) 135
Depends 0.7 (0.4 to 1.2) 57
6, Speed: waited long enough
7a, Stressful lives
Overwhelmed when have health problem < 0.001 0.031
Strongly disagree 1 487 1
Disagree 1.2 (0.98 to 1.5) 872 1.0 (0.8 to 1.3)
Neither 2.0 (1.5 to 2.6) 537 1.4 (1.1 to 1.9)
Strongly agree/agree 2.1 (1.6 to 2.9) 314 1.3 (0.9 to 1.8)
Never had problem 2.0 (1.2 to 3.1) 99 1.7 (1.0 to 2.8)
continued
DOI: 10.3310/hsdr08150 Health Services and Delivery Research 2020 Vol. 8 No. 15
© Queen’s Printer and Controller of HMSO 2020. This work was produced by O’Cathain et al. under the terms of a commissioning contract issued by the Secretary of Statefor Health and Social Care. This issue may be freely reproduced for the purposes of private research and study and extracts (or indeed, the full report) may be included inprofessional journals provided that suitable acknowledgement is made and the reproduction is not associated with any form of advertising. Applications for commercialreproduction should be addressed to: NIHR Journals Library, National Institute for Health Research, Evaluation, Trials and Studies Coordinating Centre, Alpha House,University of Southampton Science Park, Southampton SO16 7NS, UK.
233

TABLE 30 Variables explaining tendency to contact any of the three services for any vignettea (continued )
Variables
Univariate Final multivariable model
Odds ratio(95% CI) n p-value
Odds ratio(95% CI) p-value
Find life stressful 0.012
No 1 637
A bit 1.0 (0.8 to 1.2) 1316
Quite 0.8 (0.6 to 1.0) 637
Very 0.9 (0.7 to 1.2) 297
Don’t know 0.2 (0.1 to 0.7) 19
Someone to care for them if they are ill 0.004
Definitely 1 1240
Probably 0.9 (0.8 to 1.1) 697
Probably not 1.1 (0.8 to 1.4) 280
Don’t know 2.3 (1.4 to 3.9) 92
Can take time off work for GP < 0.001
Yes 1 1078
Yes but not easy 0.8 (0.6 to 1.0) 275
No 0.7 (0.5 to 1.0) 127
Not applicable/missing 1.5 (1.3 to 1.8) 1426
7b, Low burden
Travel to ED < 0.001
Very difficult 1 610
Neither 0.7 (0.5 to 0.96) 269
Fairly easy 0.7 (0.6 to 0.9) 1172
Very easy 0.6 (0.5 to 0.7) 855
Opening hours a problem 0.239
Disagree/strongly disagree
Neither
Strongly agree/agree
Prefer no appointments < 0.001
Disagree/strongly disagree 1 685
Neither 1.2 (1.0 to 1.5) 799
Strongly agree/agree 1.6 (1.3 to 2.0) 825
Want convenient times 0.737
Disagree/strongly disagree
Neither
Strongly agree/agree
APPENDIX 9
NIHR Journals Library www.journalslibrary.nihr.ac.uk
234

TABLE 30 Variables explaining tendency to contact any of the three services for any vignettea (continued )
Variables
Univariate Final multivariable model
Odds ratio(95% CI) n p-value
Odds ratio(95% CI) p-value
Willing to wait in waiting room < 0.001
Disagree/strongly disagree 1 361
Neither 0.9 (0.7 to 1.3) 194
Strongly agree/agree 1.6 (1.3 to 2.0) 2351
8, Compliance with family/friends
Check with family and friends for what to do 0.027
Not very likely 1 545
Not likely 1.0 (0.8 to 1.3) 746
Fairly likely 1.1 (0.9 to 1.3) 1061
Very likely 1.4 (1.1 to 1.8) 554
9, Views of services
Prefer ED for quick tests < 0.001 < 0.001
Disagree/strongly disagree 1 1159 1
Neither 1.6 (1.3 to 1.9) 797 1.3 (1.1 to 1.7)
Strongly agree/agree 2.6 (1.9 to 3.3) 353 1.9 (1.4 to 2.6)
Missing, self-complete 0
Doctors know more at ED < 0.001
Disagree/strongly disagree 1 850
Neither 1.5 (1.2 to 1.8) 1041
Strongly agree/agree 1.4 (1.1 to 1.8) 418
Missing, self-complete 0
No confidence in GP 0.895
Strongly disagree
Disagree
Neither
Agree
Strongly agree
Don’t know
Missing
Missing, self-complete
10, Frustration with access to GP
Hard to get GP appointment 0.940
Disagree/strongly disagree
Neither
Strongly agree/agree
Missing, self-complete
continued
DOI: 10.3310/hsdr08150 Health Services and Delivery Research 2020 Vol. 8 No. 15
© Queen’s Printer and Controller of HMSO 2020. This work was produced by O’Cathain et al. under the terms of a commissioning contract issued by the Secretary of Statefor Health and Social Care. This issue may be freely reproduced for the purposes of private research and study and extracts (or indeed, the full report) may be included inprofessional journals provided that suitable acknowledgement is made and the reproduction is not associated with any form of advertising. Applications for commercialreproduction should be addressed to: NIHR Journals Library, National Institute for Health Research, Evaluation, Trials and Studies Coordinating Centre, Alpha House,University of Southampton Science Park, Southampton SO16 7NS, UK.
235

TABLE 30 Variables explaining tendency to contact any of the three services for any vignettea (continued )
Variables
Univariate Final multivariable model
Odds ratio(95% CI) n p-value
Odds ratio(95% CI) p-value
Registered with GP 0.019
Yes 1 2840
No 0.6 (0.3 to 0.9) 65
Work or looking after family makes it difficult tosee GP
< 0.001 0.040
Disagree/strongly disagree 1 1197 1
Neither 1.2 (0.98 to 1.5) 455 1.0 (0.8 to 1.3)
Strongly agree/agree 0.7 (0.5 to 0.8) 410 0.7 (0.5 to 0.9)
Not applicable 1.2 (0.9 to 1.6) 247 0.9 (0.7 to 1.3)
Believe people use ED because can’t get GPappointment
0.499
Strongly agree/agree
Neither
Disagree/strongly disagree
Awareness of services
Know range of NHS services to use 0.118
Very confident
Fairly confident
Not confident/not at all
Can find out when NHS services are open 0.007
Very confident 1 1487
Fairly confident 1.2 (1.1 to 1.5) 1163
Not confident/not at all 1.4 (1.0 to 1.8) 255
Can find out what tests available at services 0.753
Very confident
Fairly confident
Not confident/not at all
How to contact GP OOH 0.008 0.043
Very confident 1 1338 1
Fairly confident 1.1 (0.96 to 1.3) 1056 1.1 (0.9 to 1.4)
Not very confident 1.5 (1.2 to 1.9) 389 1.5 (1.1 to 2.0)
Not at all confident 0.9 (0.6 to 1.4) 122 0.8 (0.5 to 1.3)
Will look up on the internet to see what to do < 0.001 0.015
Very likely 1 428 1
Fairly likely 0.8 (0.7 to 1.1) 752 1.0 (0.7 to 1.3)
Not very likely 1.3 (1.0 to 1.7) 680 1.3 (1.0 to 1.8)
Not at all 1.4 (1.1 to 1.7) 1016 1.3 (1.0 to 1.8)
Missing 0.7 (0.3 to 1.4) 30 0.5 (0.2 to 1.5)
APPENDIX 9
NIHR Journals Library www.journalslibrary.nihr.ac.uk
236

TABLE 30 Variables explaining tendency to contact any of the three services for any vignettea (continued )
Variables
Univariate Final multivariable model
Odds ratio(95% CI) n p-value
Odds ratio(95% CI) p-value
Will look up on the internet to decide whatproblem is
< 0.001
Very likely 1 667
Fairly likely 0.9 (0.7 to 1.1) 797
Not very likely 1.2 (0.95 to 1.6) 472
Not at all 1.4 (1.1 to 1.7) 940
Missing 0.6 (0.3 to 1.2) 30
Recursivity
If tests are done I was right to make contact < 0.001 0.002
Disagree/strongly disagree 1 280 1
Neither 1.8 (1.3 to 2.3) 793 1.4 (1.0 to 1.9)
Strongly agree/agree 2.5 (1.9 to 3.2) 1236 1.7 (1.2 to 2.2)
Missing, self-complete 0
Health literacy
Lower health literacy compared with higher healthliteracy – understand information
1.5 (1.3 to 1.7) < 0.001
Lower health literacy compared with higher healthliteracy – ability to communicate
1.2 (1.1 to 1.4) 0.005
Recent use of health care
Ambulance use 0.238
Never
≥ 12 months
< 12 months
Ambulance frequent user 0.235
< 3 times
≥ 3 times in 12 months
ED use 0.450
Never
≥ 12 months
6–12 months
3–6 months
< 3 months
ED frequent user 0.017
< 3 times 1 2738
≥ 3 times in 12 months 1.5 (1.1 to 2.1) 167
continued
DOI: 10.3310/hsdr08150 Health Services and Delivery Research 2020 Vol. 8 No. 15
© Queen’s Printer and Controller of HMSO 2020. This work was produced by O’Cathain et al. under the terms of a commissioning contract issued by the Secretary of Statefor Health and Social Care. This issue may be freely reproduced for the purposes of private research and study and extracts (or indeed, the full report) may be included inprofessional journals provided that suitable acknowledgement is made and the reproduction is not associated with any form of advertising. Applications for commercialreproduction should be addressed to: NIHR Journals Library, National Institute for Health Research, Evaluation, Trials and Studies Coordinating Centre, Alpha House,University of Southampton Science Park, Southampton SO16 7NS, UK.
237

TABLE 30 Variables explaining tendency to contact any of the three services for any vignettea (continued )
Variables
Univariate Final multivariable model
Odds ratio(95% CI) n p-value
Odds ratio(95% CI) p-value
Contacted GP 0.015 0.043
≥ 12 months 454 1
Never 0.8 (0.5 to 1.4) 65 0.7 (0.4 to 1.5)
6–12 months 1.3 (0.98 to 1.7) 484 1.5 (1.1 to 2.1)
3–6 months 1.2 (0.9 to 1.5) 518 1.1 (0.8 to 1.6)
< 3 months 1.4 (1.1 to 1.7) 1384 1.4 (0.98 to 1.7)
Attitudes towards overuse of health services
Too many use 999 0.112
Strongly agree/agree
Neither
Disagree/strongly disagree
Too many use ED 0.015
Strongly agree/agree 1 2515
Neither 1.4 (1.1 to 1.8) 291
Disagree/strongly disagree 1.5 (0.95 to 2.3) 100
Too many use GP 0.017
Strongly agree/agree 1 2082
Neither 1.3 (1.0 to 1.5) 577
Disagree/strongly disagree 1.3 (1.0 to 1.8) 247
Reluctance to use ED 0.043
Strongly agree/agree 1 1348
Neither 0.9 (0.8 to 1.1) 734
Disagree/strongly disagree 0.8 (0.7 to 0.95) 824
OOH, out of hours.a Completed only where p < 0.05.
TABLE 31 Full model for any service
Variables Sig. Exp(B)
95% CI for Exp(B)
Lower Upper
Age of respondent(grouped) < 7 category > dv 0.000
Age of respondent(grouped) < 7 category > dv(1) 0.828 0.943 0.555 1.602
Age of respondent(grouped) < 7 category > dv(2) 0.320 0.770 0.461 1.288
Age of respondent(grouped) < 7 category > dv(3) 0.222 1.379 0.824 2.308
Age of respondent(grouped) < 7 category > dv(4) 0.051 1.678 0.998 2.820
Age of respondent(grouped) < 7 category > dv(5) 0.014 2.007 1.154 3.491
APPENDIX 9
NIHR Journals Library www.journalslibrary.nihr.ac.uk
238

TABLE 31 Full model for any service (continued )
Variables Sig. Exp(B)
95% CI for Exp(B)
Lower Upper
Age of respondent(grouped) < 7 category > dv(6) 0.301 1.375 0.752 2.514
Sex of respondent(1) 0.000 0.667 0.538 0.827
Limiting long-term condition or disability dv 0.003
Limiting long-term condition or disability dv(1) 0.132 0.822 0.636 1.061
Limiting long-term condition or disability dv(2) 0.013 1.544 1.095 2.178
Limiting long-term condition or disability dv(3) 0.190 0.233 0.026 2.063
Respondent: social class [pre-SOC2000] best estimate dv 0.395
Respondent: social class [pre-SOC2000] best estimate dv(1) 0.333 1.203 0.827 1.750
Respondent: social class [pre-SOC2000] best estimate dv(2) 0.157 1.346 0.892 2.029
Respondent: social class [pre-SOC2000] best estimate dv(3) 0.055 1.555 0.991 2.440
Respondent: social class [pre-SOC2000] best estimate dv(4) 0.094 1.453 0.938 2.251
Respondent: social class [pre-SOC2000] best estimate dv(5) 0.861 1.083 0.445 2.638
IMD_ALL 0.514
IMD_ALL(1) 0.725 1.063 0.757 1.493
IMD_ALL(2) 0.398 1.157 0.825 1.624
IMD_ALL(3) 0.415 1.147 0.825 1.595
IMD_ALL(4) 0.098 1.333 0.949 1.874
DV To which of these racial groups do you consider you belong?(compressed)(1)
0.000 2.431 1.574 3.753
2007 version: Government office region 0.095
2007 version: Government office region(1) 0.934 0.987 0.731 1.333
2007 version: Government office region(2) 0.755 0.954 0.711 1.280
2007 version: Government office region(3) 0.111 1.428 0.921 2.212
2007 version: Government office region(4) 0.235 1.375 0.813 2.325
2007 version: Government office region(5) 0.079 1.457 0.957 2.219
Number of Respondents children in HH aged 0–4yrs – dv(1) 0.540 1.120 0.779 1.609
When did you last see or speak to a GP from your GP surgery(for yourself or someone else)?
0.061
When did you last see or speak to a GP from your GP surgery(for yourself or someone else)?(1)
0.344 0.880 0.674 1.147
When did you last see or speak to a GP from your GP surgery(for yourself or someone else)?(2)
0.396 1.127 0.855 1.486
When did you last see or speak to a GP from your GP surgery(for yourself or someone else)?(3)
0.029 0.713 0.526 0.966
When did you last see or speak to a GP from your GP surgery(for yourself or someone else)?(4)
0.191 0.593 0.272 1.296
Do you personally have internet access at home/work/elsewhere or ona smartphone/tablet/mobile device?(1)
0.420 1.177 0.792 1.751
continued
DOI: 10.3310/hsdr08150 Health Services and Delivery Research 2020 Vol. 8 No. 15
© Queen’s Printer and Controller of HMSO 2020. This work was produced by O’Cathain et al. under the terms of a commissioning contract issued by the Secretary of Statefor Health and Social Care. This issue may be freely reproduced for the purposes of private research and study and extracts (or indeed, the full report) may be included inprofessional journals provided that suitable acknowledgement is made and the reproduction is not associated with any form of advertising. Applications for commercialreproduction should be addressed to: NIHR Journals Library, National Institute for Health Research, Evaluation, Trials and Studies Coordinating Centre, Alpha House,University of Southampton Science Park, Southampton SO16 7NS, UK.
239

TABLE 31 Full model for any service (continued )
Variables Sig. Exp(B)
95% CI for Exp(B)
Lower Upper
For unexpected non-life-threatening health problem, how likely is it youwould . . . look on the internet to decide what the problem might be
0.989
For unexpected non-life-threatening health problem, how likely is it youwould . . . look on the internet to decide what the problem might be(1)
0.877 0.973 0.687 1.378
For unexpected non-life-threatening health problem, how likely is it youwould . . . look on the internet to decide what the problem might be(2)
0.762 0.937 0.613 1.431
For unexpected non-life-threatening health problem, how likely is it youwould . . . look on the internet to decide what the problem might be(3)
0.604 0.869 0.512 1.476
For unexpected non-life-threatening health problem, how likely is it youwould . . . look on the internet to decide what the problem might be(4)
0.792 0.771 0.111 5.338
For unexpected non-life-threatening health problem, how likely is it youwould . . . look on the internet to decide what to do
0.239
For unexpected non-life-threatening health problem, how likely is it youwould . . . look on the internet to decide what to do(1)
0.935 1.017 0.686 1.507
For unexpected non-life-threatening health problem, how likely is it youwould . . . look on the internet to decide what to do(2)
0.170 1.356 0.878 2.094
For unexpected non-life-threatening health problem, how likely is it youwould . . . look on the internet to decide what to do(3)
0.194 1.445 0.829 2.521
For unexpected non-life-threatening health problem, how likely is it youwould . . . look on the internet to decide what to do(4)
0.465 0.481 0.068 3.423
How many, if any, cars or vans does your household own or have theregular use of? <summary>
0.820
How many, if any, cars or vans does your household own or have theregular use of? <summary>(1)
0.998 1.000 0.712 1.405
How many, if any, cars or vans does your household own or have theregular use of? <summary>(2)
0.710 1.069 0.753 1.516
In general, would you say your health is . . . (excellent to poor) 0.424
In general, would you say your health is . . . (excellent to poor)(1) 0.101 0.743 0.521 1.059
In general, would you say your health is . . . (excellent to poor)(2) 0.261 0.809 0.560 1.170
In general, would you say your health is . . . (excellent to poor)(3) 0.364 0.814 0.521 1.270
In general, would you say your health is . . . (excellent to poor)(4) 0.059 0.568 0.316 1.022
In general, would you say your health is . . . (excellent to poor)(5) 0.750 0.813 0.228 2.903
How confident are you in deciding when to see a doctor, or deal withthe problem yourself, for an unexpected non-life-threatening healthproblem? SC: B, C, D
0.558
How confident are you in deciding when to see a doctor, or deal withthe problem yourself, for an unexpected non-life-threatening healthproblem? SC: B, C, D(1)
0.170 0.855 0.684 1.070
How confident are you in deciding when to see a doctor, or deal withthe problem yourself, for an unexpected non-life-threatening healthproblem? SC: B, C, D(2)
0.861 0.949 0.530 1.699
How confident are you in deciding when to see a doctor, or deal withthe problem yourself, for an unexpected non-life-threatening healthproblem? SC: B, C, D(3)
0.886 1.053 0.519 2.135
APPENDIX 9
NIHR Journals Library www.journalslibrary.nihr.ac.uk
240
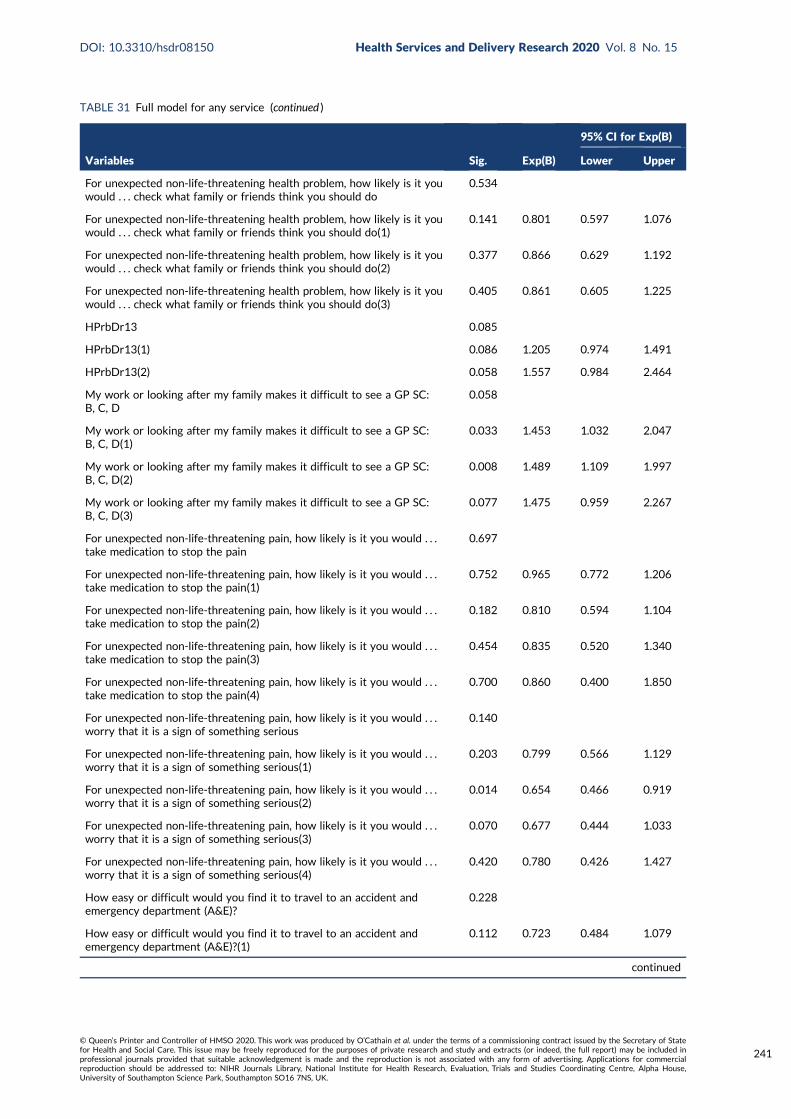
TABLE 31 Full model for any service (continued )
Variables Sig. Exp(B)
95% CI for Exp(B)
Lower Upper
For unexpected non-life-threatening health problem, how likely is it youwould . . . check what family or friends think you should do
0.534
For unexpected non-life-threatening health problem, how likely is it youwould . . . check what family or friends think you should do(1)
0.141 0.801 0.597 1.076
For unexpected non-life-threatening health problem, how likely is it youwould . . . check what family or friends think you should do(2)
0.377 0.866 0.629 1.192
For unexpected non-life-threatening health problem, how likely is it youwould . . . check what family or friends think you should do(3)
0.405 0.861 0.605 1.225
HPrbDr13 0.085
HPrbDr13(1) 0.086 1.205 0.974 1.491
HPrbDr13(2) 0.058 1.557 0.984 2.464
My work or looking after my family makes it difficult to see a GP SC:B, C, D
0.058
My work or looking after my family makes it difficult to see a GP SC:B, C, D(1)
0.033 1.453 1.032 2.047
My work or looking after my family makes it difficult to see a GP SC:B, C, D(2)
0.008 1.489 1.109 1.997
My work or looking after my family makes it difficult to see a GP SC:B, C, D(3)
0.077 1.475 0.959 2.267
For unexpected non-life-threatening pain, how likely is it you would . . .take medication to stop the pain
0.697
For unexpected non-life-threatening pain, how likely is it you would . . .take medication to stop the pain(1)
0.752 0.965 0.772 1.206
For unexpected non-life-threatening pain, how likely is it you would . . .take medication to stop the pain(2)
0.182 0.810 0.594 1.104
For unexpected non-life-threatening pain, how likely is it you would . . .take medication to stop the pain(3)
0.454 0.835 0.520 1.340
For unexpected non-life-threatening pain, how likely is it you would . . .take medication to stop the pain(4)
0.700 0.860 0.400 1.850
For unexpected non-life-threatening pain, how likely is it you would . . .worry that it is a sign of something serious
0.140
For unexpected non-life-threatening pain, how likely is it you would . . .worry that it is a sign of something serious(1)
0.203 0.799 0.566 1.129
For unexpected non-life-threatening pain, how likely is it you would . . .worry that it is a sign of something serious(2)
0.014 0.654 0.466 0.919
For unexpected non-life-threatening pain, how likely is it you would . . .worry that it is a sign of something serious(3)
0.070 0.677 0.444 1.033
For unexpected non-life-threatening pain, how likely is it you would . . .worry that it is a sign of something serious(4)
0.420 0.780 0.426 1.427
How easy or difficult would you find it to travel to an accident andemergency department (A&E)?
0.228
How easy or difficult would you find it to travel to an accident andemergency department (A&E)?(1)
0.112 0.723 0.484 1.079
continued
DOI: 10.3310/hsdr08150 Health Services and Delivery Research 2020 Vol. 8 No. 15
© Queen’s Printer and Controller of HMSO 2020. This work was produced by O’Cathain et al. under the terms of a commissioning contract issued by the Secretary of Statefor Health and Social Care. This issue may be freely reproduced for the purposes of private research and study and extracts (or indeed, the full report) may be included inprofessional journals provided that suitable acknowledgement is made and the reproduction is not associated with any form of advertising. Applications for commercialreproduction should be addressed to: NIHR Journals Library, National Institute for Health Research, Evaluation, Trials and Studies Coordinating Centre, Alpha House,University of Southampton Science Park, Southampton SO16 7NS, UK.
241

TABLE 31 Full model for any service (continued )
Variables Sig. Exp(B)
95% CI for Exp(B)
Lower Upper
How easy or difficult would you find it to travel to an accident andemergency department (A&E)?(2)
0.414 0.892 0.678 1.174
How easy or difficult would you find it to travel to an accident andemergency department (A&E)?(3)
0.086 0.773 0.576 1.037
I prefer NHS services where I don’t need to make an appointment SC:B, C, D
0.598
I prefer NHS services where I don’t need to make an appointment SC:B, C, D(1)
0.427 0.906 0.710 1.156
I prefer NHS services where I don’t need to make an appointment SC:B, C, D(2)
0.345 0.885 0.688 1.140
For unexpected non-life-threatening health problem . . . I’m willing towait a few hours in a waiting room if it means I can be seen that day
0.304
For unexpected non-life-threatening health problem . . . I’m willing towait a few hours in a waiting room if it means I can be seen that day(1)
0.150 0.735 0.484 1.118
For unexpected non-life-threatening health problem . . . I’m willing towait a few hours in a waiting room if it means I can be seen that day(2)
0.482 0.900 0.671 1.207
Do you have family, friends or a partner who could look after them ifhave an unexpected non-life-threatening health problem? SC: B, C, D
0.110
Do you have family, friends or a partner who could look after them ifhave an unexpected non-life-threatening health problem? SC: B, C, D(1)
0.053 0.799 0.637 1.003
Do you have family, friends or a partner who could look after them ifhave an unexpected non-life-threatening health problem? SC: B, C, D(2)
0.556 0.909 0.662 1.249
Do you have family, friends or a partner who could look after them ifhave an unexpected non-life-threatening health problem? SC: B, C, D(3)
0.212 1.602 0.765 3.356
When I have an unexpected health problem that is not life-threatening,I tend to feel overwhelmed SC: B, C, D
0.070
When I have an unexpected health problem that is not life-threatening,I tend to feel overwhelmed SC: B, C, D(1)
0.491 1.137 0.790 1.636
When I have an unexpected health problem that is not life-threatening,I tend to feel overwhelmed SC: B, C, D(2)
0.242 0.814 0.576 1.150
When I have an unexpected health problem that is not life-threatening,I tend to feel overwhelmed SC: B, C, D(3)
0.196 0.773 0.524 1.142
When I have an unexpected health problem that is not life-threatening,I tend to feel overwhelmed SC: B, C, D(4)
0.497 1.229 0.677 2.232
Generally, do you find your life stressful? 0.989
Generally, do you find your life stressful?(1) 0.664 1.059 0.816 1.375
Generally, do you find your life stressful?(2) 0.708 1.062 0.775 1.456
Generally, do you find your life stressful?(3) 0.878 1.032 0.687 1.552
Generally, do you find your life stressful?(4) 0.791 0.803 0.159 4.062
Can you take time away from your work, during working hours, to see aGP?
0.414
Can you take time away from your work, during working hours, to see aGP?(1)
0.827 1.040 0.732 1.477
APPENDIX 9
NIHR Journals Library www.journalslibrary.nihr.ac.uk
242

TABLE 31 Full model for any service (continued )
Variables Sig. Exp(B)
95% CI for Exp(B)
Lower Upper
Can you take time away from your work, during working hours, to see aGP?(2)
0.109 0.662 0.399 1.097
Can you take time away from your work, during working hours, to see aGP?(3)
0.997 1.000 0.761 1.314
I think doctors at A&E know more than GPs SC: B, C, D 0.059
I think doctors at A&E know more than GPs SC: B, C, D(1) 0.022 1.402 1.049 1.873
I think doctors at A&E know more than GPs SC: B, C, D(2) 0.039 1.380 1.016 1.874
I prefer A&E to a GP because I can get tests done quickly SC: B, C, D 0.000
I prefer A&E to a GP because I can get tests done quickly SC: B, C, D(1) 0.012 0.639 0.452 0.904
I prefer A&E to a GP because I can get tests done quickly SC: B, C, D(2) 0.000 0.476 0.336 0.674
If a service does tests on me, it shows I was right to go to that serviceSC: B, C, D
0.026
If a service does tests on me, it shows I was right to go to that serviceSC: B, C, D(1)
0.205 0.866 0.693 1.082
If a service does tests on me, it shows I was right to go to that serviceSC: B, C, D(2)
0.008 0.653 0.477 0.893
Ability 0.916 1.013 0.803 1.278
Understand 0.474 0.912 0.710 1.172
For unexpected non-life-threatening health problem, how confident areyou that . . . you know, or can easily find out, when NHS services areopen
0.644
For unexpected non-life-threatening health problem, how confident areyou that . . . you know, or can easily find out, when NHS services areopen(1)
0.582 0.935 0.737 1.187
For unexpected non-life-threatening health problem, how confident areyou that . . . you know, or can easily find out, when NHS services areopen(2)
0.592 1.127 0.728 1.747
For unexpected non-life-threatening health problem, how confident areyou that . . . you know, or can easily find out, how to contact GP out ofhours
0.018
For unexpected non-life-threatening health problem, how confident areyou that . . . you know, or can easily find out, how to contact GP out ofhours(1)
0.134 1.206 0.944 1.541
For unexpected non-life-threatening health problem, how confident areyou that . . . you know, or can easily find out, how to contact GP out ofhours(2)
0.005 1.663 1.168 2.367
For unexpected non-life-threatening health problem, how confident areyou that . . . you know, or can easily find out, how to contact GP out ofhours(3)
0.488 0.822 0.473 1.429
I think too many people use A&E when they do not need to 0.366
I think too many people use A&E when they do not need to(1) 0.193 1.285 0.881 1.875
I think too many people use A&E when they do not need to(2) 0.498 1.248 0.657 2.373
continued
DOI: 10.3310/hsdr08150 Health Services and Delivery Research 2020 Vol. 8 No. 15
© Queen’s Printer and Controller of HMSO 2020. This work was produced by O’Cathain et al. under the terms of a commissioning contract issued by the Secretary of Statefor Health and Social Care. This issue may be freely reproduced for the purposes of private research and study and extracts (or indeed, the full report) may be included inprofessional journals provided that suitable acknowledgement is made and the reproduction is not associated with any form of advertising. Applications for commercialreproduction should be addressed to: NIHR Journals Library, National Institute for Health Research, Evaluation, Trials and Studies Coordinating Centre, Alpha House,University of Southampton Science Park, Southampton SO16 7NS, UK.
243
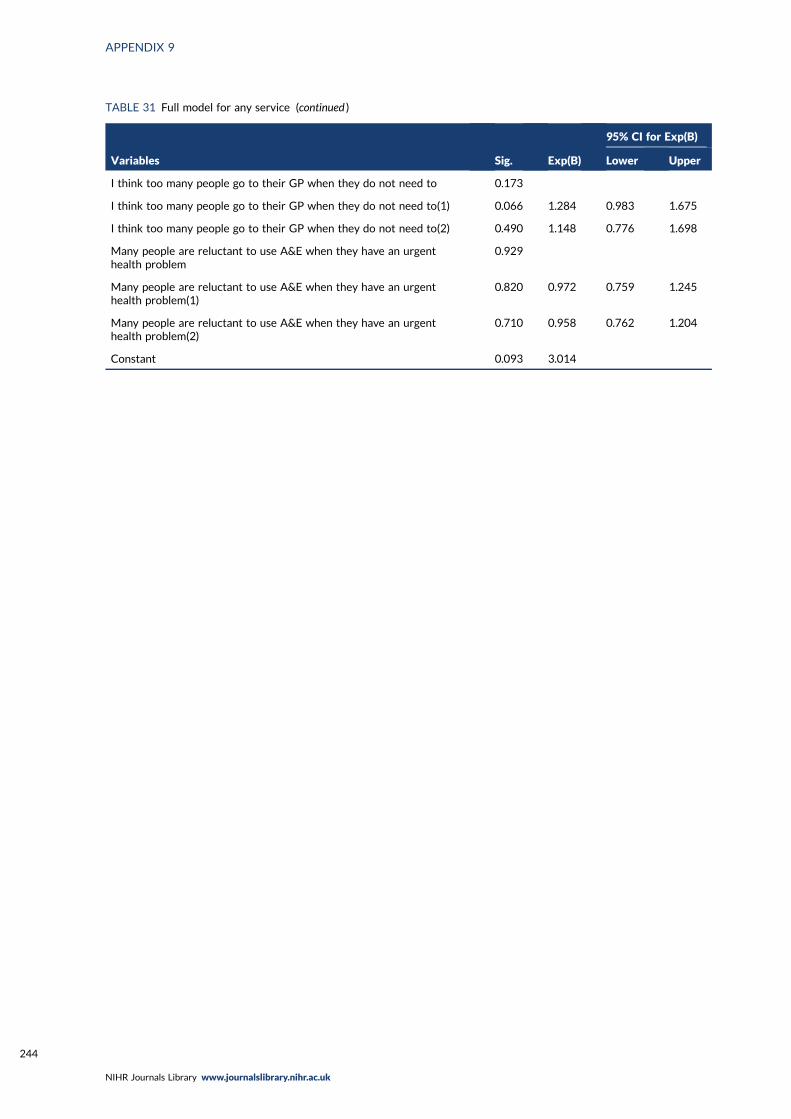
TABLE 31 Full model for any service (continued )
Variables Sig. Exp(B)
95% CI for Exp(B)
Lower Upper
I think too many people go to their GP when they do not need to 0.173
I think too many people go to their GP when they do not need to(1) 0.066 1.284 0.983 1.675
I think too many people go to their GP when they do not need to(2) 0.490 1.148 0.776 1.698
Many people are reluctant to use A&E when they have an urgenthealth problem
0.929
Many people are reluctant to use A&E when they have an urgenthealth problem(1)
0.820 0.972 0.759 1.245
Many people are reluctant to use A&E when they have an urgenthealth problem(2)
0.710 0.958 0.762 1.204
Constant 0.093 3.014
APPENDIX 9
NIHR Journals Library www.journalslibrary.nihr.ac.uk
244

Appendix 10 Integration grid
DOI: 10.3310/hsdr08150 Health Services and Delivery Research 2020 Vol. 8 No. 15
© Queen’s Printer and Controller of HMSO 2020. This work was produced by O’Cathain et al. under the terms of a commissioning contract issued by the Secretary of Statefor Health and Social Care. This issue may be freely reproduced for the purposes of private research and study and extracts (or indeed, the full report) may be included inprofessional journals provided that suitable acknowledgement is made and the reproduction is not associated with any form of advertising. Applications for commercialreproduction should be addressed to: NIHR Journals Library, National Institute for Health Research, Evaluation, Trials and Studies Coordinating Centre, Alpha House,University of Southampton Science Park, Southampton SO16 7NS, UK.
245

TABLE 32 Adapted triangulation protocol
Themes WP1 realist review WP2 qualitative interviews WP2 focus groups WP3 survey
Convergence,complementarity,disagreement, and silence
PT1 Uncertaintycausing anxiety
When there is uncertaintysurrounding symptoms (M)because they do not fit withpeople’s expectations or priorexperience (e.g. last longer, aremore severe, are unfamiliar ordo not respond to self-care inthe expected timescale) (C/M),this increases the perceivedrisk that the problem may beserious (M) and an immediateneed to establish what is wrongand obtain reassurance (M).This concern prompts the useof the ED (O), where it isperceived that the mostappropriate resources andexpertise required to establishcause can be accessed quickly(C), often in the context oftimely or satisfactory answersnot having been received fromprimary care services (C)
l Some people were anxiousabout things but other wereconcerned rather thananxious. Meaning andseriousness of symptoms.Could be serious but alsofeel unlikely to be seriousbut . . . (YP, PAR)
l Need for reassurance (PAR)l Anxious exacerbated by
mental health (DEP)
Yes Tendency to useambulance, GP and anyservice
Convergence
APPENDIX
10
NIH
RJournals
Library
www.jo
urnalslib
rary.nihr.ac.u
k
246

Themes WP1 realist review WP2 qualitative interviews WP2 focus groups WP3 survey
Convergence,complementarity,disagreement, and silence
PT2 Previoustraumatic event
When people have experienceof previous traumatic healthincidents (e.g. delayed help-seeking leading to seriousconsequences), or haveawareness of such incidentsexperienced by others or in themedia (C), they have increasedanxiety and awareness ofdanger (C/M) and reducedconfidence in their ownjudgement (M). They aretherefore unwilling to take riskswhen a health problem arises(M), leading them to seekimmediate help and advicefrom an expert in the form ofemergency care, includingambulance services and EDs (O)
l Part of PT1, contributingto anxiety
l Events for others as wellas themselves (YP) andgeneral issue about childhealth results in lowerthreshold for seekingreassurance (PAR)
– No Disagreement: may simplybe part of PT1, no supportfor this in survey but reviewhighlights that people maynot be aware of it. Also didwe measure it well enoughin the survey?
PT3 Responsibilityfor others
When people are in a positionof responsibility for others theyare less willing to take riskswith someone else’s health thanwith their own, and fear theconsequences (e.g. distress/guilt, dismissal, litigation) (M)of not doing ‘the right thing’.This leads them to seek or torecommend seeking urgentcare, particularly the ED (O)
l Key driver for parents ofyoung children (PAR)
l Also there for older peopleand older children (DEP)
l ‘They can change quickly’relates to vulnerablechildren and older people
Yes l Children have highertendency 37–42% vs.adults 1.5–30%in vignettes
l Not tested in regression
Some convergence: stronglypresent for parents ofyoung children
continued
DOI:10.3310/hsdr08150
Health
Servicesan
dDelivery
Research
2020
Vol.8
No.1
5
©Queen
’sPrin
teran
dContro
llerofHMSO
2020.T
hiswork
was
produced
byO’Cath
ainet
al.under
theterm
sofaco
mmissio
ningco
ntract
issued
bytheSecretary
ofState
forHealth
andSo
cialCare.T
his
issuemay
befreely
reproduced
forthepu
rposes
ofprivate
researchan
dstu
dyan
dextracts
(orindeed
,thefullrepo
rt)may
beinclu
ded
inpro
fessional
journals
provid
edthat
suitab
leackn
owled
gemen
tis
mad
ean
dtherepro
ductio
nis
notasso
ciatedwith
anyform
ofad
vertising.
Applicatio
nsforco
mmercial
reproductio
nshould
bead
dressed
to:NIH
RJournals
Library,
Natio
nal
Institu
teforHealth
Research
,Evalu
ation,Trials
and
Studies
Coordinatin
gCen
tre,Alph
aHouse,
University
ofSo
utham
ptonScien
cePark,So
utham
ptonSO
167NS,U
K.
247

TABLE 32 Adapted triangulation protocol (continued )
Themes WP1 realist review WP2 qualitative interviews WP2 focus groups WP3 survey
Convergence,complementarity,disagreement, and silence
PT4 Inability tofunction normally
When people are preventedthem from undertakingtheir normal lives, roles orresponsibilities (e.g. paid work,child care) (C), this creates aneed to get back to normalquickly (M), to get on withtheir lives and discharge theirresponsibilities. This promptsuse of urgent care (O) becauseit can resolve a problem quicklyby being both more accessibleand more efficient thanalternatives (C)
l YP will not wait (PT6)because of need tofunction normally
l Addition: anticipation of lostfunctioning too
Yes l As functioningdecreases, percentagemaking ‘clinicallyunnecessary’ useincreases
l Tendency higher forED and any service
Convergence
PT5 Need forimmediate painrelief
When people are in pain ordiscomfort which they findintolerable (C/M), and theybelieve or experience that noprimary care appointments areavailable within an acceptabletime period (C), they seek carefrom a more urgent service –
usually the ED (O) – because ofa need to obtain prompt relieffrom their distress (M)
l Part of not wanting to delayfurther (YP, DEP)
l Driver for ED and 999 (DEP)l Unwillingness to medicate for
a couple of people (DEP, PAR)
Pharmacists offer freeprescriptions not justGPs (DEP)
No Some convergence but notsupported by survey.However, we did notmeasure this well
APPENDIX
10
NIH
RJournals
Library
www.jo
urnalslib
rary.nihr.ac.u
k
248

Themes WP1 realist review WP2 qualitative interviews WP2 focus groups WP3 survey
Convergence,complementarity,disagreement, and silence
PT6 Delayedalready so cannotwait longer
When people delay seekingprimary care treatment (forvarious reasons, includingdeliberation and indecision,cost of treatment, lack oftransport, complex livingsituations, mistrust of healthservices and workresponsibilities) (C), they wait,often using self-help measures,and hope that the situationwill improve or go away (C).The condition reaches a ‘tippingpoint’ where either it is nolonger tolerable (M) or othercircumstances force a decision(M), and people feel theycannot wait any longer (M).At this point, if a primary careservice is unavailable to them(C), they feel they have nochoice but to use an emergencyservice (O)
l Strong driver for YP +DEP.There for parents too; theywait and self-care and thenconcern about possible fastescalation drives need forreassurance immediately
l Pain drove this (DEP)l Addition: YP trying to get
long-term issue resolved andjust fed up. Almost like thefrustration of PT10 but notabout access
Yes Not tested in regression Some convergence but nottested in regression
continued
DOI:10.3310/hsdr08150
Health
Servicesan
dDelivery
Research
2020
Vol.8
No.1
5
©Queen
’sPrin
teran
dContro
llerofHMSO
2020.T
hiswork
was
produced
byO’Cath
ainet
al.under
theterm
sofaco
mmissio
ningco
ntract
issued
bytheSecretary
ofState
forHealth
andSo
cialCare.T
his
issuemay
befreely
reproduced
forthepu
rposes
ofprivate
researchan
dstu
dyan
dextracts
(orindeed
,thefullrepo
rt)may
beinclu
ded
inpro
fessional
journals
provid
edthat
suitab
leackn
owled
gemen
tis
mad
ean
dtherepro
ductio
nis
notasso
ciatedwith
anyform
ofad
vertising.
Applicatio
nsforco
mmercial
reproductio
nshould
bead
dressed
to:NIH
RJournals
Library,
Natio
nal
Institu
teforHealth
Research
,Evalu
ation,Trials
and
Studies
Coordinatin
gCen
tre,Alph
aHouse,
University
ofSo
utham
ptonScien
cePark,So
utham
ptonSO
167NS,U
K.
249

TABLE 32 Adapted triangulation protocol (continued )
Themes WP1 realist review WP2 qualitative interviews WP2 focus groups WP3 survey
Convergence,complementarity,disagreement, and silence
PT7 Complex/stressful lives andinability to cope
When people are alreadyexperiencing significant stresseswhich impact on the internaland external resourcesavailable to them (money, time)(C) they have less capacity tocope with the additionalchallenge of a new or changedhealth problem. Symptoms aretherefore likely to triggeremotional distress, includingfeelings of loss of control andhelplessness (M), leading themto use emergency servicesbecause this is less burdensomethan making an appointmentwith a GP. This is more likely tooccur when people cannoteasily or quickly access aprimary care service (C)
l Complex lives. YP+DEP:impact of poor mental healthcreated difficulty coping,stress caused by workexacerbated health problem,need easy option of busylives (YP)
l Limited resources (YP)l Less obvious for parents:
single parent with no car,add in time of night. Butparents could feel worndown by frequentlysick child
l Social isolation (DEP)
l Yesl Improve provision of
mental health services(YP)
l Specialist mental healthED (YP)
l Improve mental healthliteracy (YP)
Tendency for ambulance,ED, GP and any service
l Complementarity: mentalhealth is a major stressorfor young people anddeprived communities
l Convergence: strongsupport for this PT fromall sources
PT8 Compliance:following advice oftrusted others
When people are anxious orconcerned about a healthproblem and have sought theadvice of trusted others (C),either in their social network(e.g. family) or healthprofessionals (particularlyprimary care staff), and havebeen advised to seek urgentcare, particularly the ED (M),they are likely to then usethose emergency services (O)
Featured for YP, with lots ofshared decision-making (YP)
Social network norms aboutattending ED (YP, PAR)
Yes Features in a number ofthe univariate analysesbut not the multivariable
Convergence but not as oneof the strongest drivers
APPENDIX
10
NIH
RJournals
Library
www.jo
urnalslib
rary.nihr.ac.u
k
250

Themes WP1 realist review WP2 qualitative interviews WP2 focus groups WP3 survey
Convergence,complementarity,disagreement, and silence
PT9 Availability andquality of service
When people have individualexperience or knowledge,or cultural beliefs about thediffering quality or availabilityof primary and emergencyservices [e.g. primary careoffering inadequate diagnosisand care or discrimination(US context only)], or EDshaving better resources,expertise or more thoroughcare (C), they are likely tochoose emergency care,particularly the ED (O) inwhich they have more trustand confidence (M)
l Positive speed andtransportation of 999,positive ED having diagnostictools and speed, perceptionsand experiences ofservices (YP)
l ED has specialists (PAR)l Familiarity with ED (PAR)l Negative GP because not
dealing with on-goingproblem (YP) or poor quality(DEP, PAR), including GPOOH (PAR)
l Positive GP becausecontinuity of care (YP)or best place andrelationship (DEP)
Yes Tendency for ED based onattraction of ED ratherthan problems with GP
Some disagreement: review,interviews and focus groupsshow unhappiness with GPbut it is attraction of EDthat explains tendency
PT10 Frustrationwith access to GP
When people are unable toobtain an appointment with aprimary care practitioner (C/M)this can further exacerbate thefeelings of anxiety and causepanic (M). Individuals canexperience feelings offrustration (M), mistrust (M),and the perception of anuncaring service (M), feelingthey have no other choice (M)but to contact an emergencyservice (O)
l Could not get appointmentand found system of gettingappointment hard (DEP, PAR)
l Positive access to GP forchildren only (PAR)
l Dichotomy of same-dayor booked appointmentweeks ahead a realproblem (DEP). Whatabout an appointmentin 2 days’ time?
l Want GP outside officehours (YP, DEP)
Did not explain tendency l Complementarity: focusgroups explain that theappointment system andthe types of appointmentsoffered are problematic,not just about not beingable to get one
l Some disagreement:why did access to a GPappointment notcontribute to theregressions? Is thisbecause people have toexperience this in practicerather than in theory?
continued
DOI:10.3310/hsdr08150
Health
Servicesan
dDelivery
Research
2020
Vol.8
No.1
5
©Queen
’sPrin
teran
dContro
llerofHMSO
2020.T
hiswork
was
produced
byO’Cath
ainet
al.under
theterm
sofaco
mmissio
ningco
ntract
issued
bytheSecretary
ofState
forHealth
andSo
cialCare.T
his
issuemay
befreely
reproduced
forthepu
rposes
ofprivate
researchan
dstu
dyan
dextracts
(orindeed
,thefullrepo
rt)may
beinclu
ded
inpro
fessional
journals
provid
edthat
suitab
leackn
owled
gemen
tis
mad
ean
dtherepro
ductio
nis
notasso
ciatedwith
anyform
ofad
vertising.
Applicatio
nsforco
mmercial
reproductio
nshould
bead
dressed
to:NIH
RJournals
Library,
Natio
nal
Institu
teforHealth
Research
,Evalu
ation,Trials
and
Studies
Coordinatin
gCen
tre,Alph
aHouse,
University
ofSo
utham
ptonScien
cePark,So
utham
ptonSO
167NS,U
K.
251

TABLE 32 Adapted triangulation protocol (continued )
Themes WP1 realist review WP2 qualitative interviews WP2 focus groups WP3 survey
Convergence,complementarity,disagreement, and silence
Other drivers
Awareness ofservices
Lack of awareness ofalternatives appeared in somereviews and articles but notstrongly enough to be a PT
l Not aware of MIU (YP)l Might not be aware of
them (DEP)
l Educate about use ofNHS 111 and GP OOH,and what pharmacistsand NHS 111 actuallydo (PAR, YP, DEP)
l Advertise alternativesin places people go, nothealth settings (YP)
Awareness of how tocontact GP OOH explainstendency to use anyservice
Some disagreement. Bigtopic of conversation in thefocus groups but did notfeature strongly in othercomponents. Is this becauseit is not a strong driver?
Problems withother services suchas NHS 111, WICand MIU
– Did not necessarily likealternatives (DEP)
l Improve skills ofpractitioners in WICs(DEP)
l Improve NHS 111 toreduce questions askedby linking to notes (DEP)
l Improve space inpharmacy forconsultation (DEP)
l Pharmacists offer freeprescriptions not justGPs (DEP)
l Language assistanceoutside ED (PAR)
l Specialist GP forchildren (PAR)
l Proactive engagementfrom health visitors(PAR)
l More child-friendlyWIC (PAR)
– The focus groups identifieddetails about this issue eventhough in the interviews weasked why they did not usealternatives
APPENDIX
10
NIH
RJournals
Library
www.jo
urnalslib
rary.nihr.ac.u
k
252

Themes WP1 realist review WP2 qualitative interviews WP2 focus groups WP3 survey
Convergence,complementarity,disagreement, and silence
Recursivity: learntbehaviour
In qualitative study aboutchronic conditions
l 999 (YP)l Could work via family/friends
not just selfl Parents had been to ED and
liked it there (PAR)
Tendency to use ED, GPand any service
l Convergence: people getvalidation from servicesthat they have done theright thing previously
l Complementarity: canalso see that it is not justtheir own experience butthat of family and friends
l Recursivity has widerimpact than identified inthe literature?
Health literacy Some evidence in recentquantitative publicationsabout EDs
l Difficult to see how healthliteracy score aligned withcontent of interview
l Reluctance to usemedication/knowledge aboutit (DEP and PAR)
l Improve ‘mental healthliteracy’ (YP)
l Improve ‘health serviceliteracy’ by educatingabout use of services inschool (YP)
Tendency to useambulance and GP
Some convergence butdifficult to see it in theinterviews
Recent use ofservices
– – – l Tendency to useambulance if have usedit recently, tendency touse any service if usedGP recently
l Frequency of serviceuse did not explaintendency
This factor was testedbecause we felt that peoplewho had used servicesrecently would base theirvignette answers onexperience. It could explaintendency because peopleare ill, or this could berelated to recursivity in thatit is easier to use it a secondtime if use recently?
continued
DOI:10.3310/hsdr08150
Health
Servicesan
dDelivery
Research
2020
Vol.8
No.1
5
©Queen
’sPrin
teran
dContro
llerofHMSO
2020.T
hiswork
was
produced
byO’Cath
ainet
al.under
theterm
sofaco
mmissio
ningco
ntract
issued
bytheSecretary
ofState
forHealth
andSo
cialCare.T
his
issuemay
befreely
reproduced
forthepu
rposes
ofprivate
researchan
dstu
dyan
dextracts
(orindeed
,thefullrepo
rt)may
beinclu
ded
inpro
fessional
journals
provid
edthat
suitab
leackn
owled
gemen
tis
mad
ean
dtherepro
ductio
nis
notasso
ciatedwith
anyform
ofad
vertising.
Applicatio
nsforco
mmercial
reproductio
nshould
bead
dressed
to:NIH
RJournals
Library,
Natio
nal
Institu
teforHealth
Research
,Evalu
ation,Trials
and
Studies
Coordinatin
gCen
tre,Alph
aHouse,
University
ofSo
utham
ptonScien
cePark,So
utham
ptonSO
167NS,U
K.
253

TABLE 32 Adapted triangulation protocol (continued )
Themes WP1 realist review WP2 qualitative interviews WP2 focus groups WP3 survey
Convergence,complementarity,disagreement, and silence
Attitudes towardshealth servicemisuse
A couple of quantitative articlesidentified population views ofthis, showing high levels ofagreement about misuse
– Educate or punishoffenders and misusers(YP, DEP)
People who do not thinkservices are misusedtend to be ‘clinicallyunnecessary’ users inunivariate analyses for allthe services but may becorrelated with othervariables because doesnot appear in most of themultivariable regressions
Not enough informationabout this but certainlyworth exploring further
Convenience Appears frequently in differentreviews
l Proximity of living or workingnear ED makes this easyoption (YP)
l 999 is transportation toED (YP)
l Proximity to GP makes thiseasy option (YP)
l Poverty (YP)l Could also be impatience
and disorganised life (YP)
Co-locate services in localareas (DEP)
Not explicitly addressed PT4 and PT7 could appearto be convenience, andinterviewees may giveaccounts of beingappropriate users, but littleevidence of misuse forconvenience. Cost of travelis an issue for people withlittle money
Digital use – l Could cause anxiety (YP, DEP)l Consulted websites (PAR)
Develop app to directpeople to best care (YP)
Lack of access to theinternet increasedtendency to useambulance
Not many findings aboutthis but could be exploredfurther as an intervention(e.g. NHS 111 Online)
Time of day/day ofweek
Evident in some reviews l Lack of support at night(YP, PAR)
l Not wanting to wait untilweekend in case it gotworse – anticipation (PAR)
GP wanted outside officehours (YP, DEP)
No real differencebetween Wednesday andSaturday in child vignettes
l Disagreement: onreflection should havehad middle of the night inone of the vignettes?
l Certainly there as adriver but not astrong one?
APPENDIX
10
NIH
RJournals
Library
www.jo
urnalslib
rary.nihr.ac.u
k
254

Themes WP1 realist review WP2 qualitative interviews WP2 focus groups WP3 survey
Convergence,complementarity,disagreement, and silence
Population subgroups
Young people Nothing in qualitative studiesbut identified as non-urgentusers of EDs in quantitativestudies
See above See above l More likely to havesome of the 10 PTs
l Does not explaintendency
Disagreement
Parents l Identified as ‘clinicallyunnecessary’ users of EDand GP in our review
l Appear strongly in PT3, PT4,PT7 and PT9
See above See above l More likely to havesome of the 10 PTs
l Does not explaintendency
Disagreement
Deprivation/socialclass/car ownership
l May be ‘clinically unnecessary’users of services but mixedevidence
l Appear strongly in PT7
See above See above l More likely to havesome of the 10 PTs
l Does not explaintendency except forambulance where lackof resources including acar are significant
Disagreement for ED andGP
Ethnicity Mixed findings in reviews andquantitative studies
– – BAME consistentlyexplains ‘clinicallyunnecessary’ use of allservices
Relies on survey to showBAME consistently explains‘clinically unnecessary’ useof all services
Age – – – Those aged > 65 yearsmore likely to contact GP;those aged 55–74 yearsmore likely to contact EDfor a child
Relies on survey to showthat older people havehigher tendency for someservices in some situations
Sex Mixed findings in reviews andquantitative studies
– – Males consistently havehigher tendency foremergency services, notfor GPs
Relies on survey to show thatmales consistently havehigher ‘clinically unnecessary’use of emergency services
continued
DOI:10.3310/hsdr08150
Health
Servicesan
dDelivery
Research
2020
Vol.8
No.1
5
©Queen
’sPrin
teran
dContro
llerofHMSO
2020.T
hiswork
was
produced
byO’Cath
ainet
al.under
theterm
sofaco
mmissio
ningco
ntract
issued
bytheSecretary
ofState
forHealth
andSo
cialCare.T
his
issuemay
befreely
reproduced
forthepu
rposes
ofprivate
researchan
dstu
dyan
dextracts
(orindeed
,thefullrepo
rt)may
beinclu
ded
inpro
fessional
journals
provid
edthat
suitab
leackn
owled
gemen
tis
mad
ean
dtherepro
ductio
nis
notasso
ciatedwith
anyform
ofad
vertising.
Applicatio
nsforco
mmercial
reproductio
nshould
bead
dressed
to:NIH
RJournals
Library,
Natio
nal
Institu
teforHealth
Research
,Evalu
ation,Trials
and
Studies
Coordinatin
gCen
tre,Alph
aHouse,
University
ofSo
utham
ptonScien
cePark,So
utham
ptonSO
167NS,U
K.
255
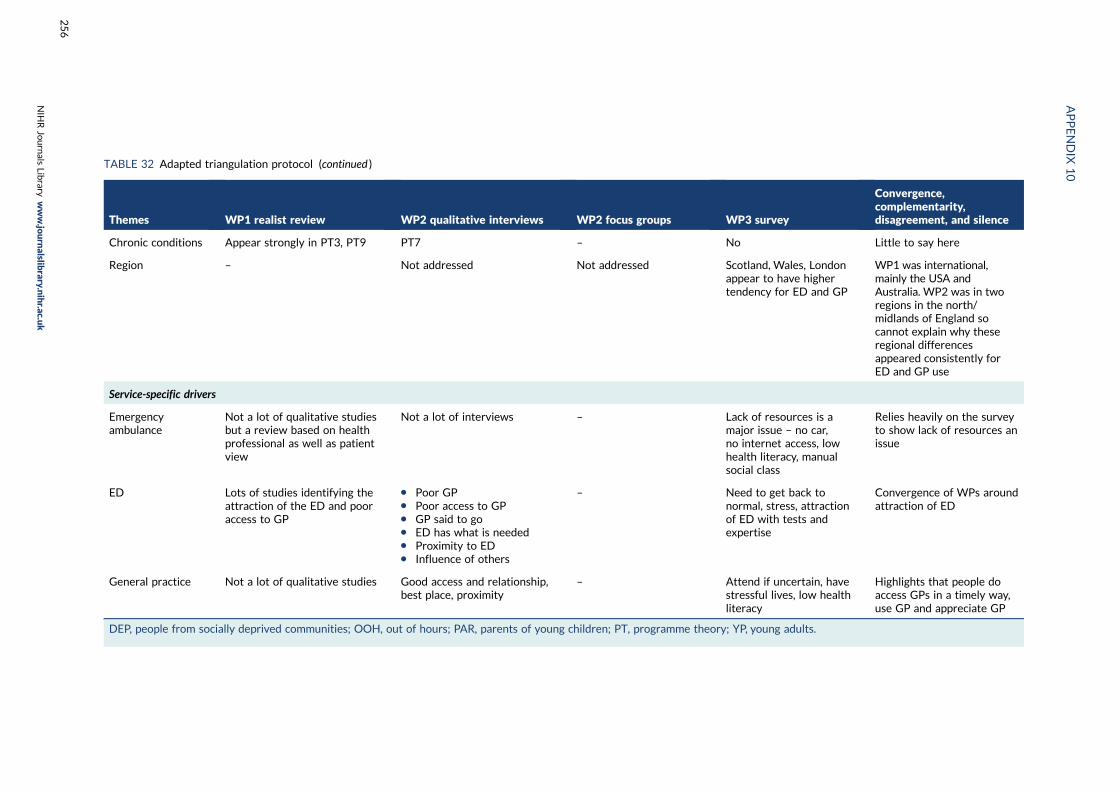
TABLE 32 Adapted triangulation protocol (continued )
Themes WP1 realist review WP2 qualitative interviews WP2 focus groups WP3 survey
Convergence,complementarity,disagreement, and silence
Chronic conditions Appear strongly in PT3, PT9 PT7 – No Little to say here
Region – Not addressed Not addressed Scotland, Wales, Londonappear to have highertendency for ED and GP
WP1 was international,mainly the USA andAustralia. WP2 was in tworegions in the north/midlands of England socannot explain why theseregional differencesappeared consistently forED and GP use
Service-specific drivers
Emergencyambulance
Not a lot of qualitative studiesbut a review based on healthprofessional as well as patientview
Not a lot of interviews – Lack of resources is amajor issue – no car,no internet access, lowhealth literacy, manualsocial class
Relies heavily on the surveyto show lack of resources anissue
ED Lots of studies identifying theattraction of the ED and pooraccess to GP
l Poor GPl Poor access to GPl GP said to gol ED has what is neededl Proximity to EDl Influence of others
– Need to get back tonormal, stress, attractionof ED with tests andexpertise
Convergence of WPs aroundattraction of ED
General practice Not a lot of qualitative studies Good access and relationship,best place, proximity
– Attend if uncertain, havestressful lives, low healthliteracy
Highlights that people doaccess GPs in a timely way,use GP and appreciate GP
DEP, people from socially deprived communities; OOH, out of hours; PAR, parents of young children; PT, programme theory; YP, young adults.
APPENDIX
10
NIH
RJournals
Library
www.jo
urnalslib
rary.nihr.ac.u
k
256

EMEHS&DRHTAPGfARPHRPart of the NIHR Journals Librarywww.journalslibrary.nihr.ac.uk
This report presents independent research funded by the National Institute for Health Research (NIHR). The views expressed are those of the author(s) and not necessarily those of the NHS, the NIHR or the Department of Health and Social Care
Published by the NIHR Journals Library
Copyright © 2022 FDOKUMEN