A permeation-diffusion-reaction model of gas transport in cellular tissue of plant materials
10
Journal of Experimental Botany, Vol. 57, No. 15, pp. 4215–4224, 2006 doi:10.1093/jxb/erl198 Advance Access publication 3 November, 2006 RESEARCH PAPER A permeation–diffusion–reaction model of gas transport in cellular tissue of plant materials Q. Tri Ho 1, *, Bert E. Verlinden 1 , Pieter Verboven 1 , Stefan Vandewalle 2 and Bart M. Nicolaı ¨ 1 1 BIOSYST-MeBioS, Faculty of Bioscience Engineering, Katholieke Universiteit Leuven, Willem de Croylaan 42, B-3001 Leuven, Belgium 2 Scientific Computing Research Group, Computer Science Department, Katholieke Universiteit Leuven, Celestijnenlaan 200A, B-3001 Leuven, Belgium Received 18 May 2006; Accepted 12 September 2006 Abstract Gas transport in fruit tissue is governed by both diffusion and permeation. The latter phenomenon is caused by overall pressure gradients which may develop due to the large difference in O 2 and CO 2 diffusivity during controlled atmosphere storage of the fruit. A measurement set-up for tissue permeation based on unsteady-state gas exchange was devel- oped. The gas permeability of pear tissue was de- termined based on an analytical gas transport model. The overall gas transport in pear tissue samples was validated using a finite element model describing simultaneous O 2 , CO 2 , and N 2 gas transport, taking into account O 2 consumption and CO 2 production due to respiration. The results showed that the model described the experimentally determined permeability of N 2 very well. The average experimentally determined values for permeation of skin, cortex samples, and the vascular bundle samples were (2.1761.71)310 219 m 2 , (2.3561.96)310 219 m 2 , and (4.5163.12)310 217 m 2 , respectively. The permeation–diffusion–reaction model can be applied to study gas transport in intact pears in relation to product quality. Key words: Controlled atmosphere, diffusion, gas transport, measurement set-up, modelling, permeation, storage, Pyrus communis. Introduction Gas exchange plays a fundamental role in biological plant materials. Gas transport is caused by differences in gas composition between the applied external atmosphere and the internal atmosphere due to O 2 consumption and CO 2 production during respiration and fermentation (Kader, 1988). In fruit tissue, the gas-filled intercellular spaces are thought to be the main pathways for gas transport through plant organs needed for respiration. Several methods have been developed to measure the gas transport properties of various horticultural commodities (Cameron and Yang, 1982; Banks, 1985) for which it was assumed that the skin was the only barrier to gas diffusion and the fruit internal gas concentration was constant. This assumption does not hold for all types of commodities, especially not for fruit with a high tissue density (Banks and Kays, 1988; Lammertyn et al., 2003a). Due to barriers between the ambient atmosphere and the cells, where respiration takes place, considerable gas gradients between the external and internal atmospheres may occur (Rajapakse et al., 1990; Lammertyn et al., 2003a). Some controlled atmos- phere storage disorders such as core breakdown in pear have been related to limited gas transport inside the fruit (Lammertyn et al., 2003a, b). Gas transport in fruit and other bulky storage organs have macroscopically been described with Fick’s laws of diffusion, assuming an effective diffusion process which is driven by concentration gradients (Burg and Burg, 1965; Cameron and Yang, 1982; Banks, 1985). During gas exchange, O 2 in the gas phase diffuses through the skin of the fruit followed by diffusion in the intercellular system of pore spaces. Subsequently, O 2 exchange between the intercellular atmosphere and the cellular solution occurs through the cell membrane. Finally, the O 2 diffuses within the cytoplasm to the point of O 2 consumption. Respiratory CO 2 follows the reverse path. The rate of gas movement * To whom correspondence should be addressed. E-mail: [email protected] ª The Author [2006]. Published by Oxford University Press [on behalf of the Society for Experimental Biology]. All rights reserved. For Permissions, please e-mail: [email protected] by guest on February 24, 2016 http://jxb.oxfordjournals.org/ Downloaded from
Transcript of A permeation-diffusion-reaction model of gas transport in cellular tissue of plant materials

Journal of Experimental Botany, Vol. 57, No. 15, pp. 4215–4224, 2006
doi:10.1093/jxb/erl198 Advance Access publication 3 November, 2006
RESEARCH PAPER
A permeation–diffusion–reaction model of gas transport incellular tissue of plant materials
Q. Tri Ho1,*, Bert E. Verlinden1, Pieter Verboven1, Stefan Vandewalle2 and Bart M. Nicolaı1
1 BIOSYST-MeBioS, Faculty of Bioscience Engineering, Katholieke Universiteit Leuven, Willem de Croylaan 42,B-3001 Leuven, Belgium2 Scientific Computing Research Group, Computer Science Department, Katholieke Universiteit Leuven,Celestijnenlaan 200A, B-3001 Leuven, Belgium
Received 18 May 2006; Accepted 12 September 2006
Abstract
Gas transport in fruit tissue is governed by both
diffusion and permeation. The latter phenomenon
is caused by overall pressure gradients which may
develop due to the large difference in O2 and CO2
diffusivity during controlled atmosphere storage of
the fruit. A measurement set-up for tissue permeation
based on unsteady-state gas exchange was devel-
oped. The gas permeability of pear tissue was de-
termined based on an analytical gas transport model.
The overall gas transport in pear tissue samples was
validated using a finite element model describing
simultaneous O2, CO2, and N2 gas transport, taking
into account O2 consumption and CO2 production due
to respiration. The results showed that the model
described the experimentally determined permeability
of N2 very well. The average experimentally determined
values for permeation of skin, cortex samples, and
the vascular bundle samples were (2.1761.71)310219
m2, (2.3561.96)310219 m2, and (4.5163.12)310217 m2,
respectively. The permeation–diffusion–reaction model
can be applied to study gas transport in intact pears in
relation to product quality.
Key words: Controlled atmosphere, diffusion, gas transport,
measurement set-up, modelling, permeation, storage, Pyrus
communis.
Introduction
Gas exchange plays a fundamental role in biological plantmaterials. Gas transport is caused by differences in gas
composition between the applied external atmosphere and
the internal atmosphere due to O2 consumption and CO2
production during respiration and fermentation (Kader,
1988). In fruit tissue, the gas-filled intercellular spaces are
thought to be the main pathways for gas transport through
plant organs needed for respiration. Several methods have
been developed to measure the gas transport properties
of various horticultural commodities (Cameron and Yang,
1982; Banks, 1985) for which it was assumed that the
skin was the only barrier to gas diffusion and the fruit
internal gas concentration was constant. This assumptiondoes not hold for all types of commodities, especially not
for fruit with a high tissue density (Banks and Kays, 1988;
Lammertyn et al., 2003a). Due to barriers between the
ambient atmosphere and the cells, where respiration takes
place, considerable gas gradients between the external
and internal atmospheres may occur (Rajapakse et al.,1990; Lammertyn et al., 2003a). Some controlled atmos-
phere storage disorders such as core breakdown in pear
have been related to limited gas transport inside the fruit
(Lammertyn et al., 2003a, b).Gas transport in fruit and other bulky storage organs
have macroscopically been described with Fick’s laws of
diffusion, assuming an effective diffusion process which
is driven by concentration gradients (Burg and Burg, 1965;
Cameron and Yang, 1982; Banks, 1985). During gas
exchange, O2 in the gas phase diffuses through the skin of
the fruit followed by diffusion in the intercellular system
of pore spaces. Subsequently, O2 exchange between the
intercellular atmosphere and the cellular solution occurs
through the cell membrane. Finally, the O2 diffuses within
the cytoplasm to the point of O2 consumption. Respiratory
CO2 follows the reverse path. The rate of gas movement
* To whom correspondence should be addressed. E-mail: [email protected]
ª The Author [2006]. Published by Oxford University Press [on behalf of the Society for Experimental Biology]. All rights reserved.For Permissions, please e-mail: [email protected]
by guest on February 24, 2016http://jxb.oxfordjournals.org/
Dow
nloaded from

depends on the properties of the gas molecules and thephysical properties of the intervening barriers (Kader,1988; Nobel, 1991). Development of the theory that con-nects the microscopic to the macroscopic description ofmass transport in biological materials has been subjectedto several investigations (Wood and Whitaker, 1998;Wood et al., 2002; Quintard et al., 2006). In these studies,the transport on the microscale was volume-averaged toa macroscopic equation containing effective parametersfor the macroscopic properties of the biological materials.Recently, a macroscopic reaction–diffusion model for themacroscopic level that incorporates both gas diffusion andrespiration was found appropriate for calculating the gastransport inside the fruit (Mannapperuma et al., 1991;Lammertyn et al., 2003a, b). Effective diffusion propertiesof the fruit were determined by measuring the concen-tration of gas exchange between two chambers of a meas-urement set-up separated by a tissue slice (Lammertynet al., 2001; Schotsmans et al., 200, 2004; Ho et al.,2006a). The results showed that the CO2 diffusivity of thetissue was much higher than O2 diffusivity. It washypothesized that CO2 is not only transported in the gasphase but also in the water phase from cell to cell, due toits high solubility in the solution, while O2 is mainlytransported in the gas phase of the gas-filled intercellularspaces. If the CO2 diffusivity is higher than that of O2, theproduced CO2 leaves the fruit at higher rates than O2 isentering the fruit. This would lead to a pressure differencebetween the internal parts of the fruit and the externalatmosphere. Therefore, besides gas diffusion driven byconcentration gradients, gas transport in the fruit occursby permeation due to total pressure gradients in thefruit tissues.Gas permeation can be defined as the transport process
in a porous medium in which the gas flow is described byDarcy’s law (Geankoplis, 1993; Bird et al., 2002). In fruittissue, the intercellular space existing within a highlycomplicated network of gaseous channels can be con-sidered as such a porous medium. Several authors havestudied the gas diffusion properties of fruit tissue; however,gas permeation in fruit has only received attention in earlywork of the 1960s (Marcellin, 1974) A further complicationcaused by small pressure gradients is the flow of N2 whichmay contribute on the alleviation of this gradient. Pressurechanges inside packages filled with horticultural produce,due to O2, CO2, and N2 transport in relation to packageshrinkage, were described by Talasila and Cameron (1997).However, with the exception of the model of Schotsmanset al. (2003) for gas transport, no models reported in theliterature include transport of N2 in fruit tissue.The objectives of this paper are (i) to determine gas
permeation properties of pear tissue, (ii) to determine N2
diffusivity in pear tissue, and (iii) to expand existingdiffusion models for O2 and CO2 transport in fruit withN2 and permeation transport.
Materials and methods
Materials
Pears (Pyrus communis L. cv. ‘Conference’) were harvested on 8September 2004 at the preclimacteric stage at the Fruitteeltcentrum(Rillaar, Belgium), cooled, and stored according to commercialprotocols for a period of 21 d at –0.5 �C preceding CA storage(2.5 kPa O2, 0.7 kPa CO2 at –0.5 �C) until they were used for theexperiments.Pear flesh samples were first cut with a professional slice cutter
(EH 158-L, Graef, Germany), subsequently small cylinders witha diameter of 24 mm were cut with a cork borer. The thickness ofthe sample was measured with a digital caliper (Mitutoyo Ltd., UK,accuracy 60.01 mm) and ranged from 1–2 mm. For the skinsamples, a razor blade was used to remove the flesh until a thicknessof less than 1 mm was obtained. Cortex tissue samples were takenin the radial direction at the equatorial region of the pear and in thevertical axis, containing vascular bundles. Because a pear has anasymmetric shape, large gradients in gas concentration were notexpected in the two tangential directions perpendicular to the radialdirection inside the fruit. It is, therefore, not important to know thegas transport properties in these directions accurately. A schematicview of the sampling protocol is given in Fig. 1.
Model of gas transport in pear tissue
Flux of gas transport: A mass flux of a gas component j (mol m�2
s�1) describing the diffusion and permeation processes through thepear tissue samples is given by
j ¼ Cuþ jd ð1Þ
with C (mol m�3) the concentration of gas, u (m s�1) the apparentvelocity vector, and jd (mol m�2 s�1) the flux of gas diffusionthrough a barrier of tissue. In equation (1), the first term of the righthand side is the mass flow carried in the bulk flow of the fluid dueto permeation, while the second term results from a concentrationgradient (Fick’s law).Permeation through the tissue by a pressure gradient can be
described by Darcy’s law for laminar flow in porous media (Birdet al., 2002).
u ¼ �K
l=P ð2Þ
with K (m2) the permeation coefficient, P (Pa) the pressure, l(Pa s�1) the viscosity of the gas, = ðm�1Þ the gradient operator.
Fig. 1. Schematic view of sampling protocol.
4216 Ho et al.
by guest on February 24, 2016http://jxb.oxfordjournals.org/
Dow
nloaded from

For laminar flow in porous media such as tissue, permeationcoefficients can be determined empirically and are usually consid-ered to be independent of the gas passing the tissue.The gas diffusion through the tissue can be approximated by
Fick’s first law of diffusion (Bird et al., 2002), which states that theflux of a gas diffusing through a barrier of tissue jd is proportionalto the concentration gradient over this barrier, =C ðmolm�4Þ withthe effective diffusion coefficient D (m2 s�1) acting as a proportion-ality coefficient
jd ¼ �D=C ð3Þ
Representative elemental volume: The tissue structure of the fruit isa combination of cells, cell walls, and intercellular spaces. A rep-resentative elemental volume (REV) of the tissue is considered tocontain two phases, namely the intracellular liquid phase of the cellsand cell walls and the air-filled intercellular space (Fig. 2). Thevolume fraction of the intercellular space is assigned a value e, theporosity of the tissue. Assuming local equilibrium at a certainconcentration of the gas component i in the gas phase Ci,g (molm�3), the concentration of the compound in the liquid phase of fruittissue normally follows Henry’s law. If the tissue has a porosity e,the volume-averaged concentration Ci,tissue (mol m�3) of species i isthen defined as:
Ci;tissue ¼ eCi;g þ ð1� eÞRTH iCi;g ð4Þ
with Hi (mol m�3 kPa�1) Henry’s constant of component i (i is O2,CO2, or N2), R the universal gas constant (8.314 J mol�1 K�1), andT (K) the temperature.From this definition, the following property of the tissue is
derived
ai ¼ eþ ð1� eÞRTHi ¼Ci;tissue
Ci;gð5Þ
The parameter ai is called the gas capacity of the component i in thetissue.
Gas transport equation in tissue: On the microscale, gas transportby diffusion and permeation in the intercellular spaces and diffu-sion and respiration in the cellular liquid phase were considered.Transport of gas i in those two phases is governed by the followingequations
e@Ci;g
@tþ =ðeugCi;gÞ ¼ =ðeDi;gÞ=Ci;g ð6Þ
ð1� eÞ @Ci;l
@t¼ =
�ð1� eÞDi;j
�=Ci;l þ ð1� eÞRi;l ð7Þ
with Ci,g (mol m�3) the concentration of i in the gas phase, Di,g
(m2 s�1) the diffusion coefficient in the gas phase, ug (m s�1) thevelocity vector in the gas phase of tissue, Ci,l (mol m�3) theconcentration of i in the liquid phase, Di,l (m
2 s�1) the diffusioncoefficient in the liquid phase of tissue, Ri,l (mol m�3 s�1) therespiration rate (mol m�3 s�1) and t (s) the time.Since gas transfer in the intercellular spaces was considered to be
in equilibrium with the liquid phase of the cells, the mass transport ofcomponent i in the liquid phase in equation (7) could be rewritten as
ð1� eÞRTHi
@Ci;g
@t¼ =
�ð1� eÞðDi;lRTHiÞ
�=Ci;g þ ð1� eÞRi;l ð8Þ
Adding equations (6) and (8) yields a single volume-averagedtransport equation over the REV:
ðeþ ð1� eÞRTHiÞ@Ci;g
@tþ =ðeugCi;gÞ
¼ =ðeDi;g þ ð1� eÞDi;lRTHiÞ=Ci;g
þ ð1� eÞRi;l ð9Þ
Using the effective diffusivity Di (m2 s�1), the effective per-meation velocity vector u (m s�1) and the effective respiration termRi (mol m�3 s�1) of the tissue, respectively, defined by
Di ¼ eDi;g þ ð1� eÞDi;jRTHi ð10Þ
u ¼ eug ð11Þ
Ri ¼ ð1� eÞRi;l ð12Þ
one obtains
ai@Ci;g
@tþ =ðuCi;gÞ ¼ =Di=Ci;g þ Ri ð13Þ
with the boundary condition:
Ci;b ¼ Ci;N ð14Þ
Ci,b (mol m�3) and Ci,N (mol m�3) are the concentration of gas iat the boundary surface of tissue and the external condition,respectively.Permeation was described using Darcy’s law (equation 2). The
relation between the concentration C and pressure P can beexpressed by using the ideal gas law P¼CRT. Therefore, equation(2) can be rewritten as follows
u ¼ � KRT
l=�+Ci;g
�ð15Þ
The estimation of permeation coefficient K and the effectivediffusivity will be discussed in the next section. The respiration oftissue was described by Ho et al. (2006a).
Measurement of gas transport parameters
Measurement set-up: The system used to measure gas transportproperties of fruit tissue consisted of two chambers (measurementchamber and flushing chamber) separated by a disc-shaped tissuesample (Fig. 3; Ho et al., 2006a). The chambers were metal
Fig. 2. A representative elemental volume of tissue. The symbol e isthe porosity of the tissue, Ci,g (mol m�3) and Ci,l (mol m�3) are theconcentration of specie i in the gas and liquid phases, respectively.
A gas transport model 4217
by guest on February 24, 2016http://jxb.oxfordjournals.org/
Dow
nloaded from

cylinders screwed together, holding a PVC ring containing a tissuesample glued on it with cyano-acrylate glue. A rubber O ring wasused to seal the PVC ring between the two chambers and to ensurethat all gas transport between the two chambers took place throughthe tissue sample. Two inlet and outlet gas channels were used toflush the gases in the measurement chamber and flushing chamber.Pressure sensors (PMP 4070, GE Druck, Germany, accuracy60.04%) monitored the pressure changes in each chamber duringthe measurements. The temperature of the system was kept cons-tant at 20.060.5 �C by submerging the set-up in a temperature-controlled water bath (F10-HC, Julabo Labor Technik GmbH,Seelbach, Germany, accuracy 60.5 �C). The preparation of thesamples was described by Ho et al. (2006a). The sealing ofchambers was checked and validated before the experiments byrapidly changing the temperature of the water bath. When the pres-sure inside the measurement chamber increased correspondinglythis indicated proper sealing.
Diffusion coefficients of O2, CO2, and N2: Data of diffusioncoefficients of respiratory gasses (O2 and CO2) were reported byHo et al. (2006b), the diffusivity of N2 was measured with the sameset-up described by Ho et al. (2006a, b). Once the sample wasattached to the diffusion cell, the measurement and the flushingchambers were flushed with, respectively, 70 kPa N2, 30 kPa O2,95 kPa N2, and 5 kPa O2, at 10 l h�1, humidified, and passedthrough a heat exchanger to prevent the sample from drying andcooling down while flushing the two chambers. After 30 min, thein- and outlet valves of the measurement chamber were closed, andthe decrease in O2 partial pressure and total pressure of themeasurement chamber was monitored for 6 h. The O2 concentrationwas measured in the measurement chamber with fluorescent opticalprobes (Foxy-Resp, Ocean Optics, Duiven, The Netherlands). Thedifference in total pressure between the two chambers was loggedand was kept smaller than 1.5 kPa to minimize permeation. The
(second) permeation term was correspondingly omitted in equation(13); the CO2 production was negligible for this case. The N2
concentration was determined indirectly from the total pressure andthe O2 concentration. DO2
and DN2were estimated by fitting the
solution of the transport equation (13) for O2 and N2 to themeasured concentration profiles in the measurement chamber.Equation (13) was solved numerically according to the proceduredescribed in Ho et al. (2006a). The CO2 diffusivity was availablefrom previous experiments (Ho et al., 2006b). RO2
was set to�2.47310�4 mol m�3 s�1 (Ho et al., 2006a).
Permeation coefficient: In the permeation experiment, the measure-ment and the flushing chambers were flushed with nitrogen at 10 lh�1, humidified, and passed through a heat exchanger to preventthe sample from drying and cooling down while flushing the twochambers. Nitrogen gas was used in the experiment as it has nophysiological activity so that the source term RN2
vanishes fromequation (13). The pressure in the measurement set-up was adjustedto get a 6 kPa pressure difference between the measurementand flushing chambers. The total pressure difference between thetwo chambers was not higher than 7 kPa, to prevent mechanicaldeformation and even damage of the tissue which would falsify theresults. Finally, the in- and outlet valves of the measurement chamberwere closed, and the decrease in pressure of the measurementchamber was monitored for at least 4 h.Because of the absence of O2, there was no transport of this gas
in the experiment. Similarly, based on some preliminary simulationsit was found that the CO2 production through fermentation was alsonegligible, so that transport of CO2 could be omitted as well. Forthis particular measurement set-up, a lumped mass balance of a onecomponent gas (N2) in the measurement chamber could be used inone-dimensional form as follows:
V@C
@tþ Aj ¼ 0 ð16Þ
with V (m3), the volume of the measurement chamber, A (m2) thesurface of the tissue area, t (s) time. Note that the vector quantitiesnow become scalar quantities in one dimension. Substitutingequation (1) into equation (16) yields
V@C
@tþ CuxA ¼ �Ajd ð17Þ
with ux (m s�1) the apparent velocity of gas in the x-directionthrough the tissue sample based on the total cross-section of thesample. The x-direction was chosen perpendicular to the samplesurface and pointing from the measurement to the flushing chamber.Clearly, C decreases when ux is positive (permeation flow from themeasurement chamber to the flushing chamber) and when thediffusive flux is negative.The relation between the concentration C and pressure P can be
found from the ideal gas law. Equation (3) can then be rewritten inone dimension as follows
jd ¼ �D@C
@x¼ � D
RT
@P
@xð18Þ
Permeation through the tissue by a pressure gradient can bededuced for one-dimensional laminar flow in porous media asfollows
ux ¼ �K
l@P
@xð19Þ
The gradient of total pressure can be approximated as thedifference in total pressure between two chambers over a barrierwhich is the sample with a thickness L (m).
Fig. 3. Schematic of the measurement set-up for tissue diffusivity andpermeability measurements. The set-up consists of two chambers(measurement chamber and flushing chamber) separated by a disc-shaped tissue sample. A gas partial pressure gradient is established byflushing the measurement and flushing chamber by different gasmixtures.
4218 Ho et al.
by guest on February 24, 2016http://jxb.oxfordjournals.org/
Dow
nloaded from
@P
@X¼ Pf � PðtÞ
Lð20Þ
with Pf (kPa), the constant pressure in the flushing chamber, andP(t) (kPa) the pressure in the measurement chamber at the time t.Substitution of equation (20) into equations (18) and (19),
respectively, and substituting the results into equation (17) yields
V@PðtÞ@t
¼�Pf � PðtÞ
��KAlL
PðtÞ þ AD
L
�ð21Þ
The analytical solution of equation (21) describing the pressurechange in the measurement chamber P(t) (kPa) with the time t (s)then is
PðtÞ ¼Pf þ Dl
K
1��1� PfþDl
K
P0þDlK
�exp
�� AK
VLl
�Pf þ Dl
K
�t�� Dl
Kð22Þ
with Po (kPa) the initial pressure in the measurement chamber.The permeation K of the tissue was determined by fitting the
experimental data to equation (22) by using an iterative leastsquares estimation procedure written in MATLAB (The Mathworks,Inc., Natick, USA).
Validation experiments
The aforementioned experiments were used to determine perme-ation properties of the pear tissue by using only N2. However, airis a mixture of three main components: O2, CO2, and N2 and thegas transport in the tissue is a combination of diffusion andpermeation processes. Validation experiments were performed toverify whether the measured permeation properties could also beapplied to O2 and CO2. In addition, a gas transport model was usedto predict the effect of permeation on the estimation of diffusioncoefficient.For model validation purposes, an experiment was performed
with gradients applied such that transport of O2 and CO2 tookplace in the opposite direction. This experimental validation wasdone based on the diffusion experiment described by Ho et al.(2006a). In validation experiment 1 (measurement chamber 30 kPaO2, 0 kPa CO2, and 70 kPa N2; flushing chamber 5 kPa O2, 30 kPaCO2, and 65 kPa N2) and 2 (measurement chamber 20 kPa O2,5 kPa CO2, and 75 kPa N2; flushing chamber 10 kPa O2, 20 kPaCO2, and 70 kPa N2), the initial gas conditions were chosen suchthat there was pressure built-up in the measurement chamber. Invalidation experiment 3, gas conditions were such that the differencein total pressure between the two chambers remained smaller than1.5 kPa and permeation was negligible (measurement chamber30 kPa O2, 3 kPa CO2, and 67 kPa N2; flushing chamber 5 kPa O2,8 kPa CO2, and 87 kPa N2).Transport of O2, CO2, and N2 was described by means of the
convection diffusion model (equations 13 and 14) in whichpermeation through the barrier of tissue by the pressure gradient isdescribed by Darcy’s law (equation 15). The parameters of O2 andCO2 diffusion and respiration were described by Ho et al. (2006a).The porosity of the pear tissue was taken equal to 0.07 (Schotsmanset al., 2004). RO2
was set to –2.47310�4 mol m�3 s�1 and RCO2
was set equal to �0:95RO2(Ho et al., 2006a). The system (13) to
(15) of transport equations was solved by means of the finiteelement method. The measurement chamber and the sample tissuewere considered as two materials consisting of 20 1D linearelements each resulting in 41 nodes in total. The diffusioncoefficient of the gas molecules in air at 20 �C was set equal to6310�5 m2 s�1 (Lide, 1999). The discretization was carried out inthe Femlab 3.1 package (Comsol AB, Stockholm, Sweden). Moredetails can be found in Ho et al. (2006a).
Results
O2 and N2 diffusivities
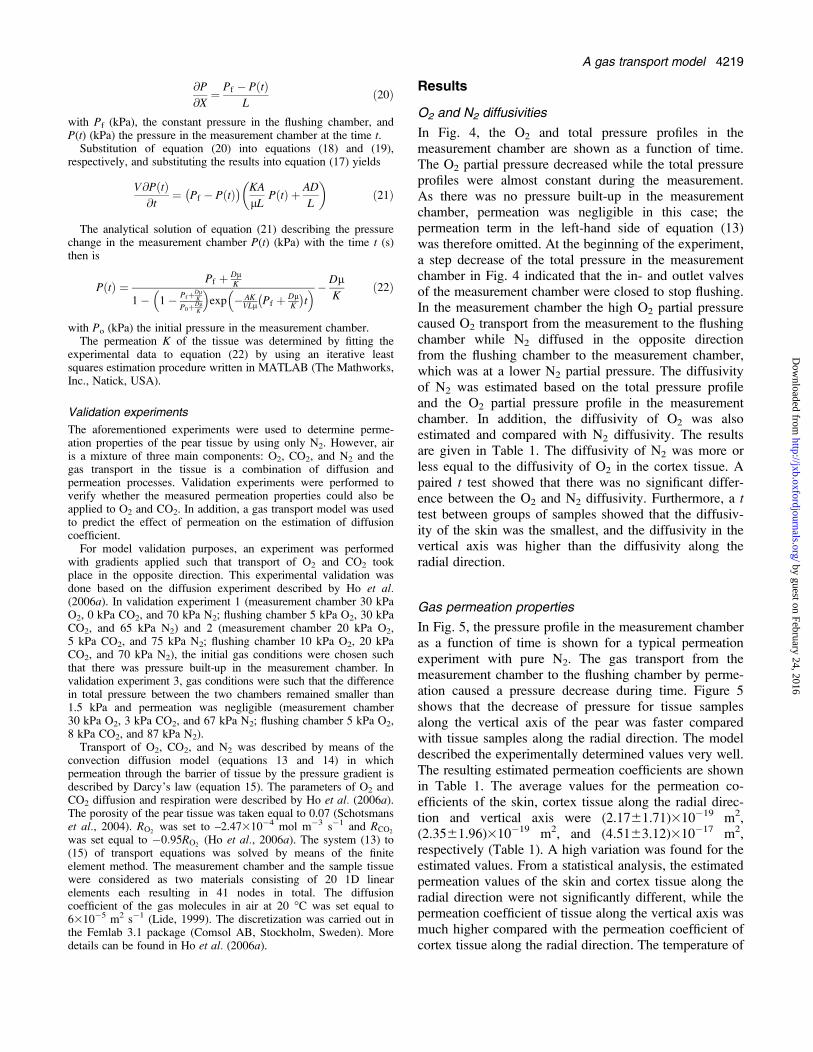
In Fig. 4, the O2 and total pressure profiles in themeasurement chamber are shown as a function of time.The O2 partial pressure decreased while the total pressureprofiles were almost constant during the measurement.As there was no pressure built-up in the measurementchamber, permeation was negligible in this case; thepermeation term in the left-hand side of equation (13)was therefore omitted. At the beginning of the experiment,a step decrease of the total pressure in the measurementchamber in Fig. 4 indicated that the in- and outlet valvesof the measurement chamber were closed to stop flushing.In the measurement chamber the high O2 partial pressurecaused O2 transport from the measurement to the flushingchamber while N2 diffused in the opposite directionfrom the flushing chamber to the measurement chamber,which was at a lower N2 partial pressure. The diffusivityof N2 was estimated based on the total pressure profileand the O2 partial pressure profile in the measurementchamber. In addition, the diffusivity of O2 was alsoestimated and compared with N2 diffusivity. The resultsare given in Table 1. The diffusivity of N2 was more orless equal to the diffusivity of O2 in the cortex tissue. Apaired t test showed that there was no significant differ-ence between the O2 and N2 diffusivity. Furthermore, a ttest between groups of samples showed that the diffusiv-ity of the skin was the smallest, and the diffusivity in thevertical axis was higher than the diffusivity along theradial direction.
Gas permeation properties
In Fig. 5, the pressure profile in the measurement chamberas a function of time is shown for a typical permeationexperiment with pure N2. The gas transport from themeasurement chamber to the flushing chamber by perme-ation caused a pressure decrease during time. Figure 5shows that the decrease of pressure for tissue samplesalong the vertical axis of the pear was faster comparedwith tissue samples along the radial direction. The modeldescribed the experimentally determined values very well.The resulting estimated permeation coefficients are shownin Table 1. The average values for the permeation co-efficients of the skin, cortex tissue along the radial direc-tion and vertical axis were (2.1761.71)310�19 m2,(2.3561.96)310�19 m2, and (4.5163.12)310�17 m2,respectively (Table 1). A high variation was found for theestimated values. From a statistical analysis, the estimatedpermeation values of the skin and cortex tissue along theradial direction were not significantly different, while thepermeation coefficient of tissue along the vertical axis wasmuch higher compared with the permeation coefficient ofcortex tissue along the radial direction. The temperature of
A gas transport model 4219
by guest on February 24, 2016http://jxb.oxfordjournals.org/
Dow
nloaded from
the set-up was also important since the total pressure inthe measurement chamber changed with temperature ac-cording to the ideal gas law. Small fluctuations of theexperimental values are due the fluctuation of the tem-perature during the measurement. A change of 0.5 �C intemperature gave an effect of about 0.17 kPa on the totalpressure in the measurement chamber.
Validation
In validation experiments 1 and 2, the initial gasconditions in the measurement chamber were chosen insuch a way that large CO2 concentration between the twochambers was created. Due to the larger diffusivity ofCO2 in cortex tissue compared with those of O2 and N2,a pressure rise was noticed during the measurement. Plots
of the measurement data, the simulation of gas transportwith permeation and without permeation are shown inFig. 6. At the beginning of the experiment, a step decreaseof the total pressure in the measurement chamber in Fig. 6indicated that the in- and outlet valves of the measurementchamber were closed off from flushing. Validation showedthat the model with permeation was more in agreementwith the experiment compared with the diffusion only.In validation experiment 3, the difference in total
pressure between the two chambers was smaller than 1.5kPa. A good agreement was found for both simulationsbetween measurements and model predictions (Fig. 6).The effect of the permeation term in the equation on thegas transport was small in this experiment. The simulatedprofile of the O2 partial pressure in the measurement
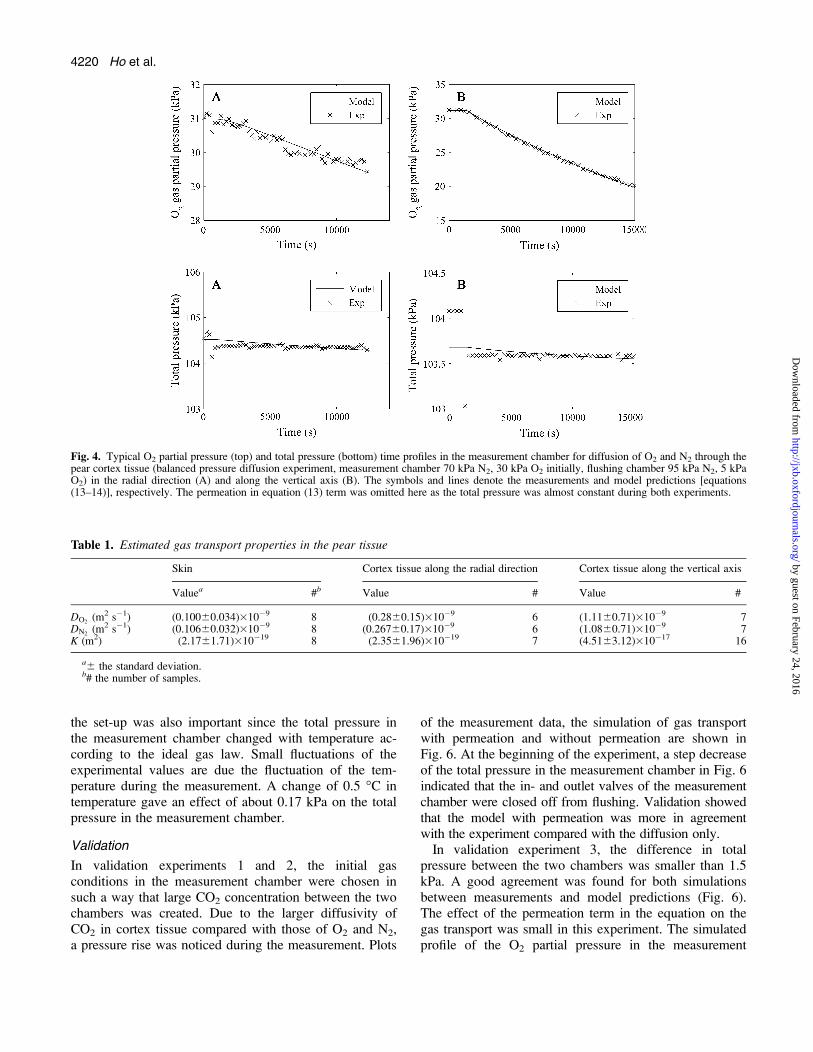
Fig. 4. Typical O2 partial pressure (top) and total pressure (bottom) time profiles in the measurement chamber for diffusion of O2 and N2 through thepear cortex tissue (balanced pressure diffusion experiment, measurement chamber 70 kPa N2, 30 kPa O2 initially, flushing chamber 95 kPa N2, 5 kPaO2) in the radial direction (A) and along the vertical axis (B). The symbols and lines denote the measurements and model predictions [equations(13–14)], respectively. The permeation in equation (13) term was omitted here as the total pressure was almost constant during both experiments.
Table 1. Estimated gas transport properties in the pear tissue
Skin Cortex tissue along the radial direction Cortex tissue along the vertical axis
Valuea #b Value # Value #
DO2(m2 s�1) (0.10060.034)310�9 8 (0.2860.15)310�9 6 (1.1160.71)310�9 7
DN2(m2 s�1) (0.10660.032)310�9 8 (0.26760.17)310�9 6 (1.0860.71)310�9 7
K (m2) (2.1761.71)310�19 8 (2.3561.96)310�19 7 (4.5163.12)310�17 16
a6 the standard deviation.b# the number of samples.
4220 Ho et al.
by guest on February 24, 2016http://jxb.oxfordjournals.org/
Dow
nloaded from

Fig. 5. Total pressure in the measurement chamber as a function of time (N2 permeation experiment) for cortex tissue in the radial direction (A) andalong the vertical axis (B). Symbols denote measurement and lines denote model predictions according to equation (22).
Fig. 6. Total pressure and O2 partial pressure profiles in the measurement chamber as a function of time for a sample of cortex tissue. Symbol ‘3’indicates measured data, symbol ‘o’ indicates the gas transport model prediction with diffusion and without permeation. The solid line (—) indicatesthe gas transport model prediction with diffusion as well as permeation taken into account. In validation experiment 1 and 2, the conditions werechosen such as to produce a total pressure difference between both chambers: in validation experiment 3 the conditions caused only a negligiblepressure difference.
A gas transport model 4221
by guest on February 24, 2016http://jxb.oxfordjournals.org/
Dow
nloaded from

chamber as a function of time in the diffusion modelcoincided with the diffusion model incorporating per-meation. The permeation term in the left-hand side of theequation (13) is not important in this case and gas permea-tion can be considered negligible for estimating diffusionparameters.The total pressure in the measurement chamber for the
three validation experiments is shown in Fig. 7. Variabil-ity between replicate measurements due to biologicalvariability is clearly visible. A good agreement was foundbetween the models and experiments with different initialgas conditions.
Discussion
O2 and N2 diffusivity
The results show that there was no significant differencebetween O2 and N2 diffusivity. During the whole ex-periment the total pressure drop over the sample was con-stant and very small to non-existent (<0.5 kPa). Becausethe experiment was done for binary gas mixtures, theconstant pressure in the measurement chamber impliedthat N2 molecules diffuse at the same rate in the oppositedirection to the O2 molecular diffusion. Further, O2 andN2 have a comparable and low solubility in water. There-fore, gas exchange through the tissue for O2 and N2 pro-bably happens through gas-filled intercellular space,where diffusion is the main mechanism.The results obtained in this research for the diffusivity of
O2 of the skin, cortex tissue along the radial direction, and
cortex tissue along the vertical direction were (0.160.034)310�9 m2 s�1, (0.2860.15)310�9 m2 s�1, and (1.1160.71)310�9 m2 s�1 while the diffusivity of N2 of the skin,cortex tissue along the radial direction, and cortex tissuealong the vertical direction were (0.10660.032)310�9 m2
s�1, (0.26760.17)310�9 m2 s�1, and (1.0860.71)310�9
m2 s�1. Measurement of the O2 and CO2 diffusivity by Hoet al. (2006b) showed that O2 diffusivities in the skin, cortextissue along the radial direction, and cortex tissue along thevertical direction was (0.18660.078)310�9 m2 s�1,(0.22260.037)310�9 m2 s�1, and (1.1160.72)310�9 m2
s�1 while the CO2 diffusivity in the skin, cortex tissuealong the radial direction, and cortex tissue along the verticaldirection was (0.50660.315)310�9 m2 s�1, (2.3260.21)310�9 m2 s�1, and (6.9763.79)310�9 m2 s�1. A goodagreement was found between the O2 diffusivity in thepresent experiment compared to the values reported by Hoet al. (2006b).Schotsmans et al. (2003) found that the O2 diffusivity
of cortex and skin after 3 months of storage were (0.3360.24)310�9 m2 s�1 and (0.4360.17)310�9 m2 s�1, res-pectively. In a more recent publication, the same authors(Schotsmans et al., 2004) found that O2 diffusivity in theflesh of ‘Jonica’ (52.8310�9 m2 s�1) and ‘Braeburn’(16.2310�9 m2 s�1) apples was much higher than that ofpear flesh tissue. Zhang and Bunn (2000) also foundsimilar O2 diffusivity values (18.1–19.0310�9 m2 s�1) fordifferent apple cultivars. We believe that the differences indiffusivity in fruit cultivars can be attributed to differencesin intercellular space volume. In this context, Schotsmanset al. (2004) showed that the intercellular space volume ofcortex tissue of ‘Jonica’ and ‘Braeburn’ apples was 16%and 10% while it was only 5–7% for ‘Conference’ pear.Ongoing research concentrates on multiscale models toprovide further evidence for this hypothesis.A higher diffusivity in the vertical axis compared with
the diffusivity along the radial direction was observed.While vascular bundles are filled with sap in intact plants,they may be not fully filled with sap during storage ofthe fruit as it typically loses water. It is, therefore, wellpossible that the vascular bundles along the axis ofthe pear indeed facilitate gas transport. Moreover, theorientation of the cells along the vertical axis could bedifferent from that of cells in the radial direction, andfurther difference in gas transport properties may be dueto enhanced interconnectivity of the gas intercellular spacealong the vertical axis compared with the radial direction.Sorz and Hietz (2006) also found that O2 diffusion inwood in axial direction was one to two orders of mag-nitude faster than in the radial direction.
Effect of gas permeation
The results indicate that estimated permeation values ofthe skin and cortex tissue in the radial direction were not
Fig. 7. Total pressure in the measurement chamber as a function oftime for samples of cortex tissue. Lines indicate model predictions ofthe total pressure including permeation; symbols denote measuredvalues (three replicate experiments). In validation experiments 1 and 2,the conditions were chosen such as to produce a total pressure dif-ference between both chambers: in validation experiment 3 the con-ditions caused only a negligible pressure difference.
4222 Ho et al.
by guest on February 24, 2016http://jxb.oxfordjournals.org/
Dow
nloaded from

significantly different while the permeation of tissue alongthe vertical axis was much higher compared with thepermeation in the cortex tissue in the radial direction. Thepermeation coefficient for the gas along the vertical axiswas high compared to the radial direction (Table 1). Thebulk gas transport along the vertical axis is probably facil-itated by means of better continuity of the gas filled spaces.The permeation coefficient of the tissue may contribute
to gas transport besides diffusion; the CO2 diffusivity ofthe tissue was higher than the O2 diffusivity (Marcellin,1974; Lammertyn et al., 2001; Schotsmans et al., 2003,2004; Ho et al., 2006a). The produced CO2, therefore,leaves the fruit at higher rates than O2 is entering the fruit.This may lead to a pressure difference between the insideof the fruit and the external atmosphere. A pressure risewas found in the measurement chamber in diffusion meas-urement for specific initial gas conditions (Ho et al.,2006a). In gas transport experiments with a mixture ofgases, for example gas diffusion in fruit, the total pressurechanges should be considered carefully, and if significant,permeation should be included. Because the O2 consump-tion rate and CO2 production rate were not the same inpear, permeation plays an important role in balancing thetotal pressure inside the fruit to the external environment.
Conclusion
A measurement set-up for gas permeation in fruit tissuebased on unsteady-state gas exchange was developed. Ananalytical model described the experimental estimatedpermeation well. Permeation coefficients of the skin andtissue along the radial direction were more or less equalwhile permeability in the vertical axis was higher thanalong the radial direction. The permeation–diffusion–reaction model can be applied to study the gas transportin whole intact fruit.While the model validation results were reasonably well
correlated, a discrepancy between measured gas concen-trations and model predictions remains. We believe thatthis is mainly due to the fact that, contrary to typical eng-ineering materials such as steel or brick, biological tissuecannot be considered as a continuum material because ofits cellular nature. A continuum model such as the oneproposed in this article should, therefore, be considered asphenomenological and the transport properties as appar-ent properties. Multiscale transport models are currentlybeing developed by the authors to quantify the cellularand intercellular pathways for gas transport and toimprove agreement further between measured and pre-dicted gas concentrations at the expense of much morecomputer resources.
Acknowledgements
The authors wish to thank the research council of the KULeuven (project IDO/00/008, OT 04/31) for financial support.
Acknowledgement is extended to the International RelationsOffice of the KU Leuven (IRO Scholarship). Pieter Verboven ispostdoctoral researcher of the Flemish fund for Scientific Research(FWO-Vlaanderen).
References
Banks NH. 1985. Estimating skin resistance to gas diffusionin apples and potatoes. Journal of Experimental Botany 36,1842–1850.
Banks NH, Kays SJ. 1988. Measuring internal gases andlenticel resistance to gas diffusion in potato tubers. Journalof the American Society of Horticultural Science 113,577–580.
Bird RB, Stewart RB, Lightfoot EN. 2002. Transport phenom-ena. New York: John Wiley & Sons.
Burg SP, Burg EA. 1965. Gas exchange in fruits. Plant Physiology18, 870–874.
Cameron AC, Yang SF. 1982. A simple method for the de-termination of resistance to gas diffusion in plant organs. PlantPhysiology 70, 21–23.
Geankoplis CJ. 1993. Transport processes and unit operations.Englewood Cliffs, New Jersey: Prentice-Hall Inc.
Ho QT, Verlinden BE, Verboven P, Vandewalle S, Nicolaı BM.2006a. Simultaneous measurement of oxygen and carbondioxide diffusivities in pear fruit tissue using optical sensors.Journal of the Science of Food and Agriculture (in press).
Ho QT, Verlinden BE, Verboven P, Nicolaı BM. 2006b. Gasdiffusion properties at different positions in the pear. PostharvestBiology and Technology 41, 113–120.
Kader AA. 1988. Respiration and gas exchange of vegetables. In:Weichmann J, ed. Postharvest physiology of vegetables. NewYork: Marcel Dekker Inc., 25–43.
Lammertyn J, Scheerlinck N, Jancsok P, Verlinden BE,Nicolaı BM. 2003a. A respiration–diffusion model for ‘Confer-ence’ pears. I. Model development and validation. PostharvestBiology and Technology 30, 29–42.
Lammertyn J, Scheerlinck N, Jancsok P, Verlinden BE,Nicolaı BM. 2003b. A respiration–diffusion model for ‘Confer-ence’ pears. II. Simulation and relation to core breakdown.Postharvest Biology and Technology 30, 43–55.
Lammertyn J, Scheerlinck N, Verlinden BE, Schotsmans W,Nicolaı BM. 2001. Simultaneous determination of oxygen dif-fusivity and respiration in pear skin and tissue. PostharvestBiology and Technology 23, 93–104.
Lide DR. 1999. Handbook of chemistry and physics. New York:CRC Press.
Mannapperuma JD, Sing RP, Montero ME. 1991. Simul-taneous gas diffusion and chemical reaction in foods stored inmodified atmospheres. Journal of Food Engineering 14,167–183.
Marcellin P. 1974. Conservation des fruits et legumes enatmosphere controllee, a l’aide de membranes de polymers.Revue Generale du Froid 3, 217–236.
Nobel PS. 1991. Physicochemical and environmental plant physi-ology. London: Academic Press Inc., 1–46.
Quintard M, Bletzacker L, Chenu D, Whitaker S. 2006.Nonlinear, multicomponent, mass transport in porous media.Chemical Engineering Science 61, 2643–2669.
Rajapakse NC, Banks NH, Hewett EW, Cleland DJ. 1990.Development of oxygen concentration gradients in flesh tissuesof bulky plant organs. Journal of the American Society forHorticultural Science 115, 793–797.
A gas transport model 4223
by guest on February 24, 2016http://jxb.oxfordjournals.org/
Dow
nloaded from
Schotsmans W, Verlinden BE, Lammertyn J, Nicolaı BM.2004. The relationship between gas transport properties andthe histology of apple. Journal of the Science of Food andAgriculture 84, 1131–1140.
Schotsmans W, Verlinden BE, Lammertyn J, Nicolaı BM.2003. Simultaneous measurement of oxygen and carbon diox-ide diffusivity in pear fruit tissue. Postharvest Biology andTechnology 29, 155–166.
Sorz J, Hietz P. 2006. Gas diffusion through wood: implicationsfor oxygen supply. Trees–Structure and Function 20, 34–41.
Talasila PC, Cameron AC. 1997. Free-volume changes in flexible,hermetic packages containing respiring produce. Journal of FoodScience 62, 659–664.
Wood BD, Quintard M, Whitaker S. 2002. Calculation ofeffective diffusivities for biofilms and tissues. Biotechnology andBioengineering 77, 495–516.
Wood BD, Whitaker S. 1998. Diffusion and reaction in biofilms.Chemical Engineering Science 53, 397–425.
Zhang J, Bunn JM. 2000. Oxygen diffusivities of apple flesh andskin. Transactions of the ASAE 43, 359–363.
4224 Ho et al.
by guest on February 24, 2016http://jxb.oxfordjournals.org/
Dow
nloaded from