A novel method for imaging internal growth patterns in marine mollusks: A fluorescence case study on...
9
673 Introduction The motivation to develop improved techniques to docu- ment and visualize growth patterns in bivalve shells originates from their great utility as environmental recorders (Richardson 2001). Bivalves are distributed globally, inhabit a wide variety of environments and water depths, and their fossilized shells are abundant and widely available through geologic time (e.g., Krantz et al. 1987). Bivalves are often well represented in archaeological sites, providing a powerful means for understanding past environments and cultures (e.g., Jones et al. 2005; Sandweiss et al. 2001). A number of bivalves are extremely long-lived, with lifetimes of many decades or even centuries, some of which include freshwater pearl mussels (Schöne et al. 2004), geoduck clams (Strom et al. 2004), ocean quahogs (Schöne et al. 2005a; Wanamaker et al. 2008a), and deepwater oysters (Wisshak et al. 2009), making them ideal candidates for environmental studies. Further, bivalves deposit growth bands/lines in their shells with a tidal to annual periodicity (Clark 1976; Jones 1980; Richardson 1989), therefore paleo-environmental reconstructions can be tempo- rally constrained with subseasonal to annual resolution. It has been shown that environmental conditions such as seawater temperature (Strom et al. 2004), air temperature (Schöne et al. 2004), productivity dynamics (Witbaard et al. 2003; Wana- maker et al. 2009), and dominant modes of atmospheric (Schöne et al. 2003) and oceanic circulation (Ambrose et al. 2006) may be reconstructed from bivalve growth records using sclerochronological methods. Sclerochronology is the broad study of the chemical compo- sition and physical structure of accretionary hard tissues of organisms (e.g., brachiopods, mollusks, corals, coralline algae, A novel method for imaging internal growth patterns in marine mollusks: A fluorescence case study on the aragonitic shell of the marine bivalve Arctica islandica (Linnaeus) Alan D. Wanamaker Jr. 1 *, Andy Baker 2 , Paul G. Butler 1 , Christopher A. Richardson 1 , James D. Scourse 1 , Iain Ridgway 1 , and David J. Reynolds 1 1 School of Ocean Sciences, College of Natural Sciences, Bangor University, Wales, LL59 5AB, United Kingdom 2 School of Geography, Earth and Environmental Sciences, University of Birmingham, Birmingham, B15 2TT, United Kingdom Abstract In this article, we explore the use of fluorescence spectroscopy to image growth patterns in the marine bivalve Arctica islandica (L.). The method presented here does not require any chemical treatment of the pol- ished shell section and yields results comparable to acetate peels of acid-etched shell sections and Mutvei- treated shell sections. Further, our results indicate that the annual growth lines in A. islandica fluoresce in the blue light spectrum (450–490 nm), thus an ultraviolet source (mercury lamp) is not required. The reflected light entering the digital camera was filtered (510–540 nm) and later enhanced to emphasize the annual growth patterns. The fluorescence of annual growth lines was consistent among the four animals used in this study. Additionally, we measured growth increments in the umbo section of one A. islandica shell using both the traditional acetate method and fluorescence imaging. The two sets of measurements were highly corre- lated (r = 0.97; P < 0.0001). We suggest that the fluorescence imaging method presented here is a viable option for increment identification and measurement in this key marine archive. It is likely that the meth- ods demonstrated here for A. islandica can easily be used/modified for other bivalve (mollusk) taxa. Fluorescence microscopy permits rapid analysis of shell growth patterns with minimal pretreatment and offers an objective method of determination of annual growth increments and lines. *Corresponding author: E-mail: [email protected]; Present Address: Department of Geological and Atmospheric Sciences, Iowa State University, Ames, IA 50011-3212, USA Acknowledgments This research is funded by EU Millennium (European Climate of the Last Millennium; Project no. 017008) and resulted from an Arctica islandica workshop held at the Gregynog Conference Centre, Wales in 2007. JDS acknowledges a Royal Society-Leverhulme Trust Senior Research Fellowship. We are grateful for helpful suggestions from three anonymous reviewers. Limnol. Oceanogr.: Methods 7, 2009, 673–681 © 2009, by the American Society of Limnology and Oceanography, Inc. LIMNOLOGY and OCEANOGRAPHY: METHODS
Transcript of A novel method for imaging internal growth patterns in marine mollusks: A fluorescence case study on...
673
Introduction
The motivation to develop improved techniques to docu-ment and visualize growth patterns in bivalve shells originatesfrom their great utility as environmental recorders (Richardson2001). Bivalves are distributed globally, inhabit a wide varietyof environments and water depths, and their fossilized shellsare abundant and widely available through geologic time(e.g., Krantz et al. 1987). Bivalves are often well representedin archaeological sites, providing a powerful means for
understanding past environments and cultures (e.g., Jones etal. 2005; Sandweiss et al. 2001). A number of bivalves areextremely long-lived, with lifetimes of many decades or evencenturies, some of which include freshwater pearl mussels(Schöne et al. 2004), geoduck clams (Strom et al. 2004), oceanquahogs (Schöne et al. 2005a; Wanamaker et al. 2008a), anddeepwater oysters (Wisshak et al. 2009), making them idealcandidates for environmental studies. Further, bivalvesdeposit growth bands/lines in their shells with a tidal toannual periodicity (Clark 1976; Jones 1980; Richardson 1989),therefore paleo-environmental reconstructions can be tempo-rally constrained with subseasonal to annual resolution. It hasbeen shown that environmental conditions such as seawatertemperature (Strom et al. 2004), air temperature (Schöne et al.2004), productivity dynamics (Witbaard et al. 2003; Wana-maker et al. 2009), and dominant modes of atmospheric(Schöne et al. 2003) and oceanic circulation (Ambrose et al.2006) may be reconstructed from bivalve growth records usingsclerochronological methods.
Sclerochronology is the broad study of the chemical compo-sition and physical structure of accretionary hard tissues oforganisms (e.g., brachiopods, mollusks, corals, coralline algae,
A novel method for imaging internal growth patterns in marinemollusks: A fluorescence case study on the aragonitic shell of themarine bivalve Arctica islandica (Linnaeus)Alan D. Wanamaker Jr.1*, Andy Baker2, Paul G. Butler1, Christopher A. Richardson1, James D. Scourse1, Iain Ridgway1, and David J. Reynolds1
1School of Ocean Sciences, College of Natural Sciences, Bangor University, Wales, LL59 5AB, United Kingdom2School of Geography, Earth and Environmental Sciences, University of Birmingham, Birmingham, B15 2TT, United Kingdom
AbstractIn this article, we explore the use of fluorescence spectroscopy to image growth patterns in the marine
bivalve Arctica islandica (L.). The method presented here does not require any chemical treatment of the pol-ished shell section and yields results comparable to acetate peels of acid-etched shell sections and Mutvei-treated shell sections. Further, our results indicate that the annual growth lines in A. islandica fluoresce in theblue light spectrum (450–490 nm), thus an ultraviolet source (mercury lamp) is not required. The reflectedlight entering the digital camera was filtered (510–540 nm) and later enhanced to emphasize the annualgrowth patterns. The fluorescence of annual growth lines was consistent among the four animals used in thisstudy. Additionally, we measured growth increments in the umbo section of one A. islandica shell using boththe traditional acetate method and fluorescence imaging. The two sets of measurements were highly corre-lated (r = 0.97; P < 0.0001). We suggest that the fluorescence imaging method presented here is a viableoption for increment identification and measurement in this key marine archive. It is likely that the meth-ods demonstrated here for A. islandica can easily be used/modified for other bivalve (mollusk) taxa.Fluorescence microscopy permits rapid analysis of shell growth patterns with minimal pretreatment andoffers an objective method of determination of annual growth increments and lines.
*Corresponding author: E-mail: [email protected];Present Address: Department of Geological and Atmospheric Sciences,Iowa State University, Ames, IA 50011-3212, USA
AcknowledgmentsThis research is funded by EU Millennium (European Climate of the
Last Millennium; Project no. 017008) and resulted from an Arcticaislandica workshop held at the Gregynog Conference Centre, Wales in2007. JDS acknowledges a Royal Society-Leverhulme Trust SeniorResearch Fellowship. We are grateful for helpful suggestions from threeanonymous reviewers.
Limnol. Oceanogr.: Methods 7, 2009, 673–681© 2009, by the American Society of Limnology and Oceanography, Inc.
LIMNOLOGYand
OCEANOGRAPHY: METHODS

sclerosponges, otoliths, statoliths) and the temporal context inwhich they formed (e.g., see 1st International SclerochronologyConference, 2007 Jul 17–21, St. Petersburg, Florida, U.S.A.,http://conference.ifas.ufl.edu/sclerochronology/; also seeOschmann 2009). Sclerochronology can be considered theaquatic counterpart of dendrochronology. Often, sclerochrono-logical techniques are used to develop a master chronostratigra-phy within biogenic carbonates, which is then used as a tem-plate for growth and geochemical analysis (Weidman et al.1994; Hendy et al. 2003; Delong et al. 2007; Halfar et al. 2008).It has been demonstrated that master shell chronologies (Wit-baard et al. 1997; Marchitto et al. 2000; Scourse et al. 2006;Helama et al. 2006; 2007; Butler et al. 2009a) can be developedon a level consistent with dendrochronological studies. In par-ticular, shell-based records from the very long-lived bivalve Arc-tica islandica can be absolutely dated like tree rings (Thompsonet al. 1980; Jones 1980), enabling the generation of ultra-high-resolution and multicentennial paleoenvironmental recordsbased on an absolute timescale (Butler et al. 2009a). Theserecords have the potential to provide significant histories ofmarine environmental change, and to serve as a basis to docu-ment natural and anthropogenic change in key regions aroundthe globe (Wanamaker et al. 2008a, 2008b). The ocean quahog(A. islandica L.), whose remarkable longevity has been found toexceed 400 years (Wanamaker et al. 2008a), is found along thecontinental shelves in the mid-to-high latitudes in the NorthAtlantic in water depths of <20 m to more than 200 m(Cargnelli et al. 1999). The usefulness of this proxy in ecosystemand ocean/climate studies is well established (e.g., Weidmanand Jones 1993; Weidman et al. 1994; Marchitto et al. 2000;Witbaard et al. 2003; Schöne et al. 2003; 2005a; Scourse et al.2006; Helama et al. 2007; Wanamaker et al. 2008a; 2008b;2008c; Wanamaker et al. 2009; Butler et al. 2009a), and it islikely that A. islandica will be further established as a key marinearchive from the North Atlantic (e.g., Schöne et al. 2005a;Wanamaker et al. 2008c) that will facilitate improved docu-mentation and interpretation of recent and past environmentaland climatic change.
With the exception of shell thin sections, which are oftendifficult and time consuming to prepare, imaging of growthpatterns in bivalves generally require that a polished sectionof the shell surface be treated or etched with an acid toenhance the microshell structure (see Ropes 1984; Schöne etal. 2005b). In many cases, an acetate peel replica is made ofthe etched shell surface (Ropes 1984), placed on a microscopeslide and then photographed. Additionally, if geochemicalsampling (isotopes, minor and trace elements) is necessary, asecond shell section would be required. More recently, treat-ment of biogenic carbonates with Mutvei’s solution (a mixtureof acetic acid, glutaraldehyde, and alcian blue; see Schöne etal. 2005b) has allowed the sectioned surface to be pho-tographed without making an acetate peel. For many workers,the Mutvei method greatly improved their ability to visualizeand interpret the growth record, but the acetate peel method
and the Mutvei method both have some minor disadvantages.The acetate peel can introduce noise (blurring) unrelated tothe growth record, or it may be unable to replicate adequatelythe physical structure of the increments. Treatment withMutvei’s solution is slightly destructive to the shell over time(especially if re-etching is required), and the shell surfacescratches easily after it is etched. Although the Mutvei methodhas been very useful in highlighting growth lines/structures, itrequires the use of glutaraldehyde (a respiratory toxin) to fixthe organics in the shell structure. An ideal method of imag-ing biogenic growth structures would dispense with the needto treat the polished shell section with chemicals and createreplicates of the surface using acetate peels.
Here, we image the annual growth increments in fourspecimens of the marine bivalve Arctica islandica (L.) usingfluorescence microscopy. Fluorescence microscopy is a widelyused technique in both geological and biological sciences(Isdale 1984; Scoffin et al. 1989; Baker et al. 1998, 1999; Proc-tor et al. 2000; Charman et al. 2001; Hendy et al. 2003). Typ-ical components of a fluorescence microscope are the lightsource (typically xenon or mercury lamps), an excitation fil-ter, a beam splitter, and an emission filter. The filters andbeam splitter are chosen to match the spectral excitation andemission characteristics of the fluorescent material being ana-lyzed. This fluorescent material may be intrinsic to the sam-ple under analysis (e.g., natural organic matter preserved ingeological materials such as stalagmites (Baker et al. 1993)and particulate organic matter in sedimentary deposits (Hart1986),or it may be an artificially added fluorophore (e.g., flu-orescent dyes or probes used to tag DNA; for example in flu-orescent in-situ hybridization; Wilkinson 1999). In this arti-cle, we investigate the use of fluorescence microscopy as asuitable alternative to chemical-etching techniques as amethod of imaging the internal growth patterns of polishedshell sections of A. islandica.
Methods and proceduresThe four A. islandica shells used in this study (WG060329,
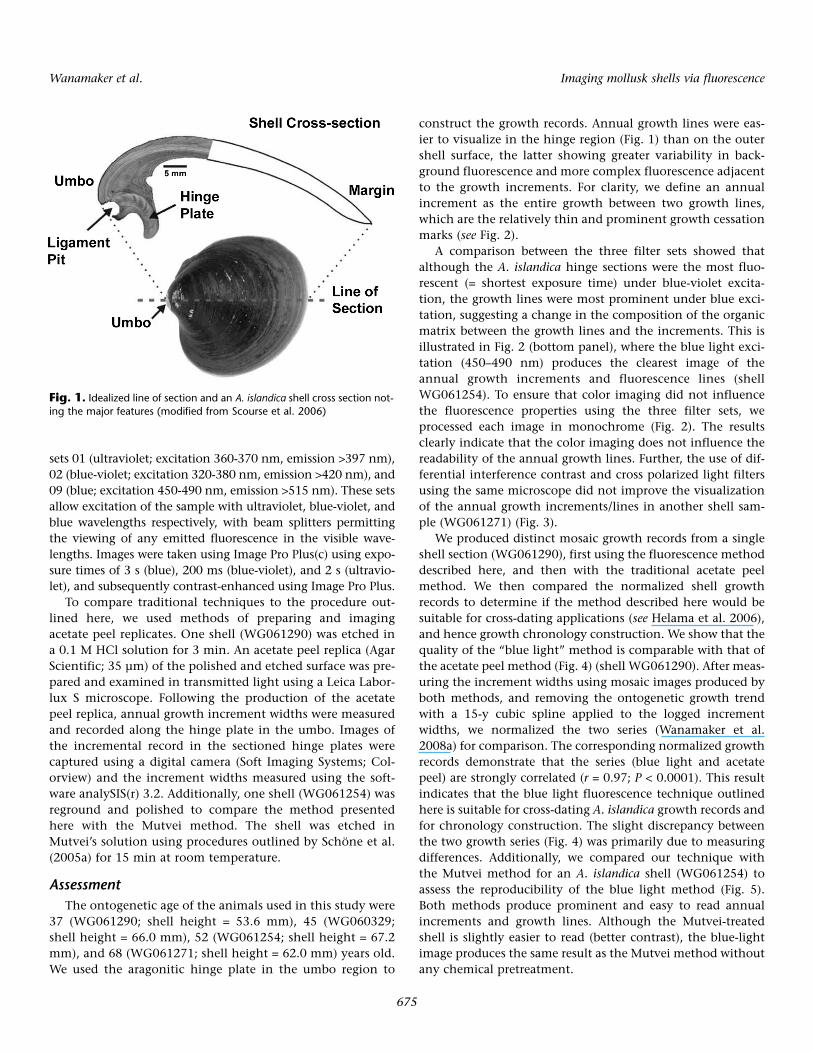
WG061254, WG061271, WG061290) were live-collectedalong the north Icelandic shelf in 2006 in 80 m water depth(see Wanamaker et al. 2008a for details), and prepared usingmethods outlined by Scourse et al. (2006), which are summa-rized below. The left-shell valves were embedded in resin (Met-Prep; Kleer Set type FF) and the shells sectioned radially fromthe umbo to the shell margin (Fig. 1). The embedded left valvewas sectioned through the center of the hinge tooth using adiamond saw. The cut surfaces were ground on progressivelyfiner grades of silicon carbide paper (MetPrep; P120, P400,P1200) and polished with dilute diamond paste (Presi; 3 µm)on rotary magnetic pads (Presi; 200 mm, 3106 and 0307).
Polished sections of the four A. islandica shells were analyzedepiscopically using a Zeiss Axiotech fluorescence microscope fit-ted with a Q imaging Micropublisher 3.3RTV camera (CCDcolor; 3.3 million pixels; 2048 × 1536) and three filter sets; Zeiss
Wanamaker et al. Imaging mollusk shells via fluorescence
674
sets 01 (ultraviolet; excitation 360-370 nm, emission >397 nm),02 (blue-violet; excitation 320-380 nm, emission >420 nm), and09 (blue; excitation 450-490 nm, emission >515 nm). These setsallow excitation of the sample with ultraviolet, blue-violet, andblue wavelengths respectively, with beam splitters permittingthe viewing of any emitted fluorescence in the visible wave-lengths. Images were taken using Image Pro Plus(c) using expo-sure times of 3 s (blue), 200 ms (blue-violet), and 2 s (ultravio-let), and subsequently contrast-enhanced using Image Pro Plus.
To compare traditional techniques to the procedure out-lined here, we used methods of preparing and imagingacetate peel replicates. One shell (WG061290) was etched ina 0.1 M HCl solution for 3 min. An acetate peel replica (AgarScientific; 35 µm) of the polished and etched surface was pre-pared and examined in transmitted light using a Leica Labor-lux S microscope. Following the production of the acetatepeel replica, annual growth increment widths were measuredand recorded along the hinge plate in the umbo. Images ofthe incremental record in the sectioned hinge plates werecaptured using a digital camera (Soft Imaging Systems; Col-orview) and the increment widths measured using the soft-ware analySIS(r) 3.2. Additionally, one shell (WG061254) wasreground and polished to compare the method presentedhere with the Mutvei method. The shell was etched inMutvei’s solution using procedures outlined by Schöne et al.(2005a) for 15 min at room temperature.
AssessmentThe ontogenetic age of the animals used in this study were
37 (WG061290; shell height = 53.6 mm), 45 (WG060329;shell height = 66.0 mm), 52 (WG061254; shell height = 67.2mm), and 68 (WG061271; shell height = 62.0 mm) years old.We used the aragonitic hinge plate in the umbo region to
construct the growth records. Annual growth lines were eas-ier to visualize in the hinge region (Fig. 1) than on the outershell surface, the latter showing greater variability in back-ground fluorescence and more complex fluorescence adjacentto the growth increments. For clarity, we define an annualincrement as the entire growth between two growth lines,which are the relatively thin and prominent growth cessationmarks (see Fig. 2).
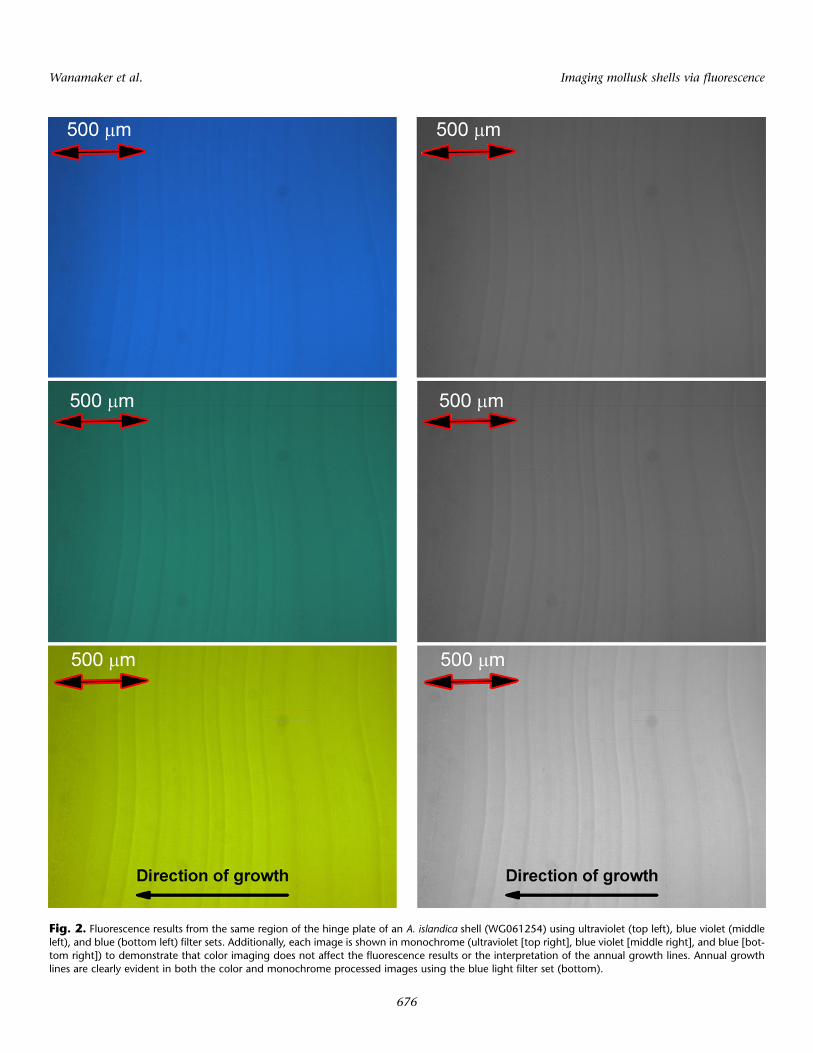
A comparison between the three filter sets showed thatalthough the A. islandica hinge sections were the most fluo-rescent (= shortest exposure time) under blue-violet excita-tion, the growth lines were most prominent under blue exci-tation, suggesting a change in the composition of the organicmatrix between the growth lines and the increments. This isillustrated in Fig. 2 (bottom panel), where the blue light exci-tation (450–490 nm) produces the clearest image of theannual growth increments and fluorescence lines (shellWG061254). To ensure that color imaging did not influencethe fluorescence properties using the three filter sets, weprocessed each image in monochrome (Fig. 2). The resultsclearly indicate that the color imaging does not influence thereadability of the annual growth lines. Further, the use of dif-ferential interference contrast and cross polarized light filtersusing the same microscope did not improve the visualizationof the annual growth increments/lines in another shell sam-ple (WG061271) (Fig. 3).
We produced distinct mosaic growth records from a singleshell section (WG061290), first using the fluorescence methoddescribed here, and then with the traditional acetate peelmethod. We then compared the normalized shell growthrecords to determine if the method described here would besuitable for cross-dating applications (see Helama et al. 2006),and hence growth chronology construction. We show that thequality of the “blue light” method is comparable with that ofthe acetate peel method (Fig. 4) (shell WG061290). After meas-uring the increment widths using mosaic images produced byboth methods, and removing the ontogenetic growth trendwith a 15-y cubic spline applied to the logged incrementwidths, we normalized the two series (Wanamaker et al.2008a) for comparison. The corresponding normalized growthrecords demonstrate that the series (blue light and acetatepeel) are strongly correlated (r = 0.97; P < 0.0001). This resultindicates that the blue light fluorescence technique outlinedhere is suitable for cross-dating A. islandica growth records andfor chronology construction. The slight discrepancy betweenthe two growth series (Fig. 4) was primarily due to measuringdifferences. Additionally, we compared our technique withthe Mutvei method for an A. islandica shell (WG061254) toassess the reproducibility of the blue light method (Fig. 5).Both methods produce prominent and easy to read annualincrements and growth lines. Although the Mutvei-treatedshell is slightly easier to read (better contrast), the blue-lightimage produces the same result as the Mutvei method withoutany chemical pretreatment.
Wanamaker et al. Imaging mollusk shells via fluorescence
675
Fig. 1. Idealized line of section and an A. islandica shell cross section not-ing the major features (modified from Scourse et al. 2006)
Wanamaker et al. Imaging mollusk shells via fluorescence
676
Fig. 2. Fluorescence results from the same region of the hinge plate of an A. islandica shell (WG061254) using ultraviolet (top left), blue violet (middleleft), and blue (bottom left) filter sets. Additionally, each image is shown in monochrome (ultraviolet [top right], blue violet [middle right], and blue [bot-tom right]) to demonstrate that color imaging does not affect the fluorescence results or the interpretation of the annual growth lines. Annual growthlines are clearly evident in both the color and monochrome processed images using the blue light filter set (bottom).

Another interesting aspect of the fluorescence lines imagedin the hinge region of the A. islandica shell (WG061329) sectionis that each fluorescence line is followed by a dark line/shadow(Fig. 6). There appears to be an increase in fluorescence (andorganics) just prior to the growth cessation period.
DiscussionOur results show that the annual growths lines in A.
islandica fluoresce in the blue light spectrum (450–490 nm), soan ultraviolet source (mercury lamp) is not required and a tra-ditional transmitted light microscope, fitted with the appro-priate filters sets, can be used to conduct this work. Currently,the source of the intrinsic fluorescence of A. islandica shells isunknown; A. islandica is known to precipitate its aragoniteshell within an organic polymer matrix, which likely includeschitin polysaccharides and proteins (e.g., Addadi et al. 2006;Cusack and Freer 2008; Dunca et al. 2009). Perez-Huerta et al.
(2008) suggested that organic macromolecules associated withchitin polysaccharides and proteins in calcitic brachiopods(Terebratalia transversa and Novocrania anomala) are the likelycause of shell fluorescence in these species. The variability inthe organic content within A. islandica growth increments hasnot been studied in any detail, and further work is required toestablish the biogeochemical drivers of the fluorescence vari-ability observed here. The observed increase in fluorescence(i.e., fluorescence lines) near the growth cessation mark (Fig.6) is immediately followed by a dark line/shadow. This mayindicate that during the period of slow growth (or during thegrowth cessation period) when the growth line is beingdeposited a dark line/shadow is formed that may contain less(fluorescence) organic material in the aragonite shell struc-ture; this result warrants further study.
It has been demonstrated here that fluorescencemicroscopy produces images of comparable quality to
Wanamaker et al. Imaging mollusk shells via fluorescence
677
Fig. 3. Fluorescence results from the same region of the hinge plate of an A. islandica shell (WG061271) using differential interface contrast (left top),cross polarized light (middle), and blue light (right bottom) filter sets. Note that the scale bar is the same for each image; direction of growth is fromright to left in each of the images.

those observed in traditional acetate peels with the addi-tional benefit that no chemical pretreatment is requiredprior to imaging. This method may increase shell through-put and increase the rate of chronology construction, as
well as reducing the use of chemicals during the prepara-tion process. Additionally, shell sections imaged in thismanner can be used directly for geochemical studies, withno requirement to create further sections. The method
Wanamaker et al. Imaging mollusk shells via fluorescence
678
Fig. 4. Comparison between the “blue light” (top) and acetate peel (middle) methods for an A. islandica shell (WG061290). Each shell growth mosaicwas measured independently and the corresponding normalized growth records are shown (bottom). The blue curve represents the blue light method,whereas the red curve is from the acetate peel technique. Highlighted years on both shell sections (1976, 1986, 1996, and 2006) are shown forcomparison.

presented here may also be used in conjunction withother methods (thin sections, acetate peels, Mutvei solu-tion) to objectively identify difficult banding patterns inbiogenic carbonates (e.g., Butler et al. 2009b). Fluores-cence microscopy produces images of comparable qualityto traditional acetate peel techniques and the Mutveimethod with the additional benefits of rapid analysis andminimal pretreatment.
Comments and recommendations
We present a novel and practical technique that uses fluores-cent microscopy to image the internal growth patterns in theshell of the long-lived marine bivalve Arctica islandica. The pol-ished and untreated aragonitic shell layer fluoresces under bluelight (450–490 nm), revealing annual growth increments andfluorescent lines. We compared our fluorescence results with tra-ditional acetate peel techniques and conclude that the blue lightmethod is equivalent in quality. We have also demonstrated thatthe growth increments in the A. islandica specimen used herecan be identified and measured using both blue light and acetatepeel methods. An important benefit of this technique is thatgeochemical analyses can be performed on the same shell sec-tion that was imaged using blue light microscopy. Further, thismethod does not require an ultraviolet light source (xenon ormercury), which can be expensive and entail certain safety pre-cautions. Although we did not test alternate light sources (e.g.,tungsten, fluorescent) with the mercury lamp used in this article,future work using such light sources may prove beneficial.
Although the variability in the organic content within A.islandica growth increments has not been studied in muchdetail, we show that there is a prominent fluorescence fromblue light excitation likely related to a change in the organicmatrix in the aragonitic shell. Specifically, the observedincrease in fluorescence near the growth cessation mark thatis followed by a dark line/shadow merits further investigation(see Fig. 6). More work is required to establish the biogeo-chemical drivers of the fluorescence variability observed herein A. islandica. Additionally, because of the extraordinarylongevity of A. islandica, this technique should be employedto determine if older specimens (>200 y) produce similarresults as those presented here for the relatively young (<100 y)animals that we used. Future efforts should include fluorescence
Wanamaker et al. Imaging mollusk shells via fluorescence
679
Fig. 5. Blue light fluorescence (left) and Mutvei-treated (right) results for an A. islandica shell (WG061254). We labeled nine complete increments (1-9)on both shell sections to show that each increment is clearly visible using both methods. The Mutvei-treated shell is slightly easier to read (better con-trast), however the image captured using the blue light method also reproduces the same result without any chemical pretreatment of the shell.
Fig. 6. Blue light fluorescence for an Arctica islandica shell (WG061329).A complete annual growth increment is shown in the middle by the whitearrow. Some of the annual lines (here fluorescence lines) are shown by theblack arrows. The direction of shell growth is noted with the gray arrow.Fluorescence lines are followed by a dark shadow/line during the “slowgrowth” or growth cessation period.

work with additional mollusc taxa (and other biogenic carbon-ates) from different oceanographic settings, including sub-fos-sil material to assess any potential diagenetic effects, and torefine and extend the methods presented here. The usefulnessof A. islandica as a proxy in ecosystem and ocean/climate stud-ies is well established, and this new “blue light” technique maymitigate some methods-based constraints and further extendits utility in environmental studies around the North Atlantic.
ReferencesAddadi, L., D. Joester, F. Nudelman, and S. Weiner. 2006. Mollusk
shell formation: A source of new concepts for understandingbiomineralization processes. Chem. Eur. J. 12:981-987.
Ambrose, W. G., M. L. Carroll, M. Greenacre, S. R. Thorrold,and K. W. McMahon. 2006. Variation in Serripes groenlandi-cus (Bivalvia) growth in a Norwegian high-Arctic fjord: evi-dence for local- and large-scale climatic forcing. Glob.Change Biol. 12:1595-1607.
Baker, A., P. L. Smart, R. L. Edwards, and D. A. Richards. 1993.Annual growth banding in a cave stalagmite. Nature364:518-520.
———, D. Genty, and P. L. Smart. 1998. High-resolutionrecords of soil humification and paleoclimate change fromvariations in speleothem luminescence excitation andemission wavelengths. Geology 26:903-906.
———, C. J. Caseldine, M. A. Gilmour, D. Charman, C. J. Proc-tor, C. J. Hawkesworth, and N. Phillips. 1999. Stalagmiteluminescence and peat humification records of palaeo-moisture for the last 2500 years. Earth Planet. Sci. Lett.165:157-162.
Butler, P. G., J. D. Scourse, C. A. Richardson, A. D. WanamakerJr., C. L. Bryant, and J. D. Bennell. 2009a. Continuousmarine radiocarbon reservoir calibration and the 13C Suesseffect in the Irish Sea: Results from the first absolutely datedmulti-centennial shell-based marine master chronology.Earth Planet. Sci. Lett. 279:230-241 [doi:10.1016/j.epsl.2008.12.043230-241].
———, and others. 2009b. Accurate increment identificationand the spatial extent of the common signal in five Arcticaislandica chronologies from the Fladen Ground, northernNorth Sea, Paleoceanography. 24:PA2210 [doi: 10.1029/2008PA001715].
Cargnelli, L. M., S. J. Griesbach, D. B. Packer, and E. Weiss-berger. 1999. Essential fish habitat source document: Oceanquahog, Arctica islandica, life history and habitat character-istics. NOAA Tech. Memorandum NMFS-NE-148:12.
Charman, D. J., C. Caseldine, A. Baker, B. Gearey, J. Hatton,and C. Proctor. 2001. Paleohydrological records from peatprofiles and speleothems in Sutherland, northwest Scot-land. Quat. Res. 55:223-234.
Clark, G. R. 1976. Shell growth in the marine-environment—approaches to problem of marginal calcification. Am. Zool.16:617-626.
Cusack, M., and A. Freer. 2008. Biomineralization: Elemental
and organic influence in carbonate systems. Chem. Rev.108:4433-4454.
DeLong, K. L., T. M. Quinn, and F. W. Taylor. 2007. Recon-structing twentieth-century sea surface temperature vari-ability in the southwest Pacific: A replication study usingmultiple coral Sr/Ca records from New Caledonia. Paleo-ceanography 22:PA4212 [doi:4210.1029/2007PA001444].
Dunca, E., and others. 2009. Using ocean quahog (Arcticaislandica) shells to reconstruct palaeoenvironment in Öre-sund, Kattegat and Skagerrak, Sweden. Int. J. Earth Sci.98:3-17.
Halfar, J., R. S. Steneck, M. Joachimski, A. Kronz, and A. D.Wanamaker. 2008. Coralline red algae as high-resolutionclimate recorders. Geology 36:463-466 [doi:10.1130/G24635A.1].
Hart, G. F. 1986. Origin and classification of organic matter inclastic systems. Palynology 10:1-23.
Helama, S., B. R. Schöne, B. A. Black, and E. Dunca. 2006. Con-structing long-term proxy series for aquatic environmentswith absolute dating control using a sclerochronologicalapproach: introduction and advanced applications. Mar.Freshw. Res. 57:591-599.
———, ———, A. J. Kirchhefer, J. K. Nielsen, D. L. Rodland, andR. Janssen. 2007. Compound response of marine and terres-trial ecosystems to varying climate: Pre-anthropogenic per-spective from bivalve shell growth increments and tree-rings. Mar. Environ. Res. 63:185-199.
Hendy, E. J., M. K. Gagan, and J. M. Lough. 2003. Chronolog-ical control of coral records using luminescent lines andevidence for non-stationary ENSO teleconnections innortheast Australia. Holocene 13:187-199.
Isdale, P. 1984. Fluorescent bands in massive corals record cen-turies of coastal rainfall. Nature 310:578-579.
Jones, D. S. 1980. Annual cycle of shell growth increment for-mation in two continental shelf bivalves and its paleoeco-logic significance. Paleobiology 6:331-340.
———, I. R. Quitmyer, and C. F. T. Andrus. 2005. Oxygen iso-topic evidence for greater seasonality in Holocene shells ofDonax variabilis from Florida, Palaeogeogr. Palaeoclimat.Palaeoecol. 228:96-108.
Krantz, D. E., D. F. Williams, and D. S. Jones. 1987. Ecologicaland paleoenvironmental information using stable isotopicprofiles from living and fossil molluscs. Palaeogeogr.Palaeoclimat. Palaeoecol. 58:249-266.
Marchitto, T. M., G. A. Jones, G. A. Goodfriend, and C. R. Wei-dman. 2000. Precise temporal correlation of Holocene mol-lusk shells using sclerochronology. Quat. Res. 53:236-246.
Oschmann, W. 2009. Sclerochronology: editorial. Int. J. EarthSci. 98:1-2.
Perez-Huerta, A., M. Cusack, A. Ball, C. T. Williams, and S.Mackay. 2008. Deciphering the distribution of organiccomponents in brachiopod shells by confocal laser scan-ning microscopy. J. Microsc. 230:94-99.
Proctor, C. J., A. Baker, W. L. Barnes, and R. A. Gilmour. 2000.
Wanamaker et al. Imaging mollusk shells via fluorescence
680

A thousand year speleothem proxy record of North Atlanticclimate from Scotland. Clim. Dyn. 16:815-820.
Richardson, C. A. 1989. An analysis of the microgrowth bandsin the shell of the common mussel Mytilus edulis. J. Mar.Biol. Assoc. U.K. 69:477-491.
———. 2001. Molluscs as archives of environmental change.Oceanogr. Mar. Biol. 39:103-164.
Ropes, J. W., D. S. Jones, S. A. Murawski, F. M. Serchuck, andA. Jearld. 1984. Documentation of annual growth lines inocean quahogs, Arctica islandica Linne. Fish. Bull. 82:1-19.
Sandweiss, D. H., K. A. Maasch, R. L. Burger, J. B. Richardson,H. B. Rollins, and A. Clement. 2001. Variation in HoloceneEl Nino frequencies: Climate records and cultural conse-quences in ancient Peru. Geology 29:603-606.
Schöne, B. R., and others. 2003. North Atlantic Oscillationdynamics recorded in shells of a long-lived bivalve mollusk.Geology 31:1037-1040.
———, E. Dunca, H. Mutvei, and U. Norlund. 2004. A 217-year record of summer air temperature reconstructed fromfreshwater pearl mussels (M. margaritifera, Sweden). Quat.Sci. Rev. 23:1803-1816.
———, and others. 2005a. Climate records from a bivalvedMethuselah (Arctica islandica, Mollusca; Iceland). Palaeo-geogr. Palaeoclimat. Palaeoecol. 228:130-148.
———, E. Dunca, J. Fiebig, and M. Pfeiffer. 2005b. Mutvei’ssolution: an ideal agent for resolving microgrowth struc-tures of biogenic carbonates. Palaeogeogr. Palaeoclimat.Palaeoecol. 228:149-166.
Scoffin, T. P., A. W. Tudhope, and B. E. Brown. 1989. Fluores-cent and skeletal density banding in porites-lutea fromPapua New-Guinea and Indonesia. Coral Reefs 7:169-178.
Scourse, J., and others. 2006. First cross-matched floatingchronology from the marine fossil record: data from growthlines of the long-lived bivalve mollusc Arctica islandica.Holocene 16:967-974 [doi:10.1177/0959683606hl987rp].
Strom, A., R. C. Francis, N. J. Mantua, E. L. Miles, and D. L.Peterson. 2004. North Pacific climate recorded in growthrings of geoduck clams: A new tool for paleoenvironmentalreconstruction. Geophys. Res. Lett. 31 [doi:10.1029/2004GL019440].
Thompson, I., D. S. Jones, and D. Dreibelbis. 1980. Annualinternal growth banding and life-history of the oceanquahog Arctica islandica (Mollusca, Bivalvia). Mar. Biol.57:25-34.
Wanamaker, Jr., A. D., J. Heinemeier, J. D. Scourse, C. A.Richardson, P. G. Butler, J. Eiríksson, and K. L. Knudsen.2008a. Very long-lived mollusks confirm 17th century ADtephra-based radiocarbon reservoir ages for north Icelandicshelf waters. Radiocarbon 50(3):399-412.
———, and others. 2008b. Coupled North Atlantic slope waterforcing on Gulf of Maine temperatures over the past mil-lennium. Clim. Dyn. 31:183-194 [doi:10.1007/s00382-007-0344-8].
———, J. D. Scourse, C. Richardson, A., P. G. Butler, D. J.Reynolds, and I. Ridgway. 2008c. Absolute chronologies fromthe ocean: records from the longest-lived, non-colonial ani-mals on Earth. PAGES News 16(3):4-6.
———, K. J. Kreutz, B. R. Schöne, K. A. Maasch, A. J. Pershing,H. W. Borns, D. Introne, and S. Feindel. 2009. A lateHolocene paleo-productivity record in the western Gulf ofMaine, USA, inferred from growth histories of the long-lived ocean quahog (Arctica islandica). Int. J. Earth Sci.98:19-29 [doi:10.1007/s00531-008-0318-z].
Weidman, C. R., and G. A. Jones. 1993. A shell-derived timehistory of bomb 14C on Georges Bank and its Labrador Seaimplications. J. Geophys. Res. Oceans 98:14577-14588.
———, ———, and K. C. Lohmann. 1994. The long-lived mol-lusk Arctica islandica—a new paleoceanographic tool for thereconstruction of bottom temperatures for the continentalshelves of the northern North Atlantic ocean. J. Geophys.Res. Oceans 99:18305-18314.
Wilkinson, D.G. 1999. In situ hybridization: A practicalapproach. 2nd ed. Oxford Univ. Press.
Wisshak, M., M. L. Correa, S. Gofas, C. Salas, M. Taviani, J.Jakobsen, and A. Freiwald. 2009. Shell architecture, elementcomposition, and stable isotope signature of the giantdeep-sea oyster Neopycnodonte zibrowii sp n. from the NEAtlantic. Deep-Sea Res. I 56:374-407.
Witbaard, R., G. C. A. Duineveld, and P. A. W. J. DeWilde.1997. A long-term growth record derived from Arcticaislandica (Mollusca, Bivalvia) from the Fladen Ground(northern North Sea). J. Mar. Biol. Assoc. U.K. 77:801-816.
———, E. Jansma, and U. S. Klaassen. 2003. Copepods linkquahog growth to climate. J. Sea Res. 50:77-83.
Submitted 16 April 2009
Revised 17 June 2009
Accepted 3 August 2009
Wanamaker et al. Imaging mollusk shells via fluorescence
681