(a) No person or corporation may publish or reproduce in any ...
144
RULES ADOPTED BY THE BOARD OF REGENTS OF THE UNIVERSITY OF HAWAII NOV 8 1955 WITH REGARD TO THE REPRODUCTION OF MASTERS THESES (a) No person or corporation may publish or reproduce in any manner., without the consent of the Committee on Research and-Graduate. Study, a. thesis which has been submitted to the University in partial fulfillment of the require ments for an advanced degree, {b) No individual or corporation or other organization may publish quota tions or excerpts from a graduate thesis without the consent of the author and of the Committee on Research and Graduate Study.
-
Upload
khangminh22 -
Category
Documents
-
view
0 -
download
0
Transcript of (a) No person or corporation may publish or reproduce in any ...
RULES ADOPTED BY THE BOARD OF REGENTS OF THE UNIVERSITY OF HAWAII
NOV 8 1955 WITH REGARD TO THE REPRODUCTION OF MASTERS THESES
(a) No person or corporation may publish or reproduce in any manner., without the consent of the Committee on Research and-Graduate. Study, a. thesis which has been submitted to the University in partial fulfillment of the require ments for an advanced degree,{b ) No individual or corporation or other organization may publish quota tions or excerpts from a graduate thesis without the consent of the author and of the Committee on Research and Graduate Study.
UNIVERSITY OF HAWAII LIBRARY
A STUDY CF SOCIO-ECONOMIC VALUES OF SAMOAN INTERMEDIATEu
SCHOOL STUDENTS IN HAWAII
A THESIS SUBMITTED TO THE GRADUATE SCHOOL OF THE UNIVERSITY OF HAWAII IN PARTIAL FULFILLMENT
CF THE REQUIREMENTS FOR THE DEGREE OF MASTER OF ARTS
JUNE 1956
Susan E. Hirsh

Hawn.CB 5 H3n o .345
co°“51 TABLE OP CONTENTS
LIST GF TABUS ............................... ivCHAPTER. I. STATEMENT CP THE PROBLEM ........ 1
Introduction • • • • • • • • • • • . • • • • • • 1Th« Problem • • • . • • • • • • • • • • • • • • • 3Methodology . » * • • * « * i « # * • * * • t * » 5
II. CONTEMPORARY SAMOA* THE CULTURE CP ORIGIN........ 10Socio-Economic Structure 12Soeic-Eoonosdo Chong« • • • • • • « . # • • • « • 15Socio-Economic Values? • • • • • • • • • • • » . . 17Conclusions 18
UI. TBE SAIOAIS IN HAWAII» PEARL HARBOR AND LAXE . . . 20Peerl Harbor 21Lala ......... 24Sumaary 28
IV. SELECTED BACKGROUND CHARACTERISTICS OP SAMOAN ANDNON-SAMOAN INTERMEDIATE SCHOOL STUDENTS IN HAWAII . 29
Location of Residences of Students • • • • • • • 29Sex and Age Distribution of Students • • • • • • 31Ethnic Background of Students • « • • • « • • • • 32Place of Birth of Students and Length of
Residence in Hawaii • • • • • • • • • • • • • 33Religious Affiliation of Students * • • • • • • • 35Friendship Contacts of Students • • • • • • • • • 36Age and Sex Distributions of Parents . . • • • « 38Birthplace and Length of Residence of Parents • • 39Occupational Lerels of Parent« . . . « • • • • • 41Religious Affiliation of Parents • • • • • • • • 42Languages of Parents • • • • • • • • • • • • • • 43The Families of the Students................ 44Summary • • • • » . • • . « • • » • • * . « • . . 48
V. SOCIO-ECONOMIC VALUES CP SAMOAN AND NON-SAMOANSIN HAWAII ......... 53
The Acculturation Seale • • • • • • • • • • • • • 53Socio-Economic Values • • • • • • • • • • • • • « 56
Family Values ........ . 56Eduoatlonal Values 63
/ , Time-Property Values • • . . « • • • • • • • • 67Occupational Values • • • • • • • » • • • • • 70
Summary 80‘ VI. SOCIO-ECONOMIC VALUES OF FIRST AND SECOND GENERATION
SAMOAN STUDENTS IN HAWAII • • • . ............ 88 ,Family Values . . . . . . . . . . . 88Educational Values • • • • • • « • • • • • • • • 93
i
Timi*-Property Values ......... 95Occupational Value« • • • • • • • • • • • » • • » 98ßuwaary • • • • • • • • « « • • * • • • • • • • • 106»
vu. suiTÄRi and c m a m i c m . . ..................... 109Probi«« and .Hypotheses • • • • • • • • • • * • • • 109iJethodologp • • • # • • » • • * • • • • • • • • « 109Qvumtsey of Findings • • • • • • • • • • • • • • • 110
Patterns of Slnllarity In Ráspense Anong theFour Saapl« Groups • « • • • • • • • • • • • 110
Patterns of Difference between Saaoaae and Non-Saneana • • • • • • « « • • • • • • • •
Patterns of Différence In Response amongOanoans by Place of Reeldenoe • • • • • • • 117
Patterns of Difference in Response amongCancana by Generation • • • • • • • • • • • 120
• « • • • • • • • • • • • • • • • • • IyHSuggestions for Further Investigation • • • • • 125
APPENDS * ........... ............................« t . • * I »bibliography....................... 133
Ill

if
30
30
31
31
33
34
35
n
37
39
40
a42
43
44
LIST OF TABLES
PERCENTAGE DISTRIBUTION Cff LOCATION CP RESIEENCES CP STUDENTS AT PEARL HARBOR INTERMEDIATE SCHOOL BX ETHNIC GROUP ................PERCENTAGE DISTRIBUTION OP LOCATION OP RESIDENCES OP STUDENTS IN INTERMEDIATE GRADES AT KAHUKU SCHOOL BY ETHNIC GROUP • • • • • • • • « ....... . . . . . . .PERCENTAGE DISTRIBUTION OP STUDENTS BY SEX, ETHNIC GROUP, AND SCHOOL ............. • • • • • ..........MEAN ACES AND AGE RANGES OP STUDENTS BY ETHNIC GROUP AND SCHOOL , *PERCENTAGE DISTRIBUTION CP PLACE OF BIRTH OP STUDENTS BY ETHNIC GROUP AND SCHOOL................... . .PERCENTAGE DISTRIBUTION OF STUDENTS BX DATES CP ARRIVAL IN HAWAII BY ETHNIC GROUP AND SCHOOLPERCENTAGE DISTRIBUTION OF CHURCH AFFILIATION OPSTUDENTS BY ETHNIC GROUP AND SCHOOL . . ......... .MEAN IN-CROUP AND SAMOAN FRIENDSHIP SCORES BY ETHNIC GROUP AND SCHOOL . . . ................ . • . • •PERCENTAGE CP FRIENDSHIP INTERACTION CP SAMOANS AND NCM-SAMOANS BY SCHOOL • • • • « • • • • • • • • • • • •PERCENTAGE DISTRIBUTION CP AGE CP PARENTS BY ETHNIC GROUP AND SCHOOL OP CHILD......... .PERCENTAGE DISTRIBUTION OP BIRTHPLACE CP PARENTS BY ETHNIC GROUP AND SCHOOL CP CHILD......... .........PERCENTAGE DISTRIBUTION CP DATES OP ARRIVAL IN HAWAII GP »RENTS BY ETHNIC GROUP AND SCHOOL OF CHILD . . . •PERCENTAGE DISTRIBUTION OP PARENTS* OCCUPATIONAL LEVEL BY ETHNIC GROUP AND SCHOOL OP CHILD ..............PERCENTAGE DISTRIBUTION OP PARENTS BY CHURCHES ATTENDED BY ETHNIC GROUP AND SCHOOL OF CHILD................PERCENTAGE DISTRIBUTION OF PARENTS WHO COULD SPEAK VARIOUS LANGUAGES BY ETHNIC GROUP AND SCHOOL CP CHILD ,
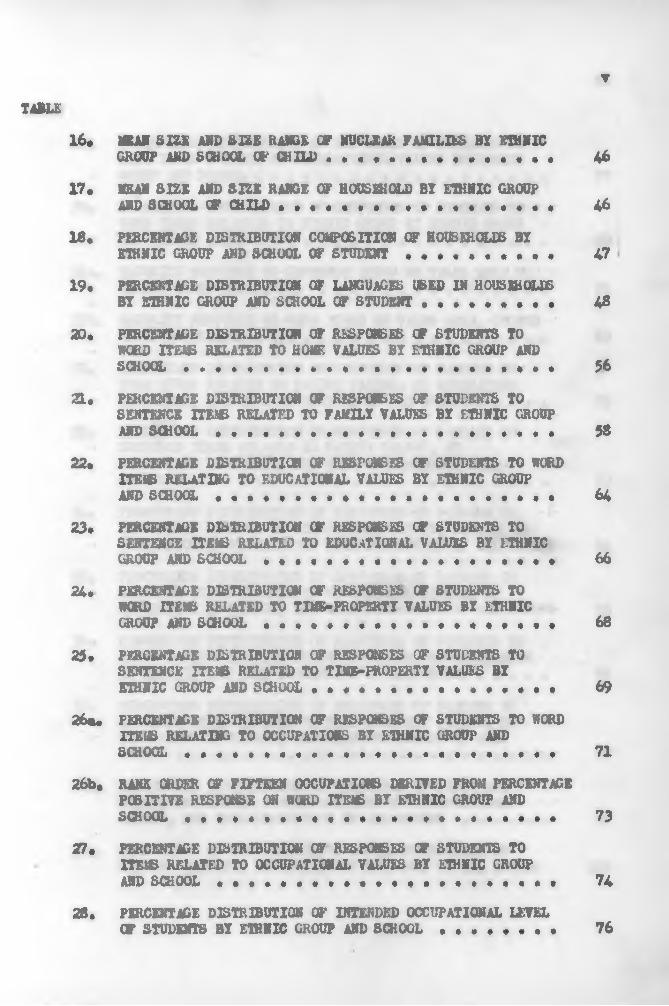
16« MEAN S m AND SIZE RANGE OF NUCLEAR FAMILIES BY ETHNICGROUP AND SCHOOL GF CHILD . . . . . . . . . . . . . . . 46
17« ISAM SIZE AND SIZE RANGE OF HOUSEHOLD BY ETHNIC GROUPAND SCHOOL OF CHILD ................. 46
18« PERCENTAGE DISTRIBUTION COMPOSITION OF HOUSHiOLIB BYETHNIC GROUP AND SCHOOL OF STUDENT ............... 47
19« PERCENTAGE DISTRIBUTION OF LANGUAGES USED IN HOUSEHOLDSBY ETHNIC GROUP AND SCHOOL OF STUDENT . ........ • 48
20« PERCENTAGE DISTRIBUTION OF RESPONSES GF STUDENTS TOWORD 2XMB RELATED TO HOME VALUES BY ETHNIC GROUP AHDSCHOOL............... 56
21. PERCENTAGE DISTRIBUTION OP RESPONSES OF STUDENTS TO SENTENCE ITEMS RELATED TO FAMILY VALUES BY ETHNIC GROUPAND SCHOOL......... 53
22. PERCENTAGE DISTRIBUTION OF RESPONSES OF STUDENTS TO WORD ITEMS RELATING TO EDUCATIONAL VALUES BY ETHNIC GROUPAND SCHOOL . . . . . . . . . . . . . . . . . ....... 64
23. PERCENTAGE DISTRIBUTION OF RESPONSES OF STUDENTS TO SENTENCE ITEM* RELATED TO EDUCATIONAL VALUES BY ETHNICGROUP AND SCHOOL........ ........................ 66
24. PERCENTAGE DISTRIBUTION OF RESPONDS» CF STUDENTS TO WORD ITEMS RELATED TO TIME»*PROPERTY VALUES BY ETHNICGROUP AND SCHOOL ......... 66
25. PERCENTAGE DISTRIBUTION OP RESPONSES OF STUDENTS TO SENTENCE ITEMS RELATED TO TIME-PROPERTY VALUES BYETHNIC GROUP AMD SCHOOL • • • • • • • .......... 69
26a. PERCENTAGE DISTRIBUTION OF RESPONSES OF STUDENTS TO WORD ITEm RELATING TO OCCUPATIONS BY ETHNIC GROUP AND SCHOOL........................... • • « • 71
26b. RANK ORDER CF FIFTEEN OCCUPATIONS DERIVED FROM PERCENTAGE POSITIVE RESPONSE ON WORD ITEMS BY ETHNIC GROUP AMD SCHOOL . . . ........ • 73
27. PERCENTAGE DISTRIBUTION OF RESPONSES GF STUDENTS TO i m ® RELATED TO OCCUPATIONAL VALUES BY ETHNIC GROUP AMD SCHOOL.............. . « • • • • .......... • 74
▼TABLE
28. PERCENTAGE DISTRIBUTION OF INTENDED OCCUPATIONAL LEVELOF STUDENTS BY ETHNIC CROUP AND SCHOOL . . . . . . . . 76
▼1
77
80
81
83
89
90
94
95
96
97
98
100
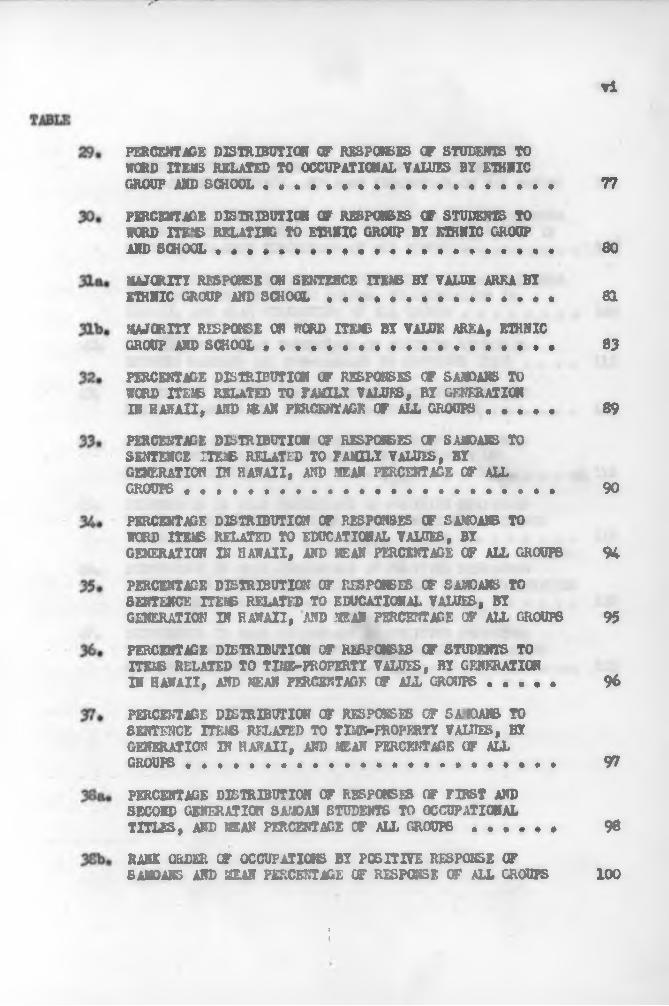
PERCENTAGE DISTRIBUTION OF RESPONSES OF STUDENTS TO WCRD ITEMS RELATED TO OCCUPATIONAL VALUES BY ETHNIC GROUP AND SCHOOL....... ........................PERCENTAGE DISTRIBUTION OP RESPONSES CP STUDENTS TO WORD ITE’fi RELATING TO ETHNIC GROUP BY ETHNIC GROUP AND SCHOOL . . . . . . ....... * ................MAJORITY RESPONSE ON SENTENCE ITEMS BY VALUE AREA BY ETHNIC GROUP AND SCHOOL . . . . . . . . . ....... •MAJORITY RESPONSE ON WORD ITEMS BY VALUE AREA, ETHNIC GROUP AND SCHOOL ............PERCENTAGE DISTRIBUTION OF RESPONSE OF SAMOANS TO«CRD zis» related to family values, by generationIN HAWAII, AND IE AN PERCENTAGE OF ALL GROUPS.......PERCENTAGE DISTRIBUTION OF RESPQEBES OF SASSDARS TO SENTENCE ITEMS RELATED TO FAMILY VALUES, BY GENERATION IN HAWAII, AND MEAN PERCENTAGE OF ALL GROUPS....... ............... .................PERCENTAGE DISTRIBUTION OF RESPONSES OF SAMOANS TO WCRD m m RELATED TO EDUCATIONAL VALUES, BY GENERATION IN HAWAII, AND MEAN PERCENTAGE OF ALL GROUPSPERCENTAGE DISTRIBUTION £F RESPONSES OF SAMOANS TO SENTENCE ITEMS RELATED TO EDUCATIONAL VALUES, BY GENERATION IN HAWAII, AND MEAN PERCENTAGE OF ALL GROUPSPERCENTAGE DISTRIBUTION OF RESPONSES CF STUDENTS TO ITEMS RELATED TO TBE-PROPERTY VALUIS, BY GENERATION IN HAWAII, AND MEAN PERCENTAGE flF ALL GROUPS . . . • «PERCENTAGE DISTRIBUTION OF RESPONSES OF SA fOANS TO SENTENCE ITEMS RELATED TO TIMW-FROPJSITY VALUES, BY GENERATION IN HAWAII, AND MEAN PERCENTAGE OF ALL GROUPS............................. ...........PERCENTAGE DISTRIBUTION OF RESPONSE® OF FIRST AND SECOND GENERATION SAX AN STUDENTS TO OCCUPATIONAL TITLES, AND MEAN PERCENTAGE OF ALL GROUPS . . . . . .RANK ORDER CF OCCUPATIONS BY POSITIVE RESPONSE OF SAMOANS AND MEAN PERCENTAGE OF RESPONSE OF ALL GROUPS
4I

▼il
39. PERCENT ALE DISTRIBUTION CP RESPONSES CP SAMOANS TOSENTENCE ITEMS RELATED TO OCCUPATIONAL VALUES, BI GENERATION IN HAWAII, AND MEAN PERCENTAGE OF ALL GROUPS 101
AO* PERCENTAGE DISTRIBUTION CP RESPONSES Qp SAMOANS TO WORD ITI« RELATED TO OCCUPATIONAL VALUES, BI GENERATION IN HAWAII, AND MEAN PERCENTAGE CP ALL GROUPS . ........... 102
TABLE
41. PERCENTAGE DISTRIBUTION QP RESPONSES OF SAMOANS TO WORD ITEMS RELATING TO ETHNIC VALUES, BI GENERATION IN HAWAII, AND MEAN PERCENTAGE QP ALL GROUPS . . . . . . . . 105
42* DIFFERENCE IN MEAN PERCENTAGE OF POSITIVE RESPONSESBETWEEN SAMOANS AND NON-SAMOANS TO SENTENCE ITEMS . . . . 113
43* DIFFERENCE IN MEAN PERCENTAGE OF POSITIVE RESPONSESBETWEEN SAMOANS AND NON-SAMOANS TO WORD ITEMS..........114
44* DIFFERENCE IN MAN PERCENTAGE OF POSITIVE RESPONSES TO SENTENCE ITEMS AMONG SAMOANS BI COMMUNITY OF RESIDENCE IN HAWAII.................. * .............. 118
45* DIFFERENCE IN MEAN PERCENTAGE OF POSITIVE RESPOKSES TO WORD ITEMS AMONG SAMOANS BI COMMUNXTI OF RESIDENCE IN HAWAII . . . .................................... 119
46. DIFFERENCE IN MEAN PERCENTAGE OF POSITIVE RESPONSESTO SENTENCE ITESE BETWEEN THE FUST AND SECOND GENERATION SAMOANS IN HAWAII......................... ........ 122
47. DIFFERENCE IN MEAN PERCENTAGE OF POSITIVE RESPONSES TO WORD ITEMS BETWEEN THE FIRST AND SECOND GENERATIONSAMOANS IN HAWAII.............. * . ................ 123
4i

CHAPTER X STATEMENT OF THE PROBLEM
toterttagfctonVarious population pressures and attractions have encouraged the
Immigration to Hawaii of relatively large groups of persons from various areas of the world* f Social scientists outside of Hawaii» as well as local researchers» have been interested in the history of these issci- grstiona and the processes of adjustment that these groups experience. There has been a considerable amount of interest In Hawaii as the Paclflo counterpart of the Mainland American "melting pot»* and some have looked toward Hawaii for the repetition or repudiation of the patterns of immigrant adjustment that have been evident elsewhere in the world and especially in North America.
The Samoans on Oahu are one of the newest and smallest of the as immigrant group# in Hawaii. fiost of the Samoans have entered the territory since World Aar II. f Although the earliest Samoan immigrants arrived in Hawaii around 1919» their mashers were not significant until at least the forties. Although no census data are available on the Samoans in Hawaii» it has been unofficially estimated that thers are between one and two thousand Samoans in the territory. According to Eyde» the Samoans have concentrated In three general areas; Lais» Pearl Harbor-B&rber’a Point, and Honolulu.1 , Pt/'sW
. i u 4 * W
1. David B. Eyde, "A Preliminary Study of a Croup of Samoan Migrants in Hawaii,* unpublished manuscript, University of Hawaii, 1954» p. 4.
i

Because of their snail numbers* location in identifiable dusters* and raoent arrival* the Samoans in Havail hare bean the object of previous studies* A general survey of the group that migrated In 1952» es the reeult of the Navy chartering the President Jackson for that {Sirpose* was completed,2 aa well as two investigations of the groups that are resident in the Naval Housing Arses at Pearl Harbor and in Lala.3 There has been sons interest, especially on the part of the Tri- Institutional Faoifie Program to extend this program of research as an integrated investigation of the acculturation of one group of Pacificpeoples .4 (Vufl <itw<S ( * \<-wvw, (i
In addition* the Samoans have been the cause of a certain amount of concern in the non-academic community. Comment has been mads by health authorities* housing administrators* school officials» and polios* as well as by private citizens, to the effect that the Bemoans constitute a social or health hazard in the various communities where they reside.5 Therefore* as an incidental objective* it is felt that an increased understanding of these peoples and their patterns of adjustment in a
2« David B. Eyde, *A Preliminary Study of a Group of Samoan Migrants la Hawaii** unpublished manuscript, University of Hawaii* 1954«
3. John Forster* "The Assimilation of Samoan Migrants in the Naval Housing Area* Pearl Harbor* Hawaii»* unpublished thesis submitted to the Graduate School of the University of Hawaii in partial fulfillment of the requirements for the Degree of Master of Arte* 19541 Bernard F* Pierce» "Acculturation of Samoans in Laie»* unfinished Master's thesis* University of Hawaii«
4« The TRIPP program is sponsored by Tale University* University of Hawaii* and the Barnice P. Bishop Museum* and is focussed on soolal and cultural change in the Faoifie area•
5« Cf«» Forster* SR* eit«. p. 1«
new social environment may provide additional information for tha enlightenment of interested parties in tha community*Tha Problem
Out of a general interest in immigrant adjustment and a more focussed interest in tha "acculturation* of tha Samoans in Hawaii, a problem for investigation was proposed which extended tha research in this field into new subject and saaple areas*
Acculturation It « tana that has bean variously used* In tha context of this investigation, it will refer to tha tendency of tha members of one society to adapt and change their culture and social behavior patterns in the direction of the culture and social behavior patterns of a more dominant society.
It la assumed that Immigrant persons, to the extent that they are not physically or socially isolated from their social environment, will undergo a process of change and adaptation toward tha and of successful adjustment to tha new situation. Ibis process of acculturation ia often be un before tha actual physical migration, through occupational, education, personal, and other sorts of contacts with members of outside groups. However, the process is accelerated as tits result of the physical Migration, aai it is assumed that an adjustment to the new situation cannot be achieved until a certain amount of aeculturatlon tehee place.
fliers are a number of variables that influence this process of adjustment, all of which cannot be explored in tills investigation* three of the variables presumed to be related to the adjustment ares (1) the local definition of the ethnic group end the ethnic composition of the community into which the Immigrants move, am well as the else and concentration of the ethnic group j (2) the nature of the new social

environment, especially in reference to exposure to rural versus urban environments; and (3) the length of exposure to the new social environ» neat«
Only on» of the «any areas of acculturation has been aeleoted for emphasis in this study. An important taro a of adjustment for insigraats is eocio-aeononic, that la, in factors related to adjustment and integration in a soney «eonony, occupational sueoess, etc. Economic interests ere usually a part of the Motivations of immigrants, and sines the Samoans in Havail are by no mans an exception to this pattern,6 socio-economic adjustaent nay be an important facet of their aceoltur»» tlon.
Perhaps even nore important than overt Bocio-eoonomic adjustment, in the process of aeoulturatlon, is the adjustaent of values and attitudes in this area. Values are those aspects of situations, events, or objects that are invested with a preferential interest as being "good,* "bad,* "desirable,* end the like. Values hare the following characteristics f they are conceptual phenomena, that is, they involve abstraction, they are affectively charged and represent emotion, they are the criteria by which goals are chosen, and they arc of laportanoe to those who express them.7
One of the moat important groups involved in the adjustment of immigrants la the younger generation. Soae of them are Immigrants and others are born to immigrant parents In the new social environment, but moat of the» find themselves between two cultural worlds* They can be
6. Cf,, Eyde, £&. olt*. p. 7.7. Cf., Robin M. Williams, Jr., American Society, (Hew York, 1952),
chapter IX.

expected to approximate the culture of the new society more clonely than do their parents« because they rsore often are exposed to It during the formative years of youth. This study is oonosrned with a number of Samoan end American socio-eoonoadc values and value-oriented behaviors anil the extent to which these are expressed by a sample group of Samoan youth in Hawaii*
A number of specific areas of values and other characteristics of Sanoan youth in Hawaii was investigated. (1) Background characteristics of tha students, their parents, and their families were obtained, in order to describe the contrasting characteristics of the sample and to suggest variables that may be related to the prooess of acculturation* (2) The expression of values and value-behavior that art considered to be, by authorities on Sanoan and American societies, typical of those societies, wars measured* (3) The reporting of actual behavior that implies preferential evaluation In various socioeconomic situations was measured* (A) The expressions of evaluations of various wards representing the socio-economic areas of behavior were measured, and related to expressions of values on other Items* •Methodology
One way of measuring values is to record verbal expressions of attitudes, opinions, and actual behavior. In order to measure the socio-economic values of Samoan youth in Hawaii, s written test of values was constructed, which included Iteas relating to the various areas of investigation.**
8* See Appendix A for complete questionnaire form*
Ib order to avoid «neh interriewing problema as lsde of motivatlon, locatine of subjcets» «to.» it «as deeided that a «ritten test of raines ba adminlatered through toe school aya tan ia a group situation. Tha locatimi of tha sahools «haré tha tast would ba administarad «as determinad by tha ooneantratlon of Sarnosas ia tao areaa» Paarl Barbor and Lale» It «as fouad that tha largaat concantrations of Sarnosas ia sohools ahora tha slemsntary gradas? «ara at Paarl Barbor Interaadiata School aad Kafauku School» Día iataraadiata gradas «ara sale otad for intarviewing at tha lattar aohool to gira a sample coaparable ia aga and sohooliag to tha Paarl Harbor School studaata. Iba Department of Pabilo Instruotion «as oontacted» aad tha paraisaloa of tha auparla* tendente» principáis» and taachars that «ould ba inrolrad «as obtaiaed»
Bafora tha adodniatratloa of tha tast of ralnas at thasa sohoola» tha tast vas pra-tastad oa a sample «lasa of saraath grada atudaats at Starenson Iataraadiata School» After thls pre-taating tha tast form «as r«rissd»
Iba revisad tast «as adminlatered to tha olasaas at tha two schools that contained Saaoan atudaats» At Paarl Barbor latarmadiata School this inrolved aeran social studiaa classes, torea art olasaas» aad four nathamaties classas*3-0 At Kahuku» tha tast «as adminlatered to all •evento» alghth» and ninth grada social studiaa dáseos, A total of
9* lt «as falt by tha inrastigator that satisfactory perforturnee on a «rittan test of valúas could aot ba achlerad «ito groupa balo« tha saraath grada»
10« It «as raquestad by tha principal at Paarl Barbor School that toa tests aot ba adminlatered to only social studiaa dasses» sinos it «as considerad to be mora desirable to iarolrs meara taachars aad Isas tima for any singla taaehsr»

approximately eight hundred students participated la the testing« with almost an equal number at each school* Therefore, the entire Samoan population at each school was included in the sample, with the exception of a few absences« end approximately half of the non-Samoans at Pearl Harbor and all of the noiy*S&moana at Kahuku were tested*
Fro* the total non-Samoan group at each sokool (ell those students who wars not Samoan or part-Samoan) two randoa samples of one hundred students« controlled for ethnie background« were selected,11 The resultant test groups were four| Samoan students fro* Pearl Harbor (30) «12 non-Samoan students from Psarl Harbor (100)« Samoan students from Kahuku (34)» and non-Samoans from Kahuku (100)* Therefore, the total number of students« whose expression of values wars analysed, was 264*
All of the tests ware administered by the writer« with the occasional aid of the teachers involved« who were requested to answer minor questions of procedure« etc.« but sot to infer say response to the questions* The introduction to the test wss Identical in all classes« with an explanation of certain questions that tended to cause confusion« an explanation of the purpose of the test (that it was for a research project at the University of Hawaii^ that there were no oorreot or inaorreet responses to the item« and that the students would
11« The students were classified according to racial background of their fathers end the some ethnie proportions were maintained in the rondo*one hundred for each school* A more detailed description of this con be found in Chapter 111*
12* The totals for the two Samoan groups vary somewhat in the analysis« since a number did not complete the questionnaires.
not b« graded in their school cork on the basis of their performance.It was not revealed that the teat vae focussed oa the Samoan students or that it tested Saaoas values*
the students were allowed to ask as aany questions as they wished« but they were encouraged to complete the questionnaire within the given period if they possibly could* Sosa of the students sere not able to eoaplete the teatj these were retained in the heaoen groups« to the extent that they were ooapleted« and ware replaced in the noa-hamoan saaple by other readonly selected testa, controlled for ethnic back* ground*
The students seemed to be highly-activated, with very few exceptions. Antagonism toward the attninistrator of the test or toward the test itself was expressed by only two students« and alaoet all of the students were openly eager to cooperate because they were being freed fro» a class period of school work* Only one student refused to ooapl*te the test« although a number of students had to be encouraged to couplet« items or seotions they had oaitted* It was fait by the investigator that the administration of the teat was satisfactory in all but a very few Instances*
Because of the nature of the test« it wee felt that the Initial reactions to the Iteas were the aoet desirable« end therefore the students were enoouraged not to spend a long tine thinking about the responses* In the eases where erasures were obvious« the first response was recorded. Also« in the oase of oaitted iteas on the sentence item test« the *Don*t Know" response mam assigned« assuming that the cense of the lack of response was indecision, either Inirelation to the «waning of the iten or the response to it*
In order to analyse the response of the students to the test of socio-economic values a number of variables related to acculturation, and specifically in reference to Saooane in Hawaii »ill be analysed descriptively* The complex of aocio-e oonomie systems and values in Samoa »111 be presented as the base for description analysis*The available information on the Samoans in Hawaii «111 then be Bttrmorised, with particular «aphasia on the relevant information that has been collected to date* Following this description of available information and generalisations on the Samoans in Hawaii, specific background characteristic* of the students in the simple groups, their parents and their families will be presented, with analysis of these selected characteristics in reference to the variables of ethnic identity and location of residence*
Fart of the test of socio-economic values »as designed as a potential scale of acculturation in values* The sentence items were selected from specific references to values and vslue-behavlor in published references on Sumo an and American society, and the students »111 be scored on this portion of the test as a scale and ranked end analysed in this context*
Finally, the expression of values by the students on the tests »ill be described end analysed in reference to the three major variables hypothesised to be related to the procese of acculturation} ethnic background, location of residence, and length of residence in new environment. The analysis will be In reference to four major topic areas) (1) family values and behavior, (2) educational values and behavior, (3) tirae-praperty values and behavior, and (A) occupational values and behavior*

CHAPTER IICOHTEMPORARX SAMOA« THE CULTURE OF ORIGIS
One of the moot important complexes of factors related to the acculturation of immigrants to a new society is that of the social and cultural systems in which the immigrants participated prior to the migration**^ A description of these systems may serve as a point of reference from which to measure the changes in the values and behavior of the immigrants. In other word a, it is assumed that there la a process of change, known as acculturation, which is s movement away fros what was characteristic before migration toward that which is characteristic of the social environment after migration*
For the purposes of this study, that is, to Investigate the values and value-oriented behavior of Samoan youth in Hawaii and ham these are changing, it is necessary to start with a fairly dear conception of what is characteristic of Samoans and caps dally Samoan youth in Samoa* Actually this is practically an impossible task, since source materials on contemporary Samoa are not oomplete or up-to-date* However, what material is available on socio-economic lift in contemporary Samoa must be presented to provide a standard sgainst which ths saaple groups can be m asured* In lieu of testing Samoan interne diate school students in Samoa on the same basis as the sample groups in Hawaii have been tested, a brief description of contemporary Samoan life, with a apodal focus
13. Other factors related to the aoculturation of immigrants are the socid and cultural systems of the new society, indlvidud participation in sub-cultures, personality variation, ate*

on socio-economic values end behavior, will be presented* This material «111 be used later In the analysis of the values and behavior of the Samoans In Hawaii* and deviation from these patterns «ill be noted in the analysis of data*
The Samoan Islands fora an archipelago that lies in the approximate center of both the Faeifie Ocean and the Faoifio Island groups« These islands (three Major and a nuaber of Minor islands) contain over eleven hundred square miles*
Samoa is administered in two sections under the wardship of two nations} How Zealand is responsible for the islands of Savai’i and Upolu («Western Samoa") under a United Nations trusteeship* and tha United States administers Tutuila* the Mann* a group* and several other smaller islands through its Department of Interior* Western Samoa is by far the largest of ths two divisions* with around three-quarters of the total population of Samoa* and ninety-four percent of the total land area* The American area therefore contains about one-fourth of the population and six percent of the land area* its major economic asset being the Pago Pago harbor area*^
The population of Samoa is primarily Polynesian* but there has been a gradual alscegen&tion with non-Samoan traders* plantation workers* sailors* and others* over the entire period of contact with the Ststern world* As the result of this* there is an increasing part-Samoan population in Samoa* Part of these have separated Aram the traditional life* forming s soeially-dlstinct group* Other part-Samoans have been
11
14« Cf** Felix M« leasing* Modern Samoa (London* 1934)* Chapter I*
Integrated into traditional Samoa society, because of the praotiae of accepting «11 children regardless of parentage«^Socio-Economic Structure^
For the purpose of thin study, the area of Samoan life that is nost relevant is that of soeio-eeonoaie activities and values, that is, the patterns of behavior surrounding the quest of nourishment, clothing, shelter, and other valued coaaaodities.17
For the majority of Samoans today, life is still patterned around the core of vhat is known as faaSaaoa. Faabaaoa is the old way of life, titie blend of the aboriginal and the Western cultures, that has been remarkably resistant to change, in spite of continual attempts to stimulate change. Western contact, through traders, missionaries, government, and schools has led to so»» important charges in socioeconomic structure, but faaSaaoa basically persists In essence in spite of these changes, which will be discussed later.
the essential unit of living, under faaSnmofe. both in terms of production and consumption, is not the individual or the married couple and their children, but the extended family, administered by, end focussed toward# its matai. or chief. The family is a residential unit, which usually consists of a group of fale. or houses, with various and numerous relatives of different degrees of relationship that function as an extended family. Economically speaking, the family is local in
12
15. Ibid.. p. 36i Chapter XI.16. Ibid.. Chapter VI,1?. Samoa refers to both Western and American Samoa, axeapt where
otherwise designated*
its functioning» but relatives noy rove between different local units of their feuilles for various purposes and often literally change families, in the local sense* However# responsibilities and ceremonial ties extend to the entire family group# and therefore basic ties remain the same in spite of local changes* Likewise# children in the extended family change their particular house with ease and frequency, as they are allowed to choose with whom they want to live. In all# family ties may extend over entire islands# bstween islands# and even to Hawaii#Maw Zealand# or the Mainland# United States,
Since life in Samoa still involves a semi-subeistenee economy# the economic life of the extended family Is still centered around fishing# maintaining family taro» breadfruit» banana» and coconut plantations» certain special crafts, maintaining the household# and necessary wage* earning. Familles send members to work for wages on company plantations# in the government# etc.# or send food or copra to marl»ting centers «hen money is needed. For most Samoans, however# such employment is not continuous# and life is not centered around a money economy for thoae who still remain within the family system.
The family# under faaSamoa, is organised according to a well* defined division of labor# with even the young member® of the family fulfilling specific responsibilities. The working force is ooapossed of all untitled men of working age In the family# and it is directed by the aatai. who administers and controls all family money and production. «¡Man are responsible primarily for household maintenance# and young girls begin their initiation into their adult roles around the age of ten# when they assume responsibility for smaller children, Xoung boys
uare initiated into skills of living and crafts as they mature, and learn to be working members of the unit from an early age« A period of lack of responsibility cooes for both semes during the adolescent years, and ends with marriage« The majority of men are never awarded a title, but gain their satisfaction and prestige through serving their family and matal.
In contemporary Samoa, some live outside of this family pattern,either through rebellion or through an interest in the new way of lifethat is to be found, especially around the urban areas of Pago Pago andApia« This is most often true of partners to mixed marriages or part-Samoans, who, because of their contact with & family member who is notS01.10an, may not be interested in the semi-traditional way of life*
In this case, the producing and consuming unit is not the extendedfamily, but the nuclear family, that is, the married couple and theirchildren, and the support may be primarily from wages rather than seal-agrioultuxal work. However, even those who work in government, etc.,may maintain economic and social ties with their extended families,and thus merely vary, rather than basically alter, the economic pattern«
In the last few decades there has also been the possibility ofmigrating to New Zealand or the United States for employment. This maybe either a temporary or a permanent arrangement, for many Samoansmigrate to earn money and then return to their homes. On the other hand,many move permanently. The emigrants also have maintained considerableresponsibility to their families in Samoa, some sending money regularlyto their aatal in Samoa, and a few matal who have migrated and conferredthe title on another family member while retaining actual power, byproxy, and even fulfilling responsibilities toward their dependents in Samoa.
\

SfttfPsfittBMlfa &2fi£M18Change in socio-economic patterns quickened after the cosing of
nlselonaries and traders (and the Navy)» Early trader and missionary contacts exposed the Samoans to Western commodities, and encouraged their interest in trading items and money* Samoan tradition had no place for the accumulation of gooda or wealth, hut sponsored the distribution of wealth according to custom* Hoarding property wee not c- part of Samoan behavior, and all property belonged to everyone and anyone in the extended family who wanted it or oould use it* In this setting, the missionaries initiated the accumulation of glfta for tha church, and even sponsored village rivalries in gifts of money to the church, which money could only be earned the eels of oopra to thetraders*^ i
The various nations that henre administered the Samoaa have attempted innumerable times to stimulate commerce, oopra raising, public works, etc«, with a remarkable lack of success*2® Although the use of money fitted easily into the Samoan system, personal ambition or consistent work did not} the contemporary chiefs are Interested in maintaining their power end prestige, which depends upon an extsnded family that oooperatea and actually penalises individual excellence and ambition* Samoans are more prosperous today, that is, more Samoans are able to gain and use various commodities, but there is on the idtole
15
18* leasing, fig. clt*. p* 291*19* Keesiflg, SSL* £&•» P* 296*20* Keesing, op. clt*. p* 33?*
However, there Is also an element of the population which is increasing in alse and which has been affected by its exposure to urban life and wage employment.21 Accelerated exposure to Western influence, especially during the war and through the compulsory school system, has focussed the interests of the younger generation on money and imported commodities* Wage-earning is a possible pre3tlge-galnlng device for the ambitious young man, especially if he has no opportunity to vie for a title within his family situation, and higher education and money has become a means for wielding power within the extended family to gain a title* For those who do not stay within the family, money-earning can be a means for rivalling the power of the family heads, or for removing oneself from the responsibilities of family life* Many young man are finding it preferable to keep their own money, rather than turning it over to their natal.
Since attempts in plantation development have not been particularly successful in Samoa, and since her land is none too large for her growing population, socio-economic change in Samoa has presented a serious problem* This was especially true in the case of the Samoans who had coma to depend on employment with the United States Wavy in Pago Pago, and who wars left without this employment when the Wavy departed in 1951. Already a fairly large number of Samoans have left their homeland for countries where economic opportunity is greater
16a high degree of resistance to change, primarily because of the aatls-factions and rewards found by the members of the old system*
21« Exact statistics on urban Samoa are not available at this time* However, Keesing, as well as other sources, describes the importance of this group*
take pi&oe). the Samoans in Laie ore not conspicuous members of tho eomMunity. One« they have made their Initial adjustment to Hawaii» they seen to have been able to maintain a certain aaount of their tradition without necessarily conforming to the new social environment in ways such as drees» food» or recreation*30 Summary
It seems then that the Seetoane settling in Pearl Harbor and Laie lead different kinda of lives* Pearl Harbor is military-oriented, transient» and urbanised» while Laie is church-oriented» permanent» and semi-agricultural* In both communities the Samoan immigrants have constituted a minority group and hare not been immediately Integrated into the community* However, the Samo&ne In Laie atea to hare adjusted more easily to their new environment primarily because it more closely approximates their former environment, and also apparently because they hare entered the community over a loader period of time* Both Hyde and Forster noted changes in behavior and reported a detectable adjustment to the new social environment. Their studies were dependent upon the memory of the interviewee and reconstruction through specific questioning, but they presented enough information to substantiate the assumption that acculturation of Samoans in Hawaii was and is taking place.31
28
30. These remarks are based on personal knowledge of the writer*31. Bernard F. Pierce, in his study of the Semoans in Laie ("Acculturation
of Samoans in Laie," unfinished ?2a*ter*s thesis, University of Hawaii), reports inaccuracies in tome of the data presented by Eyde. However, his material has been included, with this information in mind, in order to complete the description of research that has been relevant to the present study.
families of Lai« tended to contain more relatives outaide the naclear family than in other areas» with 81 percent of families categorised as "«attended#*^
Eyde found that 65 percent of employed Samoans held unskilled jobs» and that 35 percent held skilled jobs, the wean number of workers per household was 0.8» indicating seme uacnployment. Mean monthly income per household among Samoans in Laie was 1177» but this is not comparable to ineome in other areas sines life in Laie is se«d*agri cultural«
It was concluded that households that organised before 1950 exhibited the highest plane of living in laie. Eyde concluded that since most of ths Lais Samoans cams fro» rural Samoa» living in Laie represented a significant economic improvement, though It might seem a lower plane of living than that of Samoans in wore urbanism! areas on Qahu.^
The Samoans in Laie are not eonoentr&ted in any particular area of the town but are distributed more according to the time of arrival! for instance» newcomers reside in rental units on the outskirts of the town* The town is well*integrated, both on the formal level through the church structure, and informally because of its small aise and the common interests of its residents* Eyde found that 78 peroant of ths Samoan families had only Samoan contacts, but this percentage may be a function of the large aise of the Samoan group there (the greater the possibility of ingroup contacts the more likely that these contacts
2!
28* Eyde, pp. clt«« pp* 7»12* 29. Eyde, £&• j&&.» pp. 1>16.
i

within the extended family* that is, anyone who wants something is weloow to taka it or usa it, regardless of whose effort was expended in getting or keeping it* Prime obligation is to the natal, who can appropriate anything he want# fron hie family, bat beyond this there it no eenee of individual ownership or Jealousy of ownership*
In addition, economic activity in Sanaa was and is a highly-valued part of life* "Work* ia not a separate category of behavior in bemoan cultura, but ia activity that has religious and extended faailial signifícanos* Eoonoaio activity la a very inportant part of life, not just a rasane of gaining the necessary commodities*
One important contact that ¿»añosas have with Sestern culture has been in the school systems in Samoa* School attendance to the ninth grade is compulsory in American Samoa, sod through the primary grades in Sestern Saaoa, and the foous of the education, for the most pert, has bean to interact the students in testera government, values, nor sis, etc*, slsosnte that did not necessarily fit into the Samoan way of life er thought* there has been an attempt to re-foeue the educational ayatca on things Saman, but the attempted indoctrination into ideas of democracy, freedom, equality, capitalisa, etc«, has been a disrupting influence, to the extent that formal education has been successful in ¿anca* ta education increases in Importano* as a status-gaining device, this factor la apt to be one of Increasing Importance*ConclusIons
It can be seen iron this brief description of contemporary Samoan socio-economic structure and values that Samoa has been exposed to Western culture gradually and ever a long period of time* The Samoanst
IS
\
are not an *untouched * paople, although their culture has beaa reaarkably realatant to lnduced changa* In addltion, since the Sanean migrante haré come to Hawai! priaarily for economie reaaons, lt aight be auapeeted that the Sanana in Hawai! are the nost highly aceulturatad of the £ancana, cr at leaat are the group that did not adjuet oatla- factorily to the socio»eeonoade atruotur* la Samoa for rarioua reaaons, auch aa laok of enployasat, lntereat in Veatara coanodltiea, etc.T h e re is soné evidence to support this suppoaitlon, that aigrante ¡aight be more acculturated, in the extended contacta ths aigrants haré had in Samoa with two American instltutlons, the Aeraon Chureh and the United States He*?«
19
4i

CHAPTER inTHE SAM0A1S IN HAWAII* PEARL HARBOR AND LAIE
For the purpose of obtaining general Information on Samoans In Hawaii and specific information on selected background information on factors related to socio-economic adjustment and acculturation, previous investigations of the Samoan immigrants to Hawaii were explored»22 In this way it may be possible to establish the similarities and contrasts of the Samoan groups that were tested to other Samoans in Hawaii, and to point to variables that may be related to expression of socio-economic values» A summary of these materials will bs focussed only on the groups in the sane general areas where the student test groups were, to the exclusion of data on Samoans in other areas on Oahu, In addition, sons information was obtained through interviewing in Laie, and this
22» The bulk of the following chapter will consist of an integrated summary of two unpublished manuscripts iron ths University of Hawaiif David 8« Eyde, *A Preliminary Study of a Group of Samoan Migrants in Hawaii,* 1954, and John Forster, "The Assimilation of Samoan Migrants in the Naval Bousing Area, Pearl Harbor, Hawaii,* 1954» Except there specific note is made, the material presented represents data from at leaet one of these manuscripts, and special note will be made when there is any difference In findings.Special note will also be made when the writer includes information that was obtained from other sources.Eyde in his study investigated the Samoans who participated in ths 1952 migration, which was sponsored by the Navy because it m s leaving Samoa and desired to transfer personnel to Hawaii. Ha studied 464 Samoan» through interviews with the heads of their households,Forster investigated the Saaoana resident in Pearl Harbor Naval Housing Area #3 in 1954, through house-to-house interviews. He was interested especially in family behavior, Forster studied thirty of the fifty Samoan households in this area.

Pearl HarborThe housing areas in and around Pearl Harbor are populated priaarily
by military personnel and their dependents or civilians «ho are employed by the armed services and their dependents* The population is primarily Caucasian, but families of other ethnic backgrounds, such as Samoans, Hawallans, Negroes, etc., sssa to be distributed according to location of available housing «hen they arrived, rather than to factors of discrimination or conscious distribution* The immigrants fro® Samoa in 1952 settled mainly in the Naval Housing Areas, except for those «ho «ere sponsored privately instead of by the Navy* These migrants settled near-by, wherever they could find housing on Oahu*33
The Samoans in the Pearl Harbor area are a young population, with very fee adults over forty years of age, and with a large percentage of children* stoat of these Samoans came from American Samoa, and all of them lived in Tutulla before migrating.34
/Jost of the Samoan families in the Pearl Harbor area (39$) came to Hawaii after 1950, and only U percent settled in Hawaii before 1950* Mean household slse in 1953 was 5*1 persons, and most of the Samoan familisa contained only the married couple and their children (63$) with 37 percent having other relatives residing with them*
21Information «111 be Included to fill 00m gape In data presented inexisting studies of the Samoans In Hawaii*
23* Forster, £g* dt.. p. 27. 24» Forster, Ibid.. p* 28.
The families la the M«ral Housing areas were found to differ froa the non-Samoan families among «boa they were living in handling of finance» conceptions of property and the like« However» the families did display tendencies toward aqualltarlanism between husband and wife*It was observed that the nuclear family remained essentially the same throughout the migration in relation to such factors as parental roles and finance* However» the extended family relations provided an area of tension and change. Sources of Irritation In extended families were due to dislike of financial obligations to matal or family members in Samoa and to obligations of hospitality to all family members coming to Hawaii*
The children In the Samoan families had less freedom than they had in Samoa* lore time was spent by the nuclear family as a whole is recreation and other activities» such as watching television and attending church* A great deal more tension was found to axlst between parents and children than was the case in Samoa* This was attributed to the inability of children to move from family to family as they had» or to wear off their energies out-of-doors*
All of the Samoan household heads In the Pearl Harbor areas were employed in unskilled occupations» primarily with the Navy* The mean monthly income per Samoan household in Naval Housing was $292 (Eyde) or $232 (Forster). Sean monthly income per household In the veterans1 housing areas was $331* toat of the Samoan household heada (70%) planned to return to Samoa as soon as they were free from the Navy» for the reasons that "life Is easier in Samoa» * and that "there are less things
to worry about thaw*25 (quotas by Forster)«Forster reported some interesting observations on oultura change
among Samoans In tha Userai Housing area. Ha found olothing to bo markedly different in Hawaii than it had baan in Saaoaj this was true to a U appearances outaida tha home where tha Samoans conformed to local pattarna of dress» but within tha how all of tha Samoans pro»ferrad the old atyla of dress» such a« lavalecva. On tha other hand,Foratar observsd that food habita had chanced wary little» and that tha Samoan diet in Hawaii was quite different tram the diet of the non- Samoans in the saw areas« Fish, taro» bananas» and breadfruit warsthe staples of Samoan diet in Hawaii«20
The leisure-time activities of Saaoana in Navel Housing were mainly centered around the how) the men watched television or gardened while the women did little else bat housework;« Movies were the moat popular fora of entertainment» aa they are in Samoa» but there was less interest in visiting in tha evenings with other families or in church- going than in Samoa«
Within tha Naval Housing areas» the Samoans seemed to have little contact with the non-Samoans« Host of the Samoan families (64$) had all-Samoan friends, and only one family had regular contact with non- Samoan friends« Communication with neighbors» who were usually non-Samoan» was quite casual» and non-Samoans gave unfavorable opinions of their Samoan neighbors in all but one instance« Objections were
23
25« Forster» £&• olt.. p. 37« 2b« Forster» ibid.» p* 84*
nainly that the Sarso&na ware dirty, noisy, and "light?-fingered." When the Samoans first arrived the pollen considered then to be a problem, but they were no longer considered such at the tine of Forster's study, Indicating that Sas»ana had adapted to their new environment at least to this extent*LaAflZ?
The Samoans on Windward Oahu settled almost exclusively in Laie, a Mormon community of around one thousand persons. Only a few part» Samoans seem to have settled in other near-by areas* The Samoans comprise about one-third of the community, with the rest of the population being predominantly Hawaiian and part-Hawaiian, and with a few Oriental, Caucasian, or mixed families*
The way of life in Laie and the surrounding areas la distinctly different from the highly-urbanised life la the Pearl Harbor areas.Laie is located on a bay, with a coastal plain and with hills andplateaus behind the town* It was originally an Hawaiian village, «hieh
\W*was saleetsd later by the Mormons for their settlement* Even with the additions of a sugar mill, which was later leased to private holders, and many non-Hawaiian families, Laie la still a farm village, rather than an urban residential area*
According to the Mormon-Hawaiian gystea, each family in Laie has its own house on a plot of church land, or rents a house from the church* Bach family is else allotted land for cultivation of taro on the hilla
27. This descriptive material is based on the observations of theinvestigator during a week's interviewing in Laie and other informal contacts over a period of more than a year* The statistical material is based on Eyde's study of twenty-five households in Laie in which 1952 Samoan migrants were resident*

behind the town, to the extent that it vanto such land and uses it«In U m of need» any family la th« community can draw upon th« ehuroh store of food and supplies* For th« Mormon Samoan coning to Hawaii» the appeal of residence in Laie is significant» and most Samoans who live there are silling to eowsute to Barber's Point» Honolulu» or elsewhere for work while aalntaining residence in Laie.
H u way of life in Lai« is now beginning to «hang« drastically as the result of a ooaaunlty development plan that the church began last year. Formerly a one-store» one»gas-station tom» Laie ie expanding with a two-year college» new commercial enterprises» and is absorbing large numbers of strangers. Although them had been previous contact with tourist® and city-dwellara through tours in the Mormon temple and the well-known hilkllatt celebration» Laie was to all appearances a rural village within the web of a metropolitan region.
Samoans first began to settle in Laie in 1917 with the migration to Hawaii of a few individuals and families to *do church work* at ths Mormon temple. A few Samoans earns there every few years» but it was not until the late thirties that the large influx was evident. By far» most of the family units hare migrated since about 1935) before that time the church did not approve of the permanent settling of Samoans in Hawaii» since it felt that they should eventually return to Samoa and remain a part of their own society. Since the church controlled all land and life in the village» permanent settlement was not possible until the policy changed and they were encouraged to ooma and allowed to stay.
25
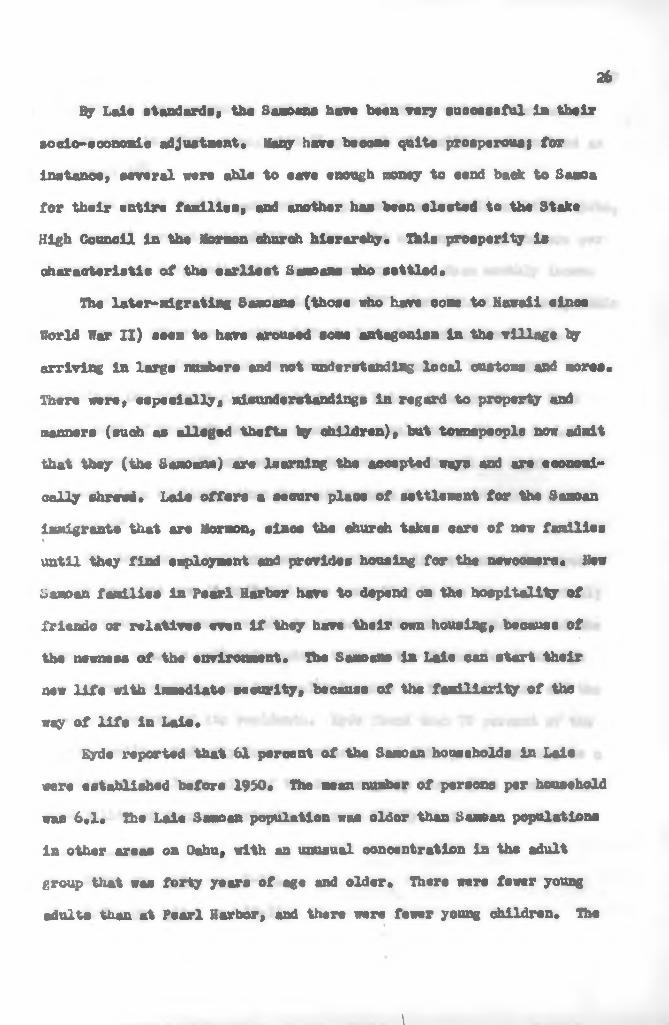
By Lale stand arde, tha Sancana have baan very succassful la thair soclo-econondc adjuetnent. ílany have be come quita proaperoua} for Instanos» sevwral «ora abla to a «va enough raoney to aand back to Sano» for thair entlre familias, and anotbar has baan alected to tha Stake H ig h Counoil in tha ¿formón ahuroh hlerarchy. Thia prosperlty la characteristlc of tha aarliast Sanoans who settled«
Tha later-migrating Samo ana (those who hcva come to Hamali a inca World War II) ata» to hava arouaad soma antagonlsa in tha village by arrivlng in larga nnmbara and not undarstanáing local customa and moras« Thera wara, « lapacially, mieunderatandlngs in ragard to proparty and mannara (sueh as allagad thafts by ohildren), but townapeople now admit that thay (tha Samana) ara laarning tha aoospted vaya and ara aeonomi- cally shrawd. Laia offars a secura placa of ssttlsmnt for tha Samanimmigranta that ara Normen, ainoa tha ohurch takas «ara of naw familias%
until thay find amploymant and próvidas houaing for tha nawoomars« Na« Saman familia# in Paarl Harbor hura to dapand on tha hospitality of friendo or relativa# «ven lf thay have their own housing, booause of tha nswneas of tha enviroament« The Samar» in Laia can start thair xwv lifa with lomadlata seeurity, because of tha familiarity of tha way of lifa in Laia«
Eyde reportad that 61 per cent of the Saman households in Laia «era astablishad befare 1930» Tha mean nusber of persona par household «as 6«1« Tha Laia Saman population waa oidor than Saman populationa in othar areaa on Oahu, with an unuaual concsntration in tha adult group that «as forty yaara of age and oldar« Thera wero fewar youngadulta than at Paarl Harbor, and thera wara favor young chlldren. The«
26
\

families of Lai« tended to contain nor« relatives outside the nuclear family then in other areas, with 31 percent of families categorised as•extended.*28
Eyds found that 65 percent of eng&syed Samexm held unakilled Jobe, and that 35 percent held skilled jobs, the mean number of workers per household was 0*3, indicating sons unemployment* Mean monthly incone per household among Samoans in Lait «as 1177, but this is not comparable to income in other areas since life in Laie le seal*agricultural«
It vas concluded that households that organised before 1950 exhibited the highest plane of living in Laie. Eyde concluded that since most of the Laie Samoans same from rural Samoa, living in Lais represented a significant economic improvement, though it might seem a lover plane of living than that of Samoans in mare urbanised areas on Oahu.2?
The Samoans in Lais are not concentrated in any particular area of the tovn but are distributed more according to the time of arrival) for inetance, newcomers reside in rental units on the outskirts of the town* The tovn is veil-integrated, both on the formal level -through the ehureh structure, and informally because of lie small sise and the common interests of its residents* Eyde found that 78 percent of the Samoan families had only Samoan contacts, but this percentage say be a function of the large sise of the Samoan group there (the greater the possibility of ingroup contacts the more likely that these contacts
zt
28. Eyde, £g. cit.. pp. 7*12.29. Eyde, ¿p. £&t., pp. 13-16*
\

take place). The Samoans la Laie ore not conspicuous members of the community* Qaee they have wade their Initial adjustment to Hawaii, they seen to heart been able to maintain a certain amount of their tradition without necessarily conforming to the new social environment in way® sueh as dress, food, or recreation,^Summary
It see me then that the Samoans settling in Pearl Harbor end Laie lead different kinds of Hires. Pearl Harbor is allitary-orlented, transient, and urbanised, while Laie is church*oriented, permanent, and semi-agricultural. In both communities the Samoan immigrants have constituted a minority group end have not been immediately Integrated into the community. However, the Samoans in Laie seem to have adjusted more easily to their nee environment primarily because it more closely approximates their former environment, and also apparently because they hove entered the community over a loiter period of time. Bote Hyde end Forster noted changes in behavior and reported a detectable adjustment to tee new social environment. Their studies were dependent upon the memory of toe Interviewee and reconetraction through specific question!^, but they presented enough information to substantiate tee assumption that acculturation of Samoans in Hawaii was and is taking place.-*1
28
30* These remarks are based on personal knowledge of tee writer.31. Bernard F. Pierce, in his study of the Samoans in Laie ("Acculturation
of Samoans In Laie," unfinished blaster's thesis, University of Hawaii), reports inaccuracies in some of the data presented by Syds. However, his material has been Included, with this information In mind, in order to complete tee description of reeearte teat has been relevant to the present study.

CHAPTER XVSELECTED BACKGROUND CHARACTERISTICS Of SAMOAN AND NON-SAMOAN
INTERMEDIATE SCHOOL STUDENTS IN HAWAII
Background information for each student end his family was obtained through the administration of a questionnaire* Such information mas considered to tie useful for descriptive purposes, that is, to deaorlbe sons of the important characteristics of the aaqpls groups, and to point to variables that may be significantly related to the processes of acculturation*Location of Residences of Students
The sample groups of students eaae from the following residentialareasf the students from Pearl Harbor Intermediate School earns from homes in the three Naval Housing areas, from Barber's Point, and from Hick am Air Force Base, with a few from other near-by residential districts | the students at Kahuku School earns from the plantation tovn of Kahuku, fro*Lais and from a number of other communities along the windward coast ofOahu*
Table 1 reports the percentage distribution of the location of residences of students in the sample groups st Pearl Harbor* The largest number of students st Pssrl Harbor Intermediate School (41*49) came from a number of veterans' housing projects* A considerable proportion (38.2£) of the Samoans at Pearl Harbor Intermediate School live at Barber's Point, a Naval Air Station located approximately fifteen idles from the school. With the exception of the absence of Samoans at Hiekam Air Force Bass, the homes of these students were fairly evenly distributed throughout the various military and non-military housing areas around Pearl Harbor*

TABLE I. PERCENT ASE DISTRIBUTION CP LOCATION CP RESIDENCES OP STDDENTS AT PEARL HARBOR INTERMEDIATE SCHOOL BX ETHNIC GROUP
30
Location Saboazi(»a 34}
Non-Samoan(H - 100}
Total (Ms 134)
Naval Housing 20*6 19.0 19.4Barber's Point 38.2 17*0 21*6Hlekaa Air Foros Base 0*0 19.0 14*2Other* 31*2 45.0 41.8No responses2 ll.S 0.0 0.0
Total 100*0 100*0 100.0
1. Include»» John Rodgers' Housingt Ualaxra Hones, Ale»» etc*2« Since the queationnairea «ere administered to a large group at
once, it «as not possible to obtain 100 per cent response at times•
Table 2 reports the location of residences of the Kahnku School students« The Samoans in tbs intarasdlats grades at Kahuku School cans from Lais, with only two exceptions. Only a small proportion (14*031) of the non-Saaoaaa cams from that town* The total Kahuku group was rather evenly divided between the three areas*
TABLE 2* PERCENTAGE DISTRIBUTION CP LOCATION OP RESIDENCES OP STUDENTS IN INTERMEDIATE GRADES AT
KAHUKU SCHOOL BX ETHNIC GROUPLocation Samoan
<hT 3 )Non-Samoan(N a 100}
Total (Ns 128)
Laia 85.7 14.0 28.1Kahuku 0.0 47.0 37.7Other* 14.3 39.0 34.2
Total 100.0 100.0 100.0
1* Includes I Hanula, Halelwa, Punaluu, Sunset Beach, ate*
t
n
^ a u A k O L at
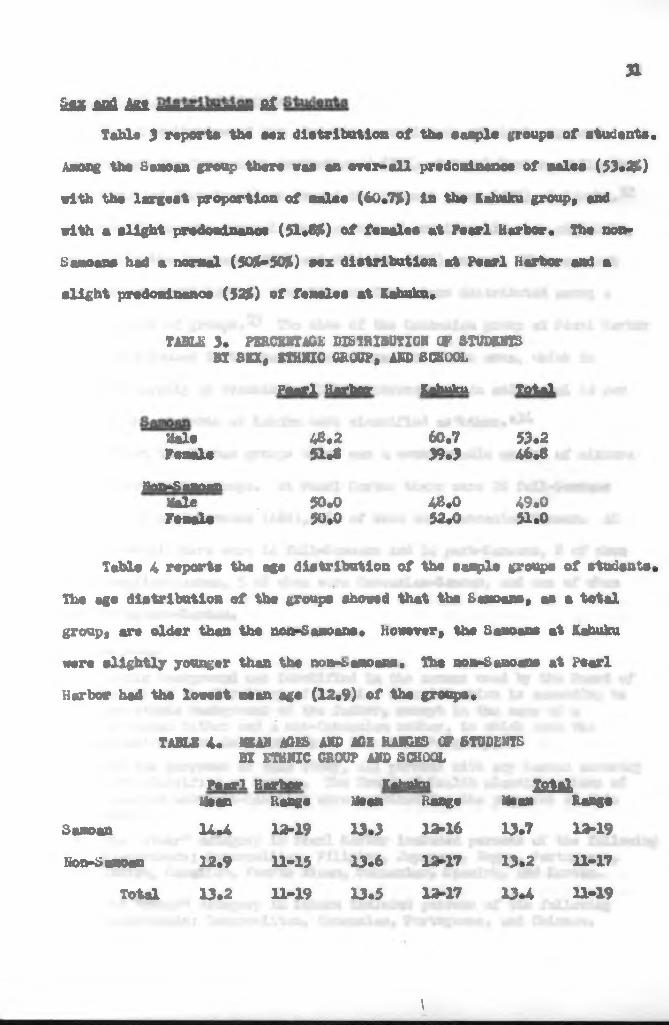
Table 3 raporta tha aax diatrlbutio» of tb« aanpla greupa of studanta. Mfflg the Saaoen group teere wa» an over-all pradomlnanoa of aalaa (53*2&) «I1di tbe largeet proportion of aalaa (60*7%) ln tb» Kahuku group* and «Ith a allght predowtnaace (51*8$) of fanalaa at Pearl Harter* The non- Sanoana had a noarnal <50^—50S&) »ex diatributlon at Paarl Harter and a allght predomlnanoe (53$) of fanalaa at Kahukn.
TABLE 3* P Ä C W M ß * ÖBtRlBÖTlOK QP STUDENTS Bf SEX* ITHNIC GROUP, ASS SCHOOL
Paarl Harber | A d m Total
48,2 60,7 53*251*8 39*3 48*8
50,0 48,0 49*050.0 52,0 51.0
Hala Fanal«
Hon-SanoanMaleFanal«
Tabla 4 raport» the age diatributlon of tha eaaple group« of atudanta* Th« aga diatributlon of tte ^roupe ahoved that the Sanoana* an a total group* ara oldar than tea non-Saaoana. Hoaeaer, tea Sanoana at Kahuku «ara allghtly youn&ar than tha noix-aaoans. Tha nen-Sanoan» at Paarl Herbor had tha lovaat naan aga (12*9) of tea groaba*
TABLE 4* NSA» AßES ANS ÄßE RANGIS OP STODESTB Bl ETHHXC CROUP ANS SCHOOL
Paarl Harter Kahuku M a lMam Ranga lean Ranga leas Rang»
Sanoan 14*4 12-19 13.3 12-16 13.7 12-19Son-äanoan 12.9 11-15 13*6 12-17 13.2 11-17
Total 13*2 11-19 13.5 12-17 13.4 11-19
\
Background Students Haw distribution of th« students according to ethnie background
showed that the Caucasians predominated (60$) at Pearl Harbor, while the Hawaiiane and Part-Hawaiiane formed the laargeet group (43$) at Kahuku«32 However, there were several other groupa of oonslderable sise at Kahuku, especially the Japanese (22$) and Filipino (23$) groups. This was not the earn at Pearl Harbor, with the nonrCaucasians distributed among a large number of groups.33 The sise of the Caucasian group at Pearl Harbor may be attributed to the partloular character of the area, which is oecuplad largely by transient military personnel. An additional 12 per eent of the students at Kahuku were classified as'Other."34
Eithin the ôsmoan groups there ess a considerable amount of mixture with other ethnie groups, it Pearl Harbor there were 28 full-Ssmoans (8291) end 6 part-bamoana (18$), all of whoa were Ceuoesia»»Saaoan. At Kahuku School there were 14 full-iiaaoans end 14 parb-Saaoans, 8 of whoa were Hawailaa-Saaoan, 5 of whoa were Caucaslaa-Samoan, and one of whom was Fcrtugusse«Sam»an«
32
32. Ethnic background was identified in the Banner used by the Board of Health of the Territory of Hawaii. Classification is according to the ethnio background of the father, except In the eaee of *Caucasian father and a non-Caucasian mother, In which case the classification is according to the »other's group.for the purposes of this study, all persons with any hamoan anceotry were classified as Samoan. The Board of Health classifications of Hawaiian and ParVHawallan ware combined for the purposes of this study.
33. The "other" category in Pearl Harbor included persons of the following backgrounds) Cosmopolitan, Fillpdno, Japanese, Hagro, Portuguese, Indian, Hawaiian, Puerto Rican, Guamanian, Spanish, and Korean.
34. Tha "other" category in Kahuku included persons of the followingbackgrounds) Cosmopolitan, Caucasian, Portuguese, and Chineaa.
\
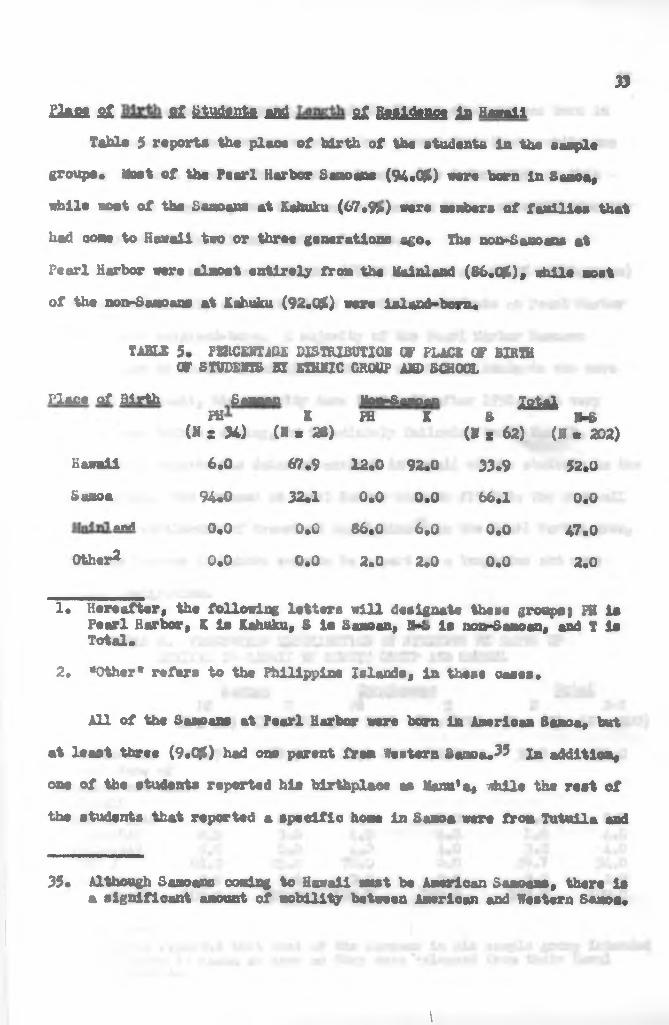
n&s* sí sí fc&Bfonfca asá sí mi&ss» Ib flamiiTabla 5 reporta the plaoe of hlrth of the students 1» the sample
groups. Moat of the Pearl Harbor Sanoane (94.05Q «ere born in Sesma«
while ffloat of the Samoans at Kahuku (67.9S») «ara members of ftuailias that had come to Hawaii too or three generations ago* The non-Samoans at Pearl Harbor «ere alnoet entirely frora the Mainland (86.C5Q, nhile moat of the non-Samoans at Kahuku (92.QSS) «ara island-born.
33
TABLE 5. FBtCEHTADE DISTRIBUTIOM GF PLACE OF BIRTH OF STUDENTS BI ETHNIC CROUP AMD SCHOOL
Place of Birth SamoanPH &
(» S 34) (H * 28)HoiwSj»an«mPH K Is&LS H-S
(K s 62) (N • 202)Hawaii 6.0 67.9 12.0 92.0 33.9 52.0Samoa 94.0 32*1 0.0 0.0 S6.1 0.0
.«a 0.0 0.0 86.0 6.0 0.0 47.0Other2 0.0 0.0 2.0 2.0 0.0 2.0
1. Hereafter, the following letters «ill daaignate these groupsj PH la Pearl Harbor, K la Kahuku, S la Samoan, !K> la non-Samoan, and T la Total.
2. '•Other* refers to the Philippine Islands, la these oases.
All of the Samoane at Paarl Harbor «are born in American Samoa, but at least three (9.056) had one parent from Western Samoa.35 In addition, one of the students reported his birthplace aa Harm's, while the rest of the students that reported a specific home in Samoa «are from Tutuila and
35. Although 3 amo ana coming to Hawaii must be American Samoans, there is a significant amount of nobility between American and Western Samoa.
\

the Pago Pago area. At Kahuku, one of the Samoan students vas born in Western Samoa, end two others reported one parent from there, while one student had both parent# fro« Western Samoa. The information on thie topic was not complete, but there was indication that a eiseable minority of Immigrants to Hawaii was Western Samoans*
Host of the students at Kahuku (67*9$ Samoans end 92.0J& non-Saraoans) were born in Hawaii, end raoat of the noa-Sanoan students at Pearl Harbor (86*0$) were isainlandkborn* A majority of the Pearl Harbor Samoans (85.3a ) came to Hawaii after 1950. Of the non-Samoan students who were not born in Hawaii, the majority came to Hawaii after 1950, with very few who came before, during, or immediately following World far II*
Table 6 reporta the dates of arrival in Hawaii of the students in the sawple group. The Samoans at Pearl Harbor seam to fit into the over-all pattern of settlement of transient population^ in the Pearl Harbor area, while the Samoans in Kahuku seam to be a part of a long-time and more gradual immigration.
TABLE 6. PttQUTJOX DISTRIBUTION OP STUDENTS BI DATES OF ARRIVAL IN HAWAII BY ETHNIC GROUP AND SCHOOL
Samoan tfon-Saaoan TotalPH K PH K S H-a
34
(» a 34) (s • as) (N a 100) (N « 100) (V a 62) (K « 2CHawaiian-born 5*9 Arrival date of students not bornin Hawaii
67.9 12.0 92.0 33.9 52.0
Before 1940 0*0 0.0 0*0 O.Q 0*0 0.01941-1945 0.0 3*6 4 .0 4 .0 1.6 4.01946-1949 5*9 0.0 4*0 4*0 3.2 4.01950 / 85.3 25,0 78.0 0,0 59.7 34.0
Wo response 2*9 3,6 2,0 2,0 3.2 2.0Total 100*0 100,0 100,0 100,0 100.0 100.0
36. Forster reported that most of the Samoans in his sample group Intended to return to Samoa as soon me they were released from their Naval commitments.

Raltelana Affiliation of StudentsTable 7 reporta the religious affiliation of the students* Moot of
the Samoans (53.2#) reported that they attend the «tormon Church, while most of the non-Samoans attend Catholic (30,0%) or Protestant (U*Q$S) churches* this lndloates that there has been sone selection in the Samoan group that migrated on the basis of religious affiliation, since considerably less than one-half of the Samoans in Samoa are Mormon.(ïhers sirs 2,337 Mormons in 1945 of a total population of 62,422. However, most of the Samoans in Laie ware Mormons while a majority of the Pearl Harbor baaoans were Protestants*
TABLE 7* PERCENTAGE DETRIBÜT1QH Of CHURCH AFFILIATIONOF STUDENTS BX ETKBIC CROUP AND SCHOOL
Samoan Non-Samoan TotalPH X PH X s ÎJ-S
(B « 34) <H 8 28) (B s 100) (B 8 100)Buddhist 0.0 0*0 0*0 10*0 0*0 5*0Catholic 17.6 0*0 23.0 37*0 9*6 30,0lOfBOfi U*7 100*0 2*0 22,0 53.2 12*0Protestant 55.9 0*0 64.0 24*0 30.6 44*0Other! 0*0 0.0 4*0 1*0 0*0 2.5None 0*0 0*0 7.0 6*0 0*0 6.5Bo response 11*8 0.0 0*0 0*0 6.5 0*0
Total 100*0 100*0 100*0 100*0 99*9 100*0
1* "Other” Includes sectarian Christian groupa and other including the Salvation Army, etc*
minor groups,
The Kahuku non-Samoan group had ths largest percentage (37*056) of Cathollos; the largest percentage of Protestants (64*0#) were in the
37« Cf., F*J*H* Grattan, Introduction i£ Samoan Custom. (Apia, 1946), p* 6*
Pearl Harbor non-Samoan group» lb« only students that attended a non» Christian church «ere the Buddhist students in Kahuku (10.0%).Friendship Contact» gf Students
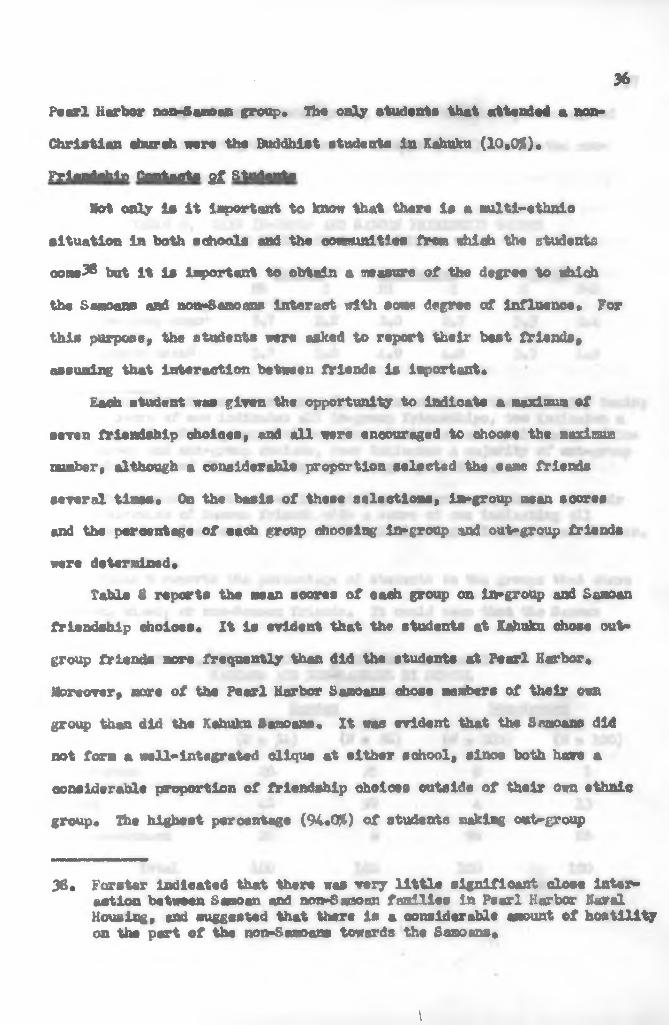
Hot only is it important to know that there is a multi-ethnlo situation in both schools and the eonwunitles fro« ehieh the students com»38 but it is important to obtain a measure of the degree to shlch the Samoans and non-Samoans interact with some degree of influence. For this purpose» the students were asked to report their best friends» assuming that interaction between friends is important.
Each student was given the opportunity to indicate a maximum of seven friendship choices, and all were encouraged to choose 'Use maxima number, although a considerable proportion selected the earn friends several times, On the basis of these selections, in*group msan scores and the percentage of each group choosing ln-group and out-group friends were determined»
Table 8 reports the mean scores of each group on in-group and Samoan friendship choices. It la evident that the students at Kahuku chose outgroup friends more frequently than did the students at Pearl Harbor» Moreover» acre of the Pearl Harbor Samoans chose members of their own group then did the Kahuku Samoans* It was evident that the Samoans did not fora a well*Integrated clique at either school» since both hare a considerable proportion of friendship choices outside of their own ethnic group. The highest percentage (94.0%) of students making out-group
36
38» Forster indicated that there was very little slgnifloant dose interaction between Samoan and non-Sanoon families in Pearl Harbor Havel Housing, end suggested that there la a considerable amount of hostility on the part of the non-Samoans towards the Samoans»
\

choices va» in the Kafcuku bemoan roup, and the smallest percentage of students choosing out-group members an friends (6.0%) was in the non- Samoan group at Pearl Harbor.
TABLE 8. m m »-GROUP AND S AMO AH KHIENÎÜH IP SCQftiS BY OHMIC GROUP AND SCHOOL
Bon-Samoan Totalm X FH X ft R-ft
In-group man1 3.7 2#8 2.0 2.7 3*3 2.4Samoan m m 2 3.7 2.8 4.9 4*8 3.3 4*9
1. Each student mas soared an a five point scale cm the following basinta score of one indicates all in-group friendships, two indicates a majority of in-group choices, three indicates an equal number of ingroup and out- ;roup choice», four indicates a majority of out-group choices, and five indicates all out-group choices.
2. The students were »cored in a similar manner on the basis of theirselection of Bemoan friends with a score of one indicating allSamoan choices and a score of five Indicating all non-Saaoan choices.
Tabla 9 reports the percentage of students in the groups that chose Samoan, mixed, or non-Samoan friends. It would seem that the Samoan
TABLE 9. PERCENTAGE OP FRIENDSHIP INTERACTION OPSAMOANS AND NON-SAMOANS BI SCHOOL
Samoan Non-SamoanFff
(X a 34) (K wK28)PH
(ft c 100)X
(M a 100)All Samoan 26 35 0 1Mixed 48 59 4 13All non-Samoan 26 6 96 86
Total 100 100 100 100
groupe care hlghly out-group orientad, aince only 26 par cent al Pearl Harbor and 6 par cent ai Kahuku dld not ohoosa non-Saaoan friande« Very fa« of the no»-Seaoans chose Saman friands (¿Jt ai Pearl Harbor and 1K* al Kahuku), and thia would sa«» lo indicate that either the Saman oui» group dioicas «ara noi racdproeaied or a very anali xaiober of non-S amans «ara interacrting «ith a largar nuatoer of S amana« In all, li would man that the Samane ara not a eslfViaolatsd cliqua, faut, in tara» of friend» ship, «ara laolaiad fagr thè exclusion firoa tha nenróamoan group.
Proa thia data, ii la évident that iba Sanoana «are highly out-group orientad. Thia m y faa baoauae of tha anali nuabers of Semana in tha total population, einca a aaall group vould faa aera api io have out-group contacta than a large group« The Samaae at Kahuku had the laaat anount of in»group aeeooiatlon« Thare «aa a «arked différence faetween Sanoana «ad non»SaraoanB on tha faaaia of dagraa of ethnie interaction«isg gafl Su Iffle sí M ìbìì
Informilo« in referenee io the parente of tha mafoera of the teat groupa «aa alao obtained. Struse the atudenta «are stili more-or-lese functionlng aa obera of houeahold unita, eom faoters pertaining io tha parental generation «are thought to be of sene importance«
Tabla 10 reporta tha aga distribution of tha parante by ethnie background. Xt «aa found that tha parante of tha Kahuku atudenta tended to be mudi older than tha perenta of the atudenta at Pearl Harbor« In generai, the youngeat parante «ere dui parents of tha non-Samane at Fearl Harbor«
38
\

39TABLE 10, PERCENT ACE DISTRIBUTION OF AGE OF PARENTS EOT
ETHNIC GROUP AND SCHOOL OF CHILDSamoan Non-Saaoen Total
PH X HI K & N-SC»e 34) (Se 28) (N* 100) (X « 100) (X e 62) (He 200)
FATHERSUnder 40 32*4 14*3 71.0 23.0 24.2 47*040-49 58.8 35.7 25.0 50*0 48*4 37.550*59 5*9 4& *4 3.0 18.0 24*2 10.560 end over 2*9 0.0 0.0 6*0 1.6 3.0«0 rtsponss 0.0 3.6 1.0 3.0 1*6 2*0
Total 100.0 100*0 100.0 100*0 100*0 100.0MOTHERSUnder 40 55.9 50*0 84.0 54.0 53.2 69.040-49 38*2 35.7 14.0 30*0 37*1 22.050-59 0.0 10.7 1.0 10.0 4.8 5.560 and over 0*0 0.0 0*0 1*0 0.0 •5No response 5.9 3.6 1.0 5.0 4.8 3.0
Total 100.0 100.0 100.0 100*0 99.9 100.0
Birthplace and Length $£ Residence ag Parents• Table 11 reporta the birthplaee of the parente* Infornation about
the birthplaces and dates of arrival of parents shoved the sons over-all patterns as for their children* However, most of the parente of Kahuku Samoans (75.C# of fathexs and 78*6$ of »others) migrated fro® Sanoa, with smaller proportions of then being Hawaiian-born than thair ohildran* However, noet of the non-Samoan parents in Kahuku were Hawaiian-born (59*0$ of the fathers and 77.QJ6 of the mothers).
\

40TABLE 11» PERCENTAGE DISTRIBUTION OF BIRTHPLACE OF PABLUIS
Bï ETHMC GROUP AND SCHOOL €T CHILDSamoan Non-Samoan Total
FK K FH K t M(H s 34} (K * 20} (H « 100) (H « 100} (K *62} <H « 200}
FATHERSHawaii 3.0 14*3 3.0 59.0 3.1 31.0Samoa 97.0 75.0 0,0 1,0 87 .1 .5Orient 0.0 0.0 1.0 6,0 0.0 3.5!1»4ul arf H«H* 0.0 10.7 91,0 11.0 4.8 51.0Other 0,0 0.0 5.0 23.0 0.0 14.0
Total 100.0 100.0 100.0 100.0 100.0 100.0HÜTK2RSHawaii 0.0 21.4 10.0 77.0 9.7 43.5Samoa 100.0 78.6 0.0 0.0 90.3 0,0Orient 0.0 0.0 0.0 6.0 0.0 3.0«a«w1»nr> U^S# 0.0 0.0 37,0 6.0 0*0 46.5Other 0.0 0.0 3*0 11,0 0,0 7.0
Total 100.0 100.0 100.0 100.0 100.0 100.0
Table 12 reports the dates of arrival of the parents* The majority of fathers (68*6§6 Samoan and 69.0$ non-Samoan) at Pearl Harbor hare ooae to Rosali sinos 1950* Khile a aajerity (60.05t) of the non-Sanoans at Kahuku ««re bom la Hawaii* the Kabuka Saaoan fathers hose migrated to Havall war the entire period, with « gap daring the war years.
Except la the Pearl Harbor Saaoan group, the »others showed aere of a tendency to be H«vallan-barn* The Saaoan »others showed a stallar pattern of arrival dates as the fathers, «1th ao«t of the aothers arriving in Hasan after 1941 In the Pearl Harbor group, end with the aoveneat of the Kahuku aothers into Hawaii spreading over a wider range in tlm*
\

a
TABLE 12« PERCKHTAGS. DISTRIBUTION OP DATES (7 ARRIVAL III HAWAIIOF PARENTS iff ETHNIC GROUP AND SCHOOL QP CHILD
_ ito>-&aaPan TotalPH X Ffl X S N-S
(N m M ) (Mm 28) (N • 100) (M • 100) (R - 62) (H » 200)FATHERBorn in Hawaii 2.8 17.9 3.0 60.0 9.8 31.5Before 19A0 0*0 35.7 10.0 31.0 15.9 20.51941-1945 14.3 10.7 11.0 2.0 12.7 6.51946-1949 8.6 7.1 4.0 1.0 8,1 2.51950 or after 68.6 21.4 69.0 6.0 46.7 37.5No response 5.7 7.1 3.0 0.0 6.5 1.5
Total 100.0 99.9 100.0 100.0 99.9 100.0MOTHERBorn in Hawaii 0.0 21,4 10.0 77.0 9.7 43.5Before 1940 5.9 35.7 6.0 15.0 19*4 10.51941-1945 21.7 3.6 2.0 1.0 8.1 1.51946-1949 11.7 3.6 4.0 0.0 8.1 2.01950 or after 70.6 25.0 75.0 6.0 50,0 40.5«o response 0,8 10.7 3*0 1,0 4.7 2.0
Total 99.7 100.0 100,0 100.0 100.0 100,0
Occupational Levels $>£ ParentsTable 13 reports the occupational level of the parents. Information
on the occupations of the parents of the members of the test groups showed that a large percentage (47.1$ of the Samoans and 87.0$ of the non-Saaoane) of the fathers of the Pearl Harbor students were employed by military agencies, although some ware enplcyed by the military In «drillan capacities. The father* of the non-Samoans at Kahuku wars employed almost entirely (85*056) on the bine collar level, while the Samoan fathers at Kehuku ware fairly well-distributed between the various occupational levels*
The Kahuku group (14.356 of Swoam and 26*0% of the non-Samoans) hadth* highest proportion of employed mothers, while the Pearl Harbor group(5.9% of Sraotm end 15.0% of th* non-Samoans) had the lowest percentage of employed mothers.
\

¡u
TABLE 13. PBKCEKÏJCE DIOTRIBIJTIOJI Cf PARU«S» OCCUPATIONAL LEVEL 3Ï £TH£IC ÜKOÜP ABD SCHOOL CT CHILD
. ■ arnoan TotalKon-Saaoan .Hi K PH K &
(X « 34) (I » 2ß) (K • 100) (X 3 100) (X • 62) (X * 200)FATHER Blue Collar Shite Collar miitary Unemployed Retired Don’t know1
23.5 11.8 47a2.95.9 8.8
35.717.921.43.60.0
2 1aTotal 100.0 100.0
»OTHERBlue Collar 0.0 3.6White Collar 5.9 10*7Military 0.0 o.QUnemployed 94a 71*4Retired 0.0 0.0Don’t know 0.0 14*3
Total 100.0 100.0
9*0 85.0 29.0 47.04.0 5.0 14.5 4.587.0 9.0 35.3 48.00.0 1*0 3.2 0.50.0 0.0 3.2 0.00.0 0 *0 14.5 0.0100.0 100.0 99.9 100.0
6.0 19.0 3.2 12.59.0 7.0 7 U 8,01.0 0.0 0.0 0.584.0 74.0 83.9 79.00*0 o.o- 0.0 0.00.0 0.0 6.5 0.0
100.0 100.0 100.0 100.0
1« "Don’t Jmovj" inoludee both no reeponse answers and positive answer» that do not indicate the level of eeploynent. In the caee of the Bothers, ell in ths<tk>n*t know" category were csployed*
aOlglMi S£ ParentsTable 14 reporta the religious affiliation of the parents. Church
attendance among the parents was similar to that of their children but fewer of the parents were obarca-g©ers. The highest percentage of church-going parents was among the Fearl Harbor Samoans (91.2* reported attendance at some church), and the parsate that attended church the least were those in the Fearl Harbor non-Samoan group (36.0$ of the fathers end 25.0% of the »other« reported that they did not attend church.)
\

43
Sjsaas Nen-Sflaoaa Total3PH X HI K £»
(M b 34) (N m 28) (» - 100) <» - 100) (N s 62) (N » 200)
TABU 14* PERCENTAGE DISTRIBUTION OT PARENTS BI CHURCHESACTIilftU m ETHNIC CROUP AND SCHOOL OF CHILD
FATHERBuddhist 0.0 0.0 0.0 10.0 0.0 5.0Catholic 14.7 0.0 13.0 26.0 12.9 19.5ffcraon 11*8 85.7 2.0 17.0 48.4 9.5Protestant 64.7 3.5 46.0 16.0 30.6 31.0Other 0.0 0.0 3.0 1.0 0.0 2.0Nona 0.0 10.7 36.0 30.0 3.2 33.0No response 8.8 0.0 0.0 0,0 4*8 0.0
Total 100.0 99.9 100.0 100.0 99.9 100.0lOKQBtBuddhist 0.0 0.0 0.0 12.0 0.0 6.0Catholic 23.5 0.0 21.0 33.0 12*9 27.0Mormon 14.7 89.3 4.0 18.0 4&*4 11.0Protestant 52.9 3.6 45.0 19.0 30.6 32.0Other 0.0 0.0 5.0 1.0 0.0 3.0None 0.0 7.1 25.0 17.0 3.2 21.0No response 8.8 0,0 0.0 0.0 4.8 0.0
Total 99.9 100.0 100.0 100.0 99.9 100.0
There were differences In church-going among parents, both between schools and between ethnlo groups. More Samoa» were church-goers, as Indicated by the Information given by their children, than non-Samoans, and awe Pearl Harbor Samoans attended church than Kahnktt Samoans. On the other hand, sore non-Samoane at Xahnku reported church attendance than non-Samoans at Pearl Harbor. Further, more mothers tended to be church-goers than fathers* ifaHBMWMI Si. Parents
Table 15 reports the languages that the parents were able to speak. The ability to use English and other languages by parents was tabulated as an item of the acculturation of the parents, and as an indicator of the languages used by the relatives close to the Bemoan and uon-Banoan

students. The large majority of all Samoan parents (99*0$ of fathers, 93*556 of mothers) and the majority (76*056 of fathers, 67.056 of mothers)
vof the non-Samoan parents at Kahuku vere bi-lingual. Only 5,9 per cent of the Samoan mothers at Pearl Harbor and 2.0 per cent of the non-Samoan mothers at Kahuku were reported as unable to communicate in English.
TABLE 15. PERCENTAGE DISTRIBUTION OF PARENTS ffliO COULD SPEAK VARIOUS LANGUAGES BY ETHNIC GROUP AND SCHOOL Of CHILD
44
Non-Samoan TotalPH K Hi K S N-S
(N - 34) (N - 28) (N - 100) (N « 100) (N s 62) (M = 200)FATHEREnglish only 5.9 10.7 64.0 24.0 8.1 44.0Bi-lingual 94*1 89.3 36.0 76.0 91.9 56.0Non-English only 0*0 0.0 0.0 0.0, 0.0 0.0
Total 100.0 100.0 100.0 100.0 100.0 100.0MOTHEREnglish only 0.0 7.1 73.0 31.0 3.2 52.0Bi-lingual 94a, 92.9 27.0 Éff.ü 93.5 47.0Non-English only 5.9 0.0 0.0 2.0 3.2 1.0
Total 100.0 100.0 100.0 100.0 99.9 100.0
Iii£ Z&SUA&& °I *&&£&£
The dotscription and analysis of the family group ia of importance, since migration usually takes place with the family as the unit. This is often true, even when family members migrate at different times, since migrants often send for other non-migrant family members as they save money in their new occupations. Therefore, variables which may be found in family structure among immigrants and among the resident population may he of importance in acculturation.
Two types of family groups will be described for the purposes of this study. The first is the "nuclear" family, which consists of the married
\

ooupla and all of their children. The mean sise and sise range of the nuclear family in the four groups vae deter mined by asking the student# to give the numbers of their brother# end sisters»#? and by adding tvo parents to this total« The else of the "household* was also determined» by asking the students how maay people live at their houses at the present time.
Among Samoans eoaing to Hawaii» movement mas usually by a married couple and their children, or the nuclear family unit« Quite often tie# with the extended family in Samoa were maintained by the nuclear family
that migrated, sometimes to the extent of regular financial obligation«
Also residence in Hawaii has usually been in the form of a nuclear family unit, with only fringe relatives who do not have families, or »ho have not yet settled in the new environment, included in the household
temporarily.
However, among Saaoane in hale, probably because of the longer time of residence in Hswaii, a much larger number of the households contain
permanent resident relatives who are not part of the nuclear family«The extent to which these relatives are present and the number of children
in the nuclear family may be indicative of change in family patterns among Samoan# in Hawaii«
Table 16 reports the mean aise end range of else of nuclear faxillae*. It was found that the largest nuclear families in the sample groups were
among Samoans (a mean else of 9«5 at Pearl Harbor and 9«6 at Sahuku).
45
39. A H brothers and sisters were included» regardless of blood relationship to students« This is to account for the Polynesian tradition of adopting children and *w<*iuri<ng them in the family with no distinction from biologically-related children«
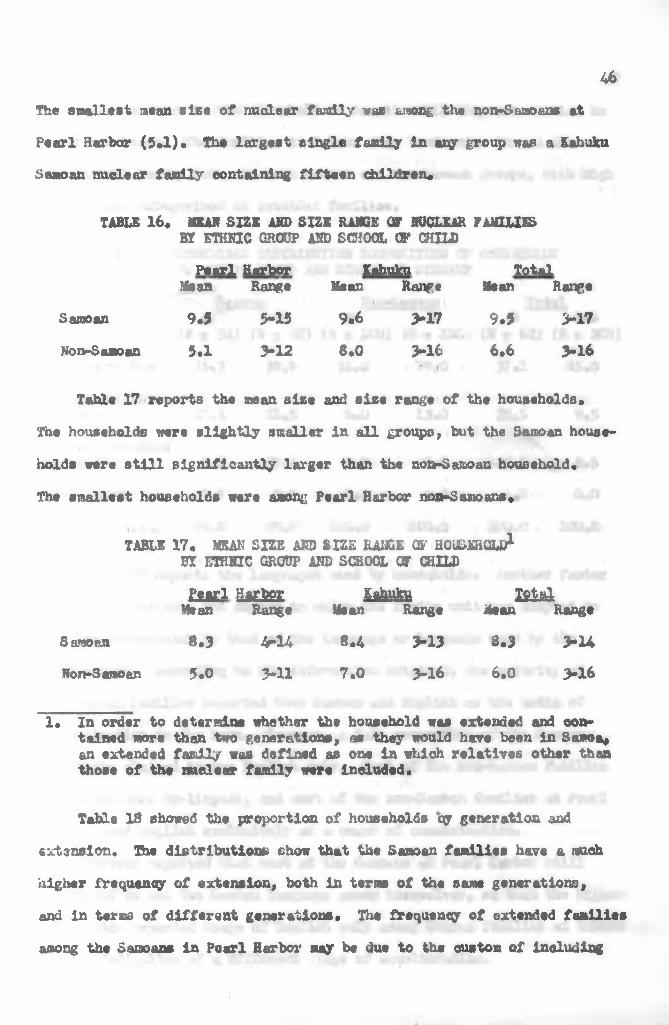
The smallest mean size of nuclear family was among the non-Samoans at
Pearl Harbor (5*1)* The largest single family In any group was a Kahuku
Samoan nuclear family containing fifteen children*
TABLE 16* MEAN SIZE AND SIZE RANGE OF NUCLEAR FAMILIESBY ETHNIC GROUP AND SCHOOL (F CHILD
Pearl Harbor Kahuku Total
46
Mean Range Mean: i
Range Mean Range
Samoan 9.5 5-15 9.6 >17 9,5 >17
Non-Samoan 5.1 >12 8,0 >16 6,6 >16“ i
Table 17 reports the mean size and size range of the households*
The households were slightly smaller in all groups, bit the Samoan house
holds were still significantly larger than the non-Samoan household.
The smallest households were among Pearl Harbor non-Samoans,
TABLE 17* MEAN SIZE AND SIZE RANGE OF HOUSEHOLD1 m ETHNIC GROUP AND SCHOOL OF CHILDgfjgi m & x i m e i s mMean Range Mean Range Mean Range
Samoan 8.3 4*14 8.4 >13 3.3 > UNon-Samoan 5.0 >11 7.0 >16 6.0 >16
1* In order to determine whether the household was extended and contained wore than two generations, as they would have been in Samoa# an extended family was defined as one in which relatives other than those of the nuelear family were included*
Table IB showed the proportion of households cy generation and
extension. The distributions chow that the Samoan families have a much higher frequency of extension, both in terms of the same generations,
and in terms of different generations. The frequency of extended families among the Samoans in Poarl Harbor may be due to the custom of including
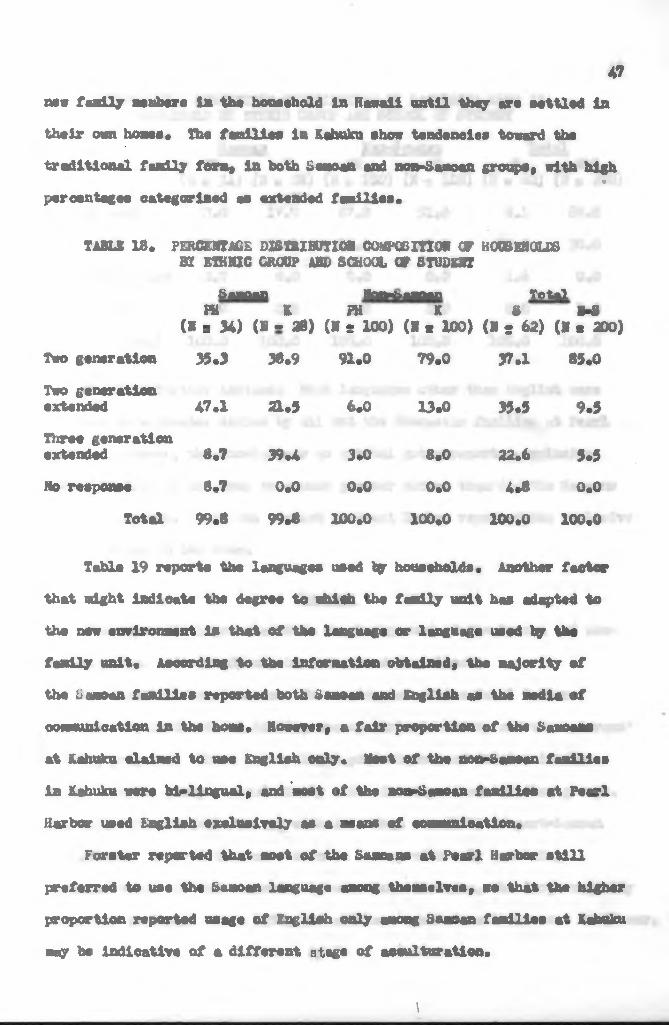
M W fafflily neobere in the household la Hawaii until they are settled In their own hones* The fanilles In Eehuku show tendencies toward thetraditional family for»» in both Seaoan and non-Eanoan groupe» with high
uSy O f « Jp Kpj
percentages categorised es extended families.* 4'"‘ , > e
TABLE IB * PERCENTAGE DISTRIBCTIOB COMPOBITIOH GT HOUSEHOLDS BE£ ETHNIC CROUP ABE SCHOOL OP STUDENT
Saraoan HonK>anoan Totalis s m K s N-s
(N s 34) (K - 28) (M s 100) (B « 100) (B t 62) (H . 200)
47
Two generation 35.3 38.9 91.0 79.0 37.1 85.0Two generation extended 47.1 21.5 6.0 13.0 35.5 9.5Three generation extended 8.7 39.4 3.0 8,0 22.6 5.5Ho response 8.7 0.0 0.0 0.0 4.8 0.0
Total 99.8 99.8 100.0 100.0 100.0 100.0
Table 19 reporte the languages used ty households. Another factor that might indicate the degree to «hioh the family unit has adapted to the new environnent la that of the language or language used hr the f sadly unit. According to the inf creation obtained, the Majority of the Sanean faailiea reported both Saman and English as the sedia of oowauiieatiott in the hoM* However, a fair proportion of the SaaoaM at Kahuku clained to uee English only. Most of tha noo-Saman f saille a in Kabuku ware bl-lingual, and ‘met of the non-Sanoan faailiea at Pearl Harbor Mod English exclusively as a aeam of aoamnnieation*
Fctrater reported that mat of tha Smmkw at Pearl Harbor still preferred to M e the Samoa language anong the suelves, so that the higher proportion reported Mage of English only saoag Saman faailiea at Kahuku aay be Indicative of a different stage of acculturation*
\

48table 19 « percentage disthibutioh cp languages used in
HOUSEHOLD EOT LTHHIC CROUP AND SCHOOL OF STUDENTSamoan Non-Samoan Total
PH K PH K S N-S(X * 34) (H * 23) (H » 100) (I - 100) (H . 62) (N = 200)
English only 0*0 17.9 87.0 51.0 8.1 69.0Bi-lingual 97.1 82.1 13. 0 47.0 90.3 30.0Non-English only 2.9 0.0 0.0 0*0 1.6 0.0No response 0*0 0*0 0.0 2.0 0.0 1.0
Total 100.0 100.0 100.0 100.0 100.0 100.0
Th* data further indicate that languages other than English vara utilized to a greater degree by all but the Caucasian families at Pearl Harbor« However, the non-Samoans ae a total group reported exclusive use of English in the home to a such greater extent than did the Samoans as a total group« Only one student at Pearl Harbor reported the exclusive use of Samoan in the hone*
SuaraaryThe major findings related to the background of the Saaoan and non»
Samoan groups under study aey be summarised as fallows*1« Pearl Harbor Saaoans« The residences of the Pearl Harbor
Samoans were in the Naval Housing areas» Burbar’s Point» and the veterans’ housing projects* There was e slight predominance of feaalss in the group, and the group wee relatively older in comparison to other groups*The majority were full-Samoan, with leee than one fifth of par t-S «moan extraction* Most of them were born in Samoa» with only two being Hawaiian»born. Of the student« who were born in Samoa» the large majority have come to Hawaii since 1950» and all hove come since the second world war*
\
Most of tills group vers Protestant church-goera, although largo mlnarltiss attend Cathollo and Horaon churches* float of than ohoso friends outside the Saaoan group, although over ons-quarter of than choee only Samoan friends*
The majority of the fathers of the Saaoane at Pearl Barter «ere between the ogee of forty end forty-nine, «hlle most of the aethers were under forty years of eg#« All of the «others, end elaost «11 of the fathers ear« tern la Samoa, end the najority of both fathers end »others migrated to Hawaii after 1950, The largest group of the fathers sere employed by the military agencies, in civilian or military positions*Only one aether mao employed* The majority of both parents were Protestant, but there «re «cere mothers who were lor »on and Cathollo than fathers*Almost all of the parents sere able to speak both Ei«liah and Saaoen, with only one »other who «as not able to oomsmioate in English*
Kuol* ar families «era large, with a range of from three to thirteen children* Households range froa four to fourteen persons* households are alaost entirely two-generation, bat almost half Included relatives outside of the nuclear family* The bulk of the households used English and Saaoan an a means of oowminioation* Only one family reported exclusive use of Saaoen and none spoks English exclusively*
2* Fsarl Harter Non-Samoans, Tbs noa-Sasnsn student® at Fsarl Harbor live at Acral Housing, Barter's Point, Hiokaa, end at the various veterans* housing projscts* She group m m predominantly Caucasian and evenly distributed between aales and females* Approdaately one-fifth of the Pearl Harter noa-Saaoan groups was composed of the diverse ethnic groups resident in ths Territory. Tbs Pearl Harbor non-Samoans wars the youngeet of the group«, with ages ranging from eleven to fifteen year«*
49
\

Moat of the students were born on th« Mainland United States end most of then cane to Hawaii after 1950» The majority ware Protestants, with a else able group of Catholics* They chose largely in» group friends, with only four students choosing friends outside of their ethnio group*
Most of the parents were under forty years of age, and alnost all of then were bora on the Mainland United States* The majority of the parents cane to Hawaii after 1950» Almost ell of the fathers were military personnel, while sixteen of the mothers were etqxLoyed* The churcb-going parents were Protestants or CathoU.es* Approximately one- third of the fathers, and one-fourth of the aethers did not attend church* Students reported that over one-third of their fathers, and over one- fourth of their mothers were able to converse in a language other then English*
Nuclear families In this group were relatively smaller with a range of from one to eleven children* There was an average of five persona per household* Nearly all of the households did not contain relatives other than the nuclear faally members* The large majority of faniliee use English excessively in the horns*
3* Kahuku Samoans. Almost all of the Samoans at Kahuku School lived in Laie* There was a predominance of boys in the group, and tha mean aga was 13*3 yeara, with ages ranging from twelve to sixteen* The group was divided evenly between full-S aaoane and part-Sanoans* About two-thirds of the group was born in Hawaii, and tha remaining third was barn in Samoa* Only one of the first-generation students ease to Hawaii before 1950* All of then wera Hormone* Almost all of the students chose friends outside their own ethnic group, end only one chose Samoan friends exclusively*
50
\

Host of the fathers of these students sere between the ages of forty and sixty years, end ell of the mothers were under fifty, with half of then under forty years of age« Approximately three-fourths of the parents were born in Sanaa, but three of the fathers were barn in the Mainland United States« the fathers divided between the three categories of employment, with the largest nuaber in blue-dollar Jobe« Four of the mothers were employed« The large majority of the parents were Hormone, but one father and one mother were Protestants, and three fathers and two mothers did not attend church* All of the parents were reported to be able to use English, and a few spoke English exclusively*
The nuclear families in this group were large, with a ran je of one to fifteen children in the families and an average of 9*6 per family« Households were also large, with an average of 8.4 persons per household« The majority of the households were extended, with only a little over one-third being nuclear« None of the families used only Samoan as a means of communication at home, but several used English exclusively«
A* Kahuku Non-Samoans« A large nuaber of the non-Samoans at Kahuku School lived in Kahuku, but many of them also lived in a number of other near-by communities. Only fourteen students lived in Laie* The group had a slight predominance of femaJ.se« The mean age of the group wee 13*6 years« The group was largely Hawaiian and Part-Hawaiian, with also a fair representation of Japanese end Filipino students. All but eight of the students were born in Hawaii« Ten students were Buddhists« The remaining were Catholica, Hormone, or Protest ants« Host of than chose only members of their own ethnic groups as friends, and only e few ohose friends outside of their own groups.
51
\

ftore than on»-half of the fathers of this group of students vert between the ages of forty end forty-nine years while an equal proportion of the Bothers were under forty years of age, A majority of both fathers and »others were born in Hawaii, Almost all of the fathsrs and approximately one-fourth of the »others were employed primarily in blue-collar occupations, a larger proportion of the anthers than the fathers attended ohurah. Almost ant-third of ths fathsrs were reported as no»-church goers. The religious affiliations of parents ware fairly evenly distributed among the various religious groups represented in the community* The majority of the parents were able to speak both English and another language« while one-fourth of the fathers and approximately one-third of the mothers spoke English exclusively. Only two of the mothers were reported unable to coxnaunioate in English,
Families in this group ranged in sise from three to sixteen persons, with an average of eight persons par family. Average household sise was seven persons, with a range from three to sixteen, nfest of the households are unclear. Only one-fifth of the household contained relatives other than nuclear family members.
52
\

CHAPTER TSOCIO-BCOSOMIC VALUES GSF SAMOAN AND NO»-SAMOAK> IN HAWAII
la carder to Masure the acculturation of Sanean youth in Hawaii la terne of socio-econoslc values, • test of values «es adnintstered to the saaple groupa of intermedíate school studente.^0 The expression of values hy the atudants cm the test vas analysed in tero waysf firet, as a ne asure of tbalr acculturation on a s cale of values fro» Saaoaix41 to Amerleant«* values, end second, in terme of • number of tapie erees trader the general ares of eocio-eeoaomle values«
26* iifltidtallâflft StiMlA The test of soolo-eaoaomle velues «aa devisad vith the possibilité
la nind of ueing the sentence item as a series of attrihutes of the value eooplex iaplielt in soeio-econoale hchavlor. This eeriee of attrihutes, if it nade possible a seale of values along whlch individúale and groupe eould be naasured, would provide an objeotive masure of the degree of acculturation of the Samoan groupe to Email«
The test oonslsted of a serles of statemnts that vers derivad trm
Infor nation given in publications in refereaoe to Aaerloan and Saaoan cultures« The item «ere «elghted arbitrerily in the direction of the Aaerloan responso, and eaeh individual in the aasple groupe «as scared in
40« Ses Appendix A for the couplets test of velues«41« Referenoe to Saaoan values are drama fron the description of
eontemporary Senoa in Chapter II«42« Cf., Rohin 1« William, Jr«, Aaerlcan Society. (Ne« York, 1952),
Chapter 31.
terns of these weights, and was ranked according to the total soare, The upper and lower qusrtllo of the ranked subjects were separated, and each lten in the scale was tested for significant differences between the awans of the upper and lower quartlle groups, the Item that did not distinguish significantly between the quartiles were discarded, and the indlwidual respondents were resoared on the basis of the remaining lteae that did show a significant difference.
The scale items were then cross-tabulated on the basis of the following variablesj ethnic group, cehool, end sex. The significant variations wsrs determined by the use of the *T* test of significance.^
A split-half test of rcllabllity44 was than confuted for tha entire regaining scale, and it was determined that thera was not sufficient correlation to warrant the use of the seals as a total unit. Therefore, the original items that had been discarded on the basis of the internal consistency test were restored, «ad the total seals was sub-divided into the following scries of scales| overt versus ideational behavior, Samoan versus American items, and family Items, Split-half tests of reliability were computed for each of these three sub-aeale systems. There was not sufficient correlation to warrant the use of any of the aub»aoelee.
Finally, the ltene were re-ordered to eliminate any possible patterning of answers that might be mechanical. A split-half test of reliability was run on the total seals and the various sub-seals systems,
54
43. Cf„ Lillian Cohen, Methods ¿SSL SfiSM SfilSfliifiM»(Mew York, 1934), pp. 103-105.
44* Cf., Killian J, Goods and Paul K. Hatt, Methods jtn Social Research.(New York, 1952), pp. 232-239,
\
and correlation coefficient* «ere insufficient to Justify the us« of any of the scales*
I« conclusion, it m y be hypothesised that a «mirara« of ltaaa representing Saaoan and American socio-«conoaic vaines doae not oouatitut« a «mirara« that ia unidimnaional. Stouffer describes thra« possible areas of unreliability on a aeala. Lack of reliability can be f*oa three sourcesj the inadequate ssapling of people, the aasfOing of the universe of attribute* car item, and the stability of response ia the saaple groups*45
Lack of reliability is not attributed to error ia the aaaspling procedure because (1) the Saaoan sables include the total universe, sod (2) the non-Sanoan sasçlee constitute a raadoa selection of one-hundred individuals froa a total test group representing the entire universe la one school and half of the universe at the other*
Lack of reliability can therefore be attributed to either inadéquats sampling of the universe of attributes or the instability of response by individuals. The latter could be measured through re-testing the sane universe with the sane test or an alternate fora, both of which are impossible*
However, it is suggested that perhaps a nor* liksly source of unreliability night be the inadequacy of the saapllag of the universe of attributes, sino* the test oovers a wide area of values and behavior, sod contains relatively snail number of iteas* Xt la suggested also that the universe of aodo-eoonoale values is likely to be aultl-diasnaionel* This
55
45* Cf*, Stauffer, et* al, Maasuraaeat jgg¿ Prediction. (Princeton, 1950),Chapter 8*
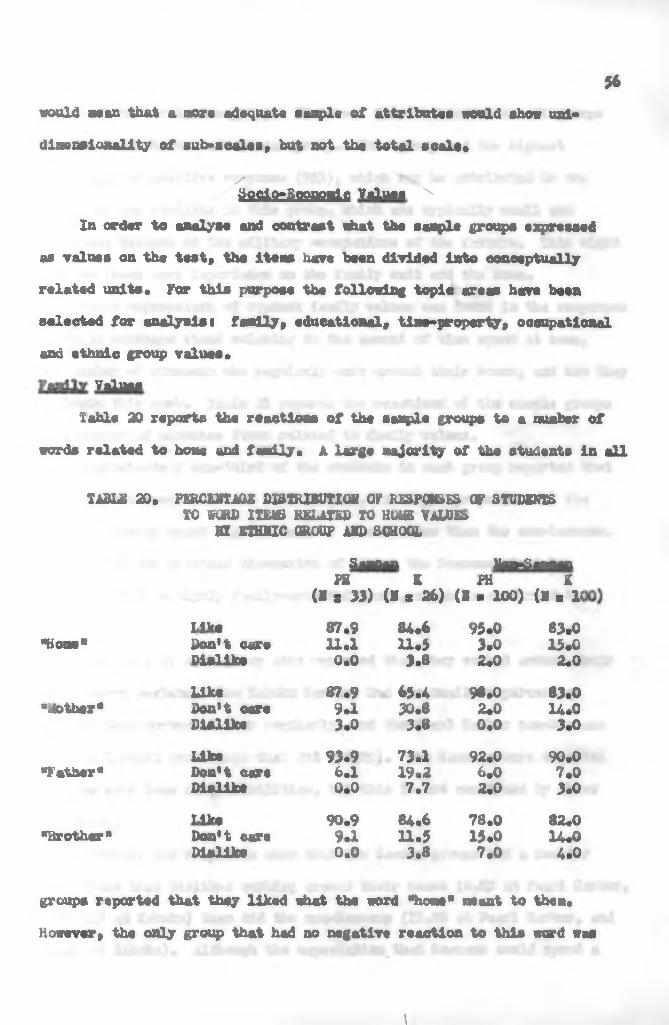
would nean that a raors adequate cample of attribute« would show uni- diaensioiiality of sub-scales» but not the total seal«*
/ '
&?dQ-Soonoialc Values xIn order to analyse and contrast what the eaaple groups expressed
as values on the test» the item have been divided into conceptuallyrelated units. For this purpose the following topic arses have been
S'... .i. k:,,.v *Vf*m-:‘ 5 •selected for analysis« fsadly, educational, tine-property, occupational and ethnic group values.
Valuesiable 20 reports the reactions of the eaaple groups to a nuaher of
• \ ’ ' 'J * *• "• - '” ' .
words related to bone and family. A large najority of the students in ell
56
TABLE 20. PERCENTAGE DISTRIBUTION OF RESPONSES OF STUDBHTS TO WCRD ItE m RELATED TO HOME VALUE»
3X ETHNIC GROUP AND SCHOOLSanoen lioa-Sanoan
Ml K H K(N S 33) (N a 26) (N * 100) (N = 1C
TT.ffc# 87.9 84.6 95.0 83.0"Hone* Don’t care 11.1 11,5 3.0 15.0ti^nvf 0.0 3.8 2.0 2.0
Like 87.9 65.4 98.0 83.0"Mother* Don't care 9*1 30.8 2.0 14.0Dislike 3*0 3.8 0.0 3.0
Like 93.9 73.1 92.0 90.0"Father* Don’t care 6.1 19.2 6.0 7.0
Dislike 0.0 7.7 2,0 3.01A)rf 90.9 84.6 78.0 82.0
"Brother* Don't care 9.1 11.5 15.0 14.0Dislike 0.0 3.8 7.0 4.0
groups reported that they liked what the word "hone* neant to the». However, the only group that had no negative reaction to this ward was
\
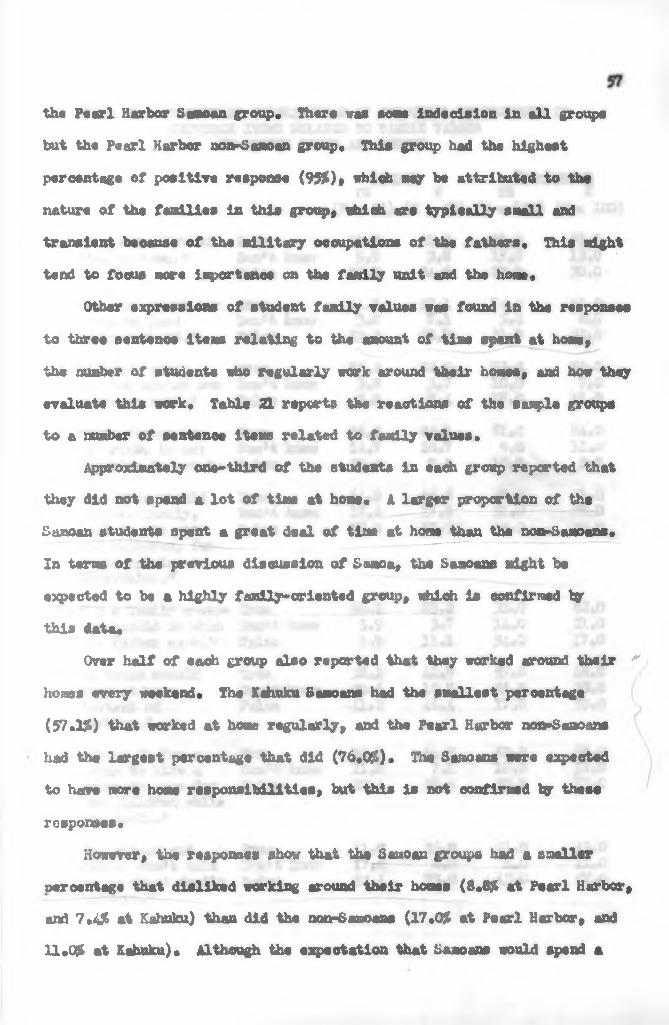
the Pearl Harbor Samoan group« There van sow indecision in all groups but the Pearl Harbor non-Sanoan group* This group had the highest percentage of positive response (93$)» which nap be attributed to the nature of the families in this group, which are typically snail and transient because of the military occupations of the fathers« This night tend to focus nor# importance on the family unit and the hone«
Other expressions of student family values was found In the responses to three sentence Items relating to the mount of tine spent at hone, the number of students who regularly work around their hones, and how they evaluate this work« Table 21 reports the reactions of the sample groups to a number of sentence items related to family values*
Approximately one*third of the students in each group reported that they did not spend a lot of time at home. A larger proportion of the Samoan students apent a great deal of time at hone than the noa-Samoans«In tarns of the previous discussion of Samoa, the Samoans sight be expected to be a highly family oriented group, which is confirmed by this data«
Over half of each group also reported that they worked around their ^ homes every weekend« The Kahuku Samoans had tbs smallest per centre (57.1$) that worked at home regularly, and the Pearl Harbor non̂ Sataoane had the largest percentage that did (76«0#)« The Samoans were expected to have more home responsibilities, but this is not confirmed by these responses«
However, the responses show that the Samoan groups had a timelier percent ape that disliked working around their hones (8*8# at Pearl Harbor, an) 7.4# at Kahuku) than did the non-Samoans (17«0# at Pearl Harbor, and 11 «0# at Kahuku)« Although the expectation that Samoans would spend a
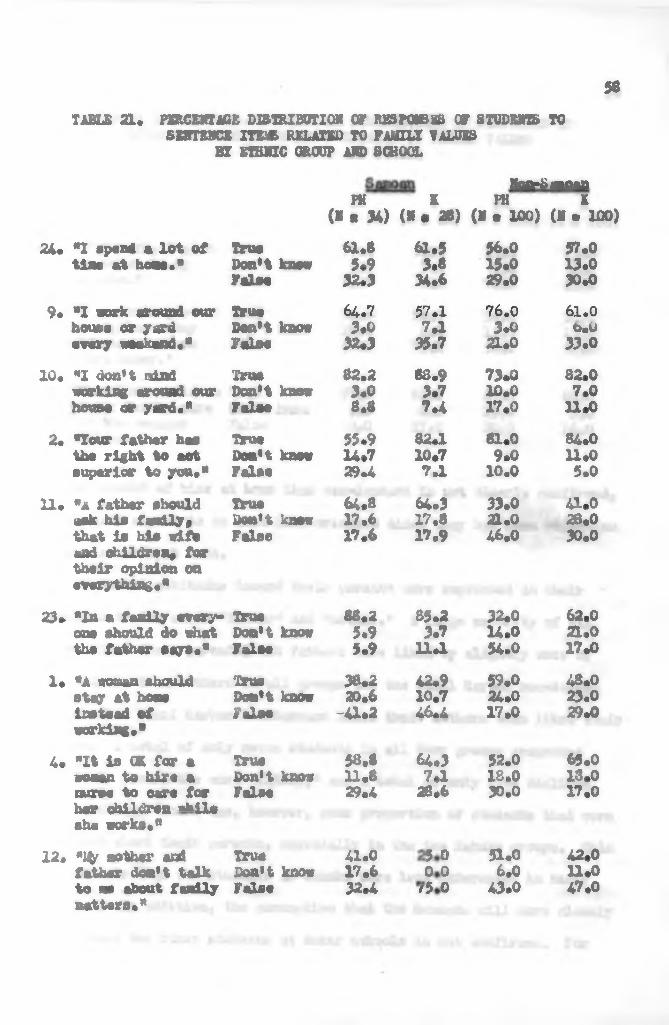
58TABLE 21« PERCENTAGE DISTRIBUTION OP RESPONSES OP STUDENTS TO
SENTENCE ITE* RELATED TO FAMILX VALUES 87 m i l G GROUP AND SCHOOL
______ Soa»Saaoan» X Hi X
(I • 34) (N • 26) (V • 100) (X • 100)24« *1 spend a lot of
tine at horn."TrueDon't know False
61*85.932.3
61.5 3.834.6
56.015.029.0
57.013.0 30.0
9* *1 work around our house or yard every weekend«*
TrueDon't knew False
64.73*032.3
57.1 7.1 35. 7
76.0 3.0
2 1.0
6 1.0b.033.0
10 « *1 don't raiadworking around our home at yard.*
TrueDon't know False
82*23*03*8
88.93.77.4
73.010 .0 17.0
32.07.0U.0
2« *Tour father has the right to aet superior to you**
TrueDon't knowFalse
55.914*729.4
82a10.77 a
81.09.0
10 .0
84.01 1 .05.0
11. *a father should ask his i'aadly* that is his wife and children, for their opinion on everything**
TTueDon't know False
64.817.617.6
64.317.817.9
33.02 1.0 46.O
41.028.0 30.0
23» *2n a fanily every» one should do what the father s<«rs**
TrueDon't know False
88.25.95.9
35.23.7u a
32.0 14. 054.0
62,02 1.017*0
1* *A wonan should stay at how instead of working**
TrueDon't know False
38.220.6
-41.242.910.7¿6.4
59.024.017.0
48.023.029.0
4* «It la OX far m woaan to hire a nurse to oar« far her children «* ^ 4 she works**
TrueDon't know False
58.81 1 .8 29.4
64.37.128.6
52.013.030.0
65.013.017.0
12* * % mother and father don't talk to we about fanily natters**
TrueDon't know False
41.017.632.4 G*
O vn
O O O 51.0
6.043.0
42.0 U.047.0

59
Samoan Non-Samoan
TaBLE 2 1 (Continued). PERCENTAGE DISTRIBUTION OF KiSPOlfciS OfSTUDENTS TO SKRÏEIÎCE ULUS RELATED TO FAdlLX VALUES
ES ETHNIC GROUP AND SCHOOL
PH K PH (B .34) (Be 26) (B • 100)
X(M • 100)
15. "If I work, I give True -79.4 ~ 92.9 19.0 73.0the money to ngr Don't know 5.9 9.0 6.0parents." False 14.7 0.0 72.0 21.020. "by parants give True 32.4 26.9 30.0 35.0
me regular noney Don't know 20.6 0.0 12.0 11.0allowance and no extra money."
False 47.0 73.1 58.0 54.0
3. "The older children True -97.0 82.1 65.0 85.0in our family care Don't know 3.0 0.0 15.0 5.0for the younger children."
False 0.0 17.9 20*0 10.0
greater amount of time at horn than non-oaaoana ia not clearly confirmed,the Samoans seemed to be more hoaw-oriented since they bad less objection to regular work at borne.
Students' attitudes toward their perenta were expressed in their *
roaponaes to the sarda “father* and “mother. * A large majority of all groups liked their parente, but fathers sers liked by slightly marc of tii® students than mothers in all groups but the Pearl harbor non-Samoan group. Ilare Pearl Barber non-Samoans liked their mothers then liked their fathers. A total of only seven students in all four groups responded negatively toward the word "father," and a total of only five disliked their ijothers. There was, however, some proportion of students that were undecided about their parents, especially in the two Kahuku groups. This may indicate that the students at hahuku were less interested in their families. In addition, tbs assumption that the Samoans «ill more closely approximate the other students at their schools is not confirmed. Par
instance, in contrast to the higher proportion of indifference in the Samoan group at Kahuku to their father* (19*#), the Kahuku non-Samoans hove relatively little neutral reaction (7JQ,
Parental roles, and the students* evaluation of these roles were expressed in sentence Item referring to the authority of the father, the superior statue of the father, the place of the »other at hone, and the like« The responses shoved that a majority of the students In all groups accepted the formal ouperiority of the father, as expressed through their agreenant with the statement «lour father has the right to aot superior to you." However, 29.4 per cant of the Pearl Harbor Saraoane and 10*0 per cant of the Pearl Harbor non-Samoans disagreed, while only 7JL per oent of the Samoans and 5 par oent of the nosHSanoans at Kahuku disagreed«There seemed to be, in terns of these responses, mare approval of the father as the head of the family in the two rural groups, and a more critical attitude toward this In the urban groups*
In response to the statement ’•Everyone in a family should do whet the father says,” most of the Samoens agreed (8S.3£ at Pecorl Harbor, end 85«2Jt at Kahuku). Less of the Kahuku non-Samoans agreed (62%), and a majority (54£) of the Pearl Harbor non-Samoans disagreed« In reference to this item, it seem that the Samoan students looked to their fathers for decision-making in the family, although they approved leas of the father'e right to aot superior to them«
On the other hand, when the students were asked whether they thought a father should ask his family's opinion on everything, there was agreement and disagreement with a similar pattern as on the previous item, but with smaller majorities. Zt appears that some of the students expected their fathers to make the decisions without asking their family's opinion«
60
However* e Majority of the student« thought that the father should discuss natters with his family, hut should make the final decisions. Only the Pearl Harbor non-&amoans tended to disagree (46$) with this, Shis would seem to indicate that the father retained the deeision^naking power in most of the f«allies, or at Issst the students believed that he should* but he was subject to family discussion and might not have informal power comparable to his formal power.
The students seemed to be less conservative about the roles of their mothers than they were about their fathers, less then half of the student®I - - - — ’ — — — — — « — ---— — -— -—In all but the Pearl Harbor non-Samoan group* fait that tha woman* s placewas in the hems instead of working. The Pearl Harbor non-Samoans had thehlgheet percentage that thought women should stsy at hone* while the PearlHarbor Samoans were the group that most disagreed with the statement, Alarge percentage of both Samoan groups (41,2$ at Pearl Harbor* and 4&«4$at Kahuku) disagreed with the statement that a women should stsy at home*while only 1? per cant of the Pearl Harbor non-Samoans did not agree* mod29 per cent of the Kahuku non-Samoans disagreed,
A majority of all groups agreed that it is right for a woman to hirea nurse to care for her children while she works* although a considerableproportion of ell groups disagreed. The Samoans seemed to approve of theworking mother role as mil as agreeing with her right to free herselffrom horns duties in order to work.
An attitude of the students toward siblings warn expressed in theirresponses to the word "brother,* The Pearl Harbor bemoans had tha highestpereentaga (90,95&) that responded favor ably to brother. The distributionof response of the other three groups were very similar» with the greatestcontrast between the two Pearl Harbor groups (90,9$ for tha Samoans* and 78% in the non-Samoan group).
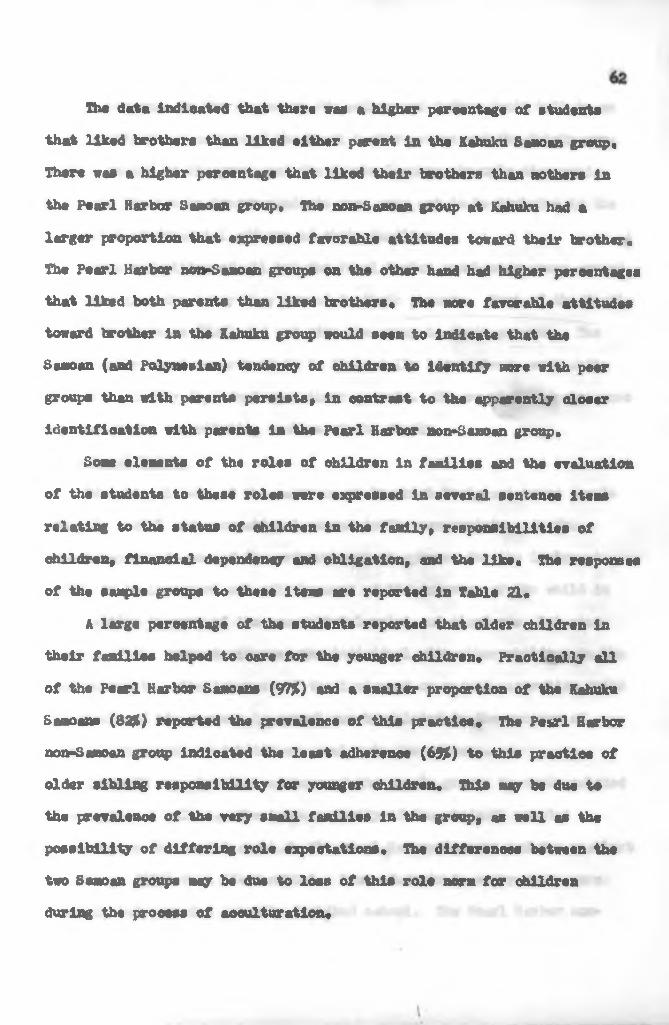
The data indicated that there «as « higher percentage of students that liked brothers than liked either parent in the Kahnku Samoan group. There ves a higher percentage that liked their brothers than mothers in the Pearl Harbor Samoan group* The non-Samoan group at Kahukn had a larger proportion that expreeeed favorable attitudes toward their brother. The Pearl Harbor non-Samoan groups on the other hand had higher percentages that liked both parent« than liked brothers. The more favorable attitude# toward brother In the Kahnku group would seem to indicate that the Samoan (and Polynesian) tendency of children to identify more with peer group# than with parents persists, in contrast to the apparently closer identification with parent# In the Pearl Harbor non-Samoan group.
Some elements of the roles of children in families «3d the evaluation of the students to these rolea «ere expressed in several sentence Items relating to the etatus of children in the family, responsibilities of children, financial dependency and obligation, and the like. The response# of the sample groups to theae items art reportsd in Taklt 21«
k large pereentage of the students reported that older children in their fomlliee helped to oare for the younger children. Practically all of the Pearl Harbor Samoans (<f7%) and a smaller proportion of the Kahuku Samoans (820) reported the prevalence of this practios. The Pearl Harbor non-Samoan group indicated the least adherenoe (690) to this practloe of older sibling responsibility for younger children. This way ba due to the prevalence of the very small families in the group, as «ell as the possibility of differing role expectations• Tbs differences between the two Samoan groups may be due to loss of this rols norm for children during the process of acculturation.

In response to ths statement "Ity mother and father don't talk to as about family money matters, • the Pearl Harbor groups and the Kahuku non» Samoans tended to disagree, and the Kahuku Samoans strongly disagreed* Evidently the Kahuku Samoan students vers more apt to be included in the discussion of financial affairs of their families»
Large majorities of all but the Pearl Harbor noa»Samoan group «greed that they gave the money they earned to their parents* Most of the Pearl Harbor non-Samoans (7256) did not give the money to their parent»* The Pearl Harbor non-Samoans tend to be financially Independent, even ehile they are actually dependent upon their parents* The remaining groups vers expected to be contributing members of the family*
M H s aEducation is one of the major means ty which immigrant young people
can gain social end occupational statue in the new society* As the school represents cos of the primary contact spheres for the immigrant child, it is important not only because of the exposure of the child in that setting to many of the new cultural roles and standards, but also because of the contact afforded the individual with other children in the same community* The Interest of the immigrant or second-generation child in school and his success in school may be related to the process of acculturation and uay inhibit or accelerate the process*
Table 22 reports the responses of the sample groups to words related to educational values* The large majority of the students reacted favorably to the word «school** The Pearl Harbor Samoans had the smallest peroentage (6356) that liked school* Some students in every group sere neutral, but very fev actually disliked school* The Pearl Harbor non-
63
\
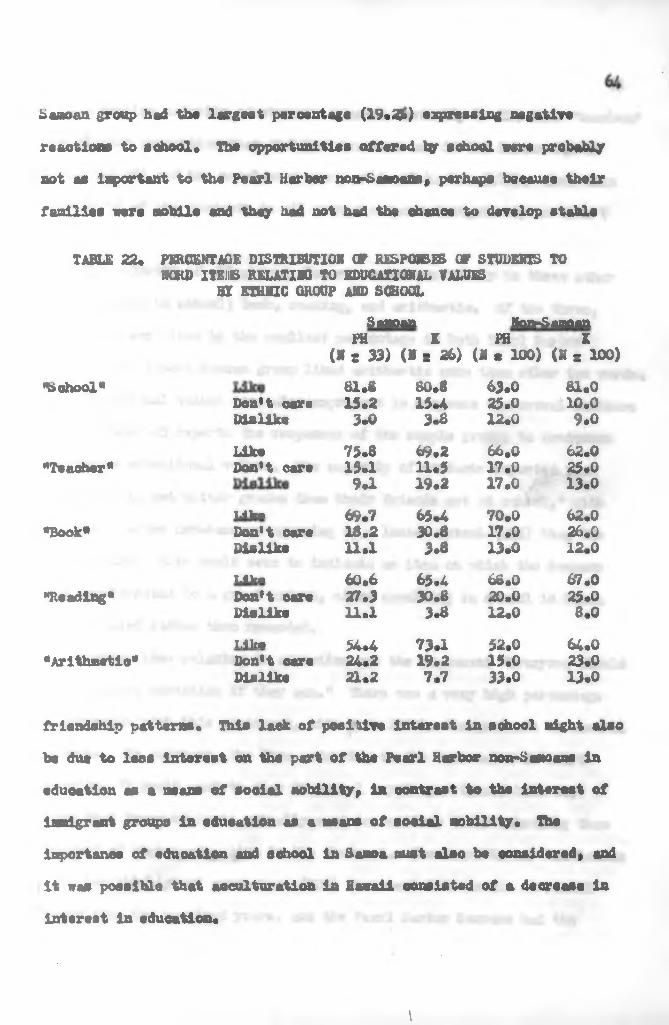
baooan group had the largest percentage (19*23») expressing negative reactions to school* The opportunities offered tor school «ere probably not as important to the Pearl Harbor non-Banosas» perhaps because their families ears mobile and they had not had the chance to develop stable
TABLE 22* PERCENTAGE DISTRIBUTION OP RESPONSES CP STUDENTS TO NGRD ITEJjB RELATING TO EDUCATIONAL TALUES
BX ETHNIC GROUP AND SCHOOLSaaoan Non-Samoan
PH X PH X(H r 33) (M s 26) (* s 100) (H a 100)
"Sohool* 81*8 80*8 63.0 81.0Don’t care 15*2 15*4 25.0 10.0Dislike 3*0 3*8 12.0 9.0Like 75.8 69*2 66.0 62.0
"Teacher* Don’t oars 15.1 11*5 17.0 25.09 a 19*2 17.0 13.0
1.4 Ira 69.7 65a 70.0 62.0"Book* Don't care 18.2 30.8 17.0 26.0
Disliks 11*1 3.8 13.0 12.0T.llr« 60*6 65.4 68.0 67.0
“Reading" Don’t care 27.3 30.8 20.0 25.0Dislike 11.1 3.8 12.0 8.0l.f Ira 54a 73a 52.0 64.0
"Arithmetic* Don’t care 24*2 19.2 15.0 23.0Disliks 21.2 7.7 33.0 13.0
friendship patterns* This lack of positive interest in school night alsobe due to less interest on the part of the Pearl Harbor non-Samoans in eduoation as a naans of social nobility» in contrast to the interest of iaadgrant groups in education as a naans of social nobility* The importance of education and school in Banos oust also be considered» and It was possible that acculturation in Hawaii consisted of a decrease in interest in education*
I

Jk smaller majority of students reacted favorably to tho wcrd "teacher.* m i highest proportion that disliked teachers was in the Kahaku Sauaoan group (19.2$) and the non-Samoan group at Pearl Harbor (17%), More than one-fourth of the students in all groups responded negatively as* didn't care.
The «ajcrity of all grotto also responded pcslttvely to three other iteras related to school j book, reading, and arithwtic. Of the three, arithmetic wan liked by the smallest percentage in both Pearl Harbor groups* The Kahnku Saraoan group liked arithmetic sore than other two word#«
Educational values sere also expressed in response to several sentence iteras. Table 23 reports the responses of the ¡sample groups to sentence# related to educational values. The majority of students reported that "they like to get better grades than their friends get at school," with the Pearl Harbor none ancons agreeing to a leaser extent (49$) than the other groups. This would seen to indicate an Item on which the Saraoons have aoculturated to a great extent, sinoe excelling in school in Haraoa was ridiculed rather than rewarded.
Another itera relating to eduoatlon was the stateraent »Everyone should get a college education If they can." There was a very high percentage of agreeaect with this statsrasnt, with very little dlsagreenent or neutral response. In contrast, the itera referring to the sane value In overt behavior, "I don't want to stay in school any longer than I have to,* shows that fewer students actually want to oontinue their schooling than approved of higher education In the abstract. The Pearl Harbor non-Samoan group had the highest percentage (70$) that wanted to remain in school longer than the required years, and the Pearl Herbar Samoans had the
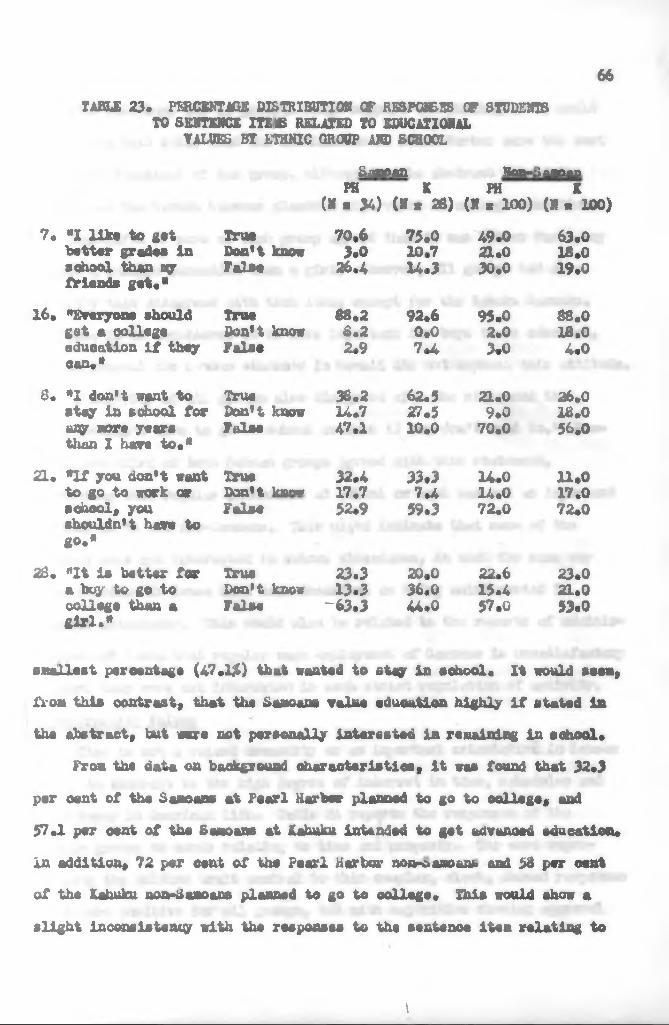
66TABLE 23. PERCENTAGE DISTRIBUTION OF RESPONSES GF STUDENTS
TO SENTENCE ITE4J RELATED TO EDUCATIONALVALUES HI ETHNIC GROUP AND SCBOCfL
Samoan TfeHa.-iflaaiyiPH X PH
(H * 34) (H s 28) (I s 100}X
(He 100)7. «1 like to get True 70.6 75.0 49.0 63.0better gradee in Don't know 3.0 10.7 21.0 18.0
school than sgr friends get.*
False 26.4 14.3 30.0 19.0
16« "Everyone should True 88,2 92.6 95.0 88.0gat a college Don't know 6.2 0.0 2.0 18.0education if they can«*
False 2.9 7*4 3.0 4.0
8« *1 don't want to True 38.2 62.5 21.0 26.0stay in school for Don't know 14«7 27.5 9.0 18.0any nore years than I have to«*
False 47.1 10.0 70.0 56.0
21« *lf you don't want TTue 32.4 33.3 14.0 11.0to go to work or Don't if««« 17.7 7.4 14.0 17.0school, you shouldn't have to go«*
False 52.9 59.3 72.0 72.0
28. "It is better for True 23.3 20. 0 22.6 23.0a boy to go to Don't know 13.3 36.0 15.4 21.0college than a girl.*
False -63.3 44.0 57.0 53.0
sjaaLLest percentage (47.10 that wanted to stay in aohool. It would shi, fi'OH this contrast) that the Saaoass valua education highly if stated In the Abe tract, but were not personally interested in remaining in school«
Proa the data on background characteristics) it wee found that 32«3 per oent of the Seasons at Pearl Harbor planned to go to oollegev end 57 «1 per oent of the S mboana at Xahuku intended to get udvanoed education« In addition, 72 per oent of the Pearl Harbor nonrc» «¡scant» and $8 per oent of the Kahuku non-Seaoans planned to go to oallege« This would show a alight inconsistency with the reeponsea to the sentence item relating to
\
the aam question« but in general «mold support the finding»# It Tjould seem, fro* this data« that the non^aaoaaa at fear1 Harbor were ths moat edueaticmmooaa cdaua of tbe group, although in the abstract all of the groups but the Kahuku bwoom planed a high value on college oduoation#
One-fifth car ¡»ore of eaeh group agreed that it va* better far a boy to get a college education than a girl# However, all group* had a majority that disagreed eith that item, except fear the Xshuku Samoans#In henoa it la oonaldered to be snore important for boys to be educated, but in general the oanoan students in Bewail did not express this attitude#
A majority of all groups also din<«?eed with the statement that *lou shouldn't have to go to school or work if you don't «ant to#* However, one-third of both Saaoan groups agreed with this state sent, indicating that regular attendance at school or work «as not as irsportant to than aa to tha not»*oaaoan»# This might indicate that aoes of the Samoans «era not intsrsstsd in school attendanoa, in wuoh tha suae rcqy that students in ¿«mo* have beau desaribed as being uninterasted in regular attendanoa# thin would also be ralatsd to the reports of adsdnl*» trstore of Sanoa that regular wage eegilcyiaeat of Sanoaas is unsatisfactory because they ware not interested in such strict regulation of activity#Tina-proparty Values
Tina is not a valued oossaodity or an l̂ pcortant orientation in Samoan life, in oontrast to the high degree of interest in tiae, echadolcs and •ffioianey in Amriem life# Table 24 reports the rcsponeea of the saagdba groups to voids relating to tins and property# The word representing tha culture trait central to this eoaplex, cloak, Showed responses that sere positive for all groups, but with aajorltles showing approval
(ft
I
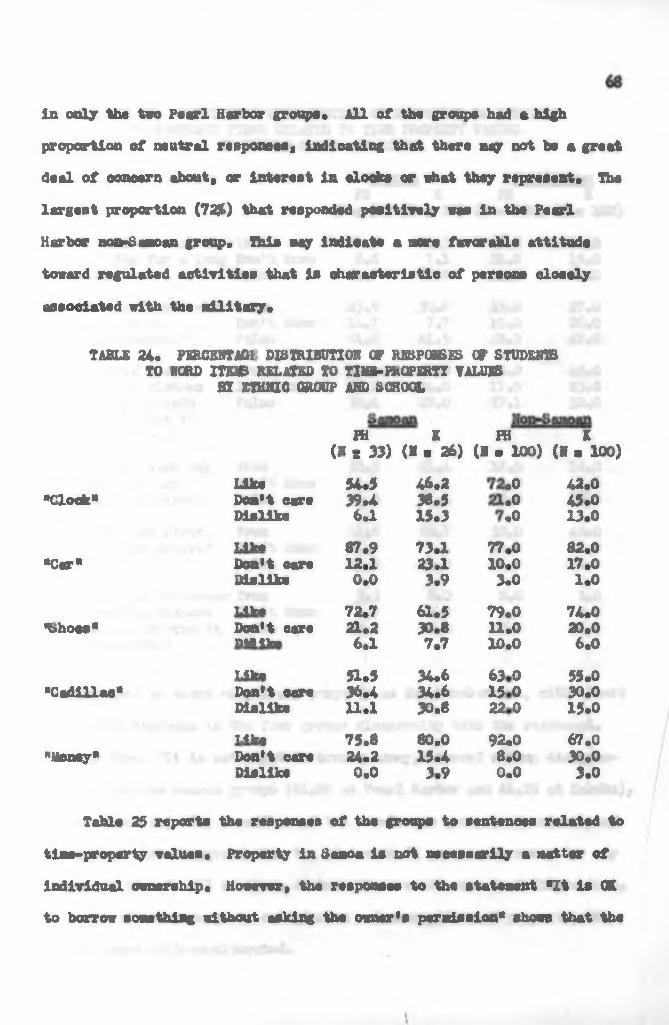
in only thè two Pearl Haorbar groupa* All of thè groupa had * high proportlon of mutarsi responaos, indioating that there u y not be a great do al of oanoern about, or interest la «look» or what thoy represent. fluì largest proportlon (72#) that reapoadod positively vaa la thè Pearl Harbor noa-Saaoan group. Thia raay indiente a auro favor alalo attitudo toward regulated activitles that la oharactarlatic of partono cloaely associateti with thè military.
TABLE 24. PERCENTAG1 DX8TRXBOT10N OF RSiPOKSES OP STUEEÌJfS TO iCRD ITElfi RELAIS© IO TIME-HtGPERTX VALUES
BI ETHNIC GROUP AH© LCHOGL
Hi K PH K(K s 33) (H « 26) (H . 100) (H a 100}
"Clock*lift»Don't care Msllke
54.539.46.1
46.2 38.515.3
ooo
...
42.045*013.0
"Cor*T.llfDon’t oaro Disllke
87.912,10.0
73.123.1 3.9
77.010.0 3.0
32.017.0 1.0
*ts.hooo"T.«lr»Don’t carenvfliv.
72.721.26.1
61.530.87.7
79.011.0 10*0
74.020.06.0
"Cadillac"T.ilmDon’t «aro Dlslike
51.536.411.1
34.634.6 30.8
ooo
288
55.030.0 15.0
"Money"T.<flrfDon’t «aro Diallke
75*824.20.0
80.015.43.9
92.08.00.0
67.030.0 3.0
latto 25 reports thè reaponaea of tho groupa to oontonooa rolatod to tirae-paroperty valuta* Proporty in Samoa la not mcessarily a mattar of indivlduel oenerohip. Howver» thè reeponoea to tho statement "It la QK to barro» sonethlng without aaklng tho oener’e permisaion* ahowa that thè

69TABLE 25. PERCENTAGE DISTRIBUTION OF R£SPONSJs£ OF STUDENTS
TO SENTENCE ITEMS RELATED TO TIME PROPERTY VALUES SI ETHHIC GROUP AND SCHOOL
PH K PH X(» »34) (Be 28) (N »IOO) (N « 100)
6. «I hats to work at True 26.5 14.3 28.0 21.0anything for a long Don't know 8.8 7.1 21.0 15.0tiae.* False 64.7 78.6 51.0 64.0
18* *1 hats people who True 23.5 30.8 33.0 27.0ore 1st« to Don't know 14*7 7.7 19.0 26.0eppoln&aejits.* False 61.8 61.5 48.0 47.05. *1 would wear a True 45.4 49.0 25.0 45.0style of clothes Don't know 15.2 24.0 17.9 23*0that ay friends
did not liks if 1 wanted to.*
False 39.4 27.0 5?a 32.0
14. *1 never save any True 32.5 21.4 18.0 19.0money for aay Don't know 11.7 7 a 2.0 7.0length of tiae.« Folse 55.8 71.4 80.0 75.026. *It is not right True 61.8 66.7 32.0 46.0
to borrow aoaay.* Don't know False
11.726.5
7 a25.9
30.038*0
28.026.0
27. •It is OK to borrow True 3.3 8.0 0.0 4.0something without Don't know 6.7 0.0 1.1 2.0asking the owner's permission**
False 90.0 92*0 98.9 91.0
Samoans war* »» aware of private property m the noa-Sanoans, with almost «11 of the studente in the four groups disagreeing with the etateaent. Another it«»» «It is not right to borrow money,* showed strong disagree» »ent by the two Saaoan groups (61.8$ at Pearl Harbor and 66.7£ at Kahuku), and no c&aar majority in either of the noa-Samoaa groups* A ssejority of all groups also disagreed with the statement «I never save money for any length of tine.* A H of these distributions would stem to indicate that, in taris of !aoaey»property orientation end conceptions of property, the Samoans wars well-acculturated.

Individuality in personal proparty was expressed in the statement "I would wear a style of clothes that ngr friends did not like if I wanted to." The only group that had a majority that would not express such individuality was the Pearl Harbor non-Samoan group* This would seem to indicate that conformity in such matters to group standards is more typical of American norms than Samoan*
A number of word items were also related to property and values relevant to Western technology. A majority of the students liked the word “money,* with only two students responding negatively* However, there was a considerable amount of indecision in reference to the word *money,* which may indicate that the word does not represent something that is highly important to the students. The Kabuku Samoans were most negative to shoes* Only four students disliked car, although 23.1 per cent were undecided in the Kahuku Samoan group. 1%e Pearl Harbor Samoans responded most favorably to the word *car* (87.956)* The students responded differently toward Cadillac than toward car, which would seem to indicate that they either did not know the meaning of the former, or ware identifying the word specifically* The percentage of negative response to Cadillac increased in all groups over the negative reaction to ear*
PggUEfrtionql M M
One of the areas of socio-economic life is that of occupation, andit is through oeoupatlon that the Initial adjustment to the new societymay begin.^ Adjustment in this area may be expressed through evaluationof occupations, feminine roles, places of work, and the like.
70
46. Cf., R.L. Challls, Social Problems of Non-Maori Polynesians in New Zealand,* (South Pacific Commission, 1953).
4 ■ *>

The distribution of responses to occupational titles la reported in Table 26a* All groups evaluated very highly the occupations of doctor, farmer, lawyer, policeman, scientist, and teacher* Artist, lieutenant, and priest reoelved large peroentages of approval from all groups but ths Kahuku Samoans* Sailor «as evaluated mare highly by the Pearl Harbor groups« The waitress was positively evaluated by a large proportion of the Pearl Harbor non-Samoan group only* There was a tendency far ths Pearl Harbor groups to evaluate janitor «are highly than the other groups. Reaction toward the barber «as fairly evenly divided between the three response categories, with a tendency toward more positive evaluation in the non-Samoan groups* Response toward bartender showed little positive response, with ths most negative response in the non-Samoan groups, and with a high proportion of neutral response in the Samoan groups* Hectrieii was not highly valued, cither positively or negatively, with large percentages of neutral responses.
TABLE 26a* PERCENTAGE DISTRIBUTION OF RESPONSES OF STUDENTS TO ISCRD ITEMS RELATING TO OCCUPATIONS
EOT ETHNIC GROUP AMD SCHOOLSamoan Non-Samoan
71
IV X HI (V • 33) (K « 26) (N . 100) (N w 100)
"Artist"LikaDon't core Dislike
51.539.49*1
30.846*223*0
o o o
o o o
"Barber*LikeDon't care Dislike
39*442.418*2
30.834*634.6 o
o o 45.0
24.0 31.0
"Bartender"nv*Don't care Me? Ike
21*257.621.2
19.246.2 34.6
18.037.045*0
5.040.055.0
I
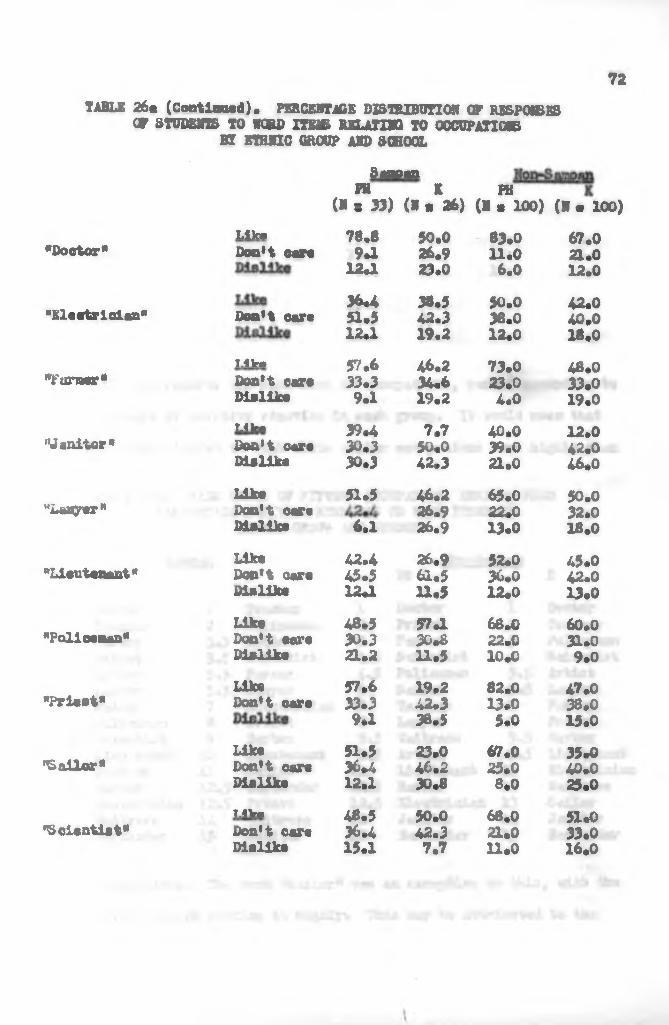
72TABLE 26ft (Continued)« PERCENTAGE DISTRIBUTION CP RESPONSES
GF STUDENTS TO WORD ITEMS RELATING TO OCCUPATIONSBY ETHNIC GROUP AND SCHOOL
Saaoan
( » T 33)K PH
(N c 26) (N « 100) (N « 100)
•Doctor*
"Electrician*
•Far»«*
“Janitor*
"Laayer"
"Lieutenant*
"Foliceraan*
"Priest*
'Sailor*
"Scientist*
Like 78.8 50.0 83.0 67.0Don't care 9.1 26.9 11.0 a. 012a 23.0 6.0 12.036a 38.5 50.0 42.0Don't eare 51.5 42.3 38.0 40,012U. 19.2 12.0 18.0
Mk* 57.6 46.2 73.0 48.0Don't care 33.3 34.6 23.0 33.0Dislike 9.1 19.2 4.0 19.0Mlf 39.4 7.7 40.0 12.0Don't care 30.3 50.0 39.0 42.0Dielike 30.3 42.3 21.0 46.0Like 51.5 46.2 65.0 50.0Don't care 26.9 22*0 32.0Dislike 6.1 26.9 13.0 18.0Like 42.4 26.9 52.0 45.0Don't oare 45.5 61.5 36.0 42.0Dislike 12a 11.5 12.0 13.0Like 48.5 57.1 68.0 60.0Don't eare 30.3 30^ 22.0 31.0Diellke 21.2 11.5 10*0 9.0Like 57.6 19.2 82.0 47.0Don't oare 33.3 42.3 13.0 38.0
9.1 38.5 5.0 15.0Like 51.5 23.0 67.0 35.0Don't care 36a 46.2 25.0 40.0Dislike 12.1 30.8 8.0 25.0T.4k* 48.5 50.0 68.0 51.0Don't oare 36.4 42.3 21.0 33.0Dislike 15.1 7,7 u.o 16.0
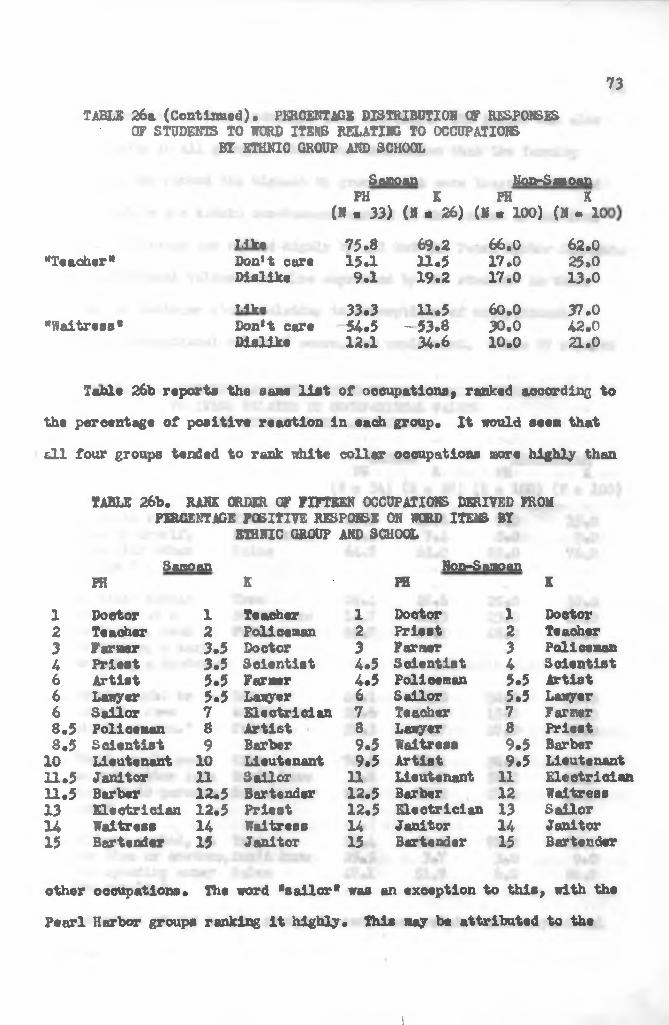
73TABLE 26a (Continued). PERCENTAGE DISTRIBUTION CF RSSPO!££S
OF STUDENTS TO WORD IZEflB RELATING TO OCCUPATIONSBY ETHNIC GROUP AND SCHOOL
Saco an Non-SanoanPH K PH K
(N a 33) (N > 26) (N • 100) (N - 1CT.-tlr« 75.8 69.2 66.0 62.0
"Teacher" Don*t care 15^ 11,5 17,0 25.0Dislike 9.1 19.2 17.0 13.0T.-tfrm 33.3 11.5 60.0 37.0
"Waitress* Don*t care 54.5 - 53.8 30.0 42.0Dislike 12.1 34.6 10.0 21.0
Table 26b report» the same list of occupations, ranked according to the percentage of positive reaction in each group. It would seen that ell four groups tended to rank white collar occupations more highly than
TABLE 26b, RANK ORDER OF FIFTEEN OCCUPATIONS DERIVED {ROM PERCENTAGE POSITIVE RESPONSE ON WORD ITEMS BY
ETHNIC GROUP AND SCHOOLSamoan Non-Samoan
PH K PH K1 Doctor 1 Teacher 1 Doctor 1 Doctor2 Teacher 2 Policeman 2 Priest 2 Teacher3 Farmer 3.5 Doctor 3 Farmer 3 Policeman4 Priest 3.5 Scientist 4.5 Scientist 4 Scientist6 Artist 5.5 Farnar 4.5 Policeman 5.5 Artist6 Lawyer 5.5 Lawyer 6 Sailor 5.5 Lawyer6 Sailor 7 Electrician 7 Teacher 7 Farmer8.5 Policeman 8 Artist 8 Lawyer 8 Priest8.5 Scientist 9 Barber 9.5 Waitress 9.5 Barber10 Lieutenant 10 Lieutenant 9.5 Artist 9.5 Lieutenant11.5 Janitor 11 Sailor 11 Lieutenant 11 Electrician11.5 Barber 12.5 Bartender 12.5 Barber 12 Waitress13 Electrician 12.5 Priest 12.5 Electrician 13 Sailor14 Waitress 14 Waitress 14 Janitor 14 Janitor15 Bartender 15 Janitor 15 Bartender 15 Bartender
other occupations. The word "sailor* was an exception to this, with the Pearl Harbor groups ranking it highly. This nay be attributed to the
i

close connection of these students with the H arry. The farmer was also ranked highly in all groups. There was Indication that the farnlz^ occupation was ranked the highest fey groups that were least associated with ltf since the Kahuku non-Samoans ranked it the lowest of the four groups. Policeman was ranked highly fey ell but the Pearl Harbor Samoans.
Occupational values wars also expressed fey the student# In their response to sentence items relating to conceptions of occupational mobility, occupational roles of women, and enpleymest. Table Z! reports
TABLE 27. PERCENTAGE DISTRIBUTION Qg RESPONSES OP STUDENTS TO ITENB RELATED TO OCCUPATIONAL VALUES
81 ETHNIC CROUP AND SCHOOLSaraoan NonrLaaoan
PH K PH K(N s 34) (N m 28) (N w 100) (N s 100)
74
19* *1 would rather True 26.3 29.6 7.0 15.0work fey mrself, Don't know 8.8 7.4 8.0 9.0than with other False 64.7 63.0 85.0 76.0people.*
13* *A woman should True 29.4 28.6 29.0 30.0not work at a Don't know 14.7 14.3 23.0 18.0man's Job, such False 55.7 57.1 48.0 52.0as driving a taxior being a doctor."
17. "Women ought to True 44.1 44*0 58.0 59.0have the tame Don't know 20.6 14.8 15.0 22.0rights as man." False 35.3 40.7 27.0 19.0
22. "Moot people seem True 70.6 73.1 36.0 70.0to get better Jobs Don't know 8.8 7.7 37.0 18.0than their parents False 20.6 19.2 27.0 12.0had."
25» *1 have worked, at True 29.4 44.4 91.0 63.0one tine or another,,Don't know 25.5 3.7 3.0 9.0for spending money False 47.1 51.9 6.0 28.0for sgrself."
the responses of the sample group« to sentences related to occupational values.
t

A majority of the students In the two non-Samoan groups reported that they had actually worked for money, while less than half of the Samoans had been employed (29.4$ at Pearl Harbor, and 44.4S& at Kahuku). Host of the students did not prefer to work alone. However, there was a higher proportion of students who preferred to work alone in the two Samoan groups (26.5^ at Pearl Harbor and 29.6^ at Kahuku) than in the non-Samoan groups. It is commonly stated that Samoans are highly group-oriented. This distribution of responses would sesm to show the opposite tendency among the Samoans. It indicates that the non-Samoans, particularly in the Pearl Harbor group, tend to be more group-oriented.
It would seem that the students firmly believed In occupational mobility, sines over 70 per cent in all groups but the Pearl Harbor non- Samoans agreed that most people seem to get better jobs than their parents had. It might be expected that students of immigrant parentage would be more interested in occupational mobility than no»-migrants. This Is confirmed, but it was Interesting to note that the Pearl Harbor non-Samoans were the only students that were not clearly decided on this item.
It is probable that the majority of Samoans In Hawaii have migrated because of the economic possibilities pressnted by residence in Hawaii.Moat employment in Samoa is on an unskilled level, and an interest in more skilled occupations on the part of the Samoan students might indicate their interest in socio-economic mobility within the Hawaiian economy. Table 28 reports the intended occupational level of the students. The largest proportion of all groups intended to work at the white collar level. This constituted a majority in two groups (50£ in the Kahuku Samoan group, and 56$ in the Pearl Harbor non-Samoan group). However, 47 per cent of the Kahuku non-Samoans and 35*3 per cent of the Pearl Harbor Samoans planned
75
\
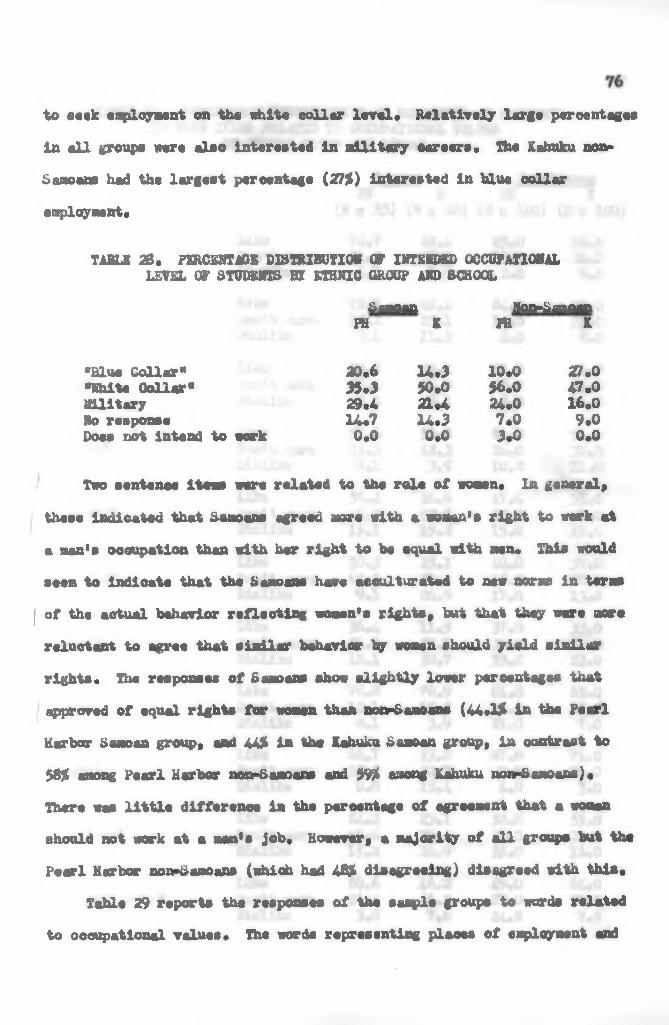
to s««k employment on the whit« collar level. Relatively large percentage» in all groups ware also interested in military careers. The Kahuku non- Samoans had the largest percentage (27%) interested in blue collar employment.
TABLE 28. PERCENTAGE DISTRIBUTION (V INTENDED OCCUPATIONALLEVEL OP STUDENTS EC ETHNIC GROUP AND SCHOOL
Samoan Non-Samoanm K m I
“Blue Collar* 20.6 14*3 10.0 27.0«White Collar* 35.3 50 «0 56.0 47.0Military 29 «4 21,4 24.0 16.0No response 14.7 14.3 7.0 9.0Does not Intend to work 0,0 0,0 3.0 0.0
Two asnttnes items ware related to the role of women, in general* these indicated that Samoans agreed aore with a woman's right to work at a man's occupation than with her right to be equal with men. This would seem to indicate that the Samoans hams acculturated to new norms in terms
| of the actual behavior reflecting women's rights* but that they were mare reluctant to agraa that similar behavior by women should yield similar rights« The responses of Samoans show slightly lower percentage« that I approved of equal rights for women than noo-Sanaaas (44.1$ in the Pearl Harbor Samoan group* and 44$ in the Kahuku Samoan group* in contrast to 58% among Pearl Harbor non-Samoans and 5 % among Kahuku non-Samoans)«There was little difference in the percentage of agreement that a woman should not work at a man's job« However* a majority of all groups but the Pearl Harbor non-Samoana (which had 48$ disagreeing) disagreed with this«
Table 29 reports the responses of the sample groups to words related to occupational values. The worde representing places of eaplcymant and
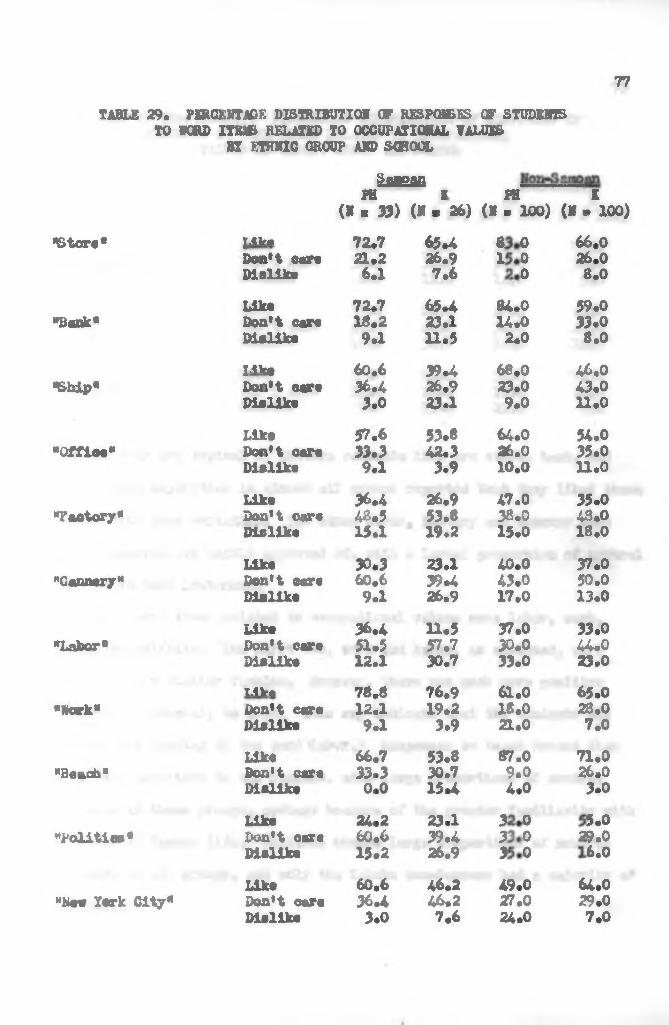
77TABLE 29. PERCENTAGE DISTRIBUTION OF RESPONSES OF STUDENTS
TO WORD ITEJfc RELATED TO OCCUPATIONAL VALUES BT ETHNIC GROUP AND SCHOOL
SusamjpH jj- pg g(X s 33) (N « 26) (N - 100) (N - 100)
•stop«« lAVmDon’t ear« Dislike
72.721.26.1
65*126.97.6
00
030 ft 66.0
26.08.0
"Bank*LikeDon't care Dislike
72.718.29.1
65.123.1 11.5
81.011.02.0
59.033.0 8.0
•Ship"T-4V«Don't ear« Dislike
60.636.13.0
39.1 26.923.1
68.023.09.0
16,013.011.0
•Offio*'LikeDon't oar« Dislike
57.633.39.1
53.812.33.9
61.026.010.0
51.035.011.0
•Factory*LikeDon't car« Dislik«
36.1 18.515.1
26.953.819,2
17.038.015.0
35.018.0 18.0
"Cannery"LikeDon't ear« Dislik«
30.360.69.1
23.139.1 26.9
10.013.017.0
37.050.0 13.0
"Labor"LikeDon't ear« Dislike
36.1 51.512.1
11.557.730.7
37*030.033.0
33.0u.o23.0
««ark"T.Clr«Don't care Dislik«
78.812.19.1
76.919.23.9
61.016.021.0
65.028.0 7.0
«Beach"LikeDon't car« Dislik«
66.733.30.0
53.830.715.1
87.09.01.0
71.026.0 3*0
"Politic® •LikaDon't care Dislik«
21.260.615.2
23.139.1 26.9 Vt
lUU
OOO
0*8 v
a ..
. OOO
"hew York City"LikeDon't care Dislike
60.636.13.0
16 .216.27.6
19.027.021.0
61.029.07.0

78
I— aMeSwMB
TABLE 29 (Continued). PERCENTAGE DISTRIBUTION CT RESPO®ES CTSTUDENTS TO WORD ITEMS RELATED TO OCCUPATIONAL
VALUES BY ETHNIC CROUP AND SCHOOL
PH X FH X(R s 33) (H e 26) (N s 100) (N • 1<
Lika 66.7 50.0 76.0 79.0Don't care 33.3 38.5 10.0 16.0Dislike 0.0 11.5 14.0 5.0Like 39.4 24.2 48.0 40.0Don't care 45.5 46.1 34.0 42.0Dislike 15.1 30.7 18.0 18.0Like 57.7 61.5 59.0 72.0Don't care 33.3 23.1 19.0 28.0Diellke 9.0 15.4 22.0 0.0
"California*
“Japan*
"Honolulu*
business that era typical of Teatern economic life are store, bank, andship* Large Majorities in alaoat all groups reported that they liked theae places, with soae variation. Two other words, factory and cannery war# not, in general, as highly approved of, with a larger proportion of neutral response in moat instances.
Other cord iterac related to occupational values were labor, work, beach, and politico. The first two, work and labor, as expected, were evaluated in a aijdlar fashion. However, there was much more positive response, in general, to work. This aay indicate that the atudeste did net know the meaning of the word labor.* Responses to beaoh showed that it is less Important to the Samoa», with large proportions of neutral respo»es in those groups, perhaps because of the greater familiarity with the beach in Samoan life. Polities showed large proportions of neutral responses in ell groups, and only the Kahuku non-Samoans had a majority of approval.

The remaining word Items related to occupations «ere four locations that might represent occupational opportunities for the migrants* there was a high percentage of approval in all groups of Me« York City» Honolulu, and California» ehile Japan «as the object of a high degree of neutral response* The Samoans» in gsnaral» responded mors neutrally on all of these items than the non-Samoans*
Table 30 reports the responses of the sample groupa to vord items that represented different ethnic groups resident in the Territory* The expression of ethnic attitudes might be related to acculturation in other areas of values* The four groups differed in their evaluation of the various ethnic groupe in almost every case* tore than half of the Pearl Harbor Samoan group responded positively to all groupa but Chinese (45.530, German (48.5$)» and Korean (45.5%)* lore than half of the Samoan group at Kahuku liked two ethnic groups; Hawaiian (5056} and Samoan (61.5%.).The Pearl Harbor noa-Sanoans responded positively toward all groupa but Filipino (4950» Korean (3950 and Samoan (4916)» In the Samoan group at Kahuku, the only ethnic group that was liked by more than half of the ' students «as Hawaiian (6456) • It «as especially interesting to note that all the Samoans at Kahuku do not seem to identify themselves with the Samoan group since 23 par cent of them responded neutrally to the word •Samoan,* and 15*4 par cent responded negatively*
79
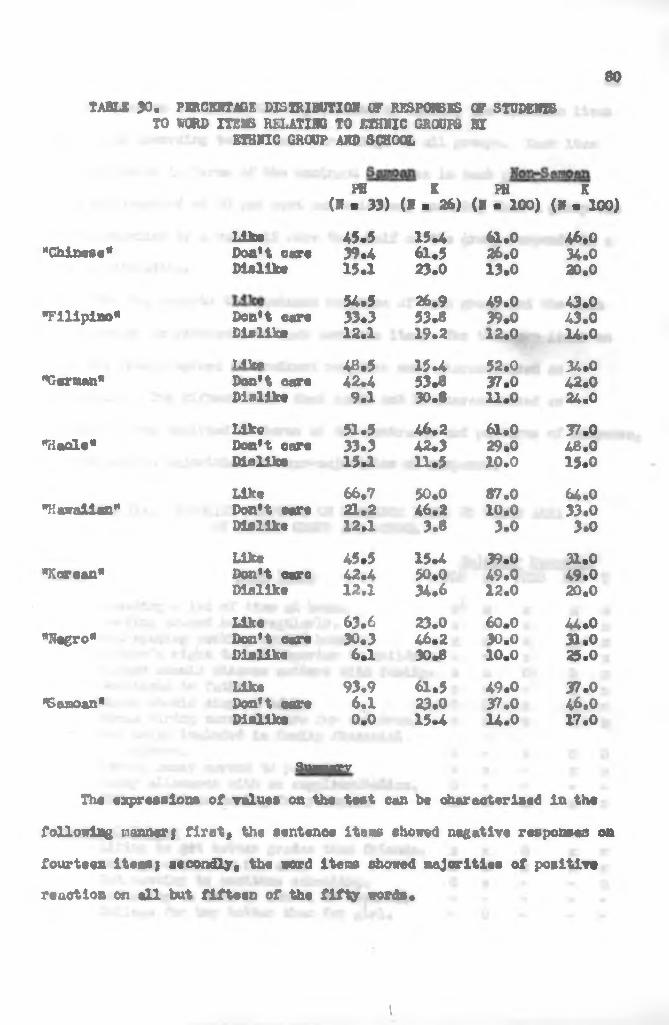
80TABLE 30. PERCENTAGE DISTRIBUTION OF RESPONSES OF STUDENTS
TO WORD ITEMS RELATING TO ETHNIC CROUPS BT ETHNIC GROUP AND SCHOOL
PH K Hi K(N • 33) (V ■ 26) (H . 100) (N • 100)
"Chinese*LikeDon’t care Dislike
45.539.415.1
15.461.5 23.0
61.026.013.0
46.034.020.0
"Filipino* Don’t care Dislike
54.533.312.1
26.953.819.2
49.039.012.0
43.043.014.0
"German*TAWij»Don't care Dislike
48.542*49.1
15.453.830.8
52.037.011.0
34.042.0 24.0
"Hade*LikeDon’t care Dislike
51.533.315.1
46*242.311.5
61.029.010.0
37.048.0 15*0
"Hawaiian"LikeDon’t eare Dislike
66.721.212.1
50.046.23.8
87.010.03.0
64.033.0 3.0
■Korean*LikeDon’t eareDislike
45*542.412.1
15*450.034.6
39.049.012.0
31.049.020.0
■Negro*UkeDon’t care Dislike
63.630.36.1
23.046.230.8
60.030.010.0
44*031*025*0
■Samoan*LikeDon't cere Dislike
93.96.10.0
61.523.015.4
49.037.014.0
37.046.017.0
SummaryThe expressions of value« on the test can be characterised In the
following r turner j first, the sentence iter* showed negative responses on fourteen iteasj secondly, the word iteos showed Majorities of positive reaction on ell but fifteen of the fifty words.
t
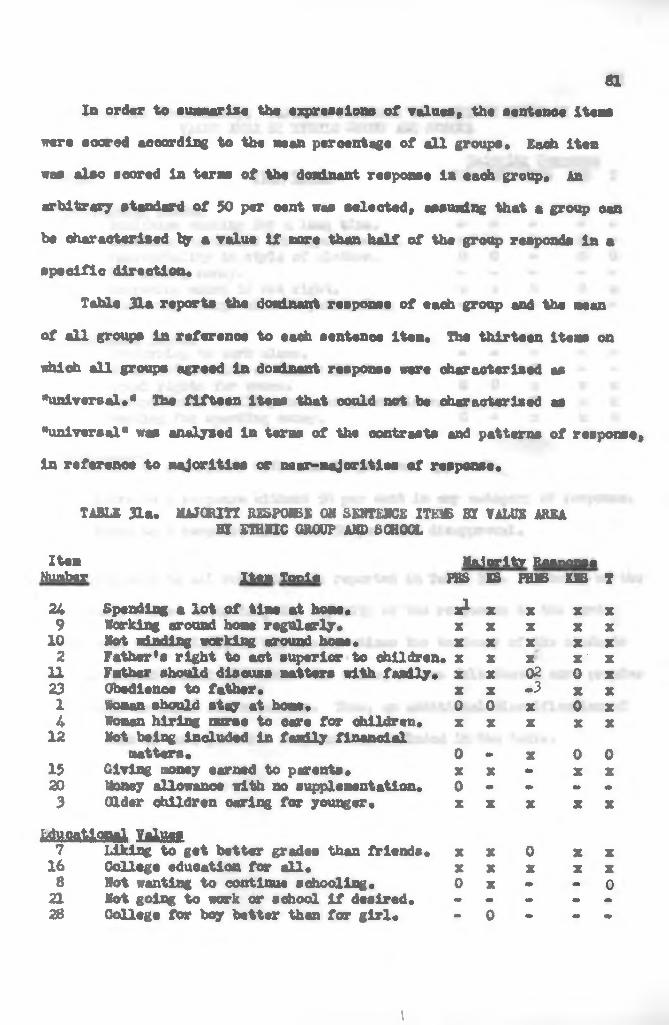
In order to summarise the expressions of values, the sentence item were soared according to the mean percentage of all groups. Each ltea was also scored In terns of the dominant response la each group« An arbitrary standard of $0 per oent was selected» assundng that a group ean be characterised Iff a value If nore than half of the group responds in a specific direction.
Table H a reports the dominant response of each group and the naan of all groups In reference to each sentence ltea. The thirteen ltene on which all groups agreed in dominant response were characterised as "universal** The fifteen ltene that could not be characterised m
"universal* was analysed In terns of the contrasts and patterns of response» In reference to majorities or near-majorities of response*
81
TABLE 31a. XAJQftXTX RESPONSE ON SENTENCE ITEMS BI VALUE AREA BI ETHNIC GROUP AND SCHOOL
Item Majority ResponseNumber ltea Toole PBS KS FHMS KNS t
24 Spending a lot of tins at hoa»* a1 X X X X9 Working around hone regularly. X X X X X10 Not minding working around hone* X X X X X2 Father's right to act superior to children.i X X X X' X11 Father should discuss matters with family* X X 02 0 X23 Obedience to father* X X . 3 X X
1 Woman should stay at horns* 0 0 X 0 X4 Woman hiring nurse to cere for children* X X X X X12 Not being Included In fondly financial
natters. 0 m X 0 015 Giving money earned to parents* X X — X X20 Money allowance with no supplementation. 0 • • • m
3 CUder children oaring for younger* X X X X XkfegateflRal M mssl7 Liking to get better grades than friends. X X 0 X X16 College education for all* X X X X X8 Not wanting to continue schooling. 0 X * m 021 Not going to work or achool If desired. m em • m m
28 College for boy better then for girl* m 0 *» m -
\
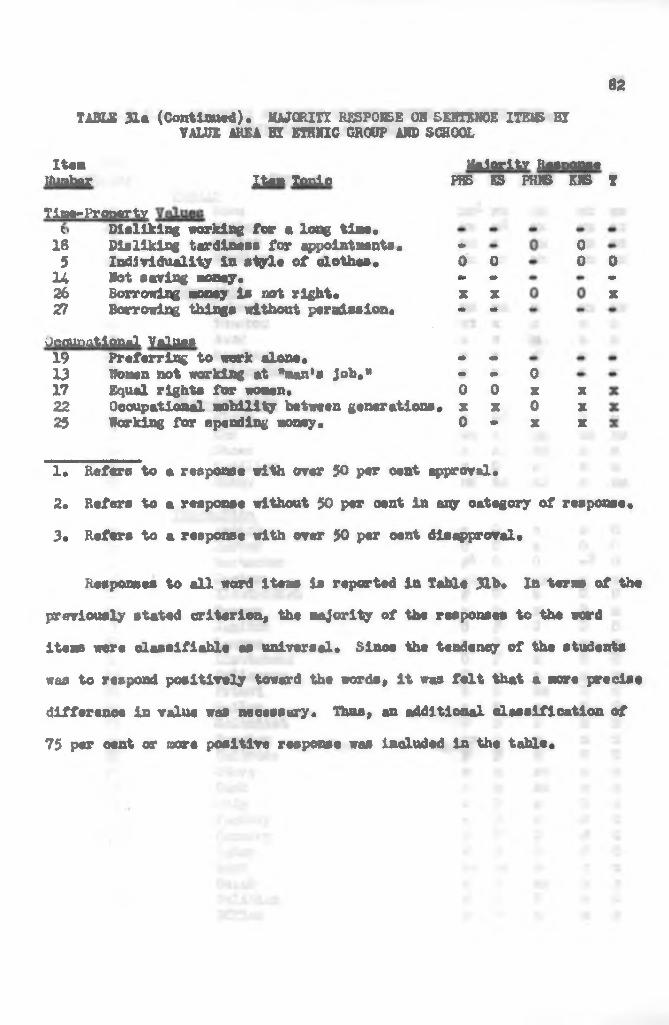
82TABLE 31a (Continued). MAJORITY RESPONSE ON SENTENCE I7FJI5 El
VALUE AREA BY ETHNIC CROUP AND SCHOOLItemNumber Item Tonic
Majority Response FHS KS PHNS KBS T
Time-Proper ty i. Bialiking working for a long time.18 Disliking tardiness for appointments* *5 Individuality in style of clothes* 0 014 Not saving money. • •26 Borrowing money is not right* x x27 Borrowing things without permission. - •Occupational Values19 Preferring to work alone. • •13 Women not working at "man's job." • •17 Equal rights for women, 0 022 Occupational mobility between generations* x x23 Working for spending money* 0 •
0x0x
00
xxX
0mX
1. Refers to a response with over 50 per cent approval,2. Refers to a response without 50 per cent in any category of response.3* Refers to a response with over 50 per oent disapproval*
Responses to all word items is reported in Table 31b* In terms of the previously stated criterion, the majority of the responses to the ward items were classifiable as universal* Sines the tendency of the students was to respond positively toward the words, it was felt that a mare precise difference in value was necessary. Thus, an additional classification of 75 per cent or more positive response was Included in the table*
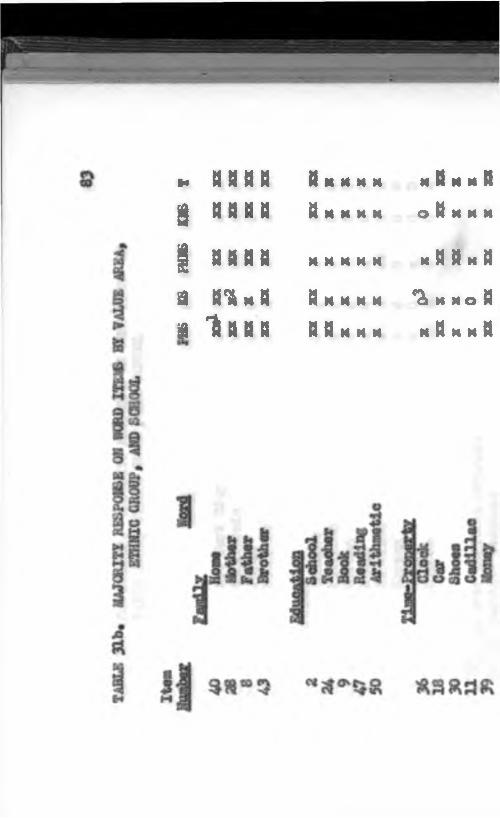
h ssa»g « s a s
g a a a a
a »<%* a * I s a s
« M U M M
S M M K X
S H H H H » » M N M
m a m m aO S M M M
h S S h S
^ K H o Sm a h m a
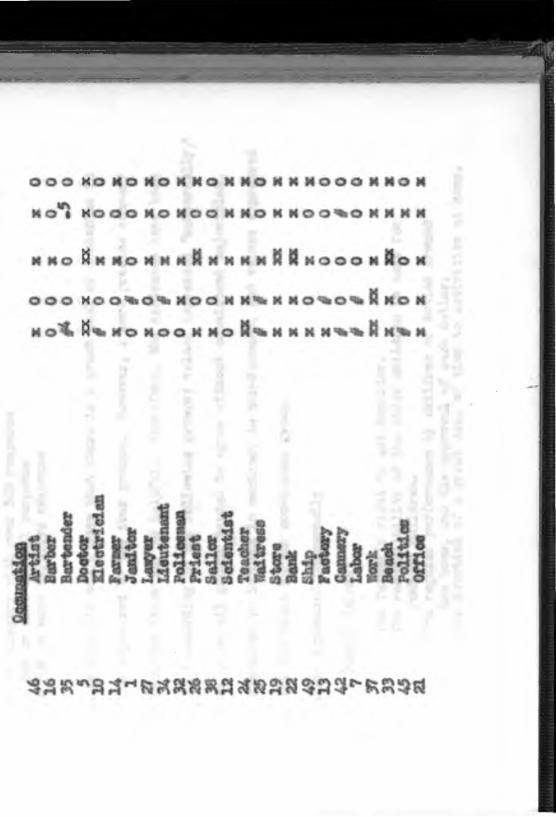

TABLE 31b (Continued). MAJC&ITX RESPONSE ON WORD ITEJB BY VALUE AREA, ETHNIC GROUP, AND SCHOOL
ItemNumber Word IBS KS FHNS KNS T
4 New lark City X 0 0 X X23 California X X XX XX X29 Japan 0 0 0 0 048 Honolulu X X X X X
15Ethnic
Chinese 0 § X 0 041 Filipino X i 0 0 044 German 0 * X 0 011 Hade X 0 X 0 06 Hawaiian X X XX X X17 Korean 0 # 0 0 03 Negro X 0 X 0 020 Samoan XX X 0 0 X
1. xx s 75% and over positive response2. x s 50-74$ positive response3. 0 s no category with over 50$ response4. # ■ 50$ or more neutral response5. - ■ 50$ or more negative response
In general, it would seem that there is a great deal of consensus in the values expressed by the four groups. However, a more precise summary of the sentence items may be helpful. Therefore, the sentences have been
4categorised according to the following groups; values expressed "universally,"values on which all groups tended to agree without consistent majorities,values expressed by Samoans in contrast to non-Samoans, and values expressedby ell but the Pearl Harbor non-Samoan group.
Values Expressed UniversallyFamily Values t
The father's right to aot superior.The responsibility of the older children in care for
younger children.The regular performance by children of duties around
the home, and the approval of sudd duties.The devotion of a great deal of time to activities at home.
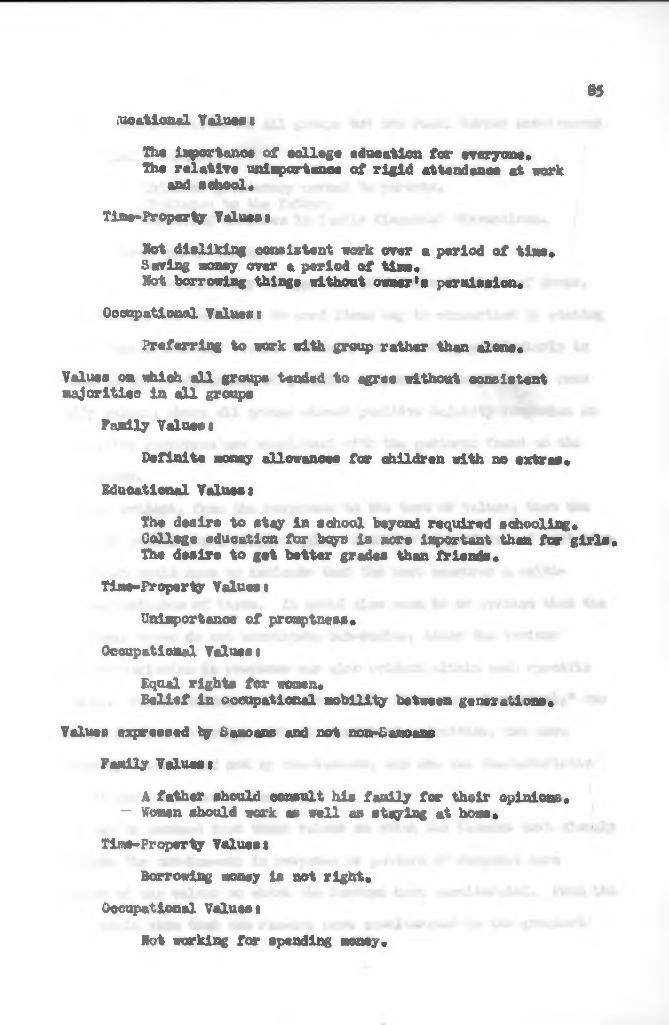
iueatlonal Valuta«The importance of college education for everyone* the relative unimportance of rigid attendant» at work
and school*Time-Proparty Valuta«
Hot disliking 0003 is teat work over a period of tine*Saving money over a period of tine*Hot borrowing things without owner's permission«
Occupational Values«Preferring to work with group rather than alone*
Values on which all groups tended to agree without consistent majorities in all groups
Family Values«Definite money allowances for ohlldren with no extras*
Educational Values«the deairs to stay in school beyond required schooling* Collage education for boye is more Important than for girls* The desire to get better grades than friends*
Time-Proper^r Values«Unimportance of promptness*
Occupational Values«Equal rights for women*Belief in occupational mobility between generations*
Values expressed by Bemoans and not noa-BemoansFamily Values«
A father should consult his family for their opinions*- women should work as well as staying at home*
' ... | •'Tins-Property Values*
Borrowing money is not right*Occupational Values«
Not working for spending money.
85
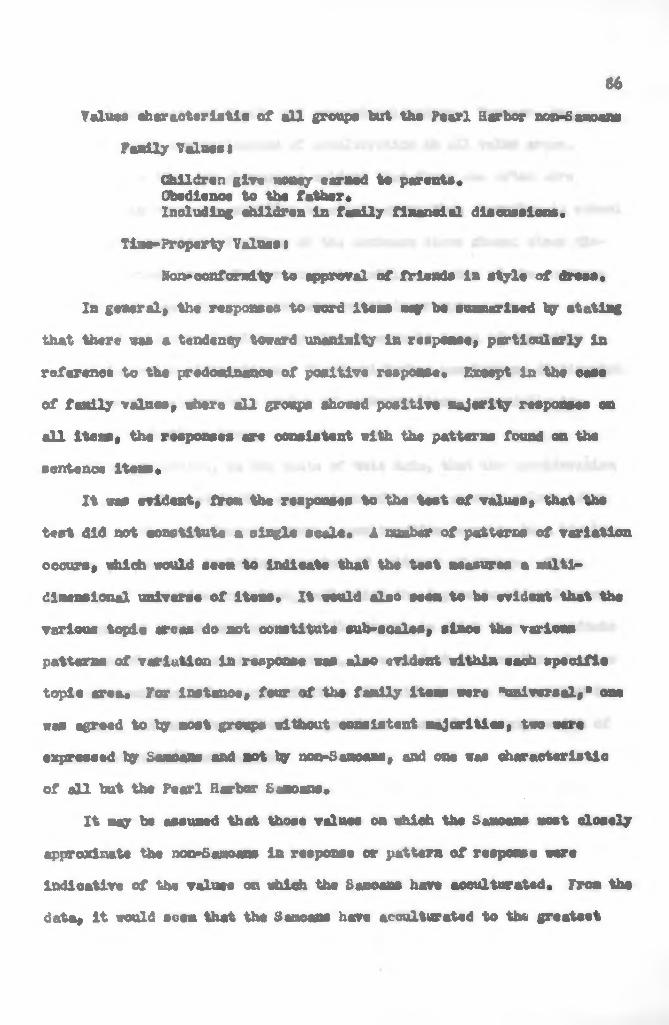
Values characteristic of ail groupe but tha Pearl ïlarbor non-Saa»ansFasdly Values«
Children give money csrned to parents«Obedienoe to the fatber*Ineludlag children la faeilly flnencial discussions.
Tiras-Froperty Values«Sax>confanaity to approval of frieade in style of dreaa.
In général, the responsea to word itéras «ay be euisnarlsed by atating that therc «as a tendency toward unanlmlty in response» partioularly la raferenee to the predomiziance of pœitive response* Exeept lu the eeee of faaily values, «tiers ail groupe afaowad positive majority reaponses on ail itéras, the response* are ooneistent with the patterna found on the sentence items«
Xt m m évident, firoa the responses to the teet of values, that tha
test dld sot oonstitute a single sosie. A nuabar of patte«® of variation oeeurs, «hlch would seen to indic&te that the teat naaaures a eailti- dliaenslonal univeraa of itene. Xt «euld also m m to ba évident that the varioua topic «cas do not conatitute aub-ecales, aince tha varions patterna of variation in respanee «es also «vident «ithin eaeh spécifié tapie are a. Tôt instance, four of the faaily itéras mire "universel,» «se «as agreed to by aoet groupe vlthout consistent raajorities, tmo more expresaad by Saaoaae sud not by non-Saaoans, and one «as ehoraeteriatie of ail but tha Pearl Rarbor Saaoans*
Xt aay be assuaed that those values on «hloh the Saraoans «est d o o ely
approxinate the non-Saaoax» in response or pattern of response «are indicative of the values on whieh the Saraoaa* hâve aeculturated. Froa the data, it would aoea that the Srnmtm bave acculturated to the greateet
66

From the data, it also seems evident that there was often more difference In response according to ethnic group than according to school (community or residence), None of the sentence items showed dear disagreement between Pearl Harbor students, while a number of the sentence items showed dear disagreement between ethnic groups.
Some variation of values may also be seen in terns of Caucasian and non-Caucasian distinctions, The Pearl Harbor non-Samoans distinguish themselves In response to a number of sentenoe items, especially in reference to family values.
It can be stated, on the basis of this data, that the aeculturation process, as reflected in the expressIona of socio-economic values, does not seem to be a unilinear process, Acculturation seems to be a highly oomplsx phenomenon, Including a number of patterns of ohange* The patterns of variation in values, reflecting the degree to which Samoans have departed from Samoan norms and the degree to which they approximate the norms of the new social situation, wars evident In a number of areas of aocio-eoonomic lift« Approximation of resident norms was evident in all areas, but was revealed to the greatest extent in the expression of family and sduoational values«
87
degree in the areas of family and educational values« However, lay thisstandard, there was indication of acculturation in all value areas.

CHAPTER VISXIOECOHOTIIC VALUES OP FIRST AND SECOND GENERATION
SA20AM STUDENTS IN HAWAII
Another major variable that la oonmohly Inferred to be important inthe acculturation porooeaa la the length of residence of immigrants in a new society. It may be assumed that ever a period of tine some change takes place because of the exposure to s new social environment and culture*
In order to measure the degree to vhleh the changes have taken plaos, the Samoans were divided Into two groups on the basis of their length of residence in Hawaii* The large majority of the Samoan students in the sample were first generation, that Is, sere born in Samoa and migrated to Hawaii* Almost all of thesa first generation Samoans have oome to Hawaii since 1950* Because of the small else of the total group, tabulation of responses was on the basis of this aingls variable* It was reoognised that there were maoy other important variables that ere related to acculturation that cannot be considered within the scope of this study* Family Values
There were large differences in response according to generation on many of the items expressing family values* Tads 32 reports the responses of the first and second generation Samoans to words related to family values* The first generation students had a higher percentage that responded positively toward father and mother than did the second generation group, ifere students in both groups responded favorably toward father than mother* However, there wes a much higher proportion of neutral response toward both in the eeoond generation group* This would seam to Indleats that the

father was still ths central figure in the fuaily for the Samoan children in Hawaii» tut both parents seen to have decreased in affective importance to ths children over the period of residenoe in Hawaii*
Response toward the word "hone" was predominantly positive» with a «¡nailer proportion of tho second generation students responding with
89
TABLE 32. PERCENTAGE DISTRIBUTION OF RESPONSES uF SAMOA» TO WCBD ITSi£ RELATED TO FAMILY VALUES»
BY GENERATION IN HAWAII, AND MEANPERCENTAGE OF ALL GROUPS
1st Gen* (Me 40)
2nd Gen. (N • 19)
Total Group(T* 259)
"Father*LikeDon't care Dislike
92*57*50*0
68.4 21.110.5
87.39.63.1
"¡¿other*LikeDon't care Dislike
85*012.52.5
63.231.65.2
83.614. 0 2.4
*Hotae*LikeDon’t care Dislike
85*015.00*0
78.915*95.3
87.610*22.0
"Brother*LikeDon't care Dislike
92.57.50*0
78.915.85.3
83.912.43.7
approval* One of the second generation group end none of ths first generation evaluated hone negatively* A sinUer response was found in reference to brother» with larger differences between generation* The saae proportion in the first generation liked brother as liked father» but leee liked aother* The attitude toward brothers was acre favorable then towards either parent in the second generation group* This would seen to indicate that siblings decrease in Importance to the Samoans over e period of tine» but not to so great an extent as the parents decrease in laportanoe*
1

It was also Intereating to note that« on all wards relating to fmlly values, the proportion of positive response in the second generation not only decreased but the students responded acre negatively than the response of the total saaple group.
Table 33 reports the responses of first sad attend generation Saaoaas to sentence itens relating to family values* The reepouses showed that there was not a single pattern ooraparable to that found la reference to the wood item. Son* of the fawily values changed away firon Samoan norm or toward Antrleaa norm, but others seamd to chsags In the opposite direction. There m s a smaller percentage« for example« In the aeoond
90
TABLE 33* PERCENTAGE mSTKZOUTlQN OF RESPONSES OF SADDAMS TO SENTENCE ITE5S» RELATED TO FAHXLT VALUES« BY GENERATION
IX HAWAII, AMD BEAM PERCENTAGE CF ALL GROUPS1st Gan, Gen. Total Grouu
y If 8F aOkJ(»• a) (X* 21)
"I spend a lot of tine at hone«*
TrueDon't iaiow False
41.5H,643.9
42.919.038a
47.019.633a
*1 work around our house Trueor yard every weekend,* Don't know
False58.57,334*1
66.70.033.3
64.74^J30.5
*1 don’t «lad workingaround our housa or yard«*
TrueDon't know False
80.54,914.6
100.00.00.0
83.05.9na
*Iour father has theright to act superior to you,*
TrueDon't know False
87,84.97.3
81.014,34.7
75.8u a12.9
•A father should ask his fondly, that is his wife and children,for their opinion on everything«*
TrueDon't know False
63.4 17.119.5
66.719.014*3
50.821.127.9
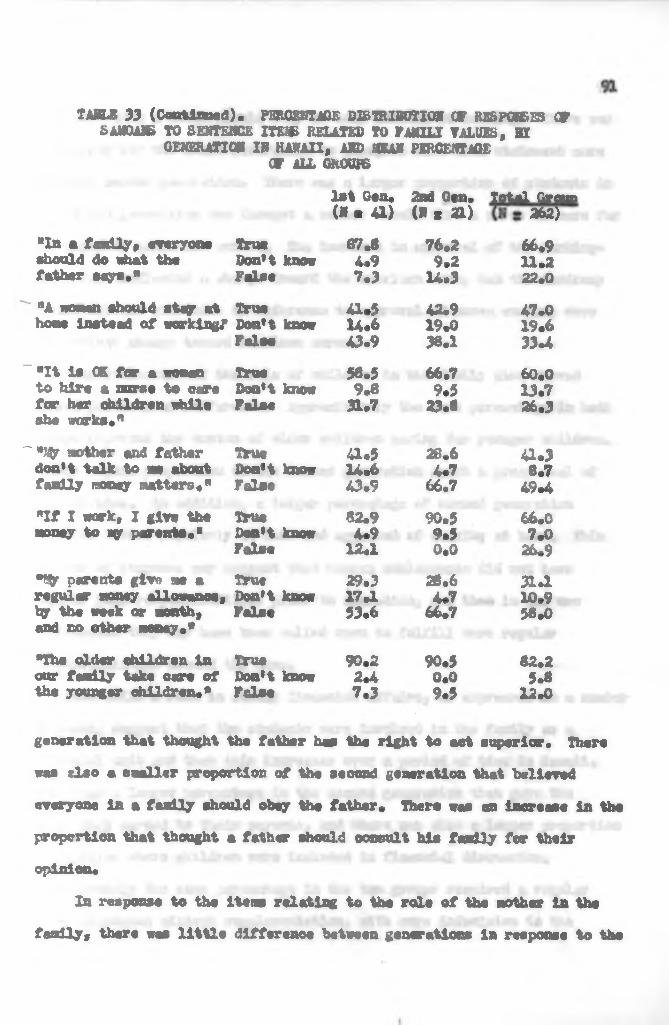
TABLE 33 (Continued). PERCENTAGE DISTRIBUTION OF RESPONSES Of SAilOAie TO SENTENCE ITEMi RELATED TO FAN1LI VALUES, BY
GENERATION IN HAWAII, AND MEAN PERCENTASE GT ALL GROUPS
1st Sen.(*• a) 2nd Gen. («s 21)
Total Group 262)
"In a family* everyone ehould do what tha fatter says."
TrueDon't know False
67.84.97.3
76.2 9.214.3
66.911.222.0
"A woman should stay at home Instead of working/
TrueDon't know False
41.5 H . 6 43.9
42.919.038.1
47.019.633.4
~ "It is OK for a woman to hire a nurse to ears for her children whileshe works.*
TrueDon't know False
58.59.831.7
66.79.523.8
60.013.726.3
~ * W »other end father don’t talk to as about family money matters."
TrueDon't knowFolse
41.514.643.9
28.64.766.7
41.3 8.749.4
"If I work, I give the money to qr parents.“
TrueDon't knowFalse
82.94.912.1
90.59.50.0
66.C7.026.9
•tay parents give me « regular money allowance* by the week or month, and no other momy.*
TrueDon't know False
29.317*153.6
28.64.766.7
31.110.958.0
"1%« older children in our family take oars of the younger children.*
TrueDon’t know False
90.22*47.3
90.50.09.5
82.25.8
12.0
generation that thought tha fatter ha« the right to set superior. There was ¿Lao a smaller proportion of the second generation that believed everyone in a fasdly should obey the father. There van an increase in the proportion that thought a father ehould commit his fsadly for their opinion.
In response to the iteas relating to the role of the »other in the fsally* there was little difference between generations in response to tte
statement that a woman should s t a y at home Instead of working, Thar* was a tendency for the first generation to disagree with that etateMnt «ore than the second generation, There «as a larger proportion of students in the second generation aho thought a «other should hire a nurse to oars for her children while she worked. The inereeae in approval of the working» woman rale reflected a change toward the Amarlean norm» hut the tendency toward divided attitudes in reference to approval of women working dees not reflect change toward American norms.
The evaluation of the rale of children in the fsadly else shoved varied patterns of difference. Approximately the tana percentage in both groups reported the cue ton of older children caring for younger children#A much higher proportion of the second generation spent a groat deal of tine at hone. In addition, a larger percentage of second generation students worked regularly at hons and approved of working at home. This pattern of rasponaa nay suggest that Samoan adolescents did not have regular hone responsibilities prior to migration, and that in the new environment they mgr heve been celled upon to fulfill acre regular responsibilities around the hone*
The child's role In family financial affairs, as expressed in a number of items, suggest that the students were Involved in the family as a financial unit and that this Increases over a period of time in Hawaii, There was a larger percentage in the eeoond generation that gars the money they earned to their parents, and there wee also a larger proportion of families where children were included in financial discussion. Approximately the ease percentage in the two groups received a regular money allowance without supplementation, with more indecision in the
92
\
first generation, That mare eeoond generation students give money to their parents aagr also indicate that more of then were actually earnli^ money, rather than a larger percentage of thoee working giving the money to parents»
It weald seen iron the date in Tables 32 and 33# that the first andsecond generation students differ in the area of family values. The group
\
of Sauces students that has been resident in Hawaii for ware than one generation seems to like families less and to like work at home wore.There was a tendency in the eeoond generation to he leaa favorable to authoritarian fathers, and to he wore favorable to independent mothers. However, there was little difference between the groups aeoording to the amount of time epent at heme or the amount of work done at home. Eriuftntiomtl Values
Similar changes were evident over a period of residence in Hawaii on responses related to educational values* Table 34 reports the responses of the first and second generation Samoans to words related to educational values.
Thsrs were very slight increases in the proportion in the second generation in positive response to school and book, while there were large increases in the percentages that favored reading and arithmetic. There was a definite decrease in the proportion that responded pa ltively toward teacher, ehlofo seem to be the most important change, indicating that the teacher decreases in importance over a period of time.
93

94
1st Gen, 2nd Gen* Total Group (H t 40) ( I t 19) ( H e 289)
TABLE 34« PERCENTAGE DISTRIBUTION OP RESPONSES OF SAMOANS TO»(XU) XTENS RELATED TO EDUCATIONAL VALUES, BX GENERATION
IN HAWAII, AND MEAN PERCENTAGE OF ALL GROUPS
•School* Like 82*5 84.2 76.7Don't eare 15.0 10.5 16.4Dislike 2*5 5.3 6.9
#7.5 68.4 66.8•Book* Don't oar« 25*5 26.3 23.0
Dislike 10*0 5.3 10,0T 4 V . 80.0 57.9 68.3•Teacher" Don't eare 12*5 15.8 17.2Dislike 7.5 26.3 14.5T .41r. 60*0 68.4 65.3"Reading* Don't care 30.0 26.3 25.8Dislike 10.0 5.3 8.7Like 60.0 68*4 60.9"Arlthnetlo* Don't care 25.5 2 1 .1 20.4Dislike 17.5 10.5 18.7
The sentence item relating to educational educe showed aixHar response pattern»« Tahle 39 report» the response of the first and second generation Sanoano to »ontenoee related to education* A »lightly larger majority in the second generation agreed that everyone should go to college. The groups were undecided as to whether college ess are important far boys than for girls* The groups were also quite undecided as to whsthsr they actually wanted to stey in sahoal or not, although the tendency was toward s negative response* A slightly larger percentage of the seoond generation liked to get better grades in school than their friends, and a larger percentage was undecided. Thera was s small increase between generations in the percentage agreeing that attendance at school and work could be subject to Individual variation*
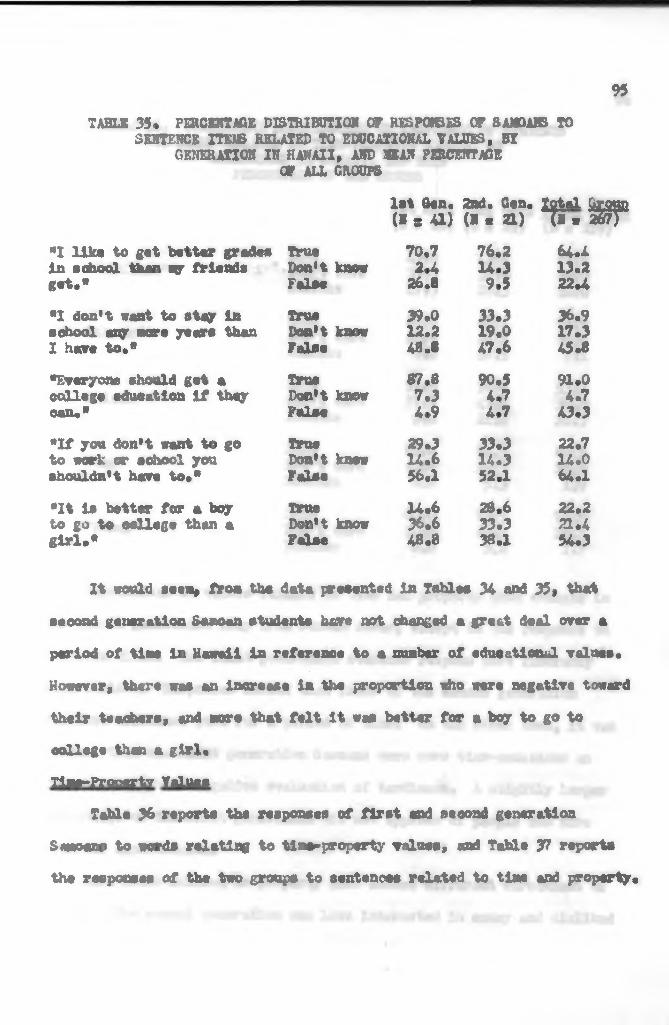
95TABLE 35# PERCENTAGE DISTRIBUTION OP RESPONSES OF SlUOAIS TO
SENTENCE XTE& RELATED TO EDUCATIONAL VALUES» BY GENERATION IN HAWAII, AND SEAN PERCENTAGE
OP ALL CROUPS1st Gtn* dad« Can. Total Groan(» * a) (»« a) IF. 3W
"I like to get better grades True 70.7 76,2 64.4in school then my friends Don't know 2 «A 14*3 13.2get«* False 26.8 9.5 22.4*1 don't want to step in True 39.0 33.3 36.9school any more years than Don't know 12.2 19.0 17.3I have to«* False 48.8 47.6 45.8"Everyone should get a True 87 .8 90.5 91.0college education if they Don't know 7.3 4,7 4*7can«* False 4.9 4.7 43.3"If you don't want to go True 29.3 33.3 22.7to work or school you Don't know 14.6 14.3 14. 0shouldn't heevs to«* False 56.1 52.1 64.1"It is better for a boy True 14.6 28.6 22.2to go to «allege than a Don't know 36.6 33.3 21.4girl«* Folse 48.8 38.1 54.3
It would seam, fro« tbs data presented In Table* 34 and 35» that second generation Samoan students here not changed a great deal over a period of tiBe in Hawaii in reference to a number of educational values. However, there was an inoraase in the proportion who were negative toward their teachers, and «ore that felt it we« better for a boy to go to odllege then a girl«Tlae-Property Values
Table 36 reports the responses of first and second generation Samoans to words relating to tl»»»property values, and Table 71 reports the responses of the two groups to sentences related to time and property.

96TABLE 36* FERCEHTAGE DISTFIIBUTIO« Jf KEAPOffilii OF GTUBfiWTS
TO ITEMS RELAXED TO TPO-PROPBRTY VALUES, BXgensratioh is ham i $ aid ueah
PERCENTAGE OP ALL GROUPS1st Gen. 2nd. Gen. Total Group <» • AO) (N . 19) “ 239)
Like 45.0 42d 51.0"Cadillac" Don't ear« 37.5 31.6 29.0Dlallka 17.5 26.3 20.0
T A lrm 67*5 68.4 71.8•©hoea* Don't oar« 27,5 2 1 ,1 20.85.0 10.5 7*4
Hit« 57.5 36.8 53.7"Clock* Don't cure 37.5 42a 36*0Dislike 5.0 2 1 ,1 10.3
80,0 84.2 82.5•Car* Don't care 2 0 . 0 10.5 15.6Dislike 0 , 0 5.3 1.9Like 80.0 73.7 78.9"itoney* Don't care 20.0 2 1 .1 19.4
0 , 0 5.2 1.7
Lxpreaaiona of values related to tins «ad property «ho* change« la the second generation an ay from Saaoan norms, except in the response to the word clock. The first generation students respond more favorably toward dock. Responses showed that fewer of the eeoond generation disliked continued work for a period of tine. On the other hand, it was evident that the first generation Samoans ware more time-oora dons ea indicated by their negative evaluation of tardineaa, A slightly larger percentage of the first generation did not approve of people who were late for appointments.
Word items related to property also showed different directions of change. The second generation was leas interested in money and disliked

9?
TABLE 37. PERCENTAGE DISTRIBUTION CW RESPONSES OP SAMOANS TO SENTENCE ITEMS RELATED TO TIMB-PROPKRTT VALUES, BT
GENERATION IN HAWAII, AND MEAN PERCENTAGE OP AIL GROWS
»1 hat« to work at anything for sry length of tine«*
*1 hat« people «bo or« late for appointments.*
*1 would war a style of doth«« W friend» did not like If I «anted to«**1 never soar* any money forany length of tine«*
»It 1# not right to borrow rwney«*
"It is OK to borrow soon» thing without the owner's permission."
1st Gen. 2nd Gen. Total Group (N s 262)(H s 41) (H - 21)
TrueDon't know False
26.3 9.«63.4
9.54.785.7
22.5 13.064.6
TrueDon't know False
26*814*658.5
23.8 14.361.9
28.616.954.5
TrueDon't know Folse
41.519.5 39.0
23.814.36L.9
41.120.038.9
TrueDon't know False
29.312.158.5
28.60.071*4
22.7 7.0 70 J.
TrueDon't know False
61.07.331.7
66.719.014.3
51.619.329a
TrueDon't know False
2*419.578.0
9.54.785.7
3.82.5
93.0
shoes wore, both of which ere not in the direction of American norm*The second feneration Samoans liked ears better, bat were mere negative to the word »Cadillac.» This «ay indicate an Increased awareness rvsr a period of tine of status and economic differenoes.
The second generation 3moane were more conforming to peer standard« in style of dothing. Tbie wodd support the findings in the previous chapter concerning the high eonforwity in the Pearl Harbor non-Samoan group, and indicate that the Samoans have aoculturated toward ibis sort of norm. Fewer of the seoond generation Samoans saved money, which is change sway from American norm» However, there was a definite increase
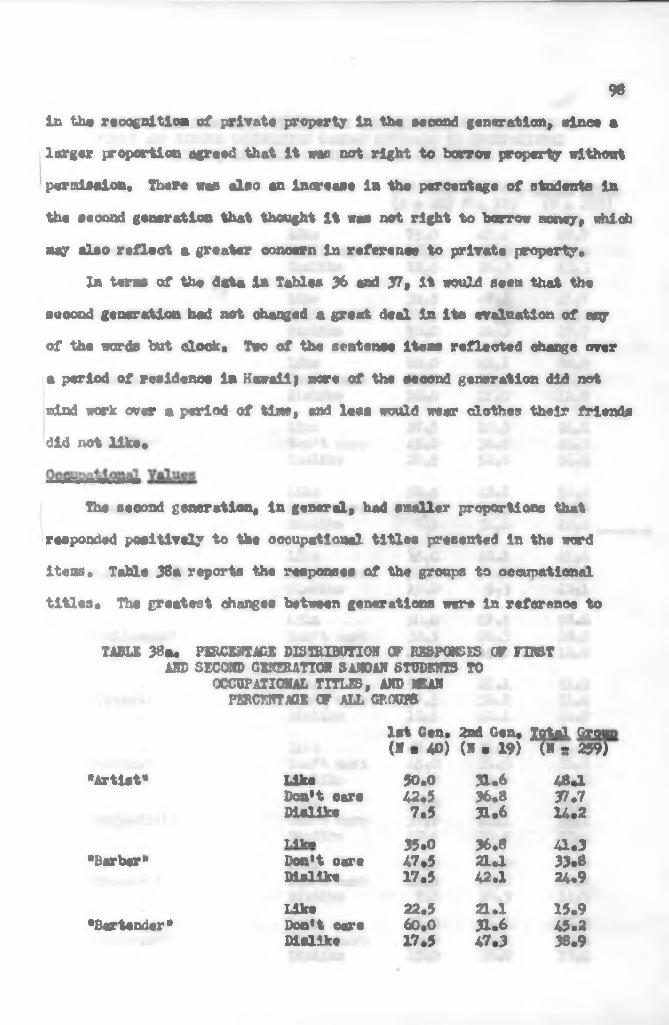
in the recognition of private property in the second generation, since a larger proportion agreed that it ms not right to borrow property without permission, There won also an increase in the percentage of (students in the second generation that thought it wan not right to barrow money, which nay also reflect a greater concern in reference to private property.
In terns of the data la Tables 36 and 37, It would seen that the soeond generation had not changed a great deal in its evaluation of any of the words but dock. Two of the sentence Item reflected change over a period of residence in Hawaii) nor« of the second generation did not aind work over a period of time, and less would wear dotheo their friends did riot like.
The second generation, in general, had smaller proportions that responded positively to the occupational titles presented in the word itoas. TaWLe 38a reports the responses of the groups to occupational titles. The greatest changes between generations were in reference to
TABLE 38a. PERCENTAGE DISTRIBUTION CF mPGNSES OF FIRST AND SECOND GENERATION SA.NOAN STUDENTS TO
OCCUPATIONAL TITLES, AND ¡CAM PERCENTAGE OF ALL GROUPS
98
1st Gen. 2nd Gen. Total Grou (I * 40) (N « 19) 7 * 8 259)
"Artist* LikeDon’t ears Dislike
50.042.57.5
31.636.831.6
48.137.714.2
"Barber*Ml»Don’t care Dislike
35.047.517.5
36.821*142.1
41.333.824.9
■Bartender *LikeDon’t care Dislike
22.5 60.017.5
21.131.647.3
15.9 45.238.9

99tabld 36* (continued). ruuxstags o&raiBUfiuK or mpoj&ss carFIRST iSD DDCQ8D G&RI3UXIQK SAHDM STi&EJHS TO OCCUPATICKAL
TXXZJ&* ADD FXEC2MXAGS OF ALL GROUPS1st C*n. 2nd G«n. Total Croup(» « 40) X a 19) (ST BIT
"Doofc«r* Don't oar* Dlallka
75*012.512.5
47.426.326.3
69.717.013.3
*£l««trlaUfn*LiksDon't ear« 32.557.5
10.047.426.326.3
41.743.015.3
"*«rasar«W mDon't ear« si*nk«
60.030.010.0
422136.821.0
56.231.012.8
*y*Bitosr*T.4 Ir.Don't ear«TA*14It.
27.5 15.027.5
10.5 36.852.6
24.S40.334.9
’’Lswqfsp *'|-4 frfDon't ear«nt.uk«
52.5<40.07.5
42^26.331.6
53.230.816.0
"Llautsftant̂likeDon't ear« Bialik«
35.050.0 15.0
42.152.65.3
41.646.31241
*?ollo«Ban*T.41r̂Don't ear* Dialik«
50.032.517.5
57.926.315.8
58.628.512.9
*Pri««t"Mk.Don't car« Dialik«
50.037.512.5
2ia36.843.1
51*531.616.9
bailor*1,4k.Don't car*
22.515.012.0
31.631.6 36.6
44a36.919.0
•fcci«irtlst»143eeDon't ear»MalUre
50.037.512.5
47.4 42a10.5
54.4 33.212.4
vT«*otwrvLikeDon't ear« Dialik*
60.012.57.5
57.915.826.3
68.317.214.5
"Saitr«*»»*Mir.Don't care Dialik«
25.060.015.0
2ia42.136.8
35.545a19.4
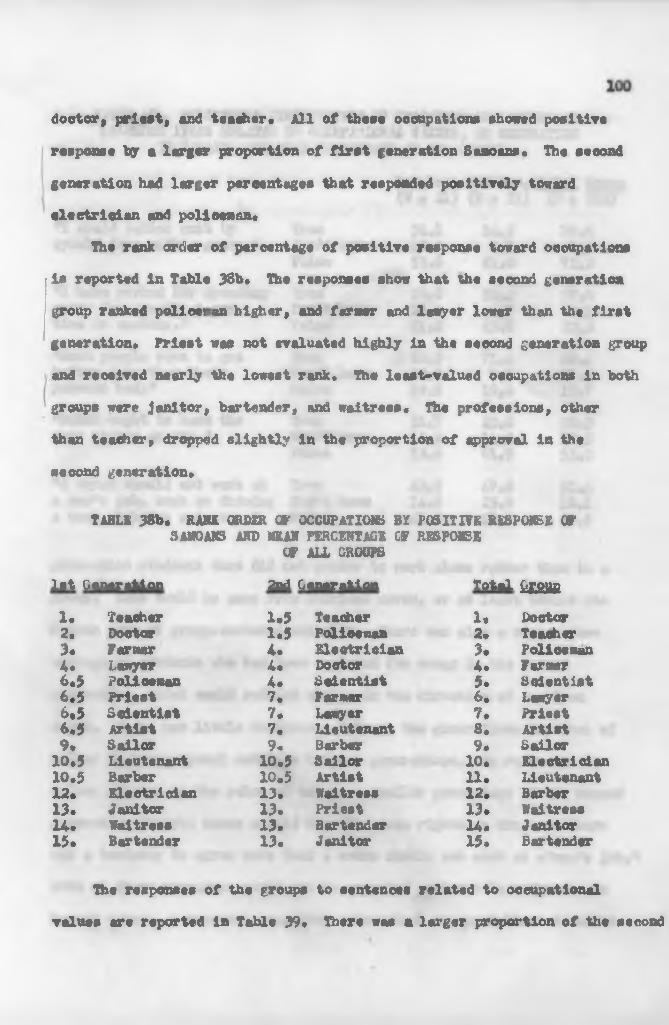
doctor, priest, and teacher. All of these occupations shoved positive response by a larger proportion of first generation Samoans. The second generation had larger percentages that responded positively toward electrician and policeman«
The rank ordsr of percentage of positive response toward occupations is reported in Table 38b« the responses show that the second generation group ranked poll or an higher, and f corner and lawyer lower than tit# first generation« Priest was not evaluated highly in the second generation group and recalved nearly the lowest rank« The least-valued occupations in both groups were janitor, bartender, and waitress* fha professions, other than teacher, dropped slightly in the proportion of approval in the aeoond generation«
TABLE 38b« RAMA ORDER OF OCCUPATION BY POSITIVE R¿SPOUSE OP BAMOAMS AMD MEAN PERCENTAGE CF RESPONSE
OF ALL GROUPS1st Generation 2nd Generation Total fesaaa
1« Teacher 1.5 Teacher 1« Doctor2. Doctor 1 .5 Policeman 2. Teacher3« Farmer 4 . Electrician 3. PoliceBanA« Lawyer 4. Doctor 4« Farmer¿«5 Policeman 4* Scientist 5* Scientist6.5 Priest 7. Farmer 6. Lawyer6*5 Scientist 7. Laaysr 7* Priest6.5 Artist 7. Lieutenant 8 . Artist9 . SfldULctir 9. Barber 9* Sailor10.5 Lieutenant 10.5 Sailor 10. Electrician10.5 Barber 10.5 Artist 11. Lieutenant12« Electrician 13. Waitress 12. Barber13. Janitor 13. Priest 13. Waitress14. Waitress 13. Bartender 14. Janitor15. Bartender 13. Janitor 15« Bartender
The responses of the groups to sentences related to occupational values are reported in Table 39« There was a larger proportion of the second
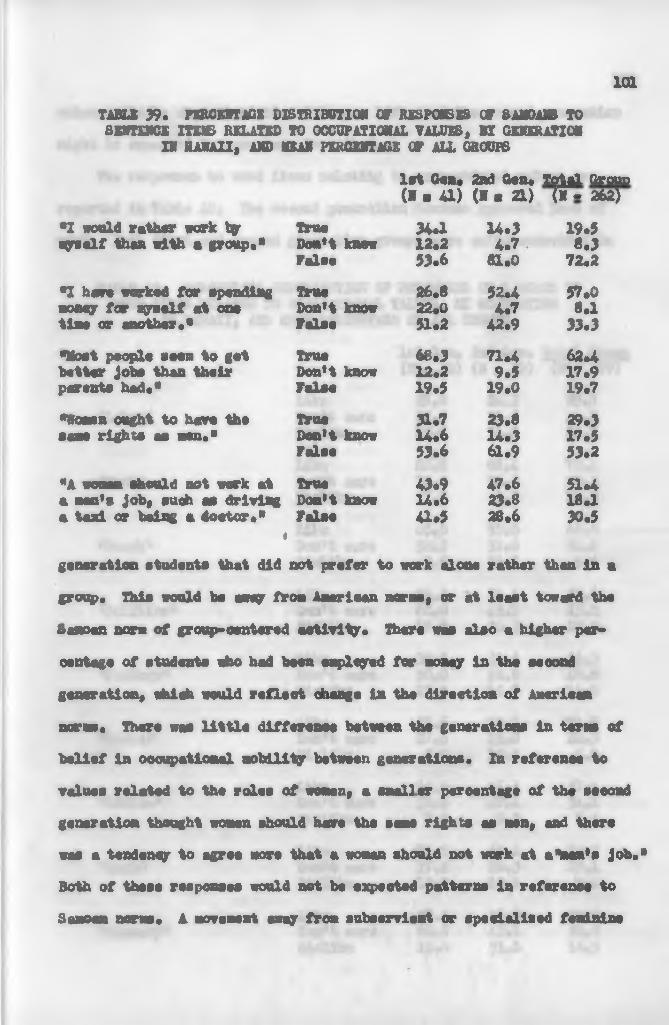
let Gen* 2nd Gen. Total Group (I a U ) (X a 21) (T- 262)
101TABLE 39* PERCENTAGE DISTRIBUTION OF RESPONSES OF SAMOA» TOSENTENCE ITEMS RELATED TO OCCUPATIONAL VALUES, BY GENERATION
II HAWAII, AND MEAN PERCENTAGE OF ALL GROUPS
*1 would rather work by True 34.1 14.3 19.5eywelf than with a group." Don’t know 12.2 4.7 8.3False 53.6 81.0 72.2
"1 hart worked for spending True 26.8 52.4 57.0money for syaelf at one Don’t know 22.0 4.7 8.1tine or another." False 51.2 42.9 33.3"Moat people seem to get True 68.3 71.4 62.4better Jobe than their Don’t know 12.2 9.5 17.9parante had«* False 19.5 19.0 19.7"Woman ought to have the True 31.7 23.8 29.3earn right# as men." Don’t know 14.6 14.3 17.5False 53.6 61.9 53.2"A woman should not work at True 43.9 47.6 51.4a man’s job, each as drlvia« Don’t know 14*6 23.8 18.1n taxi or being n doctor«*
«False 41.5 28.6 30.5
generation students that did not prefer to work alona rather than in a group. This mold ha away fro* Aaerlean norms, or at least toward the Sanoan norm of group-oenterad activity. There wma aleo a higher percentage of students who had been employed for money la the seoondgeneration, whioh would reflect change In the direction of Americannorma. There was little differenee between the generations in ter me of belief in occupational mobility between generations. In refercnoe to values related to the roles of woman, a smaller percentage of the eeeoad generation thought woman should hart the same rights as nan, and there wee a tendency to agree more that a woman should not work at a%an*a Job."Both of these responses would not ba expected patterns in refer anea toSanoan norma. A movement away from subservient or specialised feminine

rolaa would lit eharacttristic of Snnoan lift» «ad tht atoond generation wight ht expected to mart away f*’«*» that«
Hat responses to word items relating to occupational valuta art reported la Table 40« Tht ttooad generation Santana approved Ittt of work« Both flrat tad ttooad generation group* wtrt quitt undecided la
TABLE 40« PERCENTAGE DISTRIBUTION CP RESPOI&ES CP SAMOAMS TO WORD ITBJC RELATED TO OCCOPATIORAL VALUES», BY GEHERATIOS
XX HAWAII, AHD iffiAH PERCENTAGE CP ALL GROUPS
1 s t Gan# 2nd Ota# T o ta l Group ( I a 40 ) (N s 29) ( T o 259)
«Labor* LlktDon't tart Dislike
25#062.512.5
26.336.836.8
29.545.824.7
•Work*LlktDon't cart Dislike
82.510.07.5
68.426.35.2
79*419.310.3
"Bttth*LlktDon't cart Malika
65.032.52.5
52.631.615.8
69*624.85.6
«Polities"LlktDon't care Dlsllkt
25.5 60.017.5
31*642*126.3
33.643.223.2
^Pattory"LlktDon't tart Dislike
32.5 50.017.5
31.652.6 15.8
36.346.816.8
•'Store* Don't care Dislike
67.527.5 5*0
73.715.8 10.5
71.822.35.9
••Offlot"LlktDon't cart Malik«
60.032.57.5
47.447.4 5.2
57*4344.8.5
«Bank*LlktDon't ears Dislike
72.517.510.0
63.226.310.5
70.322.17.6
“Cannery*LfVeDon't ears Dlsllkt
27.562.5 10.0
26.342.131.6
32.650.916.5

TABUS 40 (Contimied). FBRCESTaGE DISTRIBUTION CT BXBPOMBSß CTSAmtm to vciq) m » related to occupatiokal valües,
BZ GEiERAn« ZK HAWAII, JÜTO SABr m c m m er all groofb
Ist C«n. 2ad Goa. Total Group ( * « 4 0 ) ( I • 2 9 ) w r & r
103
L i k # 5 7 . 5 5 2 . 6 5 6 . 2
« h i p « D o a ' t e a r « 4 0 . 0 1 5 . 8 3 2 . 3M r t t l w 2 . 5 3 1 * 6 1 1 . 5
L i k o 5 5 . 0 5 2 . 6 6 0 . 0
• S h r w f o r k C i t y * D o a ' t e a r o 4 2 . 5 3 6 . 8 3 4 « 6M « H h « 2 . 5 1 0 . 5 1 0 . 4
L U » C 7 . 5 4 7 . 4 e r . 9
• C a l i f o r n i a « D o a ' t e a r « 3 2 . 5 4 2 . 1 2 4 * 5
0 . 0 1 0 . 5 7 . 6
L i k « 3 0 .0 3 1 . 6 3 7 . 6
« J a p a n « D o n ' t « a r « 6 2 . 5 3 6 . 8 a . 9
D l « l l k « 1 7 . 5 3 1 « 6 2 0 . 5
Tr| W 6 0 . 0 5 7 . 9 6 2 . 5
« H o n o l u l u « D o n ' t « a r « 3 2 . 5 2 1 a 2 5 . 9
D i a l l k a 7 . 5 2 1 . 1 1 1 . 6
rafarenoe to labor» perhapo ladleatlng « ladt of undaratandlng of th« ward. Th« saoonä genor&tlon liked beaesh lus, whidi night be «xg*eted «■ a rej«otlon of a fanilior part of llf« in Gtunoa. Thor« « m no largo diffarence ln raspoasa to sowt of th« ward«, «xoapt that th«r« t«nd«d to h« las® nautral reactioa toward th« word* tgr the sacond ganeratlon group.
Ward« raprammtlng plaoa« of «nplasMWfe ahawad ralatiwely llttla «hang««« Thar« war« no dlff «raneas batvaan th« flrat and aaeond ganar&tloa ln thadr «raluatisn of th« «erd faetory, bat aore saoond ganaratloa atodaata raspoadad poaitiraly toaard ator«, and nur« reapondad nagatlraly toward offlee, bank» aanmry, and «hip. Sh« pooltlwa intaraat ln «tor« aay lndloata an intarast in itaaa that ar« «railabl« ln th« naw «nvironanxt»
The distribution of rwpMita to th« lteas relatlng to géographie locations showed an inereasa in th« par œnt âge of négative réaction on ail itena by tha aaoond ganaratioa group. Hoeever» « signlflcantly largar proportion of tha firet génération group tha» tha seoond génération group evaluated California poeitlvsly. There «as a eigniflcaatly large gronp of Saaoan migrants in California» and this reeponae mqt rafle et négative évaluations of tha exnerienoes of aiaraata in California.
nia data presanted in Tablas 38 through 40 would aeaa to iadleato that « m important différences la occupations! values suy be due to a parlod of rssldsaos ln Hawaii* altfaough tha slalleritiea la responae «are rauoh more fréquent than tha dlffarenesa» there «are contraste évident in the deoreaae in the proportion of studente that like to vork aloni» and tha inereasa in proportion that had bean eaployed, Also» tha ganeral dterease in positiva reapemea and inereasa in aagatlva reapoasa in tha second génération group may indioate a général optlalsK in tha évaluations of the nsv Migrants «hioh «as net évident anong Saneane who hâve bean raised in Hawaii.
Tha attitudes of tha Sanoan studants toward words relating to othnio groupa eaeprassad distinct changes in attitudes ovar tins. Tha reeponooe of tha flrst and second génération Sasnena to the «crd Iteas represeatlng ethnie groupa ara reported ln Tabla 41* Xt «aa évident that attitude» toward ail groupe but tha Haola and the H avalisa «ara «are négative ln tha aaoond génération group. Tha change la attitudes between
104la contrast to th« laaaar degree of interest ln other plaoes of eaployasnt.

105
TABLE 41. p m CENT ACE DISTRIBUTION OF RESPONSES GF SAMOANS TO IKED XTES6 RELATING TO ETHNIC VALUES, XI GENERATION
IX HAWAII | AND MEAN PKRCEHTXBE OF ALL GROUPS1st Gen« 2nd Gen. Total Croup(X . AO) (X * 19} 7 x 7 3 5 T37.5 21.1 42.0
"Chinese" Don't eare ■45 .0 52.6 40.2Dislike 17.5 26.3 17.8Mir. 45.0 26.3 43.4
•Filipino" Don't oare 40.0 47 4 42.3Dislike 15.0 26.3 14.3
40.0 21.1 37.5"Genum" Don't oare 50.0 42.1 43.8
Dislike 10.0 36.8 18.7T.<t» 42.5 57.9 48.9
"Hade" Don't oere 42.5 36.8 38.2Dislike 15.0 5.3 12,9Like 62.5 52.6 66.9
"Hawaiian" Don't ears 27.5 42a 27.6Dislike 10.0 5.3 5.5T<V. 40.0 15.8 32.7
"Korean" Don't oare 45.0 47.4 47.6Dislike 15.0 36.8 19.7T.4Vf 55.0 10.5 47.7
"Bagro* Don't oare 32.5 47.4 34.3Dislike 12.5 42.1 18,0Lika 90.0 57.9 60.4
NSanoan" Don't eare 10.0 21.1 28.07* «0 4 if? 0.0 21.0 11,6
the first and seeonfl generation Samoans toward all athnie groups bit the Hawaiian and the Chinees was In the direction of the response of the total group. However, the attitude toward the Hawaiian and Chinese showed changes away iron the naan* These responses would suggest that, in general, the Saraoans were adopting and oftsn exceeding in intensity the ethnie attitudes of the resident comaunitiea.
i
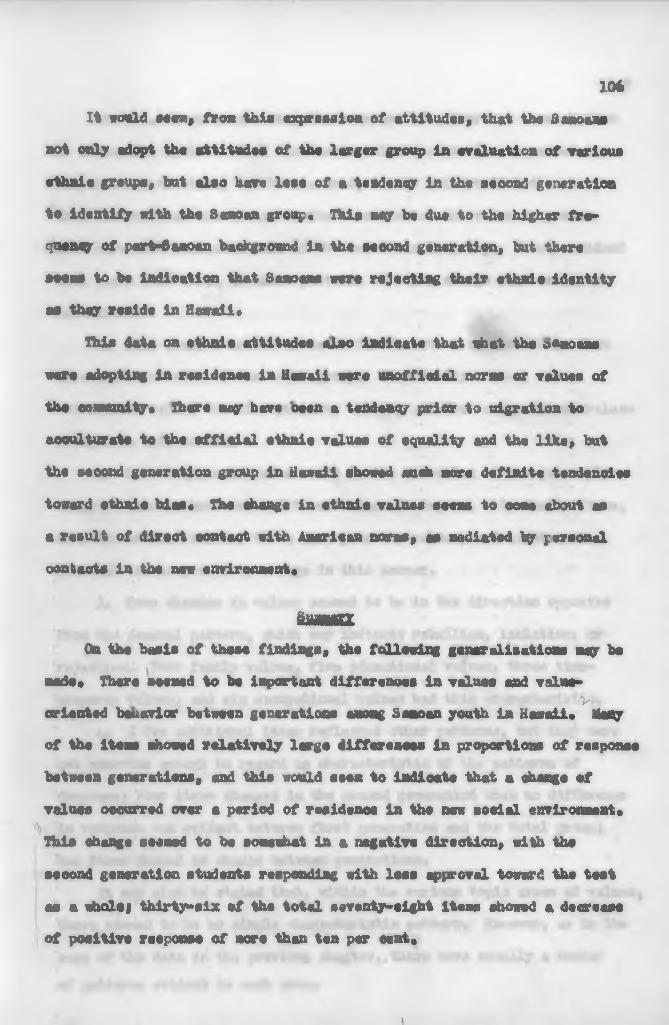
1% would MiBf fron thie expression ot attitudes, that the Bmoaxm not only adopt the attitudes of the large* group in évaluation of varioua ethnie groupe, but aleo have leee of a tendency in the second génération to identifÿ with the Senoan group. This *ay be due to the higher fre- quency of pert-Gasoen baekground in the second génération, tut there sseas to be indication that Samom sera rejeoting their ethnie ldentity as they résidé in Bairall*
This date on ethnie attitudes aLso indieate that chat the oaaoans vers adopting in residenes in Hawaii «ers unoffioial noms or values of the oommity* There may hâve oeen s tendency prior to «igratiaa to aooulturste to the officiel ethnie values of equality and the like, but the eecoad génération group in dswell shoaed nuoh nore definite tendenoies toward ethnie bise* The change in ethnie values saens to eone «bout es a resuit of direct contact with Aaerican noms, es sodiated by peraonal contacts in ths new emrirooasat,
f t m k z
On the basis of these findings, the following généralisations u y besade* There seened to bs i»portant différences in valuee and valus»
Varlented beuaeiar between générations anong Senoan youth in Hawaii» Jtaoy of the ltese ehowwd relatively large differenoea in proportions of responee between générations, and this would a tes to indioate that a change of values oeeurred ovsr s psriod of residenos in ths ne« social environnent. This change seeasd to be soaeehat in a négative direction, with the seoond génération students respoadiag with laae approval toward the teat as s whols} thirtyeix of the total seventy-elght itéras ahowed a decreaae of positive reeponse of acre than ten par cent«
106
i
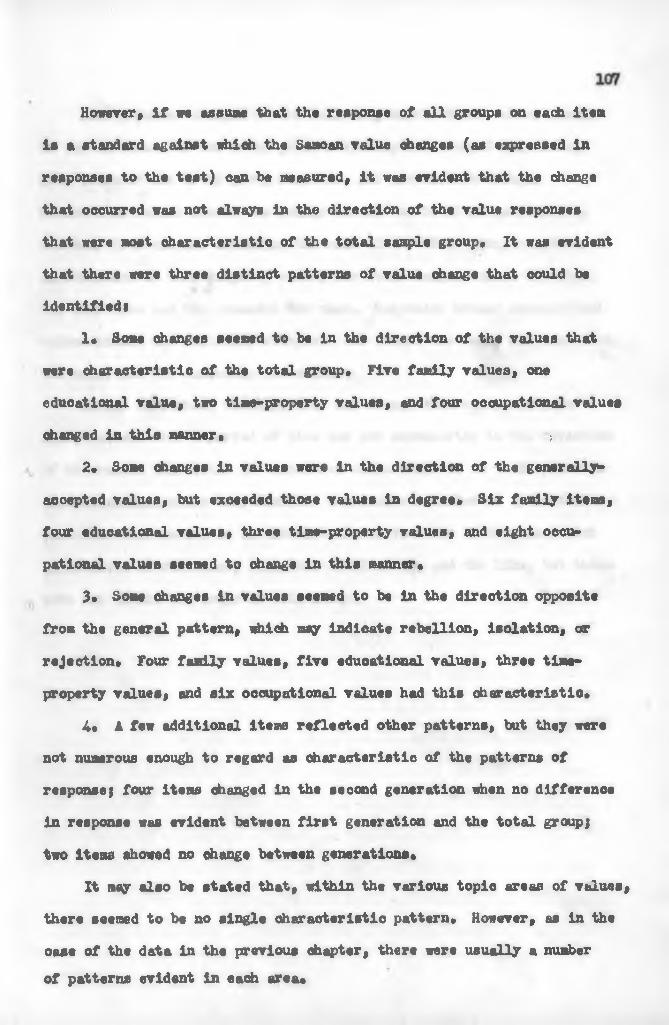
However« If we assume that the response of all groups cm each Item is a standard against which the Samoan value changes (as expressed in responses to the test) can be measured« it was evident that the change that occurred was not always in the direction of the value responses that were »set characteristic of the total sample group* It was evident that there were three distinct patterns of value change that could be identified!
1* Some changes seemed to be in the direction of the values that were characteristic of the total group* Five family values* one educational value* two time-property values* and four occupational values changed in this manner. ;
2* Some changes in values ware in the direction of the generally«» accepted values* but exceeded those values in degree* Six family items* four educational values* three time-property values, and eight occupational values seemed to change in this manner*
3* Some changes in values seemed to be in the direction opposite from the general pattern* which may indicate rebellion, isolation* or rejection* Four family values* five eduoational values* three time- property values* and aix occupational values had this characteristic*
4* A few additional items reflected other patterns* but they were not numerous enough to regard as characteristic of the patterns of response; four items changed in the second generation when no difference in response was evident between first generation and the total groups two Items showed no change between generations*
It may also be stated that* within the various topic areas of values* there seemed to be no single characteristic pattern* However* as in the oase of the data in the previous chapter* there were usually a number of patterns evident in each area*

Family values changed in the following ways* three values changed in the direction of the total group response, two (hanged away from, four exceeded the total group response, and two did not change* Educational values shoved one change toward the total group response, two away from and two exceeding the mean of the total group response.In referenoe to tine-property value, one item changed toward the mean, two away from and two axeeaded the mean* Responses toward occupational values showed the following changes* two toward the mean, one away fl*om the mean, and two exceeding the mean*
It may be stated, finally, that the change that seemed to occur among Samoans over a period of time was not necessarily in the direction of the values that could be considered characteristic of their peers in the communities where they reside. There were a number of additional variables that seemed to be closely related to these differences, such as location of residence, religious affiliation, and the like, but these were not within the scope of this study*

CHAPTER VII M M U R X AND CONCLUSIONS
£ES&IB Jfld flZBSltUUUUIThe intent of this study has been to describe and confere aoeio-
\ fl' economic values expressed by Samoan and non-Samoan youth in Hawaii«V The study was based on the postulate that culture contact situations
bring about some degree of modification of behavior, or acculturation«It was also postulated that acculturation in the general area of soeio- economic behavior is central to this modification of behavior of the group that migrates to a new society«
Three general hypotheses were presented for investigation! first, that the expression of values and ths process of value change is related to the ethnic characteristics of a group) secondly, that the expression of values and value change is related to the specific situation of culture contact) thirdly, that the expression of values and value change is related to the length of time of culture contact«
M M a l g gIn order to investigate Samoan socio-economic values, the literature
on contemporary Samoa was explored« From available information on Samoan values, a series of items that were reported as specifically Samoan, or specifically not Samoan, was collected. To this list were added a number of items that were considered to be likely to reflect differences of values in reference to sooio-economic behavior«
These items, which were considered to be likely to reflect value changes among Samoan youth in Hawaii, were included in a questionnaire, which was administered to sample groups of Samoans and non-Samoans in
f t\af \

Hawaii« The sample groups were chosen from the school populations at Pearl Harbor Intermediate School am! Kahuku School. The questionnaire also Included questions relating to selected background characteristics of the students«
Summary o£ Find ices The investigation of available literature on contemporary Samoa
revealed that much of Samoa was characterized by the way of life known as faaSaxaoa. Socio-economic life in Samoa was focused toward the extended family as the basic unit of consumption, production, and status- earning« A number of sources of change have been introduced into Samoan socio-economic life over a long period of years. These included some urbanization, contacts with missionaries, military personnel, foreign government personnel, teachers, and traders* However, the faaSamoa tradition has been remarkably resistant to change« In spite of the change in socio-economic life that has taken place In Samoa, faaSamoa provided a standard of measure from which the socio-economic values of Samoans in Hawaii may be measured*
A number of specific areas of values were described and compared in light of socio-economic values under the fa/Samoa way of life. Among these were family values, educational values, time-property values, occupational values, and ethnic values«
Patterns o£ similarity ¿n response m M & £ £*& sarole ¿22HE4*In the area of values centering on family, it would seem that the Samoans in Hawaii did not subscribe to the unquestioned authority and control of the father in the family« There were indications that the non-Samoan families in both communities were more patriarchal than the

Samoan families* There were also indications that Samoans in Hawaii may have acculturated to the idea of democratic family behavior. The \students in all groups seemed to he well-integrated into their families« in terms of the responses to the items, in reference to family responsibilities, activities, and discussions.
The Samoans and non-Samoans seemed to be most similar in the area of educational values. The importance of higher education, particularly college, and scholastic achievement were agreed to by all of the groups. Although higher education was important in Samoa, this amount of interest in scholastic achievement would seem to indicate an acculturation in values*
Response to time-property values would seem to indicate that the Samoans have acculturated towards ideas of continued effort over a period of time, private ownership, and the accumulation of property in the form of money. However, since none of the groups indicated a negative evaluation of tardiness, there was indication that this was not necessarily part of the American value orientation. There was indication that the Samoans have not acculturated to the American norm centering on the practice of borrowing money. In rcferenoe to conforming to peer standards in personal property, there was indication that American norms place more Importance on conformity than did Samoan norma* Samoans indicated less interest in conformity to peer standard, in this respect, although they did not differ from non-Samoans In respect to scholastic achievement in reference to peers.
Responses to occupational values showed that working with groups and occupational mobility between generations were values to which the Samoans have acculturated. Attitudes toward feminine occupational

Expressions of ethnic values showed that all groups evaluated the various ethnic groups positively* There was no ethnic group that brought a predominantly negative evaluation*
There seemed to be three distinct patterns of similarity among the four sanple group in referenoe to their expression of values* First* one-half or more of all groups responaed in the same manner to a large number of value items* These were considered core characteristics of all groups* Secondly* in terms of predominant responses* there were a number of values on which the two Samoan groups tended to disagree with the two non-Samoan groups* Finally* the entire sample group from Kahuku* in terms of predominant response* tended to disagree with the entire sample group from Pearl Harbor Intermediate School*
M tjE ia s i & £L«r«sm tetesm Sa&sam a s* Tables
42 and 43 report the mean percentage differences between Samoan and non-Samoan responses to questionnaire items and the level of statistical significance of difference* These data would seem to indicate that ethnic identity was a variable that was significantly related to the expression of socio-economic values* Of the total seventy-eight items on the test of values* all bat twelvs ware found to have statistically significant differences between the responses of Samoan and non- Samoan students*
roles showed that the Saooana have acculturated to ideas of occupationalequality for women «ad freedom from home duties for women»
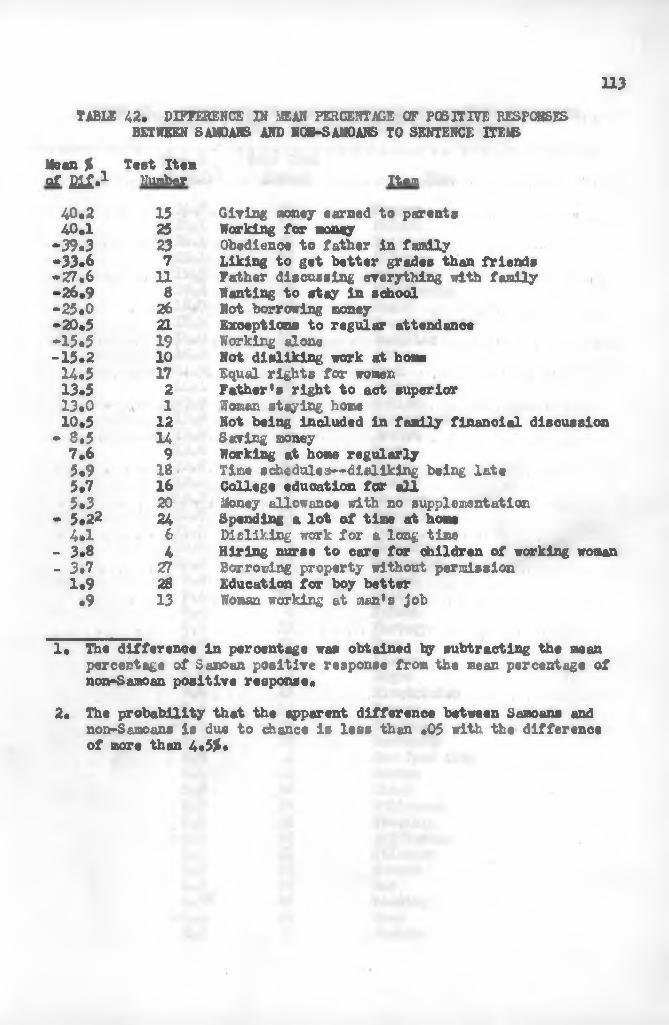
113TABLE 42. DIFFERENCE IN MEAN PERCENTAGE OF POSITIVE RESPONSES
BETWEEN SAMOANS AND NON-SAMOANS TO SENTENCE ITEMSMean % Teat Itemo t m - 1 Number Item40.2 15 Giving money earned to parents40.1 25 Working for money
-39.3 23 Obedience to father in family-33.6 7 Liking to get better grades than friends-27.6 11 Father discussing everything with family-26.9 8 Wanting to stay in school—25*0 26 Not borrowing money-20.5 21 Exceptions to regular attendance-15.5 19 Working alone-15.2 10 Not disliking work at homeH.5 17 Equal rights for women13.5 2 Father's right to act superior13.0 1 Woman staying home10.5 12 Not being included in family financial discussion- 3.5 14 Saving money7.6 9 Working at home regularly5.9 18 Time schedules— disliking being late5.7 16 College education for all5.3 20 Money allowance with no supplementation
- 5.22 24 Spending a lot of time at hone4.1 6 Disliking work for a long time
- 3.8 4 Hiring nurse to care for children of working woman- 3.7 Z! Borrowing property without permission1.9 28 Education for boy better.9 13 Woman working at man's job
1. The difference In percentage vaa obtained by subtracting the meanpercentage of Samoan positive response from the mean percentage of non-Samoan positive response*
2. The probability that the apparent difference between Samoans andnon-Samoans is due to chance is less than *05 with the difference of more than 4«5£*

43* DIFFERENCE IN MEAN PERCENTAGE OF POSITIVE RESPONSESBETWEEN SAMOANS AND NON-SAMOANS TO WORD ITEMSMean % n St Plf*
Teat lien Number Item
34.7 20 Samoan26.1 26 Priest26.1 25 Waitress
-23.1 15 Chinese19.9 45 Politics19.4 23 California13.9 33 Beach17.2 6 Hawaiian16.0 11 Cadillac15.0 39 1 ■i/'vnm?’ iWiiWjr*14.9 37 Work14.4 28 Mother13.9 38 Sailor13.9 34 Lieutenant13.9 46 Artlat-13.6 22 Bank12.3 29 Japan12*4 16 Barber-12.3 43 Brother11.8 42 Cannery11.1 7 Labor10.6 5 Doctor10.3 12 Scientist- 9.5 2 Sdhool9.4 30 Shoes9.4 8 Father9.3 13 Factory8.9 22 Bank8,7 27 Lasyar3,7 3 Negro3.6 10 Electrician-8.6 14 Farmer-8.5 24 Teacher-8.5 35 Bartender6.9 4 New Tork City6.1 44 German5.9 36 Clock5.9 32 Policeman5.9 48 Honolulu-5.8 50 Arithmetic5.3 u Filipino5.0 17 Korean4.9 18 Car4.52 47 Reading-4.4 40 Horns2.5 1 Janitor
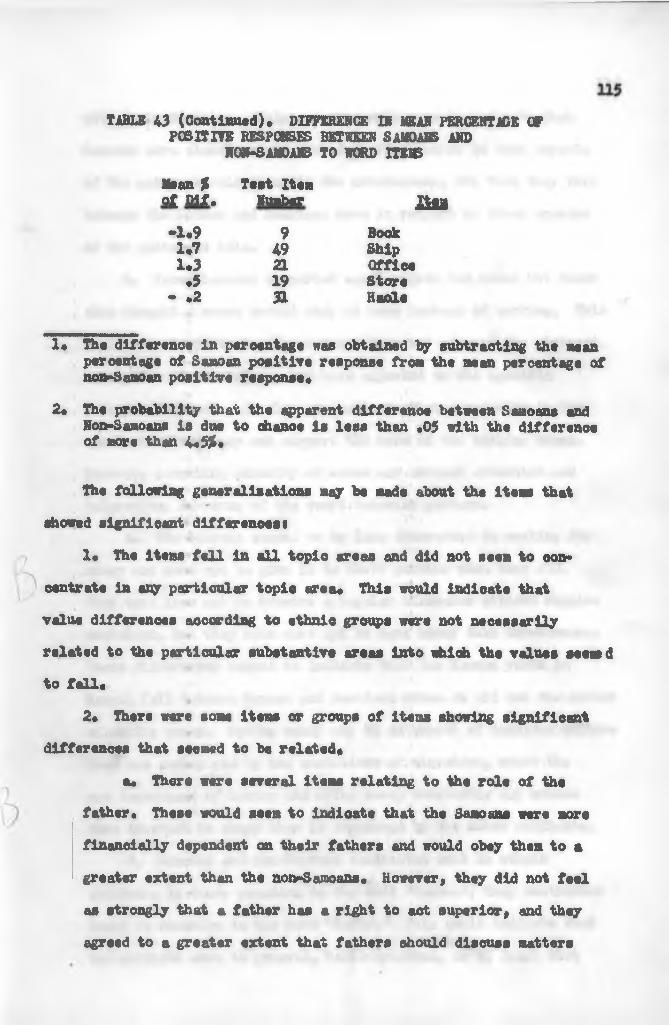
TABLE 43 (Continued), DIFFERENCE IK MEAN PERCENTAGE OFFOBXTIVE RESPONSES BETWEEN SAMOANS AND
NON-SAMOANS TO WORD ITEMSMean % Teat Item o£ M X . Number Ufa•1.91.71.3.5
* * m2
949211931
BookShipOfficeStoreHaole
1« The difference in percentage was obtained by subtracting the aean percentage of Samoan positive response from the nean percentage of non-Samoan positive response.
2« The probability that the apparent difference between Samoans and Non-Saaoana is due to chance is less than ,05 with the difference of more than 4.5$.
The following generalisations may be made about the items that showed significant differences t
1. The items fell in all topic areas and did not seem to concentrate in any particular toplo area. This would indicate that value differences according to ethnic groups wart not necessarily related to the particular substantlvo areas into which the values «eased to fall.
2. There were som iteas or groups of items showing significant differences that seemed to be related.
a. There were several items relating to the role of the father. These would seem to indloate that the Samoans were more financially dependent an their fathers and would obsy them to a greater extent than the non-Samoans. However, they did not feel as strongly that a father has a right to act superior, and they agreed to a greater extent that fathers should discuss matters

116with their families. This pattern would seen to indie&te that Saaoane more closely approximated American norms in some aspects of the paternal role than did the non-Samoans, hut that they fell between the Samoan and American norm in respect to other aspects of the patterned role.
b. Fewer Samo ans supported equal rights for women but fewer also thought a woaan should stay at hoae instead of working. Thia would seem to indieate that Samoans hava not adopted the abstract conception of the valuss, but haare adjusted to the specific behavior lnvolved* 1t also may indieate that a najority in the American eulture may not support the norm of the working wofian.However, a working minority of women may attract attention and/toleration, in terms of the overt behavior pattern.
c. The Samoans seemed to be less interested in working for money and more ept to give it to their parents when they did.They were leas apt to receive a regular allowance without supplementation, but they were more apt to save money than non-Samoans. These differences seemed to indieate that the Samoan youth in Hawaii fell between Samoan and American norms on all but the matterof saving raoney. Scrlng money may be en aspeet of American culture that was emphasized by the eondltions of ndgration, Aere the new impórtense of haeing and using money constantly may «reate more interest in money than ls expressed by the other residente.
d. Samoans and non-Samoana contrastad most in ethnio altitudes in their reaction to the word *3aaoan»j they contrastadleast in reaction to the word "Haole." This would indioate thatthe students were in general, Haole-criented, or at least that
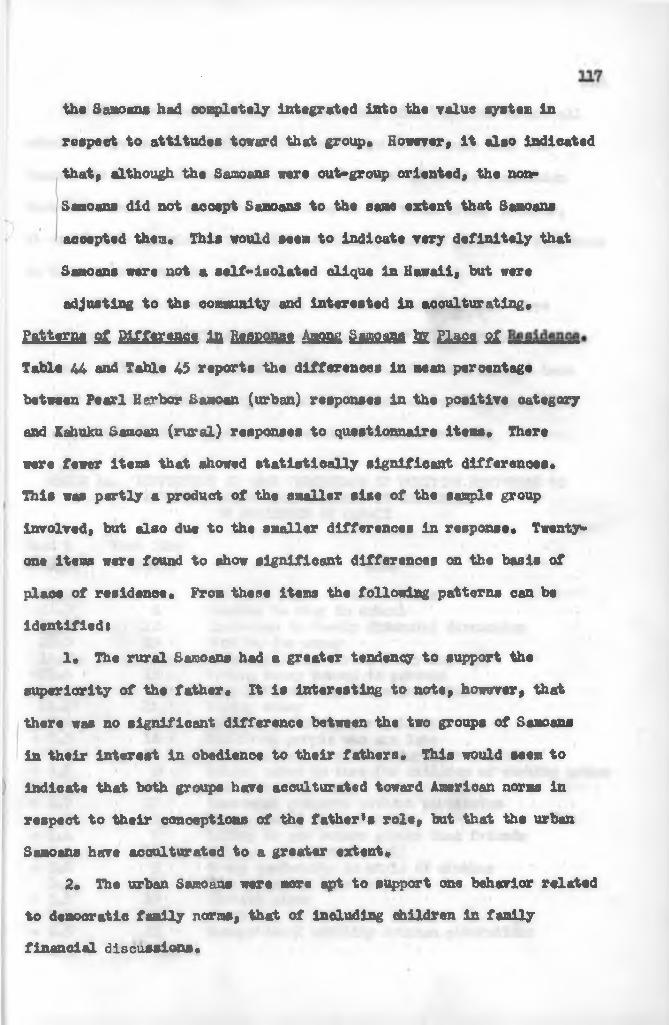
Samoans did not accept Samoans to the ana extent that Samoans accepted them« This would seem to indicate very definitely that Samoans were not a self-isolated clique in Hawaii, but were adjusting to ths community and interested in acoulturating«
S&tgrja s£ iMfiE«aas.t ¿a tiaasssm Aagaa Ssaaaas & SLasa a iTable 44 and Table 4? reports the differences in mean percentage between Pearl Harbor Samoan (urban) responses in the positive category and Kshuku Samoan (rural) responses to questionnaire Items* There were fewer items that showed statistically significant differences«This was partly a product of the smaller size of the sample group involved, but also due to the smaller differences in response« Twenty- one item were found to show significant differences on the basis of place of residence• From these items the following patterns can be identified»
1« The rural Samoans had a greater tendency to support the superiority of the father« It is interesting to note, however, that there was no significant difference between the two groups of Samoans In their interest in obedience to their fathers. This would seem to indicate that both groups have aceulturated toward American norms in respect to their conceptions of the father's role, but that the urban Samoans have aceulturated to a greater extent,
2« The urban Samoans were more apt to support one behavior related to democratic family norms, that of including children In family financial discussions«
the Samoans had completely Integrated into the value system inrespect to attitudes toward that group« However, It also indicatedthat, although the Samoans were out-group oriented, the non»

3. The rural Samoans ware significantly aore negative toward all ethnic groups but the Bade. This would seem to indicate that the Saaoans in the rural area were eapooed to nor as of ethnie evaluation that were much owe negative than those in the urban area« However, it could also be related to another variable, that of length of residence in the new cmrirornent«
4« The difference in response to Priest indicated that there ware jarraon norms Involved in the expressions of values of the rural Saaoans« Although the variable of religious affiliation has not bean
ftJ) treated except in the description of background characteristics, thia is an element that is importantly related to acculturation«
118
TABLE 44« DIFFERENCE IN fSEAK PERCENTAGE Of POSITIVE RJÏÏP08S1S TOsentence m m m m samqans bi coîMnmi
OF RESIDENCE IN HAWAIIMean % Test Items i m * 1 M» a W Item•26*2 2 Father’s right to act superior•24*3„ 3 Wanting to step in school22.02 12 Inclusion in family financial discussion15*0 25 Working for massy14«9 3 Older children caring far younger
-13.5 15 Giving money earned to parents12.2 6 Disliking working for a long time11 «1 14 Saving noney7.6 9 Working around hog» regularly
- 7.3 18 Disliking people who are lata5.5 20 Honey allowance with no supplementation
- 5.5 4 Hiring nurse to care far children of working mother- 4.9 26 Not harrowing money- 4.7 27 Borrowing property without permission* 4.7 1 Women should stay at home- 4.4 7 Liking to get better grades than friends• 4.4 16 Collsge education for all- 3.6 5 Group conformity in style of clothes3.3 28 Education for boys better
- 3.1 19 Working slant3.0 23 Obedience to father in family
— 2.5 22 Occupational mobility between generations

119
TABLE 44 (Continued), DIFFERENCE IN MEAN PERCENTAGE OF POSITIVERESPONSES TO SENTENCE ITEMS AMONG SAMOANS BY COMMUNITY
OF RESIDENCE IN HAWAIIMean % Teat ItemSL £i£« Number Item• 1.7 10 Not dialiking «ark at home* .9 21 Exceptions to regular attendance
.8 13 Woman working at man1« job•5 11 Father discussing everything with family•3 24 Spending a lot of time at home•1 17 Equal rights for «omen
1, Mean percentage of difference «as obtained by subtracting the mean positive response of the Kahuku Samoan group from the mean positive response of the Pearl Harbor Samoan group.
2. The probability that the apparent difference in response betveen the urban and rural Samoans is due to chance is less than .05 if the difference is greater than 16,7£.
TABLE 45. DIFFERENCE IN MEAN PERCENTAGE OF POSITIVE RESPONSES TO WORD 2TENS AMONG SAMOANS BY
COMMUNITY OF RESIDENCE IN HAWAIIMean % at Dif«
Test ItsmNumKpv Item40*6 3 Negro38.4 26 Priest33a 44 German32.4 20 Samoan31.7 1 Janitor30.1 17 Korean30.1 15 Chineac28.8 5 Doctor27 .6 a Filipino24.9 7 Labor22.5 28 Mother21.8 25 Waitress20.8 8 Father20.7 46 Artist18.6 50 Arithmetic18.5 38 Sailor16.9 11 Cadillac16,7 23 California16.72 6 Hawaiian15.3 29 Japan15.5 27 Lawyer14.8 18 Car

120TABLE 45 (Continued). DIFFERENCE IK MEAN PERCENTAGE CF POSITIVE
RESPONSES TO WGRD HENS AMONG SAMOANS BYcowAnrm of residence in Hawaii
Mean %a t m »
Test Item Number Item
14*4 4 New York City12.9 33 Beach11.4 14 Farmer11*2 30 Shoes10.8 32 Policeman10.6 49 Ship9.5 13 Factory8.6 16 Barber8.3 36 Clock7.3 22 Bank7.3 19 Store7.2 42 Cannery6.6 ; 24 Teacher6.3 43 Brother5*3 27 Lawyer5.3 31 Hade
* 5.0 39 Money* 4.8 47 Reading4.3 9 Book
- 3.9 48 Hondulu3.8 21 Office3.3 40 Horn
- 2 a 10 Electrician2.0 35 Bartender1.9 37 Work
- 1.5 12 Scientist1.1 45 Politics1.0 2 School
1« Mean percentage of difference was obtained by subtracting the mean positive response of the Kahuku Samoan group from the man positive response of the Pearl Harbor Samoan group*
. . . * •2* The probability that the apparent difference in response between
the urban and rural Samoans is due to chance is less than «05 if the difference is greater than l6«7Jt.
Patterns of difference 4a response among Samoans b£ generation. The percentages of difference of positive response between first and second generation Samoans on the value items reported in Tables 46 and 47 shoved that twenty items had differenoas that were statistically
✓

significant. It may be pointed out, at this time, that nearly all of the Pearl Harbor Samoans were of the first generation, and the Kahuku Samoans were distributed over several generations# The following con- elusions were made»
1« The first generation Samoans were more individualistic and leas*conforming to group standards, in referanea to their atranger interest in working alone and less interest in conformity to group standards in style of dress# This confirmed the earlier suggestion that emphasis in the literature on the conformity of the individual to the group in Samoan life may be over*emphaslzed#
2# Second generation Samoans seemed to be closer to their homes in reference to spending more time at home and liking more to be at home# This might have been more related to the variable of community of residence rather than to length of residence# It may also hare indicated that the first generation Samoans were more highly acculturated to American norms prior to migration, and that the Samoans riho migrated earlier preserved more of their Samoan norms in tha Hawaiian setting#
3# The seeond generation Samoans were significantly more negative in their response to nearly all ethnic groups, indicating that residence in Hawaii may hova encouraged acculturation to informal norma of ethnic evaluation, which w«re not expressed by newcomers io Hawaii#
12X

TABLE 46. DIFFERENCE IN IIEAN PERCENTAGE OF POSITIVE RESPONSESTO SENTENCE ITEMS BETWEEN THE FIRST AND SECOND
GENERATION SAMOANS IN HAWAIIMean % Test Item
Number lisa25.6 25 Working for money
-19.8 19 Working alone19.5 10 Not disliking work at home17.8 24 Spending a lot of time at home
-17.7 5 Non-conformity in style of clothes-17.32 6 Disliking working for a long tins14*0 28 Education for boy better
-12.9 12 Inclusion in family financial discussion11.6 23 Obedience to father in family8.4 15 Giving money earned to parents8.2 9 Working around horns regularly8.2 4 Hiring nurse to care for children of working woman
- 7.9 13 Working woman at a man's job7 a 27 Borrowing property without permission
— 6.8 2 Father's right to act superior6<»4 7 Liking to get better grades than friends5.7 8 Wanting to stay in school5.7 26 Not borrowing money4.3 17 Equal rights for women4.0 21 Exceptions to regular attendance3.3 11 Father discussing everything with family3.1 22 Occupational mobility between generations
- 3.0 18 Compulsion about time scheduler-disliking being late
2.7 16 College education for all1.4 ' 1 Women should stay home
- .7 20 Money allowance with no supplementation- .7 U Saving money
•3 3 Older children oaring for younger siblings
1« The difference in percentage wee obtained tor subtracting the man positive response of the first generation Samoans from the mean positive response of the second generation Samoans.* - >'* 1 ; • .. .
2. The probability that the apparent difference in response between first and second generation Samoans is due to chance is lees than .05 if the difference is greater than 16.7£.

TABLE 47. DIFFERENCE IN MEAN PERCENTAGE OF POSITIVE RESPONSESTO WORD ITEMS BETWEEN THE FIRST AND SECOND GENERATION
SAMOANS IN HAWAIIMean %s & m * 1
Test Item Number
-44.5 3 Negro-32.1 20 Samoan-26.9 26 Priest-28.4 46 Artist-27.6 5 Doctor-24.2 17 Korean-24*1 8 Father-22.1 24 Teacher-21.8 28 Mother-20.7 36 Cloak-20.1 23 California-18.9 44 German-18.7 a Filipino-17.9 u Farmer-17 .02 1 Janitor-16.4 15 Chinese15.4 31 Haole-14.1 37 Work-13.6 43 Brother-12.6 21 Office-12.4 33 Beach-10.7 38 Sailor-10.4 27 Lawyer-10.1 6 Hawaiian9.3 22 Bank8.4 50 Arithmetic8.4 47 Reading7.9 32 Policeman6.9 34 Lieutenant
- 6.3 39 Money- 6.1 40 Home6.1 45 Folitlea5.2 19 Store5.1 49 Ship4.9 10 Electrician4.2 18 Car
- 3.9 25 Waitress- 2.6 12 Scientist- 2.9 11 Cadillac- 2.4 4 New York City- 2.1 48 Honolulu1.8 16 Barber1.7 2 School1.6 29 Japan
-1.4 35 Bartender

TABLE 47 (Continued). DIFFERENCE IN MEAN PERCENTAGE OF POSITIVERESPONSES TO WORD ITEMS BETWEEN THE FIRST AND SECOND
GENERATION SAMOANS IN HAWAIIMean % Test Itemo i m . Number Ik
1.3 (SI Labor1.2 42 Cannery.9 13 Factory•9 9 Book•9 30 Shoes
1. The difference in percentage was obtained by subtracting the meanpositive response of the first generation Samoans from the meanpositive response of the second generation Samoans.
2. The probability that the apparent difference in response betweenfirst and second generation Samoans is due to chance is lass than •05 if the difference is greater than 16.7%.
Qoafl-ttplgagOn the basis of the data presented in this and previous chapters ,
the following conclusions can be drawnI1. Samoan youth in Hawaii expressed values that were similar to
those reported as typical of Samoan youth in Samoa. However, they alsoexpressed values that were similar to those expressed by non-Samoan
■youth in Hawaii. The direction of similarity in responses did not seem to be consistent within specific individuals.
2. Samoan youth in Hawaii expressed values that wers different from those expressed by non-Samoans in Hawaii, and differed in their own group on the basis of the length of their residence in Hawaii, and on the basis of the location of their residence in Hawaii.
3* On the basis of evidence in written reports of Samoa and on the basis of differences in values among Samoans in Hawaii according to length of residence, there was indication of a process of change in

in values among migrating youth. This process of change did not seem to he unidimensional, that is, from Samoan values toward American values, hut was multi-dimensional in the total area of socio-economic values and within the various substantive areas of values. The process of <hangs as evident in the data that have been presented, seemed to involve three patterns of changef (a) a change in the direction of values expressed by all students in the communities, (b) a change in the sane direction as above, but exceeding the degree of evaluation of all students in the communities, and (c) a change away from the values expressed by all students in the oommunities.
4. The data indicated that value changes occur at different rates. Ethnic values, for instance, showed a great deal of change, and there was indication that abstract values change at different rate from overt behavior.
5. It was evident from the data that literary accounts of Samoan values did not constitute an accurate standard from which to measure change. In some oases, for instance, values reported by various accounts as typically Samoan seemed to be distinctly non-Samoan or American. Likewise, descriptions of American values were not specific or sensitive enough to use as adequate standards of measure for particular migrant groups and situations. Knowledge of the specific community appeared to be the only adequate standard of American values for purposes of studying acculturation of values*
toattaftfrjgfl« on the basis of the study, the following are suggested areas for further Investigation!
1. Acculturation prior to migration« Acculturation may begin prior to migration, through direct and indirect contacts, and migration
125
may bring about a rejection <xf some norms that were appropriate in the old environment* For instance, there was some evidence that the Samoan children in the seoond generation were closer to the traditional Samoan values than those in the first generation or the migrant group*
2* Differential acculturation to values* There was some evidence that aoculturation was mors rapid in values on the concrete level then in values that were more abstract* For instance, Samoans in Hawaii tended to eupport the woman*s right to leave home duties and be employed, but did not support ss strongly equal rights for women*
3* Differential acculturation of early migrant and recant migrant groups* Acculturation for those who remained in the old country may be more rapid than for those who migrated at m earlier period* Thus, the more recent migrants may be more highly aoculturatsd to American norms*Some evidence of this le indicated in the high degree of acculturation to family norm« in the first generation Samoan group*
4« Factors in acculturation* The degree of acculturation of any specific group may vary with a large number of faotara, including (a) compatibility of the bid way of lift and the new, (b) the extent to which the group has aceulturated prior to migration, mod (o) the degree of aocoptanoe of the incoming group by the resident groups in the new environment*
In order to measure more adequately the process of value change among migrants, the following suggestions arc made for further researcht
1* A tirae-sequsnos study of the earns specific group from the period before migration, through migration, and over an additional period of time in the new environment* Thin would enable a more careful measuring of ths variables involved in the process of value change*
126
2. A comparative study of two groups at the same time, one of which has migrated and the other \daich has not. This might indicate the contrast in value change in the two contexts» and give a more realistic hase for comparison of the variables Involved in each specific environment.
3. A more intensive investigation of various sub-areas of the general field of socio-economic values might produce a scale of values that could be used as a measure of acculturation with which a specific migrant group could be analysed.
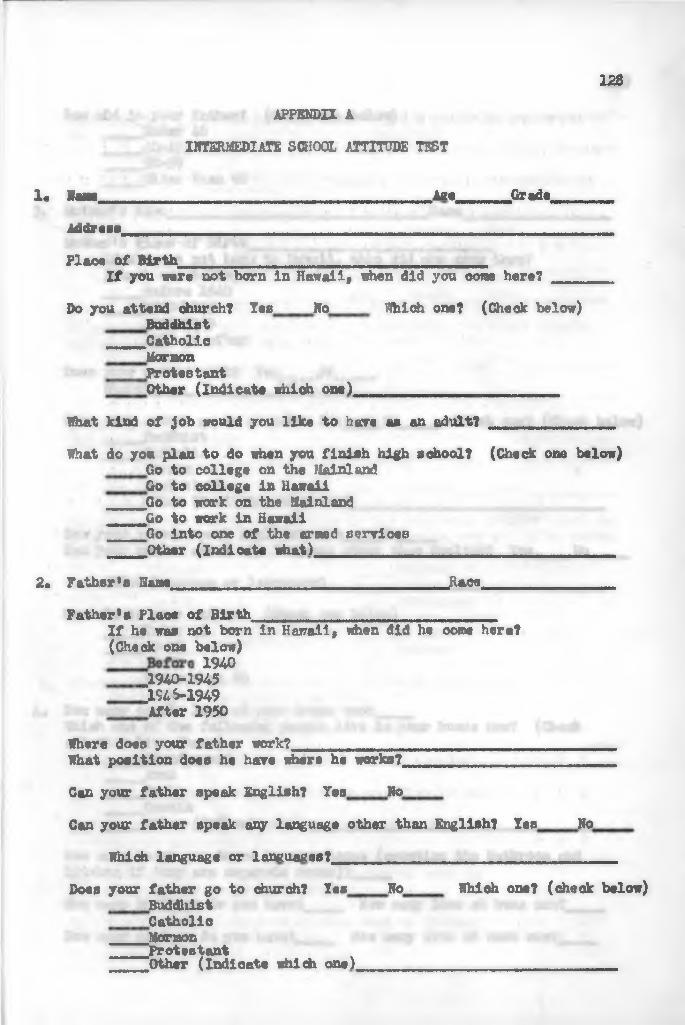
128
APPENDIX A INTERMEDIATE SCHOOL ATTITUDE TEST
1« Nam ÀS9 Grad«Address ______________________________Place of Birth
If you were not born in Hawaii, when did you come here?Do you attend church? Yes No Which one? (Check below)
Buddhist Catholic
MaroonProtestantOther (Indicate which one) ............
Shat kind of job would you like to hare as an adult?What do you pian to do when you finish high sohool? (Check one below)
Go to college on thè Mainiand Go to college in Hawaii Go to wocrk on thè Mai ni and
Go to work in Hawaii Go into one of thè ermed Services Other (Indicate what)
2« Father’s Marne Race.Father’s Place of Birth__________________________
If he was not born in Hawaii, when did he come here? (Cheok one below)
19-40 „1940-1945 „154$-1949 After 1950
Where doea your father work?What position does he have where he works?.Can your father speak English? Yes NoCan your father speak any language other than English? Yes No
Which language or languages?Does your father go to church? Yes Ho Whieh one? (check below)
Buddhist Catholic
Morraon Protestant Other (Indicate which one)

129How old la your father? (Check one below)
Under 40 40-49 50*59
Older than 603* Mother *8 Kaas Race
Mother's Place of Birth________________________If she was not barn in Hawaii, when did she come here?(Check one below)
Before 1940 .1940-1945 L946-1949 .1950 or after
Does your mother work? Yes NoWhere?
Does your mother go to okurch? Yea No Which one? (Check below) Buddhist
Catt olio Mormon Proteatant
Other (Indicate whioh one)Can your mother sp eak English? Yea HoCan your mother 8peak any language other than English? Yes Ho
3hich language or languages?.How old is your mother? (Check one below)
Under 40 40-49 50-59
Older than 60How many people live at your house now?Which one of the following people live in your house now? (Check all that live there)
Grandparent Aunt Unde
Cousin Other (indicate who)
How many rooms are there in your house (counting the bathroom and kitchen if they are separate rooms)?How many brothers do you have? How many live at home now?How many sisters do you have? How many live at home now?
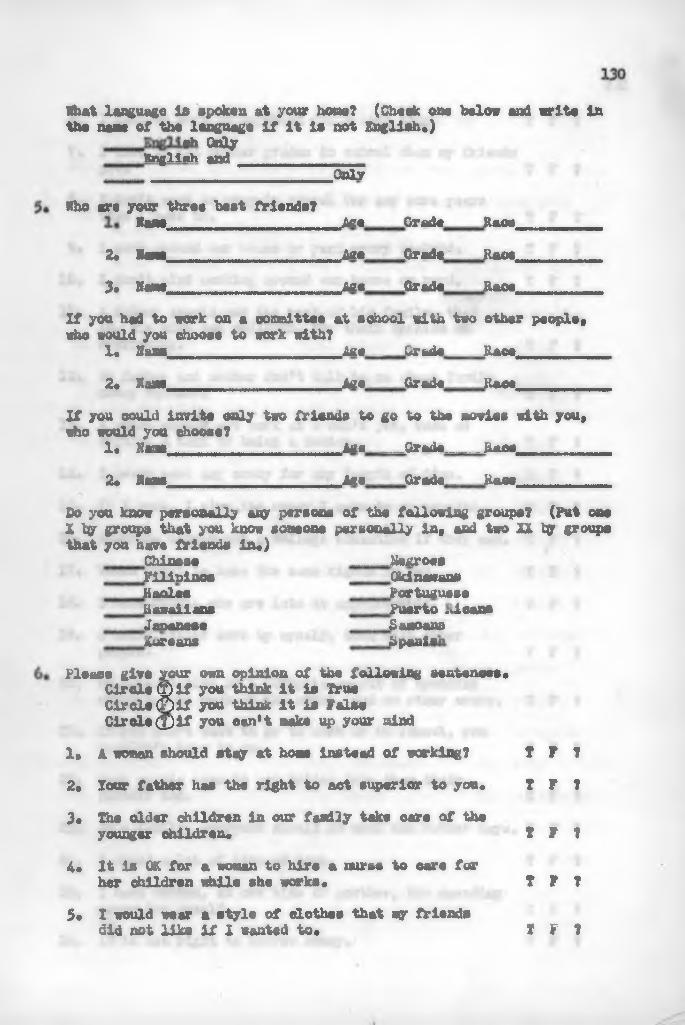
What language is spoken at your ham? (Check one below and «rite in the nam of the language if it la not English.)
»h Only IBnfliah and mmmmm
....... . OnlyWho are your three best friends?
Mm * .................. Age. Grade... Raoe.... .....2* Maw ............... ..Ace....Grade ... Raoe.3* Maw ...............-....Ac«.... Grade .. .Race
If you had to work on a committee at school with two other people, who would you choose to work with?
1* Maw ....... Ase.. Grade....Raoe......2* M a w . Aae Grade... Jtsoe.
If you could invite only two friends to go to the aovies with you, who would you choose?
1. law .................. Aaa Orade,,......Eaoe........2* Maw ................ . tee ..Grade Raoe ........ .
Do you know personally any persona of the following groups? (Put oneX by groups that you know a one one personally in, and two XX by groupsthat you have friends in«)
Chinese .....NegroesFilipinos OkinawansHaolwa PortugueseHawaiian» ....Puerto .-loansJapanese ..... SaaoansxCuraans hpaAfl>n
Please give your own opinion of the following sentences •Circle ff)if you think it is TrueCircle (?)if you think it is FalsaCircleQpif you can’t sake up your sdnd
1« A wowan should stay at how instead of working? T P ?2« lour father has the right to act superior to you. I F ?3« The older children in our faadly take care of the
younger children« T F ?4« It is OK for a woman to hirs a nurse to cere for
her children while she works. T F ?5« I would wear a style of clothee that qy friends
did not like if 2 wanted to« S F ?

131
6« 1 hate to work at anything for a long time* I F7. I like to get better grades in school than ay friends
get, 7 F3« I don't want to stay in school for any core years
than I have to, 7 F9, 1 work around our house or yard every weekend, T F10, I don't mind working around our house or yard, J ¥
U , A father should ask the rest of hie family, thatis, his wife and children, for their opinion on everything. 7 F
12, i$r father and mother don't talk to m about familymoney matters • 7 F
13« A woman should not work at a man's job, such asdriving a taxi or being a doctor, 7 F
14, 1 never save any money for any length of time. T ¥15, If 1 work, I give the money I earn to isy parents, T F16, Everyone should get a college education if they can* T ¥17, Women ought to have the same rights as ¡sen. 7 F13, I hate people who are late to appointments. f F19. I would rather work by myself, than with other
people, 7 F20, parents give m a definite amount of spending
money by the week or the month, and no other money. 7 F21. If you don't want to go to work or to school, you
shouldn't have to go* 7 F22, «lost people seem to get better jobs than their
parents had, 7 F23, In a family, everyone should do what the father says. 7 F24. I spend a lot of time at home. 7 F25. I have worked, at one time or another, for spending
money for myself, 7 F26, It is not right to borrow money, T F
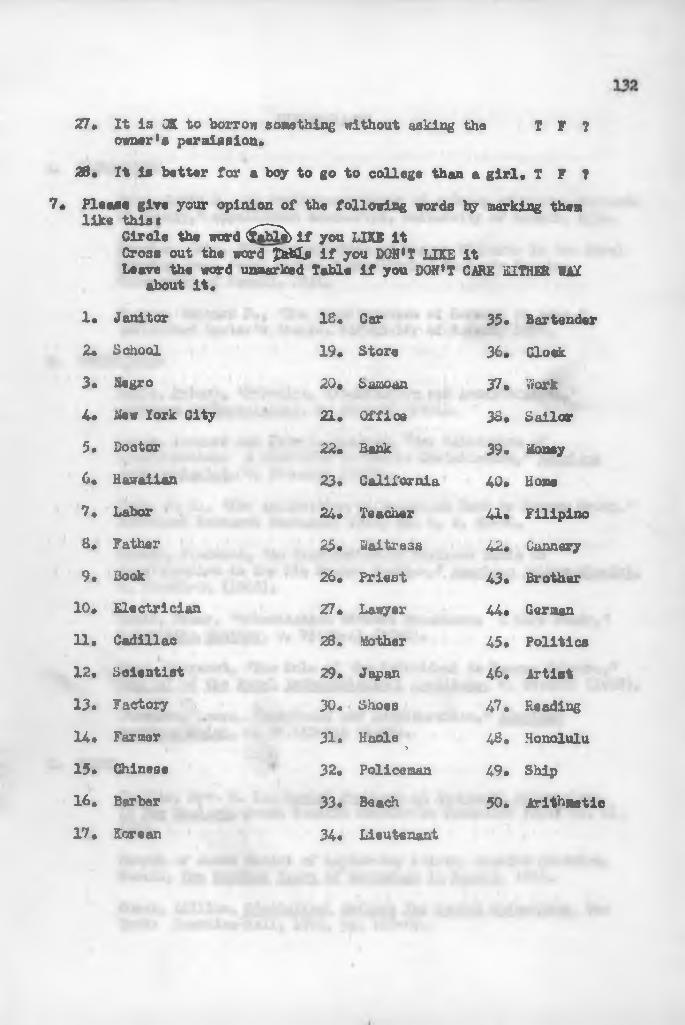
28. It is better for & boy to go to college than a girl* I F ?7# Pleas« give your opinion of the following words by marking them
like this i ^ ^Circle the word (fable) if you LIKE it Cross out the word JkKLe if you DON'T LIKE it Leave the word unmarked Table
27* It is OK to borrow semething without asking the I F ?owner*« per mission.
about it*1* Janitor 18.Zm School 19.3. Negro 20.4. New fork City z u
5. Doctor 22#6. Hawaiian 23.7. Labor 24*8. Father 25«9. Book 26.10. Electrician 27.11. Cadillac 28.12. Scientist 29.13. Factory 30.14. Farmer 31.15. Chinese 32.16. Barber 33.17. Korean 34.
i f you DON'T CARE EITHHl WAX
Car 35. BartenderStore 36. ClockSamoan 37. WorkOffice 38. SailorBank 39. MoneyCalifornia 40. HomeTeacher a . FilipinoSaltrees 42. CanneryPriest 43. BrotherLawyer 44. GermanMother 45. PoliticsJapan 46» ArtistShoes 47. ReadingHaole > 48. HonoluluPoliceman 49. ShipBeach 50. ArithmeticLieutenant

133
BIBUOGRAFHI
A. MANUS CIìIPTS
Eyda, David £., "A Preliminary Study of A Croup of Samoan Migrants in Hawaii,* unpublished manuscript. University of Hawaii, 1954.Forster, John, *fhe Assimilation of Samoan Migrants in the Naval Housing Area, Pearl Harbor,* unpublished Master's thesis, University of Hawaii, 1954«Pierce, Bernard P . , "The Acculturation of Samoans in Laic,* unfinished Master's thesis, University of Hawaii, 1956«
Beals, Robert, "Urbanism, Urbanisation and Acculturation," Afi&ffPPOWPt, 53(1-10 (1951).
Broom, Leonard and John 1« Kitausa, "The Validation of Acculturation« A Condition to Ethnic Assimilation," American
▼. 57(44-48 (1955).Cook, P. H., "The Application of Rorschach Test to Samoan Group," Rorschach Research Exchange, 1940, pp. 6, 2, 51-60«Hawley, Florenoe, "An Examination of Problems Basie to Acculturation in the Rio Grande Pueblos," American Anthropologist, v. 50(612-24 (1948).Lewis, Oscar, "Urbanisation Without Breakdown! A Case Study," I
M i t e , ▼. 75(31-41 (1952).Mead, Margaret, "The Role of the Individual in Samoan Culture," ¿SBTJrt Si &2Z& Anthropological Institute, v. 58(481f (1928),Thompson, Laura, "Attitudes and Acculturation," American
50(112-116 (1948).
Ghallis, Rev. R. L., Social Problems o£ Ron-Maori Polynesia»»Id Iks Zealand. South Pacific Commission Technical Paper No. 41, 1953.Church of Jesus Christ of Latter-Day Saints, Mission District, Hawaii, (¿M. Hundred Years o£ Itormonism ¿a Hawaii. 1954.
B. PERIODICALS
C. BOOBS
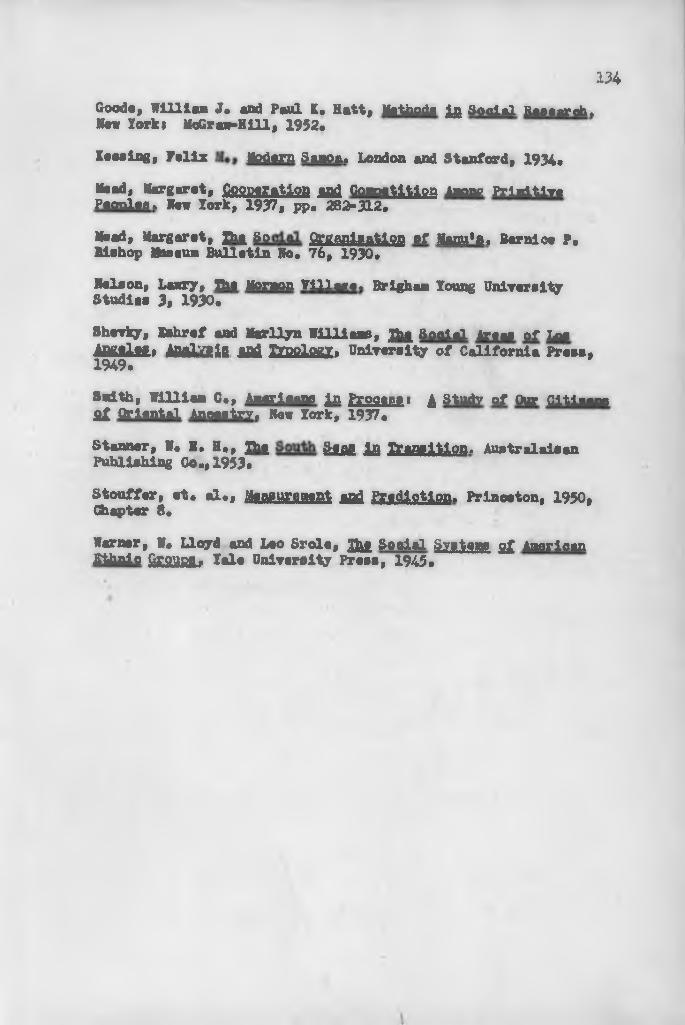
134
Keesing, Felix Modern Samoa. London and Stanford, 1934*Mead, Margaret, fifffiMEfltfrofl BB& Competition Among Primitive Peoples. Hew York, 1937, pp. 282-312*Mead, Margaret, Jh& S o firganlgation of Manu»fl. Bernice P. Bishop Museum Bulletin Ho. 76, 1930.
Good«, William J. and Pawl K. Hatt, Methods 4a Social Research.New York* McGraw-Hill, 1952.
Nelson, Lawry, The Mormon Village. Brigham Young University Studies 3» 1930.Shevky, Eahref and Marilyn Williams, Jhg. Soolal Areas of LosÊMalMt M'fPlS MBâ Smdsseit University of California Press, 1949.Smith, William C., Aaerloans in Prooesst 4 Study of Cto Citizens SÎ Oriental Ancestry. Hew York, 1937.Stanner, W. E. H., Jhj SJM ifi Transition. AustralaisanPublishing Co.,1953.Stouffer, et. al., M u Ë W W f t 3S& Prediction. Princeton, 1950, Chapter 8.Warner, W. Lloyd and Lao Srole, 33i£ Social Systems s£ American ethnic Orouoa. Tele University Press, 1945.