Solar Divergence Collimators for Optical Characterisation of Solar Components
Upload
khangminh22Category
view
4download
0
sustainability
Article
A New Sustainable and Novel Hybrid Solar Chimney PowerPlant Design for Power Generation and Seawater Desalination
Emad Abdelsalam 1 , Fares Almomani 2,* , Feras Kafiah 1 , Eyad Almaitta 3, Muhammad Tawalbeh 4 ,Asma Khasawneh 1 , Dareen Habash 1 , Abdullah Omar 2 and Malek Alkasrawi 5
�����������������
Citation: Abdelsalam, E.; Almomani,
F.; Kafiah, F.; Almaitta, E.; Tawalbeh,
M.; Khasawneh, A.; Habash, D.;
Omar, A.; Alkasrawi, M. A New
Sustainable and Novel Hybrid Solar
Chimney Power Plant Design for
Power Generation and Seawater
Desalination. Sustainability 2021, 13,
12100. https://doi.org/10.3390/
su132112100
Academic Editors: Nuria Novas
Castellano and Rosa María García
Salvador
Received: 19 September 2021
Accepted: 23 October 2021
Published: 2 November 2021
Publisher’s Note: MDPI stays neutral
with regard to jurisdictional claims in
published maps and institutional affil-
iations.
Copyright: © 2021 by the authors.
Licensee MDPI, Basel, Switzerland.
This article is an open access article
distributed under the terms and
conditions of the Creative Commons
Attribution (CC BY) license (https://
creativecommons.org/licenses/by/
4.0/).
1 School of Engineering Technology, Al Hussein Technical University, Amman 11831, Jordan;[email protected] (E.A.); [email protected] (F.K.); [email protected] (A.K.);[email protected] (D.H.)
2 Chemical Engineering Department, Qatar University, Doha 2713, Qatar; [email protected] Department of Power and Mechatronics Engineering, Tafila Technical University, Tafila 66110, Jordan;
[email protected] Sustainable and Renewable Energy Engineering Department (SREE), University of Sharjah,
Sharjah P.O. Box 27272, United Arab Emirates; [email protected] UWSP Paper Science & Engineering Department, University of Wisconsin, Stevens Point, WI 54481, USA;
[email protected]* Correspondence: [email protected]
Abstract: This study presents a case study of a novel hybrid solar chimney power plant (HSCPP)design’s performance in the city of Doha, Qatar. The HSCPP construction is similar to the traditionalsolar chimney power plant (SCPP) but with the addition of water sprinklers installed at the top ofthe chimney. This allowed the solar chimney (SC) to operate as a cooling tower (CT) during thenighttime and operate as an SC during the daytime, hence providing a continuous 24-h operation.The results showed that the HSCPP produced ~633 MWh of electrical energy per year, comparedto ~380 MWh of energy produced by the traditional SCPP. The results also showed that the HSCPPwas able to produce 139,000 tons/year of freshwater, compared to 90,000 tons/year produced by thetraditional SCPP. The estimated CO2 emission reduction (~600 tons/year) from the HSCPP is twicethat of the traditional SCPP (~300 tons/year). The results clearly show that the HSCPP outperformedthe traditional SCPP.
Keywords: solar water distillation; solar chimney; cooling tower; hybrid solar chimney
1. Introduction
Increasing demand for energy and water, driven by an exponential increase in theworld population and industrial growth, without proper management will lead to morestress on the available resources and increased air pollution. The extensive use of fossilfuels plays a major role in air pollution and climate change because of the greenhouse gases(GHG) emitted as a result of using these types of fuels [1–3]. Sustainable, renewable, andclean energy has emerged as a favorable choice to reduce GHG and mitigate climate changeimpact [1,4,5]. Some clean energy technologies, such as solar photovoltaic (PV) and wind,do not depend on water. Many other technologies, however, require huge amounts of water,such as biofuels and nuclear power. This is an additional burden on already scarce waterresources. Among all renewable energy technologies, solar PV has increasingly becomesthe first utility choice because of its competitive price, but many challenges still lie ahead,such as the efficiency of the PV panel, intermittent nature, and integration policies [6–9].On the other hand, different solar systems can offer an alternative to solar PV. One of thepromising systems that received more attention in recent years is the solar chimney powerplant (SCPP) due to its low manufacturing cost and modest design [6–9].
The year 1982 witnessed the construction and successful operation of the first SCPPprototype in Spain [10,11]. There are three distinct units in the SCPP basic model: the
Sustainability 2021, 13, 12100. https://doi.org/10.3390/su132112100 https://www.mdpi.com/journal/sustainability

Sustainability 2021, 13, 12100 2 of 24
base-collector, the mechanical rotor, and the chimney. The intercepted solar radiationpasses through the base collector and heats the ambient cool air inside the system. Theheated air then flows to the entrance of the chimney. The accumulated air at the entranceof the tower leads to a density difference between the air inside and outside the chimney.This density difference creates a pressure gradient that forces the warm air through thechimney. As this air flows, it acts as a driving force on the turbine blades, located at thechimney base, converting the mechanical energy into electrical energy.
Since the first introduction of the Spanish model, several developments have beenproposed. Schlaich et al. [12] and Tingzhen et al. [13] investigated the optimization of thedimensional parameters to maximize the electricity output from the SCPP, such as thechimney height, chimney diameter, and collector area. The potential of seawater integrationinto SCPP to improve process economy and improve efficiency has been proposed inseveral studies [14–18]. Low thermal efficiency, high levelized cost of energy, large landrequirement, and the requirement of a tall chimney are the main challenges that hinderthe practical implementation of the SCPP [19–22]. To overcome these challenges, manyrecent publications have focused on innovative design solutions. These solutions includenew design configurations, combined desalination processes with power production, andgreenhouse incorporation for crop production [19,23–27]. Table 1 summarizes the literaturearticles that proposed various modifications of the original SCPP.
Table 1. Literature analysis of certain modifications proposed to boost the efficiency of the SCPP.
Aim of the Study Reference(s)
Introduce a ventilation system using roof solar chimney [27–31]Introduce multi turbo generators and power electronics [29]
Use different absorber materials and collector types [32–36]Improve storing capabilities [37,38]
Integrate SCPP with PV system [26]Insulate the surface of the collector to increase the power
outcome and the process efficiency [32]
Combine the SCPP with a wind capture device toharvest wind energy at an elevated height [39–41]
Many performances and feasibility studies on SCPP across different countries andgeographical areas have been conducted to evaluate its potential applications and eco-nomic viability. Table 2 presents an overview of the numerical and experimental researchcontributions based on locations.
Few studies have investigated the possibility of combining CT and SCPP. The prospectof incorporating a cooling tower (CT) with the SCPP has been explored by Zandian andAshjaee [34] to increase the thermal performance of the power plant. Abdelsalam et al. [35]suggested a novel hybrid SCPP (HSCPP) design that incorporates the traditional SCPPand CT. The new design is based on utilizing the chimney and the bi-directional turbineto extend energy production hours, by operating as a CT at nighttime and as an SCPPduring the daytime. The design was validated using weather data in southern Jordanand showed a promising outcome. It is known that the weather data (solar irradiationintensity, temperature, and humidity) is the key operational performance parameter ofthe SCPP. To provide a solid conclusion of the results reported in our previous work, theHSCPP should be validated in different climate zones. Therefore, the present work aimedto validate the performance of the HSCPP in the Arabian gulf region where the temperatureand humidity are the maximum values reached worldwide. This will be the first studythat has assessed the performance and economics of the HSCPP in the city of Doha, Qatar,and evaluated the effect of high temperatures and excessive humidity on energy andwater production. The study also focused on comparing the performance of the HSCPPin terms of electricity production and freshwater production against a traditional SCPP.Climate benefits related to the reduction in greenhouse gases (GHG) due to the decrease in
Sustainability 2021, 13, 12100 3 of 24
fossil fuel burning for electricity production and the CAPEX and OPEX of the HSCPP arepresented and discussed.
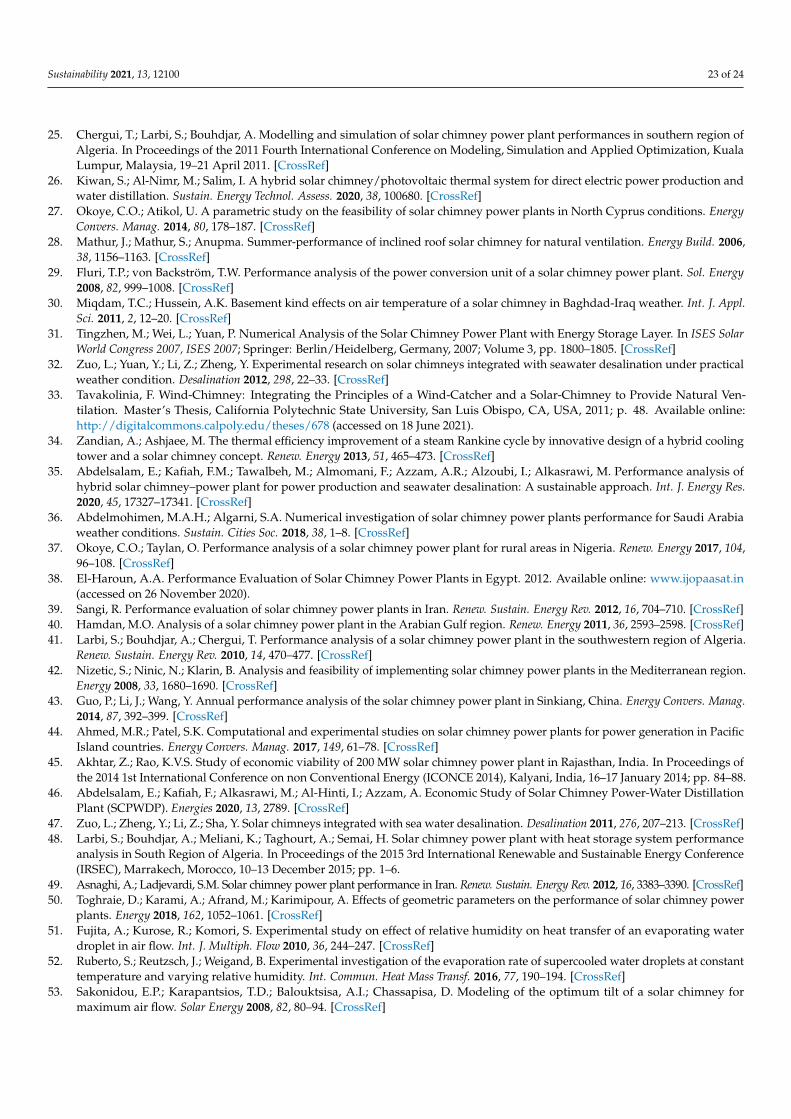
Table 2. Studies performed on the use of SCPP for power generation in different geographic locations.
Location Contribution Year Reference
Saudi Arabia Numerical study on the performance of SCPP. 2018 [36]
NigeriaPerformance analysis of SCPP (power output, levelized
cost of electricity (LCOE), and carbon emissionpredictions) seven regions.
2017 [37]
Egypt Performance assessment of electrical energy via SCPP indifferent locations of Egypt theoretically. 2012 [38]
Iran Performance evaluation, simulation, and optimization ofdifferent SCPP models in different locations across Iran. 2012, 2012, 2017, 2014 [39]
Arabian Gulf regionA simplified thermodynamics model for steady airflow
inside a solar chimney and evaluation of geometricparameters on power generation.
2011 [40]
Algeria Performance and CFD analysis of different SCPP modelsacross regions in Algeria. 2010, 2015, 2017 [41]
Mediterranean region Analysis and feasibility of implementing solar chimney. 2008 [42]Cyprus A parametric study on the feasibility of solar chimney. 2014 [27]
ChinaAnnual performance analysis of the solar chimney powerplant in Sinkiang. Performance analysis of conventional
and sloped solar chimney power plants in China.2014, 2013 [43]
Pacific Island Countries Computational and experimental studies on powergeneration from SCPP in Pacific Island countries. 2017 [44]
India Study of economic viability of 200 MW SCPP. 2014 [45]
2. Materials and Methods2.1. HSCPP Description
The design feature of the HSCPP is made up of three modules: a collector, a turbine,and a solar chimney, as presented in Figure 1. In several recent designs [42], the collectorcontains a seawater basin to saturate the air with water vapor, leading to water desalinationwhen the air leaves the turbine. The structural cross-sectional views of the HSCPP areshown in Figure 1. The design of the HSCPP includes a CT modular function integratedinto the SCPP with respect to heat flow but share the energy production via its customizedturbines. The CT is integrated with the chimney in a hybrid configuration, offsetting theneed for a base structural foundation, as shown in Figure 1b [46]. However, the operationalmodes of SCPP and CT are separated by synergetic interaction. Moreover, the SCPP ishighly dependent on solar radiation, like the PV systems, while the CT is independent ofsolar radiation and operates at any time. The novel design of the HSCPP offers a uniqueopportunity to operate over 24 continuous hours for electrical power production and waterproduction. It is worth mentioning that the SCPP and CT operate on the same principleas the air density difference (outside and inside the system boundary). This is the maindriving force for power generation. The technical difference between the SCPP and the CTis the heat flow direction of the air entering and leaving the turbines. In the SCPP, the air isheated due to solar radiation increasing its kinetic velocity, whereas the air density (higherhumidity) inside the CT is the reason for increasing the air velocity. In the SCPP, the airmoves up the chimney and heat flows out to the surrounding area. Meanwhile, the air inthe CT moves downward, and the heat flows from the air to the surroundings. According tothe ideal gas law, when the air heats up inside the collector, it creates a pressure differencebetween the bottom and the top of the SCPP. This eventually creates a momentum forcethat increases the air velocity upward. The upward movement of the air collides withthe turbines in a way that is analogous to the wind turbines, leading to electrical powerproduction, as shown in Figure 1a. Similarly, this applies to the CT, but the entering air iscooled down, due to evaporative cooling. To accelerate the cooling effect, the air insidethe CT chimney is humidified via a nozzle placed at the top, close to the air entrance. The

Sustainability 2021, 13, 12100 4 of 24
sprayed water via the nozzle creates very tiny water droplets that easily evaporate, dueto latent flow from the air. Consequently, the air is cooled and becomes denser. When thewater nozzle operates, it increases the air density inside, leading to an increase in pressure,according to the ideal gas law. As a result, the velocity of cold air is increased downwardsand collides with the turbine, thereby producing electricity. Interestingly, the futuristicdesign of the HSCPP is the use of a bi-directional turbine that changes spinning direction(clockwise or counterclockwise), depending on the operational mode of the system as aCT or SCPP. The hybrid design enables the HSCPP to work throughout the day and shiftsto the idle mode at night when it is scheduled to work as CT. The novel design lies inits function as a versatile energy system that can operate at any time, depending on theweather condition and the intensity of solar radiation. The most prominent advantage ofthe design is that it can operate continuously, which increases the utilization efficiency,leading to a decrease in the LCOE.
Sustainability 2021, 13, x FOR PEER REVIEW 4 of 25
air in the CT moves downward, and the heat flows from the air to the surroundings. Ac-
cording to the ideal gas law, when the air heats up inside the collector, it creates a pressure
difference between the bottom and the top of the SCPP. This eventually creates a momen-
tum force that increases the air velocity upward. The upward movement of the air collides
with the turbines in a way that is analogous to the wind turbines, leading to electrical
power production, as shown in Figure 1a. Similarly, this applies to the CT, but the entering
air is cooled down, due to evaporative cooling. To accelerate the cooling effect, the air
inside the CT chimney is humidified via a nozzle placed at the top, close to the air en-
trance. The sprayed water via the nozzle creates very tiny water droplets that easily evap-
orate, due to latent flow from the air. Consequently, the air is cooled and becomes denser.
When the water nozzle operates, it increases the air density inside, leading to an increase
in pressure, according to the ideal gas law. As a result, the velocity of cold air is increased
downwards and collides with the turbine, thereby producing electricity. Interestingly, the
futuristic design of the HSCPP is the use of a bi-directional turbine that changes spinning
direction (clockwise or counterclockwise), depending on the operational mode of the sys-
tem as a CT or SCPP. The hybrid design enables the HSCPP to work throughout the day
and shifts to the idle mode at night when it is scheduled to work as CT. The novel design
lies in its function as a versatile energy system that can operate at any time, depending on
the weather condition and the intensity of solar radiation. The most prominent advantage
of the design is that it can operate continuously, which increases the utilization efficiency,
leading to a decrease in the LCOE.
(a)
Sustainability 2021, 13, x FOR PEER REVIEW 5 of 25
Figure 1. HSCPP system (a) operated as a solar chimney, and (b) operated as a cooling tower.
2.2. Mathematical Model
The novel design was developed mathematically after establishing the mass and en-
ergy balance of the HSCPP. The mass and energy balance equations are detailed to de-
scribe the system performance from 1 through 11, as shown in Figure 2. The detailed en-
ergy balance can be found in the Supplementary Materials. The equations included all the
physical properties for both air and water, solved numerically using MATLAB software.
The MATLAB program that executed the codes was developed, verified, and tested using
the genetic algorithm function built in MATLAB to find the numerical solution for the
system operational parameters. The program runs the codes based on initial guessing and
continuous iteration until the results do not alter beyond the 1 × 10⁻⁶. The program code
retrieves the weather data, including solar radiation wind velocity, temperature, and rel-
ative humidity (RH), from an excel file, and it takes about three hours to handle 1000 data
entries. Since we aimed to calculate the power and water production on an annual basis,
the program ran for about 26 h to handle a large amount of data (8760 data points). The
program used the physical the data of HSCPP, presented in Tables 3 and 4, as a constant
input for the numerical analysis.
Table 3. Design parameters of the HSCPP.
Parameter Dimension (m)
Collector Diameter 250
Collector Entrance Height 6
Chimney Height 200
Chimney Diameter 10
Depth of Seawater Pool 0.03
Table 4. Material of construction of the HSCPP and their properties HSCPP.
Material Transmissivity Emissivity Absorptivity
Glass 0.90 0.90 0.05
Water 0.90 0.95 0.05
Base 0.95 0.95 0.95
(b)
Figure 1. HSCPP system (a) operated as a solar chimney, and (b) operated as a cooling tower.

Sustainability 2021, 13, 12100 5 of 24
2.2. Mathematical Model
The novel design was developed mathematically after establishing the mass andenergy balance of the HSCPP. The mass and energy balance equations are detailed todescribe the system performance from 1 through 11, as shown in Figure 2. The detailedenergy balance can be found in the Supplementary Materials. The equations included allthe physical properties for both air and water, solved numerically using MATLAB software.The MATLAB program that executed the codes was developed, verified, and tested usingthe genetic algorithm function built in MATLAB to find the numerical solution for thesystem operational parameters. The program runs the codes based on initial guessingand continuous iteration until the results do not alter beyond the 1 × 10⁻⁶. The programcode retrieves the weather data, including solar radiation wind velocity, temperature,and relative humidity (RH), from an excel file, and it takes about three hours to handle1000 data entries. Since we aimed to calculate the power and water production on anannual basis, the program ran for about 26 h to handle a large amount of data (8760 datapoints). The program used the physical the data of HSCPP, presented in Tables 3 and 4, asa constant input for the numerical analysis.
Table 3. Design parameters of the HSCPP.
Parameter Dimension (m)
Collector Diameter 250Collector Entrance Height 6
Chimney Height 200Chimney Diameter 10
Depth of Seawater Pool 0.03
Table 4. Material of construction of the HSCPP and their properties HSCPP.
Material Transmissivity Emissivity Absorptivity
Glass 0.90 0.90 0.05Water 0.90 0.95 0.05Base 0.95 0.95 0.95
The next section shows the main energy balance equations. The detailed equationscan be found in the Supplementary Materials.
2.2.1. Sector 1: Solar Air Heating
The energy per unit area of the chimney was determined by performing energy balanceon the airflow, absorber, and collector as per Equation (1):
qc,gls−air
(kwm2
)+ qc,abs−air
(kwm2
)= −
cp,air
(kJ
kg.K
)mair
(kgs
)2πr(m)
dTair(K)
dr(m)(1)
Since the relative humidity is conserved (i.e., ω1 = ω2), Equations (2) and (3) can beused to determine the energy in different sections of the structure:
qr,abs−gls
(kwm2
)+ qc,abs−air
(kwm2
)+ qkabs
(kwm2
)= αabsτgls I
(kwm2
)(2)
qc,gls−out
(kwm2
)+ qc,gls−air
(kwm2
)+ qr,gls−spc
(kwm2
)= αgls I
(kwm2
)+ qr,abs−gls
(kwm2
)(3)

Sustainability 2021, 13, 12100 6 of 24Sustainability 2021, 13, x FOR PEER REVIEW 6 of 25
Figure 2. Energy balance across different sections of the HSCPP: (a) sector 1, sector 2, and sector 3; (b) Cooling Tower.
The next section shows the main energy balance equations. The detailed equations
can be found in the Supplementary Materials.
(a)
(b)
Figure 2. Energy balance across different sections of the HSCPP: (a) sector 1, sector 2, and sector 3; (b) Cooling Tower.

Sustainability 2021, 13, 12100 7 of 24
2.2.2. Sector 2: Water Evaporation
The energy balance for the airflow, absorber, and collector per unit area of the seawaterpool was applied using Equations (4)–(6):
qc,gls−air
(kwm2
)+ qc,wtr−air
(kwm2
)= −
cp,air
(kJ
kg.K
)mair
(kgs
)2πr(m)
dTair(K)dr(m)
(4)
qc,abs−wtr
(kwm2
)+ qkabs
(kwm2
)= αglsτwtrτgls I
(kwm2
)(5)
qr,gls−spc
(kwm2
)+ qc,gls−out
(kwm2
)= qc,gls−air
(kwm2
)+ qr,wtr−gls
(kwm2
)+ αgls I
(kwm2
)(6)
Similarly, the energy balance of water per unit area of the chimney was calculatedfollowing Equation (7):
qewtr(kwm2 ) + qr,wtr−air(
kwm2 ) + qc,wtr−air(
kwm2 ) +
cp,wtr(kJ
kg.K ) mwtr(kgs )
2πr(m)dTwtr(k)
dr(m)
= qc,abs−wtr(kwm2 ) + αwtrτgls I( kw
m2 )(7)
The velocity of the air entering the chimney was calculated using the Bernoulli equa-tion within the chimney following Equation (8) [47]:
Vch
(ms
)=
√2g(m
s2
)Hch(m)
Tch,ent − Tout
Tout(8)
The output power of the turbine was determined using Equation (9) [48]:
Pelc(w) =12
ρen,ch
(kgm3
)C f Ach
(m2)
V3ch
(m3
s3
)(9)
where, C f is the turbine efficiency, 0.42.
2.2.3. Sector 3: Chimney
During the daytime, the HSCPP operates as an SCPP; hence, the energy balanceequations are:
Pelc(kw) + Qout(kw) = mair
(kgs
)[( v2ch,ent
2
(m2
s2
)+ gzch,ent
(m2
s2
)+ ich,ent
(m2
s2
))−(
v2ch,out
2 + gzch,out + ich,out
)](10)
The utilization factor for electricity production was calculated as follows:
η =Pelc
14 π
(D2
col − D2ch)
I(11)
2.3. Model Validation
The established HSCCP model was validated against the outcomes reported by Zuoet al. [47]. The temperature profile (from the entrance of the collector to the beginning ofthe chimney) of the developed HSCPP was in excellent agreement with the values reportedby Zuo et al. [47]. The temperature profiles values were compared using one-way analysisof variance (ANOVA) at a significance level of 5%, where the determination coefficient (R2),

Sustainability 2021, 13, 12100 8 of 24
Equation (12), the root mean square (RMS) Equation (13), and difference residuals wereused to judge the difference between the data sets:
R2 = 1 −∑m
i=1 (Tcal − Tre f )2
∑mi=11 (Tlit − Tre f )
2 (12)
RMS =
√∑ Tcal − Tre f
N ∑ T2cal
(13)
where Tcal is the calculated temperature and Tre f is the referenced values from Zuo et al. [47].The R2 and RMS of the results were found to be 0.66% and 0.98%, respectively, confirmingthat the developed model can predict the temperature profile of both HSCPP and SCCP.The low range of residuals between the calculated and referenced temperature profilespecifies that there is very small variation between both values and confirms the ability ofthe used model to represent the SCCP without any significant systematic errors. Figure3 indicates that the air temperature rises as a function of the radial distance, where themaximum temperature was located at the lower end of the chimney. This significant ∆Trepresents the main design parameter that develops the air mass flow within the systemand contributes to energy production, as will be discussed later.
Sustainability 2021, 13, x FOR PEER REVIEW 9 of 25
Figure 3. Mathematical model of the HSCPP validation against the temperature profile obtained by
Zuo et al. [47].
2.4. Cost Analysis
The cost analysis of the SCPP includes fixed capital costs, operating costs, and reve-
nues. The fixed capital cost calculation was based on the historical method adjusted to the
production capacity (i.e., online published information related to the process construction
cost at similar capacities). The detailed procedure for the cost analysis can be found in our
previous work [35]. The operating cost, which includes maintenance, labor, insurance, li-
cense, and taxes, was estimated as a function of the fixed capital investment. It was as-
sumed that in the first period of the plant (up to year 9), it is around 4% of the yearly
capital, it increases to 5% from year 10 to 17, and then increases again to 6.5 after 17 years.
The revenue was judged based on the payback time, return on investment (ROI), which
represents the percentage ratio of annual profit to the capital investment, and discounted
cash flow rate of return (DCFRR).
3. Results and Discussion
Figure 4 presents an example of a weather data profile (solar irradiance, ambient
temperature, wind speed, and RH) obtained from Doha, Qatar (25.2854° N, 51.5310° E) in
different seasons. The general trends show that solar irradiance is at its lowest when the
sunlight is weak (i.e., during the early period of the day and at night). The daily solar
irradiance was estimated to be in the range of 287 to 857 W/m2, with a maximum value of
849 ± 8 W/m2 achieved in the period from 9:00 am to 12:00 midday. The average daily solar
irradiation was estimated to be 334.1 W/m2. The temperature profile in Doha shows a
slight fluctuation between day and night. Figure 4 show that the temperature ranged from
16.0 to 27.0 °C, 12.0 to 41.5 °C, 12.0 to 47.5 °C, and 30.0 to 36.0 °C, in January, May, August,
and October with average values of 20.8, 23.9, 29.2, and 29.9 °C, respectively. A tempera-
ture peak of 42.3 °C was usually observed at noon. The RH is observably inversely pro-
portional to the temperature. A maximum of 67% was reported at night and a daily aver-
age value of 50%, dropping to 20% during the hottest and driest period of the day. The
wind speed was recorded to be in the range of 1.5–6.7 m/s with an average value of 3.7
m/s, although this change will be shown in the following sections to have a minimum
impact on the performance of the SCCP, as opposed to the other factors. By using solar
Figure 3. Mathematical model of the HSCPP validation against the temperature profile obtained byZuo et al. [47].
2.4. Cost Analysis
The cost analysis of the SCPP includes fixed capital costs, operating costs, and rev-enues. The fixed capital cost calculation was based on the historical method adjusted to theproduction capacity (i.e., online published information related to the process constructioncost at similar capacities). The detailed procedure for the cost analysis can be found inour previous work [35]. The operating cost, which includes maintenance, labor, insurance,license, and taxes, was estimated as a function of the fixed capital investment. It wasassumed that in the first period of the plant (up to year 9), it is around 4% of the yearlycapital, it increases to 5% from year 10 to 17, and then increases again to 6.5 after 17 years.The revenue was judged based on the payback time, return on investment (ROI), which

Sustainability 2021, 13, 12100 9 of 24
represents the percentage ratio of annual profit to the capital investment, and discountedcash flow rate of return (DCFRR).
3. Results and Discussion
Figure 4 presents an example of a weather data profile (solar irradiance, ambienttemperature, wind speed, and RH) obtained from Doha, Qatar (25.2854◦ N, 51.5310◦ E)in different seasons. The general trends show that solar irradiance is at its lowest whenthe sunlight is weak (i.e., during the early period of the day and at night). The daily solarirradiance was estimated to be in the range of 287 to 857 W/m2, with a maximum value of849 ± 8 W/m2 achieved in the period from 9:00 am to 12:00 midday. The average dailysolar irradiation was estimated to be 334.1 W/m2. The temperature profile in Doha showsa slight fluctuation between day and night. Figure 4 show that the temperature rangedfrom 16.0 to 27.0 ◦C, 12.0 to 41.5 ◦C, 12.0 to 47.5 ◦C, and 30.0 to 36.0 ◦C, in January, May,August, and October with average values of 20.8, 23.9, 29.2, and 29.9 ◦C, respectively. Atemperature peak of 42.3 ◦C was usually observed at noon. The RH is observably inverselyproportional to the temperature. A maximum of 67% was reported at night and a dailyaverage value of 50%, dropping to 20% during the hottest and driest period of the day. Thewind speed was recorded to be in the range of 1.5–6.7 m/s with an average value of 3.7m/s, although this change will be shown in the following sections to have a minimumimpact on the performance of the SCCP, as opposed to the other factors. By using solarirradiation during the day and acting as a CT during the night, the proposed design wouldtake advantage of the weather data profile and thereby contribute to 24-h energy output.
Figure 5a summarizes the monthly minimum, maximum, and average solar irradiancerecords across the year. The solar irradiations are at the maximum level in the summermonths (June to September) with a maximum observed in June (7800 W/m2), and it dropsto lower values starting from October, reaching the minimum value at the end of the year(see Figure 4a–d). It is worth noting that there is a big difference between the minimumand maximum irradiation profiles. While the maximum irradiation profile values fluctuaterelatively insignificantly and take a uniform parabolic shape, the minimum value seems towildly differ from month to month. It is believed that the uniform maximum irradiationprofile is due to insignificant differences between the hottest and coldest months. Themaximum solar irradiation is usually reported in the time period 10:00 am to 1:00 pm allyear round. At this time, Doha, the studied area, is characterized by a clear sky and sunnytime. Therefore, the reported maximum solar irradiation is almost uniform, i.e., the shiftin monthly solar energy received is caused by a slight change in the maximum reportedirradiation values. Meanwhile, the minimum solar irradiation values seem to wildly differfrom month to month, with a staggering near the low value of 150 W/m2 during Marchand December, and a surprise increase in the maximum value in June. This would suggestanother important piece of information for solar power-based technology: the difference insolar radiation between the cool day periods and hot ones during extremely hot summermonths is marginal compared to that during the beginning and end of the year, highlightingthe extra advantage gained from operating the plant all year round rather than only duringthe summer (i.e., there is an advantage brought by operating the plant during both hotand cold months). This intense solar irradiation represents promising renewable energy togenerate electricity and water using the proposed HSCPP. The reported solar irradianceresults are promising when compared to other existing established SCPP, such as that ofHamdan [40], who calculated that a solar chimney could produce up to 50 MW with solarirradiation of 263 W/m2, though the physical specifications of the SCCP (collector radius~1000 m, chimney radius ~50 m, and chimney height ~1000 m) are different from the oneproposed in the present study. Additionally, Larbi et al. [48] investigated and proved thefeasibility of the SCPP that was operated with an average daily and working hour solarirradiance of 229 and 611 W/m2, producing 140–200 kW, which was sufficient for the needsof remote villages in southwestern Algeria.

Sustainability 2021, 13, 12100 10 of 24
Sustainability 2021, 13, x FOR PEER REVIEW 10 of 25
irradiation during the day and acting as a CT during the night, the proposed design would
take advantage of the weather data profile and thereby contribute to 24-h energy output.
0 1 2 3 4 5 6 7 8 9 10 11 12 13 14 15 16 17 18 19 20 21 22 23
0
20
40
60
80
100
0
200
400
600
800
1000
Time
Am
bie
nt
Te
mp
era
ture
(°C
),
Win
d S
pe
ed
(m
/s)
an
d
Re
lati
ve
Hu
mid
ity
(%
)
Ho
rizo
nta
l So
lar Irra
dia
tion
(W/m
2)
January 6
0 1 2 3 4 5 6 7 8 9 10 11 12 13 14 15 16 17 18 19 20 21 22 23
0
20
40
60
80
100
0
200
400
600
800
1000
Time
Am
bie
nt
Te
mp
era
ture
(°C
),
Win
d S
pe
ed
(m
/s)
an
d
Re
lati
ve
Hu
mid
ity
(%
)
Ho
rizo
nta
l So
lar Irra
dia
tion
(W/m
2)
May 15
0 1 2 3 4 5 6 7 8 9 10 11 12 13 14 15 16 17 18 19 20 21 22 23
0
20
40
60
80
100
0
200
400
600
800
1000
Time
Am
bie
nt
Te
mp
era
ture
(°C
),
Win
d S
pe
ed
(m
/s)
an
d
Re
lati
ve
Hu
mid
ity
(%
)
Ho
rizo
nta
l So
lar Irra
dia
tion
(W/m
2)
August 30
0 1 2 3 4 5 6 7 8 9 10 11 12 13 14 15 16 17 18 19 20 21 22 23
0
20
40
60
80
100
0
200
400
600
800
1000
Time
Am
bie
nt
Te
mp
era
ture
(°C
),
Win
d S
pe
ed
(m
/s)
an
d
Re
lati
ve
Hu
mid
ity
(%
)
Ho
rizo
nta
l So
lar Irra
dia
tion
(W/m
2)
October 20
Solar Irradiation
Ambient Temperature
Wind Speed
Relative Humidity
(a)
(b)
(c)
(d)
Figure 4. Daily weather data at Doha, Qatar (a) 6 January, (b) 15 May, (c) 30 August, and (d) 20
October.
Figure 4. Daily weather data at Doha, Qatar (a) 6 January, (b) 15 May, (c) 30 August, and(d) 20 October.
3.1. SCPP Performance
Figure 5b shows the monthly minimum, maximum, and average power generationfor the HSCPP. It can be seen that it follows the same trend as solar radiation, and thisis because solar irradiation is the main key operational parameter used to develop thetemperature gradient (∆T) within the HSCPP, which is considered the main reason for

Sustainability 2021, 13, 12100 11 of 24
the airflow and consequently the energy production. As the solar irradiation intensityincreases, the absorbed energy by the HSCCP increases, leading to the development of high∆T between the inlet and outlet of the system. This ∆T will create a pressure differencebetween hot and cold air and thus increase the airflow in the structure and produceenergy by operating the turbine. Therefore, the direct proportional relation between thesolar irradiation and power generation trends makes sense. The average monthly energyproduction from the HSCPP ranged from 900–1150 kWh, with the maximum reported inthe range of 1150–1300 kWh, with the hotter mid-year months (May to June) being morepromising in terms of energy production. Since the power produced from the HSCPPfollows the same trend as the received solar radiation from the sun across the year, thetwo implications discussed earlier regarding irradiance variation and comparison betweenthe minimum and maximum values also apply here as well. The observed trend can alsobe used to correlate the expected energy production in different regions, with the climateconditions in general and solar irradiation specifically. The variation in the maximumenergy output across the year is relatively small, compared to the spikes in minimumvalues, and the difference between the minimum and maximum energy output during thehottest months is relatively small.
Table 5 provides a summary of the power generation from SCPP in different countries,different SCPP design parameters, and different climate conditions. It can be seen thatthe annual power generation from the HSCPP in Qatar is higher than the values reportedin the literature for different countries, except for the study reported by Guo et al. [43],Akhtar and Rao [45], and Okoye et al. [27] due to the big difference in the collector diameterproposed in these studies, which is difficult and expensive to construct. In addition, thecumulative annual electricity production reported in the present study is 2.5 to 3 timeshigher than the classical SCPP (377 MWh) as reported by Zuo et al. [47], and 1.9–2.3 ordersof magnitude higher than hybrid solar chimney power plant (528 MWh) reported byAbdelsalam et al. [35]. Besides, the power generation reported in this study is significantlyhigher than the values reported in the literature under similar climate conditions. Tingzhemet al. [13] produced no more than 35 kW for SCPP operated under a solar radiation intensityof 800 W/m2. Larbi et al. [41] produced electricity in the range of 140 and 200 kW with thesolar irradiation and ambient temperature in the range of 400 to 600 W/m2 and 20 to 38 ◦C,respectively. Abdelmohimen et al. [36] reported a numerical performance for an SCPP inthe range of 55–63 kW for solar irradiation in the range 715–765 W/m2.
Sustainability 2021, 13, x FOR PEER REVIEW 11 of 25
Figure 5a summarizes the monthly minimum, maximum, and average solar irradi-
ance records across the year. The solar irradiations are at the maximum level in the sum-
mer months (June to September) with a maximum observed in June (7800 W/m2), and it
drops to lower values starting from October, reaching the minimum value at the end of
the year (see Figure 4a–d). It is worth noting that there is a big difference between the
minimum and maximum irradiation profiles. While the maximum irradiation profile val-
ues fluctuate relatively insignificantly and take a uniform parabolic shape, the minimum
value seems to wildly differ from month to month. It is believed that the uniform maxi-
mum irradiation profile is due to insignificant differences between the hottest and coldest
months. The maximum solar irradiation is usually reported in the time period 10:00 am
to 1:00 pm all year round. At this time, Doha, the studied area, is characterized by a clear
sky and sunny time. Therefore, the reported maximum solar irradiation is almost uniform,
i.e., the shift in monthly solar energy received is caused by a slight change in the maximum
reported irradiation values. Meanwhile, the minimum solar irradiation values seem to
wildly differ from month to month, with a staggering near the low value of 150 W/m2
during March and December, and a surprise increase in the maximum value in June. This
would suggest another important piece of information for solar power-based technology:
the difference in solar radiation between the cool day periods and hot ones during ex-
tremely hot summer months is marginal compared to that during the beginning and end
of the year, highlighting the extra advantage gained from operating the plant all year
round rather than only during the summer (i.e., there is an advantage brought by operat-
ing the plant during both hot and cold months). This intense solar irradiation represents
promising renewable energy to generate electricity and water using the proposed HSCPP.
The reported solar irradiance results are promising when compared to other existing es-
tablished SCPP, such as that of Hamdan [40], who calculated that a solar chimney could
produce up to 50 MW with solar irradiation of 263 W/m2, though the physical specifica-
tions of the SCCP (collector radius ~1000 m, chimney radius ~50 m, and chimney height
~1000 m) are different from the one proposed in the present study. Additionally, Larbi et
al. [48] investigated and proved the feasibility of the SCPP that was operated with an av-
erage daily and working hour solar irradiance of 229 and 611 W/m2, producing 140–200
kW, which was sufficient for the needs of remote villages in southwestern Algeria.
(a)
Figure 5. Cont.

Sustainability 2021, 13, 12100 12 of 24Sustainability 2021, 13, x FOR PEER REVIEW 12 of 25
Figure 5. (a) Monthly minimum, maximum, and average solar irradiance record across the year at Doha, Qatar; (b)
monthly minimum, maximum, and average power generation for the HSCPP; and (c) the variation of air temperature as
a function of the radius of the water pool radius in the HSCPP.
3.1. SCPP Performance
Figure 5b shows the monthly minimum, maximum, and average power generation
for the HSCPP. It can be seen that it follows the same trend as solar radiation, and this is
because solar irradiation is the main key operational parameter used to develop the tem-
perature gradient (∆T) within the HSCPP, which is considered the main reason for the
airflow and consequently the energy production. As the solar irradiation intensity in-
creases, the absorbed energy by the HSCCP increases, leading to the development of high
(b)
(c)
Figure 5. (a) Monthly minimum, maximum, and average solar irradiance record across the year atDoha, Qatar; (b) monthly minimum, maximum, and average power generation for the HSCPP; and(c) the variation of air temperature as a function of the radius of the water pool radius in the HSCPP.

Sustainability 2021, 13, 12100 13 of 24
Table 5. Summary of the power generation from SCPP in different countries, different SCPP designparameters, and different climate conditions.
Location Annual EnergyProduction (kWh)
Daily SolarIrradiance Range
(W/m2)Design Parameters Reference
Saudi Arabia 660−765 715−765 H: 195 m, h: 2 mD: 244 m, d: 10 m [36]
Nigeria 602−738 840–860 H: 150 m, h: 2.5 mD: 600 m, d: 10 m [37]
Egypt 1.6−1.7 × 10⁵ 500−950 H: 500 m, D: 3000 m, d: 50 m [38]
Iran 13,000 to 26,000 450−750 H: 350 m, D: 1000 m, [39]
Iran 120,000–336,000 * 450−750 H: 200 m, h: 2 mD: 244 m, d: 10 m, [49]
Arabian Gulfregion +104,000 185−1250 H: 500 m, D: 1000 m [40]
Algeria 700–720 420−620 H: 200 m, h: 2.5 mD: 500 m, d: 10 m, [41]
Mediterraneanregion 5000–6200 * 130−750 H: 550 m,
D: 1250 m, d: 82 m [42]
Cyprus 945,000 120–700 H: 750 m, h: 2.5 mD: 2900 m, d: 70 m [27]
China 1,300,000 * 200–1000 H: 1000 m,D: 2750 m, d: 120 m, [43]
Pacific IslandCountries 560 608 H: 100 m, h: 0.5 m
D: 80 m, d: 2.5 m [44]
India 2,600,000 * - [45]
Qatar 633,125.9 125 to 850 H: 200 m, h: 6 m,D: 250 m, d: 10 m This study
H: Chimney height, h: Collector inlet height, D: Collector diameter; d: Chimney diameter. * corrected to 15 h solarirradiation/day.
The principal explanation for the substantial output of electrical power is the arrange-ment of the HSCPP. The system was operated as SCPP and CT in parallel, contributing tothe combined production of electricity. The intercepted solar irradiation was used through-out the day to heat the air under the collector. The heat absorbed increases the temperatureof the air, reduces its density, and induces a streamlined velocity over the seawater pool.The airflow pushes the hot air up the chimney to allow the ambient outside temperature toreach the chimney and maintain continuous airflow. The heat absorbed also evaporatespart of the water, leading to an improvement in the air’s percent RH and improving thecooling effect. The difference in temperature and pressure between the inside and outsideof the chimney pushes hot air through the chimney, where the kinetic energy is convertedto mechanical energy, thereby producing electricity.
The effect of the water pool radius on the air temperature within the HSCCP is anotherimportant operational parameter because this value determines the magnitude of thedistilled water production and electric power generation. Figure 5c shows the temperatureprofile of the air entering the chimney from the collector entrance under different valuesof the pool radius. Generally speaking, the air temperature increases as it travels towardsthe chimney entrance due to the contact between the air and solar glass heating. However,once the air reaches the water pool zone, water evaporates into the air, saturating it anddecreasing its temperature. So, while the net change in air temperature is still positive dueto the dominant effect of solar heating, the surface area of the water pool (radius) has asignificant effect on the chimney inlet air temperature. A lower pool surface area implies asmaller decrease in air temperature and consequently lower distilled water production. Onthe other hand, while a higher surface area should be able to produce more distilled water,the developed ∆T will be less, airflow will decrease, and thus the electric energy producedfrom the turbine will decrease.

Sustainability 2021, 13, 12100 14 of 24
Previous studies have shown that the temperature profile observed and the corre-sponding airflow at a given radius can be correlated with the power production fromthe SCPP. Kiwan and Salam [19] reported an increase in the power production curves byincreasing the chimney radius to 350 m. Although a larger radius slightly improves theproduced power, there is a limitation in the chimney radius above which the constructioncost contradicts the benefits in power production. This trend can be aimed at the excessiveheat loss at a high radius from both the collector and ground to the soil. Thus, there willbe an upper limit for the airflow temperature in the collector in terms of the equilibriumbetween heat loss and inlet solar radiation. The present study suggests a chimney radius inthe range of 5 to 25 m to be optimum for maximum power output and lower fixed capitalcosts. Toghraie et al. [50] showed that although the output power of the solar chimneyincreased by increasing the radius, the efficiency decreased significantly. The pressuregradient created by the increase in the chimney radius, which increases the airflow rate,is the main explanation for the increase in power output. However, at a high radius, theheat transfer area increased at constant heat flux, resulting in a significant decrease in theefficiency.
The obtained trends suggest that there is an optimum production of distilled water andelectric energy while keeping the construction cost of the HSCPP reasonable. A pool radiusof 15 m was previously determined to be the optimum choice, allowing for a chimneyinlet air temperature of 63 ◦C, while also not hurting the efficiency of the power plant insubstantial ways. The obtained results show that the pool radius and the air temperatureare strongly inversely proportional, conforming to the phenomenon described earlier. Itshould be noted that the HSCCP can be operated as a CT at night and as an SCPP during theday, offering 24-h energy production. The SCPP mode produces an annual electrical powerof 380,263.1 kWh and 139,443.4 tons of distilled water. The produced electrical energy iscomparable to the value of 377,000 kWh/year reported by Zuo et al. [47]. However, thepresent structure reported 1.5-fold higher water desalination production (92,616 tons/year).Sangi et al. [39] illustrated that by decreasing the radius of the seawater pool, the air velocityprofile through the collector increased dramatically at the chimney base. The same studyreported that the air velocity increased at a constant radius with rising solar radiation. Anaccelerated natural air draught tower is created by the temperature gradient between theinside and outside of the chimney.
3.2. CT Performance
Figure 6a shows the minimum, maximum, and average monthly electric power gen-eration from the operation of the HSCCP in the CT mode. The maximum and averagepower outputs follow the same trends, which is different than the minimum values. It wasobserved that the energy production starts around mid-February and increases to reach thehighest values during the hot months (May to September) and then decreases to reach lessthan 250 kWh in November-December. For the minimum production, a sudden decreasein the power production rate was observed in July and August. The observed trend can beattributed to the impact of the ambient temperature on the system performance. The opera-tion of the HSCPP as CT depends on two main principles: mass transfer when droplets ofwater evaporate and extract the required latent heat from the water pool, leading to thecooling effect; and heat transfer, where the developed ∆T determines the magnitude of thepressure difference and the airflow to operate the turbine and produce electricity. In thelow-temperature months (January, February, November, and December), the temperaturedifference between the water droplets and inlet air is low, creating a small ∆T and resultingin very low power production. On the other hand, a high-temperature month will createhigh ∆T and enhance both the mass and heat transfer, resulting in significant coolingand airflow and thus high energy production. The average power produced from theCT operation was 1700 kWh, with a maximum of 2300 kWh reported in August. It isknown that the RH and the temperature are the main climate parameters that have a strongimpact on the output power from CT. Figure 6b presents the output energy in correlation

Sustainability 2021, 13, 12100 15 of 24
with temperature and RH. It is expected that increasing the temperature will increase thegradient driving force of the inside air movement and this will increase the power output.However, it can be seen in Figure 6b that the variation in temperature during the operationas CT is negligible and cannot be considered as a dominant factor in this case. Instead, theRH is inversely proportional to the CT output power, and its obvious fluctuations deem itto be the main driving force behind the change in electricity production. During the earlyperiod of the day (00:00 am–05:00 am), the RH sees a noticeable increase from 57% to 63%,followed by a drop to an even lower value than it initially started at, and the opposite ofthis trend applies to the output power, where it decreases slightly from 173 to 170 kW andthen increases back to 171 kW. The effect of RH on the power productivity is felt even morestrongly after 17:00 when the humidity shoots up to the maximum value of 67%, and theoutput power declines from 176 to 170 kW along with it. The effect of humidity on the per-formance of the CT is explained by the change in water evaporation, since highly saturated(humid) air can only accept a small amount of extra water molecules from the sprinklers,which leads to less cooling by the evaporation of the water into the air, and this leads toa smaller temperature gradient, hence less air movement inside the chimney. Fujita et al.investigated the effect of RH on the heat transfer between air and an evaporating waterdroplet and concluded that low RH decreases the droplet temperature, and high humidityincreases its temperature [51]. Additionally, Ruberto et al. [52] investigated the evaporationrate of supercooled water droplets at varying values of RH and constant temperature, andthey found that the evaporation rate was strongly linearly and inversely proportional tothe RH, with a decrease in the evaporation rate from about 340 to 170 µm2/s when thehumidity increased from 20 to 60%.
As discussed earlier, the outside temperature is a critical factor that decides powerproductivity in the tower, and this is further demonstrated by Figure 6c, in which theoutside temperature and outlet temperature seem to have a constant temperature differenceof approximately 6 ◦C, where the latter one is cooler due to the vaporization of waterleading to the subsequent downward movement. Because the outside temperature in theearly morning period seems almost constant (and with it, the outlet temperature), the airvelocity inside the chimney does not change much during the period and stays at the valueof 25.2 m/s. However, after 17:00, the outside air temperature dwindles from 36.5 to 34 ◦C,and with it, the air velocity drops from 25.4 to 25.2 m/s, further demonstrating the effectthe outside temperature has on the downward movement in the tower. The CT modeproduces a total annual electrical power of 252,862.8 kWh, a significant increase thatmakes up 66.5% of the HSCPP mode, highlighting the feasibility of the hybrid design.The influence of the ∆T between the air inside and outside the chimney is connected tothis observed trend. The differential pressure increases by raising the ∆T, leading to anincrease in the velocity of the air within the chimney and providing more dynamic powerto drive the turbine and improve the output power. In the same way, the amount of waterthat can be evaporated to achieve the necessary cooling effect decreases as the percentRH of the external air increases, contributing to lower power generation. The patternobserved also highlights the effect of the wind speed and its hydrodynamics on systemefficiency. The change in the kinetic energy of the air within the chimney can be increasedby any potential changes in the direction and speed of the wind and thus the power outputcan be enhanced. Sakonidou et al. [53] illustrated that the air velocity profile within thechimney exhibits a non-interacting boundary layer with local maxima at the center. Thehigh air velocity evolved due to the high-pressure difference between the inside and theambient air temperature. Arce et al. [54] confirmed that the thermal gradients betweenthe absorber plate and the air adjacent to it affect the airflow rate through the SC. Thesame work emphasized the significance of the upper side of the chimney’s wind velocityin generating a draft to increase the velocity of the airflow.

Sustainability 2021, 13, 12100 16 of 24
Sustainability 2021, 13, x FOR PEER REVIEW 17 of 25
(a)
(b)
Figure 6. Cont.

Sustainability 2021, 13, 12100 17 of 24
Sustainability 2021, 13, x FOR PEER REVIEW 18 of 25
Figure 6. (a) Monthly electric power generation from the CT mode, (b) the effect of the RH and temperature on the output
power from CT, and (c) the effect of the outside temperature on the air velocity within the CT.
3.3. HSCPP Performance
The proposed HSCPP model was devised, and its performance regarding distilled
water and electric power production is summarized in Figure 7a,b, respectively. The plant
produces up to 170 kW during the early morning and night periods, and up to 148 kW
during the day, showing the benefit of adding the CT to the conventional SCPP design
and its feasibility for electricity production. Meanwhile, distilled water production goes
up to 56 tons at 14:00, further adding to the plant’s value. Since the air temperature gradi-
ent, and thus the electric power and distilled water production, is a strong function of the
solar radiation intensity, it is well within expectation for these three variables to follow a
similar trend in the SCPP mode. Furthermore, the graphs show that a setup that maxim-
izes power production could be installed, such that the cooler periods where the solar
irradiance is minimal are utilized to maintain power production by normally having the
HSCPP operating as an SCPP during the high irradiance periods, and a CT between sunset
and sunrise. One possible modification of the design could be optimizing the operating
hours for the two modes, and this is because as the figures show, the solar irradiance is
relatively low in the beginning and end of the SCPP 5:00–17:00 period, which leads to the
question of whether or not the extension of the CT mode operating hours at those low-
irradiance times would be a net positive overall, but this would need further studying of
the plant performance under different time distributions for the two modes. Table 6 sum-
marizes a full year of a working plant, producing electric power and distilled water, and
a comparison between the conventional SCPP and the proposed HSCPP is presented. For
both power plants (conventional and hybrid), the production is at its lowest value during
the winter months (at the beginning and end of the year) due to low radiation and high
humidity, while the summer months witness an increased outside temperature, solar ir-
(c)
Figure 6. (a) Monthly electric power generation from the CT mode, (b) the effect of the RH andtemperature on the output power from CT, and (c) the effect of the outside temperature on the airvelocity within the CT.
3.3. HSCPP Performance
The proposed HSCPP model was devised, and its performance regarding distilledwater and electric power production is summarized in Figure 7a,b, respectively. The plantproduces up to 170 kW during the early morning and night periods, and up to 148 kWduring the day, showing the benefit of adding the CT to the conventional SCPP design andits feasibility for electricity production. Meanwhile, distilled water production goes up to56 tons at 14:00, further adding to the plant’s value. Since the air temperature gradient,and thus the electric power and distilled water production, is a strong function of the solarradiation intensity, it is well within expectation for these three variables to follow a similartrend in the SCPP mode. Furthermore, the graphs show that a setup that maximizes powerproduction could be installed, such that the cooler periods where the solar irradianceis minimal are utilized to maintain power production by normally having the HSCPPoperating as an SCPP during the high irradiance periods, and a CT between sunset andsunrise. One possible modification of the design could be optimizing the operating hoursfor the two modes, and this is because as the figures show, the solar irradiance is relativelylow in the beginning and end of the SCPP 5:00–17:00 period, which leads to the questionof whether or not the extension of the CT mode operating hours at those low-irradiancetimes would be a net positive overall, but this would need further studying of the plantperformance under different time distributions for the two modes. Table 6 summarizes afull year of a working plant, producing electric power and distilled water, and a comparisonbetween the conventional SCPP and the proposed HSCPP is presented. For both powerplants (conventional and hybrid), the production is at its lowest value during the wintermonths (at the beginning and end of the year) due to low radiation and high humidity,

Sustainability 2021, 13, 12100 18 of 24
while the summer months witness an increased outside temperature, solar irradiance,and lower humidity, giving rise to the plant’s most productive period. The electricityproduction by the HSCPP over the span of one year is 633,125.9 kWh, which is 66.5%higher than that produced by the conventional SCPP (380,263.1 kWh), while the productionrate of distilled water reaches 139,443.4 tons, which is almost double the amount producedfrom a conventional SCPP.
Sustainability 2021, 13, x FOR PEER REVIEW 19 of 25
radiance, and lower humidity, giving rise to the plant’s most productive period. The elec-
tricity production by the HSCPP over the span of one year is 633,125.9 kWh, which is
66.5% higher than that produced by the conventional SCPP (380,263.1 kWh), while the
production rate of distilled water reaches 139,443.4 tons, which is almost double the
amount produced from a conventional SCPP.
Figure 7. The energy and distilled water production from HSCPP (a) distilled water and (b) electric power production.
(a)
(b)
Figure 7. The energy and distilled water production from HSCPP (a) distilled water and (b) electricpower production.

Sustainability 2021, 13, 12100 19 of 24
Table 6. Monthly electrical power production and distilled water generation from the HSCPP.
Month
MonthlyGlobal SolarIrradiation(kWh/m2)
ElectricEnergy,
SCPP (kWh)
ElectricEnergy, CT
(kWh)
ElectricEnergy,HSCPP
(kWh) SCPP& CT
DistilledWater (ton)
January 185.944 29,515.89 0 29,515.89 8960.995February 175.847 28,347.98 0 28,347.98 10,243.77
March 204.597 32,542.67 327.133 32,869.8 11,499.31April 206.499 32,119.36 824.2792 32,943.64 13,501.25May 234.531 35,510.46 39,262.42 74,772.87 13,339.45June 231.652 34,419.29 47,988.49 82,407.78 14,510.86July 231.961 34,129.4 50,792.73 84,922.13 14,816.74
August 226.995 34,068.48 47,993.29 82,061.77 13,176.88September 212.239 31,472.88 51,265.52 82,738.4 11,412.38
October 206.029 30,662.84 14,243.77 44,906.61 9558.005November 189.334 29,553.07 165.1956 29,718.26 9339.416December 173.411 27,920.79 0 27,920.79 9084.36
Total 2479.04 380,263.1 252,862.8 633,125.9 139,443.4
3.4. Environmental Impact Assessment
Table 7 presents the annual electrical power and freshwater production from the SCPPand HSCPP in addition to the annual reduction in the CO2 emissions with the same amountof energy and water produced from natural gas (NG) burning. Operating the SCPP inthe hybrid mode exhibited an increase in the electrical power and freshwater production1.67- and 1.54-fold higher than the classical solar chimney. Besides, the annual reduction inthe CO2 emissions with this amount of electricity and water produced from NG burningwas estimated to be 617.7 metric tons/year, which will contribute to a decrease in Qatar’sGHG emissions. The CO2 emissions in Qatar from fossil fuel burning and industrialactivities have increased massively since 1970, recording up to 106.5 million metric tons in2019, with an annual increase of 1.85 million metric tons/year. Compared to other energysources, such as coal-fired power plants, the HSCPP is a pollution-free facility. The benefitsoffered from the present system would produce sustainable and renewable clean energyand water while contributing to a reduction in the country’s CO2 emissions.
Table 7. Comparison of the performance of the HSCPP against a conventional SCPP.
Item SCPP [48] HSCPP
Electrical power production, (kWh/year) 380,263 633,125Fresh water production (metric tons/year) 90,000 139,443
CO2 emission reduction (tons/year) 294.4 617.5
In addition to the CO2 emissions, the biggest problem with flue gas from powerplantand desalination processes is the emission of other gases, such as NOx, SOx, and H2S, whichhave a dramatic impact on the environment. The proposed HSCPP is expected to reducethe emissions of these gases by 20%, 15%, and 13%, respectively. NOx can cause asthma,inflammation of the lungs, and bronchitis at the human level, and lowers the ozone layer,inducing skin cancer that triggers ultra-violet rays from the Sun at the environmental level.Further, NOx can react with humidity to produce HNO2 and HNO3 and destroy greenliving on Earth. SOx can be converted to H2SO4, generating the same drastic results on allliving species, such as the corroding of structures, substance, or clothing degradation. H2Sis a toxic gas that can cause serious problems for humans and properties. The reductionin these gasses in addition to free energy production is an addition to the benefits of theproposed design.

Sustainability 2021, 13, 12100 20 of 24
3.5. Economic Analysis
The cost of the proposed HSCPP design considering the chimney, glass base, concertbasin, turbine, and installation cost was estimated to be US $3.25 million. The estimatedcost is in good agreement with the cost estimated by Abdelsalam et al. [35] for a lowelectrical capacity of 481 MW. However, it slightly differs from the costs proposed byAl-Dabbas [55] and Dehghani and Mohammadi [56] due to the differences in capacity,components, and labor costs. The individual component cost was determined using theexponent method as per Equation (14) as reported by Gavin and Towler [57]. The estimatedcost also included the integration of the cooling section
Cost = Tabulated Factor + (Component Size)(Exponent factor/size) (14)
The proposed design peculiarity maximizes energy output while lowering initialcosts and providing an environmentally friendly design that is simple to deconstruct andreinstall. The HSCPP has the ability to produce electricity for 24 h and operate as a coolingtower during the night. The cost of cooling is correlated to the price of electricity per 1 ◦CBy contrast, the proposed design could achieve the required cooling free of charge. Fromthis perspective, the HSCPP will always be economically viable and has a cost advantage.Considering the ability of the HSCPP to produce electricity and water, and to work asa CT, the overall cash flow analysis showed a payback time of 4.5 years, ROI of 27.8%,and DCFRR of 25.6%. The obtained short payback time and the high ROI and DCFRRhighlight the economic benefits observed from the proposed HSCPP. The short paybacktime, which represents the cost of the investment divided by the annual cash flow, confirmsthe desirable aspect of the investment. The positive values of ROI and DCFRR encourageand support investment effectiveness compared to the cost of the investment.
4. Conclusions
A performance study of HSCPP in Doha, Qatar was presented. It was shown thatthe HSCPP can run as an SCPP during the daytime and as a CT during the nighttime.The results showed that the HSCPP can run continuously if the weather conditions arefavorable. The proposed HSCPP exhibited an electrical power and freshwater production1.67- and 1.54-fold higher than the classical solar chimney, which can reduce the annualCO2, NOx, SOx, and H2S emissions by 5% 20%, 15%, and 13%, respectively. The annualelectricity production from the HSCPP was observed to be 633,125.9 kWh, which is 66.5%higher than that produced by the conventional SCPP (380,263.1 kWh). There is a strongseasonal difference in power production, with the HSCPP’s output improving throughoutthe summer. Increasing the solar irradiations and reducing heat transfer resulted in anincrease in the air mass flow rate and consequently increased the power generation fromthe HSCPP. Abundant solar radiation and high amounts of solar irradiation in the vastdesert land mean it is a suitable site for the construction of HSCPP to utilize local solarirradiation. The results also showed that the HSCPP outperformed the traditional SCPPtwo to one in the amount of electricity and freshwater generated, as well as the amount ofCO2 reduction. The results showed that the HSCPP would be a feasible solution to provideelectricity and fresh water in Qatar. Future work may include studying interfacing theHSCPP to a traditional water desalination power plant to take advantage of excess hot airproduced by the desalination plant to improve the performance of the HSCPP. Overall, thestudy revealed that HSCPP could be employed to improve energy access in rural areaswith a high return on investment (payback period of 4.5 years, ROI of 27.8%, and DCFRRof 25.6%). Future work on the social and environmental impact of such projects throughsurveys and dialogues with the stakeholders is highly recommended.
Supplementary Materials: Detailed equations of the mathematical model for the HSCPP are avail-able online at https://www.mdpi.com/article/10.3390/su132112100/s1.

Sustainability 2021, 13, 12100 21 of 24
Author Contributions: Conceptualization, E.A. (Emad Abdelsalam), F.K., F.A.; methodology, E.A.(Emad Abdelsalam), F.K., D.H. and A.K.; validation, E.A. (Emad Abdelsalam), F.K., M.A. and F.A.;formal analysis, E.A. (Eyad Almaitta), F.K., F.A. and M.A.; investigation, E.A. (Eyad Almaitta), F.K.,A.K. and A.O.; writing—original draft preparation, A.O, E.A. (Eyad Almaitta), F.K., M.A., F.A. andM.T.; writing—review and editing, A.O., F.K., M.A., F.A. and M.T.; visualization, D.H., A.K. andD.H.; supervision E.A. (Eyad Almaitta), and F.K. All authors have read and agreed to the publishedversion of the manuscript.
Funding: This research received no external funding.
Data Availability Statement: Not available.
Acknowledgments: The authors would like to the thank the MERG lab for their support in develop-ing this work. Special thanks to Luz Gonzalez for proofreading.
Conflicts of Interest: The authors declare no conflict of interest.
NomenclatureA Area (m2)H Height (m)Pelc Electrical Power (W)q Heat transfer rate (W m−2)h Heat transfer coefficient (W m−2 K−1)dh Hydraulic diameter (m)rw Seawater pool radius (m)m Mass flow rate (kg s−1)g Gravity acceleration (m s−2)D Diameter (m)I Intensity of solar irradiation (kW m−2)k Thermal conductivity of airT Temperature (K)Qout Heat transfer between the outside and chimney wall (W)cp Specific heat capacity (J kg−1 K−1)r Radius (m)PV Photovoltaici Enthalpyhfg Latent heat of water evaporation, (kJ/kg)f Friction factorVch Air velocity entering the chimney, (m s−1)E The net mechanical energy, (Pa).F Energy loss coefficientC f Turbine Efficiency, 0.63.Greek Symbolsτ TransmissivityA AbsorptivityP Density (kg m−3)ω Relative Humidityη System Utilization FactorSubscriptsc Convective heat transfergls Glasswtr Waterch Chimneycd Condensated watere Evaporation

Sustainability 2021, 13, 12100 22 of 24
col Collectorent Entranceout Outsider Radiative heat transfersky Skyabs Absorberair Airflowvap The humid air resulting from spraying water on the dry air in the case of CTNet Net
References1. Mohsin, M.; Abbas, Q.; Zhang, J.; Ikram, M.; Iqbal, N. Integrated effect of energy consumption, economic development, and
population growth on CO2 based environmental degradation: A case of transport sector. Environ. Sci. Pollut. Res. 2019, 26,32824–32835. [CrossRef]
2. Takalkar, G.D.; Bhosale, R.R.; Kumar, A.; Almomani, F.; Khraisheh, M.A.M.; Shakoor, R.A.; Gupta, R.B. Transition metal dopedceria for solar thermochemical fuel production. Sol. Energy 2018, 172, 204–211. [CrossRef]
3. International Energy Agency. Energy, Water & the Sustainability Development Goals, Excerpt from World Energy Outlook 2018.2018, pp. 1–15. Available online: https://webstore.iea.org/download/direct/2459 (accessed on 12 August 2021).
4. Franzluebbers, A.J. Cattle Grazing Effects on the Environment: Greenhouse Gas Emissions and Carbon Footprint. In ManagementStrategies for Sustainable Cattle Production in Southern Pastures; Elsevier: Amsterdam, The Netherlands, 2020; pp. 11–34.
5. Almomani, F.; Judd, S.; Bhosale, R.R.; Shurair, M.; Aljaml, K.; Khraisheh, M. Intergraded wastewater treatment and carbonbio-fixation from flue gases using Spirulina platensis and mixed algal culture. Process Saf Environ Prot. 2019, 124, 240. [CrossRef]
6. Zhou, X.; Wang, F.; Ochieng, R.M. A review of solar chimney power technology. Renew. Sustain. Energy Rev. 2010, 14, 2315–2338. [CrossRef]7. Dhahri, A.; Omri, A. A review of solar chimney power generation technology. Int. J. Eng. Adv. Technol. 2013, 2, 1–17.8. Kasaeian, A.; Ghalamchi, M.; Ahmadi, M.H.; Ghalamchi, M. GMDH algorithm for modeling the outlet temperatures of a solar
chimney based on the ambient temperature. Mech. Ind. 2017, 18, 216. [CrossRef]9. Ming, T.; Liu, W.; Xu, G. Analytical and numerical investigation of the solar chimney power plant systems. Int. J. Energy Res.
2006, 30, 861–873. [CrossRef]10. Schlaich, J. The solar chimney: Electricity from the Sun, Edition Axel Menges; Scientific Research: Stuttgart, Germany, 1995.11. Ghalamchi, M.; Kasaeian, A.; Ahmadi, M.H.; Ghalamchi, M. Evolving ICA and HGAPSO algorithms for prediction of outlet
temperatures of constructed solar chimney. Int. J. Low-Carbon Technol. 2017, 12, 84–95. [CrossRef]12. Schlaich, J.; Bergermann, R.; Schiel, W.; Weinrebe, G. Sustainable electricity generation with solar updraft towers. Structural Eng.
Int. J. Int. Assoc. Bridge Struct. Eng. 2004, 14, 225–229. [CrossRef]13. Tingzhen, M.; Wei, L.; Guoling, X.; Yanbin, X.; Xuhu, G.; Yuan, P. Numerical simulation of the solar chimney power plant systems
coupled with turbine. Renew. Energy 2008, 33, 897–905. [CrossRef]14. Zou, Z.; He, S. Modeling and characteristics analysis of hybrid cooling-tower-solar-chimney system. Energy Convers. Manag. 2015,
95, 59–68. [CrossRef]15. Xu, Y.; Zhou, X. Performance of a modified solar chimney power plant for power generation and vegetation. Energy 2019, 171,
502–509. [CrossRef]16. Asayesh, M.; Kasaeian, A.; Ataei, A. Optimization of a combined solar chimney for desalination and power generation. Energy
Convers. Manag. 2017, 150, 72–80. [CrossRef]17. Khan, M.A.M.; Rehman, S.; Al-sulaiman, F.A. A hybrid renewable energy system as a potential energy source for water
desalination using reverse osmosis: A review. Renew. Sustain. Energy Rev. 2018, 97, 456–477. [CrossRef]18. Niroomand, N.; Amidpour, M. New combination of solar chimney for power generation and seawater desalination. Desalin.
Water Treat. 2013, 51, 7401–7411. [CrossRef]19. Kiwan, S.; Salam, Q.I.A. Solar chimney power-water distillation plant (SCPWDP). Desalination 2018, 445, 105–114. [CrossRef]20. Ming, T.; de Richter, R.K.; Meng, F.; Pan, Y.; Liu, W. Chimney shape numerical study for solar chimney power generating systems.
Int. J. Energy Res. 2013, 37, 310–322. [CrossRef]21. Chergui, T.; Larbi, S.; Bouhdjar, A. Thermo-hydrodynamic aspect analysis of flows in solar chimney power plants-A case study.
Renew. Sustain. Energy Rev. 2010, 14, 1410–1418. [CrossRef]22. Pasumarthi, N.; Sherif, S.A. Experimental and theoretical performance of a demonstration solar chimney model-part I: Mathemat-
ical model development. Int. J. Energy Res. 1998, 22, 277–288. [CrossRef]23. Zuo, L.; Ding, L.; Chen, J.; Zhou, X.; Xu, B.; Liu, Z. Comprehensive study of wind supercharged solar chimney power plant
combined with seawater desalination. Sol. Energy 2018, 166, 59–70. [CrossRef]24. Cao, F.; Ma, Q.; Zhao, L.; Guo, L. Design and simulation of a novel geothermalsolar combined chimney power plant. In
Proceedings of the 26th International Conference on Efficiency, Cost, Optimization, Simulation and Environmental Impact ofEnergy Systems (ECOS 2013), Guilin, China, 15–19 July 2013; Volume 84, pp. 186–195.
Sustainability 2021, 13, 12100 23 of 24
25. Chergui, T.; Larbi, S.; Bouhdjar, A. Modelling and simulation of solar chimney power plant performances in southern region ofAlgeria. In Proceedings of the 2011 Fourth International Conference on Modeling, Simulation and Applied Optimization, KualaLumpur, Malaysia, 19–21 April 2011. [CrossRef]
26. Kiwan, S.; Al-Nimr, M.; Salim, I. A hybrid solar chimney/photovoltaic thermal system for direct electric power production andwater distillation. Sustain. Energy Technol. Assess. 2020, 38, 100680. [CrossRef]
27. Okoye, C.O.; Atikol, U. A parametric study on the feasibility of solar chimney power plants in North Cyprus conditions. EnergyConvers. Manag. 2014, 80, 178–187. [CrossRef]
28. Mathur, J.; Mathur, S.; Anupma. Summer-performance of inclined roof solar chimney for natural ventilation. Energy Build. 2006,38, 1156–1163. [CrossRef]
29. Fluri, T.P.; von Backström, T.W. Performance analysis of the power conversion unit of a solar chimney power plant. Sol. Energy2008, 82, 999–1008. [CrossRef]
30. Miqdam, T.C.; Hussein, A.K. Basement kind effects on air temperature of a solar chimney in Baghdad-Iraq weather. Int. J. Appl.Sci. 2011, 2, 12–20. [CrossRef]
31. Tingzhen, M.; Wei, L.; Yuan, P. Numerical Analysis of the Solar Chimney Power Plant with Energy Storage Layer. In ISES SolarWorld Congress 2007, ISES 2007; Springer: Berlin/Heidelberg, Germany, 2007; Volume 3, pp. 1800–1805. [CrossRef]
32. Zuo, L.; Yuan, Y.; Li, Z.; Zheng, Y. Experimental research on solar chimneys integrated with seawater desalination under practicalweather condition. Desalination 2012, 298, 22–33. [CrossRef]
33. Tavakolinia, F. Wind-Chimney: Integrating the Principles of a Wind-Catcher and a Solar-Chimney to Provide Natural Ven-tilation. Master’s Thesis, California Polytechnic State University, San Luis Obispo, CA, USA, 2011; p. 48. Available online:http://digitalcommons.calpoly.edu/theses/678 (accessed on 18 June 2021).
34. Zandian, A.; Ashjaee, M. The thermal efficiency improvement of a steam Rankine cycle by innovative design of a hybrid coolingtower and a solar chimney concept. Renew. Energy 2013, 51, 465–473. [CrossRef]
35. Abdelsalam, E.; Kafiah, F.M.; Tawalbeh, M.; Almomani, F.; Azzam, A.R.; Alzoubi, I.; Alkasrawi, M. Performance analysis ofhybrid solar chimney–power plant for power production and seawater desalination: A sustainable approach. Int. J. Energy Res.2020, 45, 17327–17341. [CrossRef]
36. Abdelmohimen, M.A.H.; Algarni, S.A. Numerical investigation of solar chimney power plants performance for Saudi Arabiaweather conditions. Sustain. Cities Soc. 2018, 38, 1–8. [CrossRef]
37. Okoye, C.O.; Taylan, O. Performance analysis of a solar chimney power plant for rural areas in Nigeria. Renew. Energy 2017, 104,96–108. [CrossRef]
38. El-Haroun, A.A. Performance Evaluation of Solar Chimney Power Plants in Egypt. 2012. Available online: www.ijopaasat.in(accessed on 26 November 2020).
39. Sangi, R. Performance evaluation of solar chimney power plants in Iran. Renew. Sustain. Energy Rev. 2012, 16, 704–710. [CrossRef]40. Hamdan, M.O. Analysis of a solar chimney power plant in the Arabian Gulf region. Renew. Energy 2011, 36, 2593–2598. [CrossRef]41. Larbi, S.; Bouhdjar, A.; Chergui, T. Performance analysis of a solar chimney power plant in the southwestern region of Algeria.
Renew. Sustain. Energy Rev. 2010, 14, 470–477. [CrossRef]42. Nizetic, S.; Ninic, N.; Klarin, B. Analysis and feasibility of implementing solar chimney power plants in the Mediterranean region.
Energy 2008, 33, 1680–1690. [CrossRef]43. Guo, P.; Li, J.; Wang, Y. Annual performance analysis of the solar chimney power plant in Sinkiang, China. Energy Convers. Manag.
2014, 87, 392–399. [CrossRef]44. Ahmed, M.R.; Patel, S.K. Computational and experimental studies on solar chimney power plants for power generation in Pacific
Island countries. Energy Convers. Manag. 2017, 149, 61–78. [CrossRef]45. Akhtar, Z.; Rao, K.V.S. Study of economic viability of 200 MW solar chimney power plant in Rajasthan, India. In Proceedings of
the 2014 1st International Conference on non Conventional Energy (ICONCE 2014), Kalyani, India, 16–17 January 2014; pp. 84–88.46. Abdelsalam, E.; Kafiah, F.; Alkasrawi, M.; Al-Hinti, I.; Azzam, A. Economic Study of Solar Chimney Power-Water Distillation
Plant (SCPWDP). Energies 2020, 13, 2789. [CrossRef]47. Zuo, L.; Zheng, Y.; Li, Z.; Sha, Y. Solar chimneys integrated with sea water desalination. Desalination 2011, 276, 207–213. [CrossRef]48. Larbi, S.; Bouhdjar, A.; Meliani, K.; Taghourt, A.; Semai, H. Solar chimney power plant with heat storage system performance
analysis in South Region of Algeria. In Proceedings of the 2015 3rd International Renewable and Sustainable Energy Conference(IRSEC), Marrakech, Morocco, 10–13 December 2015; pp. 1–6.
49. Asnaghi, A.; Ladjevardi, S.M. Solar chimney power plant performance in Iran. Renew. Sustain. Energy Rev. 2012, 16, 3383–3390. [CrossRef]50. Toghraie, D.; Karami, A.; Afrand, M.; Karimipour, A. Effects of geometric parameters on the performance of solar chimney power
plants. Energy 2018, 162, 1052–1061. [CrossRef]51. Fujita, A.; Kurose, R.; Komori, S. Experimental study on effect of relative humidity on heat transfer of an evaporating water
droplet in air flow. Int. J. Multiph. Flow 2010, 36, 244–247. [CrossRef]52. Ruberto, S.; Reutzsch, J.; Weigand, B. Experimental investigation of the evaporation rate of supercooled water droplets at constant
temperature and varying relative humidity. Int. Commun. Heat Mass Transf. 2016, 77, 190–194. [CrossRef]53. Sakonidou, E.P.; Karapantsios, T.D.; Balouktsisa, A.I.; Chassapisa, D. Modeling of the optimum tilt of a solar chimney for
maximum air flow. Solar Energy 2008, 82, 80–94. [CrossRef]

Sustainability 2021, 13, 12100 24 of 24
54. Arcea, J.; Jiménez, M.J.; Guzmán, J.D.; Heras, M.R.; Alvarez, G.; Xamán, J. Experimental study for natural ventilation on a solarchimney. Renewable Energy 2009, 34, 2928–2934. [CrossRef]
55. Al-Dabbas, M.A. A performance analysis of solar chimney thermal power systems. Therm. Sci. 2011, 15, 619–642. [CrossRef]56. Dehghani, S.; Mohammadi, A.H. Optimum dimension of geometric parameters of solar chimney power plants-A multi-objective
optimization approach. Sol. Energy 2014, 105, 603–612. [CrossRef]57. Towler, G.; Sinnott, R. Chemical Engineering Design: Principles, Practice and Economics of Plant and Process Design; Elsevier:
Amsterdam, The Netherlands, 2012.
Copyright © 2022 FDOKUMEN