
A new pyramid-based color image representation for visual localization
14
A new pyramid-based color image representation for visual localization C. Urdiales * , M. Dominguez, C. de Trazegnies, F. Sandoval Departamento de Tecnología Electrónica, University of Málaga, E.T.S.I. de Telecomunicación, Campus de Teatinos, Málaga 29071, Spain article info Article history: Received 25 May 2006 Received in revised form 9 August 2007 Accepted 27 April 2009 Keywords: Localization Color histogram Principal components Hierarchical segmentation Spatial graph abstract This paper presents a new algorithm to extract a color graph from a real image so that it can be efficiently represented in a compact way. The proposal presents two main novelties. First, a new PCA-based color feature vector has been defined. This vector is resistant against illumination changes, noise and microtex- tures. Second, the image is segmented by means of a fast, hierarchical split and merge algorithm based on a pyramid structure that implicitly provides a color graph. In order to test the suitability of the proposed representation technique, simple localization experiments have been conducted in different real environments. Ó 2009 Elsevier B.V. All rights reserved. 1. Introduction to vision-based localization One of the main concerns of autonomous navigation is localiza- tion, which can be defined as the problem of correlating the coor- dinate system of a mobile agent with that of the external world. The simplest localization problem is incremental localization, where the initial mobile pose is known and localization errors for consec- utive positions are assumed to be small [6]. If no information about the pose of the mobile agent is available, the problem is known as global localization. Global localization can be reliably achieved by means of active external reference, like emitting beacons or GPS. Alternatively, if a model of the environment is available, informa- tion can be captured by onboard sensors and matched against such a model to determine the mobile agent position. Sensors used for localization include different range sensors (sonar, laser, etc.) to deal with the geometry of the environment. In some cases, though, further data that can only be captured by more complex sensors like video cameras is required to disambiguate potential geometri- cally equal locations. Model-based localization techniques rely on geometric or topo- logical maps of the environment—either available a priori [3] or constructed on line [36]—or on recognizing isolated artificial or natural landmarks. In both cases, the key idea is to provide the mobile agent with a sequence of elements expected to be found during navigation. Localization is achieved by matching the observation (image) against the expectation (model feature or landmark) [6]. Incremental localization techniques allow genera- tion of an expected view, which is reconciled with the camera perception to refine the robot position, whereas absolute localiza- tion systems must construct a match between the observations and the expectations as derived from the entire model database [41]. Model-based localization techniques can be geometric or impli- cit. Geometric techniques aim at calculating the position of signif- icant features of the environment, like corners or edges [35], or even artificial landmarks using stereo [3,11] or trinocular vision [25]. Alternatively, implicit or appearance based methods rely on storing raw sensor data at significant positions. This approach has been widely used with omnidirectional cameras, capable of capturing panoramic views of the environment [2]. Panoramic views, however, may be prone to errors in dynamic environments, where the view may significantly change because of moving obsta- cles and people. To solve this problem, some implicit methods rely on extracting descriptors from the image, like uniform regions or disparity areas, that are not globally affected by dynamic changes [12,32]. Geometric and implicit localization methods have been compared in [39] and it has been reported that implicit ones are more robust to noise, occlusions and changes in illumination. A significant body of implicit localization techniques relies on Content Based Image Retrieval (CBIR) techniques [20,45,48]. In these systems, the input image at a given time instant is compared against a stored image set and the position of the mobile agent is assumed to be equal to the one related to the retrieved image. However, it must be assumed that the probability of being at the exact position where the images in the database were captured is virtually zero and, hence, a perfect match will not exist. CBIR relies on descriptors such as color, texture, shape or spatial layout to index images in terms of a set of visual features. These systems mostly differ on how vectors are extracted, how systems 0262-8856/$ - see front matter Ó 2009 Elsevier B.V. All rights reserved. doi:10.1016/j.imavis.2009.04.014 * Corresponding author. E-mail address: [email protected] (C. Urdiales). Image and Vision Computing 28 (2010) 78–91 Contents lists available at ScienceDirect Image and Vision Computing journal homepage: www.elsevier.com/locate/imavis
Transcript of A new pyramid-based color image representation for visual localization
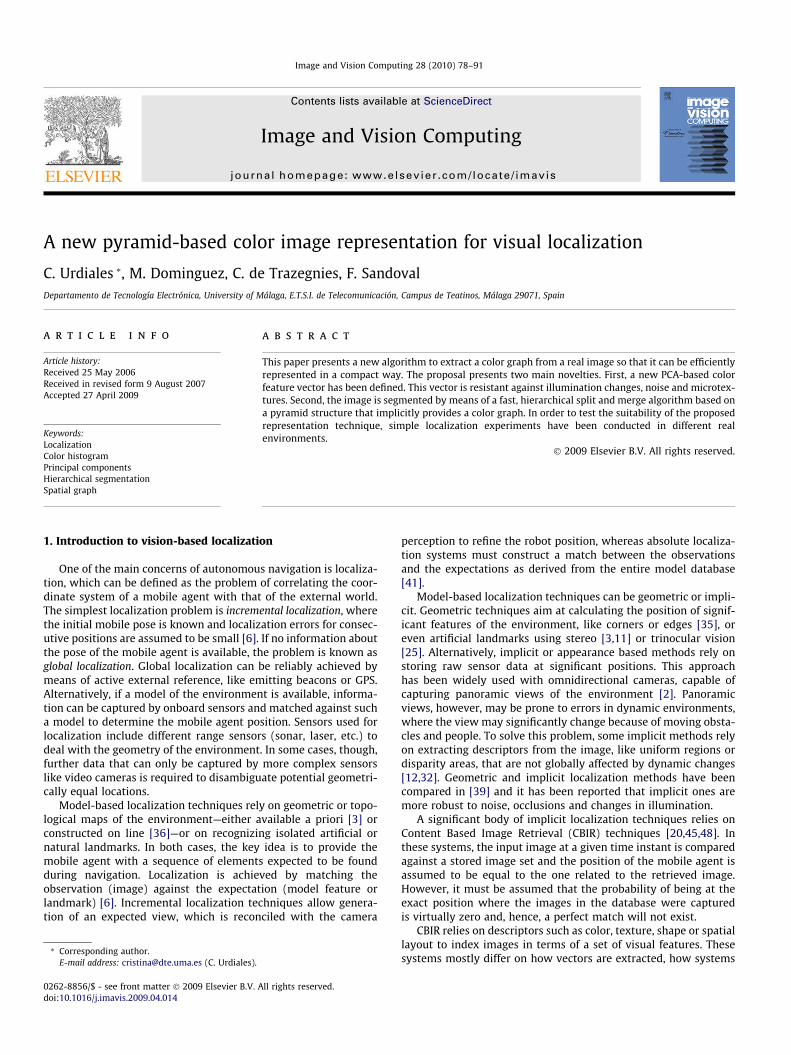
Image and Vision Computing 28 (2010) 78–91
Contents lists available at ScienceDirect
Image and Vision Computing
journal homepage: www.elsevier .com/locate / imavis
A new pyramid-based color image representation for visual localization
C. Urdiales *, M. Dominguez, C. de Trazegnies, F. SandovalDepartamento de Tecnología Electrónica, University of Málaga, E.T.S.I. de Telecomunicación, Campus de Teatinos, Málaga 29071, Spain
a r t i c l e i n f o
Article history:Received 25 May 2006Received in revised form 9 August 2007Accepted 27 April 2009
Keywords:LocalizationColor histogramPrincipal componentsHierarchical segmentationSpatial graph
0262-8856/$ - see front matter � 2009 Elsevier B.V. Adoi:10.1016/j.imavis.2009.04.014
* Corresponding author.E-mail address: [email protected] (C. Urdiales).
a b s t r a c t
This paper presents a new algorithm to extract a color graph from a real image so that it can be efficientlyrepresented in a compact way. The proposal presents two main novelties. First, a new PCA-based colorfeature vector has been defined. This vector is resistant against illumination changes, noise and microtex-tures. Second, the image is segmented by means of a fast, hierarchical split and merge algorithm based ona pyramid structure that implicitly provides a color graph. In order to test the suitability of the proposedrepresentation technique, simple localization experiments have been conducted in different realenvironments.
� 2009 Elsevier B.V. All rights reserved.
1. Introduction to vision-based localization
One of the main concerns of autonomous navigation is localiza-tion, which can be defined as the problem of correlating the coor-dinate system of a mobile agent with that of the external world.The simplest localization problem is incremental localization, wherethe initial mobile pose is known and localization errors for consec-utive positions are assumed to be small [6]. If no information aboutthe pose of the mobile agent is available, the problem is known asglobal localization. Global localization can be reliably achieved bymeans of active external reference, like emitting beacons or GPS.Alternatively, if a model of the environment is available, informa-tion can be captured by onboard sensors and matched against sucha model to determine the mobile agent position. Sensors used forlocalization include different range sensors (sonar, laser, etc.) todeal with the geometry of the environment. In some cases, though,further data that can only be captured by more complex sensorslike video cameras is required to disambiguate potential geometri-cally equal locations.
Model-based localization techniques rely on geometric or topo-logical maps of the environment—either available a priori [3] orconstructed on line [36]—or on recognizing isolated artificial ornatural landmarks. In both cases, the key idea is to provide themobile agent with a sequence of elements expected to be foundduring navigation. Localization is achieved by matching theobservation (image) against the expectation (model feature orlandmark) [6]. Incremental localization techniques allow genera-tion of an expected view, which is reconciled with the camera
ll rights reserved.
perception to refine the robot position, whereas absolute localiza-tion systems must construct a match between the observationsand the expectations as derived from the entire model database[41].
Model-based localization techniques can be geometric or impli-cit. Geometric techniques aim at calculating the position of signif-icant features of the environment, like corners or edges [35], oreven artificial landmarks using stereo [3,11] or trinocular vision[25]. Alternatively, implicit or appearance based methods rely onstoring raw sensor data at significant positions. This approachhas been widely used with omnidirectional cameras, capable ofcapturing panoramic views of the environment [2]. Panoramicviews, however, may be prone to errors in dynamic environments,where the view may significantly change because of moving obsta-cles and people. To solve this problem, some implicit methods relyon extracting descriptors from the image, like uniform regions ordisparity areas, that are not globally affected by dynamic changes[12,32]. Geometric and implicit localization methods have beencompared in [39] and it has been reported that implicit ones aremore robust to noise, occlusions and changes in illumination.
A significant body of implicit localization techniques relies onContent Based Image Retrieval (CBIR) techniques [20,45,48]. Inthese systems, the input image at a given time instant is comparedagainst a stored image set and the position of the mobile agent isassumed to be equal to the one related to the retrieved image.However, it must be assumed that the probability of being at theexact position where the images in the database were capturedis virtually zero and, hence, a perfect match will not exist.
CBIR relies on descriptors such as color, texture, shape or spatiallayout to index images in terms of a set of visual features. Thesesystems mostly differ on how vectors are extracted, how systems

C. Urdiales et al. / Image and Vision Computing 28 (2010) 78–91 79
are queried and how the matching process is performed. Visualfeatures used in CBIR can be roughly divided into those that canbe extracted from the image as a whole, like edges or histograms[13,45], those extracted from regions in the image, like area, cen-troid, color or texture [5,24] and those extracted from interestpoints, like corners or high gradient points [14,33,49]. The mainadvantage of systems relying on segmenting the image into regionsis that they implicitly include spatial information about the layoutof significant elements and also that regions can be ranked accord-ing to interest criteria. Segmentation of real images, however, is anill-posed and hard to solve problem. Hence, some methods rely onsimply dividing the image into a fixed set of subimages [29,34],while others perform a color-based or texture based segmentationto obtain homogeneous regions [1,9]. It has been shown that re-gion based localization methods perform better than those basedon interest points or the whole image [26], thus, this paper willfocus on a region based localization system.
This paper presents a new image representation technique forimplicit localization, based on color information extracted fromimage regions. Unlike methods based on geometric features likecorners, which usually require depth information for disambigua-tion and, consequently, rely on several cameras, the proposed onerequires a single color camera. Other methods based on a singlecamera rely on omnicameras because, given their large field ofview, complete images can be handled as landmarks. Our methodworks with a conventional camera instead and, hence, can be usedin any equipment yielding such a camera. It relies on unsupervised-ly segmenting the input image to create a graph which includes allsignificant homogeneous color regions in the view. Segmentation isbased on a new, compact color descriptor which has proven to beresistant against noise, illumination changes, mild gradients andmicrotextures. The main novelty of the representation process isthat it works in a fast, hierarchical way and that the graph is implic-itly returned by the segmentation algorithm. Section 2 shows howcolors are characterized in an efficient way, whereas Section 3 focuson the graph construction method. To demonstrate the usefulnessof the representation, a simple localization algorithm based on apanoramic world model is described in Section 4. Section 5 showsseveral results and experiments in different real environments.Finally, Section 6 presents conclusions and future work.
2. A new color feature vector
2.1. Color representation
Color is a powerful image descriptor, typically represented in3D spaces like RGB, rgb, HSI, YUV, etc. An homogeneous color isa point in those spaces. However, homogeneous regions in realimages do not present a single color because of capture conditions,gradients, shadows and microtextures. For example, a region of thesea may present different shades of blue (Fig. 3a and b). Conse-quently, rather than a point, the color of a real homogeneous re-gion is a 3D volume in 3D-color spaces. It is necessary to notethat images may be negatively affected by intensity changes dueto shading or surface orientation changes. Hence, it is usual towork with color features invariant to these factors. Normalized col-or spaces like rgb [43] can be used to avoid this problem, but a pop-ular choice is to use color spaces where illumination is stored in aseparate channel, like HSI or HSV. In these cases, some methods(e.g. [46]) rely uniquely on the hue field for simplicity, despitethe loss of information. In extreme illumination conditions, it doesnot solve the problem, but in general cases it offers a good compro-mise between color invariance and loss of chromatic information.
Although color measures are the most usual choice for imagerepresentation, some systems rely on atomic texture features like
anisotropy, entropy, homogeneity, coarseness, etc. [9,31]. How-ever, texture calculation is computationally expensive. Local Bin-ary Patterns (LBP) have been reported to behave well in terms ofefficiency and processing time [24] and have been used in CBIR(e.g. [5]). However, texture is strongly scale-dependant and, hence,some approaches have relied on wavelets [5,47]. This increases thedata volume associated with an image and the computational com-plexity required to represent it.
Many CBIR systems represent region colors by means of histo-grams, so that they can be stored in a simple, intuitive way. Forexample, Ulrich and Nourbakhsh [45] proposed a localizationmethod based on supervisedly acquiring a panoramic view of eachroom of interest in an indoor environment by means of an Omni-cam, where each image was globally characterized by means of 6one-dimensional histograms for the RGB and HLS bands, respec-tively. Sometimes histograms are extracted from relatively lowresolution images, where only a few prominent colors are pre-served to reduce the histograms variability (e.g. [22]). In othercases (e.g. [13]), the histogram x-axis is split into a few color bins.Histograms may be represented in two-dimensional or three-dimensional spaces. Therefore, their main drawback is that they re-quire special metrics to be compared, like L1 or L2 [44]. Besides, ifstored as a whole, this implies that they may present a huge datavolume that makes querying computationally expensive. Also, theytend to be noisy because of the paucity of data. Hence, manyauthors find it necessary to extract only relevant information fromcomplete histograms, thus retaining reduced feature vectors. Someauthors rely on extracting their Color Moments or Color Sets[14,33,49]. Color moments are good descriptors when the analyzedregion presents a dominant color, but this technique provides con-fusing results when applied to mixed color regions. Color Sets canbe adjusted to represent color regions, but they introduce a quan-tization on the original color histograms, thus, they do not adapt tothe characteristics of any particular colored region.
A typical technique to reduce the dimensionality of data is Prin-cipal Components Analysis (PCA) [40]. PCA involves a mathemati-cal procedure that transforms a number of potentially correlatedvariables into a smaller number of uncorrelated ones called Princi-pal Components (PC). PCA has been already used for visual locali-zation purposes [19]. However, existing PCA based schemes relyon extracting features from the image as a whole (e.g. [34,45]).Hence, the working environment needs to be adequately exploredto acquire a representative enough set of images to grant that PCAworks properly. This approach to localization is mostly related toomnicameras.
In the present work, we propose using PCA to represent the hueof an homogeneous region in a compact, efficient way. Some histo-gram reduction methods rely on progressively decreasing the res-olution of the image to reduce color differences. This approachleads to a significant loss of chromatic information. However, anhomogeneous region histogram tends to be redundant becauseinformation is concentrated in small segments: a single peak,wider or narrower depending on the region nature. (Fig. 3a–e).Therefore, the number of PC to represent such histograms is boundto be low. Consequently, rather than working with the histogramof a whole image, a set of subimages or a lower resolution versionof an image, we rely on performing a rough color segmentationfirst to characterize each of the resulting homogeneous color re-gions by the PCs of their histograms.
According to PCA, the best approximation for a set of N-dimen-sional hue histograms H(h) when projected onto a P-dimensionalsubspace is achieved by the P Principal Components associated tothe P highest eigenvalues of their autocorrelation matrix [40]:
C ¼ 1M
XM
i¼1
Hi�!
Hi�!T ð1Þ

80 C. Urdiales et al. / Image and Vision Computing 28 (2010) 78–91
where superscript T denotes the vector transponse. The N eigenvec-tors f /k
�!gNk¼1 and eigenvalues fkkgN
k¼1 of C are the solutions of:
C � /!k ¼ kk /!
k; k ¼ 1; . . . ;n ð2Þ
The orthogonal basis defined by the first P components, f /k�!gP
k¼1, isused to obtain a P-dimensional feature vector V
!for any new hue
histogram by projection onto the aforementioned orthogonal basis.In order to minimize the representation error, the set of histo-
grams chosen to extract a basis must be representative. Our goalis to achieve the best color representation not for a specific imagebut for any type of picture. Thus, the histograms used to calculatesuch a basis must be representative for any possible hue. It hasbeen experimentally tested that when the basis is extracted fromsets of homogeneous regions existing in real images, results arebiased for specific color ranges. For example, a basis extracted fromprairie images does not provide good results for sea landscapes.Fig. 1 presents an example of this behavior. Fig. 1b has been seg-mented according to the split and merge paradigm using a basisextracted from homogeneous regions in ten sea landscape pictures.The resulting basis represent very well blue shades but dealspoorly with greens and reds. Fig. 1c, however, relies on a basisextracted from representative histograms, which is explainedbelow.
In order to achieve a controlled set of color samples and, conse-quently, a general, representative basis, we extract our basis from aset of Gaussian-shaped histograms covering the whole hue range.These histograms do not correspond to real images but are artifi-cially generated:
HiðhÞ ¼1ffiffiffiffiffiffiffi2pp
ae�ðh�iÞ2
2a2 ; 0 6 i 6 N=n ð3Þ
N being the number of possible hues, n the number of histograms inthe analyzed set and a the deviation of a histogram peak. In this pa-per, the basis is extracted from a set of 16 histograms: N is equal to256, n is equal to 16 and a is equal to 4. We have not used hue ds inour histograms because hues are not pure in real images. Instead,the proposed histograms present a certain overlapping with theirneighbours. Using this base, all hues are efficiently represented byonly 16 histograms.
A hue histogram projected onto the obtained basis can be re-garded as a vector in a P-dimensional space, being P the numberof elements of the basis. P is heuristically chosen so that colorscan be separated in a qualitative correct way but also so that vec-tors can be as short as possible. In all our experiments, P equal to 5provides good results.
One of the main advantages of the proposed color representa-tion is that both, feature vector extraction and segmentation canbe performed at the same process, thus, saving computation time.We propose to segment the image into homogeneous regions,according to the PCA of the region histograms. If the region is wellrepresented by those components, it means that segmentation is
Fig. 1. (a) Original image; segmentation for: (
correct, otherwise, we divide the region further. This segmentationprocess is fully explained in Section 3. Fig. 2b and d shows anexample of segmentation for P equal to 2, 5 and 7, respectively.It can be appreciated that results are poor for P equal to 2, but thatno major improvement is achieved for P equal to 7 with respect toP equal to 5. These results were similar for the rest of the testedimages.
2.2. Color similarity measure
Once a histogram is represented by a vector, the distancebetween two feature vectors, v1 and v2, corresponding to twodifferent regions, can be evaluated as the sine function of theirrelative angle:
dðv1;v2Þ ¼jv1 � v2jjv1j � jv2j
ð4Þ
While the distance between similar homogeneous regions is low,the distance between a non homogeneous region and any otherone—even if they present a similar color combination—tends to behigh. Hence, once non homogeneous regions are either discardedor split into smaller homogeneous ones, any image can be repre-sented by a set of significant color regions.
Orthogonal vectors correspond to very different regions, whileparallel vectors correspond to similar ones. This is an importantadvantage with respect to typical histogram metrics, which arecomputationally more expensive. Fig. 3a–e shows different exam-ples of homogeneous patterns. The distances for a five-dimensionalbasis between the feature vector of Fig. 3a and b–e are 0.0137,0.1851, 0.4316 and 0.9929, respectively, corresponding to anglesof 0.78�, 10.66�, 25.26� and 83.16�. It can be observed that, despitetheir differences, sea patches on (Fig. 3a and b present very similarfeature vectors. The cloud (Fig. 3c) presents an average hue similarto the sea in Fig. 3a, but their texture is different enough to signif-icantly increase their distance. The turquoise cloth in Fig. 3d pre-sents a different hue average, a more delta-like histogram andless overlapping with the histogram in Fig. 3a. Thus, its feature vec-tor and the feature vector of Fig. 3a conform an angle equal to25.56�. Finally, Fig. 3a is perceptually very different from Fig. 3eand it can be observed that they are also very far. It must be notedthat those vectors are not orthogonal. This happens mainly becauseof the representation error derived from using a reduced number ofPCA to approximate the histogram, but also because of minor sim-ilarities in the hue distribution of both regions. It could be statedthat the proposed vectors provide rough information on texture,as there is a higher similarity between sea patches in the previousexperiment.
It is important to note that the proposed angular distance mea-sure can be used to discriminate whether a region is homogeneousor not. When a nonhomogeneous region is compared to any otherone, their angular distances tend to be high. This fact can be used
b) sea basis; and (c) representative basis.

Fig. 2. (a) Original image; segmentation for a representative basis of: (b) 2 vectors; (c) 5 vectors; and (d) 7 vectors.
Fig. 3. Different homogeneous patterns and their color histograms: (a) sea 1; (b) sea 2; (c) blue clouded sky; (d) turquoise cloth; and (e) red frog skin.
C. Urdiales et al. / Image and Vision Computing 28 (2010) 78–91 81
to find the homogeneous regions we use to represent an image, asexplained in Section 3. Fig. 4 shows an example of this fact. Fig. 4band c presents regions 1 and 2, segmented from the original imagein Fig. 4a by means of the pyramid structure proposed in Section 3.Angular distances have been calculated between each of these seg-mented regions and the combination of both (Fig. 4d). Even thoughthe region in Fig. 4d includes a high number of red brick pixels
Fig. 4. (a) Original image; (b) pixels belonging to region 1; (c) pixels belonging to regioregions 1 and 2.
from region 1, their angular distance rises to a value of 0.6952. Thiscorresponds to an angle of 39.8�, thus indicating a dissimilarity be-tween region 1 and the merged one. Similarly, region 2 presents anangular distance of 0.5129 with respect to the merged one (29.4�).Furthermore, when comparing regions 1 and 2 with a non seg-mented sector of the original image, including red brick and bluesky pixels, their distances rise to 0.6230 (35.7�) and 0.5983
n 2; (d) regions 1 and 2 joined together; and (e) rectangular area including part of

82 C. Urdiales et al. / Image and Vision Computing 28 (2010) 78–91
(34.3�), respectively, which are very similar to the previous dis-tance values. In comparison, the distance between region 1 and an-other red brick area has been evaluated to be as low as 0.0267(1.5�). Hence, a non homogeneous region presents high distancevalues to any other, even to those presenting any of the colors con-tained in it.
3. Image representation
After color is properly defined, a graph of the captured imagecan be constructed by segmenting it into homogeneous colorregions: each significant region of the image becomes a node andthe weight of the arc between any pair of nodes is equal to the dis-tance between the centroids of those regions. It is immediate tonote that for any given image, all nodes are connected, either di-rectly or via adjacent nodes. We propose a hierarchical segmenta-tion method to extract a graph from a color image in a straightway. It is necessary to note, though, that our goal is not to achieveprecise segmentation, but to represent the representative color re-gions of an image in a compact way. The method is based on con-structing a linked pyramid over a given image—which becomes thepyramid base—and rearranging the link structure so that each nodeis finally linked to a segmented region.
Image-based graph generation is a widely exploited technique.Classical approaches are based on obtaining regions as different aspossible. A good example of these techniques is the NormalizedCut method [38]. This method relies on the recursive minimizationof a normalized cut measure, which depends on the dissimilaritybetween pixels belonging to different partitions. The main draw-back is that it involves O(n3) operations, which can be reducedby means of a complex mathematical approximation to O(n3/2) +O(n) operations, n being the total number of image pixels for eachpass of the recursive algorithm. If optimization is not required,simpler approaches include the well known quadtree [37], whichrelies on recursively splitting each partition of the image into2 � 2 smaller ones until every existing partition is homogeneous.The main drawback of these methods is that they are based on arigidly structured hierarchy that provokes strong artifacts in theresulting partition, like rough borders or poorly definition of thinregions [10]. In these cases, the segmentation quality can be im-proved by dynamically restructuring the hierarchy. To achieve thisrestructuration, region adjacency must be regarded by the em-ployed hierarchical data structures.
A pyramid is a 3D structure built over an image, which is repre-sented at progressively lower resolution at higher levels of thestructure. A linked pyramid is a pyramid where any node (parent)is linked to lower level nodes that were averaged to generate it(children). These pyramidal structures preserve spatial informationand, hence, they have been widely used to achieve hierarchical seg-mentation [16]. However, methods that use regular pyramids [18]have difficulties in extracting regions of irregular geometries. Tosolve this problem, rearranged linked pyramids were proposed in[7]. These pyramids are processed by using the Adaptive RelinkingPrinciple [18] which allows iterative rearranging of the link struc-ture of a pyramid so that each level of the structure is associated toan irregular partition into homogeneous classes at the base. Thismethod presents some drawbacks. One of them is that it is neces-sary to choose a working level. The number of classes in the result-ing partition is equal to the number of nodes in that level and apostprocessing merging process is required to achieve the correctnumber of classes afterwards. However, the most important draw-back of this algorithm is that class connectivity is not preserved.There have been proposals to avoid this problem, like the IteratedParallel Transformations method (IPT) [30]. However, it has beenreported that this approach does not necessarily lead to connected
regions [15] because the compatibility of relinking operations can-not be locally described. Some methods employ irregular pyramids[4,42] to avoid nodes related to non connected regions. However,they are strongly affected by local decisions. Fuzzy c-means clus-tering algorithms [8] avoid such premature decisions, but they in-volve a slow iterative process.
We propose a new algorithm derived from the 3D hierarchicalstructure proposed in [7]. It differs from adaptively stabilized con-ventional linked pyramids because: (i) it is not recursive; (ii) nodesare always linked to connected regions; (iii) we work with thewhole pyramid rather than supervisedly choosing a working level;(iv) we work in a top-down way, rather than in a bottom-up one;and (v) our pyramid is not complete, as some nodes are removedfrom the structure.
3.1. Pyramid generation
In order to build the proposed structure, we associate the fol-lowing parameters to each node at level l, (x,y, l):
� Hue, saturation and illumination, H(x,y, l), S(x,y, l) and I(x,y, l):are equal to the average of the hue, saturation and illuminationof the region of pixels at the base linked to node (x,y, l), whichare called its children. These values are only propagated upthe pyramid for calculation purposes, but are not used to char-acterize the node.
� Chromaticity, CHR(x,y, l): If S(x,y, l) is over a saturation thresholdSth and I(x,y, l) is within an illumination interval [Ith1, Ith2],CHR(-x,y, l) is set to 1, otherwise it is set to 0. The concept of achroma-ticity is well known in computer vision: if an scene is poorlyilluminated or saturated or if there is too much light, colorscan not be appreciated. Consequently, any algorithm based oncolors like the proposed one is not valid for achromatic regions.
� Color homogeneity, CH(x,y, l): If the children of node (x,y, l) pres-ent an homogeneous color, CH(x,y, l) is equal to 1. Otherwise it isequal to 0.
� Color, C(x,y, l): If CH(x,y, l) and CHR(x,y, l) are both equal to 1,C(x,y, l) is equal to the hue vector resulting from projecting thecolor histogram of (x,y, l) children at the base onto the basis cal-culated in the previous section. Otherwise, it has no value.C(x,y, l) is used to characterize graph nodes.
� Area, A(x,y, l): The area of a node is equal to the sum of the areasof its children at the level below.
� Bounding Box, BB(x,y, l): The bounding box of a node is equal tothe bounding box of the region conformed by its children at thebase. This parameter is important to deal with segmentationerrors for querying.
� Parent link, (X,Y)(x,y,l): If a node is homogeneous, its position isadded to the parent link field of all its children in the levelbelow.
To generate the structure, starting with the input image as the base(level 0), for each set of 2 � 2 nodes at level l � 1, a node is createdat level l immediately above and linked to these 2 � 2 nodes (chil-dren). This process continues until a level presents no further 2 � 2node sets. When the process is finished, each level is a subsampledversion of the level below. During the generation process, thehomogeneity parameter CH is not calculated yet. Fig. 5 shows avery simple example of structure generation and parameter calcu-lation for a black and white image. Two nodes at level l (l = 1) havebeen built over a base of two 2 � 2 pixel sets (l = 0). C(x,y,l) has nosense when histograms present only a few pixels, but it can be eas-ily observed that the H, S and I parameters of the nodes are calcu-lated for the generated nodes by averaging the correspondingvalues of their children. It is immediate to note that the nodemostly linked to white pixels is poorly saturated and, hence, achro-

Fig. 5. Example of node parameter calculation.
C. Urdiales et al. / Image and Vision Computing 28 (2010) 78–91 83
matic. Homogeneity is not calculated in the generation stage, butin this simple example it can be intuitively noted that the graynode would be homogeneous, as it is linked to similar gray chil-dren, but the white one would not, because most its children arewhite and one is gray.
3.2. Pyramid pruning and link rearrangement
The pruning stage relies on the split paradigm. Its goal is to re-move non homogeneous nodes from the structure, and it consistsof the following steps:
(1) Let l = L (top level).(2) For every node (x,y, l) at level l:
� If CHR(x,y, l) is equal to 0, remove (x,y, l) from the struc-ture by setting CH(x,y, l) to 0, as achromatic nodes arenot interesting for color based localization.
� If CHR(x,y, l) is equal to 1, calculate the color distancebetween every two of its four children at level l � 1, cal-culated as in Eq. (4). If any of the calculated distances isover a threshold Colorth, remove (x,y, l) from the structureby setting CH(x,y, l) to 0.
(3) Let l = l � 1. If l > 0, return to step 2.
After this stage, all remaining nodes in the pyramid are homoge-neous and chromatic. Nodes that were linked to a removed parentare called orphan nodes. Regions of pixels at the base linked toorphan nodes provide a first, rough, split-based segmentation.Fig. 6a shows a linked pyramid generated over a 4 � 4 pixels imagesimilar to the one in Fig. 5. During the pruning stage, the only nodeat level 2 disappears because it is not homogeneous (Fig. 6b). Also,two nodes at level 1 are pruned as well (Fig. 6c). However, theresulting partition is clearly suboptimal, as in any algorithmderived from the split paradigm. Hence, a link rearrangement stageis performed. This step is basically a hierarchical top-down mergestage.
The link structure of the pyramid is rearranged in a top-downway for all existing levels. The link structure at any given level lis rearranged in two steps:
(1) Parent search: any orphan node (x,y, l) searches for the parentof a non-orphan neighbour node (x
0,y0, l + 1) such that its dis-
tance to that parent is below threshold Colorth. If such a par-ent is found, the orphan links to it.
(2) Twinning: remaining orphan nodes search for orphan neigh-bours such that their distances are below threshold Colorth.Those nodes are merged into a single one.
After this link rearrangement process is accomplished for all levels,all remaining orphan nodes are linked to irregular homogeneouscolor regions at the base.
After pruning is finished in Fig. 6, level 2 does not exist any-more, so no parent searching stage can be performed at level 1. In-stead, the two remaining nodes at that level are twinned into asingle one (Fig. 6d). At level 0, a parent searching stage is possibleand two nodes find a suitable parent in their neighbourhood(Fig. 6e). The remaining ones simply link to their siblings in the fi-nal twinning stage.
3.3. Graph extraction
After the relinkage stage is accomplished, the graph is alreadyavailable: each orphan node in the structure becomes a graph nodeand every two nodes are related by an arc whose weight is equal tothe Euclidean distance between their centroids. However, for colorbased localization purposes, we remove very small nodes, whichare not globally significant. It can be noted in the example inFig. 6 that only two nodes remain after this final pruning. Fig. 7presents a similar example for a real image (Fig. 7a). Regions linkedto parent nodes after the split and merge stages are presented inFig. 7b and c, respectively. It can be noted that segmentation isnot perfect: the front sticks are merged with the roller coaster inthe background and the most illuminated part of one of the sticksconforms a different region. However, the graph describes the im-age well: there is a sky node on the left connected to wood nodeson the centre and bottom of the image and to a red cloth node onthe right. It can be observed that segmentation does not need to beperfect in order to describe the contents of the image.
The main advantage of working hierarchically in a top-downway is that if a node is labelled as homogeneous, it is not necessary
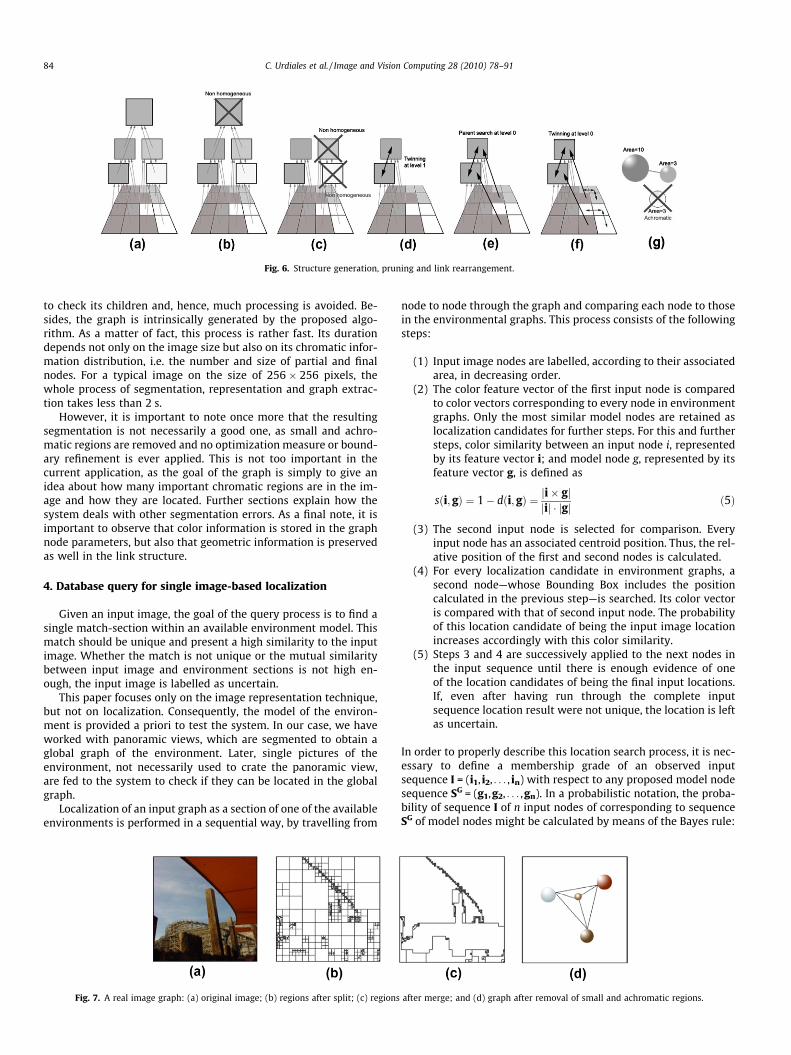
Fig. 6. Structure generation, pruning and link rearrangement.
84 C. Urdiales et al. / Image and Vision Computing 28 (2010) 78–91
to check its children and, hence, much processing is avoided. Be-sides, the graph is intrinsically generated by the proposed algo-rithm. As a matter of fact, this process is rather fast. Its durationdepends not only on the image size but also on its chromatic infor-mation distribution, i.e. the number and size of partial and finalnodes. For a typical image on the size of 256 � 256 pixels, thewhole process of segmentation, representation and graph extrac-tion takes less than 2 s.
However, it is important to note once more that the resultingsegmentation is not necessarily a good one, as small and achro-matic regions are removed and no optimization measure or bound-ary refinement is ever applied. This is not too important in thecurrent application, as the goal of the graph is simply to give anidea about how many important chromatic regions are in the im-age and how they are located. Further sections explain how thesystem deals with other segmentation errors. As a final note, it isimportant to observe that color information is stored in the graphnode parameters, but also that geometric information is preservedas well in the link structure.
4. Database query for single image-based localization
Given an input image, the goal of the query process is to find asingle match-section within an available environment model. Thismatch should be unique and present a high similarity to the inputimage. Whether the match is not unique or the mutual similaritybetween input image and environment sections is not high en-ough, the input image is labelled as uncertain.
This paper focuses only on the image representation technique,but not on localization. Consequently, the model of the environ-ment is provided a priori to test the system. In our case, we haveworked with panoramic views, which are segmented to obtain aglobal graph of the environment. Later, single pictures of theenvironment, not necessarily used to crate the panoramic view,are fed to the system to check if they can be located in the globalgraph.
Localization of an input graph as a section of one of the availableenvironments is performed in a sequential way, by travelling from
Fig. 7. A real image graph: (a) original image; (b) regions after split; (c) regions
node to node through the graph and comparing each node to thosein the environmental graphs. This process consists of the followingsteps:
(1) Input image nodes are labelled, according to their associatedarea, in decreasing order.
(2) The color feature vector of the first input node is comparedto color vectors corresponding to every node in environmentgraphs. Only the most similar model nodes are retained aslocalization candidates for further steps. For this and furthersteps, color similarity between an input node i, representedby its feature vector i; and model node g, represented by itsfeature vector g, is defined as
sði; gÞ ¼ 1� dði;gÞ ¼ ji� gjjij � jgj ð5Þ
(3) The second input node is selected for comparison. Everyinput node has an associated centroid position. Thus, the rel-ative position of the first and second nodes is calculated.
(4) For every localization candidate in environment graphs, asecond node—whose Bounding Box includes the positioncalculated in the previous step—is searched. Its color vectoris compared with that of second input node. The probabilityof this location candidate of being the input image locationincreases accordingly with this color similarity.
(5) Steps 3 and 4 are successively applied to the next nodes inthe input sequence until there is enough evidence of oneof the location candidates of being the final input locations.If, even after having run through the complete inputsequence location result were not unique, the location is leftas uncertain.
In order to properly describe this location search process, it is nec-essary to define a membership grade of an observed inputsequence I = (i1, i2, . . . , in) with respect to any proposed model nodesequence SG = (g1,g2, . . . ,gn). In a probabilistic notation, the proba-bility of sequence I of n input nodes of corresponding to sequenceSG of model nodes might be calculated by means of the Bayes rule:
after merge; and (d) graph after removal of small and achromatic regions.

C. Urdiales et al. / Image and Vision Computing 28 (2010) 78–91 85
PðIjSGÞ ¼ Pði1; i2; . . . ; injg1;g2; . . . ;gnÞ ¼ � � �¼ Pði1jg1Þ � Pðg2jg1Þ � Pði2jg2Þ � � � � � Pðgn�1jgnÞPðinjgnÞ¼ � � � ¼ Pði1jg1Þ � Pði2jg2Þ � � � � � PðinjgnÞ ð6Þ
where terms P(ik—gk) represent the probability of input node ik ofbelonging to model node gk, assuming that events ik are statisticallyindependent. Also, terms P(gk—gk�1) are equal to 1 and all otherP(gk—gl) terms are equal to 0, as long as nodes gk and gk�1 are cho-sen to be correlative in SG.
However, the classical probabilistic notation presents somedrawbacks in this case. In a probabilistic framework, an input nodeis assigned with a set of probabilities of being identified as everymodel node, depending on a hidden random process. Thus, forany input node, membership probabilities should be normalizedover all possible model nodes, so that their sum is equal to 1. Thisframework does not behave well when an input node is an outlier.In such case, low membership grades to all model nodes are desir-able, even though they would not add up to 1. In order to avoid thisproblem, the membership grade of input node i to model node g isunderstood as their mutual color similarity, as defined in step 2,even if the membership grades are not normalized as probabilitiesshould be
fgðiÞ ¼ sði;gÞ ð7Þ
Furthermore, during query a process, global membership gradeshould be evaluated and thresholded at each sequence node, as de-scribed in step 5. If membership grades were defined as Bayesianprobabilities in Eq. (6), different thresholds would be required forpartial sequences of different length.
An attractive alternative to the Bayesian rule is to use a votingstrategy. It can be proven that the maximization of a Bayesianprobability, as defined in Eq. (6), is equivalent to the maximizationof an additive multiple voting rule [23]. Voting schemes have beensuccessfully applied to different pattern recognition applications[21]. In a simple voting scheme, every vote k would be directly pro-portional to the membership grade of input node ik to model nodegk. Thus, the global membership grade of an input sequence oflength j (with j < n) would result in
FjGðIÞ ¼
Xj
k¼0
fgkðikÞ ð8Þ
Although this simple approach may lead to good results, in general,an optimization by means of weighted voting rules can be achieved[28]. In the present work, in order to take advantage of the sequen-tiality of the process, we have chosen a weighted voting schemethat simulates a cumulative probability process with forgettingfactor:
Fig. 8. Global map of an Amsterdam street: (
FjGðIÞ ¼
Xj
k¼1
1
2j�k� fgkðikÞ ð9Þ
When the first input node is analyzed, there might be several modelcandidates for matching. In general, the system can not choose yet aunique localization result: all of them are plausible candidates. Asinformation related with the first node has been already exploited,it decreases its voting weight and the next input node is evaluated.Hence, successive input nodes are used to refine the system deci-sion along the input node sequence, whereas already analyzednodes are slowly forgotten once their contribution has been ac-counted for. The process stops when there is a unique localizationcandidate showing a high global membership grade.
It must be observed that the proposed forgetting structure isable to recover from local observation errors affecting input nodes.If an erroneous input node decreases the global membership grade,successive observations will correct the local error. Some examplesof this process are presented in the next section. This kind of erroris more likely to appear at the beginning than at the end of an inputsequence, because its relative localization precision with respect toa global graph increases with an increasing number of analyzed in-put nodes. However, it must be noted that, if a recognition errorappeared at the first node of a sequence, the localization algorithmwould be subjected to a global error. Nevertheless, the probabilityof such an error is extremely low, because the first node is chosento be the one with the highest chromatic area, and hence, the onewith most significant chromatic information. Furthermore, the riskof a wrong relative position at the first node is not to be considered.These assumptions are supported by the fact that, in the extensivetests presented in Section 5, an error at the first input node wasnever found.
5. Experiments and results
In this section, we present experiments in two different realenvironments: Bruges Grote Markt and an Amsterdam street.These environments have been chosen because they are fairlychromatic, they present significantly different views and, aboveall, because a large image database on both places was available.Pictures from Bruges were captured using a Canon Powershot230 digital camera, whereas Amsterdam images were downloadedfrom the web. Fig. 8a shows a panoramic of the Amsterdam streetand Fig. 8b shows the corresponding global graph. It can immedi-ately be appreciated that it is more efficient to handle the resultinggraph than a mild number of color images. It can also be observedthat achromatic areas of the environment barely generate any node(left side of the street and gray buildings). In too achromatic envi-ronments, color based localization is consequently not possible.
a) complete view; and (b) model graph.

Table 1Experiment results.
Success Error (%) Uncertainty (%)
Bruges 56.6 6.7 36.7Amsterdam 82.1 0 17.9
86 C. Urdiales et al. / Image and Vision Computing 28 (2010) 78–91
The Bruges graph (Brug) is significantly larger than the Amsterdamone (Ams).
The experiments presented here consisted of trying to localize60 random images corresponding to the Brug model and 60 corre-sponding to the Ams one. These test images were not included inthe training set but its content belongs to one of the panoramasat least in an 80% of its area. Capture shifting were freely allowedin both the X and Y axes, but large perspective changes were notbecause, in such case, the structure of the captured graph wouldnot be similar to any part of the stored model. This restriction isusual for this type of localization approach. Similarly, all comparedimages present the same resolution, even though minor scalechanges are allowed, like perspective changes. It must be notedthat illumination changes do not affect the system reliability aslong as the scene does not become achromatic, because color is de-fined in terms of its hue. Similarly, moderate capture noise is notsignificant because the pyramid has a low pass component. Also,the proposed PCA-based feature vector extraction provides alow-pass filtering effect for non systematic noise.
The results for these experiments are briefed in Table 1. In allcases, success means that the system correctly returns the mostsimilar view in the model, which has been qualitatively evaluatedto correspond to the input view. Errors occur when the returnedview does not correspond to the captured image, whereas uncer-tainty means either that there is no similar view in the model orthat there are different views that could correspond to the inputone. In case of uncertainty, the mobile agent could capture a sec-ond view to solve the situation by any usual statistical method likeMarkov or Monte Carlo. However, to test the proposed image rep-resentation system we use a single image for localization tests.
Fig. 9. Several examples
Fig. 9a–d shows some examples of correct retrieval in the Brugenvironment. Each figure presents the input view, its associatedgraph and a black square over its estimated position in the envi-ronment. In the graph, nodes corresponding to non-connected re-gions are not linked by an arc for visualization purposes, eventhough they are used in the process. If there are many unconnectednodes in a graph, it means that a lot of regions have been discarded,either for their size or for their achromaticity. It can be observedthat Fig. 9b and d has been captured in approximately the same po-sition. However, due to slight view differences and capture condi-tions, their topologies are not the same. Specifically, Fig. 9dpresents an extra node related to the central building because ofsegmentation differences and Fig. 9b presents two additional onesrelated to the brown building on the right of the picture, that is notso visible in Fig. 9d. Nevertheless, despite their differences, bothtopologies present basically the same information and, conse-quently, lead to a correct estimation. Fig. 10a–d shows some exam-ples of success in the Ams environment. It can be noted thattopologies do not need to present a large number of nodes for cor-rect localization as long as the information is significant and unam-biguous in the environment. For example, Fig. 10a and bcorresponds to consecutive views and present unconnected nodes.Despite differences in the graphs, they are both correctly identified.
Results of those experiments are briefed in Table 1. It can be ob-served that the error percentages are very low in both cases.Uncertainty, however, is significant in both environments, as someof the houses are similar, and a reliable localization system wouldrequire acquisition of a second view to statistically accumulate evi-dence about the mobile agent position. It can be also observed thatthe error percentage for experiments in Bruges is larger than inAmsterdam. This happens because the studied environment is lar-ger and, consequently, there are more similar views. Because ofperspective, segmentation errors and illumination changes, a givenview may yield a lower distance to a similar, yet wrong, one than toits corresponding part of the model. Naturally, the less similarviews in the environment, the less likely this problem occurs. Inthe smaller Amsterdam model, for example, there are no such
of success in Bruges.

Fig. 10. Several examples of success in Amsterdam.
C. Urdiales et al. / Image and Vision Computing 28 (2010) 78–91 87
errors. Fig. 11 shows an example of this behavior. In the Brugesscenario, there are several red buildings, like the one on the rightof the input image. The grey roof and the pale yellow front of thebuilding on the right are achromatic and, hence, do not providemuch information. Capture conditions make the input image inthis example more similar to another location, where a very similarred building had a white one on its right conforming the samestructure. It can be appreciated that the perspective of the build-ings is not the same, but it is necessary to assume these errors ifsome resistance against perspective changes is to be achieved.
For similar reasons, uncertainty is slightly higher in the Brugesscenario. However, the differences are not so significant in thiscase. This happens because the Amsterdam scenario, although lesschromatic than the Bruges one, presents smaller dimensions.Fig. 12 shows two different uncertainty cases in the proposedenvironments. Fig. 12a shows an image which is similar to otherareas in the environment and, hence, the system can not reach adecision. Fig. 12b shows an image that is too achromatic, yieldinga single blue node corresponding to the cloth in the bottom leftpart of the building. Again, without further information, the systemcan not find a single match.
It is interesting to point out that no images from Bruges werelocalized in the Amsterdam environment and viceversa. Thishappens simply because both environments are quite different,but if more similar scenarios were used or the number of availablemodels were too large, similar regions in two different environ-ments could be confused, as occurred with similar regions withinthe same environment. This has been tested by introducing differ-ent scenarios corresponding to other Amsterdam streets. Eventhough the success rate was still high, more errors were detected.This problem could also be solved by statistical accumulation ofevidence.
In the last years, a strong effort has been performed to developcomparison tools among image retrieval systems. Unfortunately, itis difficult to fairly compare several retrieval systems. Someauthors propose the use of standard image databases for compar-
ison [17]. However, every retrieval system is composed by a localor global feature extraction method and an image retrieval strat-egy. Thus, the reliability of every proposed retrieval system de-pends on the efficiency of the feature extraction method, on thereliability of the retrieval strategy, and on how well they adaptto each other. One of the most complete comparison studies, per-formed by Mikolajczyk and Schmid [27], focuses on isolating thelocal features’ representativeness and evaluating their perfor-mance on retrieving image regions with the help of an standardimage database. In [27], comparison is based on Recall and(1 � Precision) figures are defined as follows:
Recall ¼ #correct matches#correspondences
ð10Þ
ð1� PrecisionÞ ¼ #false matches#correct matchesþ#false matches
ð11Þ
#correspondences being the number of corresponding regions be-tween input regions and database images of the same scene. Forthe evaluation of these figures, it is necessary to define a retrievalstrategy for image regions. As the final result depends on the com-bination of local features extraction and retrieval methods, it is notpossible to select an standard retrieval system for comparison pur-poses. In [27], several retrieval strategies were selected, each ap-plied to all considered feature extraction methods. Results werepresented in graphical form, showing Recall versus (1 � Precision).
In our work, feature description and retrieval strategy arestrongly related. Therefore, we have calculated Recall as well as(1 � Precision) figures for the complete system at different scenar-ios. Although test conditions are not exactly the same than those in[27], they can give a rough estimation of the proposed systembehavior when compared with other retrieval systems. Recall and(1 � Precision) results are presented in Table 2.
It can be observed that, while the proposed system presentssimilar Recall values than those compared in [27], its Precision re-sults are significantly better. The reason is that the proposed sys-tem focusses on granting localization reliability: it is not as

Fig. 11. Typical localization errors.
88 C. Urdiales et al. / Image and Vision Computing 28 (2010) 78–91
important to always get a match as to avoid false matches thatwould lead to a wrong localization. This goal is widely supportedby a global Precision value over 90%. Nevertheless, a queryresulting in uncertainty, is not a critical problem, because the sys-tem can always slightly change the input image and repeat thequery.
Fig. 12. Uncertainty examples: (a) the image is too achromatic to yield enough informa
Further tests have been performed to check the proposed sys-tem robustness against partial occlusions. In this case, inputimages have been corrupted with the addition of synthetic objects,whether colored or neutral. Neutral objects occlude some featuredescriptors of the input image, thus erasing some nodes of itsgraph. Colored objects alter this graph by including additional
tion; (b) the resulting graph might correspond to different areas of the global map.

Table 2Results expressed in terms of Recall and (1 � Precision).
Recall (1 � Precision)
Bruges 0.57 0.11Amsterdam 0.82 0Global 0.64 0.07
C. Urdiales et al. / Image and Vision Computing 28 (2010) 78–91 89
nodes which could lead to retrieval mistakes. Results for someexamples of such tests are presented in Figs. 13–15.
Fig. 13 presents two small colored occlusions and a black one. Inthis case, the black rectangle on the bottom right corner of the in-put image (Fig. 13a) changes the original graph only marginally,because it does not add any new chromatic information and it onlypartially occludes original segmented regions (Fig. 13b). The blueand green patches in Fig. 13a generate two new nodes in the graph(Fig. 13c) with small associated areas. When this image is fed to thesystem, it can easily recover from these small deviations due to theinclusion of a forgetting factor at the voting scheme, as observed inFig. 13d.
Example 2 in Fig. 14a presents a case where occlusive patcheshave been filled with similar hue values than the segmented re-gions in the original image. In this case, the red and yellow circleshave been added to original nodes (Fig. 14c), thus displacing themfrom their original positions. While the green rectangle constitutesa bigger new node by itself. It can be observed in Fig. 14d how thesystem retrieves a correct result. Similarly, the inclusion of an iso-lated new node is not critical for the final result, while slight nodes
Fig. 13. Occlusion example 1: (a) altered image; (b) segmenta
Fig. 14. Occlusion example 2: (a) altered image; (b) segmenta
displacements are tolerated by the graph structure as perspectivechanges were.
Finally, a more dramatic example has been tested (Fig. 15). Inthis case, a big achromatic patch covers the central area of the ori-ginal image (Fig. 15a) and it is clearly visible after segmentation(Fig. 15b): all nodes of the bottom central area are missing at theresulting graph (Fig. 15c). To further complicate this example,two extra green and blue patches have been added, each one ofthem constituting an extra small node by itself. The query processruns through the available input nodes, as described in Section 4.As long as most of the input nodes are correctly located and pres-ent coherent node descriptors with respect to its correspondingpanorama location, the system can recover the original location(Fig. 15d). If there are still enough correctly segmented nodes,missing nodes are ignored. Furthermore, thanks to the commentedforgetting factor, even in this case, where a small quantity of falsenodes are present at the input image, the final result is correct.
6. Conclusions and future work
This paper has presented a new method to represent an imageby means of a graph of homogeneous color regions for localizationpurposes. The method presents several novelties. First, a new colorfeature vector is extracted from the hue histogram of a pixel regionby means of Principal Components Analysis. These vectors arecompact, resistant against noise, illumination changes and micro-textures and, above all, can be compared in a simple, straightway. Also, a new 3D structure is proposed to accomplish split
tion; (c) resulting graph; and (d) system proposed match.
tion; (c) resulting graph; and (d) system proposed match.

Fig. 15. Occlusion example 3: (a) altered image; (b) segmentation; (c) resulting graph; and (d) system proposed match.
90 C. Urdiales et al. / Image and Vision Computing 28 (2010) 78–91
and merge based segmentation in a fast, hierarchical top-downway. After segmentation, the structure implicitly provides a graphwhere nodes corresponding to homogeneous regions are repre-sented by the proposed color vector and the geometric relation-ships between regions are preserved.
The efficiency of the proposed method has been tested byimplementing a simple localization algorithm based on votingschemes. The input to the algorithm is an image that belongs toan a priori available environment and the output is the locationof the image within the environment. The error rate of the methodis very low. However, a significant part of the tested images yieldto uncertainty. Consequently, a new, more complex localizationalgorithm would be desired to disambiguate data by accumulatinginformation. Similarly, it would be necessary to develop a simulta-neous localization and map building strategy rather than providingpanoramic environment images a priori. In this case, representedimages would be related to a physical location and displacementinformation would need to be used to establish relationshipsamong them. In a Markovian framework, each image graph wouldbecome a state and transition between consecutive images wouldprovide localization.
The main drawback of the proposed system is that it is not validfor achromatic environments, where color information is scarce. Itmust be noted that, given that the environment contains chromaticinformation, the proposed system has shown to be resistant to ad-verse test conditions, such us partial occlusions.
Results have been presented in terms of standard reliabilitymeasures, to allow comparison with other existing methods. Itmust be noted that results in [27] are averaged over large dat-abases, while the proposed one has been tested over 100 images.It would be interesting to perform massive tests with larger andmultiple scenarios. In such framework, the proposed system wouldprobably reduce its Recall results while keeping similar Precisionfigures, because a larger number of possible matches would onlyincrease the number of Uncertainty results, while keeping reliabil-ity of positive matches.
Acknowledgement
This work has been partially supported by the spanish Junta deAndalucia, Project No. TIC249 (SIAMA).
References
[1] G. Aggarwal, P. Dubey, S. Ghosal, A. Kulshreshtha, A. Sarkar, ipure: Perceptualand user-friendly retrieval of images, in: Proc. of IEEE Conf. on Multimedia andExposition (ICME 2000), 2000.
[2] D.G. Aliaga, I. Carlbom, Finding Yourself: fiducial planning for error-boundedpose estimation of a panoramic camera in large environments, IEEE Roboticsand Automation Magazine 11 (4) (2004) 53–61.
[3] S. Atiya, G.D. Hager, Real-time vision-based robot localization, IEEETransactions on Robotics and Automation 9 (6) (1993) 785–800.
[4] S. Baronti, A. Casini, F. Lotti, L. Favaro, V. Roberto, Variable pyramid structurefor image segmentation, Computer Vision Graphics and Image Processing 49(1990) 346–356.
[5] A. Berman, L. Shapiro, A flexible image database system for content-basedretrieval, Computer Vision and Image Understanding 75 (1/2) (1999) 175–195.
[6] J. Borenstein, H.R. Everett, L. Feng, Navigating Mobile Robots, A.K. Peters Ltd.,Wesley, MA, 1996.
[7] P.J. Burt, T. Hong, A. Rosenfeld, Segmentation and estimation of image regionproperties through cooperative hierarchical computation, IEEE Transactions onSystems, Man and Cybernetics 11 (12) (1981) 802–809.
[8] R.L. Cannon, R.L. Dave, J.C. Bezdek, Efficient implementation of fuzzy c-meansclustering algorithm, IEEE Transactions on Pattern Analysis and MachineIntelligence 8 (2) (1986) 248–255.
[9] C. Carson, M. Thomas, S. Belongie, J.M. Hellerstein, J. Malik, Blobworld: asystem for region-based image indexing and retrieval, in: Proc. of Int. Conf.Visual Information Systems, 1999.
[10] K.J. Cho, P. Meer, Image segmentation from consensus information, ComputerVision and Image Understanding 68 (1) (1997) 72–89.
[11] H.I. Christensen, N.O.S. Kirkeby, S. Kristensen, L.F. Knudsen, E. Granum, Model-driven vision for in-door navigation, Robotics and Autonomous Systems 12(1994) 199–207.
[12] D. Cobzas, H. Zhang, M. Jagersand, Image-based localization with depth-enhanced image map, in: Proc. of IEEE International Conference on Roboticsand Automation (ICRA 2003), Taiwan, 2003.
[13] I.J. Cox, M.L. Miller, T.P. Minka, T. Papathomas, P.-N. Yianilos, The Bayesianimage retrieval system, PicHunter: theory, implementation andpsychophysical experiments, IEEE Transactions on Image Processing 9 (1)(2000) 20–37.
[14] A. Diplaros, T. Gevers, I. Patras, Combining color and shape information forillumination-viewpoint invariant object recognition, IEEE Transactions onImage Processing 15 (1) (2006) 1–11.
[15] R. Glantz, W.G. Kropatsch, Guided relinking of graph pyramids, in: Joint IAPRInternational Workshops on SSPR’2000 and SPR’2000, 2000, pp. 367–376.
[16] R.M. Haralick, L.G. Shapiro, Computer and Robot Vision, Addison-Wesley, NewYork, 1992.
[17] I.H. Jermyn, C.W. Shaffrey, N.G. Kingsbury, Evaluation methodologies for imageretrieval systems, in: Proc. Advanced Concepts for Intelligent Vision SystemsACIVS2002, Ghent University, Belgium, September, 2002.
[18] J.M. Jolion, A. Rosenfeld, A Pyramid Framework for Early Vision:Multiresolution Computer Vision, Kluwer Academic Publishers, New York,1994.
[19] B. Krose, N. Vlassis, R. Bunschoten, Y. Motomura, A probabilistic model forappearance-based robot localization, Image and Vision Computing 19 (6)(2001) 381–391.
[20] B. Krose, R. Bunschoten, Probabilistic localization by appearance models andactive vision, in: Proc. of the International Conference on Robotics &Automation (ICRA), 1999.
[21] L. Lam, C.Y. Suen, Application of majority voting to pattern recognition: ananalysis of its behavior and performance, IEEE Transactions on Man andCybernetics 27 (5) (1997) 553–568.
[22] Z. Li, O.R. Zayane, Z. Tauber, Illumination invariance and object model incontent-based image and video retrieval, Journal of Visual Communication andImage Representation 10 (1999) 219 244.
[23] X. Lin, S. Yacoub, J. Burns, S. Simske, Performance analysis of pattern classifiercombination by plurality voting, Pattern Recognition Letters 24 (12) (2003)1959–1969.

C. Urdiales et al. / Image and Vision Computing 28 (2010) 78–91 91
[24] T. Mäenpää, M. Pietikäinen, Texture analysis with local binary patterns, in:C.H. Chen, P.S.P. Wang (Eds.), Handbook of Pattern Recognition andComputer Vision, third ed., World Scientific, Singapore, 2004.
[25] J. Mallon, O. Ghita, P.F. Whelan, Robust 3-D landmark tracking using trinocularvision, OPTO-Ireland: SPIE’s Regional Meeting on Optoelectronics, Photonicsand Imaging, Galway, 2002.
[26] K. Mikolajczyk, C. Schmid, An affine invariant interest point detector, in: Proc.Seventh European Conf. Computer Vision, Copenhagen, Denmark, 2002, pp.128–142.
[27] K. Mikolajczyk, C. Schmid, A performance evaluation of local descriptors, IEEETransactions on Pattern Analysis and Machine Intelligence 27 (10) (2005)1615–1630.
[28] X. Mu, M. Hassoun, P. Watta, A weighted voting and sequential combination ofclassifiers scheme for human face recognition, in: Proc. of the Int. Conf. onComputer Vision and Pattern Recognition (CVPR 2005), San Diego, CA, 2005.
[29] S. Mukherjea, K. Hirata, Y. Hara, Amore: a world wide web image retrievalengine, The WWW Journal 2 (3) (1999) 115–132.
[30] P.F.M. Nacken, Image segmentation by connectivity preserving relinking inhierarchical graph structures, Pattern Recognition 28 (6) (1995) 907–920.
[31] M. Ortega, Y. Rui, K. Chakrabarti, S. Mehrotra, T.S. Huang, Supporting similarityqueries in MARS, in: Proc. of the 5th ACM Int. Multimedia Conf., Seattle,Washington, 1997, pp. 403–413.
[32] J.M. Porta, J.J. Verbeek, B.J.A. Krse, Active appearance-based robot localizationusing stereo vision, Autonomous Robots 18 (1) (2005) 59–80.
[33] Y. Rui, T.S. Huang, S. Chang, Image retrieval: current techniques, promisingdirections and open issues, Journal of Visual Communication and ImageRepresentation 10 (1) (1999) 123.
[34] S. Sclaroff, L. Taycher, M. La Cascia, Imagerover: a content-based imagebrowser for the world wide web, in: Proc. of IEEE Workshop on Content-basedAccess of Image and Video Libraries, 1997.
[35] S. Se, D. Lowe, J. Little, Local and global localization for mobile robots usingvisual landmarks, in: Proc. of the IEEE/RSJ International Conference onIntelligent Robots and Systems (IROS), Maui, Hawaii, October 2001, pp. 414–420.
[36] S. Se, D.G. Lowe, J. Little, Mobile robot localization and mapping withuncertainty using scale-invariant visual landmarks, International Journal ofRobotics Research 21 (8) (2002) 735–758.
[37] C.A. Shaffer, H. Samet, Optimal Quadtree construction algorithms, ComputerVision Graphics and Image Processing 37 (3) (1987) 402–419.
[38] J. Shi, J. Malik, Normalized cuts and image segmentation, IEEE Transactions onPattern Analysis and Machine Intelligence 22 (8) (2000) 888–905.
[39] R. Sim, G. Dudek, Comparing image-based localization methods, in: Proc. of Int.Joint Conf. on Artificial Intelligence (IJCAI), Acapulco, Mexico, 2003, 6 pp.
[40] L. Sirovich, R. Everson, Analysis and management of large scientific databases,International Journal Supercomputing Applications and High PerformanceComputing 6 (1) (1992) 50–68.
[41] G.N. de Souza, A.C. Kak, Vision for mobile robot navigation: a survey,Transactions on Pattern Analysis and Machine Intelligence 24 (2) (2002)237–267.
[42] M. Spann, C. Horne, Image segmentation using a dynamic thresholdingpyramid, Pattern Recognition 22 (1989) 719–732.
[43] M.J. Swain, C. Frankel, V. Athitsos, WebSeer: an image search engine for theworld wide web, Technical Report TR-96-14, Dept. of Computer Science,University of Chicago, 1996.
[44] M. Swain, D. Ballard, Color indexing, International Journal of Computer Vision7 (1) (1991) 11–32.
[45] I. Ulrich, I. Nourbakhsh, Appearance-based place recognition for topologicallocalization, in: IEEE International Conference on Robotics and Automation,San Francisco, CA, 2000, pp. 1023–1029.
[46] J. Vendrig, M. Worring, A.W.M. Smeulders, Filter image browsing, Exploitinginteraction in image retrieval, in: D.P. Huijsmans, A.W.M. Smeulders (Eds.),Visual Information and Information Systems, Lecture Notes in ComputerScience, vol. 1614, Springer, Berlin, 1999, pp. 229–236.
[47] S. Volmer, Tracing images in large databases by comparison of waveletfingerprints, in: Proc. of the 2nd Int. Conf. on Visual Information Systems, SanDiego, 1997, pp. 163–172.
[48] J. Wolf, W. Burgard, H. Burkhardt, Using an image retrieval system for vision-based mobile robot localization, in: Proc. of the International Conference onImage and Video Retrieval (CIVR), 2002.
[49] P. Zingaretti, E. Frontoni, Appearance based robotics, IEEE Robotics &Automation Magazine 13 (1) (2006) 59–68.