A New Analytical Bench Assay for the Determination of Arylsulfatase A Activity Toward...
9
A New Analytical Bench Assay for the Determination of Arylsulfatase A Activity Toward Galactosyl-3-Sulfate Ceramide: Implication for Metachromatic Leukodystrophy Diagnosis Francesco Morena, † Ilaria di Girolamo, † Carla Emiliani, † Angela Gritti, ‡ Alessandra Biffi, ‡ and Sabata Martino* ,† † Department of Experimental Medicine and Biochemical Science, Section of Biochemistry and Molecular Biology, University of Perugia, Via del Giochetto, 06126 Perugia, Italy ‡ San Raffaele Scientific Institute, San Raffaele Telethon Institute for Gene Therapy, Milano, via Olgettina 58, 20132 Milano, Italy * S Supporting Information ABSTRACT: Here, we present the design and validation of a new assay for the diagnosis of metachromatic leukodystrophy. The method is highly specific, simple, reproducible, and straightforward. In our spectrophotometric method, the determination of arylsulfatase A (ARSA) activity toward the natural substrate, galactosyl-3-sulfate ceramide (or sulfatide), is performed using neat sulfatide without chemical modification. This confers to the assay high analytical specificity. The hydrolyzed sulfatide is monitored upon inclusion of the colorimetric reagent Azure A. The nonhydrolyzed sulfatide-Azure A is recovered and measured at a wavelength of λ = 650 nm. Thus, ARSA activity toward the sulfatide is obtained by subtracting the nonhydrolyzed sulfatide from the total sulfatide used in the enzyme reaction (sulfatide-Azure A present in a parallel assay performed in the absence of ARSA). Within a clinical context, our method definitely discriminated between healthy subject samples and metachromatic leukodystrophy patient samples, and, therefore, it is suitable for diagnostic applications and for monitoring the efficacy of therapeutic treatments in patients or animal models. M etachromatic leukodystrophy (MLD) (Omim No. 250100) is a rare inherited autosomal recessive lysosomal storage disorder caused by the deficiency of arylsulfatase A (ARSA) (EC.3.1.6.8). ARSA catalyzes the first step in the degradation pathway of galactosyl-3-sulfate ceramide (alias: cerebroside sulfate or sulfatide), which is one of the major membrane lipids of myelin sheaths. Because of the abolishment of ARSA activity, the desulfation reaction does not occur and the undegraded cerobroside sulfate accumulates in the lysosomes, leading to a progressive demyelination of the nervous system of patients. Death occurs within a few years from the onset of symptoms. 1−3 Currently, a therapeutic option for patients with late infantile MLD is a Phase I−II clinical trial based on the bone marrow transplantation of hematopoietic stem cell transduced with the lentiviral vector to transfer a functional ARSA 4 and a Phase I−II enzyme replacement therapy trial to evaluate the efficacy of the rhARSA administration in MLD patients. 5 MLD diagnosis is performed by either the biochemical evaluation of the absence of the enzymatic activity 6,7 or by molecular characterization of the ARSA gene through complete sequencing of the coding region. 8 Currently, ARSA activity is measured through a variety of biochemical assays based on radiolabeled sulfatide 9−11 or fluorogenic derivatives 12−15 or on fluorogenic/colorimetric artificial substrates. 16−18 Notwithstanding their specificity, radiolabeled- and fluoro- genic-sulfatide-based assays require several steps prior to the final detection, thus compromising the assay reproducibility and accuracy. 9−11,13 Of note, accuracy could be also prejudiced by the need to synthesize the radiolabeled sulfatide, since both the 35 S-radiolabeled sulfatide 19 and the 14 C-radiolabeled sulfatide 20 are not generally commercially available. Preparation proce- dures are tedious, time-consuming, and necessitate either a relatively large amounts of radioactivity to yield a high-quality product or a moderately large amounts of protein as source of enzyme activity, raising major sensitivity issues in light of the limited availability of specimens from patients, particularly if in the pediatric age. More recently, electrospray ionization (ESI) mass spectrom- etry assay for the determination of the hydrolysis of sulfatide by ARSA has been developed. 21 The assay is sensitive and highly specific; although similar to the above-mentioned methods, requires specialized laboratory analyses to be carried out, thereby limiting its application potential. Received: July 30, 2013 Accepted: December 2, 2013 Published: December 2, 2013 Article pubs.acs.org/ac © 2013 American Chemical Society 473 dx.doi.org/10.1021/ac4023555 | Anal. Chem. 2014, 86, 473−481
-
Upload
independent -
Category
Documents
-
view
0 -
download
0
Transcript of A New Analytical Bench Assay for the Determination of Arylsulfatase A Activity Toward...
A New Analytical Bench Assay for the Determination of ArylsulfataseA Activity Toward Galactosyl-3-Sulfate Ceramide: Implication forMetachromatic Leukodystrophy DiagnosisFrancesco Morena,† Ilaria di Girolamo,† Carla Emiliani,† Angela Gritti,‡ Alessandra Biffi,‡
and Sabata Martino*,†
†Department of Experimental Medicine and Biochemical Science, Section of Biochemistry and Molecular Biology, University ofPerugia, Via del Giochetto, 06126 Perugia, Italy‡San Raffaele Scientific Institute, San Raffaele Telethon Institute for Gene Therapy, Milano, via Olgettina 58, 20132 Milano, Italy
*S Supporting Information
ABSTRACT: Here, we present the design and validation of a newassay for the diagnosis of metachromatic leukodystrophy. Themethod is highly specific, simple, reproducible, and straightforward.In our spectrophotometric method, the determination of arylsulfataseA (ARSA) activity toward the natural substrate, galactosyl-3-sulfateceramide (or sulfatide), is performed using neat sulfatide withoutchemical modification. This confers to the assay high analyticalspecificity. The hydrolyzed sulfatide is monitored upon inclusion ofthe colorimetric reagent Azure A. The nonhydrolyzed sulfatide-AzureA is recovered and measured at a wavelength of λ = 650 nm. Thus,ARSA activity toward the sulfatide is obtained by subtracting the nonhydrolyzed sulfatide from the total sulfatide used in theenzyme reaction (sulfatide-Azure A present in a parallel assay performed in the absence of ARSA). Within a clinical context, ourmethod definitely discriminated between healthy subject samples and metachromatic leukodystrophy patient samples, and,therefore, it is suitable for diagnostic applications and for monitoring the efficacy of therapeutic treatments in patients or animalmodels.
Metachromatic leukodystrophy (MLD) (Omim No.250100) is a rare inherited autosomal recessive
lysosomal storage disorder caused by the deficiency ofarylsulfatase A (ARSA) (EC.3.1.6.8). ARSA catalyzes the firststep in the degradation pathway of galactosyl-3-sulfate ceramide(alias: cerebroside sulfate or sulfatide), which is one of themajor membrane lipids of myelin sheaths. Because of theabolishment of ARSA activity, the desulfation reaction does notoccur and the undegraded cerobroside sulfate accumulates inthe lysosomes, leading to a progressive demyelination of thenervous system of patients. Death occurs within a few yearsfrom the onset of symptoms.1−3 Currently, a therapeutic optionfor patients with late infantile MLD is a Phase I−II clinical trialbased on the bone marrow transplantation of hematopoieticstem cell transduced with the lentiviral vector to transfer afunctional ARSA4 and a Phase I−II enzyme replacementtherapy trial to evaluate the efficacy of the rhARSAadministration in MLD patients.5
MLD diagnosis is performed by either the biochemicalevaluation of the absence of the enzymatic activity6,7 or bymolecular characterization of the ARSA gene through completesequencing of the coding region.8
Currently, ARSA activity is measured through a variety ofbiochemical assays based on radiolabeled sulfatide9−11 or
fluorogenic derivatives12−15 or on fluorogenic/colorimetricartificial substrates.16−18
Notwithstanding their specificity, radiolabeled- and fluoro-genic-sulfatide-based assays require several steps prior to thefinal detection, thus compromising the assay reproducibility andaccuracy.9−11,13 Of note, accuracy could be also prejudiced bythe need to synthesize the radiolabeled sulfatide, since both the35S-radiolabeled sulfatide19 and the 14C-radiolabeled sulfatide20
are not generally commercially available. Preparation proce-dures are tedious, time-consuming, and necessitate either arelatively large amounts of radioactivity to yield a high-qualityproduct or a moderately large amounts of protein as source ofenzyme activity, raising major sensitivity issues in light of thelimited availability of specimens from patients, particularly if inthe pediatric age.More recently, electrospray ionization (ESI) mass spectrom-
etry assay for the determination of the hydrolysis of sulfatide byARSA has been developed.21 The assay is sensitive and highlyspecific; although similar to the above-mentioned methods,requires specialized laboratory analyses to be carried out,thereby limiting its application potential.
Received: July 30, 2013Accepted: December 2, 2013Published: December 2, 2013
Article
pubs.acs.org/ac
© 2013 American Chemical Society 473 dx.doi.org/10.1021/ac4023555 | Anal. Chem. 2014, 86, 473−481
Thus, there is a need for a more suitable and easy method tomonitor the ARSA activity toward the cerebroside sulfate, evenin small amounts of cell or tissue protein extracts.Here, we report the design and validation of a new
spectrophotometric assay for the determination of ARSAactivity toward the hydrolysis of the natural cerebroside sulfate.The assay is very specific, reproducible, highly sensitive, andsimple, such that it can be performed in all laboratories.Moreover, this method is the first colorimetric bench assay
that uses neat sulfatide without chemical modifications and iscapable of measuring the ARSA activity toward the sulfatidedirectly, using a spectrophotometer at λ = 650 nm.
■ EXPERIMENTAL SECTION
Sulfatide and Azure A Preparation. Sulfatide (Matreya≥98% TLC, bovine) was dissolved in a 2:1:0.1 chloroform:me-thanol:water mixture and dried at room temperature overnight,after which time it was redissolved in Buffer A (100 μL ofdimethyl sulfoxide (DMSO) and ARSA enzymatic buffer (100mM sodium acetate/acetic acid, pH 4.5) containing 20 mMMnCl2 and taurodeoxycholate (100 μg/50 μL)) to a finalconcentration of 5 mM.Azure A was dissolved in 95 mL of distilled water and 5 mL
of 50 mN sulfuric acid. The dye solution was stored in a darkbottle and was stable for at least 10 days.22
Preparation of Standard and Quality Control. Azure ACalibration Curve. A series of working standards were obtainedfrom the stock standards (100 mg and 80 mg of Azure Adissolved in 47.5 mL distilled water and 2.5 mL of 50 mNsulfuric acid) by serial dilution with the same buffer over therange of 5−100 mg. An amount of 0.17 mL of dye solutionAzure A22 was added to 0.85 mL of a 1:1 chloroform:methanolmixture and 0.85 mL of 50 mN H2SO4. The mixture was mixedby inversion, tubes were centrifuged at 300g for 10 min at roomtemperature, and absorbance of the lower phase was measuredat a wavelength of λ = 650 nm on a Microplate Reader (ModelGDV-DV-990BV6). The calibration curve was constructedusing different concentrations of Azure A (five replicates ofeach concentration). The absorbance at λ = 650 nm wasplotted against the corresponding dye concentration. Linearregression analysis using GraphPad was used to generate thestandard curves.The quality control (QC) samples (blank Azure A) used in
both the validation study and each experimental run wereprepared in the same manner as the calibration standards toobtain final concentrations of 0.4 mg/mL.Sulfatide Calibration Curve. A series of working standards
were obtained from the stock standards of sulfatide (83.3 and66.6 nmol) by serial dilution with Buffer A over the range of0.52−83.3 nmol. Fifty microliters (50 μL) of a solution createdby mixing an equal volume of Buffer A with the above amountof sulfatide in Buffer A (25 μL + 25 μL, respectively) was addedto 0.85 mL of a 1:1 chloroform:methanol, 0.85 mL of 50 mNH2SO4, and 0.17 mL of dye solution Azure A (finalconcentration of 0.4 mg/mL).22 After shaking, tubes werecentrifuged at 300g for 10 min at room temperature; the upperphase and the lower phase (containing the sulfatide-Azure A[sulfatide-AA]) were measured at λ = 650 nm on a MicroplateReader (Model GDV-DV-990BV6).Calibration curve was constructed using different concen-
trations of sulfatide, five replicates of each concentration. Theabsorbance at λ = 650 nm was plotted against the
corresponding concentration. Linear regression analysis usingGraphPad was used to generate the standard curve.The QC samples (blank sulfatide-AA) used in both the
validation study and each experimental run of the study wereprepared in the same manner as the calibration standards toobtain final concentrations of 21 nmol.
Optimum pH. The optimum pH was evaluated using 0.012mU ARSA in the presence of sulfatide (21 nmol) at differentpH values: 3.0, 3.5, 4.0, 4.25, 4.5, 5.0, 5.5, and 6.0. Reactionswere carried out at different times of incubation at 37 °C (seethe Results section for details). Results were expressed as themean of five independent experiments each in triplicate.
Optimal Time of Incubation. We determined the optimalreaction time by plotting a curve of the rate of sulfatidehydrolyzed by a series of fixed ARSA mU (0.0015, 0.003, 0.006,0.012, 0.024, 0.048 mU) at different times of incubation: 6, 12,18, 24, and 36 h.Results were expressed as the mean of five independent
experiments, each of which was performed in triplicate.Determination of Km,Vmax, and Kcat. Km and Vmax were
determined by the Lineweaver−Burk method.23 Kcat and Kcat/Km were deduced by the Michaelis−Menten equation (seedetails in the Supporting Information). The kinetic parameterswere defined using the following concentrations of sulfatide:0.052, 0.104, 0.208, 0.312, 0.416, 0.500, 0.625, 0.750, and 0.833mM (corresponding to 2.5, 5, 10, 15, 20, 25, 31, 37.5, and 41.6nmol of sulfatide, respectively).We performed enzymatic reactions using 0.012 mU from
purified ARSA incubated for 18 h at 37 °C. Results wereexpressed as the mean of five independent experiments, eachperformed in triplicate.
Method Validation. As validation procedures, we evaluatedlinearity, accuracy, sensitivity, selectivity, intra-run and inter-runprecision, and reproducibility.
Linearity. Linearity was assessed by plotting a curve of therate of sulfatide hydrolyzed by a series of ARSA mU (0.0015,0.003, 0.006, 0.012, 0.024, and 0.048 mU) at fixed selectedincubation times: 6, 12, 18, 24, and 36 h. Results wereexpressed as the mean of five independent experiments, eachperformed in triplicate.
Accuracy. The absence of stained sulfatide within the upperphase and the total recovery of the sulfatide in the lower phasewere estimated to assess the assay accuracy.The absence of sulfatide-AA was estimated by measuring the
absorbance of the upper phase of serial working standardsobtained from the stock standards of sulfatide (83.3 and 66.6nmol) and used for the generation of the sulfatide-AAcalibration curve. As reference, the upper phase of the AzureA blank assay was also measured.The trueness and bias were evaluated from 10 replicates,
either using three concentrations of sulfatide (16, 21, and 29nmoles) in sulfatide-AA blank assay or in the presence of threeconcentrations of ARSA (0.003, 0.012, and 0.024 mU) and 21nmol of sulfatide. Determinations were according to thestandard procedures (http://www.fao.org/docrep/w7295e/w7295e09.htm; also see the Supporting Information).
Sensitivity. We determined the lowest and highest limit ofdetection of the sulfatide assay by plotting a curve of the rate ofsulfatide hydrolyzed in tubes containing various concentrationsof WT and MLD proteins extract (1−40 μg). Results wereexpressed as the mean of five independent experiments, eachperformed in triplicate.
Analytical Chemistry Article
dx.doi.org/10.1021/ac4023555 | Anal. Chem. 2014, 86, 473−481474
Selectivity. The interfering effect of protein extract and othermolecules (e.g., DNA,24 hyaluronic acid,25 lipids, sphingo-sine22) was estimated to assess the assay selectivity.The effect of proteins was evaluated by plotting a curve of
the Azure A absorbance measured using serial proteins extractconcentration (10−100 μg) in the Azure A blank assay.The effect of DNA was evaluated by plotting a curve of
absorbance of DNA-Azure A measured using serial (μg)purified DNA (gently provided by Dr. M. Di Cristina,University of Perugia) either in the Azure A blank assay or inthe sulfatide-AA blank assay.The effect of lipids was evaluated by plotting a curve of
absorbance of lipds-Azure A measured using lipid extract fromtissue samples either in the Azure A blank assay or in thesulfatide-AA blank assay. Lipids were extracted by the methodof Folch et al.26 Because of the potential interfering ofsphingosine,22 we also measured the effect of a serialconcentration of purified sphingosine (Matreya, synthetic,
98+% TLC) either in the Azure A blank assay or in thesulfatide-AA blank assay. Sphingosine was prepared asdescribed by Bandhuvula et al.27
Finally, we monitored the potential effect of hyaluronic acid(Sigma−Aldrich, No. 53747). A stock solution of hyaluronicacid (0.3% w/v) in distilled water was prepared as describedaccording to the manufacturer’s recommendation. The effect ofhyaluronic acid was evaluated by plotting a curve of absorbanceof hyaluronic acid-Azure A, using a serial concentration of purehyaluronic acid either in the Azure A blank assay or in thesulfatide-AA blank assay mixture.
Intra-run and Inter-run Precision Accuracy. Four differentconcentrations of ARSA enzyme were used to assess the intra-run and inter-run precision, using the coefficient of variationobtained from 10 replicates in 10 consecutive runs.
Reproducibility. The reproducibility of the assay ondiscriminating healthy subjects and MLD patients was
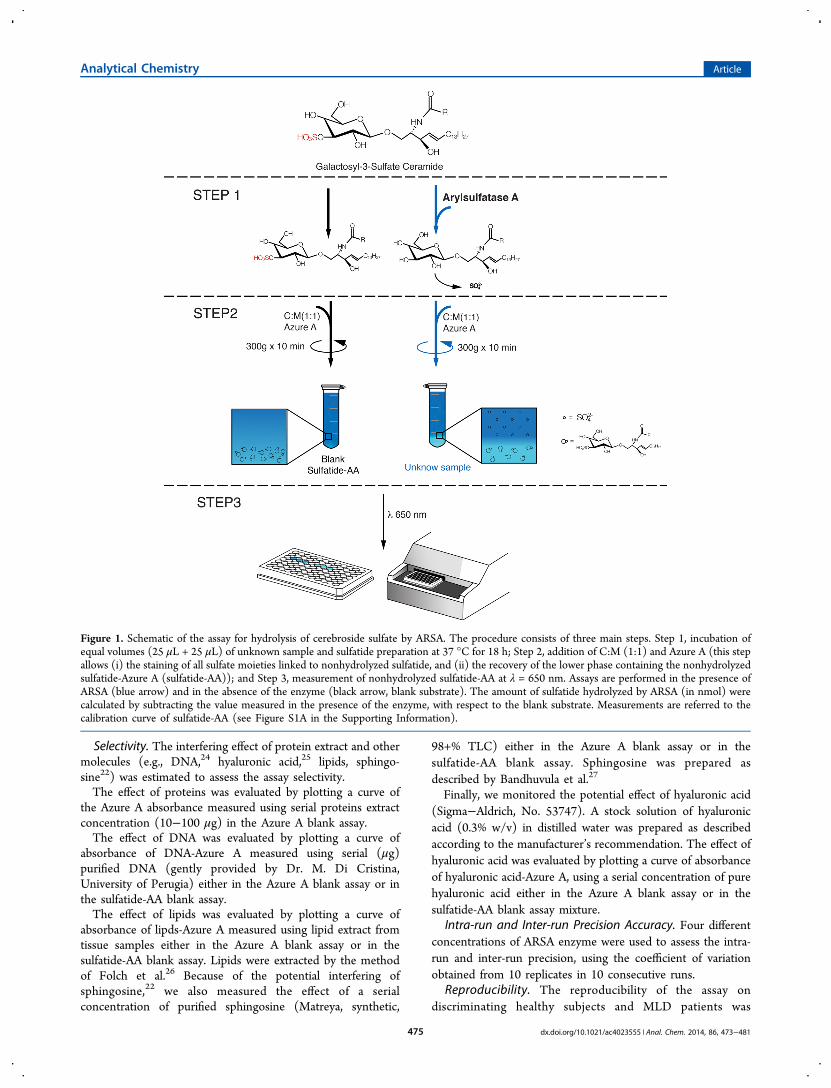
Figure 1. Schematic of the assay for hydrolysis of cerebroside sulfate by ARSA. The procedure consists of three main steps. Step 1, incubation ofequal volumes (25 μL + 25 μL) of unknown sample and sulfatide preparation at 37 °C for 18 h; Step 2, addition of C:M (1:1) and Azure A (this stepallows (i) the staining of all sulfate moieties linked to nonhydrolyzed sulfatide, and (ii) the recovery of the lower phase containing the nonhydrolyzedsulfatide-Azure A (sulfatide-AA)); and Step 3, measurement of nonhydrolyzed sulfatide-AA at λ = 650 nm. Assays are performed in the presence ofARSA (blue arrow) and in the absence of the enzyme (black arrow, blank substrate). The amount of sulfatide hydrolyzed by ARSA (in nmol) werecalculated by subtracting the value measured in the presence of the enzyme, with respect to the blank substrate. Measurements are referred to thecalibration curve of sulfatide-AA (see Figure S1A in the Supporting Information).
Analytical Chemistry Article
dx.doi.org/10.1021/ac4023555 | Anal. Chem. 2014, 86, 473−481475
evaluated by the Fisher’s test using the R software (http://www.r-project.org/).In routine analysis, each analytical set includes a blank Azure
A, a blank sulfatide-AA, a blank of unknown sample containingAzure A without sulfatide, and the unknown samples containingsulfatide and Azure A for the ARSA activity determination.Other Analytical Methods. Other analytical methods
include patients, animal model, tissue and cell preparation, celltransduction with ARSA-encoding lentiviral vector, tissue andcell extract preparation, ARSA activity assay toward thefluorogenic substrate, DEAE-cellulose chromatography, true-ness and bias determination, Kcat/Km determination, andstatistical analysis. These other methodologies are detailed inthe Supporting Information.
■ RESULTS
Rational Design. Enzyme reactions were performed in afinal volume of 50 μL by mixing an equal volume of ARSAsample with 21 nmol of sulfatide at 37 °C for 18 h (see Figure1, blue arrow, Step 1). As a reference assay, 21 nmol of sulfatideat 37 °C for 18 h were mixed with an equal volume of Na/acetate buffer (Figure 1, black arrow, Step 1). Reactions werestopped by adding 0.85 mL of a 1:1 chloroform:methanolmixture, 0.85 mL of 50 mN H2SO4, and 0.17 mL of dyesolution Azure A22 (final concentration of 0.4 mg/mL). Aftershaking, tubes were centrifuged at 300g × 10 min at roomtemperature (Figure 1, blue and black arrow, Step 2). TheAzure A binds either to sulfate-residues of the nonhydrolyzedsulfatide or to free sulfate-groups hydrolyzed by ARSA from thesulfatide. After centrifugation, the upper phases were discardedand the lower phases, containing the nonhydrolyzed sulfatide-AA (blue arrow) and the blank sulfatide-AA (black arrow),were recovered (see Figure 1, Step 2) and measured at λ = 650nm on a Microplate Reader (Model GDV-DV-990BV6) (seeFigure 1, Step 3).The amount of sulfatide hydrolyzed (in nmol) were
calculated by subtracting the value measured in the assayperformed in the presence of the ARSA enzyme (blue arrow)from the value obtained from the assay carried out in theabsence of the enzyme (black arrow).Absorbance was evaluated by using a sulfatide-AA calibration
curve as a reference (see Figure S1A in the SupportingInformation). As a reference, the Azure A calibration curve isalso reported (see Figure S1B in the Supporting Information).Optimization of Kinetics Parameters. Ad hoc kinetics
parameters for the enzyme reaction were determined by usingdifferent mU (0.0015, 0.003, 0.006, 0.012, 0.024, 0.048 mU) ofpartial purified ARSA, each at different incubation times: 6, 12,18, 24, and 36 h.Enzyme Preparation. We used DEAE-cellulose chromatog-
raphy to separate ARSA from the other protein extracts,according to our previous protocol.16 As an enzyme source, weused human mononuclear cells (PBMCs) freshly isolated fromperipheral blood of healthy donors. In our experimentalcondition, arylsulfatase B (ARSB) (EC.3.1.6.12), which hassimilar ARSA biochemical properties (http://www.brenda-enzymes.info/), is eluted with the void volume of the column,while the ARSA activity retained by the column is eluted by alinear gradient of NaCl 50−250 mM as confirmed by thespecific assay in the presence of the AgNO3, an ARSA inhibitor(see Figure S2A in the Supporting Information) and theabsence of ARSA activity in PBMCs from MLD patients (see
Figure S2B in the Supporting Information). This procedureincreased the ARSA specific activity at least 70-fold.
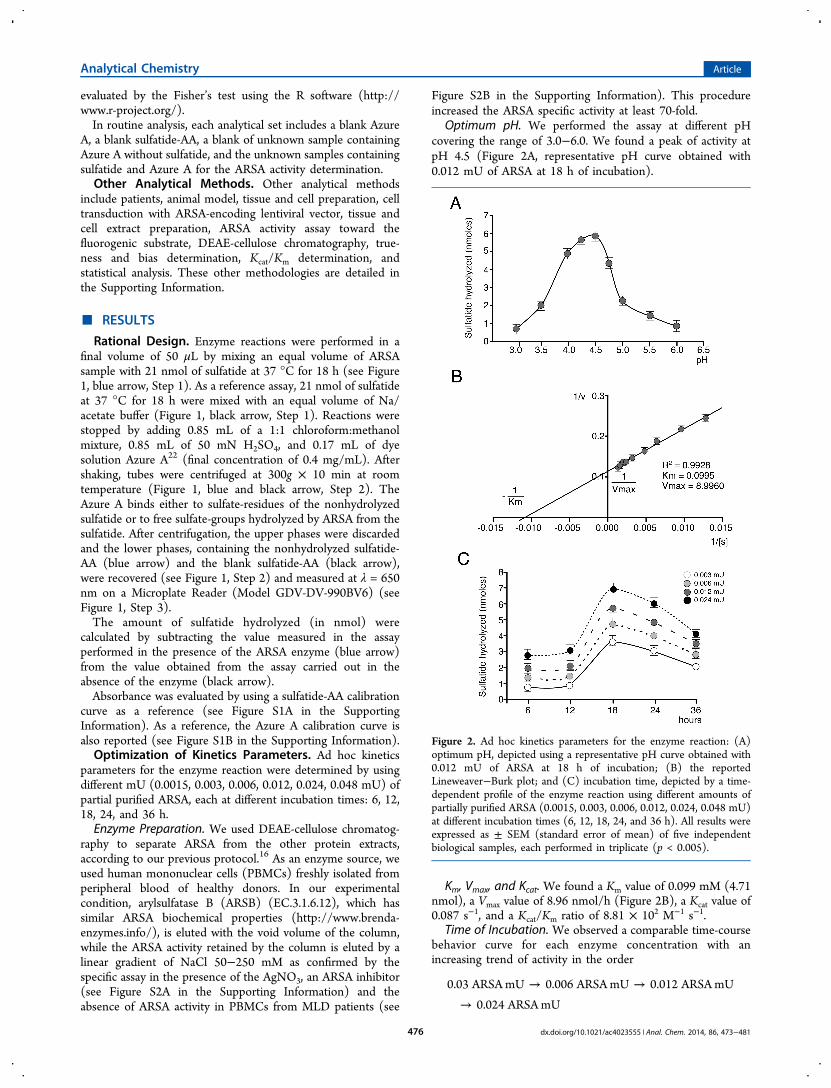
Optimum pH. We performed the assay at different pHcovering the range of 3.0−6.0. We found a peak of activity atpH 4.5 (Figure 2A, representative pH curve obtained with0.012 mU of ARSA at 18 h of incubation).
Km, Vmax, and Kcat. We found a Km value of 0.099 mM (4.71nmol), a Vmax value of 8.96 nmol/h (Figure 2B), a Kcat value of0.087 s−1, and a Kcat/Km ratio of 8.81 × 10² M−1 s−1.
Time of Incubation. We observed a comparable time-coursebehavior curve for each enzyme concentration with anincreasing trend of activity in the order
→ →→
0.03 ARSA mU 0.006 ARSA mU 0.012 ARSA mU0.024 ARSA mU
Figure 2. Ad hoc kinetics parameters for the enzyme reaction: (A)optimum pH, depicted using a representative pH curve obtained with0.012 mU of ARSA at 18 h of incubation; (B) the reportedLineweaver−Burk plot; and (C) incubation time, depicted by a time-dependent profile of the enzyme reaction using different amounts ofpartially purified ARSA (0.0015, 0.003, 0.006, 0.012, 0.024, 0.048 mU)at different incubation times (6, 12, 18, 24, and 36 h). All results wereexpressed as ± SEM (standard error of mean) of five independentbiological samples, each performed in triplicate (p < 0.005).
Analytical Chemistry Article
dx.doi.org/10.1021/ac4023555 | Anal. Chem. 2014, 86, 473−481476
The levels of sulfatide hydrolyzed reached a peak at 18 h of
incubation, although the levels of sulfatide hydrolysis were
highest at the limits of detection (LODs)/limits of
quantification (LOQs), even after 6 and 12 h of incubation
(Figure 2C).Sulfatide Assay Validation. As standard assay validation
procedures, we evaluated the linearity, accuracy, selectivity,
sensitivity, intra-run and inter-run precision, and reproduci-bility.
Assay Linearity. Enzyme reactions were linear in the rangeof 0.003−0.024 mU at each incubation time (see Figure 3A).These data indicated that 0.003 mU is the lowest quantity ofenzyme mU requested for a valid assay.
Assay Accuracy. We found comparable absorbance valuesbetween the upper phase of Azure A blank standard and either
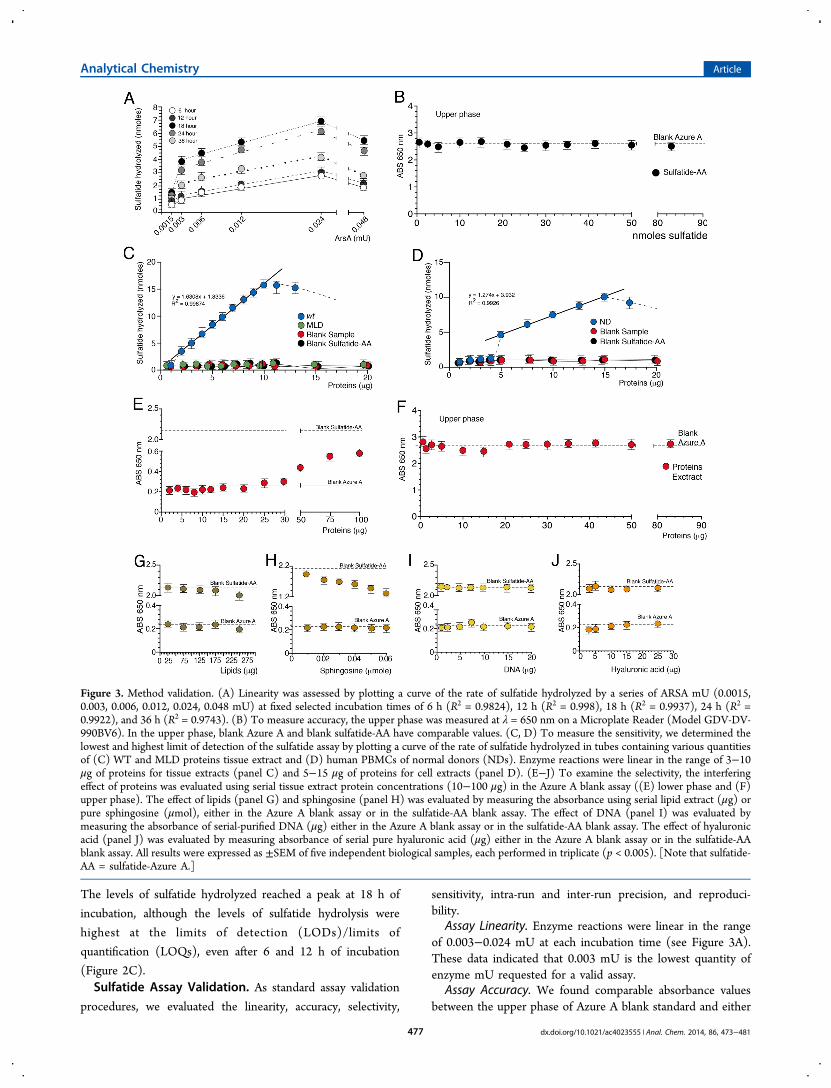
Figure 3. Method validation. (A) Linearity was assessed by plotting a curve of the rate of sulfatide hydrolyzed by a series of ARSA mU (0.0015,0.003, 0.006, 0.012, 0.024, 0.048 mU) at fixed selected incubation times of 6 h (R2 = 0.9824), 12 h (R2 = 0.998), 18 h (R2 = 0.9937), 24 h (R2 =0.9922), and 36 h (R2 = 0.9743). (B) To measure accuracy, the upper phase was measured at λ = 650 nm on a Microplate Reader (Model GDV-DV-990BV6). In the upper phase, blank Azure A and blank sulfatide-AA have comparable values. (C, D) To measure the sensitivity, we determined thelowest and highest limit of detection of the sulfatide assay by plotting a curve of the rate of sulfatide hydrolyzed in tubes containing various quantitiesof (C) WT and MLD proteins tissue extract and (D) human PBMCs of normal donors (NDs). Enzyme reactions were linear in the range of 3−10μg of proteins for tissue extracts (panel C) and 5−15 μg of proteins for cell extracts (panel D). (E−J) To examine the selectivity, the interferingeffect of proteins was evaluated using serial tissue extract protein concentrations (10−100 μg) in the Azure A blank assay ((E) lower phase and (F)upper phase). The effect of lipids (panel G) and sphingosine (panel H) was evaluated by measuring the absorbance using serial lipid extract (μg) orpure sphingosine (μmol), either in the Azure A blank assay or in the sulfatide-AA blank assay. The effect of DNA (panel I) was evaluated bymeasuring the absorbance of serial-purified DNA (μg) either in the Azure A blank assay or in the sulfatide-AA blank assay. The effect of hyaluronicacid (panel J) was evaluated by measuring absorbance of serial pure hyaluronic acid (μg) either in the Azure A blank assay or in the sulfatide-AAblank assay. All results were expressed as ±SEM of five independent biological samples, each performed in triplicate (p < 0.005). [Note that sulfatide-AA = sulfatide-Azure A.]
Analytical Chemistry Article
dx.doi.org/10.1021/ac4023555 | Anal. Chem. 2014, 86, 473−481477
the upper phases of a serial sulfatide-AA blank standards(Figure 3B) or of a serial protein extracts samples (Figure 3F)thereby indicating the absence of nonhydrolyzed sulfatide-AAwithin the upper phase.The degree of accuracy evaluated in the blank sulfatide-AA
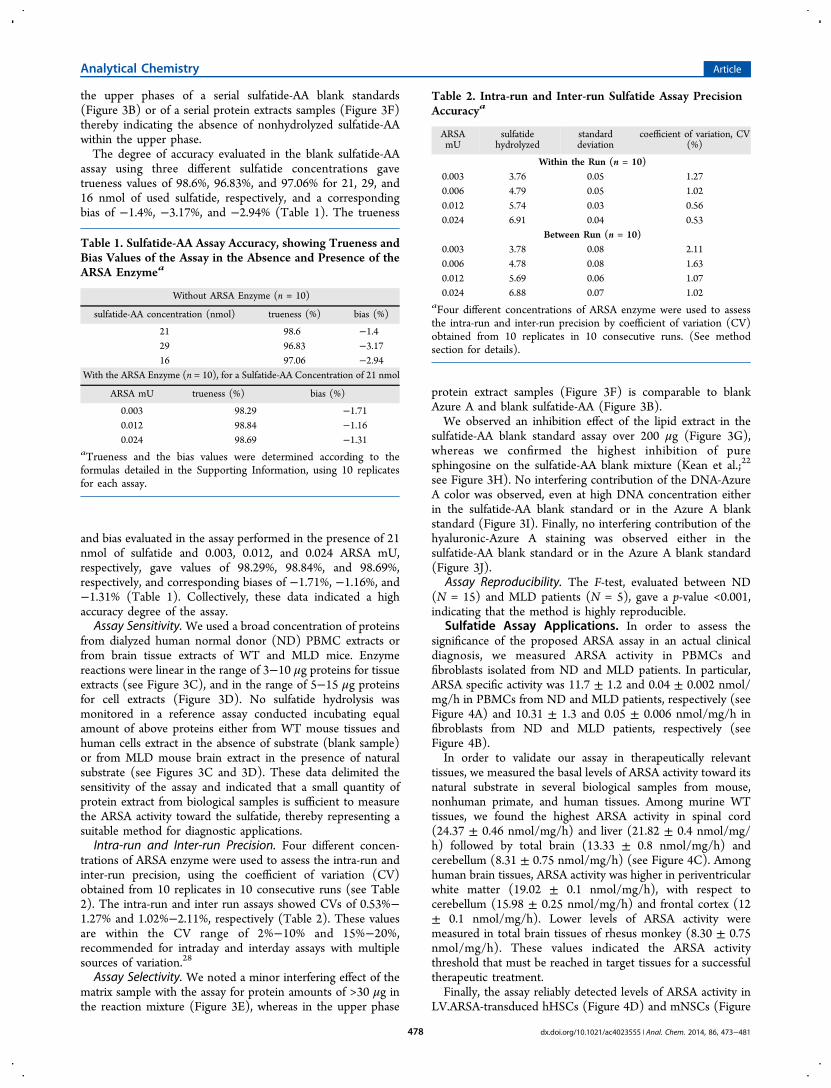
assay using three different sulfatide concentrations gavetrueness values of 98.6%, 96.83%, and 97.06% for 21, 29, and16 nmol of used sulfatide, respectively, and a correspondingbias of −1.4%, −3.17%, and −2.94% (Table 1). The trueness
and bias evaluated in the assay performed in the presence of 21nmol of sulfatide and 0.003, 0.012, and 0.024 ARSA mU,respectively, gave values of 98.29%, 98.84%, and 98.69%,respectively, and corresponding biases of −1.71%, −1.16%, and−1.31% (Table 1). Collectively, these data indicated a highaccuracy degree of the assay.Assay Sensitivity. We used a broad concentration of proteins
from dialyzed human normal donor (ND) PBMC extracts orfrom brain tissue extracts of WT and MLD mice. Enzymereactions were linear in the range of 3−10 μg proteins for tissueextracts (see Figure 3C), and in the range of 5−15 μg proteinsfor cell extracts (Figure 3D). No sulfatide hydrolysis wasmonitored in a reference assay conducted incubating equalamount of above proteins either from WT mouse tissues andhuman cells extract in the absence of substrate (blank sample)or from MLD mouse brain extract in the presence of naturalsubstrate (see Figures 3C and 3D). These data delimited thesensitivity of the assay and indicated that a small quantity ofprotein extract from biological samples is sufficient to measurethe ARSA activity toward the sulfatide, thereby representing asuitable method for diagnostic applications.Intra-run and Inter-run Precision. Four different concen-
trations of ARSA enzyme were used to assess the intra-run andinter-run precision, using the coefficient of variation (CV)obtained from 10 replicates in 10 consecutive runs (see Table2). The intra-run and inter run assays showed CVs of 0.53%−1.27% and 1.02%−2.11%, respectively (Table 2). These valuesare within the CV range of 2%−10% and 15%−20%,recommended for intraday and interday assays with multiplesources of variation.28
Assay Selectivity. We noted a minor interfering effect of thematrix sample with the assay for protein amounts of >30 μg inthe reaction mixture (Figure 3E), whereas in the upper phase
protein extract samples (Figure 3F) is comparable to blankAzure A and blank sulfatide-AA (Figure 3B).We observed an inhibition effect of the lipid extract in the
sulfatide-AA blank standard assay over 200 μg (Figure 3G),whereas we confirmed the highest inhibition of puresphingosine on the sulfatide-AA blank mixture (Kean et al.;22
see Figure 3H). No interfering contribution of the DNA-AzureA color was observed, even at high DNA concentration eitherin the sulfatide-AA blank standard or in the Azure A blankstandard (Figure 3I). Finally, no interfering contribution of thehyaluronic-Azure A staining was observed either in thesulfatide-AA blank standard or in the Azure A blank standard(Figure 3J).
Assay Reproducibility. The F-test, evaluated between ND(N = 15) and MLD patients (N = 5), gave a p-value <0.001,indicating that the method is highly reproducible.
Sulfatide Assay Applications. In order to assess thesignificance of the proposed ARSA assay in an actual clinicaldiagnosis, we measured ARSA activity in PBMCs andfibroblasts isolated from ND and MLD patients. In particular,ARSA specific activity was 11.7 ± 1.2 and 0.04 ± 0.002 nmol/mg/h in PBMCs from ND and MLD patients, respectively (seeFigure 4A) and 10.31 ± 1.3 and 0.05 ± 0.006 nmol/mg/h infibroblasts from ND and MLD patients, respectively (seeFigure 4B).In order to validate our assay in therapeutically relevant
tissues, we measured the basal levels of ARSA activity toward itsnatural substrate in several biological samples from mouse,nonhuman primate, and human tissues. Among murine WTtissues, we found the highest ARSA activity in spinal cord(24.37 ± 0.46 nmol/mg/h) and liver (21.82 ± 0.4 nmol/mg/h) followed by total brain (13.33 ± 0.8 nmol/mg/h) andcerebellum (8.31 ± 0.75 nmol/mg/h) (see Figure 4C). Amonghuman brain tissues, ARSA activity was higher in periventricularwhite matter (19.02 ± 0.1 nmol/mg/h), with respect tocerebellum (15.98 ± 0.25 nmol/mg/h) and frontal cortex (12± 0.1 nmol/mg/h). Lower levels of ARSA activity weremeasured in total brain tissues of rhesus monkey (8.30 ± 0.75nmol/mg/h). These values indicated the ARSA activitythreshold that must be reached in target tissues for a successfultherapeutic treatment.Finally, the assay reliably detected levels of ARSA activity in
LV.ARSA-transduced hHSCs (Figure 4D) and mNSCs (Figure
Table 1. Sulfatide-AA Assay Accuracy, showing Trueness andBias Values of the Assay in the Absence and Presence of theARSA Enzymea
Without ARSA Enzyme (n = 10)
sulfatide-AA concentration (nmol) trueness (%) bias (%)
21 98.6 −1.429 96.83 −3.1716 97.06 −2.94
With the ARSA Enzyme (n = 10), for a Sulfatide-AA Concentration of 21 nmol
ARSA mU trueness (%) bias (%)
0.003 98.29 −1.710.012 98.84 −1.160.024 98.69 −1.31
aTrueness and the bias values were determined according to theformulas detailed in the Supporting Information, using 10 replicatesfor each assay.
Table 2. Intra-run and Inter-run Sulfatide Assay PrecisionAccuracya
ARSAmU
sulfatidehydrolyzed
standarddeviation
coefficient of variation, CV(%)
Within the Run (n = 10)0.003 3.76 0.05 1.270.006 4.79 0.05 1.020.012 5.74 0.03 0.560.024 6.91 0.04 0.53
Between Run (n = 10)0.003 3.78 0.08 2.110.006 4.78 0.08 1.630.012 5.69 0.06 1.070.024 6.88 0.07 1.02
aFour different concentrations of ARSA enzyme were used to assessthe intra-run and inter-run precision by coefficient of variation (CV)obtained from 10 replicates in 10 consecutive runs. (See methodsection for details).
Analytical Chemistry Article
dx.doi.org/10.1021/ac4023555 | Anal. Chem. 2014, 86, 473−481478
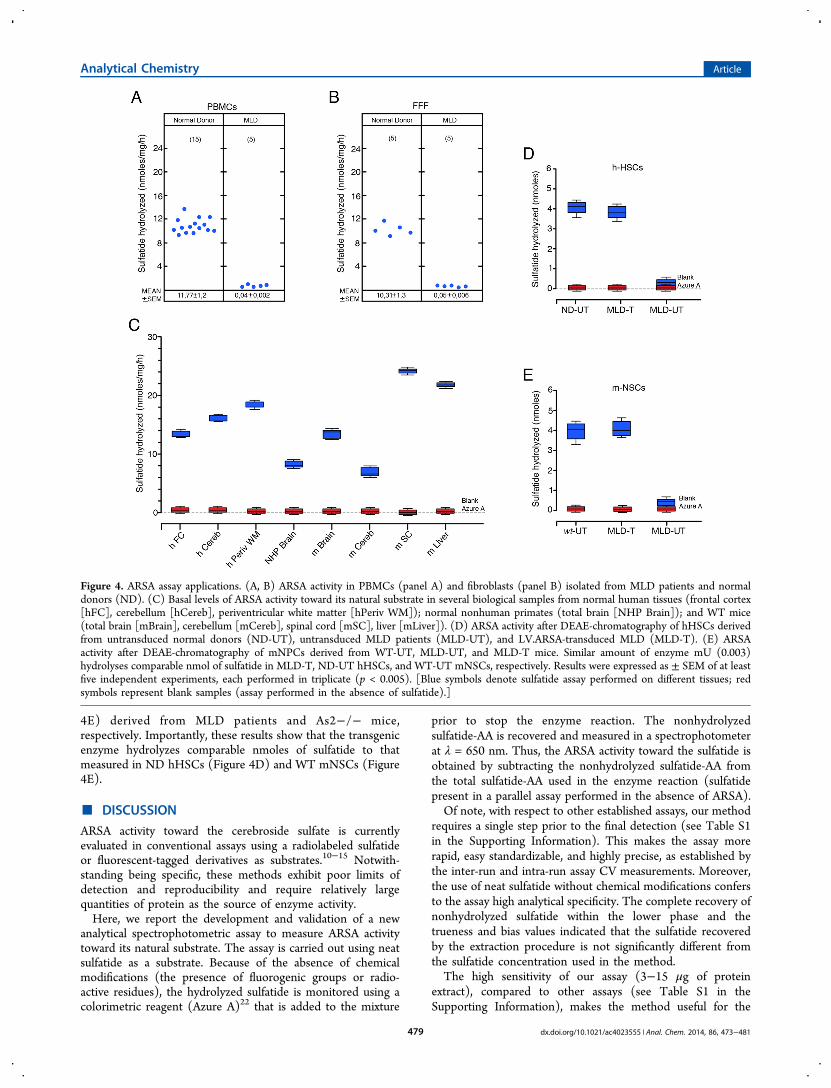
4E) derived from MLD patients and As2−/− mice,respectively. Importantly, these results show that the transgenicenzyme hydrolyzes comparable nmoles of sulfatide to thatmeasured in ND hHSCs (Figure 4D) and WT mNSCs (Figure4E).
■ DISCUSSION
ARSA activity toward the cerebroside sulfate is currentlyevaluated in conventional assays using a radiolabeled sulfatideor fluorescent-tagged derivatives as substrates.10−15 Notwith-standing being specific, these methods exhibit poor limits ofdetection and reproducibility and require relatively largequantities of protein as the source of enzyme activity.Here, we report the development and validation of a new
analytical spectrophotometric assay to measure ARSA activitytoward its natural substrate. The assay is carried out using neatsulfatide as a substrate. Because of the absence of chemicalmodifications (the presence of fluorogenic groups or radio-active residues), the hydrolyzed sulfatide is monitored using acolorimetric reagent (Azure A)22 that is added to the mixture
prior to stop the enzyme reaction. The nonhydrolyzedsulfatide-AA is recovered and measured in a spectrophotometerat λ = 650 nm. Thus, the ARSA activity toward the sulfatide isobtained by subtracting the nonhydrolyzed sulfatide-AA fromthe total sulfatide-AA used in the enzyme reaction (sulfatidepresent in a parallel assay performed in the absence of ARSA).Of note, with respect to other established assays, our method
requires a single step prior to the final detection (see Table S1in the Supporting Information). This makes the assay morerapid, easy standardizable, and highly precise, as established bythe inter-run and intra-run assay CV measurements. Moreover,the use of neat sulfatide without chemical modifications confersto the assay high analytical specificity. The complete recovery ofnonhydrolyzed sulfatide within the lower phase and thetrueness and bias values indicated that the sulfatide recoveredby the extraction procedure is not significantly different fromthe sulfatide concentration used in the method.The high sensitivity of our assay (3−15 μg of protein
extract), compared to other assays (see Table S1 in theSupporting Information), makes the method useful for the
Figure 4. ARSA assay applications. (A, B) ARSA activity in PBMCs (panel A) and fibroblasts (panel B) isolated from MLD patients and normaldonors (ND). (C) Basal levels of ARSA activity toward its natural substrate in several biological samples from normal human tissues (frontal cortex[hFC], cerebellum [hCereb], periventricular white matter [hPeriv WM]); normal nonhuman primates (total brain [NHP Brain]); and WT mice(total brain [mBrain], cerebellum [mCereb], spinal cord [mSC], liver [mLiver]). (D) ARSA activity after DEAE-chromatography of hHSCs derivedfrom untransduced normal donors (ND-UT), untransduced MLD patients (MLD-UT), and LV.ARSA-transduced MLD (MLD-T). (E) ARSAactivity after DEAE-chromatography of mNPCs derived from WT-UT, MLD-UT, and MLD-T mice. Similar amount of enzyme mU (0.003)hydrolyses comparable nmol of sulfatide in MLD-T, ND-UT hHSCs, and WT-UT mNSCs, respectively. Results were expressed as ± SEM of at leastfive independent experiments, each performed in triplicate (p < 0.005). [Blue symbols denote sulfatide assay performed on different tissues; redsymbols represent blank samples (assay performed in the absence of sulfatide).]
Analytical Chemistry Article
dx.doi.org/10.1021/ac4023555 | Anal. Chem. 2014, 86, 473−481479
analysis of a small amount of biological samples, therebyrepresenting an advantage for the diagnostic investigation.The selectivity of the method is demonstrated by (i) the
absence of matrix (e.g., proteins, lipids) staining interferingeffect within the assay condition; (ii) the absence of any noisyeffect of DNA and hyaluronic acid that, based on recentstudies,24,25 could interact with Azure A; (iii) the absence ofinterfering of other potential compounds present within thesample extract, as revealed by the comparable absorbance valueof a blank sample (assay performed in the absence of sulfatide)and the blank Azure-A. Thus, we could exclude the interferenceof sphingosine22 that we confirmed could inhibit the sulfatidestaining.Taking into account the variability of enzyme activity in
normal donors and patients, our assay returned activities thatwere highest for ND-derived cells and lowest for patient’s cells,compared to the range of values previously reported in theliterature10−13 or routinely generated through conventionalmethods in laboratory facilities specialized in prenataldiagnostics. Thus, our assay allows for detection of ARSAactivity specifically in cells and tissues from NDs, defining areference threshold of activity that must be restored in targettissues for a successful therapeutic treatment and clearlyidentifying samples from MLD patients, in which ARSAactivity is undetectable.In light of the potential use of engineered hematopoietic
and/or neural stem cells for the treatment of MLD, the assay’sperformance was validated in stem cell types of human(hHSCs) and murine (mNSCs) origin. Results indicated thatthe assay can be used to monitor the efficacy of viral-mediatedgene therapy approaches.4,29
■ CONCLUSIONS
Our study demonstrates the advantages of the newspectrophotometric assay for the determination of the ARSAactivity toward the hydrolysis of sulfatide. The assay is ideal forperforming accurate diagnosis of MLD disease but also formonitoring the follow-up during a therapeutic treatment.Moreover, because of the relatively easy manufacture, themethod could be suitable for high-throughput diagnosticscreening.
■ ASSOCIATED CONTENT
*S Supporting InformationThis material is available free of charge via the Internet athttp://pubs.acs.org.
■ AUTHOR INFORMATION
Corresponding Author*Tel.: +39 0755857439. Fax +390755857443. E-mail: [email protected].
Author ContributionsF.M. and I. di G. performed experiments and analyzed data.A.G. and A.B. performed gene therapy experiments andanalyzed and discussed data. C.E. analyzed data. S.M. designedassay, supervised experiments, analyzed data, and wrote themanuscript. All authors have given their approval to the finalversion of the manuscript.
NotesThe authors declare no competing financial interest.
■ ACKNOWLEDGMENTSPart of this work has been supported by EUPRIM-Net (underthe EU Contract No. RII3-026155 of the 6th FrameworkProgramme) and the Telethon Foundation (through ProjectNo. TGT11B02 to A.G.).
■ REFERENCES(1) Gieselmann, V.; von Figura, K. J. Inherit Metab. Dis. 1990, 13 (4),560−71.(2) Gieselmann, V.; Krageloh-Mann, I. Neuropediatrics 2010, 41 (1),1−6.(3) Biffi, A.; Aubourg, P.; Cartier, N. Hum. Mol. Genet. 2011, 20(R1), R42−53.(4) Biffi, A.; Montini, E.; Lorioli, L.; Cesani, M.; Fumagalli, F.; Plati,T.; Baldoli, C.; Martino, S.; Calabria, A.; Canale, S.; Benedicenti, F.;Vallanti, G.; Biasco, L.; Leo, S.; Kabbara, N.; Zanetti, G.; Rizzo, W. B.;Mehta, N. A.; Cicalese, M. P.; Casiraghi, M.; Boelens, J. J.; Del Carro,U.; Dow, D. J.; Schmidt, M.; Assanelli, A.; Neduva, V.; Di Serio, C.;Stupka, E.; Gardner, J.; von Kalle, C.; Bordignon, C.; Ciceri, F.;Rovelli, A.; Roncarolo, M. G.; Aiuti, A.; Sessa, M.; Naldini, L. Science2013, DOI: 10.1126/science.1233158.(5) Batzios, S. P.; Zafeiriou, D. I. Mol. Gent. Metab. 2012, 105 (1),56−63.(6) Polten, A.; Fluharty, A. L.; Fluharty, C. B.; Kappler, J.; von Figura,K.; Gieselmann, V. N. Engl. JT Med. 1991, 324, 18−22.(7) Natowicz, M. R.; Prence, E. M.; Chaturvedi, P.; Newburg, D. S.Clin. Chem. 1996, 42 (2), 232−8.(8) Regis, S.; Corsolini, F.; Stroppiano, M.; Cusano, R.; Filocamo, M.Hum. Genet. 2002, 110 (4), 351−5.(9) Raghavan, S. S.; Gajewski, A.; Kolodny, E. H. J. Neurochem. 1981,36 (2), 724−31.(10) Dubois, G.; Zalc, B.; Le Saux, F.; Baumann, N. Anal. Biochem.1980, 102 (2), 313−7.(11) Masson, M.; Li, W. X.; Fluharty, A. L.; Beaucourt, J. P.; Turpin,J. C.; Baumann, N. Clin. Chim. Acta 1991, 201 (3), 157−68.(12) Louis, A. I.; Widen, K. E.; Tsay, K. K.; Fluharty, A. L.Mol. Chem.Neuropathol. 1991, 14 (2), 113−30.(13) Monti, E.; Preti, A.; Novati, A.; Aleo, M. F.; Clemente, M. L.;Marchesini, S. Clin. Chim. Acta 1993, 218 (2), 139−47.(14) Consiglio, A.; Quattrini, A.; Martino, S.; Bensadoun, J. C.;Dolcetta, D.; Trojani, A.; Benaglia, G.; Marchesini, S.; Cestari, V.;Oliverio, A.; Bordignon, C.; Naldini, L. Nat. Med. 2001, 7 (3), 310−6.(15) Biffi, A.; De Palma, M.; Quattrini, A.; Del Carro, U.; Amadio, S.;Visigalli, I.; Sessa, M.; Fasano, S.; Brambilla, R.; Marchesini, S.;Bordignon, C.; Naldini, L. J. Clin. Invest. 2004, 113 (8), 1118−29.(16) Martino, S.; Consiglio, A.; Cavalieri, C.; Tiribuzi, R.; Costanzi,E.; Severini, G. M.; Emiliani, C.; Bordignon, C.; Orlacchio, A. J.Biotechnol. 2005, 117 (3), 243−51.(17) Consiglio, A.; Martino, S.; Dolcetta, D.; Cusella, G.; Conese, M.;Marchesini, S.; Benaglia, G.; Wrabetz, L.; Orlacchio, A.; Deglon, N.;Aebischer, P.; Severini, G. M.; Bordignon, C. J. Neurol. Sci. 2007, 255(1−2), 7−16.(18) Chang, P. L.; Rosa, N. E.; Davidson, R. G. Anal. Biochem. 1981,117 (2), 382−9.(19) Fluharty, A. L.; Davis, M. L.; Kihara, H.; Kritchevsky, G. Lipids.1974, 9, 865−869.(20) Ahn, V. E.; Faull, K. F.; Whitelegge, J. P.; Fluharty, A. L.; Prive,G. G. Proc. Natl. Acad. Sci. USA. 2003, 100, 38−43.(21) Norris, A. J.; Whitelegge, J. P.; Yaghoubian, A.; Alattia, J. R.;Prive, G. G.; Toyokuni, T.; Sun, H.; Brooks, M. N.; Panza, L.; Matto,P.; Compostella, F.; Remmel, N.; Klingestein, R.; Sandhoff, K.;Fluharty, C.; Fluharty, A.; Faulk, K. F. J. Lipid Res. 2005, 46 (10),2254−64.(22) Kean, E. L. J. Lipid. Res. 1968, 9 (3), 319−27.(23) Lineweaver, H.; Burk, D. J. Am. Chem. Soc. 1934, 56 (3), 658−666.(24) Paul, P.; Suresh Kumar, G. Spectrochim. Acta A Mol. Biomol.Spectrosc. 2013, 107, 303−10.
Analytical Chemistry Article
dx.doi.org/10.1021/ac4023555 | Anal. Chem. 2014, 86, 473−481480

(25) Chen, Q.; Li, X. L.; Liu, Q.; Jiao, Q. C.; Cao, W. G.; Wan, H.Anal. Bioanal. Chem. 2005, 382 (7), 1513−9.(26) Folch, J.; Lees, M.; Sloane Stanley, G. H. J. Biol. Chem. 1957,226 (1), 497−509.(27) Bandhuvula, P.; Fyrst, H.; Saba, J. D. J. Lipid Res. 2007, 48 (12),2769−78.(28) Jimsheena, V. K.; Gowda, L. R. Anal. Chem. 2009, 81, 9388−9394.(29) Biffi, A.; Capotondo, A.; Fasano, S.; del Carro, U.; Marchesini,S.; Azuma, H.; Malaguti, M. C.; Amadio, S.; Brambilla, R.; Grompe,M.; Bordignon, C.; Quattrini, A.; Naldini, L. J. Clin. Invest. 2006, 116(11), 3070−82.
Analytical Chemistry Article
dx.doi.org/10.1021/ac4023555 | Anal. Chem. 2014, 86, 473−481481