A new adaptive fuzzy FDI method for Bond Graph uncertain parameters systems
6
643 978-1-4577-1846-5/11/$26.00 ©2011 IEEE A new Adaptive Fuzzy FDI method for Bond Graph uncertain parameters systems Walid Bouallègue, Salma Bouslama Bouabdallah University of Tunis el Manar LACS, National Engineering School of Tunis Université de Tunis El Manar, Tunis, Tunisia [email protected], [email protected] Moncef Tagina Manouba University LI3, National School of Computer Sciences Manouba, Tunisia [email protected] Abstract—In this paper, a new adaptive fuzzy Fault Detection and Isolation (FDI) approach of non linear Bond Graph (BG) uncertain parameters systems is proposed. In this approach two methods are combined: adaptive thresholds based method and a fuzzy logic method. A simulation example of a real system is provided to show the efficiency of the proposed method in comparison with adaptive thresholds based method. Keywords- FDI; Adaptive fuzzy mechanism; BG model; parametric uncertainties. I. INTRODUCTION Fault Detection and Isolation (FDI) is a subfield of control engineering which concerns process supervision. Due to the complexity of modern control systems and the increasing demand for quality, safety and reliability, FDI is an increasingly active research domain [8]. A widespread solution for FDI consists in comparing the behavior of the real system to a theorical model. For complex systems, there is no available accurate mathematical model [8]. In this case, fuzzy logic is the most appropriate solution since it deals with uncertainties and imprecise informations; its performance was shown in many works [3][13]. FDI methods can be divided into two major categories: quantitative and qualitative methods [1] [14] [15] [16]. The choice of a modelling formalism is an important step for FDI. Because of its behavioural, structural and causal properties, the Bond Graph (BG) tool is used in complex processes modelling and FDI [1] [2] [6] [7]. BG gives mathematical and graphical representations that make easier the task of monitoring and the design of supervision systems. Its causal properties are used to determine the fault origins; BG is exploited in both qualitative and quantitative diagnosis methods [1]. However, the efficiency and robustness of these methods depend on the model’s accuracy. In case of uncertain parameters systems, [10] proposed a robust diagnosis algorithm, using a BG model in Linear Fractional Transformations (LFT) form, robust to parameters uncertainties. The quantity of energy given by the uncertain part is separated from residual; this idea allows the generation of adaptive thresholds for fault detection. A study of sensitivity was elaborated to deduce detectability indexes defining the detectable value of the residual in case of faults and parameter uncertainties. In Reference [17], we have proposed a FDI method based on robust fixed and adaptive thresholds. In this method, residuals sensitivity to different system’s parameters is exploited in order to determine their thresholds used in detection stage. For isolation, the FSM (Fault Signature Matrix) is compared to the coherence binary vector which contains residuals’ state. In this work, we propose to combine fuzzy approach with adaptive thresholds method in order to improve FDI system efficiency. This paper is organized as follows: In section 2, adaptive thresholds generation method is presented. In section 3, a fuzzy logic approach for on-line FDI is detailed. The proposed adaptive fuzzy FDI approach is described in section 4. Section 5 presents the benchmark used to test the proposed method. And finally, simulation results and a comparison with the adaptive thresholds based method are given in section 6. II. THE ROBUST THRESHOLDS GENERATION METHOD FOR FDI From the BG model in derivative causality, we can deduce ARRs expressions which are determined from the structural equations in junctions 0 and 1. Final expression of the ARRs has the following structure [17]: ARR : r (θ i ) =0 Where θ i represents the system’s physical parameters. The sensitivity analysis of a residual studies how a small perturbation Δθi around a nominal value of a parameter θi affects the residual. The sensitivity expression S ij is given by: i j ij j ( ) r S Where Sij is the sensitivity of residual r i with respect to a parameter θ j . Determination of the numerical value of the sensitivity S ij allows the determination of residuals’ variation for a given variation Δθ j of the parameter θ j , this variation is given by:
-
Upload
independent -
Category
Documents
-
view
1 -
download
0
Transcript of A new adaptive fuzzy FDI method for Bond Graph uncertain parameters systems
643
978-1-4577-1846-5/11/$26.00 ©2011 IEEE
A new Adaptive Fuzzy FDI method for Bond Graph
uncertain parameters systems
Walid Bouallègue, Salma Bouslama Bouabdallah
University of Tunis el Manar
LACS, National Engineering School of Tunis
Université de Tunis El Manar, Tunis, Tunisia
[email protected], [email protected]
Moncef Tagina
Manouba University
LI3, National School of Computer Sciences
Manouba, Tunisia
Abstract—In this paper, a new adaptive fuzzy Fault Detection
and Isolation (FDI) approach of non linear Bond Graph (BG)
uncertain parameters systems is proposed. In this approach two
methods are combined: adaptive thresholds based method and a
fuzzy logic method. A simulation example of a real system is
provided to show the efficiency of the proposed method in
comparison with adaptive thresholds based method.
Keywords- FDI; Adaptive fuzzy mechanism; BG model;
parametric uncertainties.
I. INTRODUCTION
Fault Detection and Isolation (FDI) is a subfield of control engineering which concerns process supervision. Due to the complexity of modern control systems and the increasing demand for quality, safety and reliability, FDI is an increasingly active research domain [8]. A widespread solution for FDI consists in comparing the behavior of the real system to a theorical model. For complex systems, there is no available accurate mathematical model [8]. In this case, fuzzy logic is the most appropriate solution since it deals with uncertainties and imprecise informations; its performance was shown in many works [3][13]. FDI methods can be divided into two major categories: quantitative and qualitative methods [1] [14] [15] [16].
The choice of a modelling formalism is an important step for FDI. Because of its behavioural, structural and causal properties, the Bond Graph (BG) tool is used in complex processes modelling and FDI [1] [2] [6] [7]. BG gives mathematical and graphical representations that make easier the task of monitoring and the design of supervision systems. Its causal properties are used to determine the fault origins; BG is exploited in both qualitative and quantitative diagnosis methods [1].
However, the efficiency and robustness of these methods depend on the model’s accuracy. In case of uncertain parameters systems, [10] proposed a robust diagnosis algorithm, using a BG model in Linear Fractional Transformations (LFT) form, robust to parameters uncertainties. The quantity of energy given by the uncertain part is separated from residual; this idea allows the generation of adaptive thresholds for fault detection. A study of sensitivity was elaborated to deduce detectability indexes defining the
detectable value of the residual in case of faults and parameter uncertainties. In Reference [17], we have proposed a FDI method based on robust fixed and adaptive thresholds. In this method, residuals sensitivity to different system’s parameters is exploited in order to determine their thresholds used in detection stage. For isolation, the FSM (Fault Signature Matrix) is compared to the coherence binary vector which contains residuals’ state.
In this work, we propose to combine fuzzy approach with adaptive thresholds method in order to improve FDI system efficiency.
This paper is organized as follows: In section 2, adaptive thresholds generation method is presented. In section 3, a fuzzy logic approach for on-line FDI is detailed. The proposed adaptive fuzzy FDI approach is described in section 4. Section 5 presents the benchmark used to test the proposed method. And finally, simulation results and a comparison with the adaptive thresholds based method are given in section 6.
II. THE ROBUST THRESHOLDS GENERATION METHOD FOR
FDI
From the BG model in derivative causality, we can deduce ARRs expressions which are determined from the structural equations in junctions 0 and 1.
Final expression of the ARRs has the following structure [17]:
ARR : r (θi) =0
Where θi represents the system’s physical parameters.
The sensitivity analysis of a residual studies how a small perturbation Δθi around a nominal value of a parameter θi affects the residual.
The sensitivity expression Sij is given by:
i j
ij
j
( ) rS
Where Sij is the sensitivity of residual ri with respect to a parameter θj.
Determination of the numerical value of the sensitivity Sij allows the determination of residuals’ variation for a given variation Δθj of the parameter θj, this variation is given by:

644
i ij jr S .
However, every component of a real physical system is affected by uncertainties which present the deviations of the parameters around their nominal values without affecting normal operating mode of the system.
In fact, for a residual r depending on m physical parameters, the residual‘s variation is given by:
1 2
1 2
m
m
r r r r ....
By applying the absolute value:
1 2 m
1 2 m
r r rΔ r = Δθ + Δθ +....+ Δθ
θ θ θ
1 2
1 2
m
m
r r r r ....
Then
1 1
1 1
m m
m m
r r r r .... r ....
And residual’s variation is then bounded by:
min maxΔ r <Δ r<Δ r
Where:
1 2
1 2
min m
m
r r r r ....
1 2
1 2
max m
m
r r r r ....
Assuming r0 is the value of the residual r in normal operating mode; the residual’s normal operating mode thresholds will be given by:
0 min 0 maxr +Δ r <r<r +Δ r
For fault detection, violation of the determined thresholds is then considered as a fault symptom.
III. FUZZY METHOD FOR FDI
From the residuals values, two features can be determined:
The absolute value of the residuals: r
Residuals’ variation over a sliding time window: d
111
t N
i t
d r( i ) r( i )N
The choice of the parameter N depends on the residuals’ variations and the noise effects, it is fixed experimentally until we extract the signal trend, this parameter improves the
robustness of the decision but it causes detection delay which affects the proposed method performances.
The descriptor sets associated with each feature fuzzy partition are:
r= {“SMALL”, “LARGE”}
d= {“SMALL”, “LARGE”}
These two variables are fuzzified using two trapezoidal membership functions (Fig. 1). So, 4 parameters have to be determined for each function.
Figure 1. Fuzzy sets of the residuals
The trapezoidal boundaries of the set SMALL are given by:
r : μsmall=[0, 0, r-max, Rmin]
d : μsmall=[0, 0, d-max, Dmin]
And for the set LARGE, are given by:
r : μLarge=[r-max, Rmin, Rmax, Rmax]
d : μLarge=[d-max, Dmin, Dmax, Dmax]
Where:
r-max respectively d-max is the maximum value of the residual respectively residual variation in normal operating mode
Rmin = Kr. r-max
Dmin= Kd. d-max
Rmax respectively Dmax: is the maximum value respectively variation of the concerned residual.
Kr, Kd: are fixed constants determined experimentally, their values influence the sensitivity of the detection system.
Detection decision is summarized in Table 1:
TABLE I. RULES BASE OF THE FUZZY SYSTEM
r
d Small Large
Small Small Large
Large Large Large
From this table, the next following rules are deduced:
If (r-i is Large) or (d-i is Large) then (Fault_index-i is Large)
If (r-i is Small) and (d-i is Small) then (Fault_index-i is Small)

645
Rules are obtained using MIN-MAX inference method, the MIN operator represents the logic function AND, and the MAX operator for the logic function OR.
The output of this fuzzy system is a fault index indicating whether the concerned residual is in normal operating mode or faulty mode (Fig. 2).
Figure 2. Residuals’ defuzzification
IV. THE PROPOSED FUZZY ADAPTIVE FDI METHOD
By combining the two previous methods, an adaptive Fuzzy Logic Mechanism (FLM) is deduced. The interesting point of the method is that the FLM changes according to the control while staying robust to parametric uncertainties for all operating points of the system.
The idea is to change the value r-max in the support of the fuzzy set in entrance which is the value of threshold of the normal operating mode of the system by the adaptive threshold value ΔRmax given by equation 9 as shown by Fig. 3. Then, any variation in control will generate modification in the normal operating mode thresholds of residuals, these thresholds will be used in the fuzzy logic mechanism to generate an adaptive fuzzy logic mechanism.
Figure 3. Residuals fuzzy sets supports
Where:
ΔRmax: is the normal operating mode adaptive threshold,
Rmin = Kr. ΔRmax
Rmax: is the maximal value of the residual in presence of fault.
For the residual’s variation, the following supports represented by Fig. 4 are used:
Figure 4. Residuals variation’s fuzzy sets supports
Where:
Δdmax : is the maximum residual’s variation in fault free case, it’s equal to Δdmax=2* ΔRmax (since the thresholds are symmetric the variation of the residual cannot exceed 2* ΔRmax)
Dmin= Kd. Δdmax
Dmax : is the maximal residual’s variation in presence of fault.
So, adaptive fuzzification which is changing according to the control is obtained. The inference mechanism as well as the defuzzification rules has not to be modified.
To isolate the faulty component, the FSM can be rewritten by replacing “1” by "Large" and “0” by "Small". This allows writing inference rules in the form:
IF Fault_index_1 is ("Small"/"Large") and Fault_index_2 is ("Small"/"Large")…and Fault_index_N is ("Small"/"Large") THEN Fault_j is ("Small"/"Large").
V. APPLICATION EXAMPLE
A. Presentation of the benchmark:
Let us consider the following hydraulic system (Fig. 5):
Figure 5. Real hydraulic system
This system is composed of three tanks T1, T2 and T3 respectively of diameters D1, D2 and D3; water level in tanks, H1, H2 and H3 (proportional respectively to the pressures P1, P2 and P3) is measured by 3 level sensors. This system is fed by two pumps which deliver flows Sf1 (flow of entrance on T1) and Sf2 (flow of entrance on T3).
Tanks T1 and T2 communicate through valve V12, tanks T2 and T3 communicate through valve V23 of diameter Sv. Each tank has a draining valve noted Vi (i=1 to 3). Two flow sensors are placed in the exit of valve 1 and 3.
In normal operating mode, it is assumed that all valves are open.
Flow of pump 1 vary according to the following variation

646
3
3
3
3
3
0.00025 m / s if 0 t 3000
0.0005 m / s if 3000 t 5000
sf 1 0.00025 m / s if 5000 t 7000
0.0003 m / s if 7000 t 9000
0.00025 m / s if 9000 t 10000
B. BG modelling and generation of ARRs:
A procedure described in [5] allows elaborating the non linear BG model of the system in integral causality as well as the corresponding model in derivative causality (Fig. 6).
Figure 6. BG model in preferred differential causality
From the model of Fig. 6, ARRs are established from structural equations in junctions 0:
ARR 1:
.
1 11 1 1 1 1
12
12 1 2 1 2
dP 2.SSf -C -μ . .sign(P ). P
dt ρ
2.S-μ . sign(P -P ). P -P 0
ρ
ARR 2:
12 2 2
12 1 2 1 2 2 2
23
2 2 23 2 3 2 3
2.S dP 2.S μ . .sign(P -P ). P -P -C -μ .
dtρ ρ
2.S.sign(P ). P -μ . .sign(P -P ). P -P =0
ρ
ARR 3:
23 3
23 2 3 2 3 3
3
3 3 3
2.S dPμ . .sign(P -P ). P -P +Sf2-C
dtρ
2.S-μ . .sign(P ). P =0
ρ
From equations in 1-junctions, the following residuals are deduced:
ARR 4:
4 01
1 1 1
2.Sf μ . .sign(P ). P
ρ
ARR 5:
19 03
3 3 3
2.Sf μ . .sign(P ). P
ρ
The FSM (Table II) can be elaborated from the structured residuals (11), (12), (13), (14) and (15).
TABLE II. FAULT SIGNATURE MATRIX
r1 r2 r3 r4 r5
Sf1 1 0 0 0 0
Sf2 0 0 1 0 0
V1 1 0 0 1 0
V12 1 1 0 0 0
V2 0 1 0 0 0
V23 0 1 1 0 0
V3 0 0 1 0 1
VI. SIMULATION RESULTS
In this section, a comparison between Adaptive Binary FDI and Adaptive Fuzzy FDI methods is made.
For simulation, we used the matlab/simulink environment, and supposed that all uncertainties are equals to ±5%.
A. Case of 5% uncertainty:
1) Normal operating mode:
In fault free case, residuals are close to zero. The Binary
Logic and the Fuzzy FDI methods give the same isolation results (Fig. 7).
0 1000 2000 3000 4000 5000 6000 7000 8000 9000 10000-1
0
1
defS
F1
0 1000 2000 3000 4000 5000 6000 7000 8000 9000 10000-1
0
1
defS
F2
0 1000 2000 3000 4000 5000 6000 7000 8000 9000 10000-1
0
1
defR
1
0 1000 2000 3000 4000 5000 6000 7000 8000 9000 10000-1
0
1
defR
2
0 1000 2000 3000 4000 5000 6000 7000 8000 9000 10000-1
0
1
defR
3
0 1000 2000 3000 4000 5000 6000 7000 8000 9000 10000-1
0
1
defR
12
0 1000 2000 3000 4000 5000 6000 7000 8000 9000 10000-1
0
1
defR
23
Time (s)
Figure 7. BG Residuals in fault free case
We note that all fault indexes are equals to zero showing that there is no faulty components.
2) Valve V1 fault :
Valve V1 is totally closed in intervals 2000s to 4000s and
7000s to 8500s.
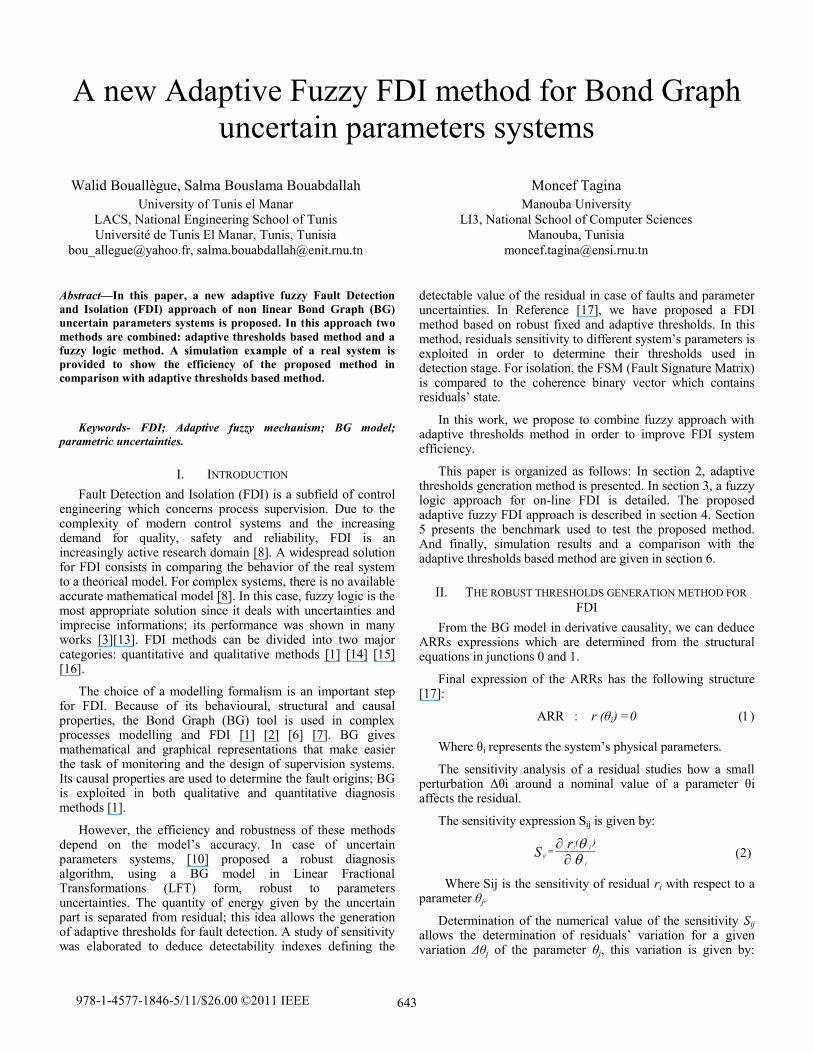
a) Adaptive thresholds FDI method: When the fault
occurs, residuals r1 and r4 pass to 1. Others residuals exceed
also their thresholds causing some detection errors.
Detection results are processed by the FSM, results are presented in Fig.8.
647
0 1000 2000 3000 4000 5000 6000 7000 8000 9000 10000-1
0
1
defS
F1
FSM
0 1000 2000 3000 4000 5000 6000 7000 8000 9000 10000-1
0
1
defS
F2
0 1000 2000 3000 4000 5000 6000 7000 8000 9000 100000
0.5
1
defR
1
0 1000 2000 3000 4000 5000 6000 7000 8000 9000 10000-1
0
1
defR
2
0 1000 2000 3000 4000 5000 6000 7000 8000 9000 10000-1
0
1
defR
3
0 1000 2000 3000 4000 5000 6000 7000 8000 9000 10000-1
0
1
defR
12
0 1000 2000 3000 4000 5000 6000 7000 8000 9000 10000-1
0
1
defR
23
Time(s)
Figure 8. Isolation by adaptive thresholds method
When the fault occurs, only valve V1’s fault index varies and passes to one, due to detection errors some perturbations on this index are observed, while others different components’ fault indexes still at 0.
b) Fuzzy logic FDI method: Compared to the adaptive
thresholds based method, the proposed adaptive fuzzy method
proved to be more robust to parameters uncertainties. The
proposed detection approach filters all perturbations in
residuals and detects faults in residuals 1 and 4. All others
residuals fault indexes still equals or near to zero.
The enhancements in the detection stage affect isolation results. Faulty component (V1) is perfectly isolated (Fig. 9).
0 1000 2000 3000 4000 5000 6000 7000 8000 9000 10000-1
0
1
defS
F1
Fuzzy FSM
0 1000 2000 3000 4000 5000 6000 7000 8000 9000 10000-1
0
1
defS
F2
0 1000 2000 3000 4000 5000 6000 7000 8000 9000 100000
0.5
1
defR
1
0 1000 2000 3000 4000 5000 6000 7000 8000 9000 10000-1
0
1
defR
2
0 1000 2000 3000 4000 5000 6000 7000 8000 9000 10000-1
0
1
defR
3
0 1000 2000 3000 4000 5000 6000 7000 8000 9000 10000-1
0
1
defR
12
0 1000 2000 3000 4000 5000 6000 7000 8000 9000 10000-1
0
1
defR
23
Time(s)
Figure 9. Isolation by Fuzzy FSM
B. Case of no well estimated uncertainties:
In real systems, the wear of components can cause a little change in parameters uncertainties. So, we will study the effects of these faulty estimated uncertainties in the performances of the fuzzy FDI system compared to the classical one. In this case, we suppose that the real system is affected by 7% uncertainty while the model has 5%.
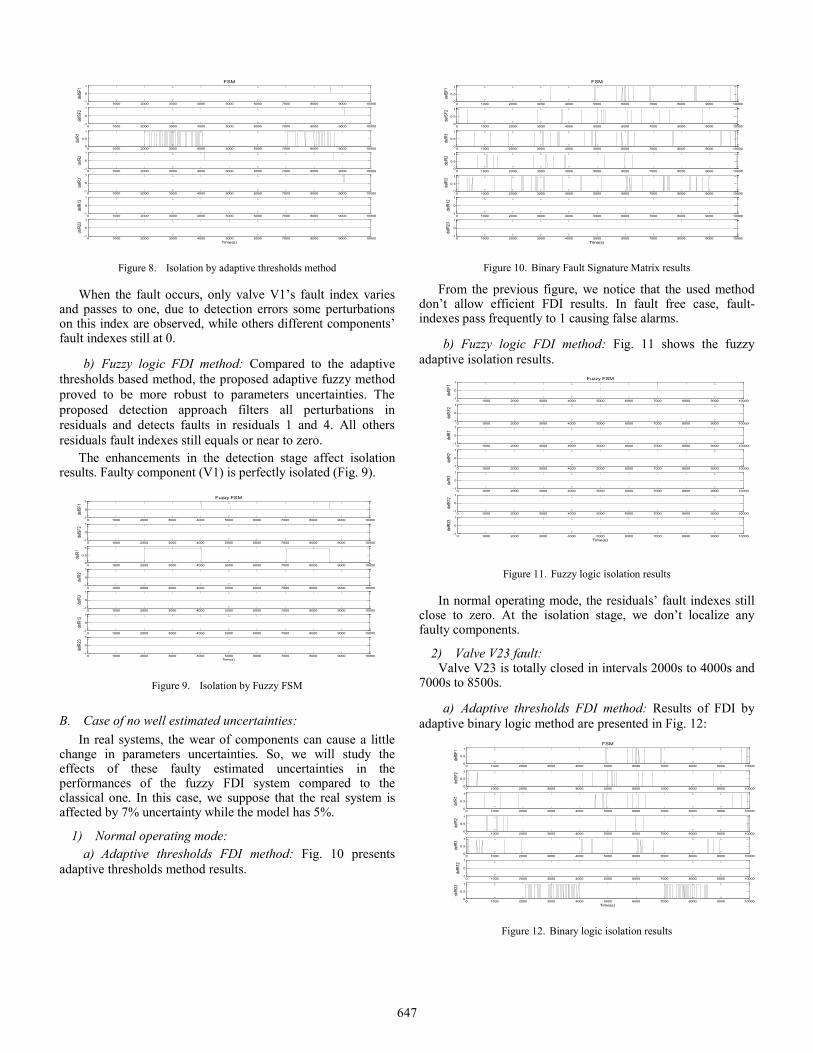
1) Normal operating mode:
a) Adaptive thresholds FDI method: Fig. 10 presents
adaptive thresholds method results.
0 1000 2000 3000 4000 5000 6000 7000 8000 9000 100000
0.5
1
defS
F1
FSM
0 1000 2000 3000 4000 5000 6000 7000 8000 9000 100000
0.5
1
defS
F2
0 1000 2000 3000 4000 5000 6000 7000 8000 9000 100000
0.5
1
defR
1
0 1000 2000 3000 4000 5000 6000 7000 8000 9000 100000
0.5
1
defR
2
0 1000 2000 3000 4000 5000 6000 7000 8000 9000 100000
0.5
1
defR
3
0 1000 2000 3000 4000 5000 6000 7000 8000 9000 10000-1
0
1
defR
12
0 1000 2000 3000 4000 5000 6000 7000 8000 9000 10000-1
0
1
defR
23
Time(s)
Figure 10. Binary Fault Signature Matrix results
From the previous figure, we notice that the used method don’t allow efficient FDI results. In fault free case, fault-indexes pass frequently to 1 causing false alarms.
b) Fuzzy logic FDI method: Fig. 11 shows the fuzzy
adaptive isolation results.
0 1000 2000 3000 4000 5000 6000 7000 8000 9000 10000-1
0
1
defS
F1
Fuzzy FSM
0 1000 2000 3000 4000 5000 6000 7000 8000 9000 10000-1
0
1
defS
F2
0 1000 2000 3000 4000 5000 6000 7000 8000 9000 10000-1
0
1
defR
1
0 1000 2000 3000 4000 5000 6000 7000 8000 9000 10000-1
0
1de
fR2
0 1000 2000 3000 4000 5000 6000 7000 8000 9000 10000-1
0
1
defR
3
0 1000 2000 3000 4000 5000 6000 7000 8000 9000 10000-1
0
1
defR
12
0 1000 2000 3000 4000 5000 6000 7000 8000 9000 10000-1
0
1
defR
23
Time(s)
Figure 11. Fuzzy logic isolation results
In normal operating mode, the residuals’ fault indexes still close to zero. At the isolation stage, we don’t localize any faulty components.
2) Valve V23 fault: Valve V23 is totally closed in intervals 2000s to 4000s and
7000s to 8500s.
a) Adaptive thresholds FDI method: Results of FDI by
adaptive binary logic method are presented in Fig. 12:
0 1000 2000 3000 4000 5000 6000 7000 8000 9000 100000
0.5
1
defS
F1
FSM
0 1000 2000 3000 4000 5000 6000 7000 8000 9000 100000
0.5
1
defS
F2
0 1000 2000 3000 4000 5000 6000 7000 8000 9000 100000
0.5
1
defR
1
0 1000 2000 3000 4000 5000 6000 7000 8000 9000 100000
0.5
1
defR
2
0 1000 2000 3000 4000 5000 6000 7000 8000 9000 100000
0.5
1
defR
3
0 1000 2000 3000 4000 5000 6000 7000 8000 9000 10000-1
0
1
defR
12
0 1000 2000 3000 4000 5000 6000 7000 8000 9000 100000
0.5
1
defR
23
Time(s)
Figure 12. Binary logic isolation results

648
We notice that the residuals’ fault indexes and components’ fault indexes present perturbations and passages from 0 to 1. Those perturbations are due to the faulty estimated parametric uncertainties that are not taken into account when determining the adaptative thresholds. So, the determined thresholds are frequently exceeded causing then false alarms.
b) Fuzzy logic FDI method: In the faults intervals, we
notice that only reisuals r2 and r3 passes to 1 while others
residuals still equal to zero, this indicates a fault affecting
V23. Outside these intervals, all indexes are equals to 0
signaling a normal operating mode of the system.
The Fuzzy FSM gives the results of Fig. 13.
0 1000 2000 3000 4000 5000 6000 7000 8000 9000 10000-1
0
1
defS
F1
Fuzzy FSM
0 1000 2000 3000 4000 5000 6000 7000 8000 9000 10000-1
0
1
defS
F2
0 1000 2000 3000 4000 5000 6000 7000 8000 9000 10000-1
0
1
defR
1
0 1000 2000 3000 4000 5000 6000 7000 8000 9000 10000-1
0
1
defR
2
0 1000 2000 3000 4000 5000 6000 7000 8000 9000 10000-1
0
1
defR
3
0 1000 2000 3000 4000 5000 6000 7000 8000 9000 10000-1
0
1
defR
12
0 1000 2000 3000 4000 5000 6000 7000 8000 9000 100000
0.5
1
defR
23
Time(s)
Figure 13. Fuzzy logic isolation results
Fig. 13 shows clearly a perfect isolation of the faulty component since fault index of component V23 reaches 1 when the fault occurs. While the others components don’t show any abnormal bahaviour.
VII. CONCLUSION
In this paper an adaptive fuzzy FDI method is proposed. The detection is based on a fuzzy logic method combined with an adaptive thresholds generation approach, so, an adaptive fuzzy logic detection mechanism changing according to the control is generated. For isolation, the FSM is transformed into fuzzy rules allowing the generation of components’ fault indexes indicating the state of components.
According to simulations, the proposed approach proved to be more efficient and robust compared to the adaptive thresholds binary method. In case of well known uncertainties, simulations show that the direct method is very sensitive to the value of uncertainty; it requires its exact value which is not always provided and even if it is the case some variations in the residuals’ behavior cannot be predicted mathematically which can cause false alarms. The superiority of the adaptive proposed method is shown especially in case of faulty estimated uncertainties, we notice there the improvements given by the new approach by localizing the exact cause of fault reducing then false alarms.
REFERENCES
[1] A.K. Samantaray, B. Ould Bouamama, “Model-based Process Supervision: A Bond Graph Approach,” Springer, 2008.
[2] A.K. Samantaray, K. Medjaher, B. Ould Bouamama, M. Staroswiecki, G. Dauphin-Tanguy, “Diagnostic bond graphs for online fault detection and isolation,” In Simulation Modelling Practice and Theory, 2006.
[3] A. Evsukoff, S. Gentil, J. Montmain, “Fuzzy reasoning in co-operative supervision systems”, Control Engineering Practice 8, 2000, pp. 389-407.
[4] Cordier, M.O., Dague, P., Dumas, M., Levy, F., Montmain, J., Staroswiecki, M., and Trave-Massuyes, L. “Conflicts versus Analytical Redundancy Relations: a comparative analysis of the Model-based Diagnosis approach from the Artificial Intelligence and Automatic Control perspectives”, IEEE Trans. on Systems, Man, and Cybernetics (Part B), 34(5):2163-2177, 2004.
[5] G. Biswas, X. Koutsoukos, A. Bregon, B. Pulido, “Analytic Redundancy, Possible Conflicts, and TCG-based Fault Signature Diagnosis applied to Nonlinear Dynamic Systems” In Proceedings of the IFAC-Safeprocess, Barcelona, Spain, 2009.
[6] G. Dauphin-Tanguy, “Les bond graphs,” Hermès, Paris 2000.
[7] G. Dauphin-Tanguy, M. Tagina, “La méthodologie bond graph: Principes et applications ,” Centre de publications universitaires, Tunis 2003.
[8] J. Korbicz,J. M. Koscielny,Z Kowalczuk “Fault diagnosis: models, artificial intelligence, applications,” Springer Verlag Berlin Heidelberg 2004.
[9] M.A. Djeziri, B. Ould Bouamama, R. Merzouki, “Modelling and robust FDI of steam generator using uncertain bond graph model,” . In Journal of process contro Volume 19, Issue 1, January 2009, pp149-162.
[10] M. Staroswiecki, “Quantitative and qualitative model for fault detection and isolation,” In Mechanical Systems and Signal Processing, Volume 14, Issue 3, May 2000, pp 301-325.
[11] M. Tagina, “L'application de la modélisation bond graph à la surveillance des systèmes complexes,” PhD Thesis, University of Lille1, France 1995.
[12] P. M. Frank, B. Köppen-Seliger, “Fuzzy logic and neural network applications to fault diagnosis“, International Journal of Approximate Reasoning, Volume 16, Issue 1, January 1997, pp 67-88.
[13] S. Bouslama Bouabdallah, M. Tagina, “A fuzzy approach for fault detection and isolation of uncertain parameter systems and comparison to binary logic,” IFAC, IEEE 3rd International Conference on Informatics in Control, Automation and Robotics, ICINCO 2006. Portugal, Intelligent Control Systems and Optimization, pp 98-1066.
[14] V. Venkatasubramanian, R. Rengaswamy, S. N. Kavuri, K. Yin, “A review of process fault detection and diagnosis Part I: Quantitative model-based methods”, Computers and Chemical Engineering 27, 2003, pp 293-311.
[15] V. Venkatasubramanian, R. Rengaswamy, S. N. Kavuri, K. Yin, A review of process fault detection and diagnosis Part II: Qualitative models and search strategies, Computers and Chemical Engineering 27, 2003, pp 313-326.
[16] V. Venkatasubramanian, R. Rengaswamy, S. N. Kavuri, K. Yin, “A review of process fault detection and diagnosis Part III: Process history based methods”, Computers and Chemical Engineering 27, 2003, pp 327-346.
[17] W. Bouallègue, S. Bouslama Bouabdallah, M. Tagina, “Diagnosis of Bond Graph modeled uncertain parameters systems using residuals sensitivity”, Proceedings of the IEEE International conference on Systems, Man, and Cybernetics, pp 593-600, Turkey, 2010.
[18] W. Bouallègue, S. Bouslama Bouabdallah, M. Tagina, “Causal approaches and Fuzzy logic in FDI of Bond Graph uncertain parameters systems”, 2011 International Conference on Communications, Computing and ControlApplications (CCCA’11), Tunisia, 2010.