A N N U A L R E P O R T 2 0 0 9
128
ANNUAL REPORT 2009
Transcript of A N N U A L R E P O R T 2 0 0 9

A N N U A L R E P O R T 2 0 0 9

Table of Contents
1
2
6
7
12
17
19
21
22
23
25
33
Financial Highlights
Message from the Chairman & Chief Executive Officerand the President & Chief Operating Officer
Organizational Chart
Branded Consumer Foods Group Philippines
The Resurgence of Beverages
Branded Consumer Foods Group International
Agro-Industrial Group
Commodity Foods Group
Perfectly Positioned for the Surge
Employees Offer Gifts to Jack ‘n Jill Village Families
Board of Directors
Financial Statements
Photo credits: Tourism Malaysia, Singapore Tourism Board, Tourism Authority of Thailand, Mary Joy Rosete

Financial Highlights
(in million pesos, except per share data) Years ended September 30 2009 vs. 2008
NET SALESINCOME FROM OPERATIONSNET INCOME TO EQUITY HOLDERS Total Assets Total Liabilities Stockholders’ Equity Per Share Earnings Book Value
50,453 4,651 3,888
60,918 24,432 36,486
1.81 16.68
45,455 3,688
381
57,931 25,787 32,144
0.17 14.65
37,720 3,180 5,557
58,834 23,835 34,999
2.50 15.44
11%26%
920%
5%-5%14%
965%14%
4,998 963 3,507
2,987 (1,355) 4,342
1.64 2.03
2009 2008 2007 Inc/(Dec) % growth
60,000
50,000
40,000
30,000
20,000
10,000
6,000
5,000
4,000
3,000
2,000
1,000
Net Sales (in million pesos)
Total Assets (in million pesos) Stockholder’s Equity (in million pesos)
Net Income Attributable to Equity Holders(in million pesos)
62,000
61,000
60,000
59,000
58,000
57,000
56,000
55,000
54,000
53,000
37,000
36,000
35,000
34,000
33,000
32,000
31,000
30,000
29,000
2007 2008 2009
2007 2008 2009
2007 2008 2009
2007 2008 2009
1

Message
Against this backdrop, your company, Universal
Robina Corporation (URC), delivered
commendable results, with sales and profits
continuing their robust growth.
FROM THE CHAIRMAn & CHIEF ExECuTIVE OFFICERAnD THE PRESIDEnT & CHIEF OPERATInG OFFICER
To our shareholders,
The year 2009 was a year of ups and downs for the global economy. Developed markets were near collapse at the start of the year, with major financial firms going under from lack of liquidity. Commodity prices, after reaching all-time highs in 2008, continued sliding downward on the back of demand destruction and declining industrial output.
However, the effects of the global economic slowdown on the local economy were not as bad as first feared. Exports suffered due to slumping global demand, but showed signs of recovery by the tail end of 2009. Remittances continued to grow, albeit at a slower clip, despite fears that layoffs abroad would affect the amount of money sent home by overseas contract workers. unemployment held steady at around 7.5%, and inflation, which had momentarily neared the 10% range in 2008, went down to an average of 3.2% for 2009, thanks to lower prices for fuel, rice, and other basic goods.
Against this backdrop, your company, universal Robina Corporation (uRC), delivered commendable results, with sales and profits continuing their robust growth.
Our net sales reached Php 50.453 billion, 11.0% higher than last year, on the strength of the branded consumer foods group. We experienced strong operating income growth of 26.1% to hit Php 4.651 billion, on better profitability both in our Philippine and international branded consumer food operations. The company’s gross profit margin grew by around 2 percentage points, as cost of goods sold dropped in line with lower commodity prices.
uRC’s net income for fiscal 2009 saw a twelve-fold increase to Php 4.108 billion, from the Php 341 million recorded last year. uRC benefited from the recovering financial markets as we booked mark-to-market gains in our bond holdings, reversing the losses experienced last year. uRC’s core earnings before tax, which is operating profit after net finance costs, and after equity earnings and other expenses-net, grew 19.7% for fiscal year 2009, reaching Php 4.188 billion from the Php 3.499 billion reported in the same period last year. Operating income before interest, taxes, depreciation, and amortization (EBITDA) showed similarly strong growth, up 20.5% to Php 7.690 billion from last year’s figure of Php 6.382 billion.
Our balance sheet remains healthy. Despite the increase in sales volumes we also managed to trim inventory levels 21.3% versus the end of fiscal 2008, as commodity prices normalized and as we carefully managed our working capital levels. Total assets
2

grew to Php 60.918 billion in fiscal 2009, from Php 57.931 billion last year. uRC’s financial debt declined significantly, from Php 20.548 billion at the end of fiscal 2008 to Php 17.912 billion at the end of fiscal 2009. This led total liabilities to a 5.3% decline at the end of the year, at Php 24.431 billion versus Php 25.787 billion at the end of fiscal 2008. Shareholders’ equity grew, from Php 32.144 billion last year to Php 36.486 billion at the end of fiscal 2009.
uRC issued a Php 3 billion note in March 2009, in preparation for prepayment of our $200 million bond due in 2012 (with a put option in 2010). The exercise of this put option was limited, and we used most of the note proceeds to pay down many of our current liabilities and trust receipts. uRC ended the year in a net debt position of less than Php 300 million, and our net gearing ratio (calculated as financial debt less cash and cash equivalents, over equity) is an insignificant 0.76%, versus 18.8% last year.
STRONG SALES GROWTH Branded Consumer Foods Group
The Branded Consumer Foods Group (BCFG), comprised of BCFG Philippines, BCFG International, and Packaging, accounted for 77.6% of total uRC sales in the fiscal year ended September 30, 2009. Revenues hit Php 39.161 billion in fiscal 2009, or 12.7% higher than last year. Operating income surged 95.3%, hitting Php 3.810 billion this year.
BCFG Philippines
Domestic BCFG, which accounted for 52.7% of total uRC consolidated sales, showed strong growth this fiscal year. Sales reached Php 26.567 billion, or 10.7% higher than fiscal 2008.
Our Snackfoods business drove this growth, surging 12.4% to reach Php 16.190 billion in fiscal 2009. We continued leveraging our market leadership and strong distribution, and added the Granny Goose heritage brand into our lineup of products. We remain unchallenged as the number one Snackfoods player in the country, with dominant share positions in Savory Snacks, Candies, Chocolates, Cookies, and Pretzels. Our Beverage business reached Php 5.973 billion in sales, up 2.9% in sales value compared to last year. Great Taste, our banner coffee brand, led the growth, with our Rosario coffee plant operating at full production capacity due to strong sales. Sales of our C2 Green Tea were below expectations from strong competition in the non-carbonated space, as well as a resurgence of advertising and promotions from carbonated soft drinks.
In our Grocery division, sales grew 8.9% to Php 2.968 billion, on the back of our noodle products which made significant inroads against its major competitors. Hunts tomato based products also continued to perform admirably.
On the operating income side, uRC implemented price increases at the end of fiscal 2008 to defend its margins entering fiscal 2009. Coupled with the collapse of commodity prices in the middle of the year, BCFG Philippines saw record high profitability, with margins surging over 300 basis points versus the previous year. Operating income in fiscal 2009 reached Php 3.268 billion, up significantly against the Php 2.270 billion recorded last year.
BCFG International
In fiscal year 2009, BCFG International achieved significant revenue growth and went into profitability for the first time. It accounted for 22.9% of total uRC sales. Dollar sales surged to uS$ 240 million, or 11.7% higher than last year while in peso terms, BCFG International grew 24.4%, hitting Php 11.533 billion. uRC Thailand took the lion’s share of the revenue, with uS$ 96 million in sales for fiscal 2009. uRC Vietnam more than doubled sales to hit uS$ 65 million, on the back of the rapid growth of C2 Green Tea in that country
Operating income was reported at uS$ 13.9 million this fiscal year, reversing the loss of uS$ 7.3 million last year. This was on the back of margin expansion as the business reached scale and as input costs declined, particularly in Thailand, Malaysia and Vietnam. Due to tremendous local demand in Vietnam, we had to install additional C2 lines and we are now the market leader in ready-to-drink tea in Ho Chi Minh.
3
URC Packaging
Packaging sales declined to Php 1.061 billion, down 29.2% versus last year, as the global economic crisis affected export sales volumes. Customers stayed on the sidelines and did not restock as selling prices dropped as much as 40%. The division had a loss of Php 125 million in fiscal 2009, against a loss of Php 3 million in the previous year.
Agro-Industrial Group
The Agro-Industrial Group, consisting of the Feeds and the Farms divisions, accounted for 11.6% of uRC’s total revenues in fiscal 2009. net sales amounted to Php 5.846 billion, growing 5.0% against last year. Operating income was Php 374 million, up 29.4% versus last year.
Feeds
The animal feeds business was slightly below last year, with net sales at Php 2.736 billion against Php 2.768 billion last year. Commercial sales volumes declined, as the Philippines’ hog population went down 13% versus last year, and as competition increased. However, operating income grew 149.7% versus last year, hitting Php 387 million. The division’s profitability improved on lower input costs as prices of commodities such as corn, feed wheat, and soya declined.
Farms
Farms revenues posted commendable growth of 11.0% versus last year to P3.110 billion despite challenges faced by the industry, such as lower hog populations, lower consumption due to disease scares, and increased pork importation. The farms business posted an operating loss of Php 13 million for fiscal year ended September 2009, as the division suffered profit margin erosion due to higher feed costs at the start of the year. However, the 4th quarter of fiscal 2009 already showed recovery, with operating income substantially offsetting the losses in the first three quarters.
Commodities Food Group
The commodities food group, composed of our Sugar and Flour divisions, saw net sales growth of 6.3% in fiscal 2009, hitting Php 5.446 billion. This accounted for 10.8% of the company’s total revenues. Internal transfers to the branded consumer foods group declined 13.1% to Php 3.249 billion, due to lower orders as BCFG controlled inventories to improve working capital levels. Operating income was down 30.6% this year, to Php 1.315 billion.
Flour
Flour gross sales value was flat versus last year at Php 5.092 billion, primarily due to lower flour prices as the government mandated some price rollbacks in the first half of the fiscal year. This was tempered by higher sales volumes to outside customers, leading to net sales growth of 5.1% versus last year.
The division had operating income of Php 391 million, down 51.2% versus last year. This was due to the margin squeeze brought about by the combination of higher-costing wheat inventory, and lower selling prices vs. the previous year.
Sugar
uRC Sugar faced challenges in fiscal 2009, with gross sales down 3.4% to Php 3.603 billion. net sales were up 8.7%, to Php 1.957 billion. The division had to contend with a lower sugarcane harvest in the country, as high fertilizer prices in 2008 coupled with typhoons in sugarcane-growing areas affected production volumes.
Operating income declined 15.6% to Php 924 million on higher operating costs from the start up of our new SOnEDCO refinery and lower sugar production volumes
WHAT LIES AHEAD We are encouraged by the numerous opportunities that we see in fiscal 2010. The coming national presidential elections in May 2010 will fuel consumer spending and increase topline growth, while normalized commodity prices and correspondingly lower input costs are expected to improve margins going forward. We expect all divisions to have a strong showing this fiscal year.
For BCFG Philippines, we expect sales to continue growing on the back of our new products. This will be especially true for Beverages, where we will increase the productivity of our PET lines and launch new SKus targeted to specific trade channels, to expand consumer usage. We have already introduced several new products, including C2 Solo, C2 1.5 liters, and Coffee Twist, at the end of fiscal 2009, which have shown great promise based on initial results. We look forward to this continuing in 2010. On
We expect all divisions to have a strong showing
this fiscal year.
4
the profitability side, we expect operating margins to continue improving, as we aim to further extract efficiencies from manufacturing and distribution, and as we take advantage of lower input costs.
We will continue building BCFG International to scale and improve operating efficiencies in the countries we operate in. uRC will be expanding its production capacity via a new cookies line for Thailand, and the transfer of a snacks line to Malaysia. Vietnam will have an exciting year, as we open a new factory and operate additional PET production lines in Hanoi, to sell to the untapped northern Vietnam market.
For the Agro-Industrial Group, we expect 2010 to be a significant improvement over the previous year. Our Feeds sales volumes are seen to improve as backyard hog and poultry raisers are forecasted to return to business and as selling prices have normalized from last year’s highs. uRC is increasing its feed mill capacity in order to service more outside customers, and we expect this expansion to be completed within the year. The Farms business is headed for a strong year, as hog prices continue to rise and as demand begins to grow during the elections.
Our Commodities group was faced with challenges in 2009, but will have a tremendous recovery in 2010. We expect flour sales to be flattish on the back of further anticipated price decreases, but margins will expand significantly as we have fully depleted our higher-cost wheat inventories and have booked lower-cost freight contracts. We expect our sugar business will have a banner year, on the back of surging local demand and record-high world sugar prices in 2010. We are positioned to capture this upside, with recent expansions of our milling and refining capacities.
uRC will spend between Php 3 to 4 billion for capital expenditures in fiscal 2010, which will be financed by strong internal cashflows. Our high cash levels will also afford us the opportunity to evaluate any acquisition opportunities that come our way.
FINAL WORDS
We believe that over the uncertainty of the past year, we have steered your company carefully and safely through the troubled waters, and have ended the year on stronger footing. We would like to express our sincere appreciation to our Board of Directors, shareholders, trade partners, suppliers, employees, and consumers for your confidence in us over the past year. Rest assured that we will work hard to retain your trust, as we
continue towards uRC’s vision of being the best Philippine food and beverage conglomerate with a powerful presence throughout the ASEAn region and China.
Maraming salamat po,
James L. GoChairman and CEO
Lance Y. GokongweiPresident and COO
5
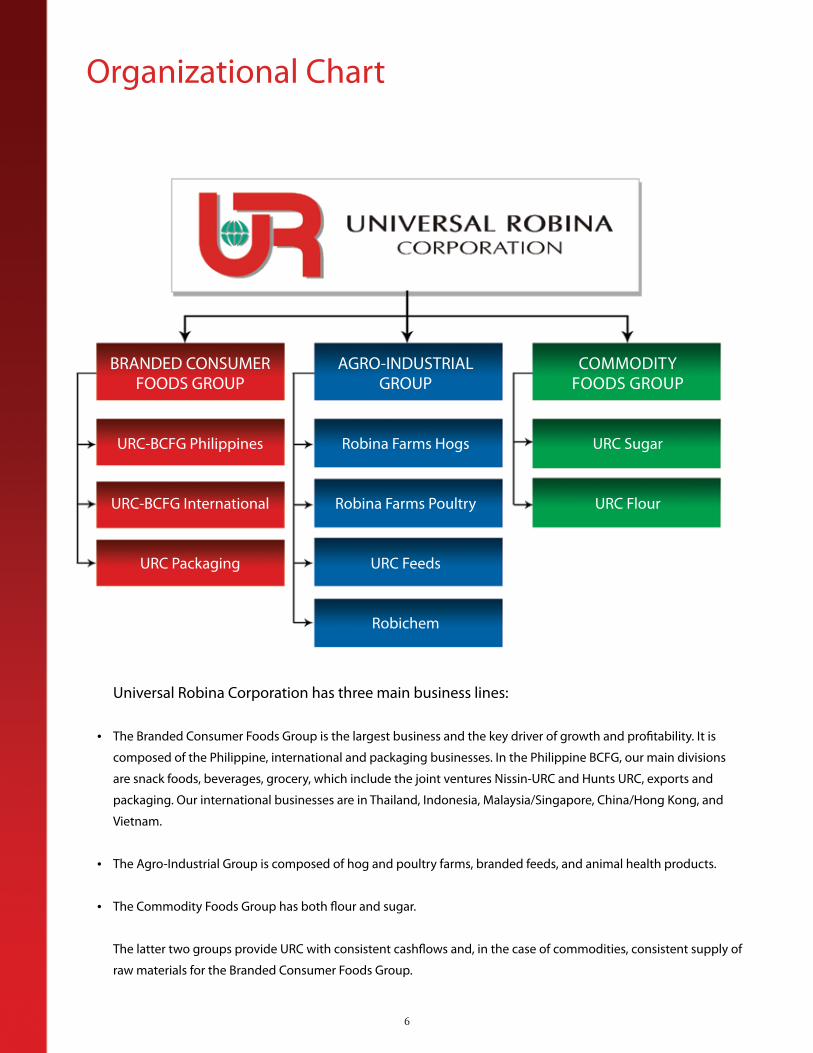
Organizational Chart
universal Robina Corporation has three main business lines:
The Branded Consumer Foods Group is the largest business and the key driver of growth and profitability. It is
composed of the Philippine, international and packaging businesses. In the Philippine BCFG, our main divisions
are snack foods, beverages, grocery, which include the joint ventures nissin-uRC and Hunts uRC, exports and
packaging. Our international businesses are in Thailand, Indonesia, Malaysia/Singapore, China/Hong Kong, and
Vietnam.
The Agro-Industrial Group is composed of hog and poultry farms, branded feeds, and animal health products.
The Commodity Foods Group has both flour and sugar.
The latter two groups provide uRC with consistent cashflows and, in the case of commodities, consistent supply of
raw materials for the Branded Consumer Foods Group.
•
•
•
6
BRAnDED COnSuMERFOODS GROuP
uRC-BCFG Philippines
uRC-BCFG International
uRC Packaging
COMMODITyFOODS GROuP
uRC Sugar
uRC Flour
AGRO-InDuSTRIALGROuP
Robina Farms Hogs
Robina Farms Poultry
uRC Feeds
Robichem

D O M E S T I C Branded Consumer Foods Group
universal Robina Corporation (uRC) is the leading branded convenience
food and beverage company in the Philippines. Touted as the country’s
first “Philippine multinational” as it has the widest geographical footprint
among local food manufacturers, uRC has blazed the trail for the branded
foods industry. The company has shaped the competitive landscape of local
consumer brands through its innovative products, wide distribution, and
high-impact marketing. uRC is best known for manufacturing and distributing
high-performing products such as Chippy, nova and other snack foods under
the Jack ‘n Jill mega brand, nissin and Payless instant noodles, as well as Hunt’s
tomato-based products.
uRC is also a trendsetter in the beverage industry with its coffee and ready-to-
drink products. It grew the local non-carbonated beverage market with the
successful launch and continuing promotion of C2 Cool & Clean Green Tea.
Building on the global trend towards health and wellness, C2 spearheaded
the expansion of a new and high-growth segment in the Philippine beverage
industry: the green tea segment. uRC built on that success with forays into
other areas of the non-carbonated beverage market, such as juices, energy
drinks, and ready-to-drink coffee, among others.
7
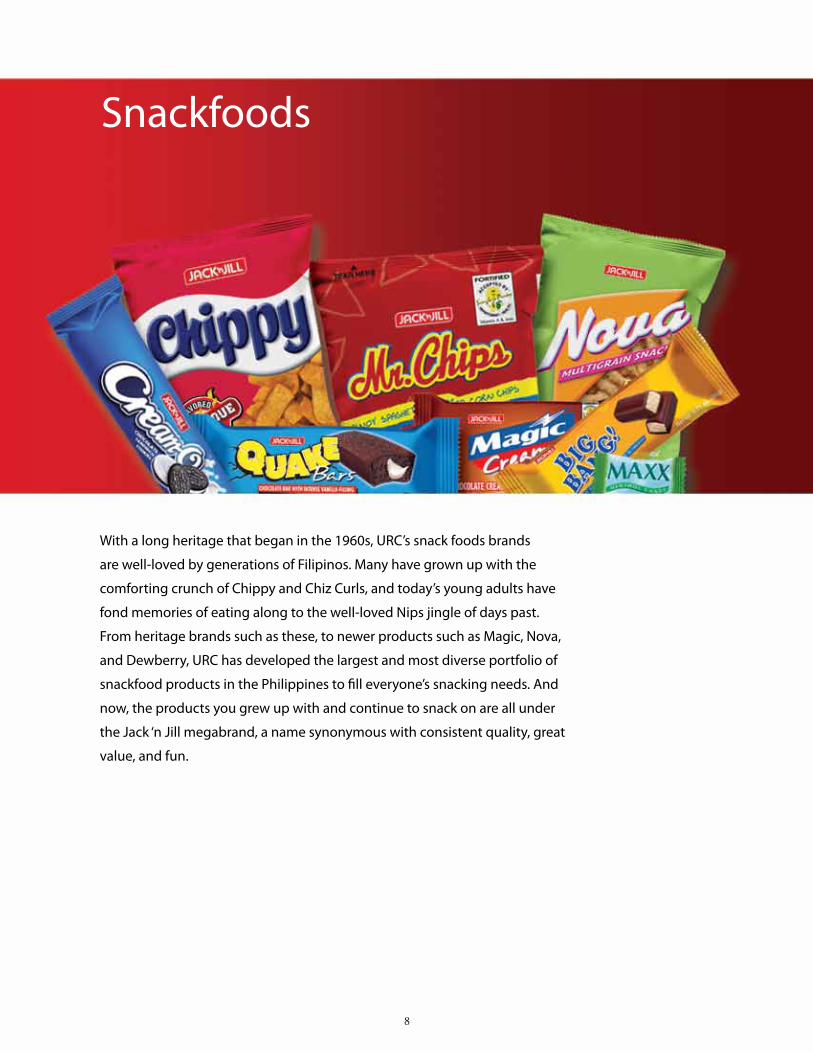
Snackfoods
With a long heritage that began in the 1960s, uRC’s snack foods brands
are well-loved by generations of Filipinos. Many have grown up with the
comforting crunch of Chippy and Chiz Curls, and today’s young adults have
fond memories of eating along to the well-loved nips jingle of days past.
From heritage brands such as these, to newer products such as Magic, nova,
and Dewberry, uRC has developed the largest and most diverse portfolio of
snackfood products in the Philippines to fill everyone’s snacking needs. And
now, the products you grew up with and continue to snack on are all under
the Jack ‘n Jill megabrand, a name synonymous with consistent quality, great
value, and fun.
8

SAVORY SNACKS BISCUITS
CAKES CANDIES
CHOCOLATES
uRC is the market leader in savory snacks, and has welcomed Granny Goose snacks into its fold.• Corn Chips – Chippy, Mr. Chips, Taquitos, Tostillas• natural Potato – Potato Chips, V-Cut• Fabricated Potato – Piattos, Roller Coaster• Extruded / Pelletized – Chiz Curls• Multi-Grain – nova• Mixed Snacks – Pic-A• Granny Goose – Tortillos, Kornets
uRC is one of the leading biscuit producers in the country.• Cookies – Presto, Cream-O, Dewberry• Crackers – Magic Flakes, Magic Creams, Magic
Flavors• Wafers – Hello! Coated, Hello! Pipers, Hello!
Glazed, Wafrets Sticks• Pretzels – Choco Pretzels, Knots
uRC is an innovative player in the cakes category.• Quake Bars• Quake Overload
uRC is the market leader in candies.• Hard Boiled – Maxx, Dynamite• Deposited – x.O.• Gummies / Jellies – Jojo Gummies• Lollipops – Star Pops• Marshmallows – Wiggles• Soft – Lush
uRC is the market leader in chocolates• Enrobed – Cloud 9, Big Bang, Chooey, Monster Munch• Panned – nips
9
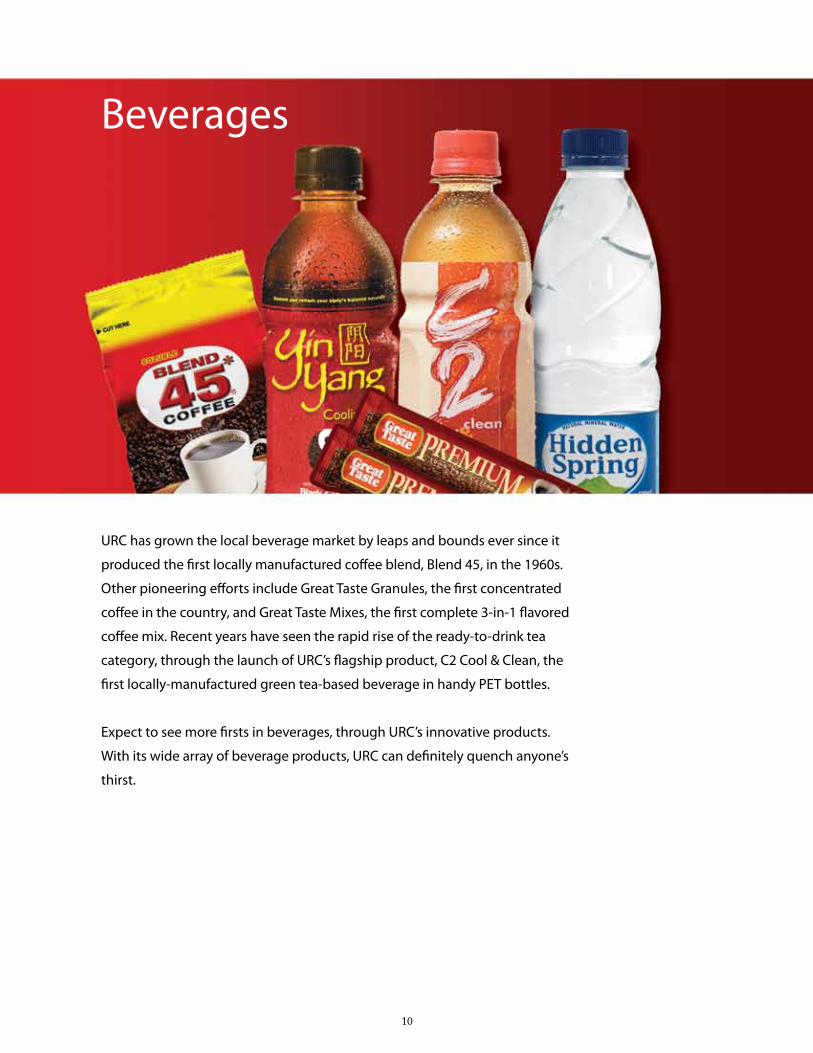
Beverages
uRC has grown the local beverage market by leaps and bounds ever since it
produced the first locally manufactured coffee blend, Blend 45, in the 1960s.
Other pioneering efforts include Great Taste Granules, the first concentrated
coffee in the country, and Great Taste Mixes, the first complete 3-in-1 flavored
coffee mix. Recent years have seen the rapid rise of the ready-to-drink tea
category, through the launch of uRC’s flagship product, C2 Cool & Clean, the
first locally-manufactured green tea-based beverage in handy PET bottles.
Expect to see more firsts in beverages, through uRC’s innovative products.
With its wide array of beverage products, uRC can definitely quench anyone’s
thirst.
10

B E V E R A G E SuRC participates in strategic segments in the Philippine beverage market that complement its snack food and biscuit products.
Ready-to-drink•Ready-to-DrinkTea–C2,YinYang•Juices–RefreshFlavoredDrinks•BottledWater–HiddenSpring,NestlèPureLife•Ready-to-DrinkCoffee–CoffeeTwist•EnergyDrinks–Xplode
Powdered•PureCoffee–GreatTasteGranules,GreatTastePremium•BlendedCoffee–Blend45•Creamer–CreamAll•InstantCoffeeMixes–GreatTasteCoffeeMixes•ChocolateMixes–ChocoLava,CaptainChoco•PowderedMilk–Vitalac•CerealDrinks–Nutrivim
11
TheResurgenceof Beverages
ack in 2004, the Philippines’ Ready-to-Drink (RTD) market was relatively undeveloped. Carbonated soft drinks dominated store shelves, in cans and large PET bottles for the modern trade such
as supermarkets and convenience stores, and returnable glass bottles for the traditional trade such as sari-sari stores. The non-carbonated space was a small slice of the total beverage business, and the available products – sports and energy drinks, iced tea, and juices, among others – were too pricey for regular consumption.
However, uRC saw an opportunity. Market research at that time showed that sales growth of carbonated soft drinks was beginning to stagnate, as consumption remained stable. A trend towards health and wellness was sweeping the globe, as consumers became more conscious of what they ate and drank. Finally, with more and more people having on-the-go lifestyles, convenience and affordability took on new importance.
Thus, C2 Cool and Clean Green Tea was born. This was the very first locally-manufactured RTD green tea in PET bottles, and it took the market by storm. C2 was positioned as a lifestyle brand, while educating the consumer about the health benefits of green tea. Consumer events also continued to harp on the advantages of tea, while promoting an active, healthy and well-balanced lifestyle. C2 also competed directly with carbonated soft drinks manufacturers at their price points.
C2 was a critical and commercial success, fueling the growth of a new category (RTD Tea) and increasing the share of non-carbonated beverages in the total market. It was a major home run for uRC, as C2 sales rapidly shot up, making it our number one brand. C2 led the charge for our fledgling beverage business, and provided another ‘leg’ for uRC to stand on besides snack foods, where it remains number one.
However, in the years since C2’s launch, the market dynamics have changed dramatically. Other companies began to take notice of the non-carbonated drinks space, with most players adopting PET
packaging and similar pricing. The success of C2 spawned a host of players wanting a piece of the pie, all seeking to cash in on the interest in tea-based drinks. Other categories such as energy drinks and juices also saw cutthroat competition and torrid growth, as multinationals and locals alike piled into the market.
The carbonated soft drink manufacturers weren’t sitting pretty, either. After watching the gains in the non-carbonated beverage space (at the expense of their own bread and butter), the main competitors came out swinging. They poured advertising and promotions money into the market, using placement and trade lockouts to stifle the non-carbonated players. They made their products more competitive, with new SKus at lower price points. And they revamped their ad campaigns, pushing soft drinks as a lifestyle and heritage brand.
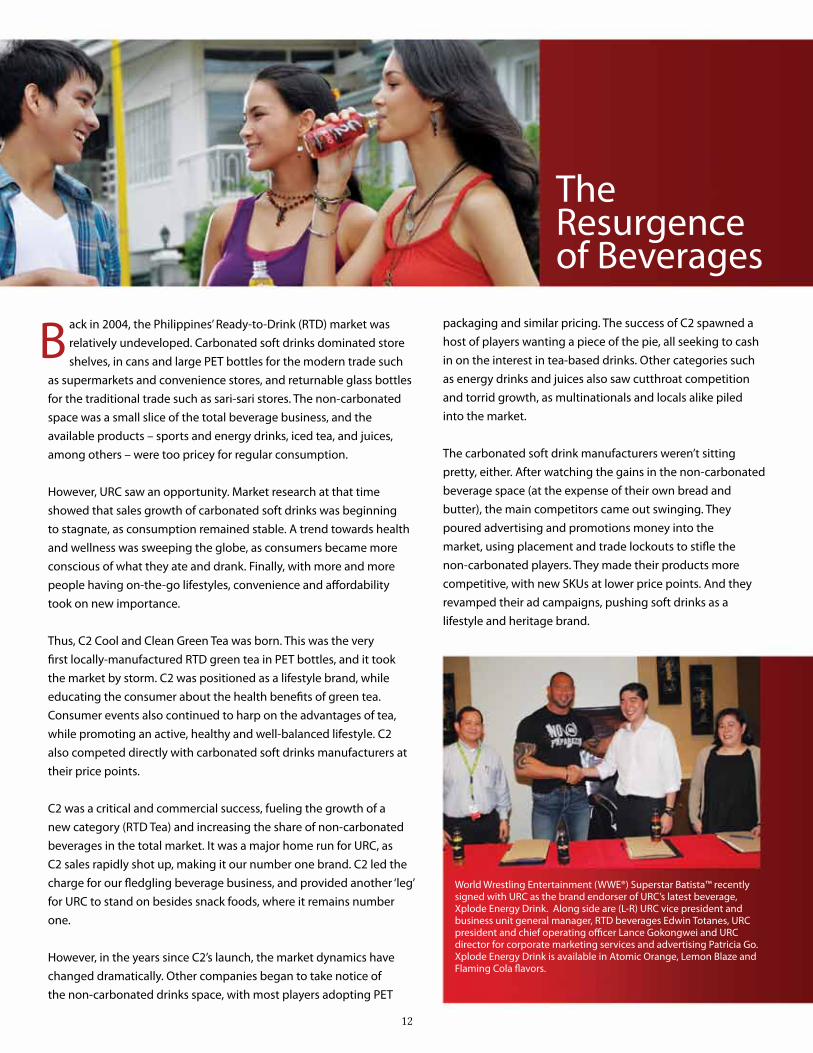
World Wrestling Entertainment (WWE®) Superstar Batista™ recently signed with uRC as the brand endorser of uRC’s latest beverage, xplode Energy Drink. Along side are (L-R) uRC vice president and business unit general manager, RTD beverages Edwin Totanes, uRC president and chief operating officer Lance Gokongwei and uRC director for corporate marketing services and advertising Patricia Go. xplode Energy Drink is available in Atomic Orange, Lemon Blaze and Flaming Cola flavors.
12
B

Against this backdrop of intense competition over the past few years, uRC began girding up for a new thrust into the hearts of our consumers. We are now employing a two-pronged strategy – attacking through new pack sizes for specific channels, and at the same time, launching new products to further excite and grow the RTD beverage market.
In 2009, C2 expanded its line, beginning with the introduction of its Sugar-free variant in May. In the last quarter of 2009 uRC launched the new C2 Solo, a 230ml product priced and sized for the tertiary trade. This product goes head-to-head against the newer and cheaper soft drink SKus, with a suggested retail price of Php 9.00, making C2 more attractive to store owners and more affordable to consumers. At the same time, uRC also launched its C2 1.5 liter bottle for the modern trade, bringing the all the goodness of C2 into a bottle for family and friends to share. These two new products were responsible for bringing C2 sales volumes to new record highs!
Outside of C2, there have been other developments on the beverage front, with numerous product launches in the past year to quench everyone’s tastes. First up was the country’s first RTD coffee in resealable PET bottles, Coffee Twist. Available in 230 ml bottles in three flavorful variants, this brand has so far been a hit, as initial results have shown great promise. uRC also produced a new tea variant, yin yang. This gulaman-flavored tea drink mixes a brew of green tea leaves with 3 traditional Chinese cooling herbs, which help even out the body’s internal heat caused by consuming hot or spicy foods. Finally, uRC recently entered the energy drinks market with xplode, its newest beverage offering. Endorsed by the World Wrestling Entertainment (WWE®) Superstar Dave “The Animal” Batista™, xplode offers to consumers what most of
its competitors on the market do not – a perfect balance of potent energy and great taste.
With its array of new product offerings and focused pricing and packaging strategies, uRC has geared up for battle. 2010 will be an interesting year indeed for RTD beverages, and with its new resurgence, uRC will be at the forefront of the charge.
13

Grocery
In response to the increasing need for lifestyle conveniences, uRC
manufactures an array of grocery products that are meant to make daily food
preparation easier for Filipinos.
Its Payless brand offers a wide selection of affordable instant noodles in
pouches and bowls, in regular and extra big servings. uRC has also made
nissin’s famous pre-flavored noodles readily available in the country, through
its joint venture with nissin Food Products Co., Ltd. of Japan.
uRC’s joint venture with Hunt-Wesson Inc. has provided mothers with handy
kitchen helpers in the form of tomato-based products such as pasta sauces
and tomato sauce, as well as its market leading Pork and Beans.
14

PAYLESS
uRC manufactures and markets instant noodles in pouches and cups through its brand, Payless.• Pouch noodles -- Payless Mami, Payless Pancit Shanghai
NISSIN - URC
HUNTS - URC
uRC manufactures and markets instant noodles in cups and pouches through its joint venture with nissin Food Products Co., Ltd. of Japan.• Pouch noodles – nissin yakisoba, nissin
Ramen• Cup noodles – nissin Cup noodles, nissin
yakisoba
uRC manufactures and markets tomato-based products, through its joint venture with Hunt-Wesson Inc. • Canned Beans – Hunt’s Pork and Beans, Hunt’s
Baked Beans• Sauces – Hunt’s Tomato Sauce, Hunt’s Spaghetti
Sauce• Tomato Paste – Hunt’s Tomato Paste
15

Packaging
uRC Packaging Division produces and sells a wide range of Bi-axially Oriented
Polypropylene (BOPP) films, primarily used for packaging of various consumer
products. This business unit holds the distinction of being the only Integrated
Management System ISO-certified BOPP plant in the country today with its
Quality ISO 9001:2000 and Environmental ISO 14001:2004 Standards.
16

INTERNATIONAL Branded Consumer Foods Group
With an eye towards the future, uRC has been investing in product innovation, and has been serving many of the ASEAn countries for the past ten years. uRC International’s sales rocketed past the uS$200 million mark for the first time in fiscal 2008 and surged to uS$240 million in fiscal 2009, thanks to innovative products, strong operational focus, and a motivated and dedicated team. From wafers in Thailand, to potato chips in Singapore, to green tea in Vietnam, and even cereals in China, uRC International has provided consumers in seven different countries within the region with the same exceptional quality that Filipinos have come to associate with the universal Robina name.
At present, uRC operates manufacturing facilities in Thailand, Malaysia, China, Indonesia, and Vietnam, and also maintains sales offices in Singapore and Hong Kong. Chances are you’ll see some of your favorite “Jack ‘n Jill” products such as Piattos, Roller Coaster, Cloud 9, and Cream-O, as well as other new and exciting brands such as ACES, Tivoli, and Jigs, on supermarket shelves and in neighborhood stores throughout the region.
In April 2006, uRC started manufacturing and selling C2 Green Tea in Vietnam, making uRC Vietnam the first subsidiary outside the Philippines to manufacture and market C2. C2 is now one of the two market leaders in Vietnam and manufacturing is being expanded to meet strong market demand, as well as to export the product to other thirsty ASEAn nations. your favorite C2 product is now also available in Malaysia and Indonesia, another testament to the multinational powerhouse that uRC has become.
17

THAILAND
uRC Vietnam, which started operations in 2004, is the newest addition to uRC’s International arm. Vietnam manufactures Biscuits, Snacks and Candies, and is the very first uRC subsidiary outside the Philippines to manufacture and successfully market C2 Green Tea.• Snacks – Fun Bite, Roller Coaster• Biscuits – Cream-O, Magic• Beverages – C2• Candies – Dynamite
18
INDONESIA
VIETNAM
MALAYSIA AND SINGAPORE
CHINA AND HONG KONG
uRC Thailand is uRC International’s largest subsidiary. It is a major snackfoods player in that country, manufacturing Snacks, Biscuits, Wafers, Candies, and Chocolates under the following brands:• Snacks – Roller Coaster, Fun Bite• Biscuits – Cream-O, Fun-O, Magic, Dewberry• Wafers – Tivoli, Lausanne• Candies – x.O., Dynamite, Lush, x-cite, • Chocolates – Wiggles
In Malaysia, uRC produces Snacks, Wafers, and Chocolates. These products are also carried by uRC’s sales office in Singapore.• Snacks – Potato Chips, Roller Coaster, Jigs• Biscuits – Cream-O, Magic, Dewberry• Wafers – Cloud 9• Candies – Dynamite, Cloud 9 Candies• Chocolates – nips, Cloud 9, Chooey Choco• Beverages – C2
uRC has a factory in the most populous country in Southeast Asia, manufacturing Snacks, Candies, and Chocolates under the following brands:• Snacks – Roller Coaster, Piattos, Sea Crunch, Poppins• Wafers – Cloud 9 Wafrets• Candies – Dynamite• Chocolates – Chooey Choco, Cloud 9• Beverages – C2
uRC has factories in China that cater to both the China and HK markets. These products are marketed under the following brands: • Snacks – Roller Coaster, Potato Chips, Beef
Crunchies (HK only)• Beverages (China only) – ACES Instant Cereal,
ACES Oates, ACES Coffee, ACES Health drink, ACES Soya
• Chocolates (HK only) – nips, Cloud 9• Biscuits – Cream-O, Magic, Dewberry
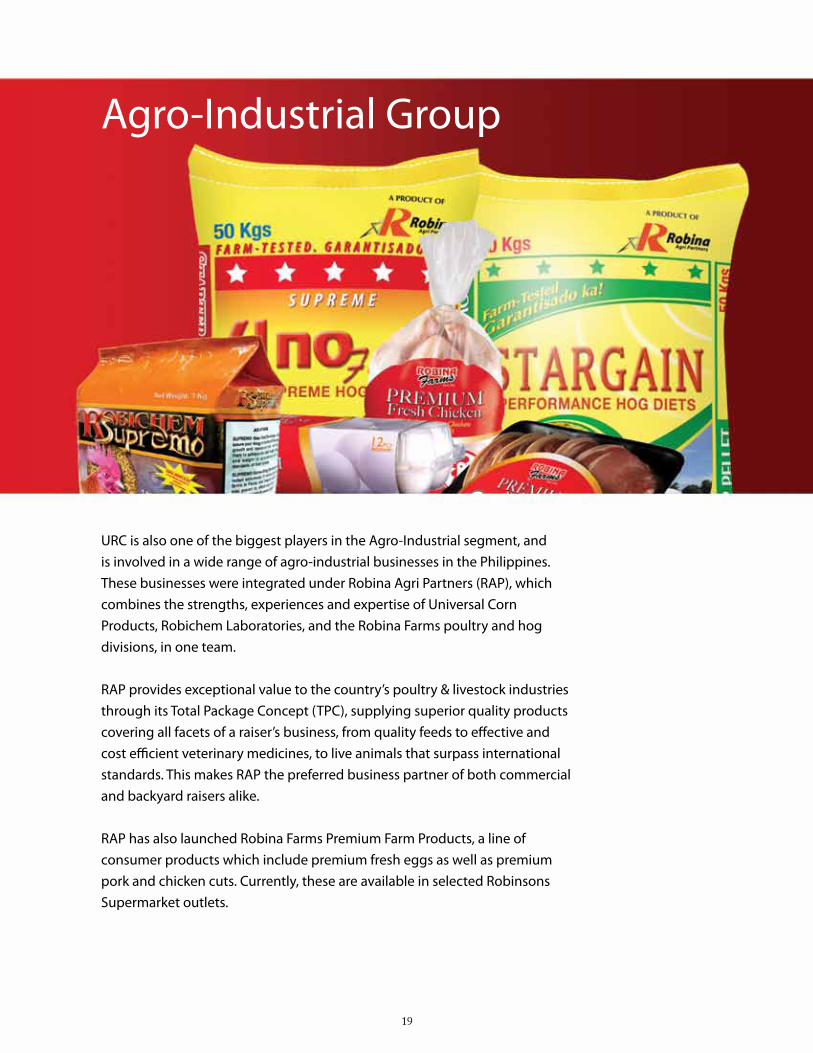
Agro-Industrial Group
uRC is also one of the biggest players in the Agro-Industrial segment, and is involved in a wide range of agro-industrial businesses in the Philippines. These businesses were integrated under Robina Agri Partners (RAP), which combines the strengths, experiences and expertise of universal Corn Products, Robichem Laboratories, and the Robina Farms poultry and hog divisions, in one team.
RAP provides exceptional value to the country’s poultry & livestock industries through its Total Package Concept (TPC), supplying superior quality products covering all facets of a raiser’s business, from quality feeds to effective and cost efficient veterinary medicines, to live animals that surpass international standards. This makes RAP the preferred business partner of both commercial and backyard raisers alike.
RAP has also launched Robina Farms Premium Farm Products, a line of consumer products which include premium fresh eggs as well as premium pork and chicken cuts. Currently, these are available in selected Robinsons Supermarket outlets.
19

UNIVERSAL CORN PRODUCTS ROBICHEM
ROBINA FARMS -- HOGS ROBINA FARMS -- POULTRY
• universal Corn Products (uCP) is one of the leaders in the Philippine animal feed industry with combined milling capacities of 1,200 MT per day in its Manila and Cebu plants.
• Backyard and commercial raisers have relied on uCP’s Brand Champions for Hog feeds – uno Feeds & Stargain Performance Diets – for achieving the maximum income potential of their businesses thru superior Feed Conversion Ratios (FCR), as well as carcass quality. In addition, the Supremo brand has achieved recognition among the best and biggest game fowl breeders in the Philippine for its ability to develop battle ready fighting cocks. Other feed categories produced and marketed by uCP are Broiler, Layer, Quail, Duck, and Aqua feeds. Feed products come in all forms – crumbled, pellet and mash form.
• uCP likewise produces and sells liquid glucose and quality soya products, which are used in the production of confectionery products and animal feeds, respectively.
• uCP has also introduced its own Brand of Dog Food under the Woofy Brand name as its entry into to this growing lucrative market.
• Robichem manufactures, distributes and sells a wide range of high-quality and well-known animal health products such as vaccines, water solubles, injectables, feeds supplements and disinfectants, which are both marketed commercially and used by Robina Farms because of its proven effectiveness and cost-efficiency.
• It has in its roster several Brand Champions – Robipenstrep P, Iron D, Spectrum and MVP Hog Cholera Vaccines – which have been trusted by animal raisers in ensuring their flock’s or herd’s state of health for many years.
• Robichem is also the exclusive distributor of multinational companies namely, Janssen Animal Health, Malaysian Vaccines Pharmaceuticals, novartis Animal Health – Vaccines, and Vetnext Agri of India.
• Robina Farms (RF) Hogs business unit breeds and sells prime finishers under the Brand name Robina Primera, breeder stocks such as its own Grandeur Boar and Grand Dame gilt, as well as quality piglets.
• The Robina Primera prime finishers are distributed through concessionaires in all the leading supermarkets in Metro Manila and are sought after by consumers and viajeros due to their high lean meat percentage, overall meat quality and thin back fat.
• RF-Hogs production facilities, located in Rizal, novaliches, Bulacan, and Batangas maintain more than 20,000 sows at any given time, and is reputed to be among the most modern swine facilities in the country.
• RF-Hogs, though AIG’s Agri-Consumer Sales, has also ventured in retailing of fresh pork meats and processed products.
• RF-Poultry business unit produces superior day-old broiler and layer chicks from the world-class breeds such as Hubbard, Shaver and Hyline.
• RF-Poultry production facilities are located in Cebu, Rizal and Bulacan, with a total farm capacity of 500,000 breeders and 160,000 layers.
• RF-Poultry is a formidable player in both the Layer and Broiler industries. It is the leader in the day old broiler and layer pullet chick markets, and is considered as one of the most dependable day-old chick suppliers in the country
• RF-Poultry has also set up commercial egg-laying operations, providing customers such as uRC-BCFG and Robinsons Supermarket with fresh table eggs.
• RF-Poultry has also introduced Fresh Chicken Meat and Cut-ups to the consumer market, as well as marinated Chicken variants.
20
Commodity Foods Group
21
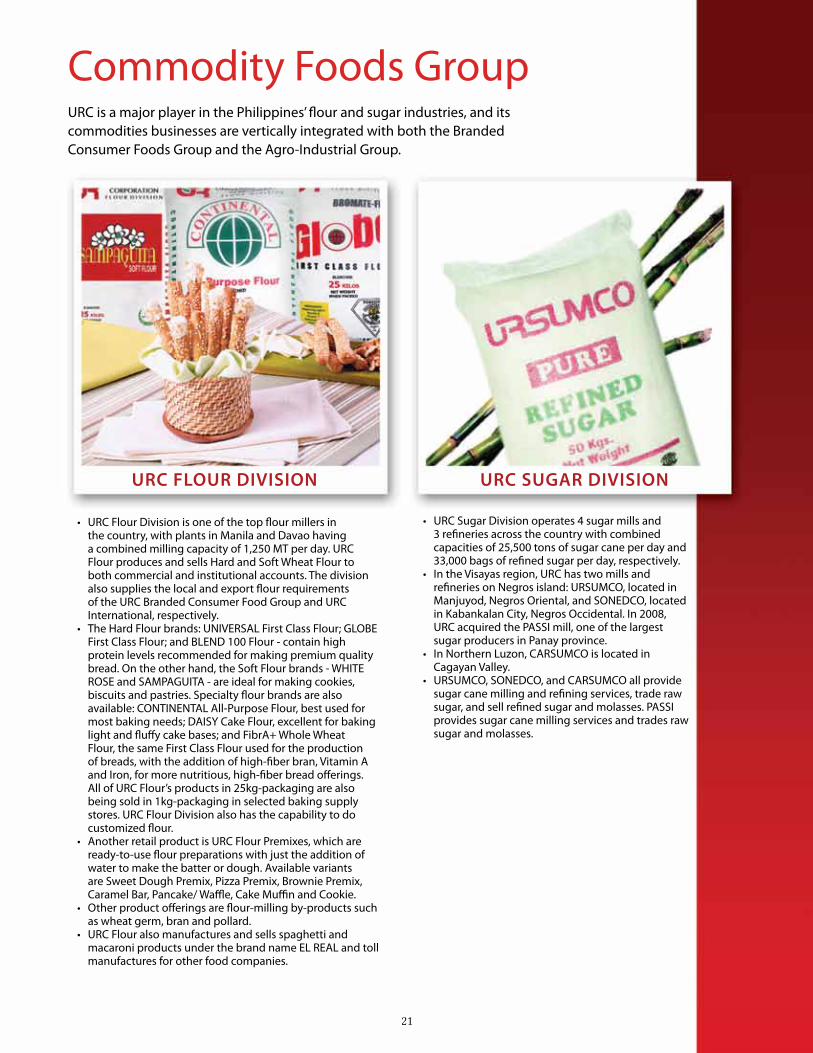
uRC is a major player in the Philippines’ flour and sugar industries, and its commodities businesses are vertically integrated with both the Branded Consumer Foods Group and the Agro-Industrial Group.
URC FLOUR DIVISION URC SUGAR DIVISION
• uRC Flour Division is one of the top flour millers in the country, with plants in Manila and Davao having a combined milling capacity of 1,250 MT per day. uRC Flour produces and sells Hard and Soft Wheat Flour to both commercial and institutional accounts. The division also supplies the local and export flour requirements of the uRC Branded Consumer Food Group and uRC International, respectively.
• The Hard Flour brands: unIVERSAL First Class Flour; GLOBE First Class Flour; and BLEnD 100 Flour - contain high protein levels recommended for making premium quality bread. On the other hand, the Soft Flour brands - WHITE ROSE and SAMPAGuITA - are ideal for making cookies, biscuits and pastries. Specialty flour brands are also available: COnTInEnTAL All-Purpose Flour, best used for most baking needs; DAISy Cake Flour, excellent for baking light and fluffy cake bases; and FibrA+ Whole Wheat Flour, the same First Class Flour used for the production of breads, with the addition of high-fiber bran, Vitamin A and Iron, for more nutritious, high-fiber bread offerings. All of uRC Flour’s products in 25kg-packaging are also being sold in 1kg-packaging in selected baking supply stores. uRC Flour Division also has the capability to do customized flour.
• Another retail product is uRC Flour Premixes, which are ready-to-use flour preparations with just the addition of water to make the batter or dough. Available variants are Sweet Dough Premix, Pizza Premix, Brownie Premix, Caramel Bar, Pancake/ Waffle, Cake Muffin and Cookie.
• Other product offerings are flour-milling by-products such as wheat germ, bran and pollard.
• uRC Flour also manufactures and sells spaghetti and macaroni products under the brand name EL REAL and toll manufactures for other food companies.
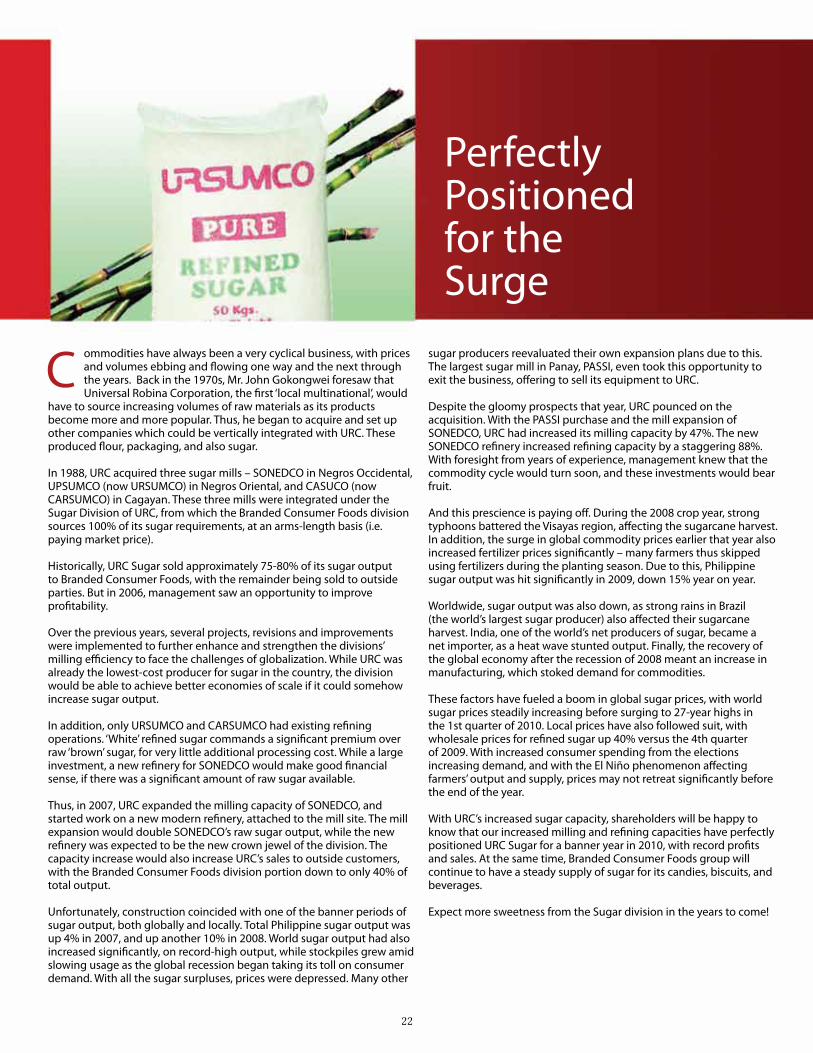
• uRC Sugar Division operates 4 sugar mills and 3 refineries across the country with combined capacities of 25,500 tons of sugar cane per day and 33,000 bags of refined sugar per day, respectively.
• In the Visayas region, uRC has two mills and refineries on negros island: uRSuMCO, located in Manjuyod, negros Oriental, and SOnEDCO, located in Kabankalan City, negros Occidental. In 2008, uRC acquired the PASSI mill, one of the largest sugar producers in Panay province.
• In northern Luzon, CARSuMCO is located in Cagayan Valley.
• uRSuMCO, SOnEDCO, and CARSuMCO all provide sugar cane milling and refining services, trade raw sugar, and sell refined sugar and molasses. PASSI provides sugar cane milling services and trades raw sugar and molasses.
PerfectlyPositionedfor theSurge
ommodities have always been a very cyclical business, with prices and volumes ebbing and flowing one way and the next through the years. Back in the 1970s, Mr. John Gokongwei foresaw that universal Robina Corporation, the first ‘local multinational’, would
have to source increasing volumes of raw materials as its products become more and more popular. Thus, he began to acquire and set up other companies which could be vertically integrated with uRC. These produced flour, packaging, and also sugar.
In 1988, uRC acquired three sugar mills – SOnEDCO in negros Occidental, uPSuMCO (now uRSuMCO) in negros Oriental, and CASuCO (now CARSuMCO) in Cagayan. These three mills were integrated under the Sugar Division of uRC, from which the Branded Consumer Foods division sources 100% of its sugar requirements, at an arms-length basis (i.e. paying market price).
Historically, uRC Sugar sold approximately 75-80% of its sugar output to Branded Consumer Foods, with the remainder being sold to outside parties. But in 2006, management saw an opportunity to improve profitability.
Over the previous years, several projects, revisions and improvements were implemented to further enhance and strengthen the divisions’ milling efficiency to face the challenges of globalization. While uRC was already the lowest-cost producer for sugar in the country, the division would be able to achieve better economies of scale if it could somehow increase sugar output.
In addition, only uRSuMCO and CARSuMCO had existing refining operations. ‘White’ refined sugar commands a significant premium over raw ‘brown’ sugar, for very little additional processing cost. While a large investment, a new refinery for SOnEDCO would make good financial sense, if there was a significant amount of raw sugar available.
Thus, in 2007, uRC expanded the milling capacity of SOnEDCO, and started work on a new modern refinery, attached to the mill site. The mill expansion would double SOnEDCO’s raw sugar output, while the new refinery was expected to be the new crown jewel of the division. The capacity increase would also increase uRC’s sales to outside customers, with the Branded Consumer Foods division portion down to only 40% of total output.
unfortunately, construction coincided with one of the banner periods of sugar output, both globally and locally. Total Philippine sugar output was up 4% in 2007, and up another 10% in 2008. World sugar output had also increased significantly, on record-high output, while stockpiles grew amid slowing usage as the global recession began taking its toll on consumer demand. With all the sugar surpluses, prices were depressed. Many other
22
C sugar producers reevaluated their own expansion plans due to this. The largest sugar mill in Panay, PASSI, even took this opportunity to exit the business, offering to sell its equipment to uRC.
Despite the gloomy prospects that year, uRC pounced on the acquisition. With the PASSI purchase and the mill expansion of SOnEDCO, uRC had increased its milling capacity by 47%. The new SOnEDCO refinery increased refining capacity by a staggering 88%. With foresight from years of experience, management knew that the commodity cycle would turn soon, and these investments would bear fruit.
And this prescience is paying off. During the 2008 crop year, strong typhoons battered the Visayas region, affecting the sugarcane harvest. In addition, the surge in global commodity prices earlier that year also increased fertilizer prices significantly – many farmers thus skipped using fertilizers during the planting season. Due to this, Philippine sugar output was hit significantly in 2009, down 15% year on year.
Worldwide, sugar output was also down, as strong rains in Brazil (the world’s largest sugar producer) also affected their sugarcane harvest. India, one of the world’s net producers of sugar, became a net importer, as a heat wave stunted output. Finally, the recovery of the global economy after the recession of 2008 meant an increase in manufacturing, which stoked demand for commodities.
These factors have fueled a boom in global sugar prices, with world sugar prices steadily increasing before surging to 27-year highs in the 1st quarter of 2010. Local prices have also followed suit, with wholesale prices for refined sugar up 40% versus the 4th quarter of 2009. With increased consumer spending from the elections increasing demand, and with the El niño phenomenon affecting farmers’ output and supply, prices may not retreat significantly before the end of the year.
With uRC’s increased sugar capacity, shareholders will be happy to know that our increased milling and refining capacities have perfectly positioned uRC Sugar for a banner year in 2010, with record profits and sales. At the same time, Branded Consumer Foods group will continue to have a steady supply of sugar for its candies, biscuits, and beverages.
Expect more sweetness from the Sugar division in the years to come!

EmployeesOffer Giftsto Jack ‘n JillVillageFamilies
or the second consecutive year, universal Robina Corporation (uRC) as well as the other JG Summit Holdings, Inc (JGSHI) Business units, celebrated Christmas with BAGOnG BAHAy, BAGOnG
BAGAy, BAGOnG BuHAy. under this project, employees shared yuletide blessings with 42 families of Gawad Kalinga’s (GK) Jack ‘n Jill Village.
Aside from cash gifts, the families also received several presents in kind, which included food and groceries, clothes, baby needs, school supplies, houseware, furniture and an eye examination. Certain members of the families were even granted employment opportunities.
The Jack ‘n Jill Village, a joint project of GK, uRC and JGSHI, was launched in 2007 and homes were turned over to the new owners in november 2008. Located in Pinagsamahan Village, Taguig City, this project aims to uplift the living condition of families residing in Taguig.
“Masayang-masaya kami dahil ngayon ay komportable na kami. ‘Di na namin kailangan isipin pa kung saan kami titira (we are very happy because we now live comfortably. We don’t have to worry about where we’ll live),” shared Arselin Arboleda, one of the residents in Jack ‘n Jill Village. “Malaki ang pasasalamat namin sa Gawad Kalinga at kay Mr. Lance Gokongwei dahil nakamit namin ang aming pangarap na tirahan. Malaking bagay ito para sa amin lalo na sa aming anak (That’s why we are very thankful to Gawad Kalinga and Mr. Lance Gokongwei because we have fulfilled our dream of owning a house. This is a very big thing for us, especially for our children).”
F
23

24

Board of Directors& Management Teams
25

Board of Directors
JOhN L. GOkONGwEI, JR.Director, Chairman Emeritus
LANCE Y. GOkONGwEIDirector, President
and Chief Operating Officer
PATRICk hENRY C. GODirector, Vice President
JAMES L. GODirector, Chairman and Chief Executive Officer
26

FREDERICk D. GODirector
wILFRIDO E. SANChEzDirector
PASCUAL S. GUERzONDirector
RObERT G. COYIUTO, JR.Director
JOhNSON RObERT G. GO, JR.Director
27

uRC Branded Consumer Foods GroupPhilippine Operations
bIENvENIDO S. bAUTISTA*Executive Vice-President and Managing Director,
URC Branded Consumer Foods Group, Philippines and PT URC Indonesia
EDwIN S. TOTANESBusiness Unit General Manager,
RTD Beverage Division
ALbERTINE P. MONTERONBusiness Unit General Manager,
Hunts Universal Robina
EDwIN R. CANTA**Business Unit General Manager,
Nissin Universal Robina Corporation
bENEDICTO A. SANChEzBusiness Unit General Manager,
Powdered Beverage Division
28*retired as of October 1, 2009 **appointed as Business Unit General Manager of URC Vietnam, October 1, 2009

29
International Operations
PATRICk O. NGExecutive Vice President and Managing Director,
URC International Branded Consumer Foods Group and Acting Business Unit General Manager, URC Vietnam
bIENvENIDO S. bAUTISTA*Executive Vice Presidentand Managing Director,
URC Indonesia
PREMChAI NAvARASUChITRBusiness Unit General Manager,
URC Thailand
GRACE wIRANATABusiness Unit General Manager,
URC Indonesia
bRIAN M. GOBusiness Unit General Manager,
URC China & URC Hong Kong
ERROL A. TANBusiness Unit General Manager,URC Malaysia & URC Singapore
STANLEY M. P. POONAsst. Business Unit General Manager,
URC Hong Kong
*retired as of October 1, 2009

Robina Agri Partners
vINCENT hENRY C. GOGroup Business Unit General Manager,
Agro-Industrial Group
DANTE J. PALAbRICADirector,
Farm Operations
30

Commodities Business Group
ELLISON DEAN C. LEEBusiness Unit General Manager,
Flour Division
PATRICk hENRY C. GOBusiness Unit General Manager,
Packaging Division (BOPP)and CFC Flexible Packaging Division
RENATO P. CAbATIBusiness Unit General Manager,
Sugar Group Division
31

Executive Officers
JAMES L. GOChairman and Chief Executive Officer
LAnCE y. GOKOnGWEIPresident and Chief Operating Officer
PATRICK HEnRy C. GOVice President
BIEnVEnIDO S. BAuTISTA* Executive Vice President and Managing Director,
uRC Branded Consumer Food Group,
Philippines and PT uRC Indonesia
PATRICK O. nGExecutive Vice President and Managing Director,
uRC International Branded Consumer Foods Group
and Acting Business unit General Manager, uRC Vietnam
EuGEnIE M.L. VILLEnASenior Vice President – Chief Financial Officer
COnSTAnTE T. SAnTOSSenior Vice President – Corporate Controller
BACH JOHAnn M. SEBASTIAnSenior Vice President – Corporate Planning
GERALDO n. FLOREnCIOFirst Vice President – Controller
ESTER T. AnGVice President – Treasurer
ROSALInDA F. RIVERACorporate Secretary
*retired as of October 1, 200932 33

Financial Statements
33

34
35
INDEPENDENT AUDITORS’ REPORT
The Stockholders and the Board of DirectorsUniversal Robina Corporation110 E. Rodriguez AvenueBagumbayan, Quezon City
We have audited the accompanying consolidated financial statements of Universal Robina Corporation and Subsidiaries, which comprise the consolidated statements of financial position as at September 30, 2009 and 2008, and the consolidated statements of comprehensive income, consolidated statements of changes in equity and consolidated statements of cash flows for each of the three years in the period ended September 30, 2009, and a summary of significant accounting policies and other explanatory notes.
Management’s Responsibility for the Financial Statements
Management is responsible for the preparation and fair presentation of these financial statements in accordance with Philippine Financial Reporting Standards. This responsibility includes: designing, implementing and maintaining internal control relevant to the preparation and fair presentation of financial statements that are free from material misstatement, whether due to fraud or error; selecting and applying appropriate accounting policies; and making accounting estimates that are reasonable in the circumstances.
Auditors’ Responsibility
Our responsibility is to express an opinion on these financial statements based on our audits. We conducted our audits in accordance with Philippine Standards on Auditing. Those standards require that we comply with ethical requirements and plan and perform the audit to obtain reasonable assurance whether the financial statements are free from material misstatement.
An audit involves performing procedures to obtain audit evidence about the amounts and disclosures in the financial statements. The procedures selected depend on the auditor’s judgment, including the assessment of the risks of material misstatement of the financial statements, whether due to fraud or error. In making those risk assessments, the auditor considers internal control relevant to the entity’s preparation and fair presentation of the financial statements in order to design audit procedures that are appropriate in the circumstances, but not for the purpose of expressing an opinion on the effectiveness of the entity’s internal control. An audit also includes evaluating the appropriateness of accounting policies used and the reasonableness of accounting estimates made by management, as well as evaluating the overall presentation of the financial statements.
We believe that the audit evidence we have obtained is sufficient and appropriate to provide a basis for our audit opinion.
A member firm of Ernst & Young Global Limited
S yCip Gor res Velayo & C o. 6760 Ayala Avenue 1226 Makati City Philippines
Phone: (632) 891 0307 Fax: (632) 819 0872 www.sgv.com.ph BOA/PRC Reg. No. 0001 SEC Accreditation No. 0012-FR-1
36
Opinion
In our opinion, the consolidated financial statements present fairly, in all material respects, the financial position of Universal Robina Corporation and Subsidiaries as of September 30, 2009 and 2008, and their financial performance and their cash flows for each of the three years in the period ended September 30, 2009 in accordance with Philippine Financial Reporting Standards.
SYCIP GORRES VELAYO & CO.
Vicky B. Lee-SalasPartnerCPA Certificate No. 86838SEC Accreditation No. 0115-AR-1Tax Identification No. 129-434-735PTR No. 2087542, January 4, 2010, Makati City
January 12, 2010

37
UNIVERSAL ROBINA CORPORATION AND SUBSIDIARIESCONSOLIDATED STATEMENTS OF FINANCIAL POSITION
September 30
2009 2008
ASSETSCurrent AssetsCash and cash equivalents (Note 7) ₱3,057,132,269 ₱2,215,628,259Financial assets at fair value through profit or loss (Notes 8, 9 and 35) 7,249,915,919 5,979,184,879Available-for-sale investments (Notes 9 and 14) 7,329,368,240 –Receivables (Notes 10 and 35) 6,820,682,560 6,175,873,872Inventories (Note 11) 6,118,041,579 7,774,455,180Other current assets (Note 12) 1,951,781,413 1,036,364,089
32,526,921,980 23,181,506,279Assets of disposal group classified as held for sale (Note 39) 100,976,527 197,416,861 Total Current Assets 32,627,898,507 23,378,923,140
Noncurrent AssetsProperty, plant and equipment (Note 13) 25,300,588,952 24,327,344,376Available-for-sale investments (Notes 9 and 14) – 6,304,842,703Biological assets (Notes 12 and 15) 505,251,239 1,443,259,742Intangible assets (Note 16) 1,643,995,276 1,646,762,912Net pension assets (Note 32) 141,018,200 243,810,600Investment in a joint venture (Note 17) 88,302,733 93,056,645Investment properties (Note 18) 75,405,339 79,003,584Other noncurrent assets (Note 19) 535,490,085 413,631,365 Total Noncurrent Assets 28,290,051,824 34,551,711,927
₱60,917,950,331 ₱57,930,635,067
LIABILITIES AND EQUITYCurrent LiabilitiesAccounts payable and other accrued liabilities (Notes 20, 21 and 35) ₱5,919,483,703 ₱4,964,941,584Short-term debt (Notes 20, 23 and 31) 5,186,769,415 8,069,508,132Trust receipts and acceptances payable (Notes 11 and 23) 478,448,886 3,000,776,510Income tax payable 178,096,460 20,761,736Current portion of long-term debt (Notes 22, 23 and 31) 27,848,985 48,031,798
11,790,647,449 16,104,019,760Liabilities directly associated with assets of disposal
group classified as held for sale (Note 39) 842,831 8,727,389 Total Current Liabilities 11,791,490,280 16,112,747,149
(Forward)
38
September 30
2009 2008
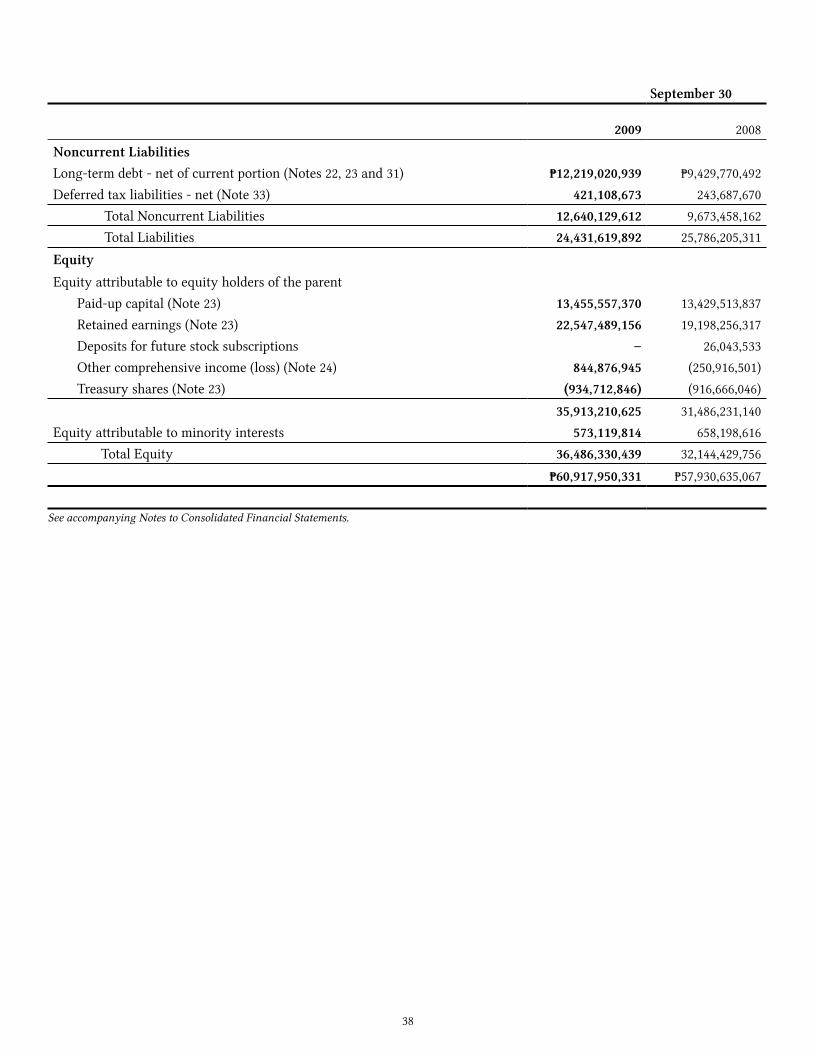
Noncurrent LiabilitiesLong-term debt - net of current portion (Notes 22, 23 and 31) ₱12,219,020,939 ₱9,429,770,492Deferred tax liabilities - net (Note 33) 421,108,673 243,687,670 Total Noncurrent Liabilities 12,640,129,612 9,673,458,162 Total Liabilities 24,431,619,892 25,786,205,311
EquityEquity attributable to equity holders of the parent Paid-up capital (Note 23) 13,455,557,370 13,429,513,837 Retained earnings (Note 23) 22,547,489,156 19,198,256,317 Deposits for future stock subscriptions – 26,043,533 Other comprehensive income (loss) (Note 24) 844,876,945 (250,916,501) Treasury shares (Note 23) (934,712,846) (916,666,046)
35,913,210,625 31,486,231,140Equity attributable to minority interests 573,119,814 658,198,616 Total Equity 36,486,330,439 32,144,429,756
₱60,917,950,331 ₱57,930,635,067
See accompanying Notes to Consolidated Financial Statements.
39
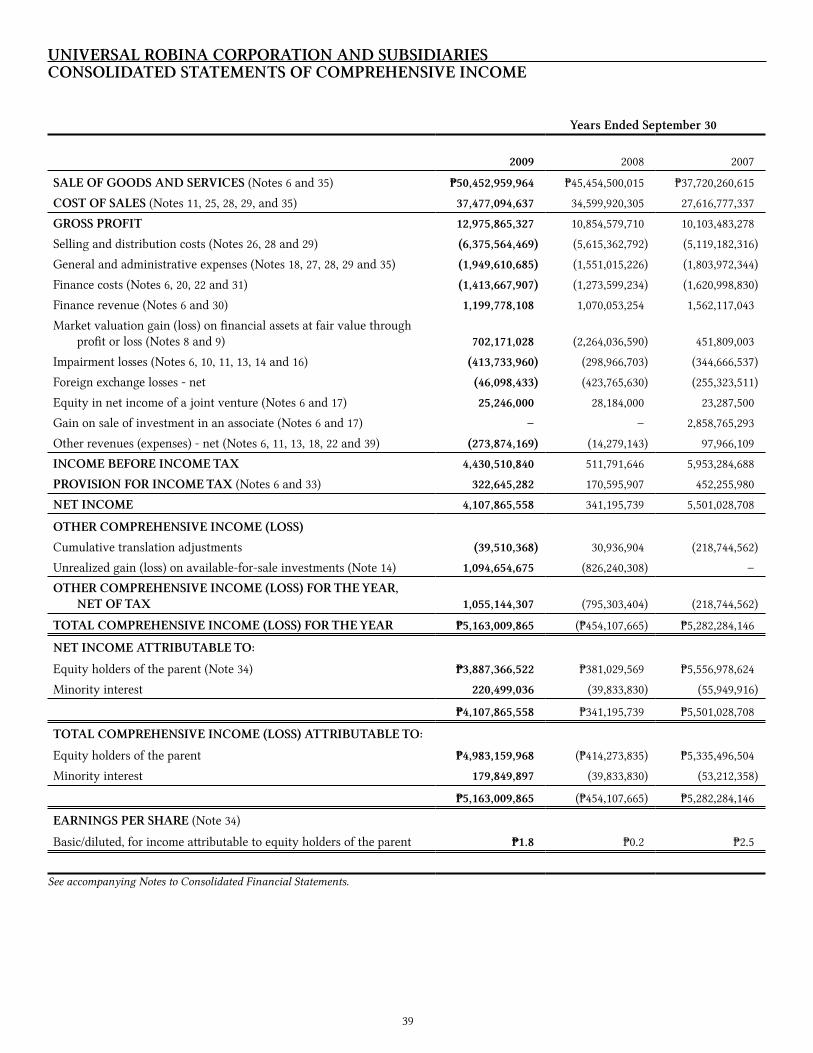
UNIVERSAL ROBINA CORPORATION AND SUBSIDIARIESCONSOLIDATED STATEMENTS OF COMPREHENSIVE INCOME
Years Ended September 30
2009 2008 2007
SALE OF GOODS AND SERVICES (Notes 6 and 35) ₱50,452,959,964 ₱45,454,500,015 ₱37,720,260,615
COST OF SALES (Notes 11, 25, 28, 29, and 35) 37,477,094,637 34,599,920,305 27,616,777,337
GROSS PROFIT 12,975,865,327 10,854,579,710 10,103,483,278
Selling and distribution costs (Notes 26, 28 and 29) (6,375,564,469) (5,615,362,792) (5,119,182,316)
General and administrative expenses (Notes 18, 27, 28, 29 and 35) (1,949,610,685) (1,551,015,226) (1,803,972,344)
Finance costs (Notes 6, 20, 22 and 31) (1,413,667,907) (1,273,599,234) (1,620,998,830)
Finance revenue (Notes 6 and 30) 1,199,778,108 1,070,053,254 1,562,117,043
Market valuation gain (loss) on financial assets at fair value through profit or loss (Notes 8 and 9) 702,171,028 (2,264,036,590) 451,809,003
Impairment losses (Notes 6, 10, 11, 13, 14 and 16) (413,733,960) (298,966,703) (344,666,537)
Foreign exchange losses - net (46,098,433) (423,765,630) (255,323,511)
Equity in net income of a joint venture (Notes 6 and 17) 25,246,000 28,184,000 23,287,500
Gain on sale of investment in an associate (Notes 6 and 17) – – 2,858,765,293
Other revenues (expenses) - net (Notes 6, 11, 13, 18, 22 and 39) (273,874,169) (14,279,143) 97,966,109
INCOME BEFORE INCOME TAX 4,430,510,840 511,791,646 5,953,284,688
PROVISION FOR INCOME TAX (Notes 6 and 33) 322,645,282 170,595,907 452,255,980
NET INCOME 4,107,865,558 341,195,739 5,501,028,708
OTHER COMPREHENSIVE INCOME (LOSS)
Cumulative translation adjustments (39,510,368) 30,936,904 (218,744,562)
Unrealized gain (loss) on available-for-sale investments (Note 14) 1,094,654,675 (826,240,308) –
OTHER COMPREHENSIVE INCOME (LOSS) FOR THE YEAR, NET OF TAX 1,055,144,307 (795,303,404) (218,744,562)
TOTAL COMPREHENSIVE INCOME (LOSS) FOR THE YEAR ₱5,163,009,865 (₱454,107,665) ₱5,282,284,146
NET INCOME ATTRIBUTABLE TO:
Equity holders of the parent (Note 34) ₱3,887,366,522 ₱381,029,569 ₱5,556,978,624
Minority interest 220,499,036 (39,833,830) (55,949,916)
₱4,107,865,558 ₱341,195,739 ₱5,501,028,708
TOTAL COMPREHENSIVE INCOME (LOSS) ATTRIBUTABLE TO:
Equity holders of the parent ₱4,983,159,968 (₱414,273,835) ₱5,335,496,504
Minority interest 179,849,897 (39,833,830) (53,212,358)
₱5,163,009,865 (₱454,107,665) ₱5,282,284,146
EARNINGS PER SHARE (Note 34)
Basic/diluted, for income attributable to equity holders of the parent ₱1.8 ₱0.2 ₱2.5
See accompanying Notes to Consolidated Financial Statements.
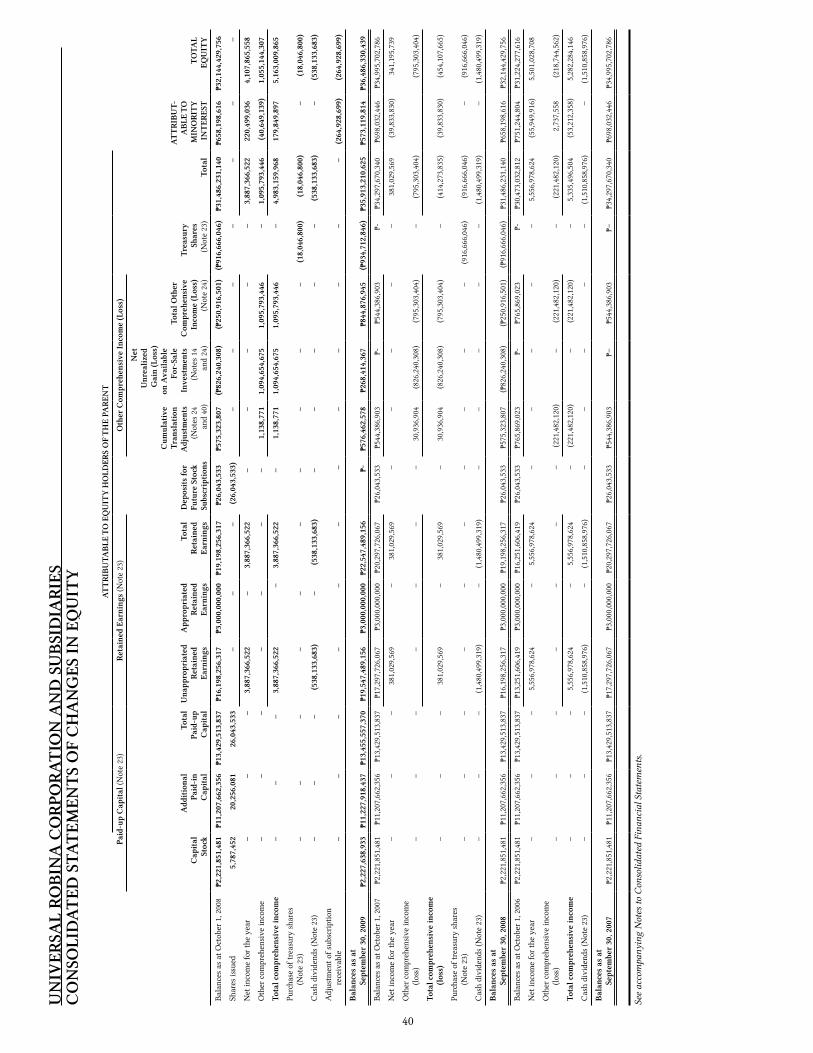
40
UN
IVER
SAL
ROB
INA
CO
RPO
RAT
ION
AN
D S
UB
SID
IARI
ESC
ON
SOLI
DA
TED
STA
TEM
ENTS
OF
CH
AN
GES
IN E
QU
ITY
AT
TRI
BU
TAB
LE T
O E
QU
ITY
HO
LDER
S O
F T
HE
PARE
NT
Paid
-up
Cap
ital
(Not
e 23
)Re
tain
ed E
arni
ngs
(Not
e 23
)O
ther
Com
preh
ensi
ve In
com
e (L
oss)
Cap
ital
St
ock
Add
itio
nal
Paid
-in
Cap
ital
Tota
l Pa
id-u
p C
apit
al
Una
ppro
pria
ted
Reta
ined
Earn
ings
App
ropr
iate
d Re
tain
ed
Earn
ings
Tota
lRe
tain
edEa
rnin
gs
Dep
osit
s fo
rFu
ture
Sto
ckSu
bscr
ipti
ons
Cum
ulat
ive
Tran
slat
ion
Adj
ustm
ents
(Not
es 2
4an
d 40
)
Net
Unr
ealiz
edG
ain
(Los
s)on
Ava
ilabl
eFo
r-Sa
leIn
vest
men
ts(N
otes
14
and
24)
Tota
l Oth
erC
ompr
ehen
sive
Inco
me
(Los
s)(N
ote
24)
Trea
sury
Shar
es(N
ote
23)
Tota
l
AT
TRI
BU
T-A
BLE
TO
MIN
ORI
TY
INT
ERES
TTO
TAL
EQU
ITY
Bala
nces
as
at O
ctob
er 1
, 200
8₱2
,221
,851
,481
₱11,
207,
662,
356
₱13,
429,
513,
837
₱16,
198,
256,
317
₱3,0
00,0
00,0
00₱1
9,19
8,25
6,31
7₱2
6,04
3,53
3₱5
75,3
23,8
07(₱
826,
240,
308)
(₱25
0,91
6,50
1)(₱
916,
666,
046)
₱31,
486,
231,
140
₱658
,198
,616
₱32,
144,
429,
756
Shar
es iss
ued
5,78
7,45
220
,256
,081
26,0
43,5
33–
––
(26,
043,
533)
––
––
––
–
Net
inco
me
for t
he y
ear
––
–3,
887,
366,
522
–3,
887,
366,
522
––
––
–3,
887,
366,
522
220,
499,
036
4,10
7,86
5,55
8
Oth
er c
ompr
ehen
sive
inco
me
––
––
––
–1,
138,
771
1,09
4,65
4,67
51,
095,
793,
446
–1,
095,
793,
446
(40,
649,
139)
1,05
5,14
4,30
7
Tota
l com
preh
ensi
ve in
com
e –
––
3,88
7,36
6,52
2–
3,88
7,36
6,52
2–
1,13
8,77
11,
094,
654,
675
1,09
5,79
3,44
6–
4,98
3,15
9,96
817
9,84
9,89
75,
163,
009,
865
Purch
ase
of tr
easu
ry s
hare
s (N
ote
23)
––
––
––
––
––
(18,
046,
800)
(18,
046,
800)
–(1
8,04
6,80
0)
Cas
h di
vide
nds
(Not
e 23
)–
––
(538
,133
,683
)–
(538
,133
,683
)–
––
––
(538
,133
,683
)–
(538
,133
,683
)
Adj
ustm
ent o
f sub
scri
ptio
n re
ceiv
able
––
––
––
––
––
––
(264
,928
,699
)(2
64,9
28,6
99)
Bal
ance
s as
at
Se
ptem
ber
30, 2
009
₱2,2
27,6
38,9
33₱1
1,22
7,91
8,43
7₱1
3,45
5,55
7,37
0₱1
9,54
7,48
9,15
6₱3
,000
,000
,000
₱22,
547,
489,
156
₱-₱5
76,4
62,5
78₱2
68,4
14,3
67₱8
44,8
76,9
45(₱
934,
712,
846)
₱35,
913,
210,
625
₱573
,119
,814
₱36,
486,
330,
439
Bala
nces
as
at O
ctob
er 1
, 200
7₱2
,221
,851
,481
₱11,
207,
662,
356
₱13,
429,
513,
837
₱17,
297,
726,
067
₱3,0
00,0
00,0
00₱2
0,29
7,72
6,06
7₱2
6,04
3,53
3₱5
44,3
86,9
03₱-
₱544
,386
,903
₱-₱3
4,29
7,67
0,34
0₱6
98,0
32,4
46₱3
4,99
5,70
2,78
6
Net
inco
me
for t
he y
ear
––
–38
1,02
9,56
9–
381,
029,
569
––
––
–38
1,02
9,56
9(3
9,83
3,83
0)34
1,19
5,73
9
Oth
er c
ompr
ehen
sive
inco
me
(loss
)–
––
––
––
30,9
36,9
04(8
26,2
40,3
08)
(795
,303
,404
)–
(795
,303
,404
)(7
95,3
03,4
04)
Tota
l com
preh
ensi
ve in
com
e (l
oss)
––
–38
1,02
9,56
9–
381,
029,
569
–30
,936
,904
(826
,240
,308
)(7
95,3
03,4
04)
–(4
14,2
73,8
35)
(39,
833,
830)
(454
,107
,665
)
Purch
ase
of tr
easu
ry s
hare
s (N
ote
23)
––
––
––
––
––
(916
,666
,046
)(9
16,6
66,0
46)
–(9
16,6
66,0
46)
Cas
h di
vide
nds
(Not
e 23
)–
––
(1,4
80,4
99,3
19)
–(1
,480
,499
,319
)–
––
––
(1,4
80,4
99,3
19)
–(1
,480
,499
,319
)
Bal
ance
s as
at
Se
ptem
ber
30, 2
008
₱2,2
21,8
51,4
81₱1
1,20
7,66
2,35
6₱1
3,42
9,51
3,83
7₱1
6,19
8,25
6,31
7₱3
,000
,000
,000
₱19,
198,
256,
317
₱26,
043,
533
₱575
,323
,807
(₱82
6,24
0,30
8)(₱
250,
916,
501)
(₱91
6,66
6,04
6)₱3
1,48
6,23
1,14
0₱6
58,1
98,6
16₱3
2,14
4,42
9,75
6
Bala
nces
as
at O
ctob
er 1
, 200
6₱2
,221
,851
,481
₱11,
207,
662,
356
₱13,
429,
513,
837
₱13,
251,
606,
419
₱3,0
00,0
00,0
00₱1
6,25
1,60
6,41
9₱2
6,04
3,53
3₱7
65,8
69,0
23₱-
₱765
,869
,023
₱-₱3
0,47
3,03
2,81
2₱7
51,2
44,8
04₱3
1,22
4,27
7,61
6
Net
inco
me
for t
he y
ear
––
–5,
556,
978,
624
–5,
556,
978,
624
––
––
–5,
556,
978,
624
(55,
949,
916)
5,50
1,02
8,70
8
Oth
er c
ompr
ehen
sive
inco
me
(loss
)–
––
––
––
(221
,482
,120
)–
(221
,482
,120
)–
(221
,482
,120
)2,
737,
558
(218
,744
,562
)
Tota
l com
preh
ensi
ve in
com
e–
––
5,55
6,97
8,62
4–
5,55
6,97
8,62
4–
(221
,482
,120
)–
(221
,482
,120
)–
5,33
5,49
6,50
4(5
3,21
2,35
8)5,
282,
284,
146
Cas
h di
vide
nds
(Not
e 23
)–
––
(1,5
10,8
58,9
76)
–(1
,510
,858
,976
)–
––
––
(1,5
10,8
58,9
76)
–(1
,510
,858
,976
)
Bal
ance
s as
at
Se
ptem
ber
30, 2
007
₱2,2
21,8
51,4
81₱1
1,20
7,66
2,35
6₱1
3,42
9,51
3,83
7₱1
7,29
7,72
6,06
7₱3
,000
,000
,000
₱20,
297,
726,
067
₱26,
043,
533
₱544
,386
,903
₱–₱5
44,3
86,9
03₱–
₱34,
297,
670,
340
₱698
,032
,446
₱34,
995,
702,
786
See
acco
mpa
nyin
g N
otes
to C
onso
lidat
ed F
inan
cial
Sta
tem
ents
.
41
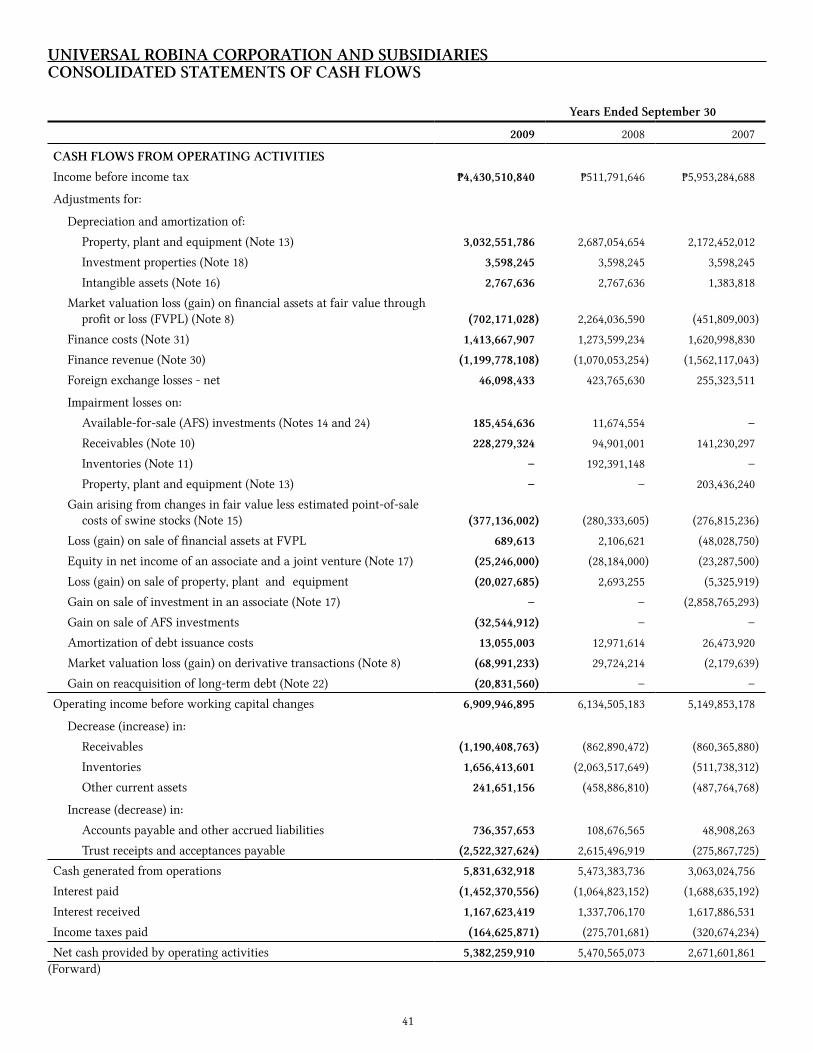
UNIVERSAL ROBINA CORPORATION AND SUBSIDIARIESCONSOLIDATED STATEMENTS OF CASH FLOWS
Years Ended September 30
2009 2008 2007
CASH FLOWS FROM OPERATING ACTIVITIES
Income before income tax ₱4,430,510,840 ₱511,791,646 ₱5,953,284,688
Adjustments for:
Depreciation and amortization of:
Property, plant and equipment (Note 13) 3,032,551,786 2,687,054,654 2,172,452,012
Investment properties (Note 18) 3,598,245 3,598,245 3,598,245
Intangible assets (Note 16) 2,767,636 2,767,636 1,383,818
Market valuation loss (gain) on financial assets at fair value through profit or loss (FVPL) (Note 8) (702,171,028) 2,264,036,590 (451,809,003)
Finance costs (Note 31) 1,413,667,907 1,273,599,234 1,620,998,830
Finance revenue (Note 30) (1,199,778,108) (1,070,053,254) (1,562,117,043)
Foreign exchange losses - net 46,098,433 423,765,630 255,323,511
Impairment losses on:
Available-for-sale (AFS) investments (Notes 14 and 24) 185,454,636 11,674,554 –
Receivables (Note 10) 228,279,324 94,901,001 141,230,297
Inventories (Note 11) – 192,391,148 –
Property, plant and equipment (Note 13) – – 203,436,240
Gain arising from changes in fair value less estimated point-of-sale costs of swine stocks (Note 15) (377,136,002) (280,333,605) (276,815,236)
Loss (gain) on sale of financial assets at FVPL 689,613 2,106,621 (48,028,750)
Equity in net income of an associate and a joint venture (Note 17) (25,246,000) (28,184,000) (23,287,500)
Loss (gain) on sale of property, plant and equipment (20,027,685) 2,693,255 (5,325,919)
Gain on sale of investment in an associate (Note 17) – – (2,858,765,293)
Gain on sale of AFS investments (32,544,912) – –
Amortization of debt issuance costs 13,055,003 12,971,614 26,473,920
Market valuation loss (gain) on derivative transactions (Note 8) (68,991,233) 29,724,214 (2,179,639)
Gain on reacquisition of long-term debt (Note 22) (20,831,560) – –
Operating income before working capital changes 6,909,946,895 6,134,505,183 5,149,853,178
Decrease (increase) in:
Receivables (1,190,408,763) (862,890,472) (860,365,880)
Inventories 1,656,413,601 (2,063,517,649) (511,738,312)
Other current assets 241,651,156 (458,886,810) (487,764,768)
Increase (decrease) in:
Accounts payable and other accrued liabilities 736,357,653 108,676,565 48,908,263
Trust receipts and acceptances payable (2,522,327,624) 2,615,496,919 (275,867,725)
Cash generated from operations 5,831,632,918 5,473,383,736 3,063,024,756
Interest paid (1,452,370,556) (1,064,823,152) (1,688,635,192)
Interest received 1,167,623,419 1,337,706,170 1,617,886,531
Income taxes paid (164,625,871) (275,701,681) (320,674,234)
Net cash provided by operating activities 5,382,259,910 5,470,565,073 2,671,601,861(Forward)
42
Years Ended September 30
2009 2008 2007
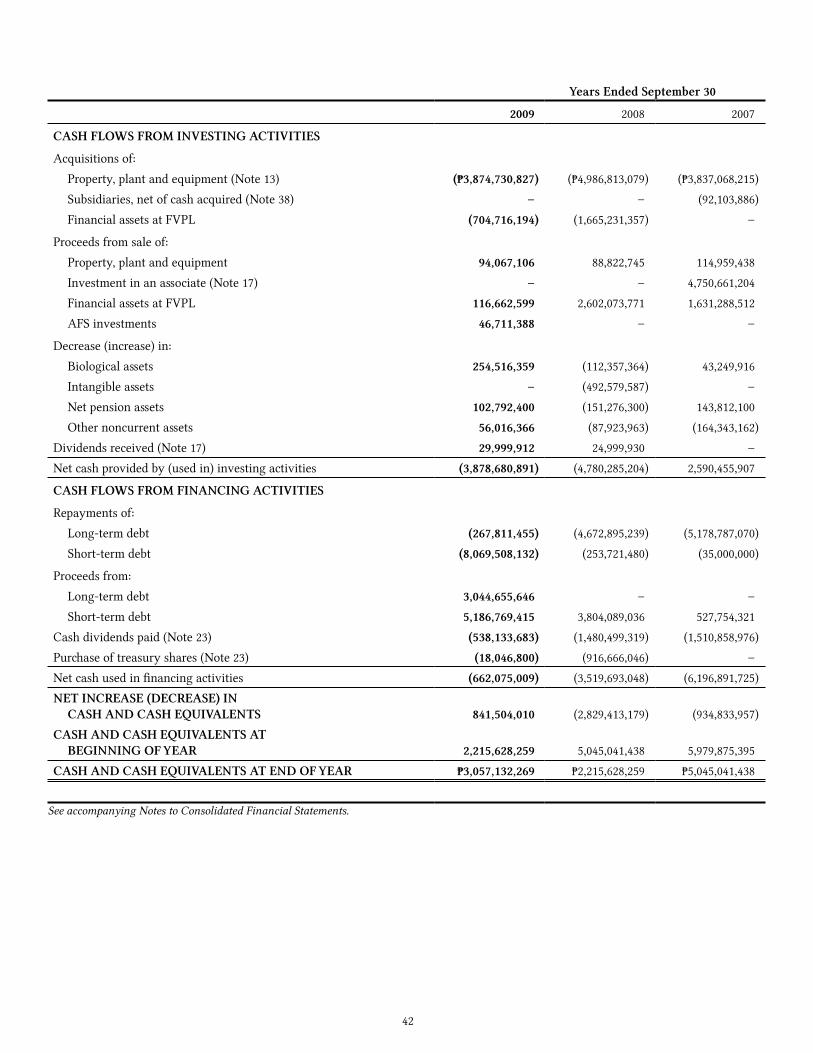
CASH FLOWS FROM INVESTING ACTIVITIES
Acquisitions of:
Property, plant and equipment (Note 13) (₱3,874,730,827) (₱4,986,813,079) (₱3,837,068,215)
Subsidiaries, net of cash acquired (Note 38) – – (92,103,886)
Financial assets at FVPL (704,716,194) (1,665,231,357) –
Proceeds from sale of:
Property, plant and equipment 94,067,106 88,822,745 114,959,438
Investment in an associate (Note 17) – – 4,750,661,204
Financial assets at FVPL 116,662,599 2,602,073,771 1,631,288,512
AFS investments 46,711,388 – –
Decrease (increase) in:
Biological assets 254,516,359 (112,357,364) 43,249,916
Intangible assets – (492,579,587) –
Net pension assets 102,792,400 (151,276,300) 143,812,100
Other noncurrent assets 56,016,366 (87,923,963) (164,343,162)
Dividends received (Note 17) 29,999,912 24,999,930 –
Net cash provided by (used in) investing activities (3,878,680,891) (4,780,285,204) 2,590,455,907
CASH FLOWS FROM FINANCING ACTIVITIES
Repayments of:
Long-term debt (267,811,455) (4,672,895,239) (5,178,787,070)
Short-term debt (8,069,508,132) (253,721,480) (35,000,000)
Proceeds from:
Long-term debt 3,044,655,646 – –
Short-term debt 5,186,769,415 3,804,089,036 527,754,321
Cash dividends paid (Note 23) (538,133,683) (1,480,499,319) (1,510,858,976)
Purchase of treasury shares (Note 23) (18,046,800) (916,666,046) –
Net cash used in financing activities (662,075,009) (3,519,693,048) (6,196,891,725)
NET INCREASE (DECREASE) IN CASH AND CASH EQUIVALENTS 841,504,010 (2,829,413,179) (934,833,957)
CASH AND CASH EQUIVALENTS AT BEGINNING OF YEAR 2,215,628,259 5,045,041,438 5,979,875,395
CASH AND CASH EQUIVALENTS AT END OF YEAR ₱3,057,132,269 ₱2,215,628,259 ₱5,045,041,438
See accompanying Notes to Consolidated Financial Statements.

43
UNIVERSAL ROBINA CORPORATION AND SUBSIDIARIESNOTES TO CONSOLIDATED FINANCIAL STATEMENTS
1. Corporate Information
Universal Robina Corporation (hereinafter referred to as “the Parent Company” or “URC”) is incorporated and domiciled in the Republic of the Philippines. The registered office address of the Parent Company is 110 E. Rodriguez Avenue, Bagumbayan, Quezon City, Philippines.
The Parent Company is a majority owned subsidiary of JG Summit Holdings, Inc. (“the ultimate parent” or “JGSHI”).
The Parent Company and its subsidiaries (hereinafter referred to as “the Group”) is one of the largest branded food products companies in the Philippines and has a growing presence in other markets in Asia. The Group is involved in a wide range of food-related businesses which are organized into three (3) business segments: (a) the branded consumer food segment which manufactures and distributes a diverse mix of salty snacks, chocolates, candies, biscuits, bakery products, beverages, noodles and tomato-based products; (b) the agro-industrial segment which engages in hog and poultry farming, production and distribution of animal health products and manufacture and distribution of animal feeds, glucose and soya bean products; and (c) the commodity food segment which engages in sugar milling and refining, flour milling and manufacture and marketing of pasta. The Parent Company also engages in consumer product-related packaging business through its packaging division which manufactures bi-axially oriented polypropylene (BOPP) film and through its subsidiary, CFC Clubhouse Property, Inc. (CCPI), which manufactures polyethylene terephthalate (PET) bottles and printed flexible packaging materials. The Parent Company’s packaging division is included in the branded consumer food segment.
The operations of certain subsidiaries are registered with the Board of Investments (BOI) as preferred pioneer and nonpioneer activities. Under the terms of the registrations and subject to certain requirements, the Parent Company and certain subsidiaries are entitled to certain fiscal and non-fiscal incentives, including among others, an income tax holiday (ITH) for a period of four (4) years to six (6) years from respective start dates of commercial operations (Note 36). The Group is also subject to certain regulations with respect to, among others, product composition, packaging, labeling, advertising and safety.
The principal activities of the Group are further described in Note 6 to the consolidated financial statements.
2. Summary of Significant Accounting Policies
Basis of PreparationThe accompanying consolidated financial statements of the Group have been prepared on a historical cost basis, except for financial assets at fair value through profit or loss (FVPL), available-for-sale (AFS) investments and derivative financial instruments that have been measured at fair value, and biological assets and agricultural produce that have been measured at fair value less estimated point-of-sale costs.
The consolidated financial statements of the Group are presented in Philippine Peso. The functional and presentation currency of the Parent Company and its Philippine subsidiaries (as well as certain foreign subsidiaries) is the Philippine Peso (further discussion under Foreign Currency Translation/Transactions).
Statement of ComplianceThe financial statements of the Group have been prepared in compliance with the Philippine Financial Reporting Standards (PFRS).
44
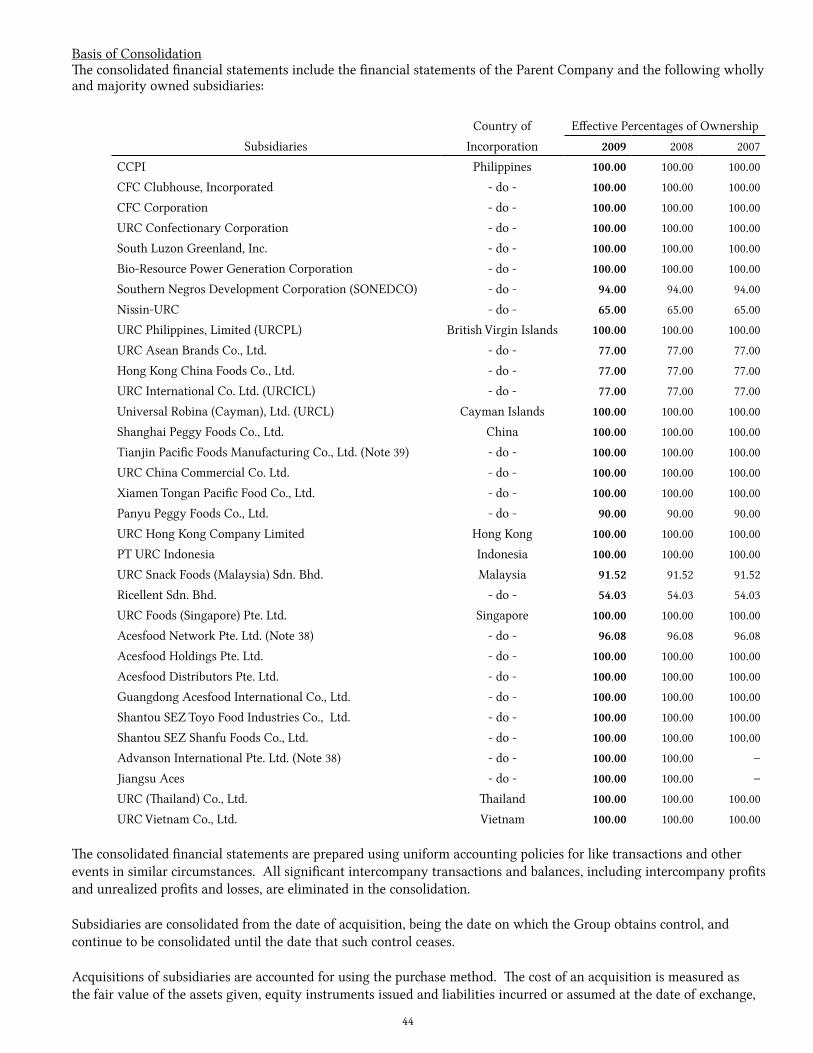
Basis of ConsolidationThe consolidated financial statements include the financial statements of the Parent Company and the following wholly and majority owned subsidiaries:
Country of Effective Percentages of Ownership
Subsidiaries Incorporation 2009 2008 2007
CCPI Philippines 100.00 100.00 100.00
CFC Clubhouse, Incorporated - do - 100.00 100.00 100.00
CFC Corporation - do - 100.00 100.00 100.00
URC Confectionary Corporation - do - 100.00 100.00 100.00
South Luzon Greenland, Inc. - do - 100.00 100.00 100.00
Bio-Resource Power Generation Corporation - do - 100.00 100.00 100.00
Southern Negros Development Corporation (SONEDCO) - do - 94.00 94.00 94.00
Nissin-URC - do - 65.00 65.00 65.00
URC Philippines, Limited (URCPL) British Virgin Islands 100.00 100.00 100.00
URC Asean Brands Co., Ltd. - do - 77.00 77.00 77.00
Hong Kong China Foods Co., Ltd. - do - 77.00 77.00 77.00
URC International Co. Ltd. (URCICL) - do - 77.00 77.00 77.00
Universal Robina (Cayman), Ltd. (URCL) Cayman Islands 100.00 100.00 100.00
Shanghai Peggy Foods Co., Ltd. China 100.00 100.00 100.00
Tianjin Pacific Foods Manufacturing Co., Ltd. (Note 39) - do - 100.00 100.00 100.00
URC China Commercial Co. Ltd. - do - 100.00 100.00 100.00
Xiamen Tongan Pacific Food Co., Ltd. - do - 100.00 100.00 100.00
Panyu Peggy Foods Co., Ltd. - do - 90.00 90.00 90.00
URC Hong Kong Company Limited Hong Kong 100.00 100.00 100.00
PT URC Indonesia Indonesia 100.00 100.00 100.00
URC Snack Foods (Malaysia) Sdn. Bhd. Malaysia 91.52 91.52 91.52
Ricellent Sdn. Bhd. - do - 54.03 54.03 54.03
URC Foods (Singapore) Pte. Ltd. Singapore 100.00 100.00 100.00
Acesfood Network Pte. Ltd. (Note 38) - do - 96.08 96.08 96.08
Acesfood Holdings Pte. Ltd. - do - 100.00 100.00 100.00
Acesfood Distributors Pte. Ltd. - do - 100.00 100.00 100.00
Guangdong Acesfood International Co., Ltd. - do - 100.00 100.00 100.00
Shantou SEZ Toyo Food Industries Co., Ltd. - do - 100.00 100.00 100.00
Shantou SEZ Shanfu Foods Co., Ltd. - do - 100.00 100.00 100.00
Advanson International Pte. Ltd. (Note 38) - do - 100.00 100.00 –
Jiangsu Aces - do - 100.00 100.00 –
URC (Thailand) Co., Ltd. Thailand 100.00 100.00 100.00
URC Vietnam Co., Ltd. Vietnam 100.00 100.00 100.00
The consolidated financial statements are prepared using uniform accounting policies for like transactions and other events in similar circumstances. All significant intercompany transactions and balances, including intercompany profits and unrealized profits and losses, are eliminated in the consolidation.
Subsidiaries are consolidated from the date of acquisition, being the date on which the Group obtains control, and continue to be consolidated until the date that such control ceases.
Acquisitions of subsidiaries are accounted for using the purchase method. The cost of an acquisition is measured as the fair value of the assets given, equity instruments issued and liabilities incurred or assumed at the date of exchange,
45
plus costs directly attributable to the acquisition. Identifiable assets acquired and liabilities and contingent liabilities assumed in a business combination are measured initially at their fair value at the acquisition date, irrespective of the extent of any minority interest.
Any excess of the cost of the business combination over the Group’s interest in the net fair value of the identifiable assets, liabilities and contingent liabilities represents goodwill. Any excess of the Group’s interest in the net fair value of the identifiable assets, liabilities and contingent liabilities over the cost of business combination is recognized in the consolidated statement of comprehensive income on the date of acquisition.
Minority interests represent the portion of income or loss and net assets not held by the Group and are presented separately in the consolidated statement of comprehensive income and within equity in the consolidated statement of financial position, separate from the parent shareholders’ equity. Acquisitions of minority interests are accounted for using the parent entity extension method, whereby, the difference between the consideration and the book value of the share of the net assets acquired is recognized as goodwill.
Changes in Accounting Policies and DisclosuresThe accounting policies adopted are consistent with those of the previous financial years except for the following new and amended accounting standards that are not yet effective to the Group:
• Amendments to PAS 1, Presentation of Financial StatementsThe amendments to PAS 1 are effective beginning January 1, 2009. In accordance with the amendments to PAS 1, the statement of changes in equity shall include only transactions with owners, while all non-owner changes will be presented in equity as a single line with details included in a separate statement. Owners are defined as the holders of instruments classified as equity.
In addition, the amendments to PAS 1 provides for the introduction of a new statement of comprehensive income that combines all items of income and expense recognized in the statement of income together with ‘Other comprehensive income’. The revisions specify what is included in other comprehensive income, such as gains and losses on AFS assets, actuarial gains and losses on defined benefit pension plans and changes in the asset revaluation reserve. Entities can choose to present all items in one statement, or to present two linked statements, a separate statement of income and a statement of comprehensive income. The Group has elected to present a single statement of comprehensive income.
• Amendment to PAS 23, Borrowing CostsThe amendments to PAS 23 are effective beginning January 1, 2009. This Standard requires capitalization of borrowing costs when such costs relate to a qualifying asset. A qualifying asset is an asset that necessarily takes a substantial period of time to get ready for its intended use or sale.
The amendment to this standard has no significant impact on the consolidated financial statements of the Group since the Group currently capitalizes borrowing costs that are related to qualifying assets.
• Amendments to PFRS 7, Financial Instruments: Disclosures - Improving Disclosures about Financial InstrumentsThese amendments are effective beginning January 1, 2009. The amended Standard requires additional disclosure about fair value measurement and liquidity risk. Fair value measurements related to items recorded at fair value are to be disclosed by source of inputs using a three level fair value hierarchy, by class, for all financial instruments recognized at fair value. In addition, a reconciliation between the beginning and ending balance for level 3 fair value measurements is now required, as well as significant transfers between levels in the fair value hierarchy. The amendments also clarify the requirements for liquidity risk disclosures with respect to derivative transactions and assets used for liquidity management. The amendments to this Standard have no significant impact on the consolidated financial statements except for the additional disclosures presented in Notes 4 and 5 to the consolidated financial statements.
46
• PFRS 8, Operating SegmentsThis Standard is effective beginning January 1, 2009. This Standard adopts a full management approach to identifying, measuring and disclosing the results of an entity’s operating segments. The information reported would be that which management uses internally for evaluating the performance of operating segments and allocating resources to those segments. The Group determined that the operating segments were the same as the business segments previously identified under PAS 14, Segment Reporting. Additional disclosures about each of these segments are shown in Note 6, including revised comparative information. Except for the additional disclosures, adoption of this Standard did not have any effect on the financial position or performance of the Group.
The following Philippine Interpretations and amendment to a Philippine Interpretation and Standard which are already effective did not have a significant impact on the consolidated financial statements of the Group:
• Amendment to Philippine Interpretation IFRIC 9, Remeasurement of Embedded Derivatives and PAS 39, Financial Instruments: Recognition and Measurement - Embedded Derivatives
• Philippine Interpretation IFRIC 12, Service Concession Arrangements• Philippine Interpretation IFRIC 13, Customer Loyalty Programmes• Philippine Interpretation IFRIC 14, PAS 19, The Limit on a Defined Benefit Asset, Minimum Funding Requirements
and their Interaction• Philippine Interpretation IFRIC 16, Hedges of a Net Investment in a Foreign Operation
Significant Accounting Policies
Revenue RecognitionRevenue is recognized to the extent that it is probable that the economic benefits will flow to the Group and the revenue can be reliably measured. Revenue is measured at the fair value of the consideration received, excluding discounts, rebates and other sales taxes or duty.
The following specific recognition criteria must also be met before revenue is recognized:
Sale of goodsRevenue from sale of goods is recognized upon delivery, when the significant risks and rewards of ownership of the goods have passed to the buyer and the amount of revenue can be measured reliably. Revenue is measured at the fair value of the consideration received or receivable, net of any trade discounts, prompt payment discounts and volume rebates.
Rendering of servicesRevenue derived from tolling activities, whereby raw sugar from traders and planters is converted into refined sugar, is recognized as revenue when the related services have been rendered.
Dividend incomeDividend income is recognized when the shareholder’s right to receive the payment is established.
Rent incomeRent income arising on investment properties is accounted for on a straight-line basis over the lease term on ongoing leases.
Interest incomeInterest is recognized as it accrues (using the effective interest method under which interest income is recognized at the rate that exactly discounts estimated future cash receipts through the expected life of the financial instrument to the net carrying amount of the financial asset).
Cash and Cash EquivalentsCash includes cash on hand and in banks. Cash equivalents are short-term, highly liquid investments that are readily convertible to known amounts of cash with original maturities of three months or less from dates of placement, and that are subject to an insignificant risk of changes in value.
47
Recognition of Financial InstrumentsDate of recognitionFinancial instruments within the scope of PAS 39, Financial Instruments: Recognition and Measurement, are recognized in the consolidated statement of financial position when the Group becomes a party to the contractual provisions of the instrument. Purchases or sales of financial assets that require delivery of assets within the time frame established by regulation or convention in the marketplace are recognized on the settlement date. Derivatives are recognized on a trade date basis.
Initial recognition of financial instrumentsFinancial instruments are recognized initially at fair value. Except for financial instruments valued at FVPL, the initial measurement of financial assets includes transaction costs. The Group classifies its financial assets into the following categories: financial assets at FVPL, held-to-maturity (HTM) investments, AFS investments and loans and receivables. The Group classifies its financial liabilities into financial liabilities at FVPL and other financial liabilities.
The classification depends on the purpose for which the investments were acquired and whether they are quoted in an active market. Management determines the classification of its investments at initial recognition and, where allowed and appropriate, re-evaluates such designation at every reporting date.
Reclassification of financial assetsA financial asset is reclassified out of the FVPL category when the following conditions are met:
• the financial asset is no longer held for the purpose of selling or repurchasing it in the near term; and • there is a rare circumstance.
A financial asset that is reclassified out of the FVPL category is reclassified at its fair value on the date of reclassification. Any gain or loss already recognized in the consolidated statement of comprehensive income is not reversed. The fair value of the financial asset on the date of reclassification becomes its new cost or amortized cost, as applicable. In 2008, the Group reclassified certain financial assets at FVPL to AFS investments (Note 9).
Determination of fair valueThe fair value for financial instruments traded in active markets at the financial position date is based on their quoted market price or dealer price quotations (bid price for long positions and ask price for short positions), without any deduction for transaction costs. When current bid and ask prices are not available, the price of the most recent transaction provides evidence of the current fair value as long as there has not been a significant change in economic circumstances since the time of the transaction.
For all other financial instruments not listed in an active market, the fair value is determined by using appropriate valuation techniques. Valuation techniques include net present value techniques, comparison to similar instruments for which market observable prices exist, options pricing models and other relevant valuation models.
Day 1 profitWhere the transaction price in a non-active market is different from the fair value based on other observable current market transactions in the same instrument or based on a valuation technique whose variables include only data from an observable market, the Group recognizes the difference between the transaction price and fair value (a Day 1 profit) in the consolidated statement of comprehensive income. In cases where variables used are made of data which is not observable, the difference between the transaction price and model value is only recognized in the consolidated statement of comprehensive income when the inputs become observable or when the instrument is derecognized. For each transaction, the Group determines the appropriate method of recognizing the Day 1 profit amount.
Financial assets and financial liabilities at FVPLFinancial assets and financial liabilities at FVPL include financial assets and financial liabilities held for trading purposes, derivative instruments, or those designated upon initial recognition when any of the following criteria are met:

48
• the designation eliminates or significantly reduces the inconsistent treatment that would otherwise arise from measuring the assets or liabilities or recognizing gains or losses on them on a different basis; or
• the assets and liabilities are part of a group of financial assets, financial liabilities or both which are managed and their performance are evaluated on a fair value basis, in accordance with a documented risk management or investment strategy; or
• the financial instrument contains an embedded derivative, unless the embedded derivative does not significantly modify the cash flows or it is clear, with little or no analysis, that it would not be separately recorded.
Financial assets and financial liabilities at FVPL are recorded in the consolidated statement of financial position at fair value. Changes in fair value are reflected in the consolidated statement of comprehensive income. Interest earned or incurred is recorded in interest income or expense, respectively, while dividend income is recorded in other operating income according to the terms of the contract, or when the right of the payment has been established.
The Group’s financial assets at FVPL consist of private bonds and equity securities (Note 8).
Derivatives recorded at FVPL The Group uses derivative financial instruments such as currency forwards and currency options to hedge the risks associated with foreign currency and interest rate fluctuations. Such derivative financial instruments are initially recorded at fair value on the date at which the derivative contract is entered into and are subsequently remeasured at fair value. Any gains or losses arising from changes in fair values of derivatives (except those accounted for as accounting hedges) are taken directly to the consolidated statement of comprehensive income. Derivatives are carried as assets when the fair value is positive and as liabilities when the fair value is negative.
The fair values of the Group’s derivative instruments are based on quotes obtained from counterparties.
Embedded DerivativeAn embedded derivative is separated from the host contract and accounted for as a derivative if all of the following conditions are met: a) the economic characteristics and risks of the embedded derivative are not closely related to the economic characteristics and risks of the host contract; b) a separate instrument with the same terms as the embedded derivative would meet the definition of a derivative; and c) the hybrid or combined instrument is not recognized at FVPL.
Subsequent reassessment is prohibited unless there is a change in the terms of the contract that significantly modifies the cash flows that otherwise would be required under the contract, in which case reassessment is required. The Group determines whether a modification to cash flows is significant by considering the extent to which the expected future cash flows associated with the embedded derivative, the host contract or both have changed and whether the change is significant relative to the previously expected cash flow on the contract.
Loans and receivablesLoans and receivables are nonderivative financial assets with fixed or determinable payments and fixed maturities that are not quoted in an active market. After initial measurement, loans and receivables are subsequently carried at amortized cost using the effective interest method less any allowance for impairment. Amortized cost is calculated taking into account any discount or premium on acquisition and includes fees that are an integral part of the effective interest rate (EIR) and transaction costs. Gains and losses are recognized in the consolidated statement of comprehensive income when the loans and receivables are derecognized or impaired, as well as through the amortization process. Loans and receivables are included in current assets if maturity is within 12 months from the financial position date. Otherwise, these are classified as noncurrent assets.
This accounting policy applies primarily to the Group’s trade and other receivables (Note 10).

49
AFS investmentsAFS investments are those nonderivative investments which are designated as such or do not qualify to be classified or designated as financial assets at FVPL, HTM investments or loans and receivables. They are purchased and held indefinitely, and may be sold in response to liquidity requirements or changes in market conditions.
After initial measurement, AFS investments are subsequently measured at fair value. The effective yield component of AFS debt securities, as well as the impact of restatement on foreign currency-denominated AFS debt securities, is reported in the consolidated statement of comprehensive income. The unrealized gains and losses arising from the fair valuation of AFS investments are excluded, net of tax, from reported earnings and are reported under the ‘Other comprehensive income’ section of the consolidated statement of comprehensive income.
When the security is disposed of, the cumulative gain or loss previously recognized in equity is recognized in the consolidated statement of comprehensive income. Interest earned on holding AFS investments are reported as interest income using the effective interest method. Where the Group holds more than one investment in the same security, these are deemed to be disposed of on a first-in, first-out basis. Dividends earned on holding AFS investments are recognized in the consolidated statement of comprehensive income, when the right to receive payment has been established. The losses arising from impairment of such investments are recognized in the consolidated statement of comprehensive income.
AFS investments held by the Group consist of private bonds, government and equity securities (Note 14).
Other financial liabilitiesIssued financial instruments or their components, which are not designated at FVPL are classified as other financial liabilities where the substance of the contractual arrangement results in the Group having an obligation either to deliver cash or another financial asset to the holder, or to satisfy the obligation other than by the exchange of a fixed amount of cash or another financial asset for a fixed number of own equity shares.
All loans and borrowings are initially recognized at the fair value of the consideration received less directly attributable debt issuance costs. Debt issuance costs are amortized using the effective interest method and unamortized debt issuance costs are offset against the related carrying value of the loan in the consolidated statement of financial position.
After initial measurement, other financial liabilities are subsequently measured at amortized cost using the effective interest method. Amortized cost is calculated by taking into account any discount or premium on the issue and fees that are an integral part of the EIR.
When a loan is paid, the related unamortized debt issuance costs at the date of repayment are charged against current operations. Gains and losses are recognized in the consolidated statement of comprehensive income when the liabilities are derecognized or impaired, as well as through the amortization process.
This accounting policy applies primarily to the Group’s short-term and long-term debt, accounts payable and other accrued liabilities and other obligations that meet the above definition (other than liabilities covered by other accounting standards, such as pension liabilities or income tax payable).
Classification of Financial Instruments Between Debt and EquityA financial instrument is classified as debt if it provides for a contractual obligation to:
• deliver cash or another financial asset to another entity; or• exchange financial assets or financial liabilities with another entity under conditions that are potentially
unfavorable to the Group; or• satisfy the obligation other than by the exchange of a fixed amount of cash or another financial asset for a fixed
number of own equity shares.
50
If the Group does not have an unconditional right to avoid delivering cash or another financial asset to settle its contractual obligation, the obligation meets the definition of a financial liability. The components of issued financial instruments that contain both liability and equity elements are accounted for separately, with the equity component being assigned the residual amount after deducting from the instrument as a whole the amount separately determined as the fair value of the liability component on the date of issue.
Impairment of Financial AssetsThe Group assesses at each financial position date whether there is objective evidence that a financial asset or group of financial assets is impaired. A financial asset or a group of financial assets is deemed to be impaired if, and only if, there is objective evidence of impairment as a result of one or more events that has occurred after the initial recognition of the asset (an incurred ‘loss event’) and that loss event (or events) has an impact on the estimated future cash flows of the financial asset or the group of financial assets that can be reliably estimated. Evidence of impairment may include indications that the borrower or a group of borrowers is experiencing significant financial difficulty, default or delinquency in interest or principal payments, the probability that they will enter bankruptcy or other financial reorganization and where observable data indicate that there is a measurable decrease in the estimated future cash flows, such as changes in arrears or economic conditions that correlate with defaults.
Financial assets carried at amortized costIf there is objective evidence that an impairment loss on financial assets carried at amortized cost (i.e., receivables) has been incurred, the amount of the loss is measured as the difference between the asset’s carrying amount and the present value of estimated future cash flows discounted at the asset’s original EIR. The carrying amount of the asset is reduced through the use of an allowance account. The loss is recognized in the consolidated statement of comprehensive income. The asset, together with the associated allowance accounts, is written off when there is no realistic prospect of future recovery.
The Group first assesses whether objective evidence of impairment exists individually for financial assets that are individually significant, and individually or collectively for financial assets that are not individually significant. If it is determined that no objective evidence of impairment exists for an individually assessed financial asset, whether significant or not, the asset is included in a group of financial assets with similar credit risk characteristics and that group of financial assets is collectively assessed for impairment. Those characteristics are relevant to the estimation of future cash flows for groups of such assets by being indicative of the debtor’s ability to pay all amounts due according to the contractual terms of the assets being evaluated. Assets that are individually assessed for impairment and for which an impairment loss is or continues to be recognized are not included in a collective assessment of impairment.
If, in a subsequent period, the amount of the impairment loss decreases and the decrease can be related objectively to an event occurring after the impairment was recognized, the previously recognized impairment loss is reversed. Any subsequent reversal of an impairment loss is recognized in the consolidated statement of comprehensive income to the extent that the carrying value of the asset does not exceed its amortized cost at the reversal date.
The Group performs a regular review of the age and status of its trade and other receivables, designed to identify receivables with objective evidence of impairment and provide the appropriate allowance for impairment loss. The review is accomplished using a combination of specific and collective assessment approaches, with the impairment loss being determined for each risk grouping identified by the Group (Note 10).
AFS investmentsThe Group assesses at each financial position date whether there is objective evidence that a financial asset or group of financial assets is impaired.
In the case of debt instruments classified as AFS investments, impairment is assessed based on the same criteria as financial assets carried at amortized cost. Interest continues to be accrued at the original EIR on the reduced carrying amount of the asset and is recorded under interest income in the consolidated statement of comprehensive income. If, in subsequent year, the fair value of a debt instrument increases, and the increase can be objectively related to an event occurring after the impairment loss was recognized in the consolidated statement of comprehensive income, the impairment loss is reversed through the consolidated statement of comprehensive income.

51
For equity investments classified as AFS investments, objective evidence would include a significant or prolonged decline in the fair value of the investments below its cost. The determination of what is significant and prolonged is subject to judgment. Where there is evidence of impairment, the cumulative loss - measured as the difference between the acquisition cost and the current fair value, less any impairment loss on that investment previously recognized in the statement of comprehensive income - is removed from equity and recognized in the statement of comprehensive income. Impairment losses on equity investments are not reversed through the statement of comprehensive income. Increases in fair value after impairment are recognized directly in equity.
Derecognition of Financial InstrumentsFinancial assetsA financial asset (or, where applicable a part of a financial asset or part of a group of financial assets) is derecognized where:
• the rights to receive cash flows from the asset have expired;• the Group retains the right to receive cash flows from the asset, but has assumed an obligation to pay them in full
without material delay to a third party under a “pass-through” arrangement; or• the Group has transferred its rights to receive cash flows from the asset and either (a) has transferred substantially
all the risks and rewards of ownership and retained control of the asset, or (b) has neither transferred nor retained the risk and rewards of the asset but has transferred the control of the asset.
Where the Group has transferred its rights to receive cash flows from an asset or has entered into a pass-through arrangement, and has neither transferred nor retained substantially all the risks and rewards of the asset nor transferred control of the asset, the asset is recognized to the extent of the Group’s continuing involvement in the asset. Continuing involvement that takes the form of a guarantee over the transferred asset is measured at the lower of original carrying amount of the asset and the maximum amount of consideration that the Group could be required to repay.
Financial liabilitiesA financial liability is derecognized when the obligation under the liability is discharged or cancelled or has expired. Where an existing financial liability is replaced by another from the same lender on substantially different terms, or the terms of an existing liability are substantially modified, such an exchange or modification is treated as a derecognition of the original liability and the recognition of a new liability, and the difference in the respective carrying amounts is recognized in the consolidated statement of comprehensive income.
Financial Guarantee ContractsIn the ordinary course of business, the Parent Company gives financial guarantees. Financial guarantees are initially recognized at fair value, and the initial fair value is amortized over the life of the financial guarantee. The guarantee liability is subsequently carried at the higher of this amortized amount and the present value of any expected payment (when a payment under the guaranty has become probable).
Offsetting Financial InstrumentsFinancial assets and financial liabilities are offset and the net amount reported in the consolidated statement of financial position if, and only if, there is a currently enforceable legal right to offset the recognized amounts and there is an intention to settle on a net basis, or to realize the asset and settle the liability simultaneously. This is not generally the case with master netting agreements; thus, the related assets and liabilities are presented gross in the consolidated statement of financial position.
InventoriesInventories, including goods-in-process, are valued at the lower of cost or net realizable value (NRV). NRV is the estimated selling price in the ordinary course of business, less estimated costs of completion and the estimated costs necessary to make the sale. NRV for materials, spare parts and other supplies represents the related replacement costs.
Costs incurred in bringing each product to its present location and conditions are accounted for as follows:
52
Finished goods, work-in-process, raw materials, containers and packaging materialsCost is determined using the average method. Finished goods and work-in-process include direct materials and labor, and a proportion of manufacturing overhead costs based on actual goods processed and produced, but excluding borrowing costs.
Materials in-transitCost is determined using the specific identification basis.
Spare parts and suppliesCost is determined using the average method.
Assets Held for SaleThe Group classifies assets as held for sale (disposal group) when their carrying amount will be recovered principally through a sale transaction rather than through continuing use. For this to be the case, the asset must be available for immediate sale in its present condition subject only to terms that are usual and customary for sales of such assets and its sale must be highly probable. For the sale to be highly probable, the appropriate level of management must be committed to a plan to sell the asset and an active program to locate a buyer and complete the plan must have been initiated. Furthermore, the asset must be actively marketed for sale at a price that is reasonable in relation to its current fair value. In addition, the sale should be expected to qualify for recognition as a completed sale within one year from the date of classification.
The related results of operations and cash flows of the disposal group that qualify as discontinued operations are separated from the results of those that would be recovered principally through continuing use, and the prior years’ consolidated statements of comprehensive income and consolidated statements of cash flows are re-presented. The results of operations and cash flows of the disposal group that qualify as discontinued operations are presented in the consolidated statements of comprehensive income and consolidated statements of cash flows as items associated with discontinued operations.
In circumstances where certain events have extended the period to complete the sale of a disposal group beyond one year, the disposal group continues to be classified as held for sale if the delay is caused by events or circumstances beyond the Group’s control and there is sufficient evidence that the Group remains committed to its plan to sell the disposal group. Otherwise, if the criteria for classification of a disposal group as held for sale are no longer met, the Group ceases to classify the disposal group as held for sale.
Initial and subsequent measurementAssets held-for-sale are measured at the lower of their carrying amount or fair value less costs to sell. Impairment losses are recognized for any initial or subsequent write-down of the assets held for sale to the extent that these have not been previously recognized at initial recognition. Reversals of impairment losses for any subsequent increases in fair value less cost to sell of the assets held for sale are recognized as a gain, but not in excess of the cumulative impairment loss that has been previously recognized.
Property, Plant and EquipmentProperty, plant and equipment, except land, are carried at cost less accumulated depreciation and amortization and impairment losses, if any. The cost of an item of property, plant and equipment comprises its purchase price and any cost attributable in bringing the asset to its intended location and working condition. Cost also includes: (a) interest and other financing charges on borrowed funds used to finance the acquisition of property, plant and equipment to the extent incurred during the period of installation and construction; and (b) asset retirement obligation relating to property, plant and equipment installed/constructed on leased properties, if any.
Land is stated at cost less any impairment in value.
Subsequent costs are capitalized as part of the ‘Property, plant and equipment’, only when it is probable that future economic benefits associated with the item will flow to the Group and the cost of the item can be measured reliably. All other repairs and maintenance are charged against current operations as incurred.
Foreign exchange differentials arising from foreign currency borrowings used for the acquisition of property, plant and equipment are capitalized to the extent that these are regarded as adjustments to interest costs.
53
Construction in-progress is stated at cost. This includes the cost of construction and other direct costs. Borrowing costs that are directly attributable to the construction of property, plant and equipment are capitalized during the construction period. Construction in-progress is not depreciated until such time as the relevant assets are completed and put into operational use.
Construction in-progress are transferred to the related ‘Property, plant and equipment’ when the construction or installation and related activities necessary to prepare the property, plant and equipment for their intended use are completed, and the property, plant and equipment are ready for service.
Depreciation and amortization of property, plant and equipment commence, once the property, plant and equipment are available for use and are computed using the straight-line method over the estimated useful lives (EUL) of the assets regardless of utilization.
The EUL of property, plant and equipment of the Group follow:
Years
Land improvements 20Buildings and improvements 10-30Machinery and equipment 10Transportation equipment 5 Furniture, fixtures and equipment 5
Leasehold improvements are amortized over the shorter of their EUL or the corresponding lease terms.
Major spare parts and stand-by equipment items that the Group expects to use over more than one period and can be used only in connection with an item of property, plant and equipment are accounted for as property, plant and equipment. Depreciation and amortization on these major spare parts and stand-by equipment commence once these have become available for use (i.e., when it is in the location and condition necessary for it to be capable of operating in the manner intended by the Group).
An item of property, plant and equipment is derecognized upon disposal or when no future economic benefits are expected to arise from the continued use of the asset. Any gain or loss arising on derecognition of the asset (calculated as the difference between the net disposal proceeds and the carrying amount of the item) is included in the consolidated statement of comprehensive income, in the year the item is derecognized.
The assets’ residual values, useful lives and methods of depreciation and amortization are reviewed and adjusted, if appropriate, at each financial year-end.
Investment PropertiesInvestment properties consist of properties that are held to earn rentals or for capital appreciation or both, and those which are not occupied by entities in the Group. Investment properties, except for land, are carried at cost less accumulated depreciation and any impairment in value. Land is carried at cost less any impairment in value. The carrying amount includes the cost of replacing part of an existing investment property at the time that cost is incurred if the recognition criteria are met, and excludes the cost of day-to-day servicing of an investment property.
Investment properties are measured initially at cost, including transaction costs. Transaction costs represent nonrefundable taxes such as capital gains tax and documentary stamp tax that are for the account of the Group. An investment property acquired through an exchange transaction is measured at fair value of the asset acquired unless the fair value of such an asset cannot be measured in which case the investment property acquired is measured at the carrying amount of asset given up. Foreclosed properties are classified under investment properties on foreclosure date.

54
The Group’s investment properties are depreciated using the straight-line method over their EUL as follows:
Land improvements 10 yearsBuildings and building improvements 10 to 30 years
Investment properties are derecognized when either they have been disposed of or when the investment properties are permanently withdrawn from use and no future economic benefit is expected from their disposal. Any gains or losses on the retirement or disposal of investment properties are recognized in the consolidated statement of comprehensive income in the year of retirement or disposal.
Transfers are made to investment property when, and only when, there is a change in use, evidenced by the end of owner occupation, commencement of an operating lease to another party or by the end of construction or development. Transfers are made from investment property when, and only when, there is a change in use, evidenced by commencement of owner occupation or commencement of development with a view to sell.
For a transfer from investment property to owner-occupied property to inventories, the deemed cost of property for subsequent accounting is its fair value at the date of change in use. If the property occupied by the Group as an owner-occupied property becomes an investment property, the Group accounts for such property in accordance with the policy stated under Property, Plant and Equipment account up to the date of change in use.
Biological AssetsThe biological assets of the Group are divided into two major categories with sub-categories as follows:
Swine livestock - Breeders (livestock bearer) - Sucklings (breeders’ offspring) - Weanlings (comes from sucklings intended to be breeders or to be sold as fatteners) - Fatteners/finishers (comes from weanlings unfit to become breeders; intended for the
production of meat)
Poultry livestock - Breeders (livestock bearer) - Chicks (breeders’ offspring intended to be sold as breeders)
A biological asset shall be measured on initial recognition and at each financial position date at its fair value less estimated point-of-sale costs, except for a biological asset where fair value is not clearly determinable. Agricultural produce harvested from an entity’s biological assets shall be measured at its fair value less estimated point-of-sale costs.
The Group is unable to measure fair values reliably for its poultry livestock breeders in the absence of: (a) an available market determined prices or values; and (b) alternative estimates of fair values that are determined to be clearly reliable; thus, these biological assets are measured at cost less accumulated depreciation and any accumulated impairment losses. However, once the fair values become reliably measurable, the Group measures these biological assets at their fair values less estimated point-of-sale costs.
Agricultural produce is the harvested product of the Group’s biological assets. A harvest occurs when agricultural produce is either detached from the bearer biological asset or when the asset’s life processes of the agricultural produce ceases. A gain or loss arising on initial recognition of agricultural produce at fair value less estimated point-of-sale cost shall be included in the consolidated statement of comprehensive income in the period in which it arises. The agricultural produce in swine livestock is the suckling that transforms into weanling then into fatteners/finishers, while the agricultural produce in poultry livestock is the hatched chick and table eggs.
Biological assets at costThe cost of an item of biological asset comprises its purchase price and any costs attributable in bringing the biological asset to its location and conditions intended by management.
55
Depreciation is computed using the straight-line method over the EUL of the biological assets, regardless of utilization. The EUL of biological assets is reviewed annually based on expected utilization as anchored on business plans and strategies that considers market behavior to ensure that the period of depreciation is consistent with the expected pattern of economic benefits from items of biological assets. The EUL of biological assets ranges from two to three years.
The carrying values of biological assets are reviewed for impairment when events or changes in the circumstances indicate that the carrying values may not be recoverable (see further discussion under Impairment of Nonfinancial Assets).
Biological assets carried at fair values less estimated point-of-sale costsSwine livestock are measured at their fair values less point-of-sale costs. The fair values are determined based on current market prices of livestock of similar age, breed and genetic merit. Point-of-sale costs include commissions to brokers and dealers, nonrefundable transfer taxes and duties. Point-of-sale costs exclude transport and other costs necessary to get the biological assets to the market.
A gain or loss on initial recognition of a biological asset at fair value less estimated point-of-sale costs and from a change in fair value less estimated point-of-sale costs of a biological asset shall be included in the consolidated statement of comprehensive income in the period in which it arises.
Investment in a Joint VentureThe Group has a 50% interest in Hunt-Universal Robina Corporation (HURC), a joint venture which is a jointly controlled entity. A joint venture is a contractual arrangement whereby two or more parties undertake an economic activity that is subject to joint control, and a jointly controlled entity is a joint venture that involves the establishment of a separate entity in which each venturer has an interest.
The Group’s investment in a joint venture is accounted for using the equity method of accounting. Under the equity method, the investment in a joint venture is carried in the consolidated statement of financial position at cost plus post-acquisition changes in the Group’s share in the net assets of the joint venture. The consolidated statement of comprehensive income reflects the Group’s share in the results of operations of the joint venture. Where there has been a change recognized directly in the investees’ equity, the Group recognizes its share of any changes and discloses this, when applicable, in the consolidated statement of changes in equity.
The investee company’s accounting policies conform to those used by the Group for like transactions and events in similar circumstances.
GoodwillGoodwill represents the excess of the cost of the acquisition over the fair value of identifiable net assets of the investee at the date of acquisition which is not identifiable to specific assets. Goodwill acquired in a business combination from the acquisition date is allocated to each of the Group’s cash-generating units, or groups of cash-generating units that are expected to benefit from the synergies of the combination, irrespective of whether other assets or liabilities of the Group are assigned to those units or groups of units.
Following initial recognition, goodwill is measured at cost, less any accumulated impairment losses. Goodwill is reviewed for impairment annually or more frequently, if events or changes in circumstances indicate that the carrying value may be impaired (see further discussion under Impairment of Nonfinancial Assets).
If the acquirer’s interest in the net fair value of the identifiable assets, liabilities and contingent liabilities exceeds the costs of the business combination, the acquirer shall recognize immediately in the consolidated statement of comprehensive income any excess remaining after reassessment.
Intangible AssetsIntangible assets acquired separately are measured on initial recognition at cost. Following initial recognition, intangible assets are measured at cost less any accumulated amortization and impairment losses, if any.

56
The EUL of intangible assets are assessed to be either finite or indefinite.
The useful lives of intangible assets with a finite life are assessed at the individual asset level. Intangible assets with finite lives are amortized over the asset’s EUL and assessed for impairment, whenever there is an indication that the intangible assets may be impaired. The amortization period and the amortization method for an intangible asset with a finite useful life are reviewed at least at each financial year-end. Changes in the EUL or the expected pattern of consumption of future economic benefits embodied in the asset is accounted for by changing the amortization period or method, as appropriate, and treated as changes in accounting estimates. The amortization expense on intangible assets with finite useful lives is recognized in the consolidated statement of comprehensive income in the expense category consistent with the function of the intangible asset.
Intangible assets with indefinite useful lives are tested for impairment annually either individually or at the cash-generating unit level (see further discussion under Impairment of Nonfinancial Assets). Such intangibles are not amortized. The useful life of an intangible asset with an indefinite useful life is reviewed annually to determine whether indefinite life assessment continues to be supportable. If not, the change in the useful life assessment from indefinite to finite is made on a prospective basis.
A gain or loss arising from derecognition of an intangible asset is measured as the difference between the net disposal proceeds and the carrying amount of the asset and is recognized in the consolidated statement of comprehensive income when the asset is derecognized.
A summary of the policies applied to the Group’s intangible assets follows:
Product Formulation Trademarks
Useful lives Indefinite Indefinite Finite (4 years)
Amortization method used No amortization
No amortization
Straight-line amortization
Internally generated or acquired Acquired Acquired Acquired
Impairment of Nonfinancial AssetsThis accounting policy applies primarily to the Group’s property, plant and equipment (Note 13), investment properties (Note 18), investment in a joint venture (Note 17), intangible assets (Note 16) and biological assets at cost (Note 15).
The Group assesses at each reporting date whether there is an indication that its nonfinancial assets may be impaired. When an indicator of impairment exists or when an annual impairment testing for an asset is required, the Group makes a formal estimate of recoverable amount. Recoverable amount is the higher of an asset’s (or cash-generating unit’s) fair value less costs to sell and its value in use and is determined for an individual asset, unless the asset does not generate cash inflows that are largely independent of those from other assets or groups of assets, in which case the recoverable amount is assessed as part of the cash-generating unit to which it belongs. Where the carrying amount of an asset (or cash generating unit) exceeds its recoverable amount, the asset (or cash-generating unit) is considered impaired and is written down to its recoverable amount. In assessing value in use, the estimated future cash flows are discounted to their present value using a pre-tax discount rate that reflects current market assessments of the time value of money and the risks specific to the asset (or cash-generating unit).
Impairment losses are recognized in the consolidated statement of comprehensive income.
For assets excluding goodwill, an assessment is made at each reporting date as to whether there is any indication that previously recognized impairment losses may no longer exist or may have decreased. If such indication exists, the recoverable amount is estimated. A previously recognized impairment loss is reversed only if there has been a change in the estimates used to determine the asset’s recoverable amount since the last impairment loss was recognized. If that is the case, the carrying amount of the asset is increased to its recoverable amount. That increased amount cannot exceed the carrying amount that would have been determined, net of depreciation and amortization, had no
57
impairment loss been recognized for the asset in prior years. Such reversal is recognized in the consolidated statement of comprehensive income. After such a reversal, the depreciation and amortization expense is adjusted in future years to allocate the asset’s revised carrying amount, less any residual value, on a systematic basis over its remaining life.
The following criteria are also applied in assessing impairment of specific assets:
GoodwillGoodwill is reviewed for impairment, annually or more frequently, if events or changes in circumstances indicate that the carrying value may be impaired.
Impairment is determined by assessing the recoverable amount of the cash-generating unit (or group of cash-generating units) to which the goodwill relates. Where the recoverable amount of the cash-generating unit (or group of cash-generating units) is less than the carrying amount to which goodwill has been allocated, an impairment loss is recognized. Where goodwill forms part of a cash-generating unit (or group of cash-generating units) and part of the operations within that unit is disposed of, the goodwill associated with the operation disposed of is included in the carrying amount of the operation when determining the gain or loss on disposal of the operation. Goodwill disposed of in this circumstance is measured on the basis of the relative fair values of the operation disposed of and the portion of the cash-generating unit retained. Impairment losses relating to goodwill cannot be reversed in future periods.
Biological assets at cost The carrying values of biological assets are reviewed for impairment when events or changes in circumstances indicate that the carrying values may not be recoverable.
Intangible assetsIntangible assets with indefinite useful lives are tested for impairment annually as of year-end either individually or at the cash-generating unit level, as appropriate.
Investment in a joint ventureAfter application of the equity method, the Group determines whether it is necessary to recognize an additional impairment loss on the Group’s investment in a joint venture. If this is the case, the Group calculates the amount of impairment as being the difference between the fair value of the joint venture and the acquisition cost and recognizes the amount in the consolidated statement of comprehensive income.
Treasury SharesTreasury shares are recorded at cost and are presented as a deduction from equity. When the shares are retired, the capital stock account is reduced by its par value. The excess of cost over par value upon retirement is debited to the following accounts in the order given: (a) additional paid-in capital to the extent of the specific or average additional paid-in capital when the shares were issued, and (b) retained earnings. No gain or loss is recognized in the consolidated statement of comprehensive income on the purchase, sale, issue or cancellation of the Group’s own equity instruments.
ProvisionsProvisions are recognized when: (a) the Group has a present obligation (legal or constructive) as a result of a past event; (b) it is probable (i.e., more likely than not) that an outflow of resources embodying economic benefits will be required to settle the obligation; and (c) a reliable estimate can be made of the amount of the obligation. Provisions are reviewed at each financial position date and adjusted to reflect the current best estimate. If the effect of the time value of money is material, provisions are determined by discounting the expected future cash flows at a pre-tax rate that reflects current market assessment of the time value of money and, where appropriate, the risks specific to the liability. Where discounting is used, the increase in the provision due to the passage of time is recognized as interest expense in the consolidated statement of comprehensive income. Where the Group expects a provision to be reimbursed, the reimbursement is recognized as a separate asset but only when the reimbursement is probable.
ContingenciesContingent liabilities are not recognized in the consolidated financial statements but disclosed unless the possibility of an outflow of resources embodying economic benefits is remote. Contingent assets are not recognized in the consolidated financial statements but disclosed when an inflow of economic benefits is probable.
58
Pension CostsPension cost is actuarially determined using the projected unit credit method. This method reflects services rendered by employees up to the date of valuation and incorporates assumptions concerning employees’ projected salaries. Actuarial valuations are conducted with sufficient regularity, with option to accelerate when significant changes to underlying assumptions occur. Pension cost includes current service cost, interest cost, expected return on any plan assets, actuarial gains and losses and the effect of any curtailments or settlements.
Actuarial gains and losses arising from experience adjustments and changes in actuarial assumptions are credited to or charged against income when the net cumulative unrecognized actuarial gains and losses at the end of the previous period exceed 10% of the higher of the present value of the defined benefit obligation and the fair value of plan assets at that date. The excess actuarial gains or losses are recognized over the average remaining working lives of the employees participating in the plan.
The asset or liability recognized in the consolidated statement of financial position in respect of defined benefit pension plans is the present value of the defined benefit obligation as of the financial position date less the fair value of plan assets, together with adjustments for unrecognized actuarial gains or losses and past service costs. The defined benefit obligation is calculated annually by an independent actuary using the projected unit credit method. The present value of the defined benefit obligation is determined by discounting the estimated future cash inflows using risk-free interest rates that have terms to maturity approximating the terms of the related pension liability.
Past service costs, if any, are recognized immediately in the consolidated statement of comprehensive income, unless the changes to the pension plan are conditional on the employees remaining in service for a specified period of time (the vesting period). In this case, past service costs are amortized on a straight-line basis over the vesting period.
Asset ceiling testThe asset ceiling test requires a defined benefit asset to be measured at the lower of the amount of the prepaid retirement asset and the total of any cumulative unrecognized net actuarial losses and past service costs and the present value of any economic benefits available in the form of refunds from the plan as reductions in the future contributions to the plan.
Income TaxesCurrent taxCurrent tax assets and liabilities for the current and prior periods are measured at the amount expected to be recovered from or paid to the taxation authorities. The tax rates and tax laws used to compute the amount are those that are enacted or substantially enacted at the financial position date.
Deferred taxDeferred tax is provided using the balance sheet liability method on all temporary differences, with certain exceptions, at the financial position date between the tax bases of assets and liabilities and their carrying amounts for financial reporting purposes.
Deferred tax liabilities are recognized for all taxable temporary differences, with certain exceptions. Deferred tax assets are recognized for all deductible temporary differences with certain exceptions, and carryforward benefits of unused tax credits from excess minimum corporate income tax (MCIT) over regular corporate income tax and unused net operating loss carryover (NOLCO), to the extent that it is probable that taxable income will be available against which the deductible temporary differences and carryforward benefits of unused tax credits from excess MCIT and unused NOLCO can be utilized.
Deferred tax assets are not recognized when they arise from the initial recognition of an asset or liability in a transaction that is not a business combination and, at the time of transaction, affects neither the accounting income nor taxable income or loss. Deferred tax liabilities are not provided on nontaxable temporary differences associated with investments in domestic subsidiaries, associates and interests in joint ventures. With respect to investments in foreign subsidiaries, associates and interests in joint ventures, deferred tax liabilities are recognized except where the timing
59
of the reversal of the temporary differences can be controlled and it is probable that the temporary difference will not reverse in the foreseeable future.
The carrying amounts of deferred tax assets are reviewed at each financial position date and reduced to the extent that it is no longer probable that sufficient taxable income will be available to allow all or part of the deferred tax assets to be utilized. Unrecognized deferred tax assets are reassessed at each financial position date, and are recognized to the extent that it has become probable that future taxable income will allow the deferred tax assets to be recognized.
Deferred tax assets and liabilities are measured at the tax rate that is expected to apply to the period when the asset is realized or the liability is settled, based on tax rates (and tax laws) that have been enacted or substantively enacted as of financial position date.
Deferred tax assets and deferred tax liabilities are offset if a legally enforceable right exists to set off current tax assets against current tax liabilities and the deferred taxes relate to the same taxable entity and the same taxation authority.
Borrowing CostsInterest and other finance costs incurred during the construction period on borrowings used to finance property development are capitalized to the appropriate asset accounts. Capitalization of borrowing costs commences when the activities to prepare the asset are in progress, and expenditures and borrowing costs are being incurred. The capitalization of these borrowing costs ceases when substantially all the activities necessary to prepare the asset for sale or its intended use are complete. If the carrying amount of the asset exceeds its recoverable amount, an impairment loss is recorded. Capitalized borrowing cost is based on the applicable weighted average borrowing rate. Borrowing costs which do not qualify for capitalization are expensed as incurred.
Interest expense on loans is recognized using the effective interest method over the term of the loans.
LeasesThe determination of whether an arrangement is, or contains a lease, is based on the substance of the arrangement at inception date, and requires an assessment of whether the fulfillment of the arrangement is dependent on the use of a specific asset or assets and the arrangement conveys a right to use the asset(s). A reassessment is made after inception of the lease only if one of the following applies:
a. there is a change in contractual terms, other than a renewal or extension of the arrangement;b. a renewal option is exercised or an extension granted, unless that term of the renewal or extension was initially
included in the lease term;c. there is a change in the determination of whether fulfillment is dependent on a specified asset; ord. there is a substantial change to the asset.
Where a reassessment is made, lease accounting shall commence or cease from the date when the change in circumstances gave rise to the reassessment for any of the scenarios above, and at the date of renewal or extension period for scenario b.
Group as a lesseeLeases where the lessor retains substantially all the risks and benefits of ownership of the asset are classified as operating leases. Operating lease payments are recognized as an expense in the consolidated statement of comprehensive income on a straight-line basis over the lease term.
Group as a lessorLeases where the Group does not transfer substantially all the risks and benefits of ownership of the assets are classified as operating leases. Initial direct costs incurred in negotiating operating leases are added to the carrying amount of the leased asset and recognized over the lease term on the same basis as the rental income. Contingent rents are recognized as revenue in the period in which they are earned.
60
Foreign Currency Translation/Transactions The functional and presentation currency of the Parent Company and its Philippine subsidiaries (as well as certain consolidated foreign subsidiaries) is the Philippine Peso.
Each entity in the Group determines its own functional currency and items included in the consolidated financial statements of each entity are measured using that functional currency. Transactions in foreign currencies are initially recorded in the functional currency rate ruling at the date of the transaction. Monetary assets and liabilities denominated in foreign currencies are retranslated at the functional currency rate of exchange ruling at the financial position date. All differences are taken to the consolidated statement of comprehensive income. Tax charges and credits attributable to exchange differences on those borrowings are also dealt with in statement of comprehensive income. Nonmonetary items that are measured in terms of historical cost in a foreign currency are translated using the exchange rate as at the date of initial transaction. Nonmonetary items measured at fair value in a foreign currency are translated using the exchange rates at the date when the fair value was determined.
The functional currencies of the Group’s consolidated foreign subsidiaries follow:
Country of FunctionalSubsidiaries Incorporation Currency
URCL Cayman Islands Philippine Peso
URCPL British Virgin Islands - do -
URC Asean Brands Co. Ltd. - do - US Dollar
Hong Kong China Foods Co. Ltd. - do - - do -
URCICL - do - - do -
Shanghai Peggy Foods Co., Ltd. China Chinese Yuan
Tianjin Pacific Foods Manufacturing Co., Ltd. China Chinese Yuan
URC China Commercial Co. Ltd. - do - - do -
Xiamen Tongan Pacific Food Co., Ltd. - do - - do -
Panyu Peggy Foods Co., Ltd. - do - - do -
URC Hong Kong Company Limited Hong Kong HK Dollar
PT URC Indonesia Indonesia Indonesian Rupiah
URC Snack Foods (Malaysia) Sdn. Bhd. Malaysia Malaysian Ringgit
Ricellent Sdn. Bhd. - do - - do -
URC Foods (Singapore) Pte. Ltd. Singapore Singapore Dollar
Acesfood Network Pte. Ltd. - do - - do -
Acesfood Holdings Pte. Ltd. - do - - do -
Acesfood Distributors Pte. Ltd. - do - - do -
Guangdong Acesfood International Co., Ltd. - do - - do -
Shantou SEZ Toyo Food Industries Co., Ltd. - do - - do -
Shantou SEZ Shanfu Foods Co., Ltd. - do - - do -
Advanson International Pte. Ltd. - do - - do -
Jiangsu Aces - do - - do -
URC (Thailand) Co., Ltd. Thailand Thai Baht
URC Vietnam Co., Ltd. Vietnam Vietnam Dong
As of reporting date, the assets and liabilities of these subsidiaries are translated into the presentation currency of the Group at the rate of exchange ruling at the financial position date and their respective statements of comprehensive income are translated at the weighted average exchange rates for the year. The exchange differences arising on the translation are taken directly to a separate component of equity. On disposal of a foreign entity, the deferred cumulative amount recognized in equity relating to that particular foreign operation shall be recognized as part of profit and loss in the consolidated statements of comprehensive income.
61
Earnings Per Share (EPS)Basic EPS is computed by dividing consolidated net income applicable to common stock (consolidated net income less dividends on preferred stock) by the weighted average number of common shares issued and outstanding during the year, adjusted for any subsequent stock dividends declared.
Diluted EPS amounts are calculated by dividing the consolidated net profit attributable to ordinary equity holders of the parent by the weighted average number of ordinary shares outstanding during the year plus the weighted average number of ordinary shares that would be issued on the conversion of all the dilutive potential ordinary shares into ordinary shares.
Segment ReportingThe Group’s operating businesses are organized and managed separately according to the nature of the products and services provided, with each segment representing a strategic business unit that offers different products and serves different markets. Financial information on business segments is presented in Note 6 to the consolidated financial statements.
Subsequent EventsAny post year-end event up to the date of approval of the Board of Directors (BOD) of the consolidated financial statements that provides additional information about the Group’s position at the financial position date (adjusting event) is reflected in the consolidated financial statements. Any post year-end event that is not an adjusting event is disclosed in the notes to the consolidated financial statements, when material.
New Accounting Standards, Interpretations, and Amendments to Existing Standards Effective Subsequent to September 30, 2009The Group will adopt the following standards and interpretations when these become effective. Except as otherwise indicated, the Group does not expect the adoption of these new and amended PFRS and Philippine Interpretations to have a significant impact on its consolidated financial statements.
Effective in 2009 for adoption in fiscal year ending September 30, 2010• Amendment to PFRS 1, First-time Adoption of Philippine Financial Reporting Standards - Cost of an Investment in
a Subsidiary, Jointly Controlled Entity or AssociateThe amended PFRS 1 allows an entity, in its separate financial statements, to determine the cost of investments in subsidiaries, jointly controlled entities or associates (in its opening PFRS financial statements) as one of the following amounts: a) cost determined in accordance with PAS 27, Consolidated and Separate Financial Statements; b) at the fair value of the investment at the date of transition to PFRS, determined in accordance with PAS 39; or c) previous carrying amount (as determined under generally accepted accounting principles) of the investment at the date of transition to PFRS.
• Amendments to PFRS 2, Share-based Payment - Vesting Condition and CancellationsThe standard has been revised to clarify the definition of a vesting condition and prescribes the treatment for an award that is effectively cancelled. It defines a vesting condition as a condition that includes an explicit or implicit requirement to provide services. It further requires non-vesting conditions to be treated in similar fashion to market conditions. Failure to satisfy a non-vesting condition that is within the control of either the entity or the counterparty is accounted for as cancellation. However, failure to satisfy a non-vesting condition that is beyond the control of either party does not give rise to a cancellation.
• Amendments to PAS 27, Consolidated and Separate Financial Statements - Cost of an Investment in a Subsidiary, Jointly Controlled Entity or AssociateThe amended PAS 27 has changes in respect of the holding companies’ separate financial statements, including (a) the deletion of the ‘cost method’, making the distinction between pre- and post-acquisition profits no longer required; and (b) in cases of reorganizations where a new parent is inserted above an existing parent of the group (subject to meeting specific requirements), the cost of the subsidiary is the previous carrying amount of its share of equity items in the subsidiary rather than its fair value. All dividends will be recognized in profit or loss. However, the payment of such dividends requires the entity to consider whether there is an indicator of impairment.
62
• Amendment to PAS 32, Financial Instruments: Presentation and PAS 1, Presentation of Financial Statements - Puttable Financial Instruments and Obligations Arising on LiquidationThese amendments specify, among others, that puttable financial instruments will be classified as equity if they have all of the following specified features: (a) The instrument entitles the holder to require the entity to repurchase or redeem the instrument (either on an ongoing basis or on liquidation) for a pro rata share of the entity’s net assets, (b) The instrument is in the most subordinate class of instruments, with no priority over other claims to the assets of the entity on liquidation, (c) All instruments in the subordinate class have identical features, (d) The instrument does not include any contractual obligation to pay cash or financial assets other than the holder’s right to a pro rata share of the entity’s net assets, and (e) The total expected cash flows attributable to the instrument over its life are based substantially on the profit or loss, a change in recognized net assets, or a change in the fair value of the recognized and unrecognized net assets of the entity over the life of the instrument.
Improvements to PFRS and PASIn May 2008, the International Accounting Standards Board (IASB) issued its first omnibus of amendments to certain standards, primarily with a view to removing inconsistencies and clarifying wording. These are the separate transitional provisions for each standard:
PFRS 5, Noncurrent Assets Held for Sale and Discontinued Operations• When a subsidiary is held for sale, all of its assets and liabilities will be classified as held for sale under PFRS 5,
even when the entity retains a non-controlling interest in the subsidiary after the sale.
PAS 1, Presentation of Financial Statements• Assets and liabilities classified as held for trading are not automatically classified as current in the balance sheet.
PAS 16, Property, Plant and Equipment• The amendment replaces the term ‘net selling price’ with ‘fair value less costs to sell’, to be consistent with PFRS 5
and PAS 36, Impairment of Assets.• Items of property, plant and equipment held for rental that are routinely sold in the ordinary course of business
after rental, are transferred to inventory when rental ceases and they are held for sale. Proceeds of such sales are subsequently shown as revenue. Cash payments on initial recognition of such items, the cash receipts from rents and subsequent sales are all shown as cash flows from operating activities.
PAS 19, Employee Benefits• Revises the definition of ‘past service costs’ to include reductions in benefits related to past services (‘negative past
service costs’) and to exclude reductions in benefits related to future services that arise from plan amendments. Amendments to plans that result in a reduction in benefits related to future services are accounted for as a curtailment.
• Revises the definition of ‘return on plan assets’ to exclude plan administration costs if they have already been included in the actuarial assumptions used to measure the defined benefit obligation.
• Revises the definition of ‘short-term’ and ‘other long-term’ employee benefits to focus on the point in time at which the liability is due to be settled.
• Deletes the reference to the recognition of contingent liabilities to ensure consistency with PAS 37, Provisions, Contingent Liabilities and Contingent Assets.
PAS 20, Accounting for Government Grants and Disclosures of Government Assistance• Loans granted with no or low interest rates will not be exempt from the requirement to impute interest. The
difference between the amount received and the discounted amount is accounted for as a government grant.
PAS 23, Borrowing Costs• Revises the definition of borrowing costs to consolidate the types of items that are considered components of
‘borrowing costs’, i.e., components of the interest expense calculated using the EIR method.
63
PAS 27, Consolidated and Separate Financial Statements• When a parent entity accounts for a subsidiary at fair value in accordance with PAS 39 in its separate financial
statements, this treatment continues when the subsidiary is subsequently classified as held-for-sale.
PAS 28, Investment in Associates• If an associate is accounted for at fair value in accordance with PAS 39, only the requirement of PAS 28 to disclose
the nature and extent of any significant restrictions on the ability of the associate to transfer funds to the entity in the form of cash or repayment of loans applies.
• An investment in an associate is a single asset for the purpose of conducting the impairment test. Therefore, any impairment test is not separately allocated to the goodwill included in the investment balance.
PAS 29, Financial Reporting in Hyperinflationary Economies• Revises the reference to the exception that assets and liabilities should be measured at historical cost, such that it
notes property, plant and equipment as being an example, rather than implying that it is a definitive list.
PAS 31, Interest in Joint Ventures• If a joint venture is accounted for at fair value, in accordance with PAS 39, only the requirements of PAS 31 to
disclose the commitments of the venturer and the joint venture, as well as summary financial information about the assets, liabilities, income and expense will apply.
PAS 36, Impairment of Assets• When discounted cash flows are used to estimate ‘fair value less cost to sell’ additional disclosure is required about
the discount rate, consistent with disclosures required when the discounted cash flows are used to estimate ‘value in use’.
PAS 38, Intangible Assets• Expenditure on advertising and promotional activities is recognized as an expense when the company either has
the right to access the goods or has received the services. Advertising and promotional activities now specifically include mail order catalogues.
• Deletes references to there being rarely, if ever, persuasive evidence to support an amortization method for finite life intangible assets that results in a lower amount of accumulated amortization than under the straight-line method, thereby effectively allowing the use of the unit of production method.
PAS 39, Financial Instruments: Recognition and Measurement• Changes in circumstances relating to derivatives - specifically derivatives designated or de-designated as hedging
instruments after initial recognition - are not reclassifications.• When financial assets are reclassified as a result of an insurance company changing its accounting policy
in accordance with paragraph 45 of PFRS 4, Insurance Contracts, this is a change in circumstance, not a reclassification.
• Removes the reference to a ‘segment’ when determining whether an instrument qualifies as a hedge.• Requires use of the revised EIR (rather than the original EIR) when re-measuring a debt instrument on the
cessation of fair value hedge accounting.
PAS 40, Investment Property• Revises the scope (and the scope of PAS 16) to include property that is being constructed or developed for future use
as an investment property. Where an entity is unable to determine the fair value of an investment property under construction, but expects to be able to determine its fair value on completion, the investment under construction will be measured at cost until such time as fair value can be determined or construction is complete.
PAS 41, Agriculture• Removes the reference to the use of a pre-tax discount rate to determine fair value, thereby allowing use of either a
pre-tax or post-tax discount rate depending on the valuation methodology used.• Removes the prohibition to take into account cash flows resulting from any additional transformations when
estimating fair value. Instead, cash flows that are expected to be generated in the ‘most relevant market’ are taken into account.
64
Effective in 2010 for adoption in fiscal year ending September 30, 2011• Revised PFRS 3, Business Combinations and PAS 27, Consolidated and Separate Financial Statements
The revised PFRS 3 introduces a number of changes in the accounting for business combinations that will impact the amount of goodwill recognized, the reported results in the period that an acquisition occurs, and future reported results. The revised PAS 27 requires, among others, that (a) change in ownership interests of a subsidiary (that do not result in loss of control) will be accounted for as an equity transaction and will have no impact on goodwill nor will it give rise to a gain or loss; (b) losses incurred by the subsidiary will be allocated between the controlling and non-controlling interests (previously referred to as ‘minority interests’); even if the losses exceed the non-controlling equity investment in the subsidiary; and (c) on loss of control of a subsidiary, any retained interest will be remeasured to fair value and this will impact the gain or loss recognized on disposal. The changes introduced by the revised PFRS 3 must be applied prospectively, while changes introduced by revised PAS 27 must be applied retrospectively with a few exceptions. The changes will affect future acquisitions and transactions with non-controlling interests.
• Amendment to PAS 39, Financial Instruments: Recognition and Measurement - Eligible Hedged ItemsThe amendment to PAS 39 will be effective on July 1, 2009, which addresses only the designation of a one-sided risk in a hedged item, and the designation of inflation as a hedged risk or portion in particular situations. The amendment clarifies that an entity is permitted to designate a portion of the fair value changes or cash flow variability of a financial instrument as a hedged item.
• Philippine Interpretation IFRIC 17, Distribution of Non-cash Assets to OwnersThis Interpretation covers accounting for two types of non-reciprocal distributions of assets by an entity to its owners acting in their capacity as owners. The two types of distribution are:a. distributions of non-cash assets (e.g., items of property, plant and equipment, businesses as defined in PFRS 3,
ownership interests in another entity or disposal groups as defined in PFRS 5); andb. distributions that give owners a choice of receiving either non-cash assets or a cash alternative.
This Interpretation addresses only the accounting by an entity that makes a non-cash asset distribution. It does not address the accounting by shareholders who receive such a distribution.
• Philippine Interpretation IFRIC 18, Transfers of Assets from CustomersThis Interpretation covers accounting for transfers of items of property, plant and equipment by entities that receive such transfers from their customers. Agreements within the scope of this Interpretation are agreements in which an entity receives from a customer an item of property, plant and equipment that the entity must then use either to connect the customer to a network or to provide the customer with ongoing access to a supply of goods or services, or to do both. This Interpretation also applies to agreements in which an entity receives cash from a customer when that amount of cash must be used only to construct or acquire an item of property, plant and equipment and the entity must then use the item of property, plant and equipment either to connect the customer to a network or to provide the customer with ongoing access to a supply of goods or services, or to do both.
Improvements to PFRSsIn April 2009, the IASB issued its second omnibus of amendments to certain standards. Below are the separate transitional provisions for each standard:
PFRS 2, Share-based Payment• The contribution of a business on formation of a joint venture and combinations under common control are not
within the scope of PFRS 2 even though they are out of scope of PFRS 3 (as revised in 2008).
PFRS 5, Noncurrent Assets Held for Sale and Discontinued Operations• Clarifies that the disclosures required in respect of non-current assets or disposal groups classified as held for sale or
discontinued operations are only those set out in PFRS 5.• The disclosure requirements of other PFRSs only apply if specifically required for such non-current assets or
discontinued operations.

65
• Also clarifies that the general requirements of PAS 1 still apply, particularly paragraphs 15 (to achieve a fair presentation) and 125 (sources of estimation uncertainty) of PAS 1.
PFRS 8, Segment Reporting• Segment assets and liabilities need only be reported when those assets and liabilities are included in measures that
are used by the chief operating decision maker.
PAS 1, Presentation of Financial Statements• The terms of a liability that could result, at anytime, in its settlement by the issuance of equity instruments at the
option of the counterparty do not affect its classification.
PAS 7, Statement of Cash Flow• Explicitly states that only expenditure that results in a recognized asset can be classified as a cash flow from
investing activities.
PAS 17, Leases• Removes the specific guidance on classifying land as a lease so that only the general guidance remains.
PAS 18, Revenue• The IASB has added guidance (which accompanies the Standard) to determine whether an entity is acting as a
principal or as an agent. The features indicating an entity is acting as a principal are whether the entity:- Has primary responsibility for providing the goods or service;- Has inventory risk;- Has discretion in establishing prices;- Bears the credit risk.
PAS 36, Impairment of Assets• Clarifies that the largest unit permitted for allocating goodwill acquired in a business combination is the operating
segment, as defined in PFRS 8, before aggregation for reporting purposes.
PAS 38, Intangible Assets• If an intangible asset acquired in a business combination is identifiable only with another intangible asset, the
acquirer may recognize the group of intangible assets as a single asset provided the individual assets have similar useful lives.
• The valuation techniques presented for determining the fair value of intangible assets acquired in a business combination that are not traded in active markets are only examples and are not restrictive on the methods that can be used.
PAS 39, Financial Instruments: Recognition and Measurement• A prepayment option is considered closely related to the host contract when the exercise price of a prepayment
option reimburses the lender up to the approximate present value of lost interest for the remaining term of the host contract.
• The scope exemption for contracts between an acquirer and a vendor in a business combination to buy or sell an acquire at a future date, applies only to binding forward contracts, and not derivative contracts where further actions by either party are still to be taken.
• Gains or losses on cash flow hedges of a forecast transaction that subsequently results in the recognition of a financial instrument or on cash flow hedges of recognized financial instruments should be reclassified in the period that the hedged forecast cash flows affect profit or loss.
Philippine Interpretation IFRIC 9, Reassessment of Embedded Derivatives• The IASB amended the scope paragraph of IFRIC 9 to clarify that it does not apply to possible reassessment, at the
date of acquisition, to embedded derivatives in contracts acquired in a combination between entities or businesses under common control or the formation of a joint venture.
66
Philippine Interpretation IFRIC 16, Hedge of a Net Investment in a Foreign Operation• The amendment states that, in a hedge of a net investment in a foreign operation, qualifying hedging instruments
may be held by any entity or entities within the group, including the foreign operation itself, as long as the designation, documentation and effectiveness requirements of PAS 39 that relate to a net investment hedge are satisfied.
Effective in 2012 for adoption in fiscal year ending September 30, 2013• Philippine Interpretation IFRIC 15, Agreements for the Construction of Real Estate
This Philippine Interpretation covers accounting for revenue and associated expenses by entities that undertake the construction of real estate directly or through subcontractors. This Philippine Interpretation requires that revenue on construction of real estate be recognized only upon completion, except when such contract qualifies as a construction contract to be accounted for under PAS 11, Construction Contracts, or involves rendering of services in which case revenue is recognized based on the stage of completion. Contracts involving provision of services with the construction materials and where the risks and rewards of ownership are transferred to the buyer on a continuous basis, will also be accounted for based on the stage of completion.
3. Significant Accounting Judgments and Estimates
The preparation of the consolidated financial statements in compliance with PFRS requires the Group to make estimates and assumptions that affect the reported amounts of assets, liabilities, income and expenses and disclosure of contingent assets and contingent liabilities. Future events may occur which will cause the assumptions used in arriving at the estimates to change. The effects of any change in estimates are reflected in the consolidated financial statements as they become reasonably determinable.
Judgments and estimates are continually evaluated and are based on historical experience and other factors, including expectations of future events that are believed to be reasonable under the circumstances.
JudgmentsIn the process of applying the Group’s accounting policies, management has made the following judgments, apart from those involving estimations, which have the most significant effect on the amounts recognized in the consolidated financial statements:
Classification of financial instrumentsThe Group exercises judgment in classifying a financial instrument, or its component parts, on initial recognition as either a financial asset, a financial liability or an equity instrument in accordance with the substance of the contractual arrangement and the definitions of a financial asset, a financial liability or an equity instrument. The substance of a financial instrument, rather than its legal form, governs its classification in the consolidated statement of financial position.
In addition, the Group classifies financial assets by evaluating, among others, whether the asset is quoted or not in an active market. Included in the evaluation on whether a financial asset is quoted in an active market is the determination on whether quoted prices are readily and regularly available, and whether those prices represent actual and regularly occurring market transactions on an arm’s length basis.
Determination of fair values of financial instrumentsThe Group carries certain financial assets and liabilities at fair value, which requires extensive use of accounting judgment and estimates. While significant components of fair value measurement were determined using verifiable objective evidence (i.e., foreign exchange rates, interest rates, volatility rates), the amount of changes in fair value would differ if the Group utilized different valuation methodologies and assumptions. Any changes in fair value of these financial assets and liabilities would affect profit and loss and equity.
Where the fair values of certain financial assets and financial liabilities recorded in the consolidated statement of financial position cannot be derived from active markets, they are determined using internal valuation techniques

67
using generally accepted market valuation models. The inputs to these models are taken from observable market data where possible, but where this is not feasible, estimates are used in establishing fair values. The judgments include considerations of liquidity and model inputs such as correlation and volatility for longer dated derivatives. The fair values of the Group’s derivative financial instruments are based from quotes obtained from counterparties.
The fair values of financial instruments are disclosed in Note 5.
Classification of leasesManagement exercises judgment in determining whether substantially all the significant risks and rewards of ownership of the leased assets are transferred to the Group. Lease contracts, which transfer to the Group substantially all the risks and rewards incidental to ownership of the leased items, are capitalized. Otherwise, they are considered as operating leases.
The Group has entered into commercial property leases on its investment property portfolio. These leases do not provide for an option to purchase or transfer ownership of the property at the end of the lease and the related lease terms do not approximate the EUL of the assets being leased. The Group has determined that it retains all significant risks and rewards of ownership of these properties which are leased out on operating leases.
Distinction between investment properties and owner-occupied propertiesThe Group determines whether a property qualifies as an investment property. In making its judgment, the Group considers whether the property generates cash flows largely independent of the other assets held by an entity. Owner-occupied properties generate cash flows that are attributable not only to property but also to the other assets used in the production or supply process.
Some properties comprise a portion that is held to earn rentals or for capital appreciation and another portion that is held for use in the production or supply of goods or services or for administrative purposes. If these portions cannot be sold separately, the property is accounted for as investment property only if an insignificant portion is held for use in the production or supply of goods or services or for administrative purposes. Judgment is applied in determining whether ancillary services are so significant that a property does not qualify as an investment property. The Group considers each property separately in making its judgment.
Determination of Functional currencyPAS 21, The Effects of Changes in Foreign Exchange Rates requires management to use its judgment to determine the entity’s functional currency such that it most faithfully represents the economic effects of the underlying transactions, events and conditions that are relevant to the entity. In making this judgment, the Group considers the following:
a. the currency that mainly influences sales prices for financial instruments and services (this will often be the currency in which sales prices for its financial instruments and services are denominated and settled);
b. the currency in which funds from financing activities are generated; andc. the currency in which receipts from operating activities are usually retained.
In the case of an intermediate holding company or finance subsidiary, the principal consideration of management is whether it is an extension of the parent and performing the functions of the parent – i.e., whether its role is simply to hold the investment in, or provide finance to, the foreign operation on behalf of the parent company or whether its functions are essentially an extension of a local operation (e.g., performing selling, payroll or similar activities for that operation) or indeed it is undertaking activities on its own account. In the former case, the functional currency of the entity is the same with that of the parent; while in the latter case, the functional currency of the entity would be assessed separately.
68
Disposal group classified as held for saleIn May 2008, the Group decided to sell the shares of stock of a wholly-owned subsidiary, Tianjin Pacific Foods Manufacturing Co., Ltd. (TPFMC) and therefore classified it as a disposal group held for sale (Note 39). The Group considered the subsidiary to have met the criteria to be classified as held for sale at that date for the following reasons:
• TPFMC is available for immediate sale and can be sold on its current condition.• The Group has already entered into an agreement with potential buyers.
ContingenciesThe Group is currently involved in various legal proceedings. The estimate of the probable costs for the resolution of these claims has been developed in consultation with outside counsel handling the defense in these matters and is based upon an analysis of potential results. The Group currently does not believe these proceedings will have a material effect on the Group’s financial position. It is possible, however, that future results of operations could be materially affected by changes in the estimates or in the effectiveness of the strategies relating to these proceedings.
EstimatesThe key assumptions concerning the future and other sources of estimation uncertainty at the financial position date that have a significant risk of causing a material adjustment to the carrying amounts of assets and liabilities within the next financial year are discussed below.
Impairment of AFS investmentsAFS debt investmentsThe Group classifies certain financial assets as AFS investments and recognizes movements in the fair value in equity. When the fair value declines, management makes assumptions about the decline in value to determine whether such can be considered as an impairment loss that should be recognized in the consolidated statement of comprehensive income.
The Group recognized provision for impairment loss on AFS debt investments, included under ‘Impairment losses’ in the consolidated statements of comprehensive income, amounting to ₱185.5 million and ₱11.7 million in 2009 and 2008 (Note 14). As of September 30, 2009 and 2008, the carrying value of AFS debt investments amounted to ₱6.4 million and ₱5.5 million, respectively
AFS equity investmentsThe Group treats AFS equity investments as impaired when there has been a significant or prolonged decline in the fair value below its cost or where other objective evidence of impairment exists. The determination of what is ‘significant’ or ‘prolonged’ requires judgment. The Group treats ‘significant’ generally as 20% or more and ‘prolonged’ as 12 months or longer for quoted equity securities. In addition, the Group evaluates other factors, such as normal volatility in share price for quoted equities and the future cash flows and the discount factors for unquoted equities.
The Group did not recognize any impairment loss on AFS equity investments in 2009 and 2008. As of September 30, 2009 and 2008, the carrying value of AFS equity investments amounted to ₱918.2 million and ₱783.9 million, respectively.
Estimation of allowance for impairment losses on receivablesThe Group maintains allowances for impairment losses on its trade and other receivables at a level considered adequate to provide for potential uncollectible receivables. The level of this allowance is evaluated by the management on the basis of factors that affect the collectibility of the accounts. These factors include, but are not limited to, the length of relationship with the customer, the customer’s payment behavior and known market factors. The Group reviews the age and status of receivables, and identifies accounts that are to be provided with allowances on a continuous basis. The Group provides full allowance for trade and other receivables that it deems uncollectible.
The amount and timing of recorded expenses for any period would differ if the Group made different judgments or utilized different estimates. An increase in the allowance for impairment losses on trade and other receivables would increase recorded operating expenses and decrease current assets.
69
Provision for impairment losses on receivables amounted to ₱228.3 million, ₱94.9 million and ₱141.2 million in 2009, 2008 and 2007, respectively. Total receivables, net of allowance for impairment losses, amounted to ₱6.8 billion and ₱6.2 billion as of September 30, 2009 and 2008, respectively (Note 10).
Determination of NRV of inventoriesThe Group, in determining the NRV, considers any adjustment necessary for obsolescence, which is generally providing 100% allowance for nonmoving items for more than one year. The Group adjusts the cost of inventory to the recoverable value at a level considered adequate to reflect market decline in the value of the recorded inventories. The Group reviews the classification of the inventories and generally provides adjustments for recoverable values of new, actively sold and slow-moving inventories by reference to prevailing values of the same inventories in the market.
The amount and timing of recorded expenses for any period would differ if different judgments were made or different estimates were utilized. An increase in inventory obsolescence and market decline would increase recorded operating expenses and decrease current assets.
Inventory obsolescence and market decline (included under ‘Impairment losses’ in the consolidated statements of comprehensive income) amounted to nil and ₱192.4 million in 2009 and 2008, respectively (Note 11). The Group’s inventories, net of inventory obsolescence and market decline, amounted to ₱6.1 billion and ₱7.8 billion as of September 30, 2009 and 2008, respectively (Note 11).
EUL of property, plant and equipment and investment propertiesThe Group estimated the useful lives of its property, plant and equipment and investment properties based on the period over which the assets are expected to be available for use. The EUL of property, plant and equipment and investment properties are reviewed at least annually and are updated if expectations differ from previous estimates due to physical wear and tear and technical or commercial obsolescence on the use of these assets. It is possible that future results of operations could be materially affected by changes in these estimates brought about by changes in factors mentioned above. A reduction in the EUL of property, plant and equipment and investment properties would increase depreciation expense and decrease noncurrent assets.
As of September 30, 2009 and 2008, the balances of the Group’s depreciable property, plant and equipment and investment properties follow:
2009 2008Property, plant and equipment - net (Note 13) ₱22,370,611,370 ₱21,348,348,949Investment properties - net (Note 18) 75,405,339 79,003,584
Fair values less estimated point-of-sale costs of biological assetsThe fair values of swine are determined based on current market prices of livestock of similar age, breed and genetic merit. Point-of-sale costs include commissions to brokers and dealers, nonrefundable transfer taxes and duties. Point-of-sale costs exclude transport and other costs necessary to get the biological assets to the market. The fair values are reviewed and updated if expectations differ from previous estimates due to changes brought by both physical change and price changes in the market. It is possible that future results of operations could be materially affected by changes in these estimates brought about by the changes in factors mentioned.
As of September 30, 2009 and 2008, the Group’s biological assets carried at fair values less estimated point-of-sale costs amounted to ₱1.4 billion and ₱1.2 billion, respectively (Note 15).
Gain arising from changes in fair market value of biological assets amounted to ₱377.1 million and ₱280.3 million in 2009 and 2008, respectively (Note 15).

70
Impairment of nonfinancial assetsThe Group assesses the impairment of assets whenever events or changes in circumstances indicate that the carrying amount of an asset may not be recoverable. The factors that the Group considers important which could trigger an impairment review include the following:
• significant underperformance relative to expected historical or projected future operating results;• significant changes in the manner of use of the acquired assets or the strategy for overall business; and• significant negative industry or economic trends.
In the case of goodwill and intangible assets with indefinite lives, at a minimum, such assets are subject to an annual impairment test and more frequently whenever there is an indication that such asset may be impaired. This requires an estimation of the value in use of the cash-generating units to which the goodwill is allocated. Estimating the value in use requires the Group to make an estimate of the expected future cash flows from the cash-generating unit and to choose a suitable discount rate in order to calculate the present value of those cash flows.
In determining the present value of estimated future cash flows expected to be generated from the continued use of the assets, the Group is required to make estimates and assumptions that can materially affect the consolidated financial statements.
Impairment losses on the Group’s nonfinancial assets amounted to nil in 2009 and 2008, and ₱203.4 million in 2007.
As of September 30, 2009 and 2008, the balances of the Group’s nonfinancial assets, net of accumulated depreciation, amortization and impairment losses follow:
2009 2008Property, plant and equipment (Note 13) ₱25,300,588,952 ₱24,327,344,376Biological assets at cost (Note 15) 175,834,549 215,072,955Intangible assets (Note 16) 1,643,995,276 1,646,762,912Investment in a joint venture (Note 17) 88,302,733 93,056,645Investment properties (Note 18) 75,405,339 79,003,584
Assets held for sale (Note 39) Property, plant and equipment 97,929,048 192,063,742 Other assets 3,018,526 5,295,219
Estimation of pension and other benefits costsThe determination of the obligation and cost of retirement and other employee benefits is dependent on the selection of certain assumptions used in calculating such amounts. Those assumptions include, among others, discount rates, expected returns on plan assets and salary increase rates (Note 32). Actual results that differ from the Group’s assumptions are accumulated and amortized over future periods and therefore, generally affect the recognized expense and recorded obligation in such future periods.
While the Group believes that the assumptions are reasonable and appropriate, significant differences between actual experiences and assumptions may materially affect the cost of employee benefits and related obligations.
The Group also estimates other employee benefits obligation and expense, including the cost of paid leaves based on historical leave availments of employees, subject to the Group’s policy. These estimates may vary depending on the future changes in salaries and actual experiences during the year.
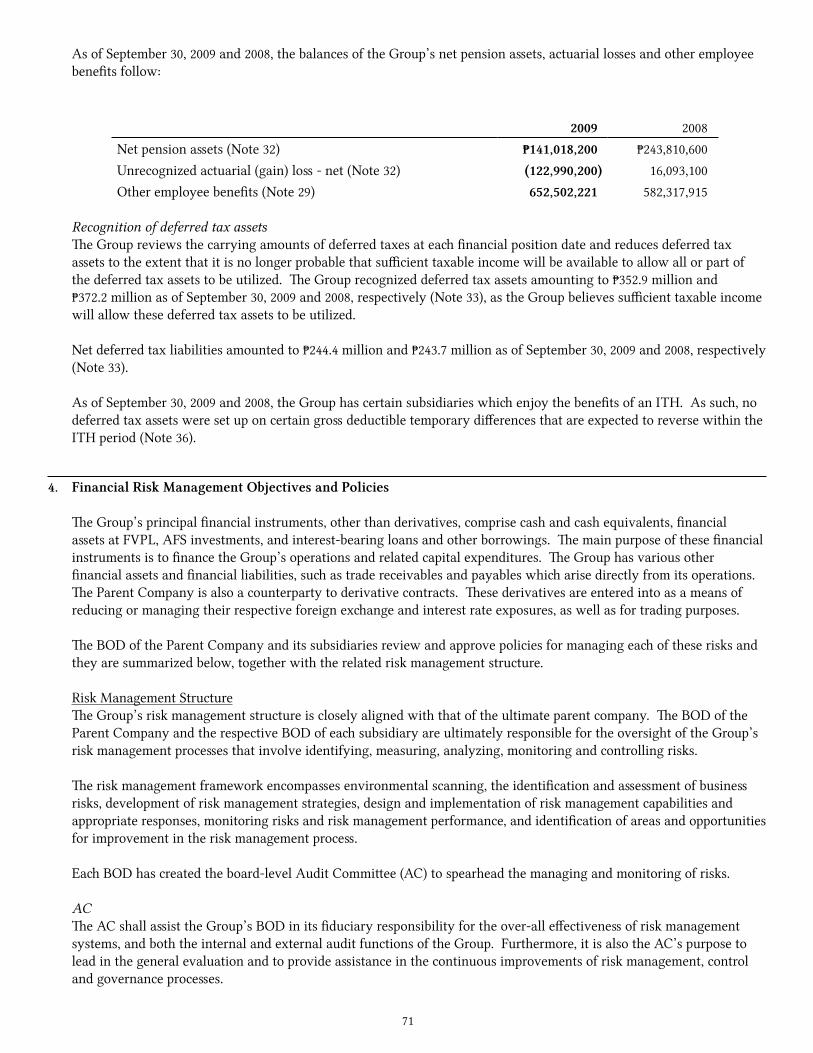
71
As of September 30, 2009 and 2008, the balances of the Group’s net pension assets, actuarial losses and other employee benefits follow:
2009 2008Net pension assets (Note 32) ₱141,018,200 ₱243,810,600Unrecognized actuarial (gain) loss - net (Note 32) (122,990,200) 16,093,100Other employee benefits (Note 29) 652,502,221 582,317,915
Recognition of deferred tax assetsThe Group reviews the carrying amounts of deferred taxes at each financial position date and reduces deferred tax assets to the extent that it is no longer probable that sufficient taxable income will be available to allow all or part of the deferred tax assets to be utilized. The Group recognized deferred tax assets amounting to ₱352.9 million and ₱372.2 million as of September 30, 2009 and 2008, respectively (Note 33), as the Group believes sufficient taxable income will allow these deferred tax assets to be utilized.
Net deferred tax liabilities amounted to ₱244.4 million and ₱243.7 million as of September 30, 2009 and 2008, respectively (Note 33).
As of September 30, 2009 and 2008, the Group has certain subsidiaries which enjoy the benefits of an ITH. As such, no deferred tax assets were set up on certain gross deductible temporary differences that are expected to reverse within the ITH period (Note 36).
4. Financial Risk Management Objectives and Policies
The Group’s principal financial instruments, other than derivatives, comprise cash and cash equivalents, financial assets at FVPL, AFS investments, and interest-bearing loans and other borrowings. The main purpose of these financial instruments is to finance the Group’s operations and related capital expenditures. The Group has various other financial assets and financial liabilities, such as trade receivables and payables which arise directly from its operations. The Parent Company is also a counterparty to derivative contracts. These derivatives are entered into as a means of reducing or managing their respective foreign exchange and interest rate exposures, as well as for trading purposes.
The BOD of the Parent Company and its subsidiaries review and approve policies for managing each of these risks and they are summarized below, together with the related risk management structure.
Risk Management StructureThe Group’s risk management structure is closely aligned with that of the ultimate parent company. The BOD of the Parent Company and the respective BOD of each subsidiary are ultimately responsible for the oversight of the Group’s risk management processes that involve identifying, measuring, analyzing, monitoring and controlling risks.
The risk management framework encompasses environmental scanning, the identification and assessment of business risks, development of risk management strategies, design and implementation of risk management capabilities and appropriate responses, monitoring risks and risk management performance, and identification of areas and opportunities for improvement in the risk management process.
Each BOD has created the board-level Audit Committee (AC) to spearhead the managing and monitoring of risks.
ACThe AC shall assist the Group’s BOD in its fiduciary responsibility for the over-all effectiveness of risk management systems, and both the internal and external audit functions of the Group. Furthermore, it is also the AC’s purpose to lead in the general evaluation and to provide assistance in the continuous improvements of risk management, control and governance processes.
72
The AC also aims to ensure that:
a. financial reports comply with established internal policies and procedures, pertinent accounting and auditing standards and other regulatory requirements;
b. risks are properly identified, evaluated and managed, specifically in the areas of managing credit, market, liquidity, operational, legal and other risks, and crisis management;
c. audit activities of internal and external auditors are done based on plan, and deviations are explained through the performance of direct interface functions with the internal and external auditors; and
d. the Group’s BOD is properly assisted in the development of policies that would enhance the risk management and control systems.
Enterprise Risk Management Group (ERMG)The ERMG was created to be primarily responsible for the execution of the enterprise risk management framework. The ERMG’s main concerns include:
a. recommending risk policies, strategies, principles, framework and limits;b. managing fundamental risk issues and monitoring of relevant risk decisions;c. providing support to management in implementing the risk policies and strategies; andd. developing a risk awareness program.
Compliance with the principles of good corporate governance is also one (1) of the primary objectives of the BOD. To assist the BOD in achieving this purpose, the BOD has designated a Compliance Officer who shall be responsible for monitoring the actual compliance with the provisions and requirements of the Corporate Governance Manual and other requirements on good corporate governance, identifying and monitoring control compliance risks, determining violations, and recommending penalties on such infringements for further review and approval of the BOD, among others.
Risk Management PoliciesThe main risks arising from the use of financial instruments are credit risk, liquidity risk, foreign currency risk, equity price risk and interest rate risk. The Group’s policies for managing the aforementioned risks are summarized below.
Credit riskThe Group trades only with recognized and creditworthy third parties. It is the Group’s policy that all customers who wish to trade on credit terms are subject to credit verification procedures. The Credit and Collection Department of the Group continuously provides credit notification and implements various credit actions, depending on assessed risks, to minimize credit exposure. Receivable balances of trade customers are being monitored on a regular basis and appropriate credit treatments are executed for overdue accounts. Likewise, other receivable balances are also being monitored and subjected to appropriate actions to manage credit risk.
With respect to credit risk arising from the other financial assets of the Group, which comprise cash and cash equivalents, financial assets at FVPL, AFS investments and certain derivative investments, the Group’s exposure to credit risk arises from default of the counterparty with a maximum exposure equal to the carrying amount of these instruments. The Group has a counterparty credit risk management policy which allocates investment limits based on counterparty credit ratings and credit risk profile.
The Group is not exposed to significant concentrations of credit risk.
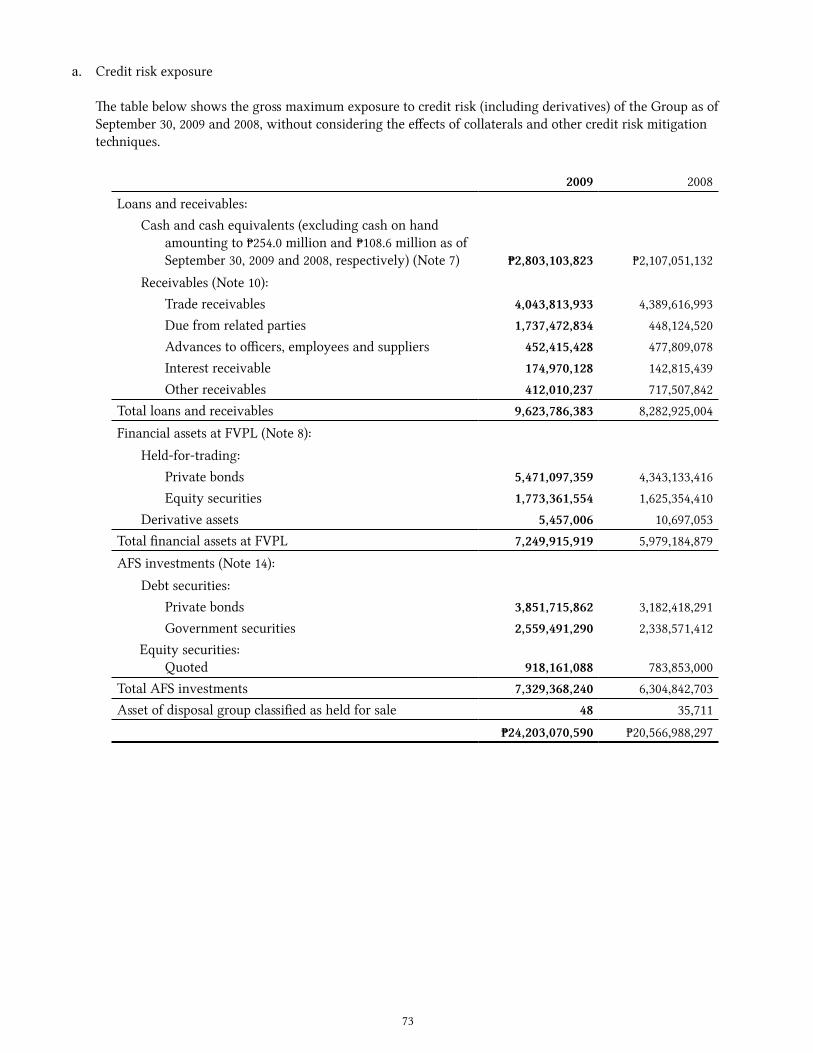
73
a. Credit risk exposure
The table below shows the gross maximum exposure to credit risk (including derivatives) of the Group as of September 30, 2009 and 2008, without considering the effects of collaterals and other credit risk mitigation techniques.
2009 2008
Loans and receivables:Cash and cash equivalents (excluding cash on hand
amounting to ₱254.0 million and ₱108.6 million as of September 30, 2009 and 2008, respectively) (Note 7) ₱2,803,103,823 ₱2,107,051,132
Receivables (Note 10): Trade receivables 4,043,813,933 4,389,616,993 Due from related parties 1,737,472,834 448,124,520 Advances to officers, employees and suppliers 452,415,428 477,809,078 Interest receivable 174,970,128 142,815,439 Other receivables 412,010,237 717,507,842Total loans and receivables 9,623,786,383 8,282,925,004
Financial assets at FVPL (Note 8):
Held-for-trading: Private bonds 5,471,097,359 4,343,133,416 Equity securities 1,773,361,554 1,625,354,410 Derivative assets 5,457,006 10,697,053Total financial assets at FVPL 7,249,915,919 5,979,184,879
AFS investments (Note 14):
Debt securities:Private bonds 3,851,715,862 3,182,418,291Government securities 2,559,491,290 2,338,571,412
Equity securities: Quoted 918,161,088 783,853,000
Total AFS investments 7,329,368,240 6,304,842,703Asset of disposal group classified as held for sale 48 35,711
₱24,203,070,590 ₱20,566,988,297
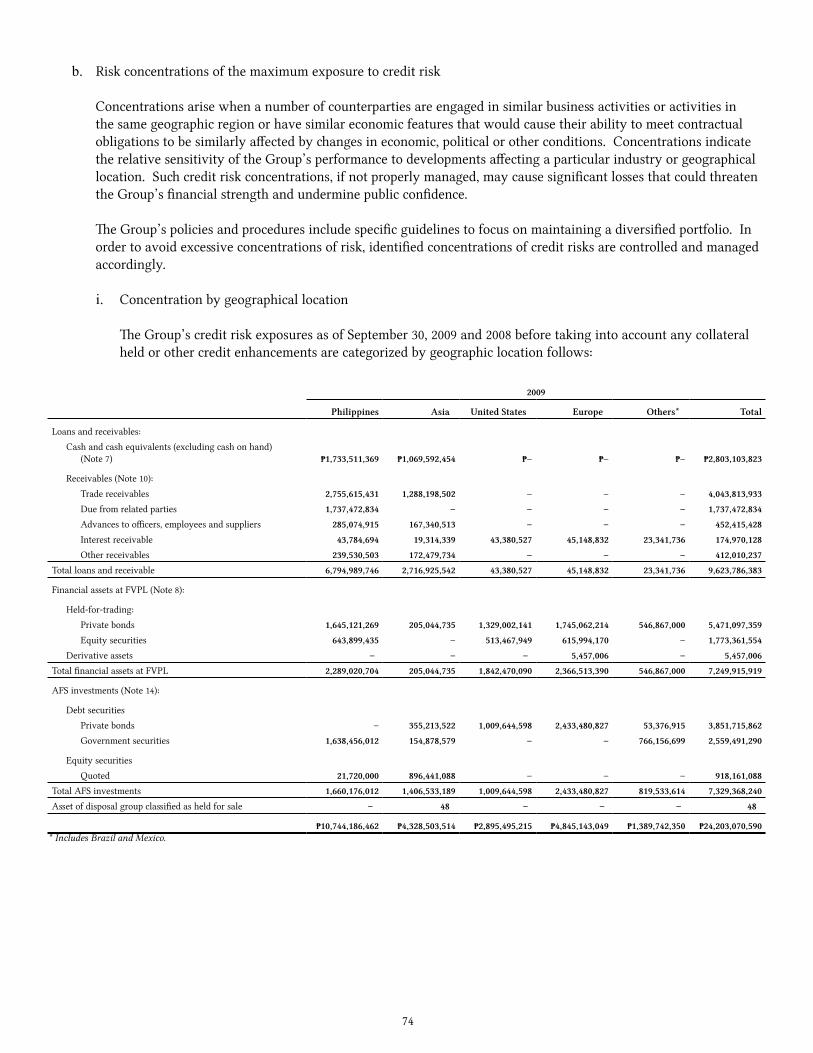
74
b. Risk concentrations of the maximum exposure to credit risk
Concentrations arise when a number of counterparties are engaged in similar business activities or activities in the same geographic region or have similar economic features that would cause their ability to meet contractual obligations to be similarly affected by changes in economic, political or other conditions. Concentrations indicate the relative sensitivity of the Group’s performance to developments affecting a particular industry or geographical location. Such credit risk concentrations, if not properly managed, may cause significant losses that could threaten the Group’s financial strength and undermine public confidence.
The Group’s policies and procedures include specific guidelines to focus on maintaining a diversified portfolio. In order to avoid excessive concentrations of risk, identified concentrations of credit risks are controlled and managed accordingly.
i. Concentration by geographical location
The Group’s credit risk exposures as of September 30, 2009 and 2008 before taking into account any collateral held or other credit enhancements are categorized by geographic location follows:
2009
Philippines Asia United States Europe Others* Total
Loans and receivables:
Cash and cash equivalents (excluding cash on hand) (Note 7) ₱1,733,511,369 ₱1,069,592,454 ₱– ₱– ₱– ₱2,803,103,823
Receivables (Note 10):
Trade receivables 2,755,615,431 1,288,198,502 – – – 4,043,813,933
Due from related parties 1,737,472,834 – – – – 1,737,472,834
Advances to officers, employees and suppliers 285,074,915 167,340,513 – – – 452,415,428
Interest receivable 43,784,694 19,314,339 43,380,527 45,148,832 23,341,736 174,970,128
Other receivables 239,530,503 172,479,734 – – – 412,010,237
Total loans and receivable 6,794,989,746 2,716,925,542 43,380,527 45,148,832 23,341,736 9,623,786,383
Financial assets at FVPL (Note 8):
Held-for-trading:
Private bonds 1,645,121,269 205,044,735 1,329,002,141 1,745,062,214 546,867,000 5,471,097,359
Equity securities 643,899,435 – 513,467,949 615,994,170 – 1,773,361,554
Derivative assets – – – 5,457,006 – 5,457,006
Total financial assets at FVPL 2,289,020,704 205,044,735 1,842,470,090 2,366,513,390 546,867,000 7,249,915,919
AFS investments (Note 14):
Debt securities
Private bonds – 355,213,522 1,009,644,598 2,433,480,827 53,376,915 3,851,715,862
Government securities 1,638,456,012 154,878,579 – – 766,156,699 2,559,491,290
Equity securities
Quoted 21,720,000 896,441,088 – – – 918,161,088
Total AFS investments 1,660,176,012 1,406,533,189 1,009,644,598 2,433,480,827 819,533,614 7,329,368,240
Asset of disposal group classified as held for sale – 48 – – – 48
₱10,744,186,462 ₱4,328,503,514 ₱2,895,495,215 ₱4,845,143,049 ₱1,389,742,350 ₱24,203,070,590* Includes Brazil and Mexico.
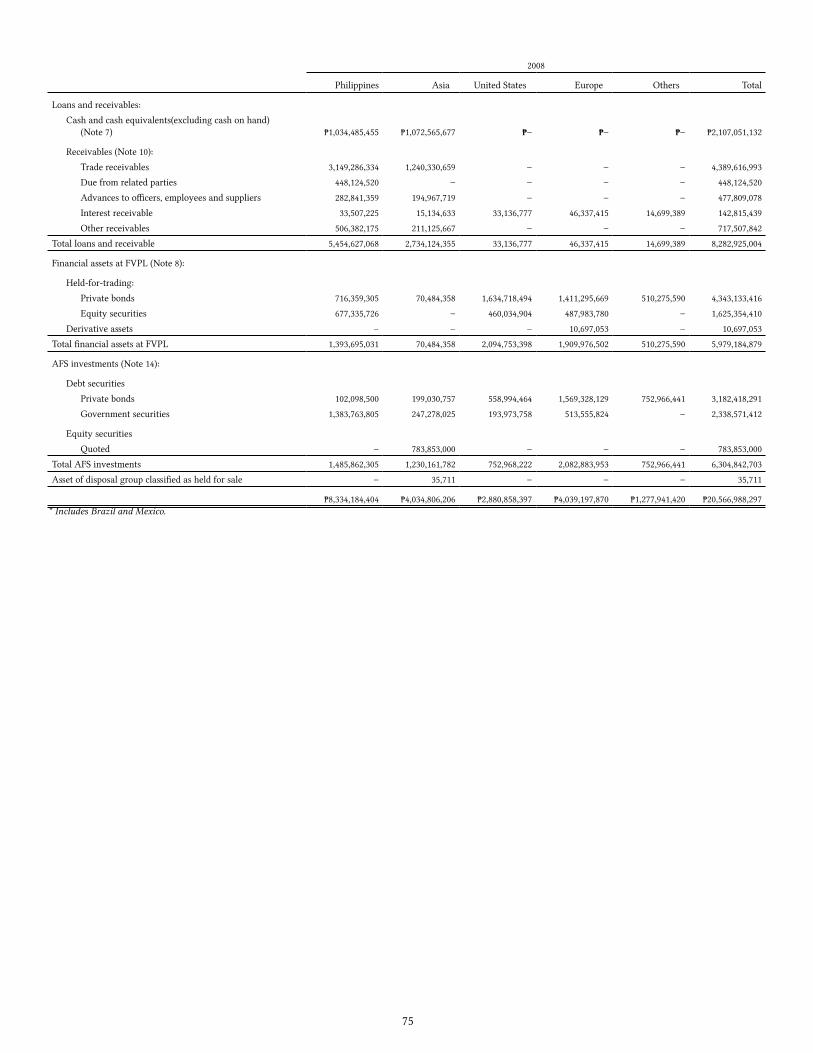
75
2008
Philippines Asia United States Europe Others Total
Loans and receivables:
Cash and cash equivalents(excluding cash on hand) (Note 7) ₱1,034,485,455 ₱1,072,565,677 ₱– ₱– ₱– ₱2,107,051,132
Receivables (Note 10):
Trade receivables 3,149,286,334 1,240,330,659 – – – 4,389,616,993
Due from related parties 448,124,520 – – – – 448,124,520
Advances to officers, employees and suppliers 282,841,359 194,967,719 – – – 477,809,078
Interest receivable 33,507,225 15,134,633 33,136,777 46,337,415 14,699,389 142,815,439
Other receivables 506,382,175 211,125,667 – – – 717,507,842
Total loans and receivable 5,454,627,068 2,734,124,355 33,136,777 46,337,415 14,699,389 8,282,925,004
Financial assets at FVPL (Note 8):
Held-for-trading:
Private bonds 716,359,305 70,484,358 1,634,718,494 1,411,295,669 510,275,590 4,343,133,416
Equity securities 677,335,726 – 460,034,904 487,983,780 – 1,625,354,410
Derivative assets – – – 10,697,053 – 10,697,053
Total financial assets at FVPL 1,393,695,031 70,484,358 2,094,753,398 1,909,976,502 510,275,590 5,979,184,879
AFS investments (Note 14):
Debt securities
Private bonds 102,098,500 199,030,757 558,994,464 1,569,328,129 752,966,441 3,182,418,291
Government securities 1,383,763,805 247,278,025 193,973,758 513,555,824 – 2,338,571,412
Equity securities
Quoted – 783,853,000 – – – 783,853,000
Total AFS investments 1,485,862,305 1,230,161,782 752,968,222 2,082,883,953 752,966,441 6,304,842,703
Asset of disposal group classified as held for sale – 35,711 – – – 35,711
₱8,334,184,404 ₱4,034,806,206 ₱2,880,858,397 ₱4,039,197,870 ₱1,277,941,420 ₱20,566,988,297* Includes Brazil and Mexico.
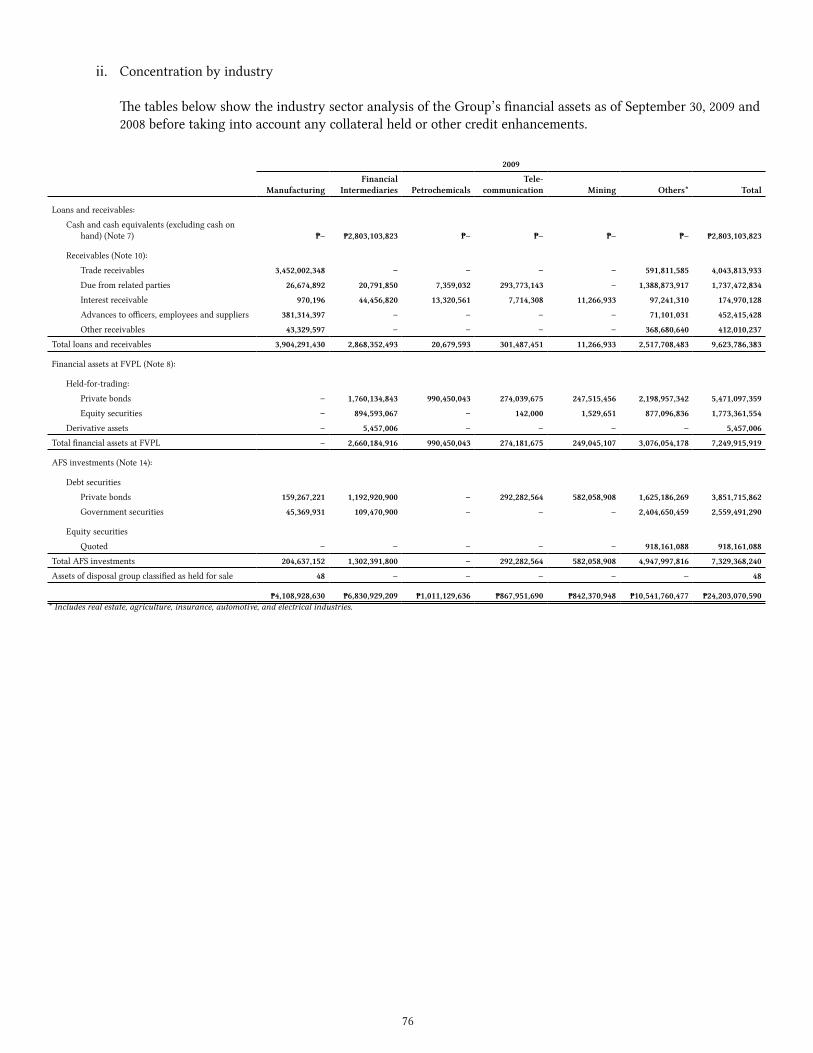
76
ii. Concentration by industry
The tables below show the industry sector analysis of the Group’s financial assets as of September 30, 2009 and 2008 before taking into account any collateral held or other credit enhancements.
2009
ManufacturingFinancial
Intermediaries PetrochemicalsTele-
communication Mining Others* Total
Loans and receivables:
Cash and cash equivalents (excluding cash on hand) (Note 7) ₱– ₱2,803,103,823 ₱– ₱– ₱– ₱– ₱2,803,103,823
Receivables (Note 10):
Trade receivables 3,452,002,348 – – – – 591,811,585 4,043,813,933
Due from related parties 26,674,892 20,791,850 7,359,032 293,773,143 – 1,388,873,917 1,737,472,834
Interest receivable 970,196 44,456,820 13,320,561 7,714,308 11,266,933 97,241,310 174,970,128
Advances to officers, employees and suppliers 381,314,397 – – – – 71,101,031 452,415,428
Other receivables 43,329,597 – – – – 368,680,640 412,010,237
Total loans and receivables 3,904,291,430 2,868,352,493 20,679,593 301,487,451 11,266,933 2,517,708,483 9,623,786,383
Financial assets at FVPL (Note 8):
Held-for-trading:
Private bonds – 1,760,134,843 990,450,043 274,039,675 247,515,456 2,198,957,342 5,471,097,359
Equity securities – 894,593,067 – 142,000 1,529,651 877,096,836 1,773,361,554
Derivative assets – 5,457,006 – – – – 5,457,006
Total financial assets at FVPL – 2,660,184,916 990,450,043 274,181,675 249,045,107 3,076,054,178 7,249,915,919
AFS investments (Note 14):
Debt securities
Private bonds 159,267,221 1,192,920,900 – 292,282,564 582,058,908 1,625,186,269 3,851,715,862
Government securities 45,369,931 109,470,900 – – – 2,404,650,459 2,559,491,290
Equity securities
Quoted – – – – – 918,161,088 918,161,088
Total AFS investments 204,637,152 1,302,391,800 – 292,282,564 582,058,908 4,947,997,816 7,329,368,240
Assets of disposal group classified as held for sale 48 – – – – – 48
₱4,108,928,630 ₱6,830,929,209 ₱1,011,129,636 ₱867,951,690 ₱842,370,948 ₱10,541,760,477 ₱24,203,070,590* Includes real estate, agriculture, insurance, automotive, and electrical industries.
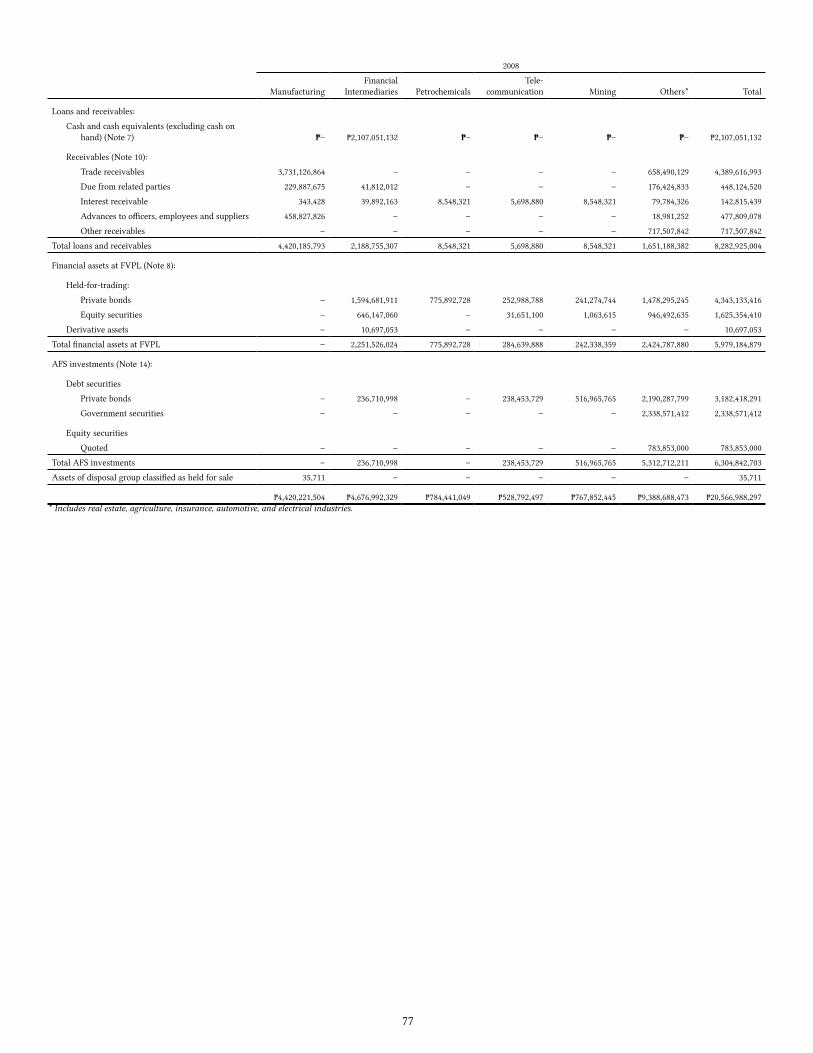
77
2008
ManufacturingFinancial
Intermediaries PetrochemicalsTele-
communication Mining Others* Total
Loans and receivables:
Cash and cash equivalents (excluding cash on hand) (Note 7) ₱– ₱2,107,051,132 ₱– ₱– ₱– ₱– ₱2,107,051,132
Receivables (Note 10):
Trade receivables 3,731,126,864 – – – – 658,490,129 4,389,616,993
Due from related parties 229,887,675 41,812,012 – – – 176,424,833 448,124,520
Interest receivable 343,428 39,892,163 8,548,321 5,698,880 8,548,321 79,784,326 142,815,439
Advances to officers, employees and suppliers 458,827,826 – – – – 18,981,252 477,809,078
Other receivables – – – – – 717,507,842 717,507,842
Total loans and receivables 4,420,185,793 2,188,755,307 8,548,321 5,698,880 8,548,321 1,651,188,382 8,282,925,004
Financial assets at FVPL (Note 8):
Held-for-trading:
Private bonds – 1,594,681,911 775,892,728 252,988,788 241,274,744 1,478,295,245 4,343,133,416
Equity securities – 646,147,060 – 31,651,100 1,063,615 946,492,635 1,625,354,410
Derivative assets – 10,697,053 – – – – 10,697,053
Total financial assets at FVPL – 2,251,526,024 775,892,728 284,639,888 242,338,359 2,424,787,880 5,979,184,879
AFS investments (Note 14):
Debt securities
Private bonds – 236,710,998 – 238,453,729 516,965,765 2,190,287,799 3,182,418,291
Government securities – – – – – 2,338,571,412 2,338,571,412
Equity securities
Quoted – – – – – 783,853,000 783,853,000
Total AFS investments – 236,710,998 – 238,453,729 516,965,765 5,312,712,211 6,304,842,703
Assets of disposal group classified as held for sale 35,711 – – – – – 35,711
₱4,420,221,504 ₱4,676,992,329 ₱784,441,049 ₱528,792,497 ₱767,852,445 ₱9,388,688,473 ₱20,566,988,297* Includes real estate, agriculture, insurance, automotive, and electrical industries.
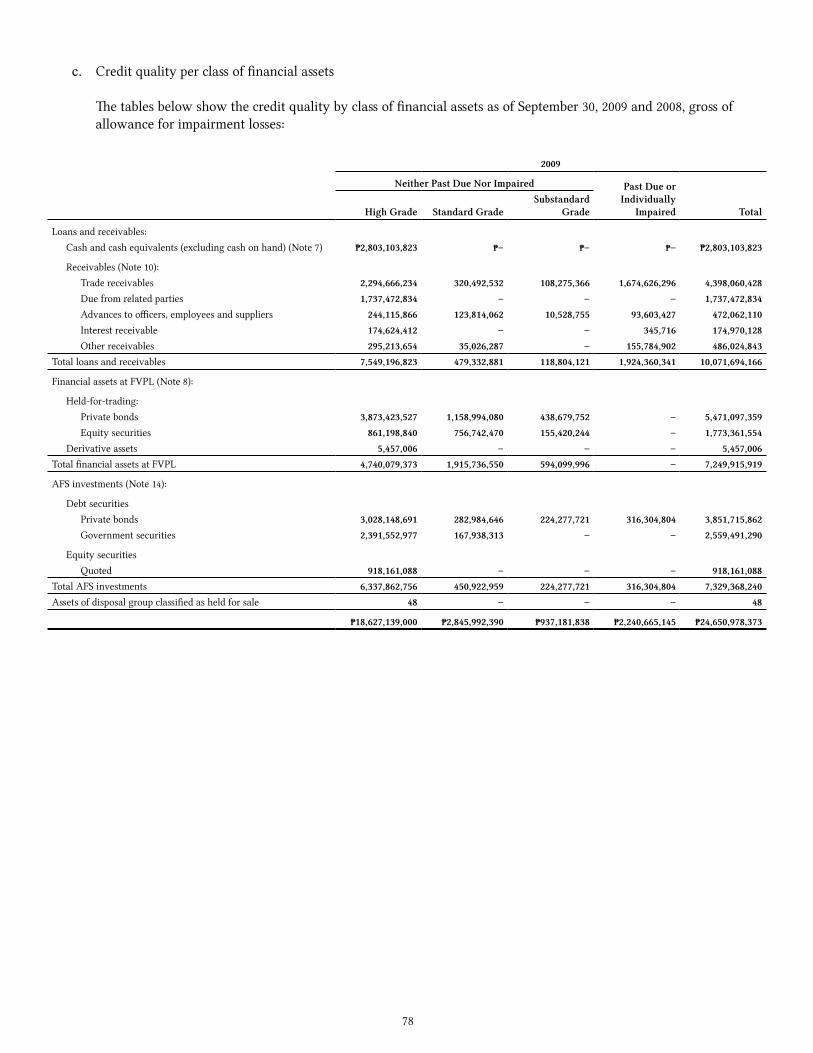
78
c. Credit quality per class of financial assets
The tables below show the credit quality by class of financial assets as of September 30, 2009 and 2008, gross of allowance for impairment losses:
2009
Neither Past Due Nor Impaired Past Due orIndividually
ImpairedHigh Grade Standard GradeSubstandard
Grade Total
Loans and receivables: Cash and cash equivalents (excluding cash on hand) (Note 7) ₱2,803,103,823 ₱– ₱– ₱– ₱2,803,103,823
Receivables (Note 10): Trade receivables 2,294,666,234 320,492,532 108,275,366 1,674,626,296 4,398,060,428 Due from related parties 1,737,472,834 – – – 1,737,472,834 Advances to officers, employees and suppliers 244,115,866 123,814,062 10,528,755 93,603,427 472,062,110 Interest receivable 174,624,412 – – 345,716 174,970,128 Other receivables 295,213,654 35,026,287 – 155,784,902 486,024,843Total loans and receivables 7,549,196,823 479,332,881 118,804,121 1,924,360,341 10,071,694,166
Financial assets at FVPL (Note 8):
Held-for-trading: Private bonds 3,873,423,527 1,158,994,080 438,679,752 – 5,471,097,359 Equity securities 861,198,840 756,742,470 155,420,244 – 1,773,361,554 Derivative assets 5,457,006 – – – 5,457,006Total financial assets at FVPL 4,740,079,373 1,915,736,550 594,099,996 – 7,249,915,919
AFS investments (Note 14):
Debt securities Private bonds 3,028,148,691 282,984,646 224,277,721 316,304,804 3,851,715,862 Government securities 2,391,552,977 167,938,313 – – 2,559,491,290
Equity securities Quoted 918,161,088 – – – 918,161,088Total AFS investments 6,337,862,756 450,922,959 224,277,721 316,304,804 7,329,368,240Assets of disposal group classified as held for sale 48 – – – 48
₱18,627,139,000 ₱2,845,992,390 ₱937,181,838 ₱2,240,665,145 ₱24,650,978,373
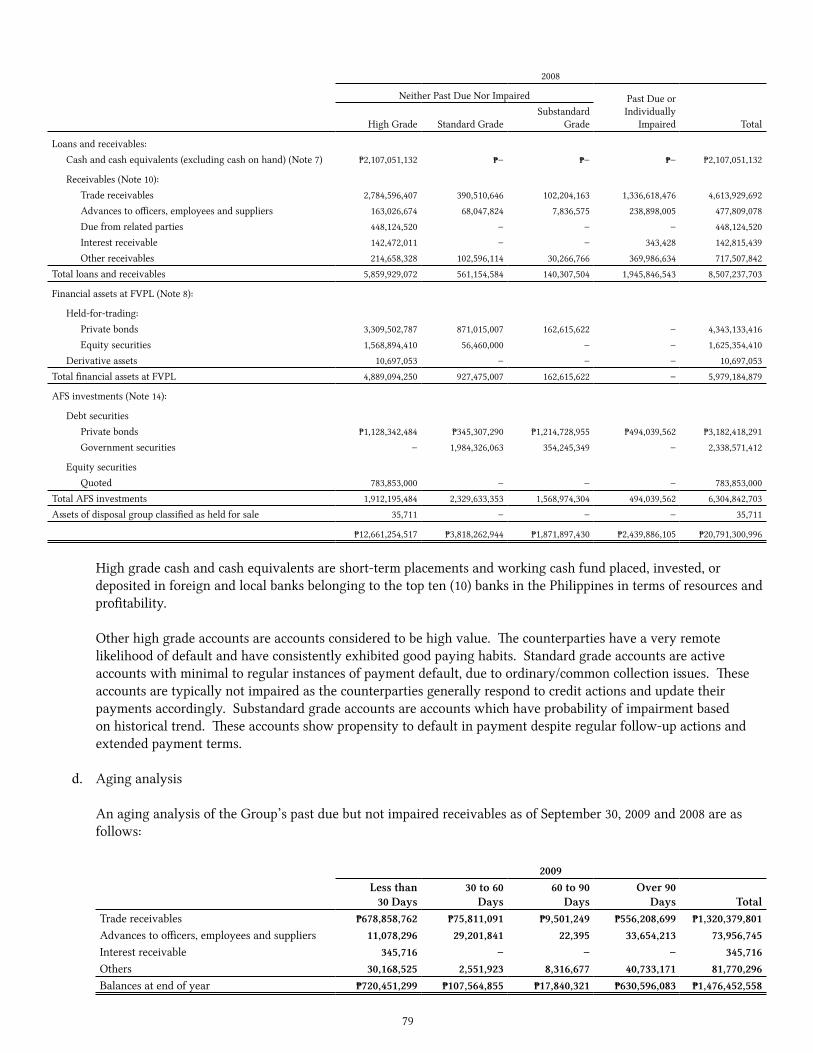
79
2008
Neither Past Due Nor Impaired Past Due orIndividually
ImpairedHigh Grade Standard GradeSubstandard
Grade Total
Loans and receivables: Cash and cash equivalents (excluding cash on hand) (Note 7) ₱2,107,051,132 ₱– ₱– ₱– ₱2,107,051,132
Receivables (Note 10): Trade receivables 2,784,596,407 390,510,646 102,204,163 1,336,618,476 4,613,929,692 Advances to officers, employees and suppliers 163,026,674 68,047,824 7,836,575 238,898,005 477,809,078 Due from related parties 448,124,520 – – – 448,124,520 Interest receivable 142,472,011 – – 343,428 142,815,439 Other receivables 214,658,328 102,596,114 30,266,766 369,986,634 717,507,842Total loans and receivables 5,859,929,072 561,154,584 140,307,504 1,945,846,543 8,507,237,703
Financial assets at FVPL (Note 8):
Held-for-trading: Private bonds 3,309,502,787 871,015,007 162,615,622 – 4,343,133,416 Equity securities 1,568,894,410 56,460,000 – – 1,625,354,410 Derivative assets 10,697,053 – – – 10,697,053Total financial assets at FVPL 4,889,094,250 927,475,007 162,615,622 – 5,979,184,879
AFS investments (Note 14):
Debt securities Private bonds ₱1,128,342,484 ₱345,307,290 ₱1,214,728,955 ₱494,039,562 ₱3,182,418,291 Government securities – 1,984,326,063 354,245,349 – 2,338,571,412
Equity securities Quoted 783,853,000 – – – 783,853,000Total AFS investments 1,912,195,484 2,329,633,353 1,568,974,304 494,039,562 6,304,842,703Assets of disposal group classified as held for sale 35,711 – – – 35,711
₱12,661,254,517 ₱3,818,262,944 ₱1,871,897,430 ₱2,439,886,105 ₱20,791,300,996
High grade cash and cash equivalents are short-term placements and working cash fund placed, invested, or deposited in foreign and local banks belonging to the top ten (10) banks in the Philippines in terms of resources and profitability.
Other high grade accounts are accounts considered to be high value. The counterparties have a very remote likelihood of default and have consistently exhibited good paying habits. Standard grade accounts are active accounts with minimal to regular instances of payment default, due to ordinary/common collection issues. These accounts are typically not impaired as the counterparties generally respond to credit actions and update their payments accordingly. Substandard grade accounts are accounts which have probability of impairment based on historical trend. These accounts show propensity to default in payment despite regular follow-up actions and extended payment terms.
d. Aging analysis
An aging analysis of the Group’s past due but not impaired receivables as of September 30, 2009 and 2008 are as follows:
2009Less than
30 Days30 to 60
Days60 to 90
DaysOver 90
Days TotalTrade receivables ₱678,858,762 ₱75,811,091 ₱9,501,249 ₱556,208,699 ₱1,320,379,801Advances to officers, employees and suppliers 11,078,296 29,201,841 22,395 33,654,213 73,956,745Interest receivable 345,716 – – – 345,716Others 30,168,525 2,551,923 8,316,677 40,733,171 81,770,296Balances at end of year ₱720,451,299 ₱107,564,855 ₱17,840,321 ₱630,596,083 ₱1,476,452,558
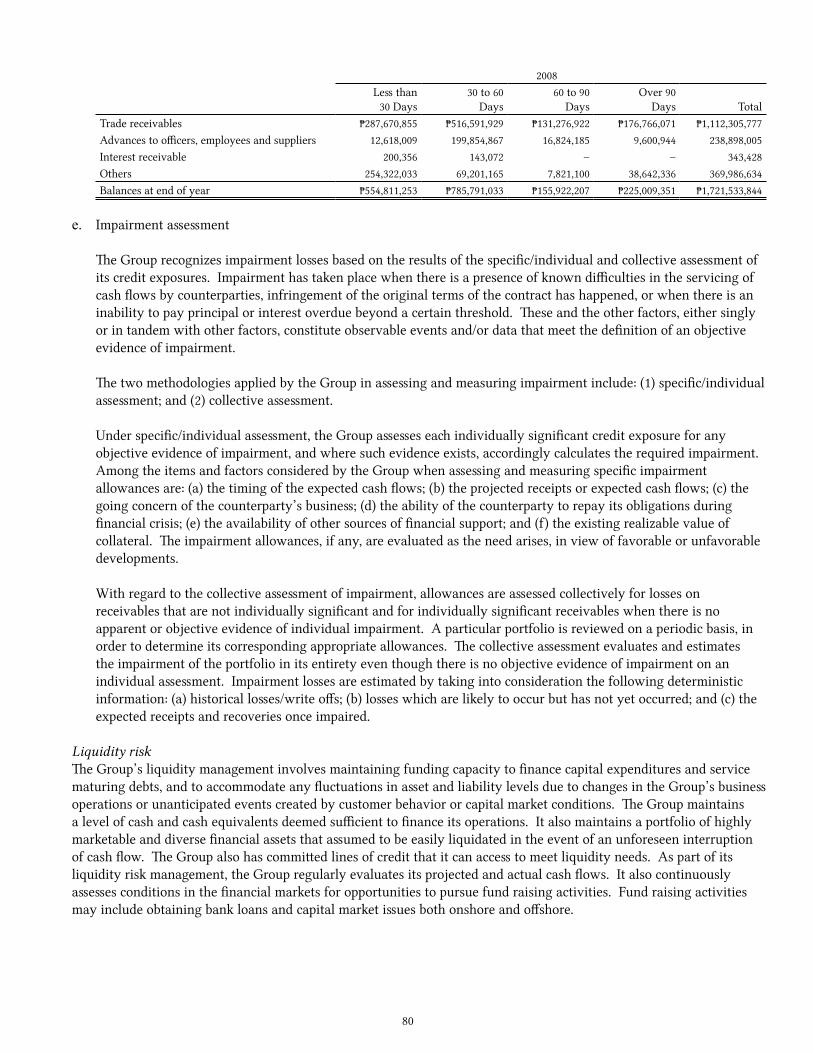
80
2008Less than
30 Days30 to 60
Days60 to 90
DaysOver 90
Days TotalTrade receivables ₱287,670,855 ₱516,591,929 ₱131,276,922 ₱176,766,071 ₱1,112,305,777Advances to officers, employees and suppliers 12,618,009 199,854,867 16,824,185 9,600,944 238,898,005Interest receivable 200,356 143,072 – – 343,428Others 254,322,033 69,201,165 7,821,100 38,642,336 369,986,634Balances at end of year ₱554,811,253 ₱785,791,033 ₱155,922,207 ₱225,009,351 ₱1,721,533,844
e. Impairment assessment
The Group recognizes impairment losses based on the results of the specific/individual and collective assessment of its credit exposures. Impairment has taken place when there is a presence of known difficulties in the servicing of cash flows by counterparties, infringement of the original terms of the contract has happened, or when there is an inability to pay principal or interest overdue beyond a certain threshold. These and the other factors, either singly or in tandem with other factors, constitute observable events and/or data that meet the definition of an objective evidence of impairment.
The two methodologies applied by the Group in assessing and measuring impairment include: (1) specific/individual assessment; and (2) collective assessment.
Under specific/individual assessment, the Group assesses each individually significant credit exposure for any objective evidence of impairment, and where such evidence exists, accordingly calculates the required impairment. Among the items and factors considered by the Group when assessing and measuring specific impairment allowances are: (a) the timing of the expected cash flows; (b) the projected receipts or expected cash flows; (c) the going concern of the counterparty’s business; (d) the ability of the counterparty to repay its obligations during financial crisis; (e) the availability of other sources of financial support; and (f) the existing realizable value of collateral. The impairment allowances, if any, are evaluated as the need arises, in view of favorable or unfavorable developments.
With regard to the collective assessment of impairment, allowances are assessed collectively for losses on receivables that are not individually significant and for individually significant receivables when there is no apparent or objective evidence of individual impairment. A particular portfolio is reviewed on a periodic basis, in order to determine its corresponding appropriate allowances. The collective assessment evaluates and estimates the impairment of the portfolio in its entirety even though there is no objective evidence of impairment on an individual assessment. Impairment losses are estimated by taking into consideration the following deterministic information: (a) historical losses/write offs; (b) losses which are likely to occur but has not yet occurred; and (c) the expected receipts and recoveries once impaired.
Liquidity riskThe Group’s liquidity management involves maintaining funding capacity to finance capital expenditures and service maturing debts, and to accommodate any fluctuations in asset and liability levels due to changes in the Group’s business operations or unanticipated events created by customer behavior or capital market conditions. The Group maintains a level of cash and cash equivalents deemed sufficient to finance its operations. It also maintains a portfolio of highly marketable and diverse financial assets that assumed to be easily liquidated in the event of an unforeseen interruption of cash flow. The Group also has committed lines of credit that it can access to meet liquidity needs. As part of its liquidity risk management, the Group regularly evaluates its projected and actual cash flows. It also continuously assesses conditions in the financial markets for opportunities to pursue fund raising activities. Fund raising activities may include obtaining bank loans and capital market issues both onshore and offshore.

81
Maturity Profile of Financial Assets and Liabilities The tables below summarize the maturity profile of the Group’s financial assets and liabilities as of September 30, 2009 and 2008 based on undiscounted contractual cash flows.
2009
On Demand1 to 3
Months3 to 12
Months1 to 5 Years Total
Financial Assets
Loans and receivables Cash and cash equivalents ₱945,126,670 ₱1,895,718,048 ₱– ₱– ₱2,840,844,718
Receivables: Trade receivables 501,321,134 2,645,610,138 896,882,661 – 4,043,813,933 Due from related parties 1,737,472,834 – – – 1,737,472,834 Advances to officers, employees and suppliers 3,601,630 247,902,546 200,911,252 – 452,415,428 Interest receivable 956,408 1,207,507 172,806,213 – 174,970,128 Other receivables 69,005,906 153,273,105 189,731,226 – 412,010,237Total Receivables 3,257,484,582 4,943,711,344 1,460,331,352 – 9,661,527,278
Financial assets at FVPL:
Held-for-trading: Private bonds – – 5,901,461,666 – 5,901,461,666 Equity securities – – 1,773,361,554 – 1,773,361,554 Derivative assets – – 5,457,006 – 5,457,006
– – 7,680,280,226 – 7,680,280,226
AFS investments:
Debt securities: Government – – – 4,053,636,251 4,053,636,251 Private – – – 2,803,663,523 2,803,663,523
Equity securities: Quoted – – – 918,161,088 918,161,088
– – – 7,775,460,862 7,775,460,862Assets of disposal group classified as held for sale 48 – – – 48
₱3,257,484,630 ₱4,943,711,344 ₱9,140,611,578 ₱7,775,460,862 ₱25,117,268,414
Financial Liabilities
Financial liabilities at amortized cost:
Accounts payable and other accrued liabilities Trade payable and accrued expenses ₱2,283,157,863 ₱2,825,335,550 ₱501,610,091 ₱– ₱5,610,103,504 Due to related parties 289,294,279 – – – 289,294,279 Short-term debt – 5,244,148,055 – – 5,244,148,055 Trust receipts and acceptances payable – 480,601,544 – – 480,601,544 Long-term debt (including current portion) – 70,991,482 841,372,357 14,640,611,580 15,552,975,419Total financial liabilities at amortized cost 2,572,452,142 8,621,076,631 1,342,982,448 14,640,611,580 27,177,122,801
Financial liabilities at FVPL: Derivative liabilities – – 20,085,920 – 20,085,920Liabilities of disposal group classified as held for sale 842,831 – – – 842,831
₱2,573,294,973 ₱8,621,076,631 ₱1,363,068,368 ₱14,640,611,580 ₱27,198,051,552
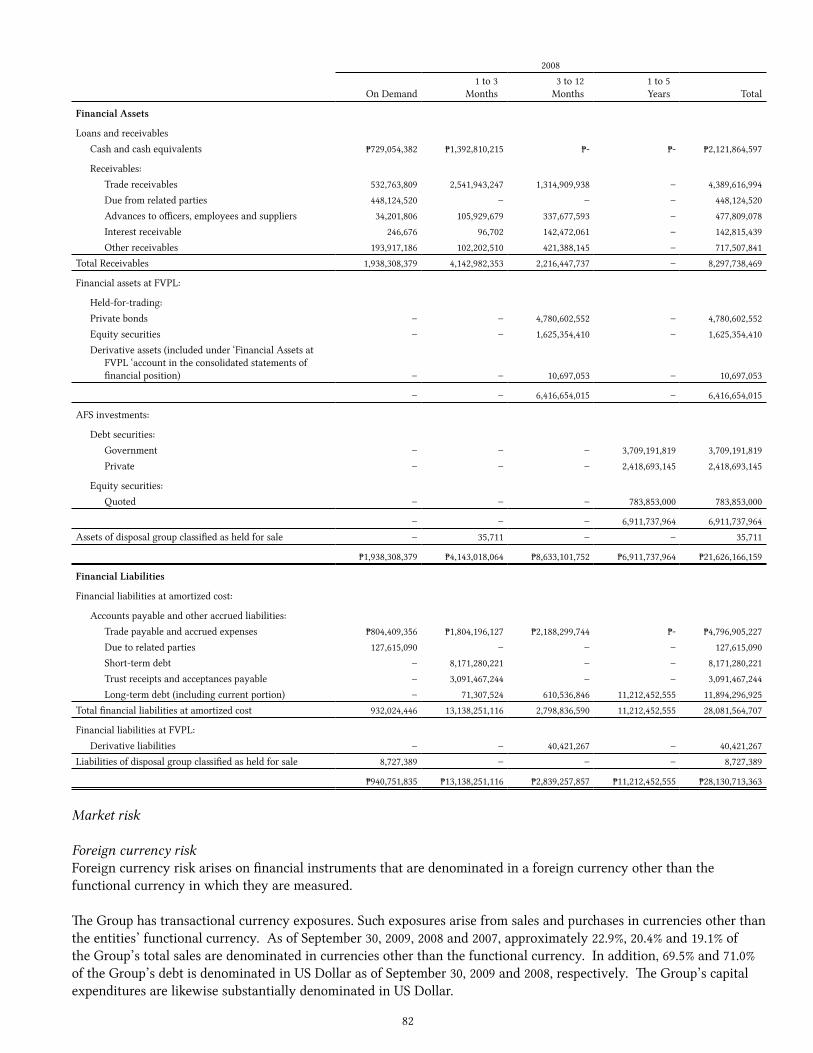
82
2008
On Demand1 to 3
Months3 to 12
Months1 to 5 Years Total
Financial Assets
Loans and receivables Cash and cash equivalents ₱729,054,382 ₱1,392,810,215 ₱- ₱- ₱2,121,864,597
Receivables: Trade receivables 532,763,809 2,541,943,247 1,314,909,938 – 4,389,616,994 Due from related parties 448,124,520 – – – 448,124,520 Advances to officers, employees and suppliers 34,201,806 105,929,679 337,677,593 – 477,809,078 Interest receivable 246,676 96,702 142,472,061 – 142,815,439 Other receivables 193,917,186 102,202,510 421,388,145 – 717,507,841Total Receivables 1,938,308,379 4,142,982,353 2,216,447,737 – 8,297,738,469
Financial assets at FVPL:
Held-for-trading: Private bonds – – 4,780,602,552 – 4,780,602,552 Equity securities – – 1,625,354,410 – 1,625,354,410 Derivative assets (included under ‘Financial Assets at
FVPL ‘account in the consolidated statements of financial position) – – 10,697,053 – 10,697,053
– – 6,416,654,015 – 6,416,654,015
AFS investments:
Debt securities: Government – – – 3,709,191,819 3,709,191,819 Private – – – 2,418,693,145 2,418,693,145
Equity securities: Quoted – – – 783,853,000 783,853,000
– – – 6,911,737,964 6,911,737,964Assets of disposal group classified as held for sale – 35,711 – – 35,711
₱1,938,308,379 ₱4,143,018,064 ₱8,633,101,752 ₱6,911,737,964 ₱21,626,166,159
Financial Liabilities
Financial liabilities at amortized cost:
Accounts payable and other accrued liabilities: Trade payable and accrued expenses ₱804,409,356 ₱1,804,196,127 ₱2,188,299,744 ₱- ₱4,796,905,227 Due to related parties 127,615,090 – – – 127,615,090 Short-term debt – 8,171,280,221 – – 8,171,280,221 Trust receipts and acceptances payable – 3,091,467,244 – – 3,091,467,244 Long-term debt (including current portion) – 71,307,524 610,536,846 11,212,452,555 11,894,296,925Total financial liabilities at amortized cost 932,024,446 13,138,251,116 2,798,836,590 11,212,452,555 28,081,564,707
Financial liabilities at FVPL: Derivative liabilities – – 40,421,267 – 40,421,267Liabilities of disposal group classified as held for sale 8,727,389 – – – 8,727,389
₱940,751,835 ₱13,138,251,116 ₱2,839,257,857 ₱11,212,452,555 ₱28,130,713,363
Market risk
Foreign currency riskForeign currency risk arises on financial instruments that are denominated in a foreign currency other than the functional currency in which they are measured.
The Group has transactional currency exposures. Such exposures arise from sales and purchases in currencies other than the entities’ functional currency. As of September 30, 2009, 2008 and 2007, approximately 22.9%, 20.4% and 19.1% of the Group’s total sales are denominated in currencies other than the functional currency. In addition, 69.5% and 71.0% of the Group’s debt is denominated in US Dollar as of September 30, 2009 and 2008, respectively. The Group’s capital expenditures are likewise substantially denominated in US Dollar.
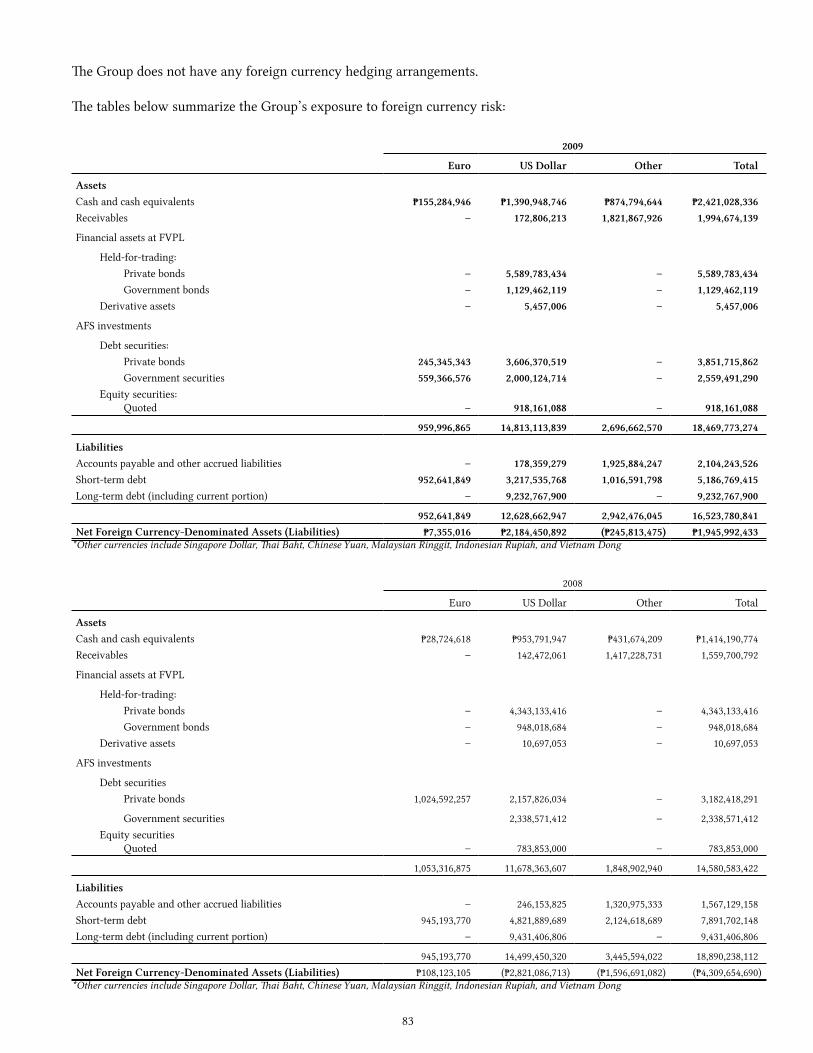
83
The Group does not have any foreign currency hedging arrangements.
The tables below summarize the Group’s exposure to foreign currency risk:
2009
Euro US Dollar Other Total
AssetsCash and cash equivalents ₱155,284,946 ₱1,390,948,746 ₱874,794,644 ₱2,421,028,336Receivables – 172,806,213 1,821,867,926 1,994,674,139
Financial assets at FVPL
Held-for-trading: Private bonds – 5,589,783,434 – 5,589,783,434 Government bonds – 1,129,462,119 – 1,129,462,119 Derivative assets – 5,457,006 – 5,457,006
AFS investments
Debt securities: Private bonds 245,345,343 3,606,370,519 – 3,851,715,862 Government securities 559,366,576 2,000,124,714 – 2,559,491,290 Equity securities: Quoted – 918,161,088 – 918,161,088
959,996,865 14,813,113,839 2,696,662,570 18,469,773,274
LiabilitiesAccounts payable and other accrued liabilities – 178,359,279 1,925,884,247 2,104,243,526Short-term debt 952,641,849 3,217,535,768 1,016,591,798 5,186,769,415Long-term debt (including current portion) – 9,232,767,900 – 9,232,767,900
952,641,849 12,628,662,947 2,942,476,045 16,523,780,841Net Foreign Currency-Denominated Assets (Liabilities) ₱7,355,016 ₱2,184,450,892 (₱245,813,475) ₱1,945,992,433
*Other currencies include Singapore Dollar, Thai Baht, Chinese Yuan, Malaysian Ringgit, Indonesian Rupiah, and Vietnam Dong
2008
Euro US Dollar Other Total
AssetsCash and cash equivalents ₱28,724,618 ₱953,791,947 ₱431,674,209 ₱1,414,190,774Receivables – 142,472,061 1,417,228,731 1,559,700,792
Financial assets at FVPL
Held-for-trading: Private bonds – 4,343,133,416 – 4,343,133,416 Government bonds – 948,018,684 – 948,018,684 Derivative assets – 10,697,053 – 10,697,053
AFS investments
Debt securities Private bonds 1,024,592,257 2,157,826,034 – 3,182,418,291
Government securities 2,338,571,412 – 2,338,571,412 Equity securities Quoted – 783,853,000 – 783,853,000
1,053,316,875 11,678,363,607 1,848,902,940 14,580,583,422
LiabilitiesAccounts payable and other accrued liabilities – 246,153,825 1,320,975,333 1,567,129,158Short-term debt 945,193,770 4,821,889,689 2,124,618,689 7,891,702,148Long-term debt (including current portion) – 9,431,406,806 – 9,431,406,806
945,193,770 14,499,450,320 3,445,594,022 18,890,238,112Net Foreign Currency-Denominated Assets (Liabilities) ₱108,123,105 (₱2,821,086,713) (₱1,596,691,082) (₱4,309,654,690)
*Other currencies include Singapore Dollar, Thai Baht, Chinese Yuan, Malaysian Ringgit, Indonesian Rupiah, and Vietnam Dong
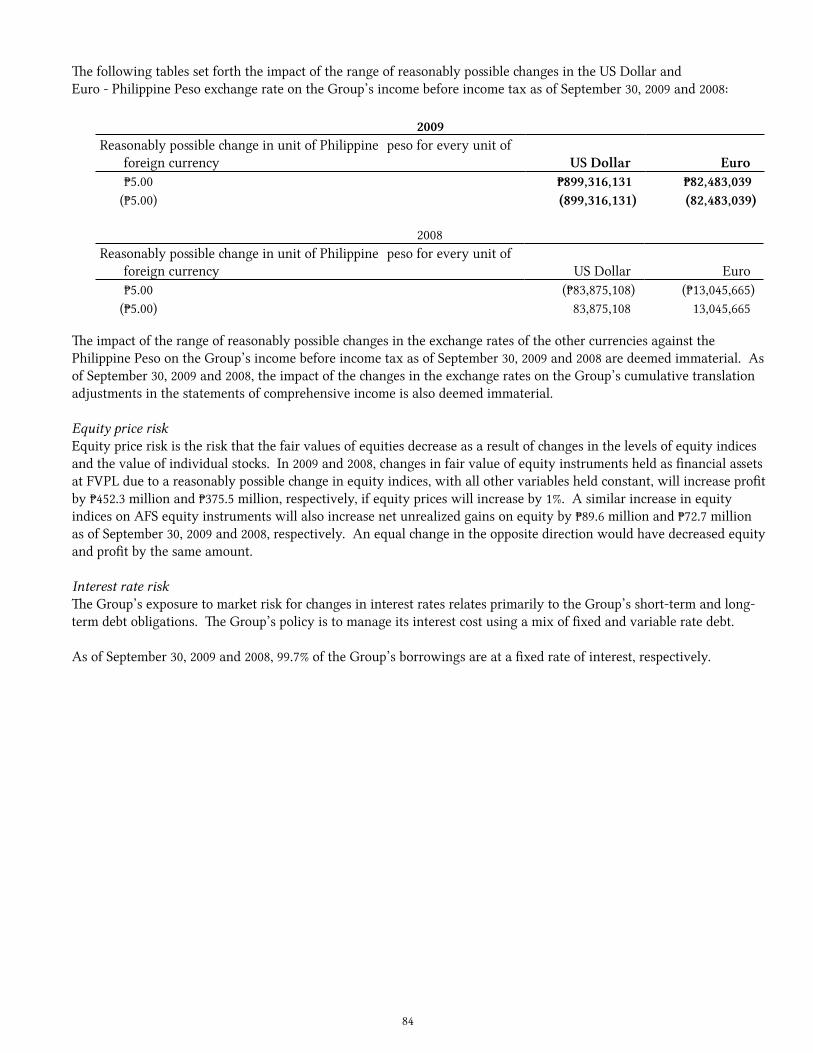
84
The following tables set forth the impact of the range of reasonably possible changes in the US Dollar and Euro - Philippine Peso exchange rate on the Group’s income before income tax as of September 30, 2009 and 2008:
2009Reasonably possible change in unit of Philippine peso for every unit of
foreign currency US Dollar Euro ₱5.00 ₱899,316,131 ₱82,483,039 (₱5.00) (899,316,131) (82,483,039)
2008Reasonably possible change in unit of Philippine peso for every unit of
foreign currency US Dollar Euro ₱5.00 (₱83,875,108) (₱13,045,665) (₱5.00) 83,875,108 13,045,665
The impact of the range of reasonably possible changes in the exchange rates of the other currencies against the Philippine Peso on the Group’s income before income tax as of September 30, 2009 and 2008 are deemed immaterial. As of September 30, 2009 and 2008, the impact of the changes in the exchange rates on the Group’s cumulative translation adjustments in the statements of comprehensive income is also deemed immaterial.
Equity price riskEquity price risk is the risk that the fair values of equities decrease as a result of changes in the levels of equity indices and the value of individual stocks. In 2009 and 2008, changes in fair value of equity instruments held as financial assets at FVPL due to a reasonably possible change in equity indices, with all other variables held constant, will increase profit by ₱452.3 million and ₱375.5 million, respectively, if equity prices will increase by 1%. A similar increase in equity indices on AFS equity instruments will also increase net unrealized gains on equity by ₱89.6 million and ₱72.7 million as of September 30, 2009 and 2008, respectively. An equal change in the opposite direction would have decreased equity and profit by the same amount.
Interest rate riskThe Group’s exposure to market risk for changes in interest rates relates primarily to the Group’s short-term and long-term debt obligations. The Group’s policy is to manage its interest cost using a mix of fixed and variable rate debt.
As of September 30, 2009 and 2008, 99.7% of the Group’s borrowings are at a fixed rate of interest, respectively.
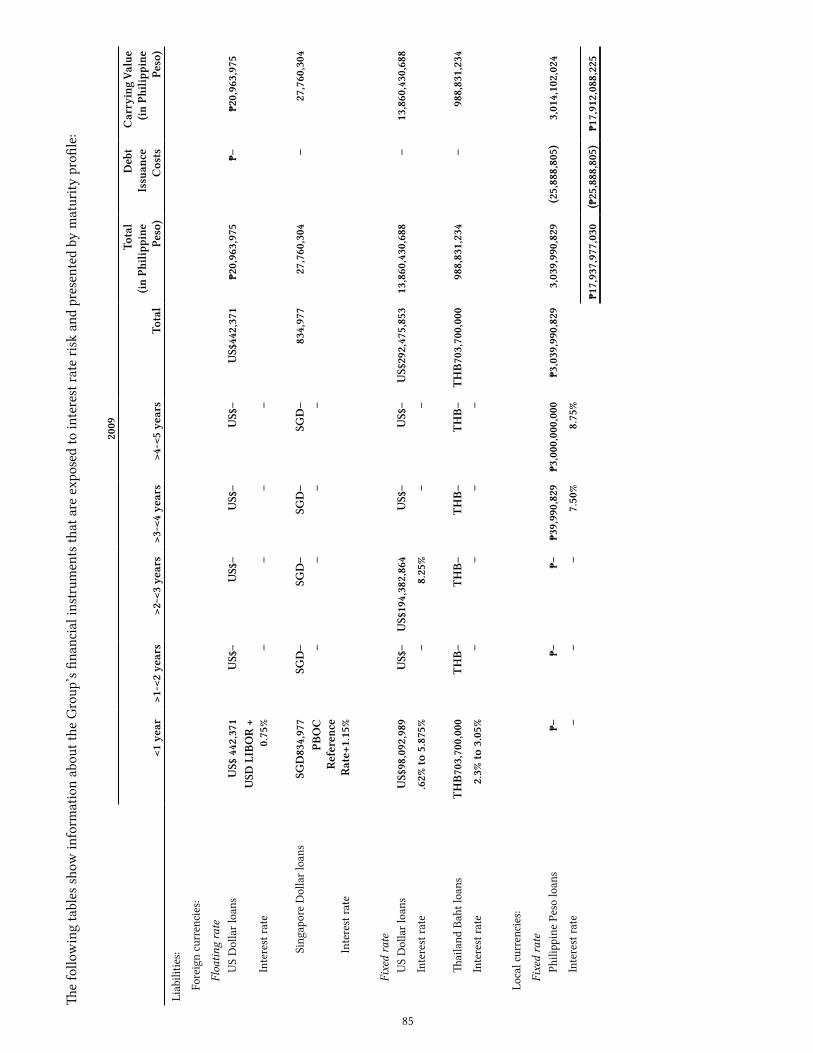
85
The
follo
win
g ta
bles
sho
w in
form
atio
n ab
out t
he G
roup
’s fi
nanc
ial i
nstr
umen
ts th
at a
re e
xpos
ed to
inte
rest
rate
risk
and
pre
sent
ed b
y m
atur
ity p
rofil
e:
2009
<1 y
ear
>1-<
2 ye
ars
>2-<
3 ye
ars
>3-<
4 ye
ars
>4-<
5 ye
ars
Tota
l
Tota
l(in
Phi
lippi
nePe
so)
Deb
tIs
suan
ceC
osts
Car
ryin
g Va
lue
(in P
hilip
pine
Pe
so)
Liab
ilitie
s:
Fo
reig
n cu
rren
cies
:
Floa
ting
rate
U
S D
olla
r loa
nsU
S$ 4
42,3
71U
S$–
US$
–U
S$–
US$
–U
S$44
2,37
1₱2
0,96
3,97
5₱–
₱20,
963,
975
In
tere
st ra
teU
SD L
IBO
R +
0.75
%–
––
–
Sing
apor
e D
olla
r loa
nsSG
D83
4,97
7SG
D–
SGD
–SG
D–
SGD
–83
4,97
727
,760
,304
–27
,760
,304
Inte
rest
rate
PBO
C
Refe
renc
e Ra
te+1
.15%
––
––
Fixe
d ra
te
US
Dol
lar l
oans
US$
98,0
92,9
89U
S$–
US$
194,
382,
864
US$
–U
S$–
US$
292,
475,
853
13,8
60,4
30,6
88–
13,8
60,4
30,6
88
In
tere
st ra
te.6
2% to
5.8
75%
–8.
25%
––
Th
aila
nd B
aht l
oans
TH
B70
3,70
0,00
0T
HB
–T
HB
–T
HB
–T
HB
–T
HB
703,
700,
000
988,
831,
234
–98
8,83
1,23
4
In
tere
st ra
te2.
3% to
3.0
5%–
––
–
Lo
cal c
urre
ncie
s:
Fixe
d ra
te
Phili
ppin
e Pe
so lo
ans
₱–₱–
₱–₱3
9,99
0,82
9₱3
,000
,000
,000
₱3,0
39,9
90,8
293,
039,
990,
829
(25,
888,
805)
3,01
4,10
2,02
4
In
tere
st ra
te–
––
7.50
%8.
75%
₱17,
937,
977,
030
(₱25
,888
,805
)₱1
7,91
2,08
8,22
5

86
2008
<1 y
ear
>1-<
2 ye
ars
>2-<
3 ye
ars
>3-<
4 ye
ars
>4-<
5 ye
ars
Tota
l
Tota
l (in
Phi
lippi
ne
Peso
)
Deb
tIss
uanc
eC
osts
Car
ryin
g Va
lue
(in P
hilip
pine
Peso
)
Liab
ilitie
s:
Fo
reig
n cu
rren
cies
:
Floa
ting
rate
U
S D
olla
r loa
nsU
S$1,
327,
114
US$
–U
S$–
US$
–U
S$–
US$
1,32
7,11
4₱6
2,44
0,70
7₱–
₱62,
440,
707
In
tere
st ra
teU
SD L
IBO
R +
0.75
%–
––
–
Fixe
d ra
te
US
Dol
lar l
oans
US$
91,4
35,3
89U
S$–
US$
–U
S$19
9,12
7,86
6U
S$–
US$
290,
563,
255
13,7
12,0
47,9
97(4
1,04
6,85
8)13
,671
,001
,139
In
tere
st ra
te2.
95%
to 8
.69%
––
8.25
%–
Eu
ro lo
ans
€20,
089,
134
€–€–
€–€–
€20,
089,
134
1,36
5,61
5,95
9–
1,36
5,61
5,95
9
In
tere
st ra
te4.
6% to
5.1
0%–
––
–
Th
aila
nd B
aht l
oans
THB1
,079
,610
,000
THB–
THB–
THB–
THB–
THB1
,079
,610
,000
1,49
2,23
4,13
0–
1,49
2,23
4,13
0
In
tere
st ra
te5.
375%
––
––
C
hina
Yua
n lo
ans
RMB8
6,80
0,00
0RM
B–RM
B–RM
B–RM
B–RM
B86,
800,
000
597,
941,
418
–59
7,94
1,41
8
In
tere
st ra
te5.
375%
––
––
Lo
cal c
urre
ncie
s:
Fixe
d ra
te
Phili
ppin
e Pe
so lo
ans
₱3,3
12,4
58,0
89₱–
₱–₱–
₱46,
395,
488
₱3,3
58,8
53,5
773,
358,
853,
577
–3,
358,
853,
577
In
tere
st ra
te6.
75%
––
–7.
5%
₱20,
589,
133,
788
(₱41
,046
,858
)₱2
0,54
8,08
6,93
0
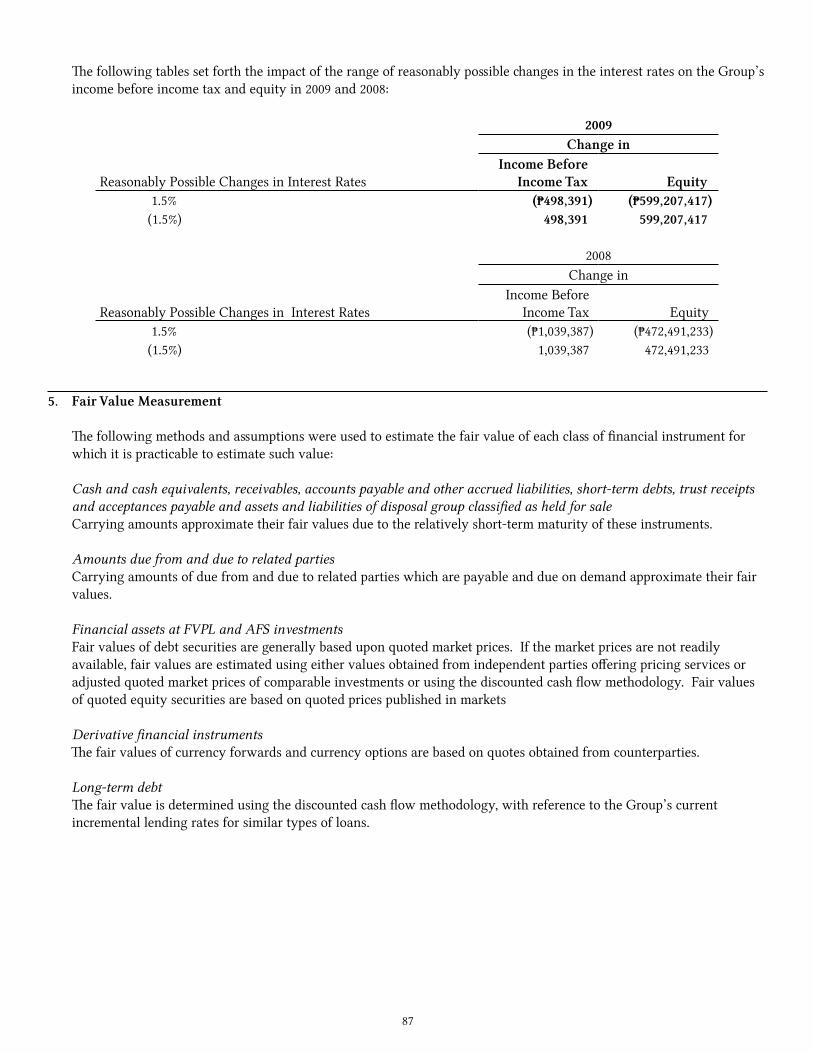
87
The following tables set forth the impact of the range of reasonably possible changes in the interest rates on the Group’s income before income tax and equity in 2009 and 2008:
2009Change in
Reasonably Possible Changes in Interest RatesIncome Before
Income Tax Equity 1.5% (₱498,391) (₱599,207,417) (1.5%) 498,391 599,207,417
2008Change in
Reasonably Possible Changes in Interest RatesIncome Before
Income Tax Equity 1.5% (₱1,039,387) (₱472,491,233) (1.5%) 1,039,387 472,491,233
5. Fair Value Measurement
The following methods and assumptions were used to estimate the fair value of each class of financial instrument for which it is practicable to estimate such value:
Cash and cash equivalents, receivables, accounts payable and other accrued liabilities, short-term debts, trust receipts and acceptances payable and assets and liabilities of disposal group classified as held for saleCarrying amounts approximate their fair values due to the relatively short-term maturity of these instruments.
Amounts due from and due to related partiesCarrying amounts of due from and due to related parties which are payable and due on demand approximate their fair values.
Financial assets at FVPL and AFS investments Fair values of debt securities are generally based upon quoted market prices. If the market prices are not readily available, fair values are estimated using either values obtained from independent parties offering pricing services or adjusted quoted market prices of comparable investments or using the discounted cash flow methodology. Fair values of quoted equity securities are based on quoted prices published in markets
Derivative financial instrumentsThe fair values of currency forwards and currency options are based on quotes obtained from counterparties.
Long-term debt The fair value is determined using the discounted cash flow methodology, with reference to the Group’s current incremental lending rates for similar types of loans.
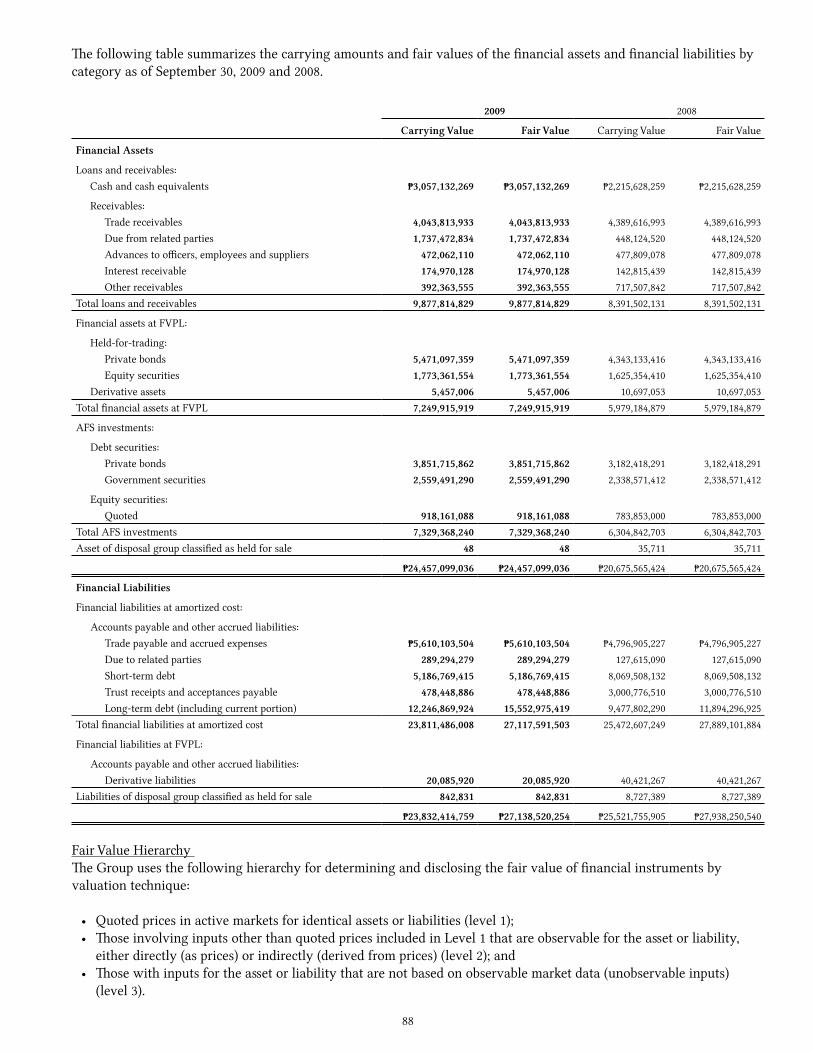
88
The following table summarizes the carrying amounts and fair values of the financial assets and financial liabilities by category as of September 30, 2009 and 2008.
2009 2008
Carrying Value Fair Value Carrying Value Fair Value
Financial Assets
Loans and receivables: Cash and cash equivalents ₱3,057,132,269 ₱3,057,132,269 ₱2,215,628,259 ₱2,215,628,259
Receivables: Trade receivables 4,043,813,933 4,043,813,933 4,389,616,993 4,389,616,993 Due from related parties 1,737,472,834 1,737,472,834 448,124,520 448,124,520 Advances to officers, employees and suppliers 472,062,110 472,062,110 477,809,078 477,809,078 Interest receivable 174,970,128 174,970,128 142,815,439 142,815,439 Other receivables 392,363,555 392,363,555 717,507,842 717,507,842Total loans and receivables 9,877,814,829 9,877,814,829 8,391,502,131 8,391,502,131
Financial assets at FVPL:
Held-for-trading: Private bonds 5,471,097,359 5,471,097,359 4,343,133,416 4,343,133,416 Equity securities 1,773,361,554 1,773,361,554 1,625,354,410 1,625,354,410 Derivative assets 5,457,006 5,457,006 10,697,053 10,697,053Total financial assets at FVPL 7,249,915,919 7,249,915,919 5,979,184,879 5,979,184,879
AFS investments:
Debt securities: Private bonds 3,851,715,862 3,851,715,862 3,182,418,291 3,182,418,291 Government securities 2,559,491,290 2,559,491,290 2,338,571,412 2,338,571,412
Equity securities: Quoted 918,161,088 918,161,088 783,853,000 783,853,000Total AFS investments 7,329,368,240 7,329,368,240 6,304,842,703 6,304,842,703Asset of disposal group classified as held for sale 48 48 35,711 35,711
₱24,457,099,036 ₱24,457,099,036 ₱20,675,565,424 ₱20,675,565,424
Financial Liabilities
Financial liabilities at amortized cost:
Accounts payable and other accrued liabilities: Trade payable and accrued expenses ₱5,610,103,504 ₱5,610,103,504 ₱4,796,905,227 ₱4,796,905,227 Due to related parties 289,294,279 289,294,279 127,615,090 127,615,090 Short-term debt 5,186,769,415 5,186,769,415 8,069,508,132 8,069,508,132 Trust receipts and acceptances payable 478,448,886 478,448,886 3,000,776,510 3,000,776,510 Long-term debt (including current portion) 12,246,869,924 15,552,975,419 9,477,802,290 11,894,296,925Total financial liabilities at amortized cost 23,811,486,008 27,117,591,503 25,472,607,249 27,889,101,884
Financial liabilities at FVPL:
Accounts payable and other accrued liabilities: Derivative liabilities 20,085,920 20,085,920 40,421,267 40,421,267Liabilities of disposal group classified as held for sale 842,831 842,831 8,727,389 8,727,389
₱23,832,414,759 ₱27,138,520,254 ₱25,521,755,905 ₱27,938,250,540
Fair Value Hierarchy The Group uses the following hierarchy for determining and disclosing the fair value of financial instruments by valuation technique:
• Quoted prices in active markets for identical assets or liabilities (level 1);• Those involving inputs other than quoted prices included in Level 1 that are observable for the asset or liability,
either directly (as prices) or indirectly (derived from prices) (level 2); and• Those with inputs for the asset or liability that are not based on observable market data (unobservable inputs)
(level 3).
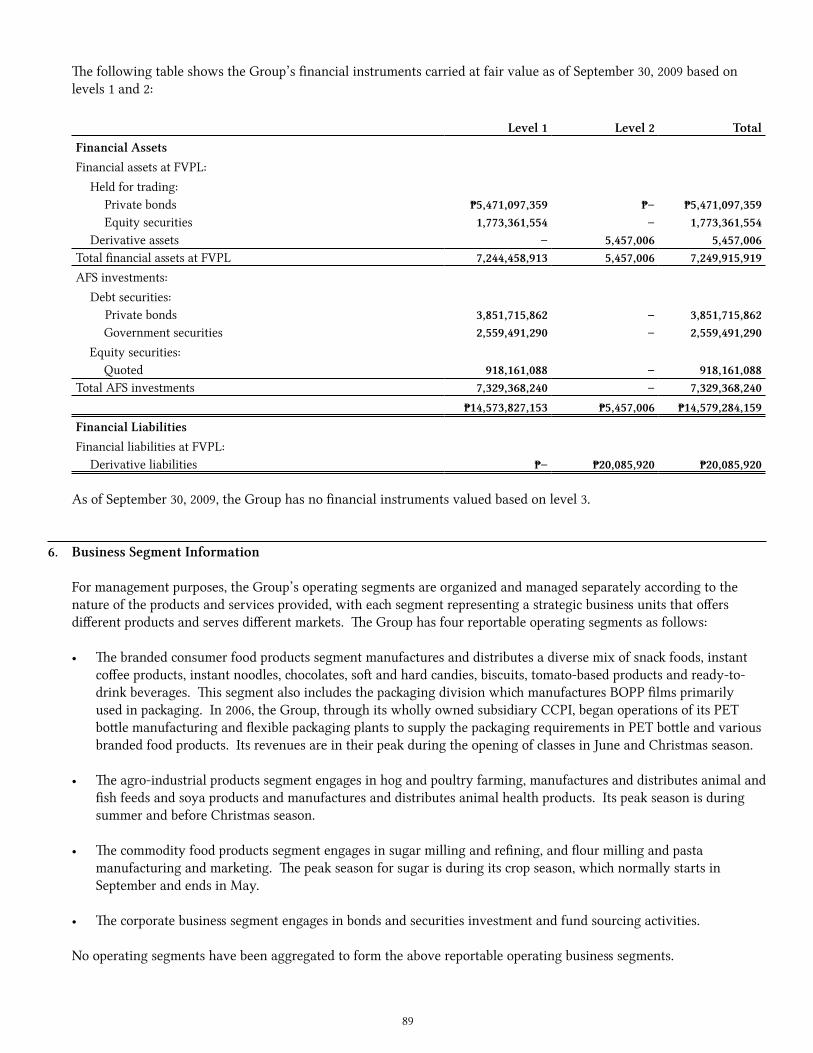
89
The following table shows the Group’s financial instruments carried at fair value as of September 30, 2009 based on levels 1 and 2:
Level 1 Level 2 TotalFinancial AssetsFinancial assets at FVPL: Held for trading: Private bonds ₱5,471,097,359 ₱– ₱5,471,097,359 Equity securities 1,773,361,554 – 1,773,361,554 Derivative assets – 5,457,006 5,457,006Total financial assets at FVPL 7,244,458,913 5,457,006 7,249,915,919AFS investments: Debt securities:
Private bonds 3,851,715,862 – 3,851,715,862 Government securities 2,559,491,290 – 2,559,491,290Equity securities: Quoted 918,161,088 – 918,161,088
Total AFS investments 7,329,368,240 – 7,329,368,240₱14,573,827,153 ₱5,457,006 ₱14,579,284,159
Financial LiabilitiesFinancial liabilities at FVPL: Derivative liabilities ₱– ₱20,085,920 ₱20,085,920
As of September 30, 2009, the Group has no financial instruments valued based on level 3.
6. Business Segment Information
For management purposes, the Group’s operating segments are organized and managed separately according to the nature of the products and services provided, with each segment representing a strategic business units that offers different products and serves different markets. The Group has four reportable operating segments as follows:
• The branded consumer food products segment manufactures and distributes a diverse mix of snack foods, instant coffee products, instant noodles, chocolates, soft and hard candies, biscuits, tomato-based products and ready-to-drink beverages. This segment also includes the packaging division which manufactures BOPP films primarily used in packaging. In 2006, the Group, through its wholly owned subsidiary CCPI, began operations of its PET bottle manufacturing and flexible packaging plants to supply the packaging requirements in PET bottle and various branded food products. Its revenues are in their peak during the opening of classes in June and Christmas season.
• The agro-industrial products segment engages in hog and poultry farming, manufactures and distributes animal and fish feeds and soya products and manufactures and distributes animal health products. Its peak season is during summer and before Christmas season.
• The commodity food products segment engages in sugar milling and refining, and flour milling and pasta manufacturing and marketing. The peak season for sugar is during its crop season, which normally starts in September and ends in May.
• The corporate business segment engages in bonds and securities investment and fund sourcing activities.
No operating segments have been aggregated to form the above reportable operating business segments.

90
Management monitors the operating results of business segment separately for the purpose of making decisions about resource allocation and performance assessment. The measure presented to manage segment performance is the segment operating income (loss). Segment operating income (loss) is based on the same accounting policies as consolidated operating income (loss) except that intersegment revenues are eliminated only at the consolidation level. Group financing (including finance costs and revenues), market valuation gain and loss, foreign exchange losses, other revenues and expenses and income taxes are managed on a group basis and are not allocated to operating segments. Transfer prices between operating segments are on an arm’s length basis in a manner similar to transactions with third parties.
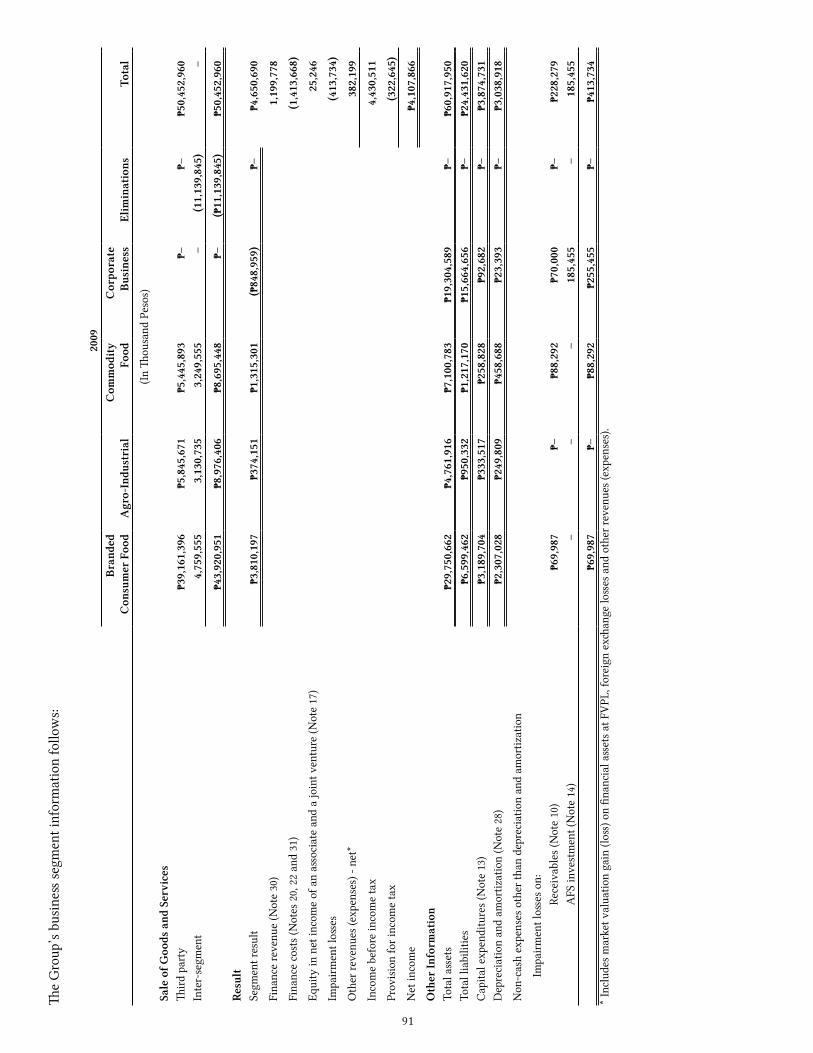
91
The
Gro
up’s
bus
iness
seg
men
t inf
orm
atio
n fo
llow
s:
2009
Bra
nded
Con
sum
er F
ood
Agr
o-In
dust
rial
Com
mod
ity
Food
Cor
pora
teB
usin
ess
Elim
inat
ions
Tota
l
(In Th
ousa
nd P
esos
)
Sale
of G
oods
and
Ser
vice
sTh
ird
part
y₱3
9,16
1,39
6₱5
,845
,671
₱5,4
45,8
93₱–
₱–₱5
0,45
2,96
0In
ter-
segm
ent
4,75
9,55
53,
130,
735
3,24
9,55
5–
(11,
139,
845)
–
₱43,
920,
951
₱8,9
76,4
06₱8
,695
,448
₱–(₱
11,1
39,8
45)
₱50,
452,
960
Resu
ltSe
gmen
t res
ult
₱3,8
10,1
97₱3
74,1
51₱1
,315
,301
(₱84
8,95
9)₱–
₱4,6
50,6
90
Fina
nce
reve
nue
(Not
e 30
)1,
199,
778
Fina
nce
cost
s (N
otes
20,
22
and
31)
(1,4
13,6
68)
Equi
ty in
net
inco
me
of a
n ass
ocia
te a
nd a
join
t ven
ture
(Not
e 17
)25
,246
Impa
irm
ent l
osses
(413
,734
)
Oth
er re
venu
es (e
xpen
ses)
- ne
t*38
2,19
9
Inco
me
befo
re in
com
e ta
x4,
430,
511
Prov
isio
n fo
r inc
ome
tax
(322
,645
)
Net
inco
me
₱4,1
07,8
66
Oth
er In
form
atio
nTo
tal a
sset
s₱2
9,75
0,66
2₱4
,761
,916
₱7,1
00,7
83₱1
9,30
4,58
9₱–
₱60,
917,
950
Tota
l lia
bilit
ies
₱6,5
99,4
62₱9
50,3
32₱1
,217
,170
₱15,
664,
656
₱–₱2
4,43
1,62
0C
apita
l exp
endi
ture
s (N
ote
13)
₱3,1
89,7
04₱3
33,5
17₱2
58,8
28₱9
2,68
2₱–
₱3,8
74,7
31D
epre
ciat
ion
and
amor
tizat
ion
(Not
e 28
)₱2
,307
,028
₱249
,809
₱458
,688
₱23,
393
₱–
₱3,0
38,9
18
Non
-cas
h ex
pens
es o
ther
than
dep
reci
atio
n an
d am
ortiz
atio
n
Im
pair
men
t loss
es o
n:
Re
ceiv
able
s (N
ote
10)
₱69,
987
₱–₱8
8,29
2₱7
0,00
0₱–
₱228
,279
AFS
inve
stm
ent (
Not
e 14
)–
––
185,
455
–18
5,45
5
₱69,
987
₱–₱8
8,29
2₱2
55,4
55₱–
₱413
,734
* In
clud
es m
arke
t val
uatio
n ga
in (l
oss) o
n fin
anci
al a
sset
s at
FV
PL, f
orei
gn e
xchan
ge lo
sses
and
oth
er re
venu
es (e
xpen
ses)
.

92
2008
Bran
ded
Con
sum
er F
ood
Agr
o-In
dust
rial
Com
mod
ityFo
od
Cor
pora
teBu
sine
ssEl
imin
atio
nsTo
tal
(In Th
ousa
nd P
esos
)
Sale
of G
oods
and
Ser
vice
sTh
ird
part
y₱3
4,76
3,05
8₱5
,570
,334
₱5,1
21,1
08₱–
₱–₱4
5,45
4,50
0In
ter-
segm
ent
4,89
1,95
42,
973,
112
3,74
0,53
1–
(11,
605,
597)
–
₱39,
655,
012
₱8,5
43,4
46₱8
,861
,639
₱–(₱
11,6
05,5
97)
₱45,
454,
500
Resu
ltSe
gmen
t res
ult
₱1,9
51,3
13₱2
88,6
05₱1
,896
,339
(₱44
8,05
5)₱–
₱3,6
88,2
02
Fina
nce
reve
nue
(Not
e 30
)1,
070,
053
Fina
nce
cost
s (N
otes
20,
22
and
31)
(1,2
73,5
99)
Equi
ty in
net
inco
me
of a
n ass
ocia
te a
nd a
join
t ven
ture
(Not
e 17
)28
,184
Impa
irm
ent l
osses
(298
,967
)
Oth
er re
venu
es (e
xpen
ses)
- ne
t*(2
,702
,081
)
Inco
me
befo
re in
com
e ta
x51
1,79
2
Prov
isio
n fo
r inc
ome
tax
(170
,596
)
Net
inco
me
₱341
,196
Oth
er In
form
atio
nTo
tal a
sset
s₱2
8,27
6,24
5₱4
,676
,191
₱8,1
71,1
69₱1
6,80
7,03
0₱–
₱57,
930,
635
Tota
l lia
bilit
ies
₱6,1
92,1
29₱1
,158
,590
₱3,6
89,7
40₱1
4,74
5,74
6₱–
₱25,
786,
205
Cap
ital e
xpen
ditu
res
(Not
e 13
)₱2
,803
,832
₱791
,961
₱1,3
64,1
40₱2
6,88
0₱–
₱4,9
86,8
13D
epre
ciat
ion
and
amor
tizat
ion
(Not
e 28
)₱2
,097
,339
₱207
,991
₱363
,546
₱24,
544
₱–₱2
,693
,420
Non
-cas
h ex
pens
es o
ther
than
dep
reci
atio
n an
d am
ortiz
atio
n
Im
pair
men
t loss
es o
n:
In
vent
orie
s (N
ote
11)
₱12,
959
₱179
,432
₱–₱–
₱–₱1
92,3
91
Re
ceiv
able
s (N
ote
10)
94,9
01–
––
–94
,901
AFS
inve
stm
ent (
Not
e 14
)11
,675
––
––
11,6
75
₱119
,535
₱179
,432
₱–₱–
₱–₱2
98,9
67*
Incl
udes
mar
ket v
alua
tion
gain
(loss
) on
finan
cial
ass
ets
at F
VPL
, for
eign
exch
ange
loss
es a
nd o
ther
reve
nues
(exp
ense
s).
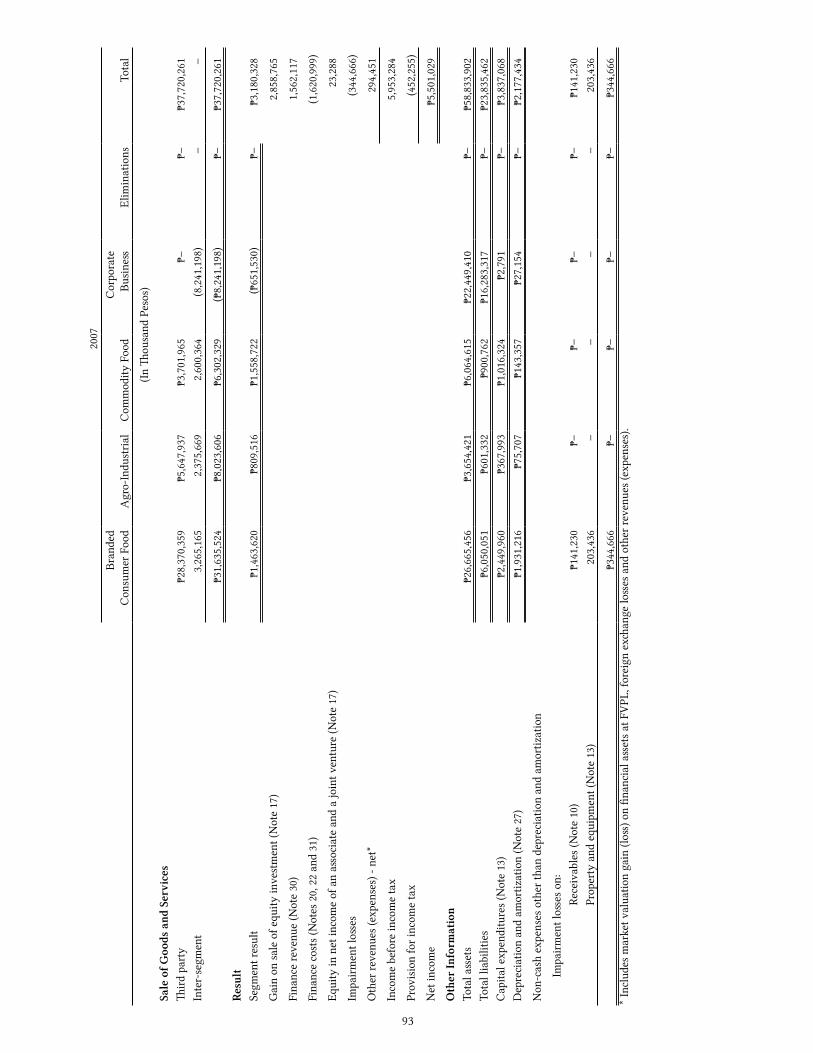
93
2007
Bran
ded
Con
sum
er F
ood
Agr
o-In
dust
rial
Com
mod
ity F
ood
Cor
pora
teBu
sine
ssEl
imin
atio
nsTo
tal
(In Th
ousa
nd P
esos
)
Sale
of G
oods
and
Ser
vice
sTh
ird
part
y₱2
8,37
0,35
9₱5
,647
,937
₱3,7
01,9
65₱–
₱–₱3
7,72
0,26
1In
ter-
segm
ent
3,26
5,16
52,
375,
669
2,60
0,36
4(8
,241
,198
)–
–
₱31,
635,
524
₱8,0
23,6
06₱6
,302
,329
(₱8,
241,
198)
₱–₱3
7,72
0,26
1
Resu
ltSe
gmen
t res
ult
₱1,4
63,6
20₱8
09,5
16₱1
,558
,722
(₱65
1,53
0)₱–
₱3,1
80,3
28
Gai
n on
sal
e of
equ
ity in
vest
men
t (N
ote
17)
2,85
8,76
5
Fina
nce
reve
nue
(Not
e 30
)1,
562,
117
Fina
nce
cost
s (N
otes
20,
22
and
31)
(1,6
20,9
99)
Equi
ty in
net
inco
me
of a
n ass
ocia
te a
nd a
join
t ven
ture
(Not
e 17
)23
,288
Impa
irm
ent l
osses
(344
,666
)
Oth
er re
venu
es (e
xpen
ses)
- ne
t*29
4,45
1
Inco
me
befo
re in
com
e ta
x5,
953,
284
Prov
isio
n fo
r inc
ome
tax
(452
,255
)
Net
inco
me
₱5,5
01,0
29
Oth
er In
form
atio
nTo
tal a
sset
s₱2
6,66
5,45
6₱3
,654
,421
₱6,0
64,6
15₱2
2,44
9,41
0₱–
₱58,
833,
902
Tota
l lia
bilit
ies
₱6,0
50,0
51₱6
01,3
32₱9
00,7
62₱1
6,28
3,31
7₱–
₱23,
835,
462
Cap
ital e
xpen
ditu
res
(Not
e 13
)₱2
,449
,960
₱367
,993
₱1,0
16,3
24₱2
,791
₱–₱3
,837
,068
Dep
reci
atio
n an
d am
ortiz
atio
n (N
ote
27)
₱1,9
31,2
16₱7
5,70
7₱1
43,3
57₱2
7,15
4₱–
₱2,1
77,4
34
Non
-cas
h ex
pens
es o
ther
than
dep
reci
atio
n an
d am
ortiz
atio
n
Im
pair
men
t loss
es o
n:
Re
ceiv
able
s (N
ote
10)
₱141
,230
₱–₱–
₱–₱–
₱141
,230
Prop
erty
and
equ
ipm
ent (
Not
e 13
)20
3,43
6–
––
–20
3,43
6
₱344
,666
₱–₱–
₱–₱–
₱344
,666
* In
clud
es m
arke
t val
uatio
n ga
in (l
oss) o
n fin
anci
al a
sset
s at
FV
PL, f
orei
gn e
xchan
ge lo
sses
and
oth
er re
venu
es (e
xpen
ses)
.

94
Inter-segment RevenuesIntersegment revenues are eliminated at the consolidation level.
Segment ResultsSegment results pertain to the operating income (loss) of each operating segments adjusted by the subsequent take up of significant transactions of operating segments with fiscal year end and the capitalization of borrowing costs at the consolidated level for qualifying assets held by a certain subsidiary excluding the amounts of market valuation gains and losses on financial assets at FVPL, foreign exchange losses and other revenues and expenses which are not allocated to operating segments.
Segment AssetsSegment assets are resources owned by each of the operating segments excluding significant inter-segment transactions.
Segment LiabilitiesSegment liabilities are obligations incurred by each of the operating segments excluding significant inter-segment transactions. The Group also reports to the chief operating decision maker the breakdown of the short-term and long-term debt of each of the operating segments.
Capital ExpendituresThe components of capital expenditures reported to the chief operating decision maker are the additions to investment property and property plant and equipment during the period.
Geographic InformationThe Group operates in the Philippines, Thailand, Malaysia, Indonesia, China, Hong Kong, Singapore and Vietnam.
The following table shows the distribution of the Group’s consolidated sales by geographical market, regardless of where the goods were produced, and the carrying amounts of segment assets and additions to property, plant, equipment, and intangible assets by geographical area in which the assets are located.
2009Domestic Foreign Total
(In Thousand Pesos)Sale of goods and services ₱38,920,004 ₱11,532,956 ₱50,452,960Segment assets ₱47,346,325 ₱13,571,625 ₱60,917,950Capital expenditures (Note 13) ₱2,218,307 ₱1,656,424 ₱3,874,731Depreciation and amortization (Note 28) ₱2,200,538 ₱838,380 ₱3,038,918Non-cash expenses other than depreciation and amortization Impairment losses on: Receivables (Note 10) ₱228,279 ₱– ₱228,279 AFS investments – 185,455 185,455
₱228,279 ₱185,455 ₱413,734
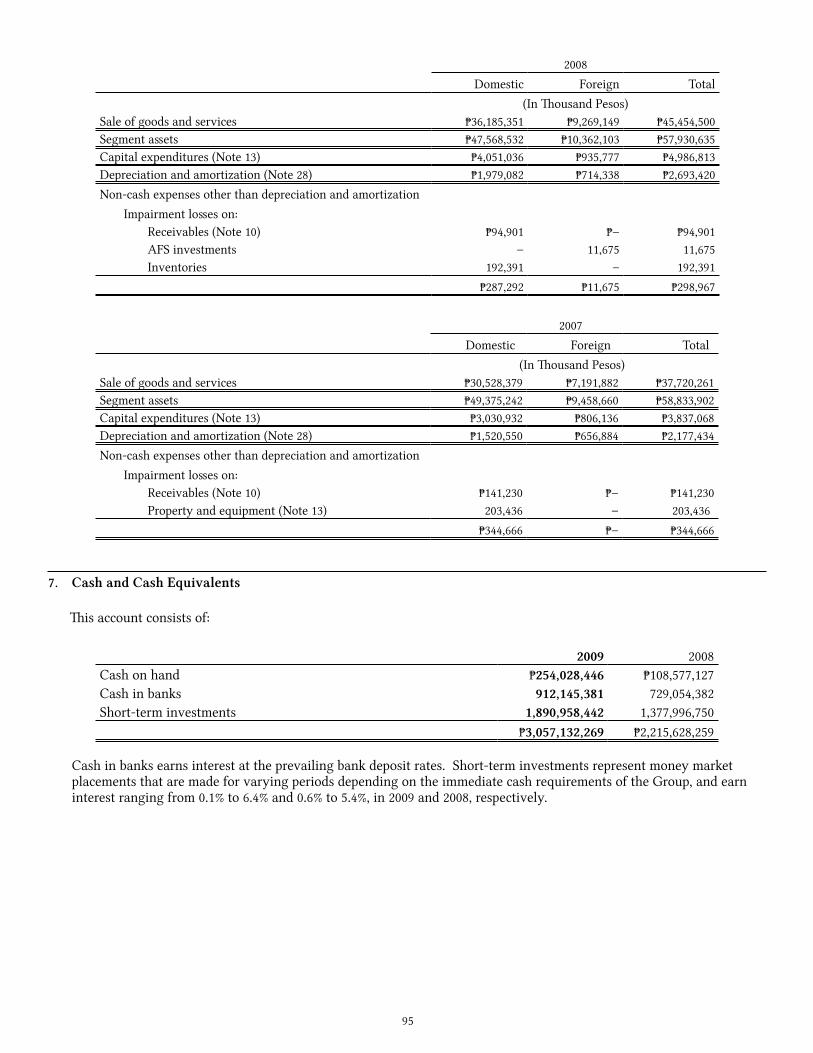
95
2008Domestic Foreign Total
(In Thousand Pesos)Sale of goods and services ₱36,185,351 ₱9,269,149 ₱45,454,500Segment assets ₱47,568,532 ₱10,362,103 ₱57,930,635Capital expenditures (Note 13) ₱4,051,036 ₱935,777 ₱4,986,813Depreciation and amortization (Note 28) ₱1,979,082 ₱714,338 ₱2,693,420Non-cash expenses other than depreciation and amortization
Impairment losses on:Receivables (Note 10) ₱94,901 ₱– ₱94,901 AFS investments – 11,675 11,675Inventories 192,391 – 192,391
₱287,292 ₱11,675 ₱298,967
2007Domestic Foreign Total
(In Thousand Pesos)Sale of goods and services ₱30,528,379 ₱7,191,882 ₱37,720,261Segment assets ₱49,375,242 ₱9,458,660 ₱58,833,902Capital expenditures (Note 13) ₱3,030,932 ₱806,136 ₱3,837,068Depreciation and amortization (Note 28) ₱1,520,550 ₱656,884 ₱2,177,434Non-cash expenses other than depreciation and amortization Impairment losses on: Receivables (Note 10) ₱141,230 ₱– ₱141,230 Property and equipment (Note 13) 203,436 – 203,436
₱344,666 ₱– ₱344,666
7. Cash and Cash Equivalents
This account consists of:
2009 2008Cash on hand ₱254,028,446 ₱108,577,127Cash in banks 912,145,381 729,054,382Short-term investments 1,890,958,442 1,377,996,750
₱3,057,132,269 ₱2,215,628,259
Cash in banks earns interest at the prevailing bank deposit rates. Short-term investments represent money market placements that are made for varying periods depending on the immediate cash requirements of the Group, and earn interest ranging from 0.1% to 6.4% and 0.6% to 5.4%, in 2009 and 2008, respectively.
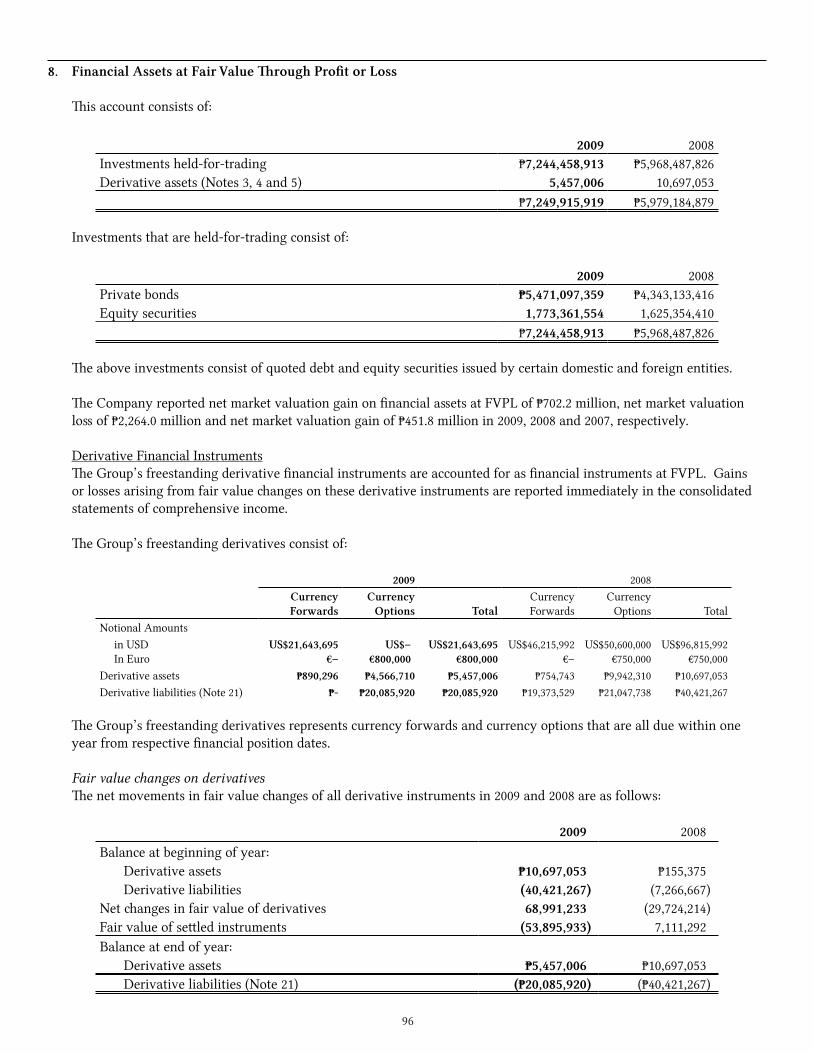
96
8. Financial Assets at Fair Value Through Profit or Loss
This account consists of:
2009 2008Investments held-for-trading ₱7,244,458,913 ₱5,968,487,826Derivative assets (Notes 3, 4 and 5) 5,457,006 10,697,053
₱7,249,915,919 ₱5,979,184,879
Investments that are held-for-trading consist of:
2009 2008Private bonds ₱5,471,097,359 ₱4,343,133,416Equity securities 1,773,361,554 1,625,354,410
₱7,244,458,913 ₱5,968,487,826
The above investments consist of quoted debt and equity securities issued by certain domestic and foreign entities.
The Company reported net market valuation gain on financial assets at FVPL of ₱702.2 million, net market valuation loss of ₱2,264.0 million and net market valuation gain of ₱451.8 million in 2009, 2008 and 2007, respectively.
Derivative Financial InstrumentsThe Group’s freestanding derivative financial instruments are accounted for as financial instruments at FVPL. Gains or losses arising from fair value changes on these derivative instruments are reported immediately in the consolidated statements of comprehensive income.
The Group’s freestanding derivatives consist of:
2009 2008CurrencyForwards
CurrencyOptions Total
CurrencyForwards
CurrencyOptions Total
Notional Amounts in USD In Euro
US$21,643,695€–
US$– €800,000
US$21,643,695€800,000
US$46,215,992€–
US$50,600,000€750,000
US$96,815,992 €750,000
Derivative assets ₱890,296 ₱4,566,710 ₱5,457,006 ₱754,743 ₱9,942,310 ₱10,697,053Derivative liabilities (Note 21) ₱- ₱20,085,920 ₱20,085,920 ₱19,373,529 ₱21,047,738 ₱40,421,267
The Group’s freestanding derivatives represents currency forwards and currency options that are all due within one year from respective financial position dates.
Fair value changes on derivativesThe net movements in fair value changes of all derivative instruments in 2009 and 2008 are as follows:
2009 2008Balance at beginning of year: Derivative assets ₱10,697,053 ₱155,375 Derivative liabilities (40,421,267) (7,266,667)Net changes in fair value of derivatives 68,991,233 (29,724,214)Fair value of settled instruments (53,895,933) 7,111,292Balance at end of year: Derivative assets ₱5,457,006 ₱10,697,053 Derivative liabilities (Note 21) (₱20,085,920) (₱40,421,267)
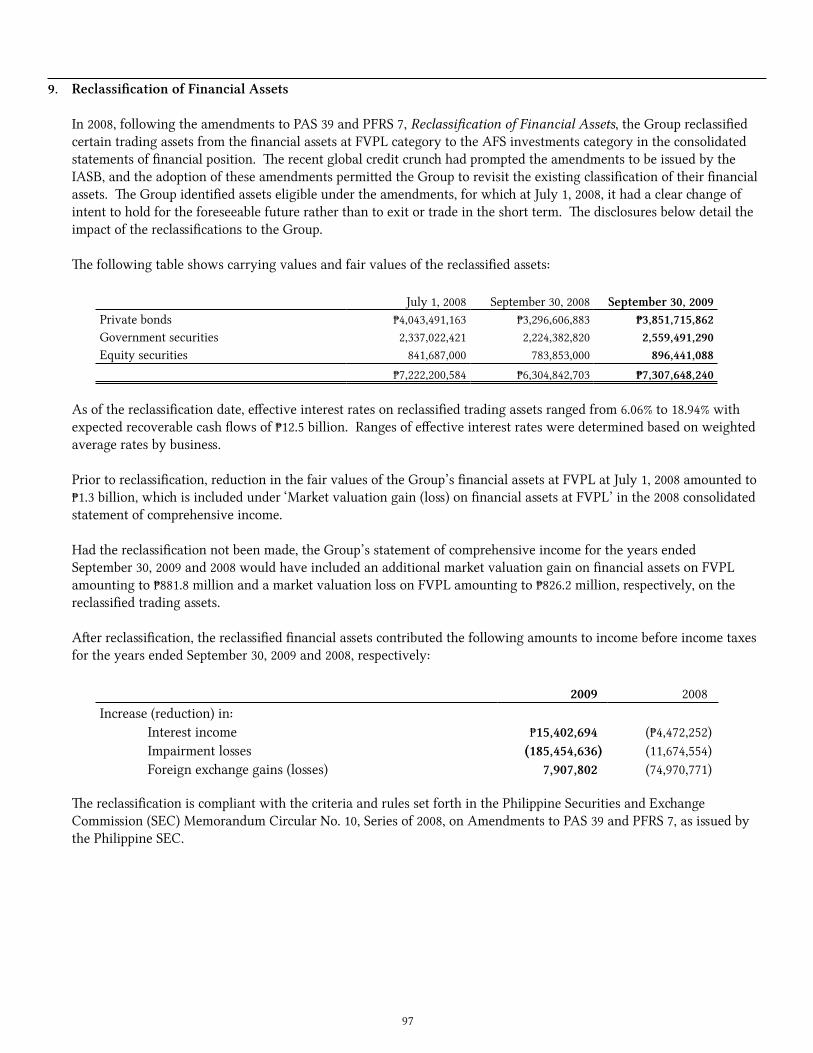
97
9. Reclassification of Financial Assets
In 2008, following the amendments to PAS 39 and PFRS 7, Reclassification of Financial Assets, the Group reclassified certain trading assets from the financial assets at FVPL category to the AFS investments category in the consolidated statements of financial position. The recent global credit crunch had prompted the amendments to be issued by the IASB, and the adoption of these amendments permitted the Group to revisit the existing classification of their financial assets. The Group identified assets eligible under the amendments, for which at July 1, 2008, it had a clear change of intent to hold for the foreseeable future rather than to exit or trade in the short term. The disclosures below detail the impact of the reclassifications to the Group.
The following table shows carrying values and fair values of the reclassified assets:
July 1, 2008 September 30, 2008 September 30, 2009Private bonds ₱4,043,491,163 ₱3,296,606,883 ₱3,851,715,862Government securities 2,337,022,421 2,224,382,820 2,559,491,290Equity securities 841,687,000 783,853,000 896,441,088
₱7,222,200,584 ₱6,304,842,703 ₱7,307,648,240
As of the reclassification date, effective interest rates on reclassified trading assets ranged from 6.06% to 18.94% with expected recoverable cash flows of ₱12.5 billion. Ranges of effective interest rates were determined based on weighted average rates by business.
Prior to reclassification, reduction in the fair values of the Group’s financial assets at FVPL at July 1, 2008 amounted to ₱1.3 billion, which is included under ‘Market valuation gain (loss) on financial assets at FVPL’ in the 2008 consolidated statement of comprehensive income.
Had the reclassification not been made, the Group’s statement of comprehensive income for the years ended September 30, 2009 and 2008 would have included an additional market valuation gain on financial assets on FVPL amounting to ₱881.8 million and a market valuation loss on FVPL amounting to ₱826.2 million, respectively, on the reclassified trading assets.
After reclassification, the reclassified financial assets contributed the following amounts to income before income taxes for the years ended September 30, 2009 and 2008, respectively:
2009 2008Increase (reduction) in: Interest income ₱15,402,694 (₱4,472,252) Impairment losses (185,454,636) (11,674,554) Foreign exchange gains (losses) 7,907,802 (74,970,771)
The reclassification is compliant with the criteria and rules set forth in the Philippine Securities and Exchange Commission (SEC) Memorandum Circular No. 10, Series of 2008, on Amendments to PAS 39 and PFRS 7, as issued by the Philippine SEC.
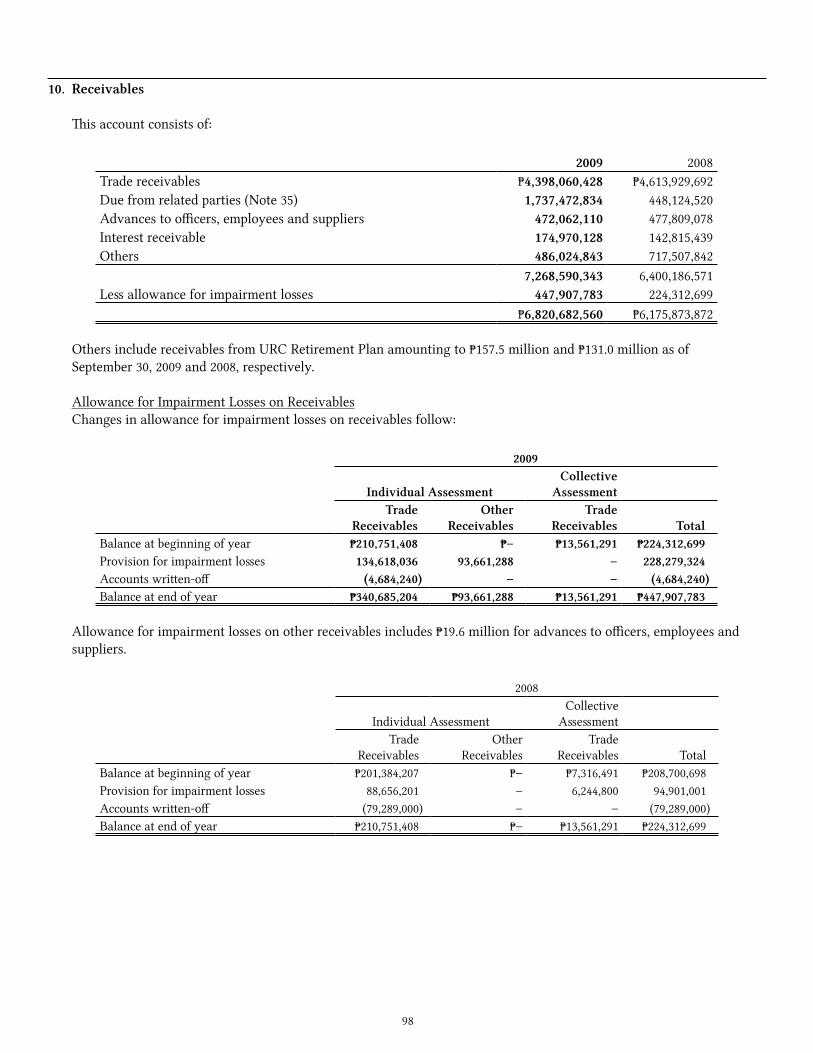
98
10. Receivables
This account consists of:
2009 2008Trade receivables ₱4,398,060,428 ₱4,613,929,692Due from related parties (Note 35) 1,737,472,834 448,124,520Advances to officers, employees and suppliers 472,062,110 477,809,078Interest receivable 174,970,128 142,815,439Others 486,024,843 717,507,842
7,268,590,343 6,400,186,571Less allowance for impairment losses 447,907,783 224,312,699
₱6,820,682,560 ₱6,175,873,872
Others include receivables from URC Retirement Plan amounting to ₱157.5 million and ₱131.0 million as of September 30, 2009 and 2008, respectively.
Allowance for Impairment Losses on ReceivablesChanges in allowance for impairment losses on receivables follow:
2009
Individual AssessmentCollective
AssessmentTrade
ReceivablesOther
ReceivablesTrade
Receivables TotalBalance at beginning of year ₱210,751,408 ₱– ₱13,561,291 ₱224,312,699Provision for impairment losses 134,618,036 93,661,288 – 228,279,324Accounts written-off (4,684,240) – – (4,684,240)Balance at end of year ₱340,685,204 ₱93,661,288 ₱13,561,291 ₱447,907,783
Allowance for impairment losses on other receivables includes ₱19.6 million for advances to officers, employees and suppliers.
2008
Individual AssessmentCollective
AssessmentTrade
ReceivablesOther
ReceivablesTrade
Receivables TotalBalance at beginning of year ₱201,384,207 ₱– ₱7,316,491 ₱208,700,698Provision for impairment losses 88,656,201 – 6,244,800 94,901,001Accounts written-off (79,289,000) – – (79,289,000)Balance at end of year ₱210,751,408 ₱– ₱13,561,291 ₱224,312,699
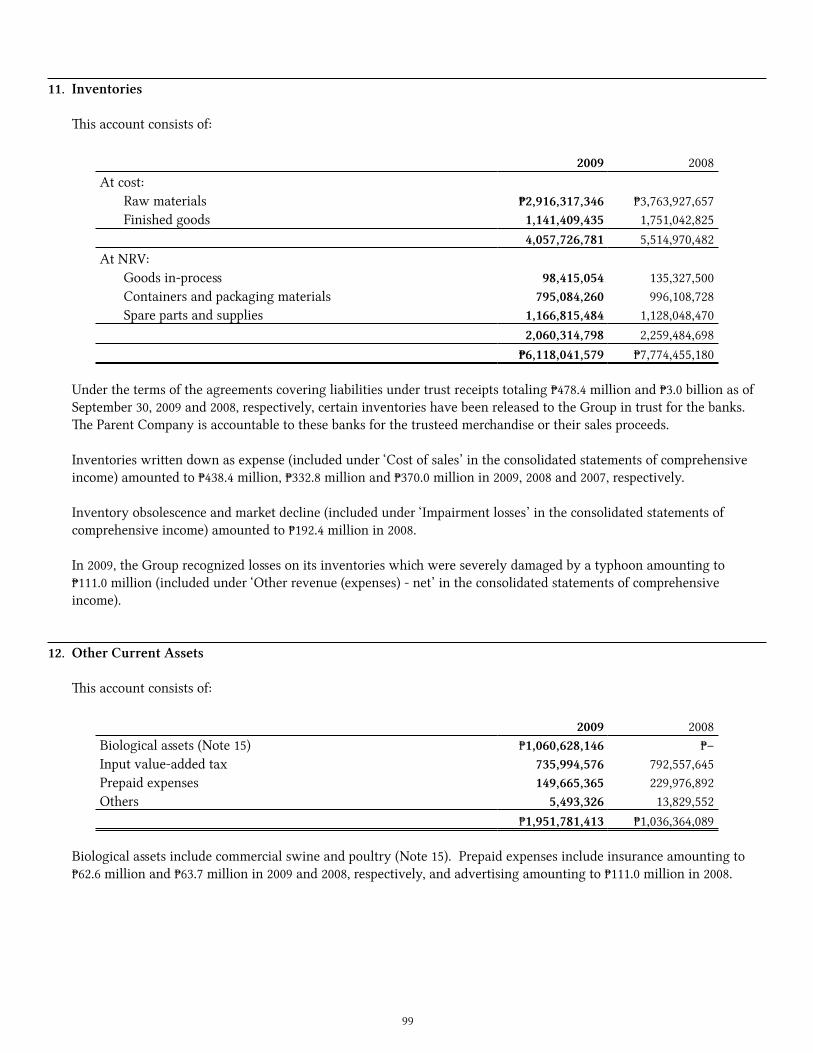
99
11. Inventories
This account consists of:
2009 2008At cost: Raw materials ₱2,916,317,346 ₱3,763,927,657 Finished goods 1,141,409,435 1,751,042,825
4,057,726,781 5,514,970,482At NRV: Goods in-process 98,415,054 135,327,500 Containers and packaging materials 795,084,260 996,108,728 Spare parts and supplies 1,166,815,484 1,128,048,470
2,060,314,798 2,259,484,698₱6,118,041,579 ₱7,774,455,180
Under the terms of the agreements covering liabilities under trust receipts totaling ₱478.4 million and ₱3.0 billion as of September 30, 2009 and 2008, respectively, certain inventories have been released to the Group in trust for the banks. The Parent Company is accountable to these banks for the trusteed merchandise or their sales proceeds.
Inventories written down as expense (included under ‘Cost of sales’ in the consolidated statements of comprehensive income) amounted to ₱438.4 million, ₱332.8 million and ₱370.0 million in 2009, 2008 and 2007, respectively.
Inventory obsolescence and market decline (included under ‘Impairment losses’ in the consolidated statements of comprehensive income) amounted to ₱192.4 million in 2008.
In 2009, the Group recognized losses on its inventories which were severely damaged by a typhoon amounting to ₱111.0 million (included under ‘Other revenue (expenses) - net’ in the consolidated statements of comprehensive income).
12. Other Current Assets
This account consists of:
2009 2008Biological assets (Note 15) ₱1,060,628,146 ₱–Input value-added tax 735,994,576 792,557,645Prepaid expenses 149,665,365 229,976,892Others 5,493,326 13,829,552
₱1,951,781,413 ₱1,036,364,089
Biological assets include commercial swine and poultry (Note 15). Prepaid expenses include insurance amounting to ₱62.6 million and ₱63.7 million in 2009 and 2008, respectively, and advertising amounting to ₱111.0 million in 2008.
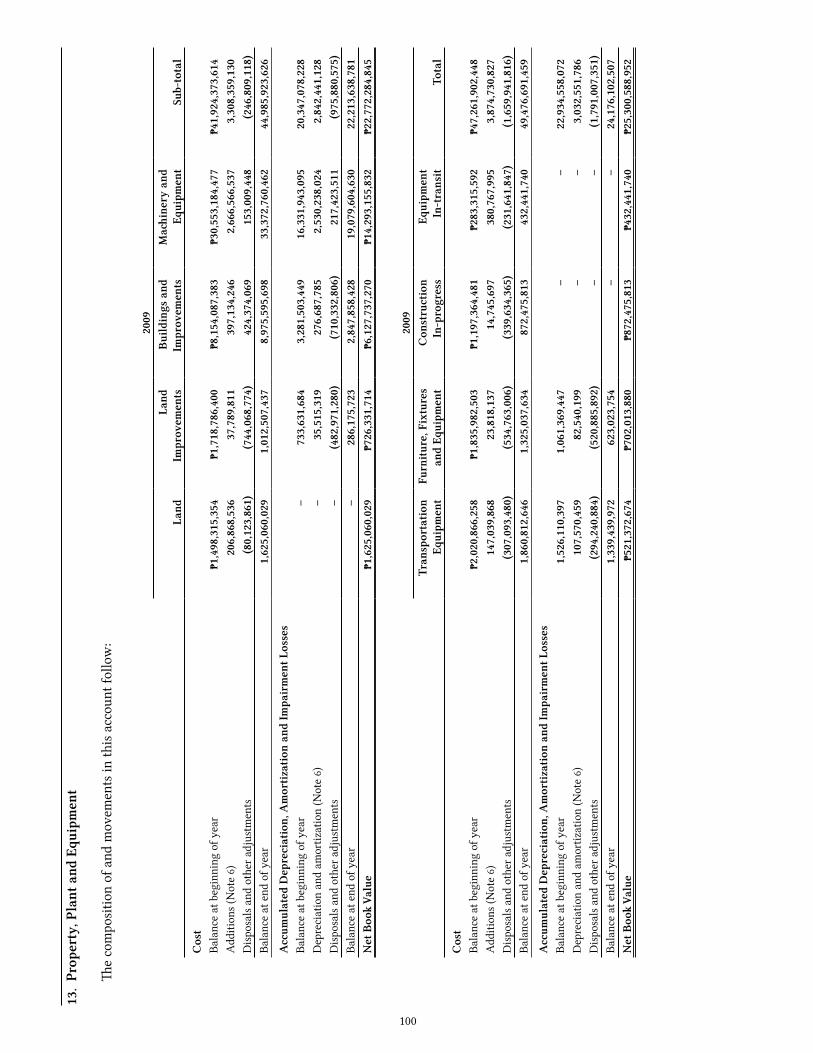
100
13.
Prop
erty
, Pla
nt a
nd E
quip
men
t
The
com
posi
tion
of a
nd m
ovem
ents
in th
is a
ccou
nt fo
llow
:
2009
Land
Land
Impr
ovem
ents
Bui
ldin
gs a
ndIm
prov
emen
tsM
achin
ery
and
Equi
pmen
tSu
b-to
tal
Cos
tBa
lanc
e at
beg
inni
ng o
f yea
r₱1
,498
,315
,354
₱1,7
18,7
86,4
00₱8
,154
,087
,383
₱30,
553,
184,
477
₱41,
924,
373,
614
Add
ition
s (N
ote
6)20
6,86
8,53
637
,789
,811
397,
134,
246
2,66
6,56
6,53
73,
308,
359,
130
Dis
posa
ls a
nd o
ther
adj
ustm
ents
(80,
123,
861)
(744
,068
,774
)42
4,37
4,06
915
3,00
9,44
8(2
46,8
09,1
18)
Bala
nce
at e
nd o
f yea
r1,
625,
060,
029
1,01
2,50
7,43
78,
975,
595,
698
33,3
72,7
60,4
6244
,985
,923
,626
Acc
umul
ated
Dep
reci
atio
n, A
mor
tiza
tion
and
Impa
irm
ent L
osse
sBa
lanc
e at
beg
inni
ng o
f yea
r–
733,
631,
684
3,28
1,50
3,44
916
,331
,943
,095
20,3
47,0
78,2
28D
epre
ciat
ion
and
amor
tizat
ion
(Not
e 6)
–35
,515
,319
276,
687,
785
2,53
0,23
8,02
42,
842,
441,
128
Dis
posa
ls a
nd o
ther
adj
ustm
ents
–(4
82,9
71,2
80)
(710
,332
,806
)21
7,42
3,51
1(9
75,8
80,5
75)
Bala
nce
at e
nd o
f yea
r–
286,
175,
723
2,84
7,85
8,42
819
,079
,604
,630
22,2
13,6
38,7
81N
et B
ook
Valu
e₱1
,625
,060
,029
₱726
,331
,714
₱6,1
27,7
37,2
70₱1
4,29
3,15
5,83
2₱2
2,77
2,28
4,84
5
2009
Tran
spor
tati
onEq
uipm
ent
Furn
itur
e, F
ixtu
res
and
Equi
pmen
tC
onst
ruct
ion
In-p
rogr
ess
Equi
pmen
tIn
-tra
nsit
Tota
l
Cos
tBa
lanc
e at
beg
inni
ng o
f yea
r₱2
,020
,866
,258
₱1,8
35,9
82,5
03₱1
,197
,364
,481
₱283
,315
,592
₱47,
261,
902,
448
Add
ition
s (N
ote
6)14
7,03
9,86
823
,818
,137
14,7
45,6
9738
0,76
7,99
53,
874,
730,
827
Dis
posa
ls a
nd o
ther
adj
ustm
ents
(307
,093
,480
)(5
34,7
63,0
06)
(339
,634
,365
)(2
31,6
41,8
47)
(1,6
59,9
41,8
16)
Bala
nce
at e
nd o
f yea
r1,
860,
812,
646
1,32
5,03
7,63
487
2,47
5,81
343
2,44
1,74
049
,476
,691
,459
Acc
umul
ated
Dep
reci
atio
n, A
mor
tiza
tion
and
Impa
irm
ent L
osse
sBa
lanc
e at
beg
inni
ng o
f yea
r1,
526,
110,
397
1,06
1,36
9,44
7–
–22
,934
,558
,072
Dep
reci
atio
n an
d am
ortiz
atio
n (N
ote
6)10
7,57
0,45
982
,540
,199
––
3,03
2,55
1,78
6D
ispo
sals
and
oth
er a
djus
tmen
ts(2
94,2
40,8
84)
(520
,885
,892
)–
–(1
,791
,007
,351
)Ba
lanc
e at
end
of y
ear
1,33
9,43
9,97
262
3,02
3,75
4–
–24
,176
,102
,507
Net
Boo
k Va
lue
₱521
,372
,674
₱702
,013
,880
₱872
,475
,813
₱432
,441
,740
₱25,
300,
588,
952
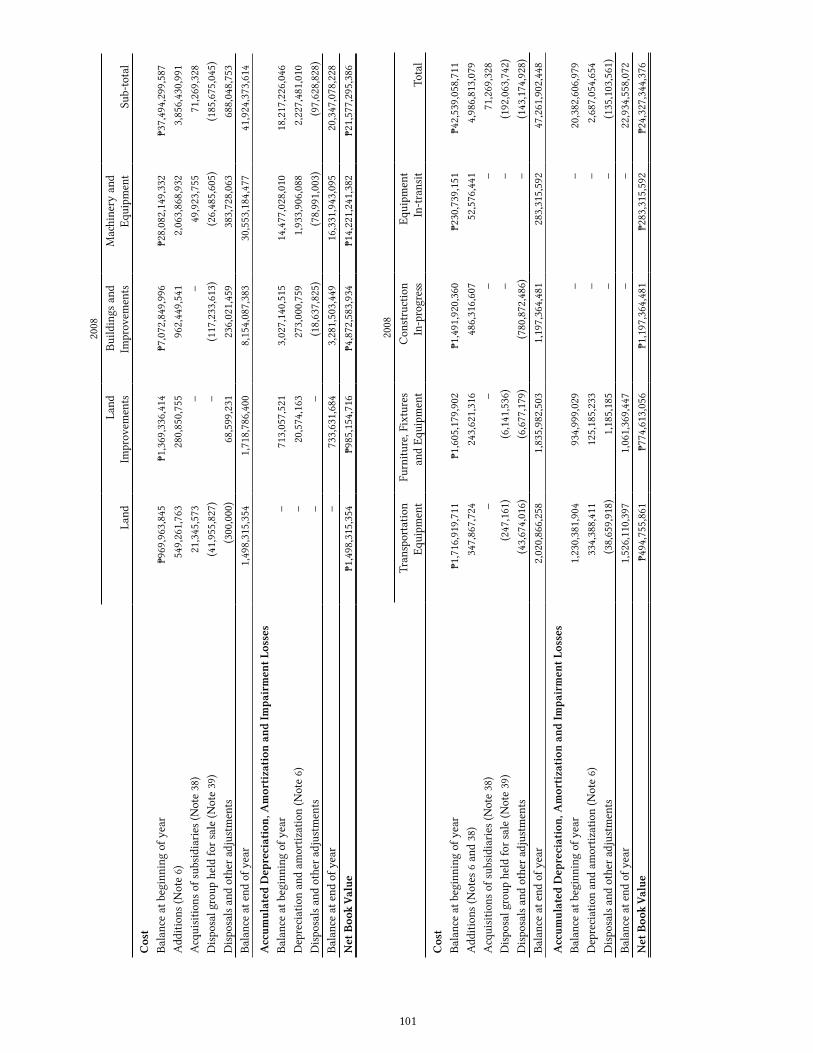
101
2008
Land
Land
Impr
ovem
ents
Build
ings
and
Impr
ovem
ents
Mach
iner
y an
dEq
uipm
ent
Sub-
tota
l
Cos
tBa
lanc
e at
beg
inni
ng o
f yea
r₱9
69,9
63,8
45₱1
,369
,336
,414
₱7,0
72,8
49,9
96₱2
8,08
2,14
9,33
2₱3
7,49
4,29
9,58
7A
dditi
ons
(Not
e 6)
549,
261,
763
280,
850,
755
962,
449,
541
2,06
3,86
8,93
23,
856,
430,
991
Acq
uisi
tions
of s
ubsi
diar
ies
(Not
e 38
)21
,345
,573
––
49,9
23,7
5571
,269
,328
Dis
posa
l gro
up h
eld
for s
ale
(Not
e 39
)(4
1,95
5,82
7)–
(117
,233
,613
)(2
6,48
5,60
5)(1
85,6
75,0
45)
Dis
posa
ls a
nd o
ther
adj
ustm
ents
(300
,000
)68
,599
,231
236,
021,
459
383,
728,
063
688,
048,
753
Bala
nce
at e
nd o
f yea
r1,
498,
315,
354
1,71
8,78
6,40
08,
154,
087,
383
30,5
53,1
84,4
7741
,924
,373
,614
Acc
umul
ated
Dep
reci
atio
n, A
mor
tiza
tion
and
Impa
irm
ent L
osse
sBa
lanc
e at
beg
inni
ng o
f yea
r–
713,
057,
521
3,02
7,14
0,51
514
,477
,028
,010
18,2
17,2
26,0
46D
epre
ciat
ion
and
amor
tizat
ion
(Not
e 6)
–20
,574
,163
273,
000,
759
1,93
3,90
6,08
82,
227,
481,
010
Dis
posa
ls a
nd o
ther
adj
ustm
ents
––
(18,
637,
825)
(78,
991,
003)
(97,
628,
828)
Bala
nce
at e
nd o
f yea
r–
733,
631,
684
3,28
1,50
3,44
916
,331
,943
,095
20,3
47,0
78,2
28N
et B
ook
Valu
e₱1
,498
,315
,354
₱985
,154
,716
₱4,8
72,5
83,9
34₱1
4,22
1,24
1,38
2₱2
1,57
7,29
5,38
6
2008
Tran
spor
tatio
nEq
uipm
ent
Furn
iture
, Fix
ture
san
d Eq
uipm
ent
Con
stru
ctio
nIn
-pro
gress
Equi
pmen
tIn
-tra
nsit
Tota
l
Cos
tBa
lanc
e at
beg
inni
ng o
f yea
r₱1
,716
,919
,711
₱1,6
05,1
79,9
02₱1
,491
,920
,360
₱230
,739
,151
₱42,
539,
058,
711
Add
ition
s (N
otes
6 a
nd 3
8)34
7,86
7,72
424
3,62
1,31
648
6,31
6,60
752
,576
,441
4,98
6,81
3,07
9A
cqui
sitio
ns o
f sub
sidi
arie
s (N
ote
38)
––
––
71,2
69,3
28D
ispo
sal g
roup
hel
d fo
r sal
e (N
ote
39)
(247
,161
)(6
,141
,536
)–
–(1
92,0
63,7
42)
Dis
posa
ls a
nd o
ther
adj
ustm
ents
(43,
674,
016)
(6,6
77,1
79)
(780
,872
,486
)–
(143
,174
,928
)Ba
lanc
e at
end
of y
ear
2,02
0,86
6,25
81,
835,
982,
503
1,19
7,36
4,48
128
3,31
5,59
247
,261
,902
,448
Acc
umul
ated
Dep
reci
atio
n, A
mor
tiza
tion
and
Impa
irm
ent L
osse
sBa
lanc
e at
beg
inni
ng o
f yea
r1,
230,
381,
904
934,
999,
029
––
20,3
82,6
06,9
79D
epre
ciat
ion
and
amor
tizat
ion
(Not
e 6)
334,
388,
411
125,
185,
233
––
2,68
7,05
4,65
4D
ispo
sals
and
oth
er a
djus
tmen
ts(3
8,65
9,91
8)1,
185,
185
––
(135
,103
,561
)Ba
lanc
e at
end
of y
ear
1,52
6,11
0,39
71,
061,
369,
447
––
22,9
34,5
58,0
72N
et B
ook
Valu
e₱4
94,7
55,8
61₱7
74,6
13,0
56₱1
,197
,364
,481
₱283
,315
,592
₱24,
327,
344,
376
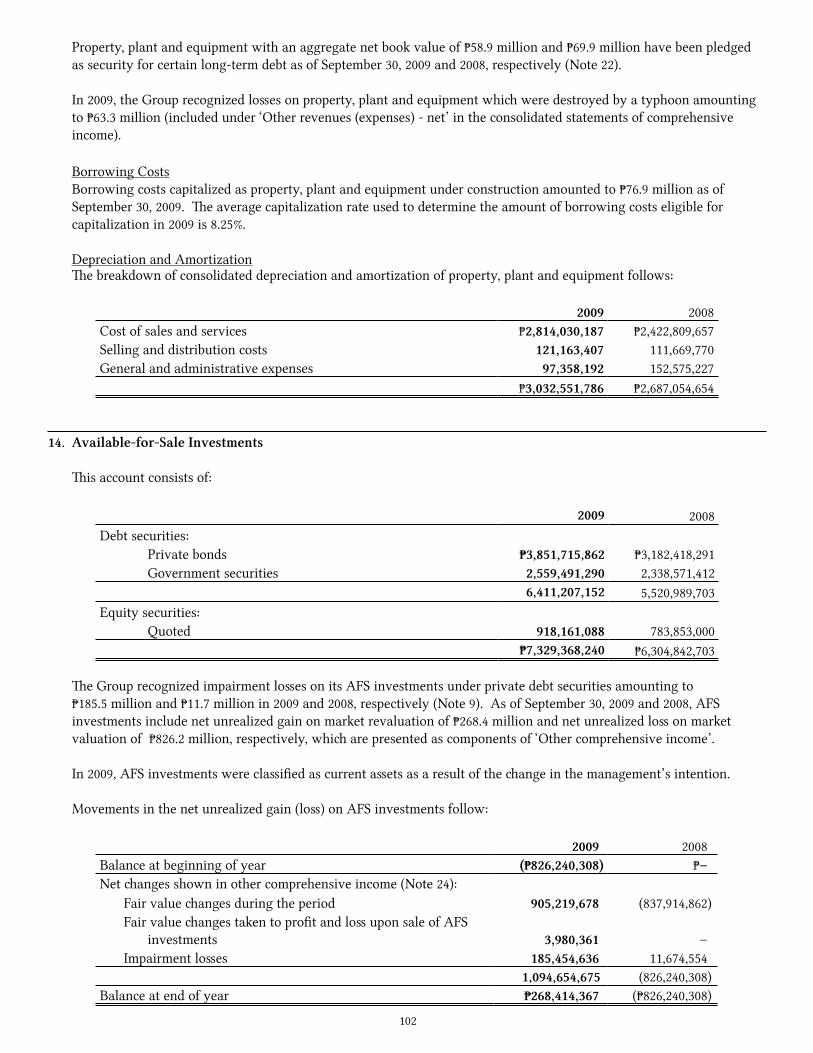
102
Property, plant and equipment with an aggregate net book value of ₱58.9 million and ₱69.9 million have been pledged as security for certain long-term debt as of September 30, 2009 and 2008, respectively (Note 22).
In 2009, the Group recognized losses on property, plant and equipment which were destroyed by a typhoon amounting to ₱63.3 million (included under ‘Other revenues (expenses) - net’ in the consolidated statements of comprehensive income).
Borrowing CostsBorrowing costs capitalized as property, plant and equipment under construction amounted to ₱76.9 million as of September 30, 2009. The average capitalization rate used to determine the amount of borrowing costs eligible for capitalization in 2009 is 8.25%.
Depreciation and AmortizationThe breakdown of consolidated depreciation and amortization of property, plant and equipment follows:
2009 2008Cost of sales and services ₱2,814,030,187 ₱2,422,809,657Selling and distribution costs 121,163,407 111,669,770General and administrative expenses 97,358,192 152,575,227
₱3,032,551,786 ₱2,687,054,654
14. Available-for-Sale Investments
This account consists of:
2009 2008Debt securities: Private bonds ₱3,851,715,862 ₱3,182,418,291 Government securities 2,559,491,290 2,338,571,412
6,411,207,152 5,520,989,703Equity securities: Quoted 918,161,088 783,853,000
₱7,329,368,240 ₱6,304,842,703
The Group recognized impairment losses on its AFS investments under private debt securities amounting to ₱185.5 million and ₱11.7 million in 2009 and 2008, respectively (Note 9). As of September 30, 2009 and 2008, AFS investments include net unrealized gain on market revaluation of ₱268.4 million and net unrealized loss on market valuation of ₱826.2 million, respectively, which are presented as components of ‘Other comprehensive income’.
In 2009, AFS investments were classified as current assets as a result of the change in the management’s intention.
Movements in the net unrealized gain (loss) on AFS investments follow:
2009 2008Balance at beginning of year (₱826,240,308) ₱–Net changes shown in other comprehensive income (Note 24): Fair value changes during the period 905,219,678 (837,914,862) Fair value changes taken to profit and loss upon sale of AFS
investments 3,980,361 – Impairment losses 185,454,636 11,674,554
1,094,654,675 (826,240,308)Balance at end of year ₱268,414,367 (₱826,240,308)
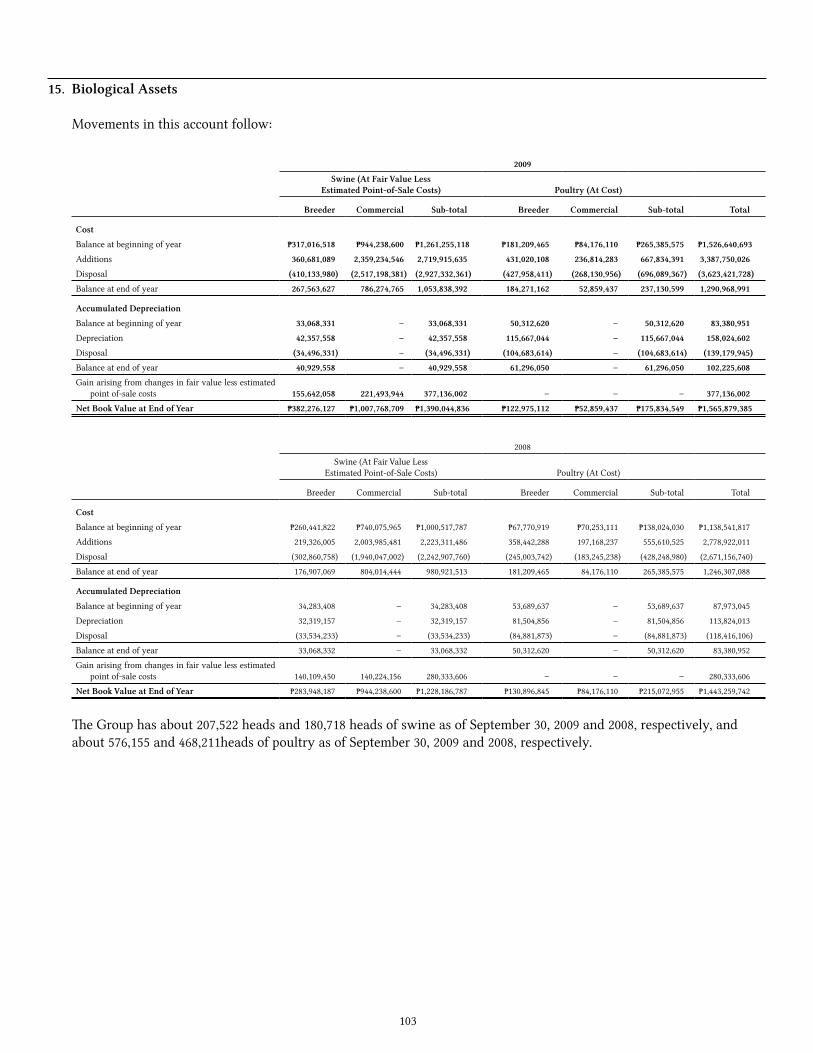
103
15. Biological Assets
Movements in this account follow:
2009
Swine (At Fair Value LessEstimated Point-of-Sale Costs) Poultry (At Cost)
Breeder Commercial Sub-total Breeder Commercial Sub-total Total
Cost
Balance at beginning of year ₱317,016,518 ₱944,238,600 ₱1,261,255,118 ₱181,209,465 ₱84,176,110 ₱265,385,575 ₱1,526,640,693
Additions 360,681,089 2,359,234,546 2,719,915,635 431,020,108 236,814,283 667,834,391 3,387,750,026
Disposal (410,133,980) (2,517,198,381) (2,927,332,361) (427,958,411) (268,130,956) (696,089,367) (3,623,421,728)
Balance at end of year 267,563,627 786,274,765 1,053,838,392 184,271,162 52,859,437 237,130,599 1,290,968,991
Accumulated Depreciation
Balance at beginning of year 33,068,331 – 33,068,331 50,312,620 – 50,312,620 83,380,951
Depreciation 42,357,558 – 42,357,558 115,667,044 – 115,667,044 158,024,602
Disposal (34,496,331) – (34,496,331) (104,683,614) – (104,683,614) (139,179,945)
Balance at end of year 40,929,558 – 40,929,558 61,296,050 – 61,296,050 102,225,608
Gain arising from changes in fair value less estimated point of-sale costs 155,642,058 221,493,944 377,136,002 – – – 377,136,002
Net Book Value at End of Year ₱382,276,127 ₱1,007,768,709 ₱1,390,044,836 ₱122,975,112 ₱52,859,437 ₱175,834,549 ₱1,565,879,385
2008
Swine (At Fair Value LessEstimated Point-of-Sale Costs) Poultry (At Cost)
Breeder Commercial Sub-total Breeder Commercial Sub-total Total
Cost
Balance at beginning of year ₱260,441,822 ₱740,075,965 ₱1,000,517,787 ₱67,770,919 ₱70,253,111 ₱138,024,030 ₱1,138,541,817
Additions 219,326,005 2,003,985,481 2,223,311,486 358,442,288 197,168,237 555,610,525 2,778,922,011
Disposal (302,860,758) (1,940,047,002) (2,242,907,760) (245,003,742) (183,245,238) (428,248,980) (2,671,156,740)
Balance at end of year 176,907,069 804,014,444 980,921,513 181,209,465 84,176,110 265,385,575 1,246,307,088
Accumulated Depreciation
Balance at beginning of year 34,283,408 – 34,283,408 53,689,637 – 53,689,637 87,973,045
Depreciation 32,319,157 – 32,319,157 81,504,856 – 81,504,856 113,824,013
Disposal (33,534,233) – (33,534,233) (84,881,873) – (84,881,873) (118,416,106)
Balance at end of year 33,068,332 – 33,068,332 50,312,620 – 50,312,620 83,380,952
Gain arising from changes in fair value less estimated point of-sale costs 140,109,450 140,224,156 280,333,606 – – – 280,333,606
Net Book Value at End of Year ₱283,948,187 ₱944,238,600 ₱1,228,186,787 ₱130,896,845 ₱84,176,110 ₱215,072,955 ₱1,443,259,742
The Group has about 207,522 heads and 180,718 heads of swine as of September 30, 2009 and 2008, respectively, and about 576,155 and 468,211heads of poultry as of September 30, 2009 and 2008, respectively.
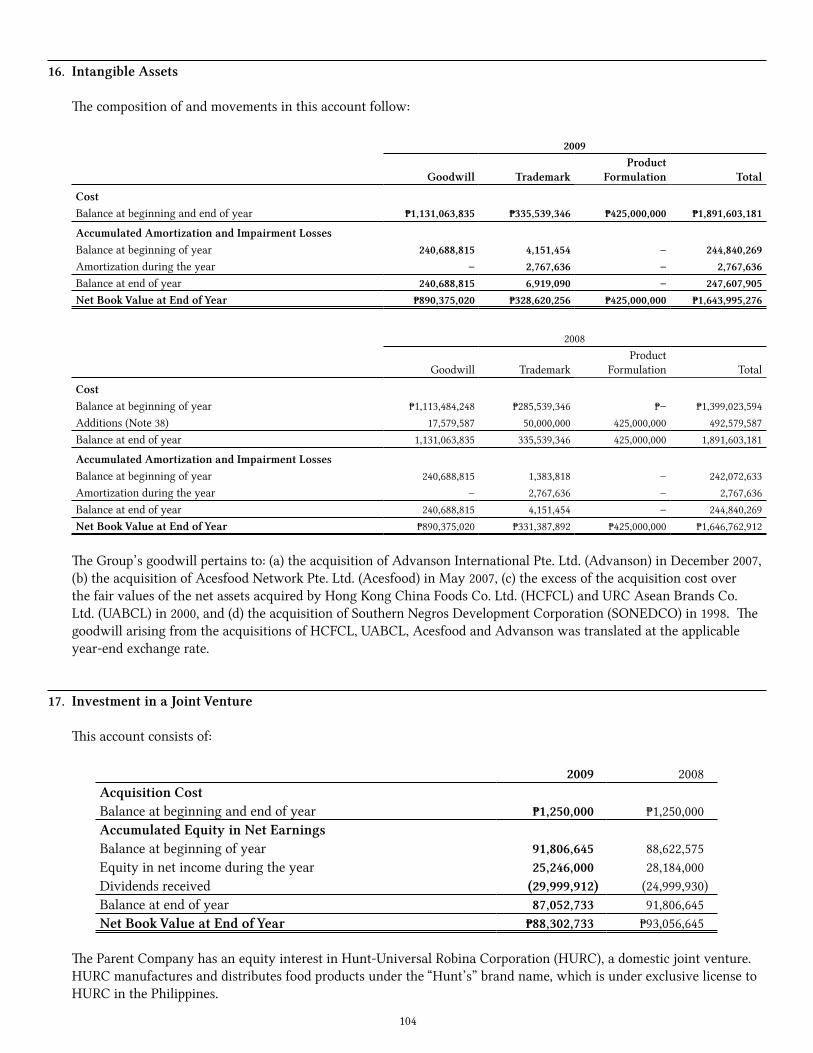
104
16. Intangible Assets
The composition of and movements in this account follow:
2009
Goodwill TrademarkProduct
Formulation Total
CostBalance at beginning and end of year ₱1,131,063,835 ₱335,539,346 ₱425,000,000 ₱1,891,603,181
Accumulated Amortization and Impairment LossesBalance at beginning of year 240,688,815 4,151,454 – 244,840,269Amortization during the year – 2,767,636 – 2,767,636Balance at end of year 240,688,815 6,919,090 – 247,607,905Net Book Value at End of Year ₱890,375,020 ₱328,620,256 ₱425,000,000 ₱1,643,995,276
2008
Goodwill TrademarkProduct
Formulation Total
CostBalance at beginning of year ₱1,113,484,248 ₱285,539,346 ₱– ₱1,399,023,594Additions (Note 38) 17,579,587 50,000,000 425,000,000 492,579,587Balance at end of year 1,131,063,835 335,539,346 425,000,000 1,891,603,181
Accumulated Amortization and Impairment LossesBalance at beginning of year 240,688,815 1,383,818 – 242,072,633Amortization during the year – 2,767,636 – 2,767,636Balance at end of year 240,688,815 4,151,454 – 244,840,269Net Book Value at End of Year ₱890,375,020 ₱331,387,892 ₱425,000,000 ₱1,646,762,912
The Group’s goodwill pertains to: (a) the acquisition of Advanson International Pte. Ltd. (Advanson) in December 2007, (b) the acquisition of Acesfood Network Pte. Ltd. (Acesfood) in May 2007, (c) the excess of the acquisition cost over the fair values of the net assets acquired by Hong Kong China Foods Co. Ltd. (HCFCL) and URC Asean Brands Co. Ltd. (UABCL) in 2000, and (d) the acquisition of Southern Negros Development Corporation (SONEDCO) in 1998. The goodwill arising from the acquisitions of HCFCL, UABCL, Acesfood and Advanson was translated at the applicable year-end exchange rate.
17. Investment in a Joint Venture
This account consists of:
2009 2008Acquisition CostBalance at beginning and end of year ₱1,250,000 ₱1,250,000Accumulated Equity in Net EarningsBalance at beginning of year 91,806,645 88,622,575Equity in net income during the year 25,246,000 28,184,000Dividends received (29,999,912) (24,999,930)Balance at end of year 87,052,733 91,806,645Net Book Value at End of Year ₱88,302,733 ₱93,056,645
The Parent Company has an equity interest in Hunt-Universal Robina Corporation (HURC), a domestic joint venture. HURC manufactures and distributes food products under the “Hunt’s” brand name, which is under exclusive license to HURC in the Philippines.

105
The Parent Company also had an equity interest in Robinsons Land Corporation (RLC), where it exercised significant influence. In 2007, the Parent Company sold its investment in RLC. Total gain on sale of said investments in common shares of RLC amounted to ₱2.9 billion.
The Parent Company’s equity in the net assets of HURC and its related percentage of ownership is summarized below:
Percentage of Ownership Equity in Net Assets
2009 2008 2009 2008
(In Million Pesos)HURC 50.0 50.0 ₱88.3 ₱93.1
Summarized financial information of HURC as of September 30, 2009 and 2008 which are accounted for under the equity method follows:
2009 2008(In Thousand Pesos)
Current assets ₱291,758 ₱313,482Noncurrent assets 11,833 7,105Current liabilities 221,756 (231,486)Noncurrent liabilities 8,000 (6,473)Revenue 769,090 733,742Costs and expenses (694,616) (649,024)Net income 51,206 55,417
18. Investment Properties
Movements in this account follow:
2009 2008CostBalance at beginning and end of year ₱107,947,364 ₱107,947,364Accumulated DepreciationBalance at beginning of year 28,943,780 25,345,535Depreciation 3,598,245 3,598,245Balance at end of year 32,542,025 28,943,780Net Book Value at End of Year ₱75,405,339 ₱79,003,584
The investment properties consist of building and plant which are made available for lease to third parties.
The aggregate fair value of the Group’s investment properties amounted to ₱192.4 million and ₱240.0 million as of September 30, 2009 and 2008, respectively. The fair values of investment properties have been determined by qualified independent appraisers. The fair value represents the amount at which the assets could be exchanged between a knowledgeable, willing buyer and knowledgeable, willing seller in an arm’s length transaction at the date of valuation.
Total rental income earned from investment properties (included under ‘Other revenue (expenses) - net’ in the consolidated statements of comprehensive income) amounted to ₱56.8 million, ₱55.4 million and ₱50.3 million in 2009, 2008 and 2007, respectively. Direct operating expenses (included under ‘General and administrative expenses’ in the consolidated statements of comprehensive income) arising from investment properties amounted to ₱0.2 million in 2009, 2008 and 2007, respectively.
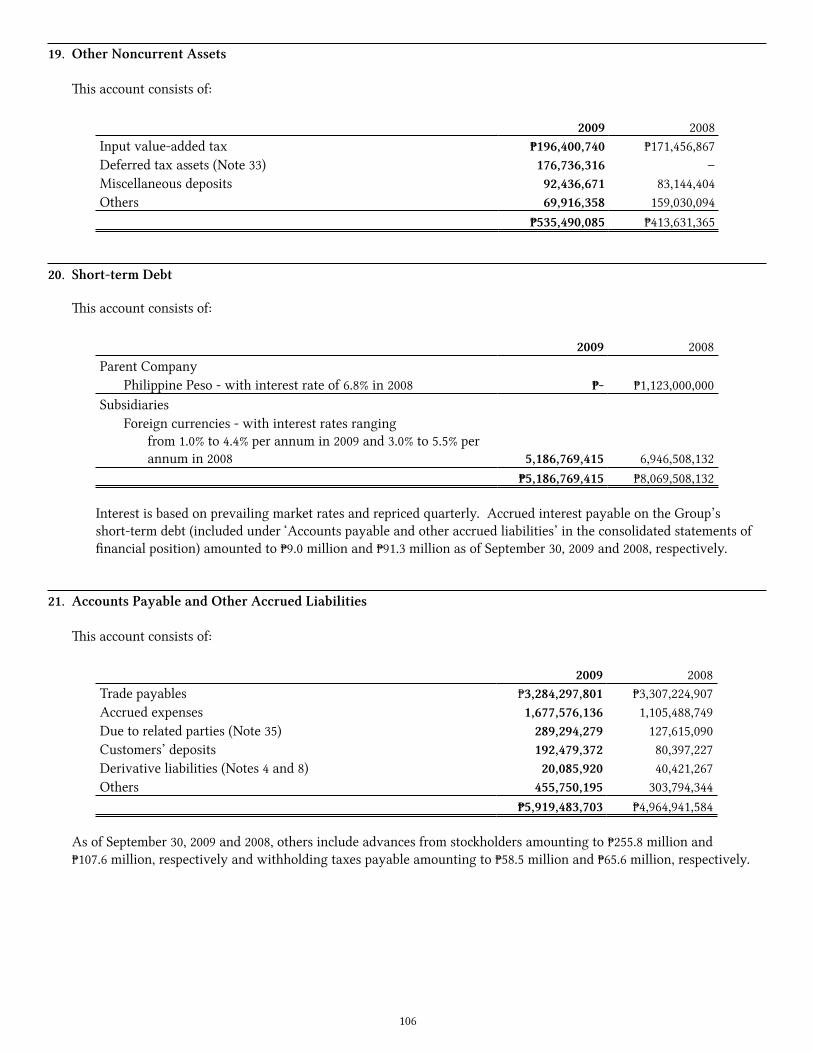
106
19. Other Noncurrent Assets
This account consists of:
2009 2008Input value-added tax ₱196,400,740 ₱171,456,867Deferred tax assets (Note 33) 176,736,316 –Miscellaneous deposits 92,436,671 83,144,404Others 69,916,358 159,030,094
₱535,490,085 ₱413,631,365
20. Short-term Debt
This account consists of:
2009 2008Parent Company Philippine Peso - with interest rate of 6.8% in 2008 ₱- ₱1,123,000,000Subsidiaries Foreign currencies - with interest rates ranging
from 1.0% to 4.4% per annum in 2009 and 3.0% to 5.5% per annum in 2008 5,186,769,415 6,946,508,132
₱5,186,769,415 ₱8,069,508,132
Interest is based on prevailing market rates and repriced quarterly. Accrued interest payable on the Group’s short-term debt (included under ‘Accounts payable and other accrued liabilities’ in the consolidated statements of financial position) amounted to ₱9.0 million and ₱91.3 million as of September 30, 2009 and 2008, respectively.
21. Accounts Payable and Other Accrued Liabilities
This account consists of:
2009 2008Trade payables ₱3,284,297,801 ₱3,307,224,907Accrued expenses 1,677,576,136 1,105,488,749Due to related parties (Note 35) 289,294,279 127,615,090Customers’ deposits 192,479,372 80,397,227Derivative liabilities (Notes 4 and 8) 20,085,920 40,421,267Others 455,750,195 303,794,344
₱5,919,483,703 ₱4,964,941,584
As of September 30, 2009 and 2008, others include advances from stockholders amounting to ₱255.8 million and₱107.6 million, respectively and withholding taxes payable amounting to ₱58.5 million and ₱65.6 million, respectively.
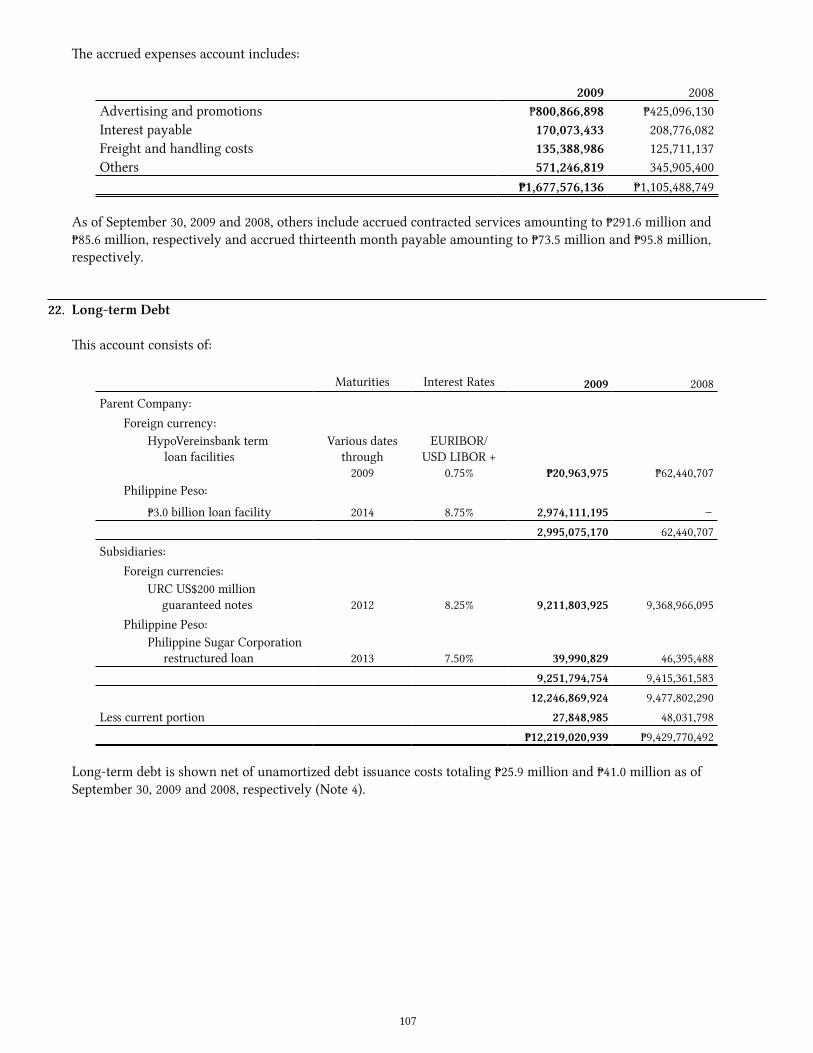
107
The accrued expenses account includes:
2009 2008Advertising and promotions ₱800,866,898 ₱425,096,130Interest payable 170,073,433 208,776,082Freight and handling costs 135,388,986 125,711,137Others 571,246,819 345,905,400
₱1,677,576,136 ₱1,105,488,749
As of September 30, 2009 and 2008, others include accrued contracted services amounting to ₱291.6 million and ₱85.6 million, respectively and accrued thirteenth month payable amounting to ₱73.5 million and ₱95.8 million, respectively.
22. Long-term Debt
This account consists of:
Maturities Interest Rates 2009 2008Parent Company:
Foreign currency:HypoVereinsbank term loan facilities
Various dates through
2009
EURIBOR/ USD LIBOR +
0.75% ₱20,963,975 ₱62,440,707 Philippine Peso:
₱3.0 billion loan facility 2014 8.75% 2,974,111,195 –2,995,075,170 62,440,707
Subsidiaries:Foreign currencies:
URC US$200 million guaranteed notes 2012 8.25% 9,211,803,925 9,368,966,095
Philippine Peso:Philippine Sugar Corporation
restructured loan
2013 7.50% 39,990,829 46,395,4889,251,794,754 9,415,361,583
12,246,869,924 9,477,802,290Less current portion 27,848,985 48,031,798
₱12,219,020,939 ₱9,429,770,492
Long-term debt is shown net of unamortized debt issuance costs totaling ₱25.9 million and ₱41.0 million as of September 30, 2009 and 2008, respectively (Note 4).
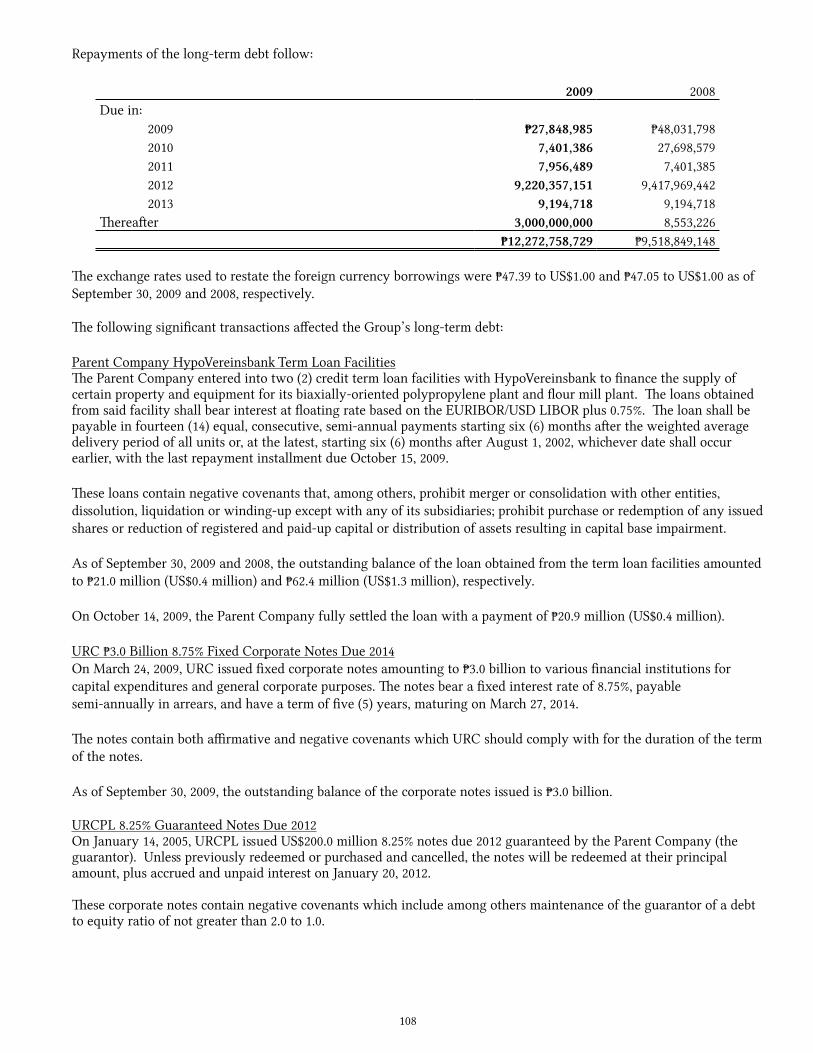
108
Repayments of the long-term debt follow:
2009 2008Due in: 2009 ₱27,848,985 ₱48,031,798 2010 7,401,386 27,698,579 2011 7,956,489 7,401,385 2012 9,220,357,151 9,417,969,442 2013 9,194,718 9,194,718Thereafter 3,000,000,000 8,553,226
₱12,272,758,729 ₱9,518,849,148
The exchange rates used to restate the foreign currency borrowings were ₱47.39 to US$1.00 and ₱47.05 to US$1.00 as of September 30, 2009 and 2008, respectively.
The following significant transactions affected the Group’s long-term debt:
Parent Company HypoVereinsbank Term Loan FacilitiesThe Parent Company entered into two (2) credit term loan facilities with HypoVereinsbank to finance the supply of certain property and equipment for its biaxially-oriented polypropylene plant and flour mill plant. The loans obtained from said facility shall bear interest at floating rate based on the EURIBOR/USD LIBOR plus 0.75%. The loan shall be payable in fourteen (14) equal, consecutive, semi-annual payments starting six (6) months after the weighted average delivery period of all units or, at the latest, starting six (6) months after August 1, 2002, whichever date shall occur earlier, with the last repayment installment due October 15, 2009.
These loans contain negative covenants that, among others, prohibit merger or consolidation with other entities, dissolution, liquidation or winding-up except with any of its subsidiaries; prohibit purchase or redemption of any issued shares or reduction of registered and paid-up capital or distribution of assets resulting in capital base impairment.
As of September 30, 2009 and 2008, the outstanding balance of the loan obtained from the term loan facilities amounted to ₱21.0 million (US$0.4 million) and ₱62.4 million (US$1.3 million), respectively.
On October 14, 2009, the Parent Company fully settled the loan with a payment of ₱20.9 million (US$0.4 million).
URC ₱3.0 Billion 8.75% Fixed Corporate Notes Due 2014On March 24, 2009, URC issued fixed corporate notes amounting to ₱3.0 billion to various financial institutions for capital expenditures and general corporate purposes. The notes bear a fixed interest rate of 8.75%, payable semi-annually in arrears, and have a term of five (5) years, maturing on March 27, 2014.
The notes contain both affirmative and negative covenants which URC should comply with for the duration of the term of the notes.
As of September 30, 2009, the outstanding balance of the corporate notes issued is ₱3.0 billion.
URCPL 8.25% Guaranteed Notes Due 2012On January 14, 2005, URCPL issued US$200.0 million 8.25% notes due 2012 guaranteed by the Parent Company (the guarantor). Unless previously redeemed or purchased and cancelled, the notes will be redeemed at their principal amount, plus accrued and unpaid interest on January 20, 2012.
These corporate notes contain negative covenants which include among others maintenance of the guarantor of a debt to equity ratio of not greater than 2.0 to 1.0.

109
Reacquisition of bondsOn October 29, 2008, the Group reacquired a portion of its bonds payable with a face value of ₱241.7 million (US$5.0 million) for a total proceeds of ₱228.0 million (US$4.5 million). The Group recognized gain on reacquisition of bonds amounting to ₱20.8 million (included under ‘Other revenues (expenses) - net’ in the consolidated statements of comprehensive income).
As of September 30, 2009 and 2008, the outstanding balance of the notes amounted to ₱9.2 billion (US$194.4 million) and ₱9.4 billion (US$199.1 million), respectively.
Philippine Sugar Corporation Restructured LoanRepublic Act (RA) No. 7202 dated February 24, 1992 provided for, among others, the condonation of all penalties and surcharges on loans granted to sugar producers from crop year 1974-1975 up to and including 1984-1985. The guidelines for the implementation of RA No. 7202 was issued under Executive Order No. 31 dated October 29, 1992, directing all government lending financial institutions to write off from their respective books the interest in excess of 12% yearly and all penalties and surcharges due.
Certain property and equipment of subsidiary with a net book value of ₱58.9 million and ₱69.9 million as of September 30, 2009 and 2008, respectively, were used to secure the loan. The loan is payable in 25 equal annual amortizations of ₱9.9 million. Unpaid interest on the loan amounted to ₱2.3 million and ₱156.3 million as of September 30, 2009 and 2008, respectively.
Total interest expense and other related charges on all of these long-term debts amounted to ₱920.2 million, ₱806.9 million and ₱1.4 billion in 2009, 2008 and 2007, respectively (Note 31).
23. Equity
The details of the Parent Company’s common stock follow:
2009 2008 2007Authorized shares 2,998,000,000 2,998,000,000 2,998,000,000Par value per share ₱1.00 ₱1.00 ₱1.00Issued shares: Balance at beginning of year 2,221,851,481 2,221,851,481 2,221,851,481 Issuance of common shares of stock during the year 5,787,452 – – Balance at end of year 2,227,638,933 2,221,851,481 2,221,851,481
Capital ManagementThe primary objective of the Group’s capital management is to ensure that it maintains healthy capital ratios in order to support its business and maximize shareholder value. The Group manages its capital structure and makes adjustments to these ratios in light of changes in economic conditions and the risk characteristics of its activities. In order to maintain or adjust the capital structure, the Group may adjust the amount of dividend payment to shareholders, return capital structure or issue capital securities. No changes have been made in the objective, policies and processes as they have been applied in previous years.
The Group monitors its use of capital structure using a debt-to-capital ratio which is gross debt divided by total capital. The Group includes within gross debt all interest-bearing loans and borrowings, while capital represents total equity. Following is a computation of the Group’s debt-to-capital ratio as of September 30, 2009 and 2008.

110
2009 2008(a) Short-term debt ₱5,186,769,415 ₱8,069,508,132 Trust receipts payable 478,448,886 3,000,776,510 Long-term debt 12,246,869,924 9,477,802,290
₱17,912,088,225 ₱20,548,086,932(b) Capital ₱36,486,330,439 ₱32,144,429,756(c) Debt-to-capital ratio (a/b) 0.49:1 0.64:1
The Group’s policy is to not to exceed a debt-to-capital ratio of 2:1 level. The Group considers its total equity as capital and the Group is not subject to externally imposed capital requirements.
Cumulative Redeemable Preferred SharesThe Group’s authorized preferred shares of stock are 12% cumulative, nonparticipating, and nonvoting. In case of dissolution and liquidation of the Parent Company, the holders of the preferred shares shall be entitled to be paid an amount equal to the par value of the shares or ratably insofar as the assets of the Parent Company may warrant, plus accrued and unpaid dividends thereon, if any, before the holders of the common shares of stock can be paid their liquidating dividends. The authorized preferred stock is 2,000,000 shares at par value of ₱1.0 per share. There have been no issuances of preferred stock as of September 30, 2009 and 2008.
Deposits for Future Stock SubscriptionsOn August 3, 2001, the Parent Company’s BOD approved the issuance of 55.7 million shares to JGSHI, Robinson’s Supermarket Corporation and a certain stockholder in exchange for two (2) parcels of land and certain marketable securities which were valued at ₱250.5 million. This was reflected as Deposits for future stock subscriptions in the consolidated statements of financial position pending approval of the Philippine SEC.
On June 19, 2003, the Philippine SEC approved the issuance of 49.9 million shares for the two (2) parcels of land.
Retained EarningsDividendsDetails of the Group’s dividend declarations follow:
2009 2008 2007Date of declaration April 16, 2009 April 17, 2008 April 19, 2007Dividend per share ₱0.25 ₱0.68 ₱0.68Total dividends ₱0.5 billion ₱1.5 billion ₱1.5 billionDate of record May 15, 2009 May 16, 2008 May 18, 2007Date of payment June 10, 2009 June 12, 2008 June 14, 2007
The Group intends to maintain an annual cash dividend payment ratio of 50.0% of the Group’s consolidated net income from the preceding fiscal year, subject to the requirements of the applicable laws and regulations and the absence of circumstances which may restrict the payment of such dividends. The BOD may, at any time, modify such dividend payment ratio.
Appropriation of retained earningsIn 2003, the Group’s BOD approved the appropriation of retained earnings amounting to ₱3.0 billion for the Group’s expansion plans.
Treasury SharesOn November 13, 2007, the Group’s BOD approved the creation and implementation of a share buy-back program allotting up to ₱2.5 billion to reacquire a portion of the Parent Company’s issued and outstanding common shares, representing approximately 7.63% of current market capitalization.
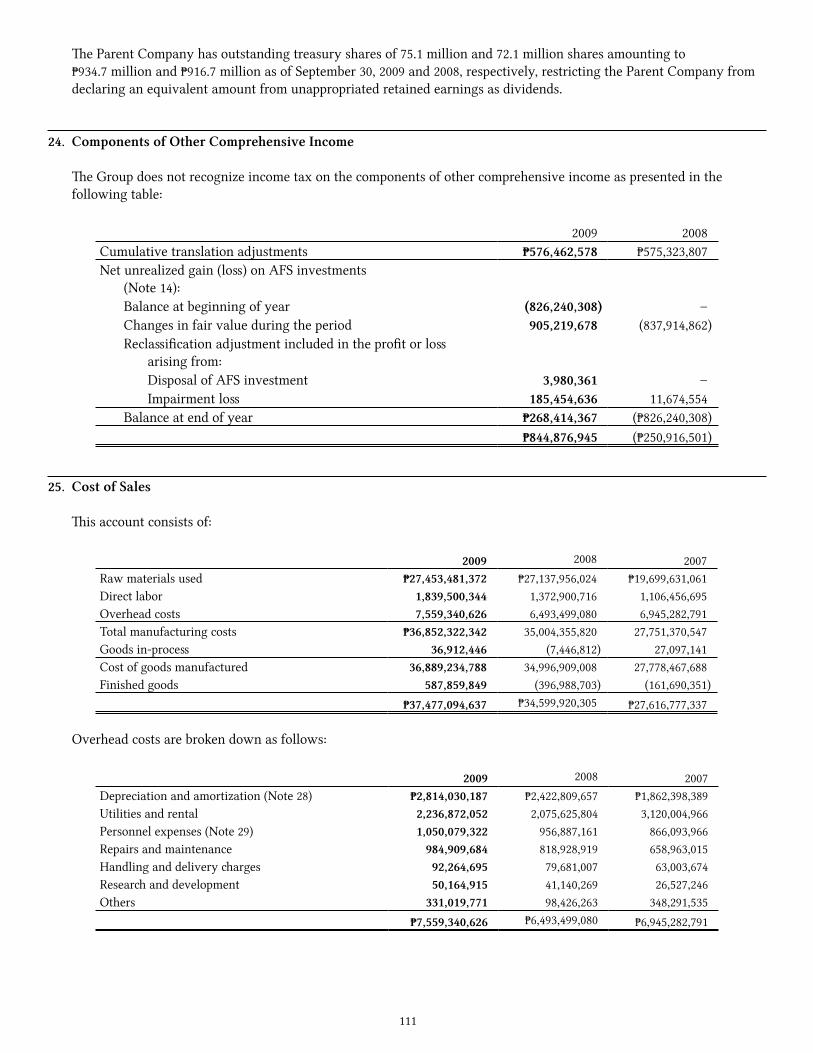
111
The Parent Company has outstanding treasury shares of 75.1 million and 72.1 million shares amounting to ₱934.7 million and ₱916.7 million as of September 30, 2009 and 2008, respectively, restricting the Parent Company from declaring an equivalent amount from unappropriated retained earnings as dividends.
24. Components of Other Comprehensive Income
The Group does not recognize income tax on the components of other comprehensive income as presented in the following table:
2009 2008Cumulative translation adjustments ₱576,462,578 ₱575,323,807Net unrealized gain (loss) on AFS investments (Note 14): Balance at beginning of year (826,240,308) – Changes in fair value during the period 905,219,678 (837,914,862) Reclassification adjustment included in the profit or loss
arising from: Disposal of AFS investment 3,980,361 – Impairment loss 185,454,636 11,674,554 Balance at end of year ₱268,414,367 (₱826,240,308)
₱844,876,945 (₱250,916,501)
25. Cost of Sales
This account consists of:
2009 2008 2007Raw materials used ₱27,453,481,372 ₱27,137,956,024 ₱19,699,631,061Direct labor 1,839,500,344 1,372,900,716 1,106,456,695Overhead costs 7,559,340,626 6,493,499,080 6,945,282,791Total manufacturing costs ₱36,852,322,342 35,004,355,820 27,751,370,547Goods in-process 36,912,446 (7,446,812) 27,097,141Cost of goods manufactured 36,889,234,788 34,996,909,008 27,778,467,688Finished goods 587,859,849 (396,988,703) (161,690,351)
₱37,477,094,637 ₱34,599,920,305 ₱27,616,777,337
Overhead costs are broken down as follows:
2009 2008 2007Depreciation and amortization (Note 28) ₱2,814,030,187 ₱2,422,809,657 ₱1,862,398,389Utilities and rental 2,236,872,052 2,075,625,804 3,120,004,966Personnel expenses (Note 29) 1,050,079,322 956,887,161 866,093,966Repairs and maintenance 984,909,684 818,928,919 658,963,015Handling and delivery charges 92,264,695 79,681,007 63,003,674Research and development 50,164,915 41,140,269 26,527,246Others 331,019,771 98,426,263 348,291,535
₱7,559,340,626 ₱6,493,499,080 ₱6,945,282,791
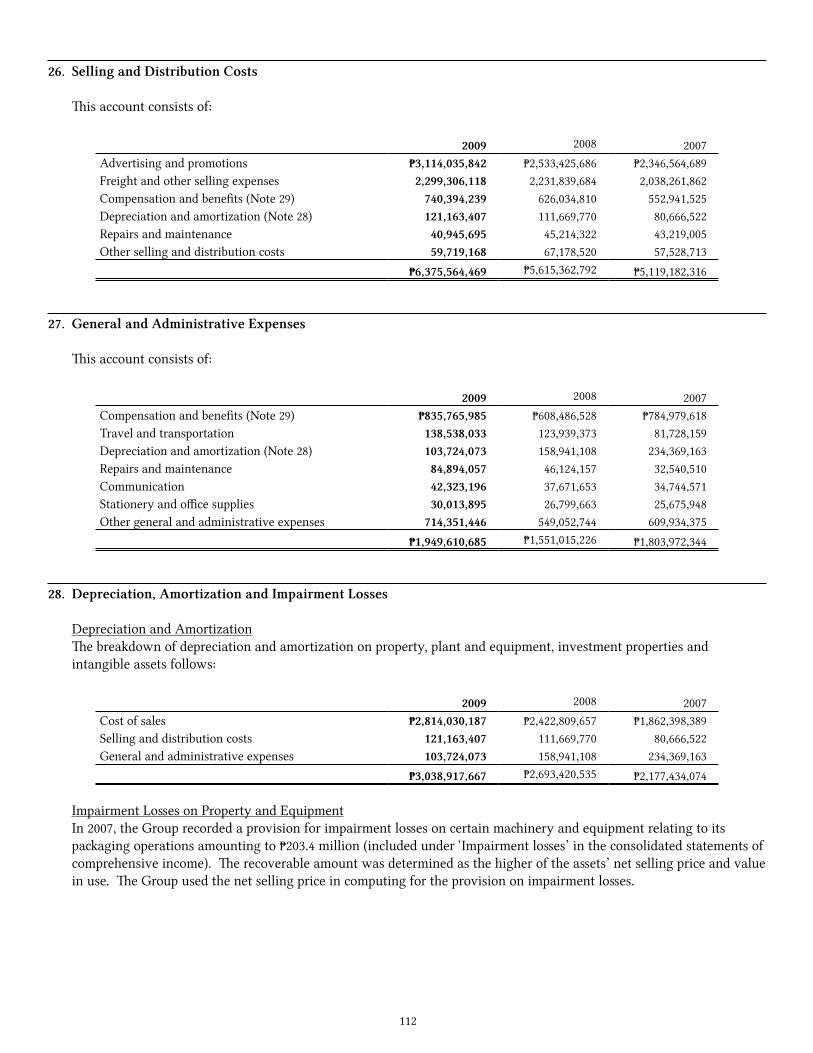
112
26. Selling and Distribution Costs
This account consists of:
2009 2008 2007Advertising and promotions ₱3,114,035,842 ₱2,533,425,686 ₱2,346,564,689Freight and other selling expenses 2,299,306,118 2,231,839,684 2,038,261,862Compensation and benefits (Note 29) 740,394,239 626,034,810 552,941,525Depreciation and amortization (Note 28) 121,163,407 111,669,770 80,666,522Repairs and maintenance 40,945,695 45,214,322 43,219,005Other selling and distribution costs 59,719,168 67,178,520 57,528,713
₱6,375,564,469 ₱5,615,362,792 ₱5,119,182,316
27. General and Administrative Expenses
This account consists of:
2009 2008 2007Compensation and benefits (Note 29) ₱835,765,985 ₱608,486,528 ₱784,979,618Travel and transportation 138,538,033 123,939,373 81,728,159Depreciation and amortization (Note 28) 103,724,073 158,941,108 234,369,163Repairs and maintenance 84,894,057 46,124,157 32,540,510Communication 42,323,196 37,671,653 34,744,571Stationery and office supplies 30,013,895 26,799,663 25,675,948Other general and administrative expenses 714,351,446 549,052,744 609,934,375
₱1,949,610,685 ₱1,551,015,226 ₱1,803,972,344
28. Depreciation, Amortization and Impairment Losses
Depreciation and AmortizationThe breakdown of depreciation and amortization on property, plant and equipment, investment properties and intangible assets follows:
2009 2008 2007Cost of sales ₱2,814,030,187 ₱2,422,809,657 ₱1,862,398,389Selling and distribution costs 121,163,407 111,669,770 80,666,522General and administrative expenses 103,724,073 158,941,108 234,369,163
₱3,038,917,667 ₱2,693,420,535 ₱2,177,434,074
Impairment Losses on Property and EquipmentIn 2007, the Group recorded a provision for impairment losses on certain machinery and equipment relating to its packaging operations amounting to ₱203.4 million (included under ‘Impairment losses’ in the consolidated statements of comprehensive income). The recoverable amount was determined as the higher of the assets’ net selling price and value in use. The Group used the net selling price in computing for the provision on impairment losses.
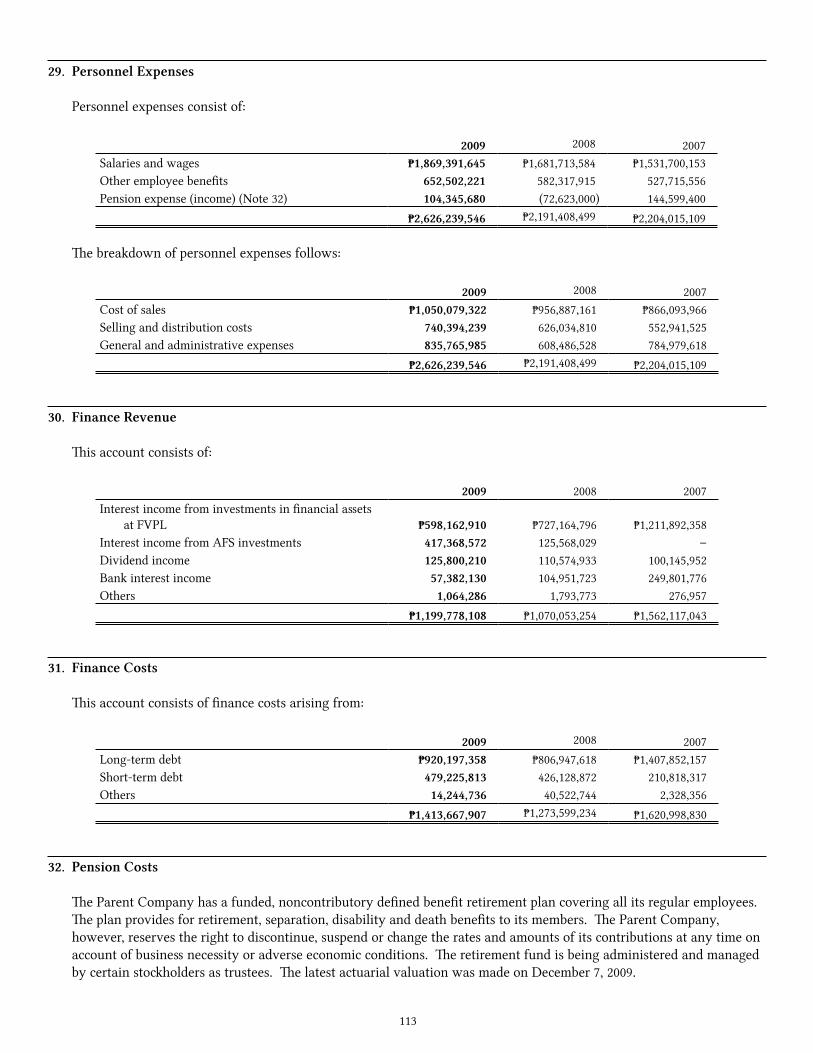
113
29. Personnel Expenses
Personnel expenses consist of:
2009 2008 2007Salaries and wages ₱1,869,391,645 ₱1,681,713,584 ₱1,531,700,153Other employee benefits 652,502,221 582,317,915 527,715,556Pension expense (income) (Note 32) 104,345,680 (72,623,000) 144,599,400
₱2,626,239,546 ₱2,191,408,499 ₱2,204,015,109
The breakdown of personnel expenses follows:
2009 2008 2007Cost of sales ₱1,050,079,322 ₱956,887,161 ₱866,093,966Selling and distribution costs 740,394,239 626,034,810 552,941,525General and administrative expenses 835,765,985 608,486,528 784,979,618
₱2,626,239,546 ₱2,191,408,499 ₱2,204,015,109
30. Finance Revenue
This account consists of:
2009 2008 2007Interest income from investments in financial assets
at FVPL ₱598,162,910 ₱727,164,796 ₱1,211,892,358Interest income from AFS investments 417,368,572 125,568,029 –Dividend income 125,800,210 110,574,933 100,145,952Bank interest income 57,382,130 104,951,723 249,801,776Others 1,064,286 1,793,773 276,957
₱1,199,778,108 ₱1,070,053,254 ₱1,562,117,043
31. Finance Costs
This account consists of finance costs arising from:
2009 2008 2007Long-term debt ₱920,197,358 ₱806,947,618 ₱1,407,852,157Short-term debt 479,225,813 426,128,872 210,818,317Others 14,244,736 40,522,744 2,328,356
₱1,413,667,907 ₱1,273,599,234 ₱1,620,998,830
32. Pension Costs
The Parent Company has a funded, noncontributory defined benefit retirement plan covering all its regular employees. The plan provides for retirement, separation, disability and death benefits to its members. The Parent Company, however, reserves the right to discontinue, suspend or change the rates and amounts of its contributions at any time on account of business necessity or adverse economic conditions. The retirement fund is being administered and managed by certain stockholders as trustees. The latest actuarial valuation was made on December 7, 2009.

114
The following tables summarize the components of net pension expense (income) recognized in the Parent Company’s statements of comprehensive income, and the funded status and amounts recognized in the statements of financial position.
The amounts recognized in the Parent Company’s statements of financial position follow:
2009 2008Present value of funded obligation ₱1,038,335,900 ₱1,113,492,800Fair value of plan assets 1,354,691,200 1,341,210,300Funded status 316,355,300 227,717,500Unrecognized actuarial (gain) losses - net (122,990,200) 16,093,100Less asset not recognized due to limit 52,346,900 –Net plan assets ₱141,018,200 ₱243,810,600Asset limit to be recognized in the consolidated statements of
financial position ₱141,018,200 ₱243,810,600Net plan assets in excess of the asset ceiling limit (not recognized in
the consolidated statements of financial position) ₱52,346,900 ₱–
As of September 30, 2009 and 2008, the asset ceiling test follows:
2009 2008(a) Retirement asset ₱141,018,200 ₱243,810,600(b) Asset ceiling limit i. Unrecognized actuarial (gain) loss (122,990,200) 16,093,100 ii. Present value of available reduction in future contributions 316,355,300 227,717,500 Limit 193,365,100 243,810,600Lower of (a) and (b) ₱141,018,200 ₱243,810,600
Components of the Parent Company’s pension expense (income) follow:
2009 2008 2007Current service cost ₱32,126,200 ₱55,595,900 ₱47,374,300Interest cost 92,085,900 88,771,600 66,350,900Expected return on plan assets (73,766,600) (67,019,700) (81,406,000)Past service cost – 132,355,700 –Loss (gain) recognized under limit on net assets 52,346,900 (284,102,700) 111,492,900Total pension expense (income) ₱102,792,400 (₱74,399,200) ₱143,812,100
Past service costs recognized in 2008 were brought about by improvements in the Parent Company’s retirement plan.
Movements in the Parent Company’s present value of the defined benefit obligation follow:
2009 2008Balance at beginning of year ₱1,113,492,800 ₱934,438,200Current service cost 32,126,200 55,595,900Interest cost 92,085,900 88,771,600Past service cost – 132,355,700Benefits paid (66,676,400) (16,115,800)Actuarial gains (132,692,600) (81,552,800)Balance at end of year ₱1,038,335,900 ₱1,113,492,800
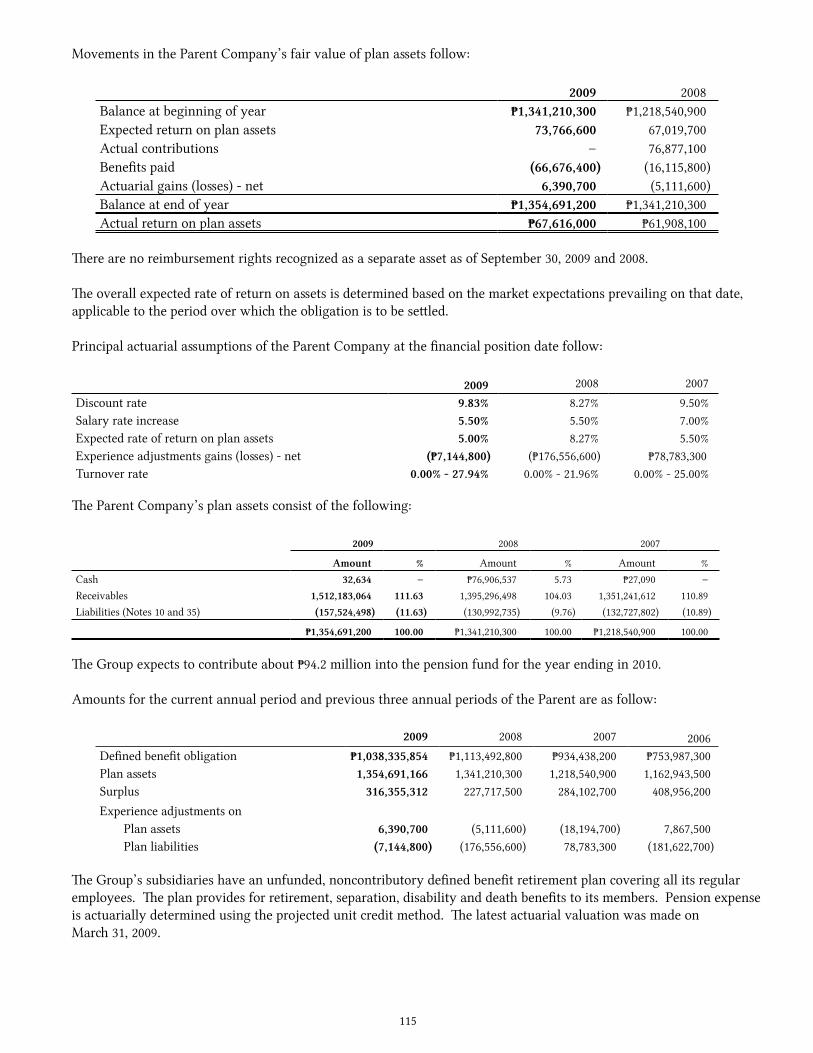
115
Movements in the Parent Company’s fair value of plan assets follow:
2009 2008Balance at beginning of year ₱1,341,210,300 ₱1,218,540,900Expected return on plan assets 73,766,600 67,019,700Actual contributions – 76,877,100Benefits paid (66,676,400) (16,115,800)Actuarial gains (losses) - net 6,390,700 (5,111,600)Balance at end of year ₱1,354,691,200 ₱1,341,210,300Actual return on plan assets ₱67,616,000 ₱61,908,100
There are no reimbursement rights recognized as a separate asset as of September 30, 2009 and 2008.
The overall expected rate of return on assets is determined based on the market expectations prevailing on that date, applicable to the period over which the obligation is to be settled.
Principal actuarial assumptions of the Parent Company at the financial position date follow:
2009 2008 2007Discount rate 9.83% 8.27% 9.50%Salary rate increase 5.50% 5.50% 7.00%Expected rate of return on plan assets 5.00% 8.27% 5.50%Experience adjustments gains (losses) - net (₱7,144,800) (₱176,556,600) ₱78,783,300Turnover rate 0.00% - 27.94% 0.00% - 21.96% 0.00% - 25.00%
The Parent Company’s plan assets consist of the following:
2009 2008 2007
Amount % Amount % Amount %Cash 32,634 – ₱76,906,537 5.73 ₱27,090 –Receivables 1,512,183,064 111.63 1,395,296,498 104.03 1,351,241,612 110.89Liabilities (Notes 10 and 35) (157,524,498) (11.63) (130,992,735) (9.76) (132,727,802) (10.89)
₱1,354,691,200 100.00 ₱1,341,210,300 100.00 ₱1,218,540,900 100.00
The Group expects to contribute about ₱94.2 million into the pension fund for the year ending in 2010.
Amounts for the current annual period and previous three annual periods of the Parent are as follow:
2009 2008 2007 2006Defined benefit obligation ₱1,038,335,854 ₱1,113,492,800 ₱934,438,200 ₱753,987,300Plan assets 1,354,691,166 1,341,210,300 1,218,540,900 1,162,943,500Surplus 316,355,312 227,717,500 284,102,700 408,956,200Experience adjustments on Plan assets 6,390,700 (5,111,600) (18,194,700) 7,867,500 Plan liabilities (7,144,800) (176,556,600) 78,783,300 (181,622,700)
The Group’s subsidiaries have an unfunded, noncontributory defined benefit retirement plan covering all its regular employees. The plan provides for retirement, separation, disability and death benefits to its members. Pension expense is actuarially determined using the projected unit credit method. The latest actuarial valuation was made on March 31, 2009.
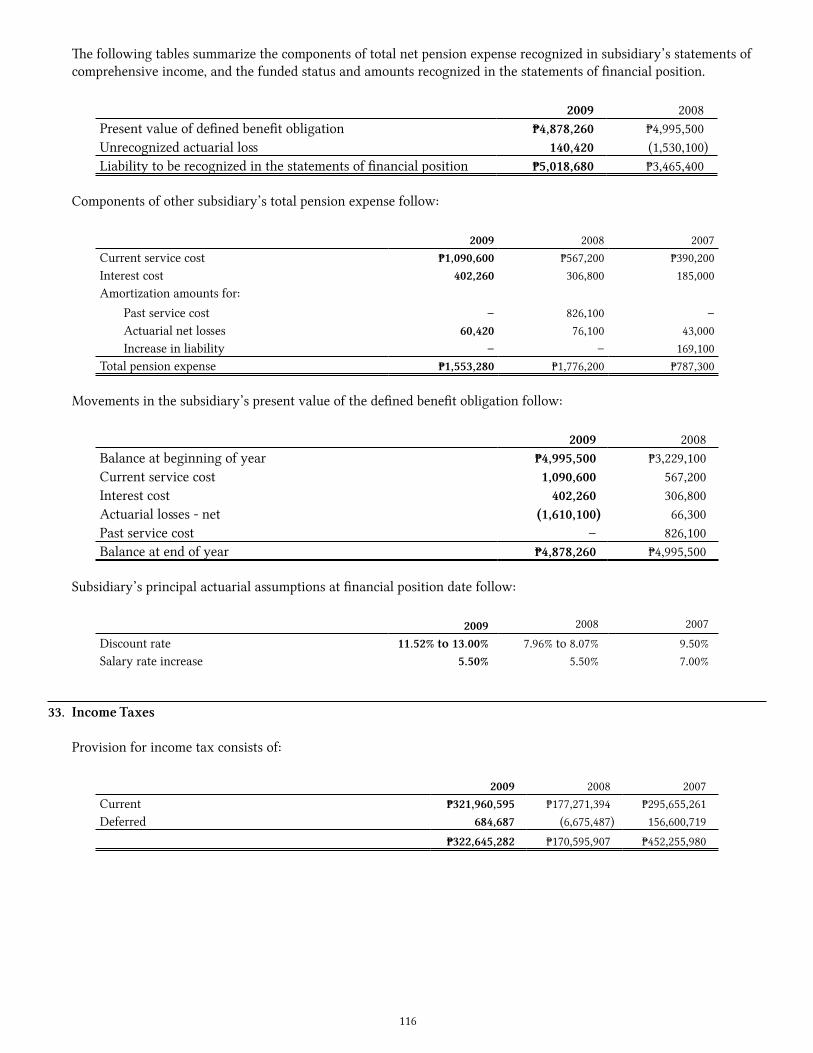
116
The following tables summarize the components of total net pension expense recognized in subsidiary’s statements of comprehensive income, and the funded status and amounts recognized in the statements of financial position.
2009 2008Present value of defined benefit obligation ₱4,878,260 ₱4,995,500Unrecognized actuarial loss 140,420 (1,530,100)Liability to be recognized in the statements of financial position ₱5,018,680 ₱3,465,400
Components of other subsidiary’s total pension expense follow:
2009 2008 2007Current service cost ₱1,090,600 ₱567,200 ₱390,200Interest cost 402,260 306,800 185,000Amortization amounts for: Past service cost – 826,100 – Actuarial net losses 60,420 76,100 43,000 Increase in liability – – 169,100Total pension expense ₱1,553,280 ₱1,776,200 ₱787,300
Movements in the subsidiary’s present value of the defined benefit obligation follow:
2009 2008Balance at beginning of year ₱4,995,500 ₱3,229,100Current service cost 1,090,600 567,200Interest cost 402,260 306,800Actuarial losses - net (1,610,100) 66,300Past service cost – 826,100Balance at end of year ₱4,878,260 ₱4,995,500
Subsidiary’s principal actuarial assumptions at financial position date follow:
2009 2008 2007Discount rate 11.52% to 13.00% 7.96% to 8.07% 9.50%Salary rate increase 5.50% 5.50% 7.00%
33. Income Taxes
Provision for income tax consists of:
2009 2008 2007Current ₱321,960,595 ₱177,271,394 ₱295,655,261Deferred 684,687 (6,675,487) 156,600,719
₱322,645,282 ₱170,595,907 ₱452,255,980
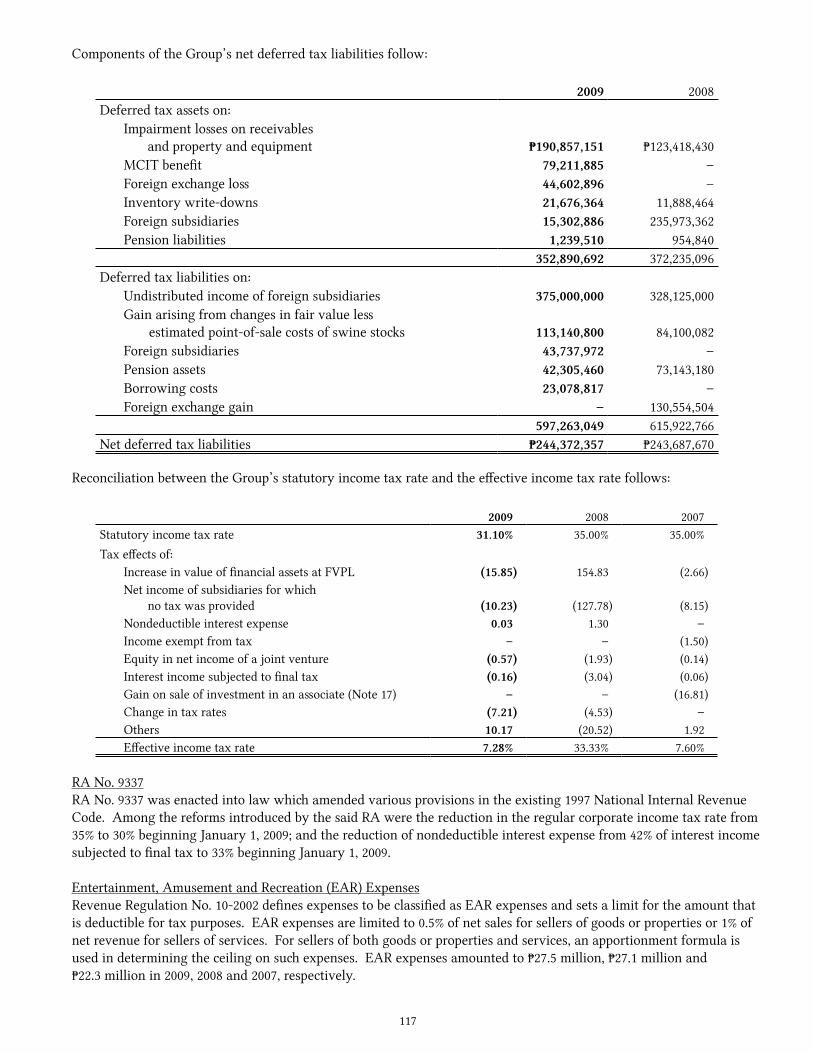
117
Components of the Group’s net deferred tax liabilities follow:
2009 2008Deferred tax assets on:
Impairment losses on receivables and property and equipment ₱190,857,151 ₱123,418,430
MCIT benefit 79,211,885 –Foreign exchange loss 44,602,896 –Inventory write-downs 21,676,364 11,888,464Foreign subsidiaries 15,302,886 235,973,362Pension liabilities 1,239,510 954,840
352,890,692 372,235,096Deferred tax liabilities on:
Undistributed income of foreign subsidiaries 375,000,000 328,125,000Gain arising from changes in fair value less
estimated point-of-sale costs of swine stocks 113,140,800 84,100,082Foreign subsidiaries 43,737,972 –Pension assets 42,305,460 73,143,180Borrowing costs 23,078,817 –Foreign exchange gain – 130,554,504
597,263,049 615,922,766Net deferred tax liabilities ₱244,372,357 ₱243,687,670
Reconciliation between the Group’s statutory income tax rate and the effective income tax rate follows:
2009 2008 2007Statutory income tax rate 31.10% 35.00% 35.00%Tax effects of: Increase in value of financial assets at FVPL (15.85) 154.83 (2.66) Net income of subsidiaries for which
no tax was provided (10.23) (127.78) (8.15) Nondeductible interest expense 0.03 1.30 – Income exempt from tax – – (1.50) Equity in net income of a joint venture (0.57) (1.93) (0.14) Interest income subjected to final tax (0.16) (3.04) (0.06) Gain on sale of investment in an associate (Note 17) – – (16.81) Change in tax rates (7.21) (4.53) – Others 10.17 (20.52) 1.92
Effective income tax rate 7.28% 33.33% 7.60%
RA No. 9337RA No. 9337 was enacted into law which amended various provisions in the existing 1997 National Internal Revenue Code. Among the reforms introduced by the said RA were the reduction in the regular corporate income tax rate from 35% to 30% beginning January 1, 2009; and the reduction of nondeductible interest expense from 42% of interest income subjected to final tax to 33% beginning January 1, 2009.
Entertainment, Amusement and Recreation (EAR) ExpensesRevenue Regulation No. 10-2002 defines expenses to be classified as EAR expenses and sets a limit for the amount that is deductible for tax purposes. EAR expenses are limited to 0.5% of net sales for sellers of goods or properties or 1% of net revenue for sellers of services. For sellers of both goods or properties and services, an apportionment formula is used in determining the ceiling on such expenses. EAR expenses amounted to ₱27.5 million, ₱27.1 million and ₱22.3 million in 2009, 2008 and 2007, respectively.

118
MCITAn MCIT of 2% on modified gross income is computed and compared with the RCIT. Any excess of the MCIT over RCIT is deferred and can be used as a tax credit against future income tax liability for the next three years. In 2009, the Parent Company has excess MCIT over RCIT amounting to ₱79.2 million for which the Parent Company recognized as deferred tax asset. The MCIT benefit will expire in 2012.
34. Earnings Per Share
The following reflects the income and share data used in the basic/dilutive EPS computations:
2009 2008 2007Net income attributable to equity holders of the
parent ₱3,887,366,522 ₱381,029,569 ₱5,556,978,624Weighted average number of common shares 2,149,408,719 2,180,503,348 2,221,851,481Basic/dilutive EPS ₱1.8 ₱0.2 ₱2.5
The weighted average number of common shares takes into account the treasury shares at year end. There have been no other transactions involving ordinary shares or potential ordinary shares between the reporting date and the date of completion of these consolidated financial statements.
There were no potential dilutive shares in 2009, 2008 and 2007.
35. Related Party Transactions
The Group, in the regular conduct of its business, has entered into transactions with JGSHI, its ultimate parent, and other related parties principally consisting of sales, purchases, advances and reimbursement of expenses, various guarantees, regular banking transactions, leases and, management and administrative service agreements.
Intercompany transactions are eliminated in the accompanying consolidated financial statements. Related party transactions not eliminated are as follows:
2009 2008Due from related parties (shown under Receivables account in the
consolidated statements of financial position) (Note 10): JG Philippines, Ltd. ₱632,391,779 ₱– Hongkong Peggy Foods, Inc. 421,852,322 – JGSHI 256,715,850 39,977,617 Digital Telecom. Philippines, Inc. (DTPI) 293,773,143 264,397,891 Cebu Air, Inc. 34,770,984 31,238,408 JG Summit Capital Services Corporation 19,047,878 19,024,284 Robinsons Land Corporation 15,981,447 12,085,906 Robinsons Convenient Store 8,523,857 4,084,069 JG Summit Petrochemical Corp. (JGSPC) 7,330,430 – Others* 47,085,144 77,316,345
₱1,737,472,834 ₱448,124,520* Others include HURC and Unicon Insurance Brokers Corp.
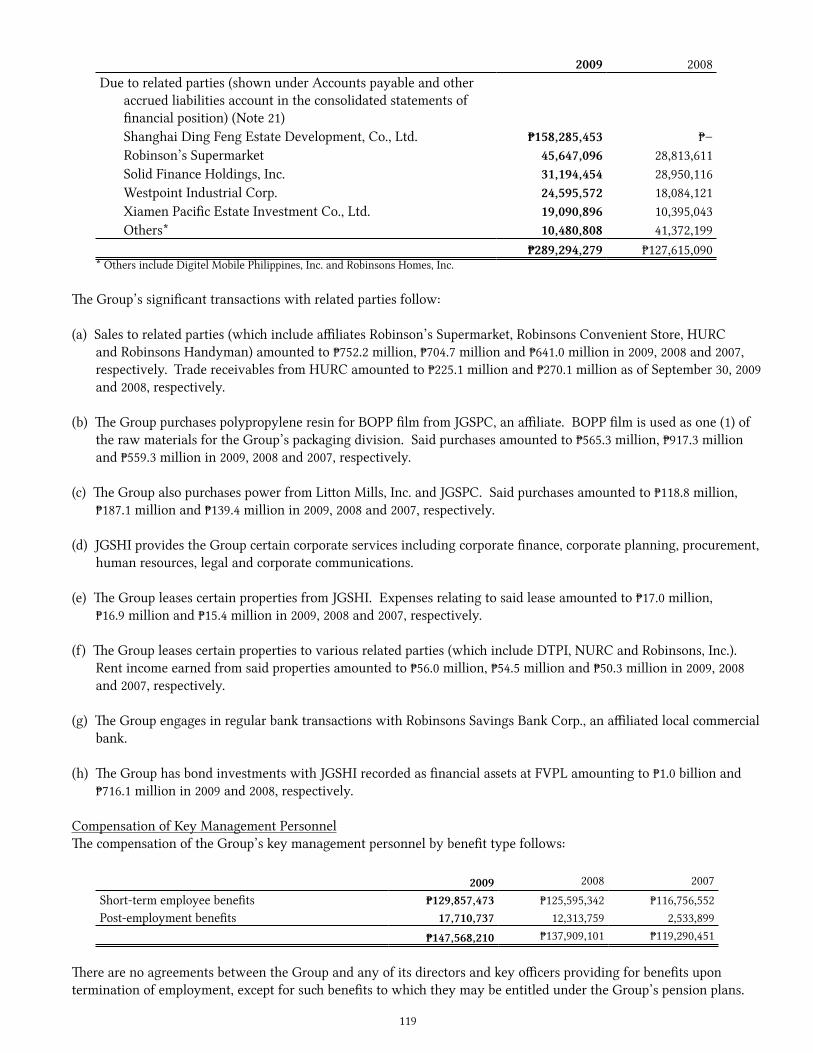
119
2009 2008Due to related parties (shown under Accounts payable and other
accrued liabilities account in the consolidated statements of financial position) (Note 21)
Shanghai Ding Feng Estate Development, Co., Ltd. ₱158,285,453 ₱– Robinson’s Supermarket 45,647,096 28,813,611 Solid Finance Holdings, Inc. 31,194,454 28,950,116 Westpoint Industrial Corp. 24,595,572 18,084,121 Xiamen Pacific Estate Investment Co., Ltd. 19,090,896 10,395,043 Others* 10,480,808 41,372,199
₱289,294,279 ₱127,615,090* Others include Digitel Mobile Philippines, Inc. and Robinsons Homes, Inc.
The Group’s significant transactions with related parties follow:
(a) Sales to related parties (which include affiliates Robinson’s Supermarket, Robinsons Convenient Store, HURC and Robinsons Handyman) amounted to ₱752.2 million, ₱704.7 million and ₱641.0 million in 2009, 2008 and 2007, respectively. Trade receivables from HURC amounted to ₱225.1 million and ₱270.1 million as of September 30, 2009 and 2008, respectively.
(b) The Group purchases polypropylene resin for BOPP film from JGSPC, an affiliate. BOPP film is used as one (1) of the raw materials for the Group’s packaging division. Said purchases amounted to ₱565.3 million, ₱917.3 million and ₱559.3 million in 2009, 2008 and 2007, respectively.
(c) The Group also purchases power from Litton Mills, Inc. and JGSPC. Said purchases amounted to ₱118.8 million, ₱187.1 million and ₱139.4 million in 2009, 2008 and 2007, respectively.
(d) JGSHI provides the Group certain corporate services including corporate finance, corporate planning, procurement, human resources, legal and corporate communications.
(e) The Group leases certain properties from JGSHI. Expenses relating to said lease amounted to ₱17.0 million, ₱16.9 million and ₱15.4 million in 2009, 2008 and 2007, respectively.
(f) The Group leases certain properties to various related parties (which include DTPI, NURC and Robinsons, Inc.). Rent income earned from said properties amounted to ₱56.0 million, ₱54.5 million and ₱50.3 million in 2009, 2008 and 2007, respectively.
(g) The Group engages in regular bank transactions with Robinsons Savings Bank Corp., an affiliated local commercial bank.
(h) The Group has bond investments with JGSHI recorded as financial assets at FVPL amounting to ₱1.0 billion and ₱716.1 million in 2009 and 2008, respectively.
Compensation of Key Management PersonnelThe compensation of the Group’s key management personnel by benefit type follows:
2009 2008 2007Short-term employee benefits ₱129,857,473 ₱125,595,342 ₱116,756,552Post-employment benefits 17,710,737 12,313,759 2,533,899
₱147,568,210 ₱137,909,101 ₱119,290,451
There are no agreements between the Group and any of its directors and key officers providing for benefits upon termination of employment, except for such benefits to which they may be entitled under the Group’s pension plans.

120
As of September 30, 2009 and 2008, the Group’s plan assets include amounts due to the Parent Company totaling ₱157.5 million and ₱131.0 million, respectively (Notes 10 and 32). The Group’s plan assets also include amounts due from JGSHI totaling ₱1.5 billion and ₱1.4 billion, respectively (see Notes 10 and 32).
36. Registration with the BOI
Certain operations of consolidated subsidiaries are registered with the BOI as preferred pioneer and nonpioneer activities. As registered enterprises, these consolidated subsidiaries are subject to some requirements and are entitled to certain tax and non-tax incentives which are considered in the computation of the provision for income tax.
Bio-Resource Power Generation CorporationOn April 2, 2008, URSUMCO’s BOD approved the change of the name of the company from Universal Robina Sugar Milling Corporation to Bio-Resource Power Generation Corporation. As of that date, the BOD and stockholders also approved the change in the principal business of the company to acquire, construct, equip, lease, maintain and operate, work systems, turbines, boilers, poles, pole wires, conduit, ducts, subway and all kinds of mechanical and electrical equipment necessary for the production (using sugar cane and/or its by products as basic raw materials) supply, distribution and sale of electricity for light, heat and power and any other use to which electricity may be generated and applied. The Philippine SEC approved the change in corporate name and principal business of the company on May 26, 2008.
Bio-Resource Power Generation Corporation is registered with BOI as pioneer status under the Omnibus Investments Code of 1987 otherwise known as Executive Order No. 226. Under the terms of its registration, the company shall be entitled to certain incentives such as (a) additional deduction from taxable income of fifty percent (50%) on wages subject to certain terms and conditions; (b) employment of foreign nationals; (c) importation of consigned equipment for a period of ten (10) years from date of registration subject to certain terms and conditions; (d) exemption from taxes and duties on imported spare parts and suppliers for certain producers; and (e) other non-fiscal incentives that may be applicable.
SONEDCOIn November 2005, SONEDCO was registered with the BOI as a new producer of refined sugar and its by-product (molasses) on a pioneer status and as expanding producer of raw sugar and it by-product (molasses) on a non-pioneer status.
Under the terms of the registration and subject to certain requirements, SONEDCO is entitled to the following fiscal and non-fiscal incentives: (a) ITH for a period of six (6) years from November 2006; (b) additional deduction from taxable income on wages subject to certain terms and conditions; (c) employment of foreign nationals; (d) tax credits on taxes and duties on raw materials and supplies used in the manufacture of export products and forming parts thereof for ten (10) years from start of commercial operations; (e) simplification of customs procedures for the importation of equipment, spare parts, raw materials and supplies; (f) access to CBMW subject to Custom rules and regulations provided firm exports at least 70% of production output; (g) exemption from wharfage dues and any export tax, duty, impost and fees; (h) importation of consigned equipment for a period of ten (10) years from date of registration; and (i) exemption from taxes and duties on imported spare parts and consumable supplies for exports producers with CBMW exporting at least 70% of production.
SONEDCO was registered with the BOI under the Omnibus Investments Code of 1987. Under the terms of its registration, SONEDCO was entitled to certain incentives which were transferred to the Parent Company, on account of the transfer of its sugar milling operations.
CFC Clubhouse Property, Inc.In June 2005, CCPI was registered with the BOI as a new producer of PET bottles on a non-pioneer status and as a new producer of printed flexible packaging materials.

121
Under the terms of the registration and subject to certain requirements, CCPI is entitled to the following fiscal and non-fiscal incentives: (a) ITH for a period of four (4) years from June 2006 (as a new producer of PET bottles) and from April 2007 (as a new producer of printed flexible packaging materials); (b) additional deduction from taxable income on wages subject to certain terms and conditions; (c) employment of foreign nationals; (d) tax credits on taxes and duties on raw materials and supplies used in the manufacture of export products and forming parts thereof for ten (10) years from start of commercial operations; (e) simplification of customs procedures for the importation of equipment, spare parts, raw materials and supplies; (f) access to CBMW subject to Custom rules and regulations provided firm exports at least 70% of production output; (g) exemption from wharfage dues and any export tax, duty, impost and fees (h) importation of consigned equipment for a period of ten (10) years from date of registration; and (i) exemption from taxes and duties on imported spare parts and consumable supplies for exports producers with common branded manufacturing warehouse exporting at least 70% of production.
37. Commitments and Contingencies
Operating Lease Commitments - Group as a LesseeThe Group leases land where certain of its facilities are located. The operating lease agreements are for periods ranging from one (1) to five (5) years from the date of the contracts and are renewable under certain terms and conditions. The Group’s rentals incurred on these leases (included under ‘Selling and distribution costs’ in the consolidated statements of comprehensive income) amounted to ₱54.3 million, ₱76.9 million and ₱55.0 million in 2009, 2008 and 2007, respectively.
Future minimum rentals payable under noncancellable operating leases follow:
2009 2008 2007Within one (1) year ₱17,207,956 ₱16,953,651 ₱14,199,136After one (1) year but not more than five (5) years 68,831,823 67,814,604 59,982,842
₱86,039,779 ₱84,768,255 ₱74,181,978
Operating Lease Commitments - Group as a LessorThe Group has entered into a (1) one-year renewable, noncancellable lease with various related parties covering certain land and building where office spaces are located.
Future minimum rentals receivable under noncancellable operating leases amounted to ₱57.4 million, ₱55.9 million and ₱50.3 million in 2009, 2008 and 2007, respectively.
OthersThe Group has various contingent liabilities arising in the ordinary conduct of business which are either pending decision by the courts, under arbitration or being contested, the outcome of which are not presently determinable. In the opinion of management and its legal counsel, the eventual liability under these lawsuits or claims, if any, will not have a material or adverse effect on the Group’s financial position and results of operations. The information usually required by PAS 37, Provisions, Contingent Liabilities and Contingent Assets, is not disclosed on the grounds that it can be expected to prejudice the outcome of these lawsuits, claims, arbitration and assessments.

122
38. Business Combinations and Purchase Agreements
The Group engaged in the following business acquisitions and purchase transactions during the year ended September 30, 2008:
Purchase of Assets from PASSI (Iloilo) Sugar Central, Inc.On October 3, 2007, the Parent Company purchased the manufacturing assets of PASSI (Iloilo) Sugar Central, Inc. (PASSI). Costs incurred by the Parent Company that are directly attributable to the purchase amounted to ₱13.9 million, and are included in the cost of the acquisition. PASSI operates two (2) sugar mills with a combined milling capacity of over 8,000 tons of cane per day.
The fair values of the manufacturing assets of PASSI as of the date of acquisition were as follows:
PASSI 1 PASSI 2 TotalLand ₱247,564,737 ₱210,310,206 ₱457,874,943Land improvements 217,352 76,504 293,856Building 59,858,084 16,572,381 76,430,465Furniture and fixtures 380 145 525Machinery and equipment 124,430,246 33,755,071 158,185,317Transportation equipment 371,386 715,019 1,086,405Total net assets acquired ₱432,442,185 ₱261,429,326 ₱693,871,511
Acquisition of Advanson International Pte. Ltd.On December 14, 2007, the Group acquired 1.8 million shares (representing 100.0% ownership) of Advanson International Pte. Ltd. and its wholly-owned subsidiary, Jiangsu Acesfood (collectively referred to as Advanson), for an aggregate purchase price of US$1.7 million and RMB2.0 million (approximately ₱61.2 million), inclusive of costs directly associated with the acquisition.
The fair value of the identifiable assets and liabilities of Advanson as of the date of the acquisition were as follows:
Cash and cash equivalents ₱1,949,608Due from affiliates 2,581,871Other receivables 1,820,572Property, plant and equipment (Note 13) 71,269,328Other noncurrent assets 8,822,946
86,444,325Short term loan 28,666,698Due to affiliates 344,000Other liabilities 13,824,939
42,835,637Total net assets acquired 43,608,688Goodwill arising from acquisition 17,579,587Cash consideration ₱61,188,275
From the date of acquisition, Advanson has contributed ₱29.31 million and ₱0.08 million loss to the income of the Group for 2009 and 2008, respectively.
The goodwill of ₱17.6 million comprises the value of expected synergies arising from the acquisition.
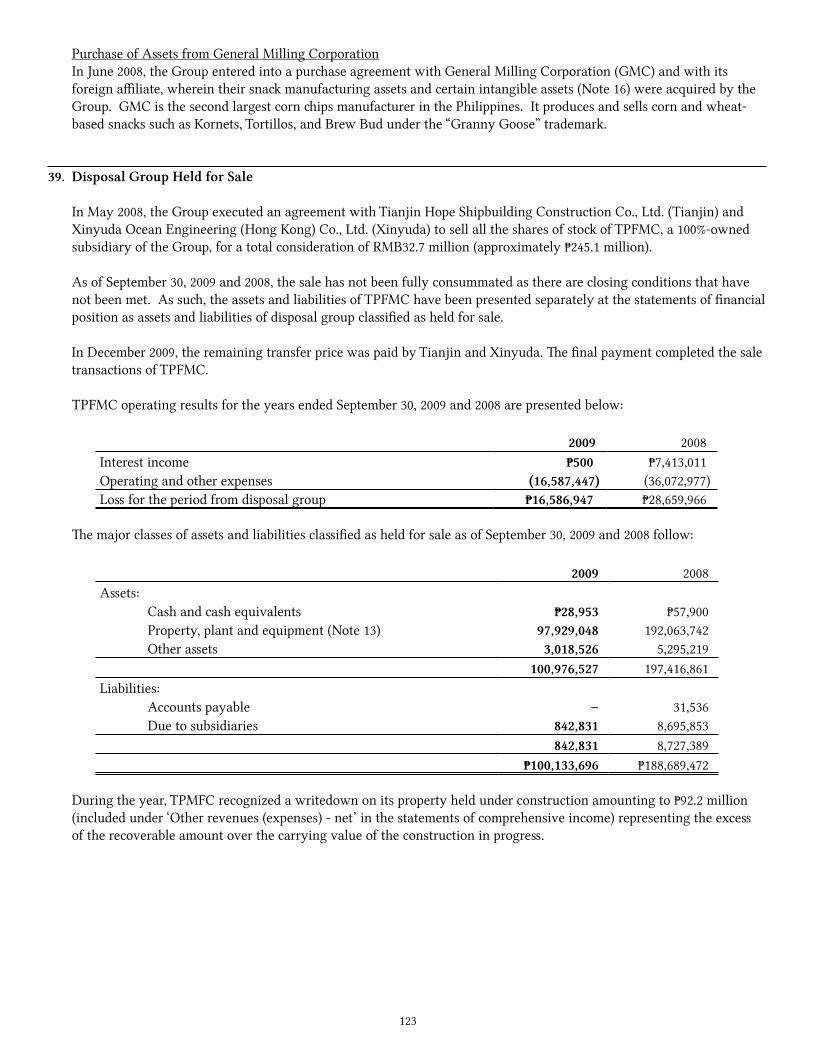
123
Purchase of Assets from General Milling CorporationIn June 2008, the Group entered into a purchase agreement with General Milling Corporation (GMC) and with its foreign affiliate, wherein their snack manufacturing assets and certain intangible assets (Note 16) were acquired by the Group. GMC is the second largest corn chips manufacturer in the Philippines. It produces and sells corn and wheat-based snacks such as Kornets, Tortillos, and Brew Bud under the “Granny Goose” trademark.
39. Disposal Group Held for Sale
In May 2008, the Group executed an agreement with Tianjin Hope Shipbuilding Construction Co., Ltd. (Tianjin) and Xinyuda Ocean Engineering (Hong Kong) Co., Ltd. (Xinyuda) to sell all the shares of stock of TPFMC, a 100%-owned subsidiary of the Group, for a total consideration of RMB32.7 million (approximately ₱245.1 million).
As of September 30, 2009 and 2008, the sale has not been fully consummated as there are closing conditions that have not been met. As such, the assets and liabilities of TPFMC have been presented separately at the statements of financial position as assets and liabilities of disposal group classified as held for sale.
In December 2009, the remaining transfer price was paid by Tianjin and Xinyuda. The final payment completed the sale transactions of TPFMC.
TPFMC operating results for the years ended September 30, 2009 and 2008 are presented below:
2009 2008Interest income ₱500 ₱7,413,011Operating and other expenses (16,587,447) (36,072,977)Loss for the period from disposal group ₱16,586,947 ₱28,659,966
The major classes of assets and liabilities classified as held for sale as of September 30, 2009 and 2008 follow:
2009 2008Assets: Cash and cash equivalents ₱28,953 ₱57,900 Property, plant and equipment (Note 13) 97,929,048 192,063,742 Other assets 3,018,526 5,295,219
100,976,527 197,416,861Liabilities: Accounts payable – 31,536 Due to subsidiaries 842,831 8,695,853
842,831 8,727,389₱100,133,696 ₱188,689,472
During the year, TPMFC recognized a writedown on its property held under construction amounting to ₱92.2 million (included under ‘Other revenues (expenses) - net’ in the statements of comprehensive income) representing the excess of the recoverable amount over the carrying value of the construction in progress.
124
40. Supplemental Disclosures of Noncash Investing Activity
The Group’s noncash investing activities pertain to the movement of the Cumulative translation adjustment account.
2009 2008 2007Cumulative translation adjustment ₱1,138,771 ₱30,936,904 (₱221,482,120)
41. Subsequent Events
On December 4, 2009, the Parent Company’s BOD approved the purchase agreement with GMC for the acquisition of a manufacturing plant, land and land improvements, building and building improvements and machinery and equipment for an aggregate purchase price of ₱233.0 million for use in its manufacturing operations.
On December 8, 2009, the Parent Company’s BOD also approved the purchase of 81.5 million of its common shares through the share buy-back program at ₱14 per share or a total consideration of ₱1.1 billion. The purchase increased the outstanding treasury shares to 156.6 million shares, equivalent to 7.0% of its outstanding shares.
42. Approval for the Release of the Financial Statements
The accompanying consolidated financial statements of the Group were authorized for issue by the AC and the BOD on January 12, 2010.
unIVERSAL ROBInA CORPORATIOn
INTERNATIONAL PHILIPPINES
URC Foods (Singapore) Pte Ltd168 Tagore Lane
Singapore 787574Tel: 65-65520314Fax: 65-65520127
URC (Thailand) Co. LtdHead Office
122-123 Moo 7, Rajpattana Road, Khwang Sapansung,
Khet Sapansung, Bangkok10240 Thailand
Tel: 662-5174800Fax: 662-5171416
URC (Thailand) Co. LtdThailand Factory
Samutsakorn Industrial Estate,1/123, MU 2, Sub-District Thasai
Samutsakorn 74000Tel: 6634-490031Fax: 6634-490298
URC Snack Foods ( Malaysia) Sdn BhdMarketing & Sales Office
No.1 Jalan Jurunilia U1/20, Seksyen U1Hicom Glenmarie Industrial Park
40150 Shah Alam, Selangor Darul EhsanTel: 603-55695855; 603-55694561 to 63
Fax: 603-55691775; 603-55695993
URC Snack Foods ( Malaysia) Sdn BhdHead Office / Factory
PLO 370 Jalan Perak Tiga,Kawasan Perindustrian 81700
Pasir Gudang, Johor BahruMalaysia
Tel: 607-2513199; 607-2510948Fax: 607-2513398; 607-2529819
URC Vietnam Co. Ltd.Head Office / Factory
No. 26, Road 6Vietnam Singapore Industrial Park
Thuan An District, Binh Duong Province
VietnamTel: 84-650-767009 to 16
Fax: 84-650-767025
URC Vietnam Co. Ltd.Sales & Marketing Office
No. 16 Cuu Long St,Ward 2, Tan Binh District, HCMC
VietnamTel: 848-62969746 to 47
Fax: 848-62969675
PT URC IndonesiaHead Office / FactoryJl. Sulawesi Blok M-27
MM 2100 Industrial TownCikarang Barat, Bekasi 17530
IndonesiaTel: 6221-899 82585Fax: 6221-8998 2586
PT URC IndonesiaMarketing & Sales Office
Menara Hijau, Lt. 6Jl MT Haryono Kav. 33
Jakarta 12770Indonesia
Tel: 6221-79192009Fax: 6221-7985875
URC Hong Kong Co. Ltd.14/F. ,Units A & B Wing Shan Ind. Bldg.
428 Cha Kwo Ling Rd.Yau Tong, Kowloon
Tel: 852-27171475; 852-27171479Fax: 852-27727052
Shanghai Peggy Foods Co., LtdNo. 358 Jiajian road
Jiading DistrictShanghai, China
Tel: 8621-59903123; 8621-59903127Fax: 8621-59903164
Branded Consumer Foods GroupCFC Administration Building13 E. Rodriguez, Jr. Avenue,
Bagong Ilog, Pasig CityTel: 671-2935 to 42/46/47
Universal Corn ProductsUCP Compound
16 Santiago Street, Bagong Ilog, Pasig CityTel: 671-8184; 671-8140
Telefax: 671-0575
Robina FarmsGBF Technical Training Center
Litton Mills Compound,Amang Rodriguez Avenue,
Rosario, Pasig CityTel: 395-1142 to 45; 395-1200
Fax: 395-1200 loc 22
URC – Flour DivisionPasig Boulevard, Bagong Ilog, Pasig City
Tel: 672-1578 to 80Fax: 672-1581; 672-1574
URC – Sugar Division22/F Robinsons Equitable Tower
ADB Avenue corner Poveda StreetOrtigas Center, Pasig City
Tel: 637-5398; 637-5021Fax: 637-3654
Independent Public AccountantsSycip, Gorres, Velayo & Co.
Certified Public AccountantsSGV Building, 6760 Ayala Avenue
Makati City
Stock Transfer AgentBank of the Philippine Islands
16/F BPI BuildingAyala Avenue corner Paseo de Roxas
Makati City
43rd Floor, Robinsons-Equitable TowerADB Avenue corner Poveda street
Ortigas Center, Pasig CityTel: (632) 633-7631 to 40 / (632) 240-8801
Fax: (632) 633-9207 / (632) 240-9106Website: www.urc.com.ph