A model of gas mixing into single-entrance tree cavities during wildland fires
12
A model of gas mixing into single-entrance tree cavities during wildland fires A.S. Bova, G. Bohrer, and M.B. Dickinson Abstract: The level of protection to fauna provided by tree cavities during wildland fires is not well understood. Here we present a model for estimating the transport of combustion gases into cylindrical, single-entrance cavities during exposures caused by different wildland fire scenarios. In these shelters, the entrance occurs near the top of the cavity. This empirical model was developed from a suite of numerical experiments using the National Institute of Standards and Technology’ s Fire Dynamics Simulator, which spanned a range of entrance diameters, wind speeds, gas temperatures, and vertical angles of in- cidence. To evaluate the model’ s predictions, it was used to replicate, with great accuracy, a time series of carbon monoxide (CO) concentrations in a controlled experiment where a fabricated cylindrical cavity was exposed to combustion products. The time constant for cavity filling is proportional to the ratio of cavity volume to entrance area. Hot gases lead to signifi- cant stratification within the cavity during exposures. To demonstrate the model’ s potential use in predicting faunal expo- sures in the context of land management, we show that the model can be used to estimate dosage within red-cockaded woodpecker (Picoides borealis Vieillot, 1809) cavities without requiring temporally detailed, local measurements of wind speed and combustion product concentrations. Résumé : Le degré de protection que procurent les cavités d’arbre pour la faune durant les feux de forêt n’est pas bien connu. Nous présentons ici un modèle pour l’estimation du déplacement des gaz de combustion dans des cavités cylindri- ques à une seule entrée lors d’expositions correspondant à différents scénarios de feux de forêt. Dans ces abris, l’entrée se trouve près du haut de la cavité. Ce modèle empirique a été développé à partir d’une série d’expériences numériques réali- sées à l’aide du simulateur de dynamique du feu du National Institute of Standards and Technology, qui permet de tester une gamme de diamètres d’entrée, de vitesses du vent, de températures des gaz et d’angles verticaux d’incidence. Pour éva- luer les prédictions du modèle, le simulateur a été utilisé pour répéter, avec une grande exactitude, une série temporelle de concentrations de monoxyde de carbone (CO) dans une expérience en conditions contrôlées qui consistait à exposer une ca- vité cylindrique usinée à des produits de combustion. La constante de temps pour le remplissage de la cavité est proportion- nelle au ratio du volume de la cavité sur l’aire de l’entrée. Les gaz chauds provoquent une importante stratification dans la cavité durant l’exposition. Pour démontrer la possibilité d’utiliser le modèle pour prédire les expositions de la faune dans un contexte d’aménagement du territoire, nous montrons que le modèle peut être utilisé pour estimer les doses dans des cavités de pic à face blanche (Picoides borealis Vieillot, 1809) et ce, sans faire appel à des mesures détaillées dans le temps, à des mesures de vitesse locale du vent ou à des concentrations de produits de combustion. [Traduit par la Rédaction] Introduction The level of protection afforded by animal shelters such as burrows, tree cavities, and caves during wildland fire events is of interest to wildland fire practitioners and wildlife man- agers, particularly when endangered or threatened species are involved (e.g., Guelta and Balbach 2005; O’Brien et al. 2006; Engstrom 2010). Fire practitioners need to estimate the im- pacts of fire use and suppression, and wildlife managers need to assess the adequacy of the shelter resource and some- times need guidance on how to supplement the resource with artificial shelters. Considerable efforts are made to supple- ment naturally occurring cavities for a range of mammal and bird species in fire-prone habitats (e.g., Franzreb 1997; Lin- denmayer et al. 2009). Although some studies of the mixing of combustion products, or smoke surrogates, into animal shelters have been performed (e.g., Guelta and Checkai 2001; Ar et al. 2004; O’Brien et al. 2006), they did not result in formulas or models that will allow forest and fire manag- ers to easily estimate the probable effects of wildland fires on conditions within such shelters. A limited number of empirical formulas are available for estimating ventilation rates in natural animal shelters. For ex- ample, Okubo and Levin (2001, p. 95) provide a simple for- mula for the volume flux of air, as a function of wind speed, through prairie dog (Cynomys ludovicianus) burrows. How- ever, it is not clear that such relationships will hold for tree Received 19 October 2010. Accepted 21 April 2011. Published at www.nrcresearchpress.com/cjfr on xx August 2011. A.S. Bova and M.B. Dickinson. USDA Forest Service, 359 Main Road, Delaware, OH 43015, USA. G. Bohrer. College of Civil and Environmental Engineering and Geodetic Science, The Ohio State University, 2070 Neil Ave, Columbus, OH 43210, USA. Corresponding author: M.B. Dickinson (e-mail: [email protected]). 1659 Can. J. For. Res. 41: 1659–1670 (2011) doi:10.1139/X11-077 Published by NRC Research Press
Transcript of A model of gas mixing into single-entrance tree cavities during wildland fires
A model of gas mixing into single-entrance treecavities during wildland fires
A.S. Bova, G. Bohrer, and M.B. Dickinson
Abstract: The level of protection to fauna provided by tree cavities during wildland fires is not well understood. Here wepresent a model for estimating the transport of combustion gases into cylindrical, single-entrance cavities during exposurescaused by different wildland fire scenarios. In these shelters, the entrance occurs near the top of the cavity. This empiricalmodel was developed from a suite of numerical experiments using the National Institute of Standards and Technology’s FireDynamics Simulator, which spanned a range of entrance diameters, wind speeds, gas temperatures, and vertical angles of in-cidence. To evaluate the model’s predictions, it was used to replicate, with great accuracy, a time series of carbon monoxide(CO) concentrations in a controlled experiment where a fabricated cylindrical cavity was exposed to combustion products.The time constant for cavity filling is proportional to the ratio of cavity volume to entrance area. Hot gases lead to signifi-cant stratification within the cavity during exposures. To demonstrate the model’s potential use in predicting faunal expo-sures in the context of land management, we show that the model can be used to estimate dosage within red-cockadedwoodpecker (Picoides borealis Vieillot, 1809) cavities without requiring temporally detailed, local measurements of windspeed and combustion product concentrations.
Résumé : Le degré de protection que procurent les cavités d’arbre pour la faune durant les feux de forêt n’est pas bienconnu. Nous présentons ici un modèle pour l’estimation du déplacement des gaz de combustion dans des cavités cylindri-ques à une seule entrée lors d’expositions correspondant à différents scénarios de feux de forêt. Dans ces abris, l’entrée setrouve près du haut de la cavité. Ce modèle empirique a été développé à partir d’une série d’expériences numériques réali-sées à l’aide du simulateur de dynamique du feu du National Institute of Standards and Technology, qui permet de testerune gamme de diamètres d’entrée, de vitesses du vent, de températures des gaz et d’angles verticaux d’incidence. Pour éva-luer les prédictions du modèle, le simulateur a été utilisé pour répéter, avec une grande exactitude, une série temporelle deconcentrations de monoxyde de carbone (CO) dans une expérience en conditions contrôlées qui consistait à exposer une ca-vité cylindrique usinée à des produits de combustion. La constante de temps pour le remplissage de la cavité est proportion-nelle au ratio du volume de la cavité sur l’aire de l’entrée. Les gaz chauds provoquent une importante stratification dans lacavité durant l’exposition. Pour démontrer la possibilité d’utiliser le modèle pour prédire les expositions de la faune dans uncontexte d’aménagement du territoire, nous montrons que le modèle peut être utilisé pour estimer les doses dans des cavitésde pic à face blanche (Picoides borealis Vieillot, 1809) et ce, sans faire appel à des mesures détaillées dans le temps, à desmesures de vitesse locale du vent ou à des concentrations de produits de combustion.
[Traduit par la Rédaction]
IntroductionThe level of protection afforded by animal shelters such as
burrows, tree cavities, and caves during wildland fire eventsis of interest to wildland fire practitioners and wildlife man-agers, particularly when endangered or threatened species areinvolved (e.g., Guelta and Balbach 2005; O’Brien et al. 2006;Engstrom 2010). Fire practitioners need to estimate the im-pacts of fire use and suppression, and wildlife managersneed to assess the adequacy of the shelter resource and some-times need guidance on how to supplement the resource withartificial shelters. Considerable efforts are made to supple-ment naturally occurring cavities for a range of mammal andbird species in fire-prone habitats (e.g., Franzreb 1997; Lin-
denmayer et al. 2009). Although some studies of the mixingof combustion products, or smoke surrogates, into animalshelters have been performed (e.g., Guelta and Checkai2001; Ar et al. 2004; O’Brien et al. 2006), they did not resultin formulas or models that will allow forest and fire manag-ers to easily estimate the probable effects of wildland fires onconditions within such shelters.A limited number of empirical formulas are available for
estimating ventilation rates in natural animal shelters. For ex-ample, Okubo and Levin (2001, p. 95) provide a simple for-mula for the volume flux of air, as a function of wind speed,through prairie dog (Cynomys ludovicianus) burrows. How-ever, it is not clear that such relationships will hold for tree
Received 19 October 2010. Accepted 21 April 2011. Published at www.nrcresearchpress.com/cjfr on xx August 2011.
A.S. Bova and M.B. Dickinson. USDA Forest Service, 359 Main Road, Delaware, OH 43015, USA.G. Bohrer. College of Civil and Environmental Engineering and Geodetic Science, The Ohio State University, 2070 Neil Ave, Columbus,OH 43210, USA.
Corresponding author: M.B. Dickinson (e-mail: [email protected]).
1659
Can. J. For. Res. 41: 1659–1670 (2011) doi:10.1139/X11-077 Published by NRC Research Press
cavities exposed to wildland fire plumes, where convectiveupwelling and increased turbulence will change the flowstructure near a cavity.Gas transport rates into single-entrance structures are espe-
cially difficult to estimate. Unlike the above example of ven-tilation by streaming flow through prairie dog burrows,ventilation induced by external flow around single-entrystructures is achieved chiefly by penetration of turbulent ed-dies through the entrance (Etheridge 2002) and the differencebetween fluctuating internal and external pressures (Chaplinet al. 2000). This mixing process makes it extremely difficultto estimate, from first principles, the effects of factors such asentry geometry and surrounding turbulence on transport ratesinto single-entry cavities. Therefore, these relations must bederived empirically from laboratory and field experiments orestimated from numerical simulations.In this manuscript, we will derive a generalized formula-
tion to predict the concentration of potentially hazardouscombustion products inside single-entrance tree cavities. Wealso describe a suite of experiments to parameterize thismethod so that it will be practical and could be used to helpland managers minimize the impact of prescribed fires onfauna sheltered in these kinds of cavities.Field experiments covering a range of fire intensities and
shelter configurations necessary for a general model of com-bustion product transport would be costly and probably re-quire many years to complete. Numerical modeling of the
interaction between fire and atmosphere and its resulting ef-fects on various animal shelters may, at least in part, fill thenear-term need for useful data. We used data from a series of“virtual experiments” to derive a formula for the transport ofneutrally buoyant gases into a single-entrance tree cavity. Theexperiments were performed using the National Institute ofStandards and Technology’s (NIST) Fire Dynamics Simulator(FDS). FDS’s fire-modeling capabilities have been exten-sively verified and validated (McGrattan et al. 2009a), mak-ing it a suitable choice for simulating the transport of smokeand hot gases into animal shelters. The derived model wasused to accurately replicate measured carbon monoxide (CO)levels in a cylindrical, single-entrance cavity exposed to com-bustion products during a real-world physical validation ex-periment.
TheoryFor clarity, all symbols and variables that we use through-
out this manuscript are listed in Table 1.The simplest relationship, a linear relationship for the vol-
ume flow (Q) in relation to an external wind speed (U)through a single window opening of aperture area (A), isgiven by Etheridge (2002) as
½1� Q ¼ k0AU
where k′ is a linear proportionality coefficient. However,Etheridge (2002) noted that k′ is a function of the wind
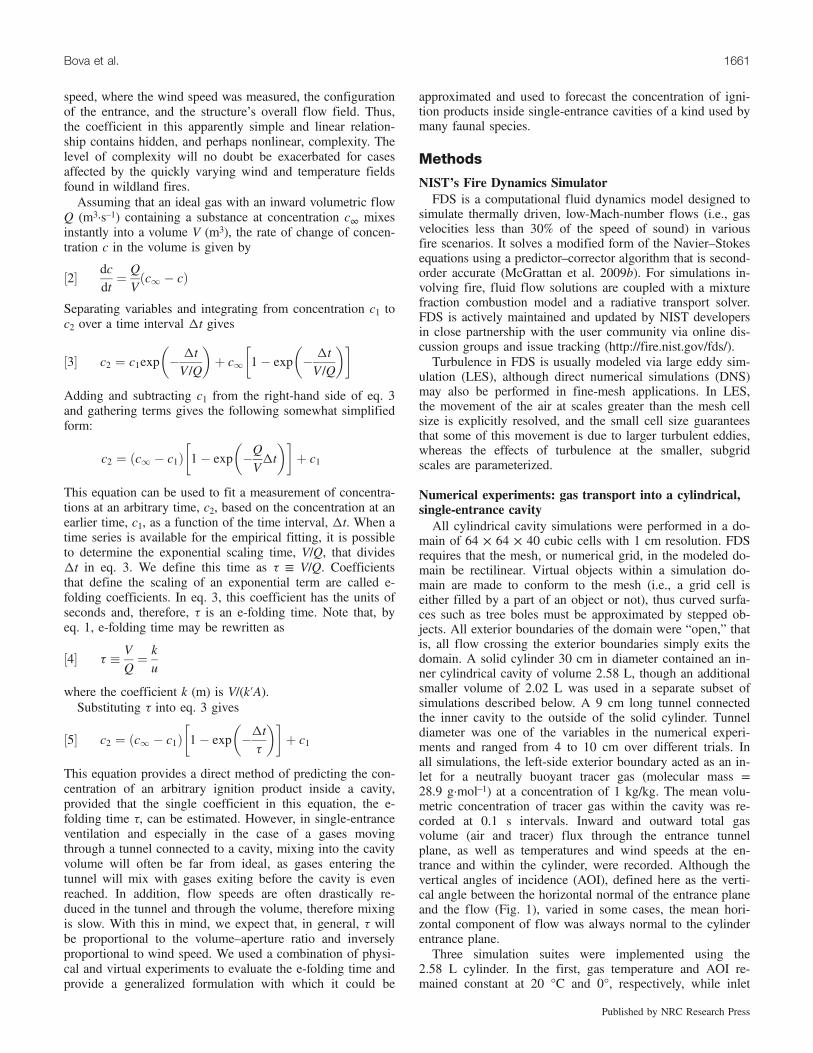
Table 1. List of mathematical symbols.
Symbol Variable or coefficient UnitsA Cavity entrance aperture area m2
a Amplitude in empirical curve (Barnett 2002) unitlessAOI Vertical angle of attack for air approaching the cavity entrance degreesc Mass fraction of a substance C, inside the cavity kgC/kgairc∞ Mass fraction of a substance C, outside the cavity kgC/kgairc1 Mass fraction of a substance C, inside the cavity at time t = 1 kgC/kgairc2 Mass fraction of a substance C, inside the cavity at time t = 2 kgC/kgairf( ) Generalized function unitlessf(AOI) AOI normalization factor, to account for the different effects of AOI
on e-folding length relative to AOI = 0unitless
h Measurement height (aboveground) for wind speed mk Proportionality coefficient between e-folding time and the inverse of
wind speedm
k′ Linear proportionality coefficient mass flow rate and the ratio ofaperture area to wind speed (eq. 1)
unitless
n Statistical sample size unitlessQ Volume flux m3/sR2 Statistical coefficient of determination of the goodness of fit for a
linear regressionunitless
s Shape coefficient in empirical curve relating time from ignition toproduct concentration (Barnett 2002)
unitless
t Time stmax Time of maximum temperature sU Wind speed m/sDt A time interval, the difference between two arbitrary times t = 1 and
t = 2s
t e-folding time, the scaling coefficient of the exponential term sr Air density kg/m3
4 Mass fraction of an arbitrary ignition product kgC/kgair
1660 Can. J. For. Res. Vol. 41, 2011
Published by NRC Research Press
speed, where the wind speed was measured, the configurationof the entrance, and the structure’s overall flow field. Thus,the coefficient in this apparently simple and linear relation-ship contains hidden, and perhaps nonlinear, complexity. Thelevel of complexity will no doubt be exacerbated for casesaffected by the quickly varying wind and temperature fieldsfound in wildland fires.Assuming that an ideal gas with an inward volumetric flow
Q (m3·s–1) containing a substance at concentration c∞ mixesinstantly into a volume V (m3), the rate of change of concen-tration c in the volume is given by
½2� dc
dt¼ Q
Vðc1 � cÞ
Separating variables and integrating from concentration c1 toc2 over a time interval Dt gives
½3� c2 ¼ c1exp � Dt
V=Q
� �þ c1 1� exp � Dt
V=Q
� �� �
Adding and subtracting c1 from the right-hand side of eq. 3and gathering terms gives the following somewhat simplifiedform:
c2 ¼ ðc1 � c1Þ 1� exp �Q
VDt
� �� �þ c1
This equation can be used to fit a measurement of concentra-tions at an arbitrary time, c2, based on the concentration at anearlier time, c1, as a function of the time interval, Dt. When atime series is available for the empirical fitting, it is possibleto determine the exponential scaling time, V/Q, that dividesDt in eq. 3. We define this time as t ≡ V/Q. Coefficientsthat define the scaling of an exponential term are called e-folding coefficients. In eq. 3, this coefficient has the units ofseconds and, therefore, t is an e-folding time. Note that, byeq. 1, e-folding time may be rewritten as
½4� t � V
Q¼ k
u
where the coefficient k (m) is V/(k′A).Substituting t into eq. 3 gives
½5� c2 ¼ ðc1 � c1Þ 1� exp �Dt
t
� �� �þ c1
This equation provides a direct method of predicting the con-centration of an arbitrary ignition product inside a cavity,provided that the single coefficient in this equation, the e-folding time t, can be estimated. However, in single-entranceventilation and especially in the case of a gases movingthrough a tunnel connected to a cavity, mixing into the cavityvolume will often be far from ideal, as gases entering thetunnel will mix with gases exiting before the cavity is evenreached. In addition, flow speeds are often drastically re-duced in the tunnel and through the volume, therefore mixingis slow. With this in mind, we expect that, in general, t willbe proportional to the volume–aperture ratio and inverselyproportional to wind speed. We used a combination of physi-cal and virtual experiments to evaluate the e-folding time andprovide a generalized formulation with which it could be
approximated and used to forecast the concentration of igni-tion products inside single-entrance cavities of a kind used bymany faunal species.
Methods
NIST’s Fire Dynamics SimulatorFDS is a computational fluid dynamics model designed to
simulate thermally driven, low-Mach-number flows (i.e., gasvelocities less than 30% of the speed of sound) in variousfire scenarios. It solves a modified form of the Navier–Stokesequations using a predictor–corrector algorithm that is second-order accurate (McGrattan et al. 2009b). For simulations in-volving fire, fluid flow solutions are coupled with a mixturefraction combustion model and a radiative transport solver.FDS is actively maintained and updated by NIST developersin close partnership with the user community via online dis-cussion groups and issue tracking (http://fire.nist.gov/fds/).Turbulence in FDS is usually modeled via large eddy sim-
ulation (LES), although direct numerical simulations (DNS)may also be performed in fine-mesh applications. In LES,the movement of the air at scales greater than the mesh cellsize is explicitly resolved, and the small cell size guaranteesthat some of this movement is due to larger turbulent eddies,whereas the effects of turbulence at the smaller, subgridscales are parameterized.
Numerical experiments: gas transport into a cylindrical,single-entrance cavityAll cylindrical cavity simulations were performed in a do-
main of 64 × 64 × 40 cubic cells with 1 cm resolution. FDSrequires that the mesh, or numerical grid, in the modeled do-main be rectilinear. Virtual objects within a simulation do-main are made to conform to the mesh (i.e., a grid cell iseither filled by a part of an object or not), thus curved surfa-ces such as tree boles must be approximated by stepped ob-jects. All exterior boundaries of the domain were “open,” thatis, all flow crossing the exterior boundaries simply exits thedomain. A solid cylinder 30 cm in diameter contained an in-ner cylindrical cavity of volume 2.58 L, though an additionalsmaller volume of 2.02 L was used in a separate subset ofsimulations described below. A 9 cm long tunnel connectedthe inner cavity to the outside of the solid cylinder. Tunneldiameter was one of the variables in the numerical experi-ments and ranged from 4 to 10 cm over different trials. Inall simulations, the left-side exterior boundary acted as an in-let for a neutrally buoyant tracer gas (molecular mass =28.9 g·mol–1) at a concentration of 1 kg/kg. The mean volu-metric concentration of tracer gas within the cavity was re-corded at 0.1 s intervals. Inward and outward total gasvolume (air and tracer) flux through the entrance tunnelplane, as well as temperatures and wind speeds at the en-trance and within the cylinder, were recorded. Although thevertical angles of incidence (AOI), defined here as the verti-cal angle between the horizontal normal of the entrance planeand the flow (Fig. 1), varied in some cases, the mean hori-zontal component of flow was always normal to the cylinderentrance plane.Three simulation suites were implemented using the
2.58 L cylinder. In the first, gas temperature and AOI re-mained constant at 20 °C and 0°, respectively, while inlet
Bova et al. 1661
Published by NRC Research Press
wind speeds increased continuously and linearly through arange of 0 to 5 m·s–1 over 50 s of simulated time and thenremained constant at 5 m·s–1 for an additional 5 s. A subsetof simulations, comprising these same boundary conditions,was also carried out for a cylinder with a smaller inner vol-ume of 2.02 L. In the second suite, inlet wind speed and AOIwere constant at 1.5 m·s–1 and 0°, respectively, but inlet gastemperature increased linearly through a range of 20 to 220 °Cover the course of 55 s of simulated time and then remainedconstant to the end of the simulation (60 s). In the final suite,inlet wind speed and temperature were constant at 2 m·s–1and 20 °C, respectively, while one of five AOI (0°, 30°, 45°,60°, 90°) were imposed at the inlet. Entrance diameters were5, 6, 7, 8, 9, and 10 cm in the separate simulations compris-ing the first two suites, whereas diameters of 5, 7, and 9 cmwere used in the final suite (Table 2). The entrance diametersand volumes used in the virtual experiments are within theranges characteristic of several species of cavity-nesting birdsin North America (Aubrey and Raley 2002). Because of therectilinear mesh, the entrances were not perfectly circular;therefore, the resulting entrance areas were slightly less thanwould be calculated for the above diameters.For each time series, e-folding times of filling, t (in sec-
onds), were calculated as a function of time by
½6� tðtÞ ¼ � t2 � t1
ln c2�1c1�1
� �
where the values of unity in the denominator are the frac-tional concentration of tracer outside of the cylinder (1 kg/kg).Time constants were calculated at each 0.1 s time step as a1 s centered moving average.
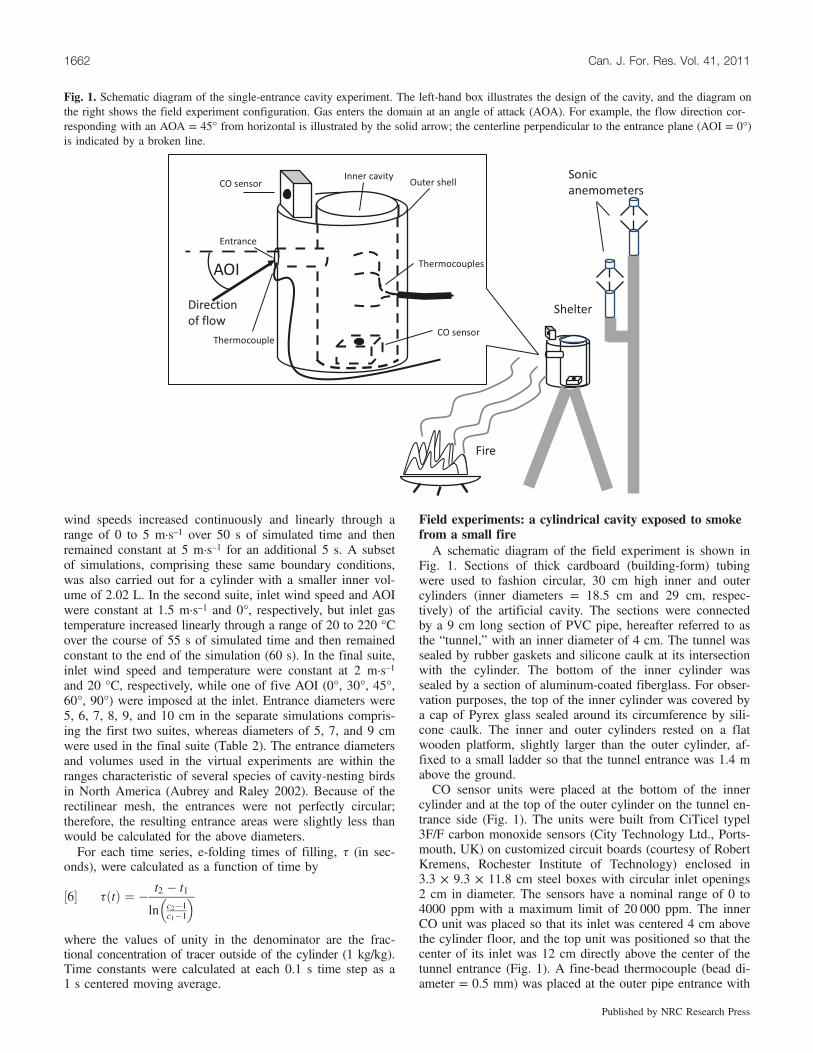
Field experiments: a cylindrical cavity exposed to smokefrom a small fireA schematic diagram of the field experiment is shown in
Fig. 1. Sections of thick cardboard (building-form) tubingwere used to fashion circular, 30 cm high inner and outercylinders (inner diameters = 18.5 cm and 29 cm, respec-tively) of the artificial cavity. The sections were connectedby a 9 cm long section of PVC pipe, hereafter referred to asthe “tunnel,” with an inner diameter of 4 cm. The tunnel wassealed by rubber gaskets and silicone caulk at its intersectionwith the cylinder. The bottom of the inner cylinder wassealed by a section of aluminum-coated fiberglass. For obser-vation purposes, the top of the inner cylinder was covered bya cap of Pyrex glass sealed around its circumference by sili-cone caulk. The inner and outer cylinders rested on a flatwooden platform, slightly larger than the outer cylinder, af-fixed to a small ladder so that the tunnel entrance was 1.4 mabove the ground.CO sensor units were placed at the bottom of the inner
cylinder and at the top of the outer cylinder on the tunnel en-trance side (Fig. 1). The units were built from CiTicel typel3F/F carbon monoxide sensors (City Technology Ltd., Ports-mouth, UK) on customized circuit boards (courtesy of RobertKremens, Rochester Institute of Technology) enclosed in3.3 × 9.3 × 11.8 cm steel boxes with circular inlet openings2 cm in diameter. The sensors have a nominal range of 0 to4000 ppm with a maximum limit of 20 000 ppm. The innerCO unit was placed so that its inlet was centered 4 cm abovethe cylinder floor, and the top unit was positioned so that thecenter of its inlet was 12 cm directly above the center of thetunnel entrance (Fig. 1). A fine-bead thermocouple (bead di-ameter = 0.5 mm) was placed at the outer pipe entrance with
Sonic
anemometersCO sensor
CO sensor
Entrance
Thermocouple
Thermocouples
Inner cavityOuter shell
Fire
ShelterDirection
of flow
AOI
Fig. 1. Schematic diagram of the single-entrance cavity experiment. The left-hand box illustrates the design of the cavity, and the diagram onthe right shows the field experiment configuration. Gas enters the domain at an angle of attack (AOA). For example, the flow direction cor-responding with an AOA = 45° from horizontal is illustrated by the solid arrow; the centerline perpendicular to the entrance plane (AOI = 0°)is indicated by a broken line.
1662 Can. J. For. Res. Vol. 41, 2011
Published by NRC Research Press
the bead about 1 cm below the center of the tunnel entrance.Three thermocouples of the same type were placed in the in-ner cylinder so that their beads were centered at heights of10, 15, and 21 cm above the cylinder floor.Sonic anemometers (model 81000; R.M. Young Company,
Traverse City, Michigan) were placed near the cylinder(Fig. 1) at heights of 2.05 m and 3.1 m aboveground. Windspeeds were averaged over the first and last half hour of theexperiment, and the measurements at two heights were fittedto the following power-law relationship:
½7� U
Uj2m ¼ h
2
� �0:33
where the denominator is the wind velocity at 2 m above theground. This relationship was used to extrapolate the windspeeds measured at the sonic anemometers to the height ofthe cavity entrance (1.4 m). Data from the thermocouples
and sonic anemometers were logged at 0.1 s intervals by amicrologger (model CR1000; Campbell Scientific, Logan,Utah). Five second moving averages of the wind speed com-ponent normal to the cylinder entrance plane were used inthe model calculations described below, with negative values(i.e., winds coming from the back side of the cylinder) takento be zero. AOI was calculated from the vertical and en-trance-directed components of wind speed and were alsoaveraged over 5 s intervals. CO concentrations were loggedat 5 s intervals.Woodland fuels (maple twigs, branches, and dry leaf litter)
were ignited in a 60 cm diameter fire pit. The center of thepit was positioned 1.2 m in front of the entrance side of thecylinder (Fig. 1). The maximum aboveground height of thefuel was about 30 cm. Fuel was fed to the fire continuallyfor about 1.5 h so that flame heights of 20 to 40 cm weremaintained. Although wind direction was erratic, smoke wasusually carried toward the cylinder.
Results
Numerical experiments
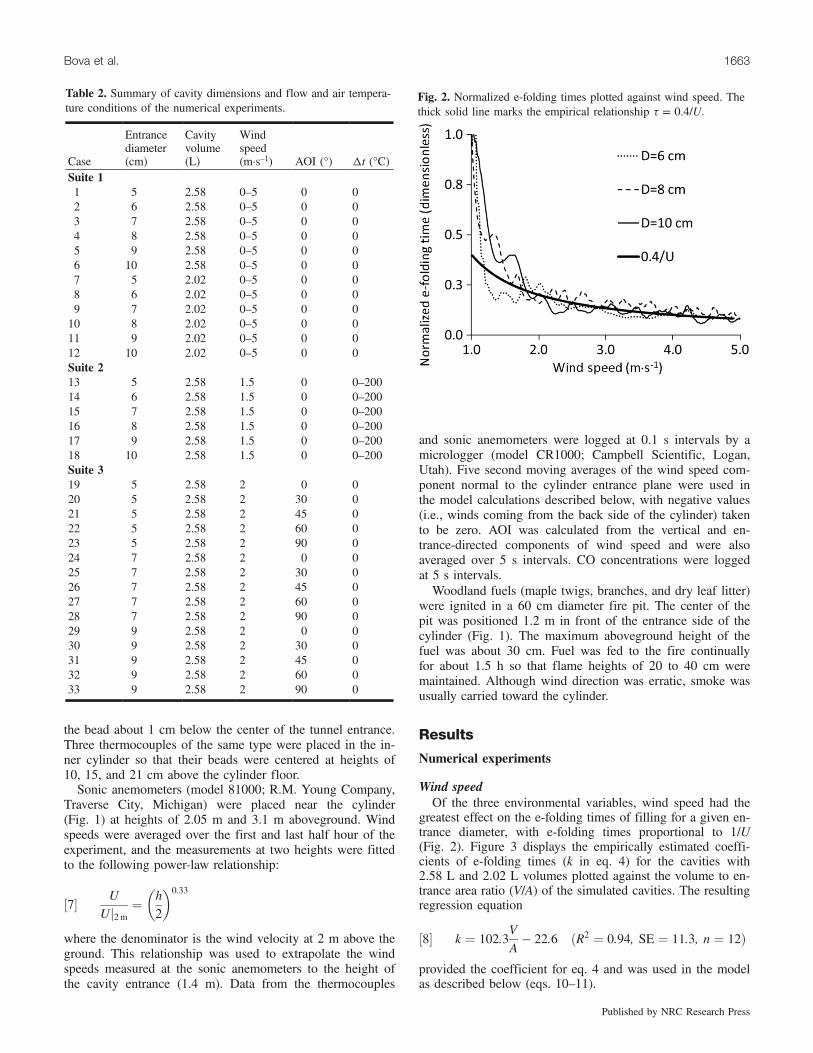
Wind speedOf the three environmental variables, wind speed had the
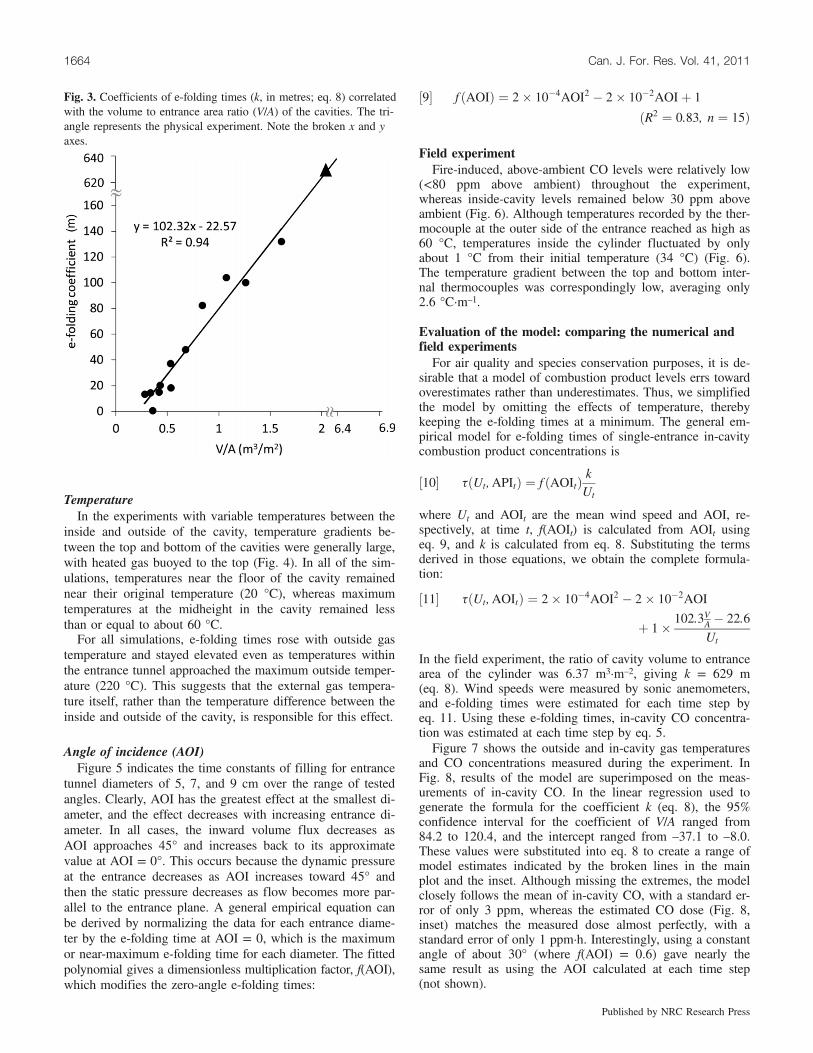
greatest effect on the e-folding times of filling for a given en-trance diameter, with e-folding times proportional to 1/U(Fig. 2). Figure 3 displays the empirically estimated coeffi-cients of e-folding times (k in eq. 4) for the cavities with2.58 L and 2.02 L volumes plotted against the volume to en-trance area ratio (V/A) of the simulated cavities. The resultingregression equation
½8� k ¼ 102:3V
A� 22:6 ðR2 ¼ 0:94; SE ¼ 11:3; n ¼ 12Þ
provided the coefficient for eq. 4 and was used in the modelas described below (eqs. 10–11).
Table 2. Summary of cavity dimensions and flow and air tempera-ture conditions of the numerical experiments.
Case
Entrancediameter(cm)
Cavityvolume(L)
Windspeed(m·s–1) AOI (°) Dt (°C)
Suite 11 5 2.58 0–5 0 02 6 2.58 0–5 0 03 7 2.58 0–5 0 04 8 2.58 0–5 0 05 9 2.58 0–5 0 06 10 2.58 0–5 0 07 5 2.02 0–5 0 08 6 2.02 0–5 0 09 7 2.02 0–5 0 010 8 2.02 0–5 0 011 9 2.02 0–5 0 012 10 2.02 0–5 0 0Suite 213 5 2.58 1.5 0 0–20014 6 2.58 1.5 0 0–20015 7 2.58 1.5 0 0–20016 8 2.58 1.5 0 0–20017 9 2.58 1.5 0 0–20018 10 2.58 1.5 0 0–200Suite 319 5 2.58 2 0 020 5 2.58 2 30 021 5 2.58 2 45 022 5 2.58 2 60 023 5 2.58 2 90 024 7 2.58 2 0 025 7 2.58 2 30 026 7 2.58 2 45 027 7 2.58 2 60 028 7 2.58 2 90 029 9 2.58 2 0 030 9 2.58 2 30 031 9 2.58 2 45 032 9 2.58 2 60 033 9 2.58 2 90 0
Fig. 2. Normalized e-folding times plotted against wind speed. Thethick solid line marks the empirical relationship t = 0.4/U.
Bova et al. 1663
Published by NRC Research Press
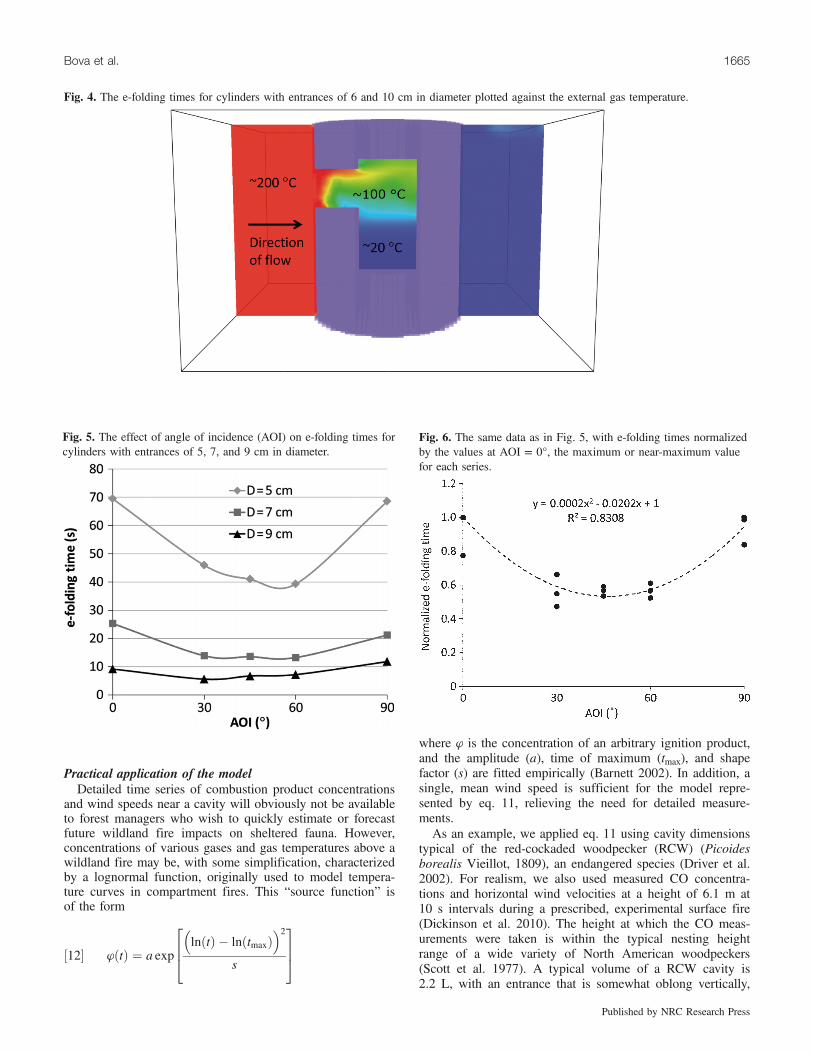
TemperatureIn the experiments with variable temperatures between the
inside and outside of the cavity, temperature gradients be-tween the top and bottom of the cavities were generally large,with heated gas buoyed to the top (Fig. 4). In all of the sim-ulations, temperatures near the floor of the cavity remainednear their original temperature (20 °C), whereas maximumtemperatures at the midheight in the cavity remained lessthan or equal to about 60 °C.For all simulations, e-folding times rose with outside gas
temperature and stayed elevated even as temperatures withinthe entrance tunnel approached the maximum outside temper-ature (220 °C). This suggests that the external gas tempera-ture itself, rather than the temperature difference between theinside and outside of the cavity, is responsible for this effect.
Angle of incidence (AOI)Figure 5 indicates the time constants of filling for entrance
tunnel diameters of 5, 7, and 9 cm over the range of testedangles. Clearly, AOI has the greatest effect at the smallest di-ameter, and the effect decreases with increasing entrance di-ameter. In all cases, the inward volume flux decreases asAOI approaches 45° and increases back to its approximatevalue at AOI = 0°. This occurs because the dynamic pressureat the entrance decreases as AOI increases toward 45° andthen the static pressure decreases as flow becomes more par-allel to the entrance plane. A general empirical equation canbe derived by normalizing the data for each entrance diame-ter by the e-folding time at AOI = 0, which is the maximumor near-maximum e-folding time for each diameter. The fittedpolynomial gives a dimensionless multiplication factor, f(AOI),which modifies the zero-angle e-folding times:
½9� f ðAOIÞ ¼ 2� 10�4AOI2 � 2� 10�2AOIþ 1
ðR2 ¼ 0:83; n ¼ 15Þ
Field experimentFire-induced, above-ambient CO levels were relatively low
(<80 ppm above ambient) throughout the experiment,whereas inside-cavity levels remained below 30 ppm aboveambient (Fig. 6). Although temperatures recorded by the ther-mocouple at the outer side of the entrance reached as high as60 °C, temperatures inside the cylinder fluctuated by onlyabout 1 °C from their initial temperature (34 °C) (Fig. 6).The temperature gradient between the top and bottom inter-nal thermocouples was correspondingly low, averaging only2.6 °C·m–1.
Evaluation of the model: comparing the numerical andfield experimentsFor air quality and species conservation purposes, it is de-
sirable that a model of combustion product levels errs towardoverestimates rather than underestimates. Thus, we simplifiedthe model by omitting the effects of temperature, therebykeeping the e-folding times at a minimum. The general em-pirical model for e-folding times of single-entrance in-cavitycombustion product concentrations is
½10� tðUt;APItÞ ¼ f ðAOItÞ kUt
where Ut and AOIt are the mean wind speed and AOI, re-spectively, at time t, f(AOIt) is calculated from AOIt usingeq. 9, and k is calculated from eq. 8. Substituting the termsderived in those equations, we obtain the complete formula-tion:
½11� tðUt;AOItÞ ¼ 2� 10�4AOI2 � 2� 10�2AOI
þ 1� 102:3VA� 22:6
Ut
In the field experiment, the ratio of cavity volume to entrancearea of the cylinder was 6.37 m3·m–2, giving k = 629 m(eq. 8). Wind speeds were measured by sonic anemometers,and e-folding times were estimated for each time step byeq. 11. Using these e-folding times, in-cavity CO concentra-tion was estimated at each time step by eq. 5.Figure 7 shows the outside and in-cavity gas temperatures
and CO concentrations measured during the experiment. InFig. 8, results of the model are superimposed on the meas-urements of in-cavity CO. In the linear regression used togenerate the formula for the coefficient k (eq. 8), the 95%confidence interval for the coefficient of V/A ranged from84.2 to 120.4, and the intercept ranged from –37.1 to –8.0.These values were substituted into eq. 8 to create a range ofmodel estimates indicated by the broken lines in the mainplot and the inset. Although missing the extremes, the modelclosely follows the mean of in-cavity CO, with a standard er-ror of only 3 ppm, whereas the estimated CO dose (Fig. 8,inset) matches the measured dose almost perfectly, with astandard error of only 1 ppm·h. Interestingly, using a constantangle of about 30° (where f(AOI) = 0.6) gave nearly thesame result as using the AOI calculated at each time step(not shown).
Fig. 3. Coefficients of e-folding times (k, in metres; eq. 8) correlatedwith the volume to entrance area ratio (V/A) of the cavities. The tri-angle represents the physical experiment. Note the broken x and yaxes.
1664 Can. J. For. Res. Vol. 41, 2011
Published by NRC Research Press
Practical application of the modelDetailed time series of combustion product concentrations
and wind speeds near a cavity will obviously not be availableto forest managers who wish to quickly estimate or forecastfuture wildland fire impacts on sheltered fauna. However,concentrations of various gases and gas temperatures above awildland fire may be, with some simplification, characterizedby a lognormal function, originally used to model tempera-ture curves in compartment fires. This “source function” isof the form
½12� 4ðtÞ ¼ a exp
�lnðtÞ � lnðtmaxÞ
�2
s
264
375
where 4 is the concentration of an arbitrary ignition product,and the amplitude (a), time of maximum (tmax), and shapefactor (s) are fitted empirically (Barnett 2002). In addition, asingle, mean wind speed is sufficient for the model repre-sented by eq. 11, relieving the need for detailed measure-ments.As an example, we applied eq. 11 using cavity dimensions
typical of the red-cockaded woodpecker (RCW) (Picoidesborealis Vieillot, 1809), an endangered species (Driver et al.2002). For realism, we also used measured CO concentra-tions and horizontal wind velocities at a height of 6.1 m at10 s intervals during a prescribed, experimental surface fire(Dickinson et al. 2010). The height at which the CO meas-urements were taken is within the typical nesting heightrange of a wide variety of North American woodpeckers(Scott et al. 1977). A typical volume of a RCW cavity is2.2 L, with an entrance that is somewhat oblong vertically,
Fig. 4. The e-folding times for cylinders with entrances of 6 and 10 cm in diameter plotted against the external gas temperature.
Fig. 5. The effect of angle of incidence (AOI) on e-folding times forcylinders with entrances of 5, 7, and 9 cm in diameter.
Fig. 6. The same data as in Fig. 5, with e-folding times normalizedby the values at AOI = 0°, the maximum or near-maximum valuefor each series.
Bova et al. 1665
Published by NRC Research Press
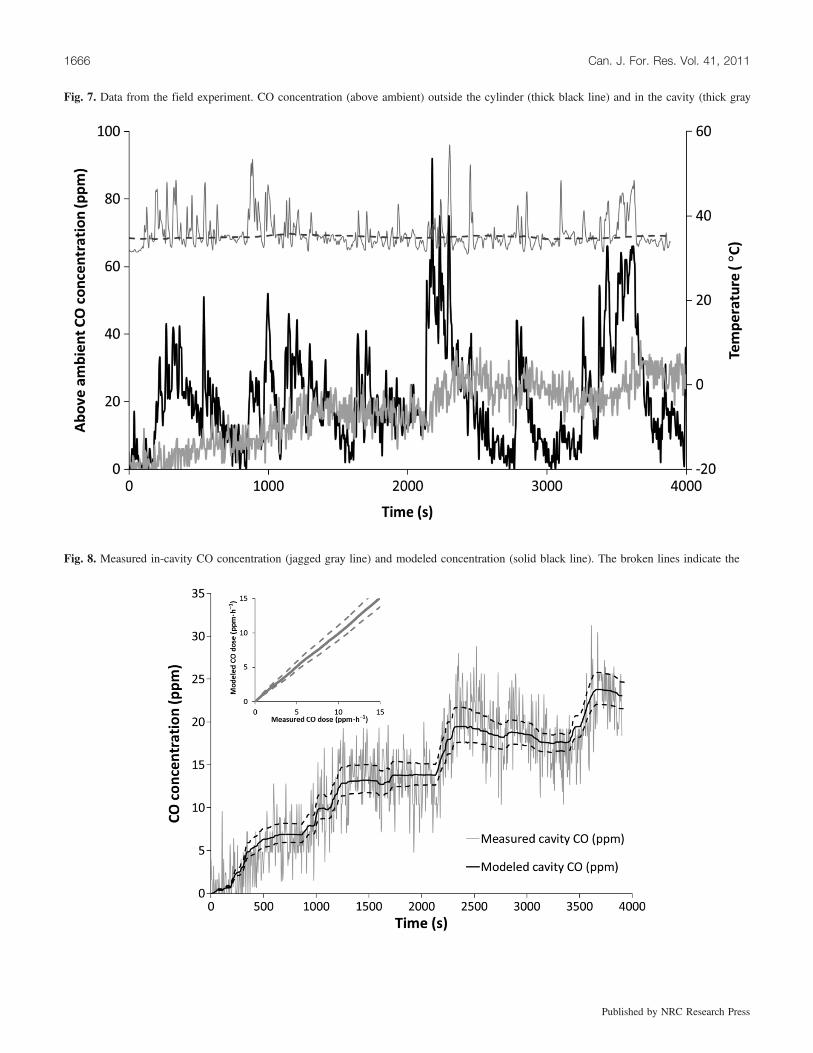
Fig. 7. Data from the field experiment. CO concentration (above ambient) outside the cylinder (thick black line) and in the cavity (thick gray
Fig. 8. Measured in-cavity CO concentration (jagged gray line) and modeled concentration (solid black line). The broken lines indicate the
1666 Can. J. For. Res. Vol. 41, 2011
Published by NRC Research Press

but with an effective diameter of about 5 cm (Driver et al.2002). This gives it a relatively low V/A of 1.12 m3·m–2 and,from eq. 8, an e-folding coefficient of about 90 m. In this ex-ample, AOI was taken to be zero.Figure 9 contains a time series of the measured CO con-
centrations (thin gray line) outside the cavity, as well as esti-mated CO concentration (broken thick gray line) calculatedusing eq. 11. We determined the parameters of the sourcefunction (eq. 12) (maximum amplitude = 137.9 ppm; timeof maximum = 213 s; shape constant = 2.17) using a leastsquares fit parameterization of the CO measurements.The in-cavity CO levels estimated by our model using
eq. 5, with the estimated source function (eq. 12) used as theoutside CO concentration, c∞, and the overall mean windspeed (thick gray line) used as a constant wind speed, matchremarkably well with those represented by the curve calcu-lated from measured CO levels outside the cavity and 10 Hzvariable wind speeds (black line), suggesting that in-cavityCO concentrations are not sensitive to rapid fluctuations inwind speed and external CO concentration. Therefore, thismethod of estimation can provide robust forecasts even with-out high-frequency data (Fig. 9). The time series of resultingestimated doses (i.e., the product of concentration and time)obtained from the mean wind speed and lognormal curvealso compares well with that calculated from the measuredtime series of observed wind and CO concentrations (Fig. 9,inset). Note that at no point throughout this low-intensity fireevent did the concentrations reach a level that would be con-sidered harmful to cavity occupants.
DiscussionThe close correspondence between measured and modeled
CO levels in the physical cavity (Fig. 8) would be notableeven if it resulted from a direct simulation of the fabricatedcavity. What makes the match more remarkable and useful isthat it was the result of a simplified equation derived fromnumerical experiments involving cavities of dimensions sig-nificantly different from the experimental cavity, resulting indiffering cavity V/A (Table 3). Furthermore, the model seemsto provide reasonable estimates without the need for high-frequency wind and external concentration data (Fig. 9). Aswith all such models, further evaluation regarding margins oferror and performance in different environments and sheltertypes than were explored here are required. However, the re-sults above suggest that numerical experiments are a usefuland productive approach to obtaining models of wildlandfire effects. In addition, they provide considerable savings ofcost and time over comparable field experiments.The tracer gas in the simulations was treated as an ideal
gas and a conserved scalar (i.e., it was of neutral buoyancy,did react chemically to evolve into other gas species, andwas not adsorbed by the cavity inner or outer walls); there-fore, the model may not apply to products such as soot, whichare not neutrally buoyant, or to highly reactive or vegetation-adsorbed species over a long term. By treating gas tempera-ture as a combustion product, it is possible that eq. 5 couldbe used to estimate increased gas temperatures in the cavity,another potential harmful effect of fire, with the caveats thatthe estimated internal temperature applies to the tunnel and
Fig. 9. Example application of the model to a cavity typical of the red-cockaded woodpecker. Thin gray line: outside CO concentrationsmeasured during a prescribed surface fire. Black line: model estimate of in-cavity CO, calculated from the observed, high-frequency timeseries of outside CO and wind speed. Broken thick gray line: outside CO concentration, calculated from lognormal curve fitted to the COmeasurements. Thick gray line: model estimate of cavity CO from the lognormal curve and a single, mean wind speed (0.68 m·s–1). Inset: thesame, but for accumulated CO dose.
Bova et al. 1667
Published by NRC Research Press
uppermost regions of the cavity and that temperature gradientsare likely to be large (and not predictable by the simplifiedmodel) as temperature increases. Applying eq. 5 to the meas-ured external temperatures in the field experiment gives an
estimated increase of about 3 °C in the cavity, which is onlya slight overprediction of the actual maximum temperatureobserved at the top of the cavity.The effect of temperature differences between the outside
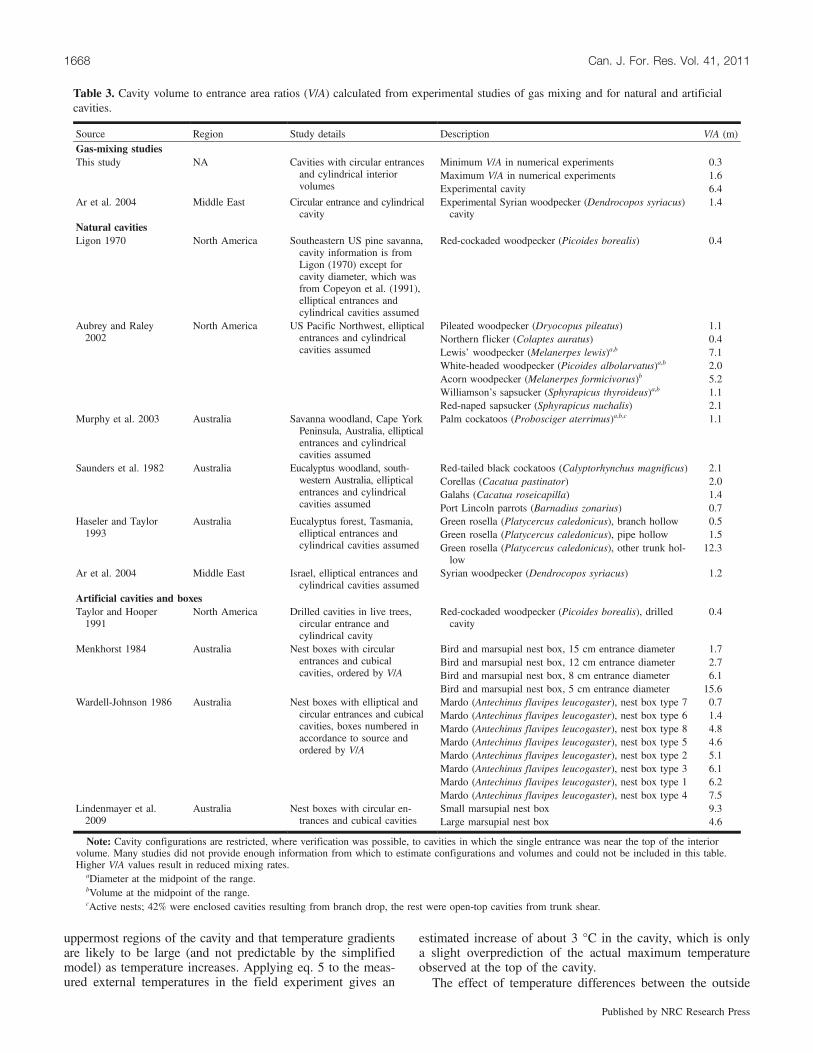
Table 3. Cavity volume to entrance area ratios (V/A) calculated from experimental studies of gas mixing and for natural and artificialcavities.
Source Region Study details Description V/A (m)Gas-mixing studiesThis study NA Cavities with circular entrances
and cylindrical interiorvolumes
Minimum V/A in numerical experiments 0.3Maximum V/A in numerical experiments 1.6Experimental cavity 6.4
Ar et al. 2004 Middle East Circular entrance and cylindricalcavity
Experimental Syrian woodpecker (Dendrocopos syriacus)cavity
1.4
Natural cavitiesLigon 1970 North America Southeastern US pine savanna,
cavity information is fromLigon (1970) except forcavity diameter, which wasfrom Copeyon et al. (1991),elliptical entrances andcylindrical cavities assumed
Red-cockaded woodpecker (Picoides borealis) 0.4
Aubrey and Raley2002
North America US Pacific Northwest, ellipticalentrances and cylindricalcavities assumed
Pileated woodpecker (Dryocopus pileatus) 1.1Northern flicker (Colaptes auratus) 0.4Lewis’ woodpecker (Melanerpes lewis)a,b 7.1White-headed woodpecker (Picoides albolarvatus)a,b 2.0Acorn woodpecker (Melanerpes formicivorus)b 5.2Williamson’s sapsucker (Sphyrapicus thyroideus)a,b 1.1Red-naped sapsucker (Sphyrapicus nuchalis) 2.1
Murphy et al. 2003 Australia Savanna woodland, Cape YorkPeninsula, Australia, ellipticalentrances and cylindricalcavities assumed
Palm cockatoos (Probosciger aterrimus)a,b,c 1.1
Saunders et al. 1982 Australia Eucalyptus woodland, south-western Australia, ellipticalentrances and cylindricalcavities assumed
Red-tailed black cockatoos (Calyptorhynchus magnificus) 2.1Corellas (Cacatua pastinator) 2.0Galahs (Cacatua roseicapilla) 1.4Port Lincoln parrots (Barnadius zonarius) 0.7
Haseler and Taylor1993
Australia Eucalyptus forest, Tasmania,elliptical entrances andcylindrical cavities assumed
Green rosella (Platycercus caledonicus), branch hollow 0.5Green rosella (Platycercus caledonicus), pipe hollow 1.5Green rosella (Platycercus caledonicus), other trunk hol-low
12.3
Ar et al. 2004 Middle East Israel, elliptical entrances andcylindrical cavities assumed
Syrian woodpecker (Dendrocopos syriacus) 1.2
Artificial cavities and boxesTaylor and Hooper1991
North America Drilled cavities in live trees,circular entrance andcylindrical cavity
Red-cockaded woodpecker (Picoides borealis), drilledcavity
0.4
Menkhorst 1984 Australia Nest boxes with circularentrances and cubicalcavities, ordered by V/A
Bird and marsupial nest box, 15 cm entrance diameter 1.7Bird and marsupial nest box, 12 cm entrance diameter 2.7Bird and marsupial nest box, 8 cm entrance diameter 6.1Bird and marsupial nest box, 5 cm entrance diameter 15.6
Wardell-Johnson 1986 Australia Nest boxes with elliptical andcircular entrances and cubicalcavities, boxes numbered inaccordance to source andordered by V/A
Mardo (Antechinus flavipes leucogaster), nest box type 7 0.7Mardo (Antechinus flavipes leucogaster), nest box type 6 1.4Mardo (Antechinus flavipes leucogaster), nest box type 8 4.8Mardo (Antechinus flavipes leucogaster), nest box type 5 4.6Mardo (Antechinus flavipes leucogaster), nest box type 2 5.1Mardo (Antechinus flavipes leucogaster), nest box type 3 6.1Mardo (Antechinus flavipes leucogaster), nest box type 1 6.2Mardo (Antechinus flavipes leucogaster), nest box type 4 7.5
Lindenmayer et al.2009
Australia Nest boxes with circular en-trances and cubical cavities
Small marsupial nest box 9.3Large marsupial nest box 4.6
Note: Cavity configurations are restricted, where verification was possible, to cavities in which the single entrance was near the top of the interiorvolume. Many studies did not provide enough information from which to estimate configurations and volumes and could not be included in this table.Higher V/A values result in reduced mixing rates.
aDiameter at the midpoint of the range.bVolume at the midpoint of the range.cActive nests; 42% were enclosed cavities resulting from branch drop, the rest were open-top cavities from trunk shear.
1668 Can. J. For. Res. Vol. 41, 2011
Published by NRC Research Press
and inside of the cavity on e-folding times is most likely theresult of the lower density of the heated gas. Depending onthe entrance diameter, gas volume fluxes either stayedroughly constant or increased by as much as 100%, thoughoscillating rapidly and sometimes erratically, as the outsidegas temperature rose. However, density of an ideal gas is in-versely proportional to temperature, so the density of thetracer gas decreased to about 62% of its room temperaturevalue over the course of the simulation, thereby decreasingmass flux (the product of density and volume flux) enoughto compensate, or overcompensate, for the increased volumeflux and increase e-folding times of filling overall.It is unlikely that a buoyant plume within a forest canopy
would maintain a constant direction directly toward a realcavity entrance (i.e., it is just as likely to approach the sideof the bole opposite the canopy entrance). In addition, theplume will “puff” and also be influenced by the local, andmost likely turbulent, wind field. Therefore, because themodel represented by eq. 10 assumes a constant flow direc-tion toward the cavity entrance, it may significantly overpre-dict cavity concentrations in a real wildland fire scenario. Aswith other engineering risk analysis models, this is desirablebecause the model then provides a built-in safety factor.Though our example model application (Fig. 9) assumed aconstant AOI of 0°, in future applications, it would be moreconservative to assume an AOI of 45° because it results inreduced e-folding times and, thus, more rapid mixing. Notealso that no allowance has been made for the effect that oc-cupants of the cavity might have, either by respiration or byconvective flow from body heat, on the ventilation rate.Equation 5, in combination with the observed mean wind
speed and eqs. 11 and 12, which provide empirical approxi-mation for the values of the parameters needed by eq. 5, mayhave wide applicability as the range of cavity V/A spanned bythe numerical and physical experiments overlaps a variety ofsingle-entrance tree cavities found around the world, bothnatural and artificial (Table 3). However, eq. 5 most likelydoes not apply to single-entrance burrows or, because ofchimney effect, shelters with multiple entrances at differentheights (e.g., hollowed tree boles with entrances both neartheir bases and well above the ground). In addition, the ef-fects of entrance tunnel length and stem diameter were notstudied, though their impacts on the model are expected tobe minimal. Shelters for which the entry tunnel is at the mid-point or bottom of the cavity may not have the same responseas the top-tunnel cavities used in these experiments, becauseheated gases may be trapped at the top of the cavity. Furtherwork on the model should include the incorporation of toxic-ity effects and the use of standard lognormal curves to ap-proximate the concentrations of toxins outside the shelter(eq. 12), based on fire plume simulations, to represent timeseries of gas concentrations and temperatures at variousheights over a range of fire spread rates and intensities. Inaddition, the interaction between forest canopy structure andwind can modify the turbulence statistics (Bohrer et al. 2009)and resulting dispersion within the canopy subdomain(Bohrer et al. 2008) and therefore affect aeration rates in single-entrance cavities. Thus, the effect of the forest canopy on gasflow should ultimately be included. Finally, buoyant flowcaused by the body heat of cavity occupants may be added
to the model to ensure realistic modeling of cavity ventila-tions rates.
ConclusionThe correspondence between modeled levels of cavity CO
and those measured in the field experiment is encouragingand supports the concept of model building by virtual experi-ments. The model represented by eqs. 5, 11, and 12 providesa useful tool for estimating the concentration of combustionproducts in a single-entrance cavity exposed to wildland fire(Fig. 9). To the authors’ knowledge, such a tool has beenheretofore unavailable. As is the usual practice in engineeringand fire management, the model tends toward overestimates,thus providing a safety factor for forest managers and ecolo-gists who wish to estimate, based on burn prescriptions andmeteorological predictions, the possible effects of wildlandfire on sheltered fauna.
AcknowledgementsWe thank William (Ruddy) Mell, Randy McDermott, and
Kevin McGrattan for their suggestions during this projectand Kyle Maurer and Dekel Shlomo for assistance in the fireexperiment. We also thank Robert Kremens, who designedand built the meteorology and CO sensor packages used toobtain the data shown in Figs. 7, 8, and 9. This work wassupported by a grant from the Joint Fire Sciences Program(05-2-1-24) and the National Fire Plan. A.B. was funded inpart by NASA-NESSF (fellowship NNX09A026H). G.B.was funded in part by the U.S. Department of Agriculture(USDA) Forest Service Northern Research Station Labora-tory in Lansing, Michigan (research joint venture agreementFS-NRS-06-Fire-10-01), the USDA Forest Service NorthernResearch Station in Delaware, Ohio (agreement 09-CR-11242302-033), the U.S. Department of Energy’s Office ofScience (BER) through the Midwestern Regional Center ofthe National Institute for Climatic Change Research at Mich-igan Technological University (award DE-FC02-06ER64158),and the National Science Foundation (grants DEB-0911461and DEB-0918869). Any opinions, findings, and conclusionsor recommendations expressed in this material are those ofthe author(s) and do not necessarily reflect the views of theNational Science Foundation.
ReferencesAr, A., Barnea, A., Yom-Tov, Y., and Mersten-Katz, C. 2004.
Woodpecker cavity aeration: a predictive model. Respir. Physiol.Neurobiol. 144(2–3): 237–249. doi:10.1016/j.resp.2004.04.019.PMID:15556106.
Aubrey, K.B., and Raley, C.M. 2002. The pileated woodpecker as akeystone habitat modifier in the Pacific Northwest. In Proceedingsof the Symposium on the Ecology and Management of DeadWood in Western Forests. Edited by W.F. Laudenslayer, P.J. Shea,B.E. Valentine, C.P. Weatherspoon, and T.E. Lisle. USDA ForestService, Pacific Southwest Research Station, General TechnicalReport PSW-GTR-181. pp. 257–274.
Barnett, C.R. 2002. BFD curve: a new empirical model for firecompartment temperatures. Fire Saf. J. 37(5): 437–463. doi:10.1016/S0379-7112(02)00006-1.
Bohrer, G., Katul, G.G., Nathan, R., Walko, R.L., and Avissar, R.2008. Effects of canopy heterogeneity, seed abscission and inertia
Bova et al. 1669
Published by NRC Research Press

on wind driven dispersal kernels of tree seeds. J. Ecol. 96(4): 569–580. doi:10.1111/j.1365-2745.2008.01368.x.
Bohrer, G., Katul, G.G., Walko, R.L., and Avissar, R. 2009.Exploring the effects of microscale structural heterogeneity offorest canopies using large-eddy simulations. Boundary-LayerMeteorol. 132(3): 351–382. doi:10.1007/s10546-009-9404-4.
Chaplin, G.C., Randall, J.R., and Baker, C.J. 2000. The turbulentventilation of a single opening enclosure. J. Wind Eng. Ind.Aerodyn. 85(2): 145–161. doi:10.1016/S0167-6105(99)00136-1.
Copeyon, C.K., Walters, J.R., and Carter, J.H., III. 1991. Induction ofred-cockaded woodpecker group formation by artificial cavityconstruction. J. Wildl. Manage. 55(4): 549–555. doi:10.2307/3809497.
Dickinson, M.B., Norris, J., Bova, A.S., Kremens, R.L., Young, V.,and Lacki, M.J. 2010. Effects of wildland fire smoke on a tree-roosting bat: integrating a plume model, field measurements, andmammalian dose–response relationships. Can. J. For. Res. 40(11):2187–2203. doi:10.1139/X10-148.
Driver, C., Ollero, J., Su, Y.F., Fulton, R., Dennis, G., Tiller, B.,Balbach, H., and Reinbold, K. 2002. Effects of fog oil smoke onthe hatchability and fledgling survival of the house sparrow(Passer domesticus), a nestling-surrogate for the red-cockadedwoodpecker. U.S. Army Corps of Engineers, Engineer Researchand Development Center, ERDC/CERL Technical Report TR-02-34.
Engstrom, R.T. 2010. First-order fire effects on animals: review andrecommendations. Fire Ecol. 6(1): 115–130. doi:10.4996/fireecology.0601115.
Etheridge, D.W. 2002. Nondimensional methods for natural ventila-tion design. Build. Environ. 37(11): 1057–1072. doi:10.1016/S0360-1323(01)00091-9.
Franzreb, K.E. 1997. Success of intensive management of a criticallyimperiled population of red-cockaded woodpeckers in SouthCarolina. J. Field Ornithol. 68(3): 458–470.
Guelta, M., and Balbach, H.E. 2005. Modeling fog oil obscurantsmoke smoke penetration into simulated tortoise burrows and batcolony trees. U.S. Army Corps of Engineers, Engineer Researchand Development Center, ERDC/CERL Technical Report TR-05-31.
Guelta, M., and Checkai, R.T. 2001. Methodology for measurementof fog oil smoke penetration into a red-cockaded woodpecker nestcavity. U.S. Army Soldier and Biological Chemical Command,Edgewood Chemical Biological Center, ECBC-TR 152.
Haseler, M., and Taylor, R. 1993. Use of tree hollows by birds insclerophyll forest in north-eastern Tasmania. Tasforests, 4: 51–56.
Ligon, J.D. 1970. Behavior and breeding biology of the red-cockadedwoodpecker. Auk, 87: 255–278.
Lindenmayer, D.B., Welsh, A., Donnelly, C., Crane, M., Michael, D.,Macgregor, C., McBurney, L., Montague-Drake, R., and Gibbons,P. 2009. Are nest boxes a viable alternative source of cavities forhollow-dependent animals? Long-term monitoring of nest boxoccupancy, pest use and attrition. Biol. Conserv. 142(1): 33–42.doi:10.1016/j.biocon.2008.09.026.
McGrattan, K., McDermott, R., Prasad, K., Hostikka, S., and Floyd,J. 2009a. Fire Dynamics Simulator (FDS) (version 5). FDStechnical reference guide. Volume 3: validation. NIST SpecialPubl. 1018-5. Available at http://www.fire.nist.gov/fds/documentation.html (accessed on 4 February 2010).
McGrattan, K., Hostikka, S., and Floyd, J. 2009b. Fire DynamicsSimulator (FDS) (version 5). FDS user guide. NIST Special Publ.1019-5. Available at http://www.fire.nist.gov/fds/documentation.html (accessed 4 February 2010).
Menkhorst, P.W. 1984. Use of nest boxes by forest vertebrates inGippsland: acceptance, preference, and demand. Aust. Wildl. Res.11(2): 255–264. doi:10.1071/WR9840255.
Murphy, S., Legge, S., and Heinsohn, R. 2003. The breeding biologyof palm cockatoos (Probosciger aterrimus): a case of a slow lifehistory. J. Zool. (Lond.), 261(4): 327–339. doi:10.1017/S0952836903004175.
O’Brien, J.J., Stahala, C., Mori, G.P., Callaham, M.A., Jr., and Bergh,C.M. 2006. Effects of prescribed fire on conditions inside a CubanParrot (Amazona leucocephala) surrogate nesting cavity on GreatAbaco, Bahamas. Wilson J. Ornithol. 118(4): 508–512. doi:10.1676/05-118.1.
Okubo, A., and Levin, S.A. 2001. Diffusion and ecological problems:modern perspectives. 2nd ed. Springer-Verlag, New York.
Saunders, D.A., Smith, G.T., and Rowley, I. 1982. The availabilityand dimensions of tree hollows that provide nest sites forcockatoos (Psittaciformes) in Western Australia. Aust. Wildl.Res. 9(3): 541–556. doi:10.1071/WR9820541.
Scott, V.E., Evans, K.E., Patton, D.R., and Stone, C.P. 1977. Cavity-nesting birds of North American forests. USDA Forest Service,Agric. Handb. 511. Available from http://www.na.fs.fed.us/spfo/pubs/wildlife/nesting_birds (accessed 21 January 2010).
Taylor, W.E., and Hooper, R.G. 1991. A modification of Copeyon’sdrilling technique for making artificial red-cockaded woodpeckercavities. USDA Forest Service, Southeastern Forest ExperimentStation, GTR-SE-72.
Wardell-Johnson, G. 1986. Use of nest boxes by mardos, Antechinusflavipes leucogaster, in regenerating Karri forest in South WesternAustralia. Aust. Wildl. Res. 13(3): 407–417. doi:10.1071/WR9860407.
1670 Can. J. For. Res. Vol. 41, 2011
Published by NRC Research Press