A model of fluff layer erosion and subsequent bed erosion in the presence of the bioturbator,...
29
A model of uff layer erosion and subsequent bed erosion in the presence of the bioturbator, Hydrobia ulvae by Francis Orvain 1,2 , Pierre Le Hir 3 and Pierre-Guy Sauriau 1 ABSTRACT Previous studies have shown that the gastropod Hydrobia ulvae destabilizes the top layers of ne-grained sediments. This process is mediated by the formation of a “biogenic” uff layer that includes tracks, faecal pellets and mucus. This uff layer has been shown to be easily resuspended before general bed erosion. In order to examine how uff layer and bed erosion interact, ume experiments were performed with uid sediments of varying water contents. Ten thousand snails were placed and allowed to crawl for 5 h on the sediment surface,and then the resuspendedsediment mass was measured in response to step-wise shear stress increases. Two distinct erosion phases were observed: (1) initial resuspension of the uff layer and (2) the subsequent bed erosion. Both the bioturbation by snails and sediment water content interacted positively to increase erosion rates during the phase of uff layer erosion.The presenceof a uff layer due to the snail’s activitiesdid not affect rates of subsequent bed erosion. A vertical model (1DV) was developed to simulate the succession in time of the two distinct erosion phases. Within this deterministic model, erosion rates of the uff layer depend on the quantity of sediment that is present in the uff layer. Previous behavioral observations of track formation mechanisms were integrated into model equations to account for the snail density and the water content dependence.The observed bed erosion was fairly well reproduced by considering the variation with depth of the sediment density as measured in the experiments. This model suggests a new approach for assessing the erosion of natural sediments under the in uence of H. ulvae populationdensity,water contentand tidal currents. 1. Introduction Mud at sediments, subjected to tidal currents that cause episodic resuspension and deposition events, may consolidate during slack high tide periods and low tide periods of emersion. The cyclic nature of the resuspension and deposition events leads to the development of a vertical structure that can, in turn, create vertical variation in cohesive sediment erodibility. Bed erodibility (or the sediment bed’s resistance to erosion) is described by two parameters: the critical threshold and erosion rate (Amos et al., 1992, 1997). The mode of erosion and the quantity of eroded sediment both vary with the 1. CREMA (CNRS-IFREMER UMR 10), Centre de Recherche sur les Ecosyste `mes Marins et Aquacoles de L’Houmeau, Place du Se ´minaire, BP 5, 17137 L’Houmeau, France. 2. Present address: Laboratoire de Biologie et BiotechnologieMarine, Universite ´ de Caen, 14032 Caen Cedex, France. email: [email protected] 3. IFREMER, Centre de Brest, DEL/EC-TP, BP 70, 29280 Plouzane ´, France. Journal of Marine Research, 61, 823–851, 2003 823
Transcript of A model of fluff layer erosion and subsequent bed erosion in the presence of the bioturbator,...

A model of uff layer erosion and subsequent bed erosion inthe presence of the bioturbator Hydrobia ulvae
by Francis Orvain1 2 Pierre Le Hir3 and Pierre-Guy Sauriau1
ABSTRACTPrevious studies have shown that the gastropod Hydrobia ulvae destabilizes the top layers of
ne-grained sediments This process is mediated by the formation of a ldquobiogenicrdquo uff layer thatincludes tracks faecal pellets and mucus This uff layer has been shown to be easily resuspendedbefore general bed erosion In order to examine how uff layer and bed erosion interact umeexperiments were performed with uid sediments of varying water contents Ten thousand snailswere placed and allowed to crawl for 5 h on the sediment surface and then the resuspendedsedimentmass was measured in response to step-wise shear stress increasesTwo distinct erosion phases wereobserved (1) initial resuspension of the uff layer and (2) the subsequent bed erosion Both thebioturbation by snails and sediment water content interacted positively to increase erosion ratesduring the phase of uff layer erosionThe presenceof a uff layer due to the snailrsquos activitiesdid notaffect rates of subsequent bed erosion A vertical model (1DV) was developed to simulate thesuccession in time of the two distinct erosion phases Within this deterministic model erosion ratesof the uff layer depend on the quantity of sediment that is present in the uff layer Previousbehavioral observations of track formation mechanisms were integrated into model equations toaccount for the snail density and the water content dependenceThe observed bed erosion was fairlywell reproduced by considering the variation with depth of the sediment density as measured in theexperiments This model suggests a new approach for assessing the erosion of natural sedimentsunder the in uence of H ulvae populationdensity water content and tidal currents
1 Introduction
Mud at sediments subjected to tidal currents that cause episodic resuspension anddeposition events may consolidate during slack high tide periods and low tide periods ofemersion The cyclic nature of the resuspension and deposition events leads to thedevelopment of a vertical structure that can in turn create vertical variation in cohesivesediment erodibility Bed erodibility (or the sediment bedrsquos resistance to erosion) isdescribed by two parameters the critical threshold and erosion rate (Amos et al 19921997) The mode of erosion and the quantity of eroded sediment both vary with the
1 CREMA (CNRS-IFREMER UMR 10) Centre de Recherche sur les Ecosystemes Marins et Aquacoles deLrsquoHoumeau Place du Seminaire BP 5 17137 LrsquoHoumeau France
2 Present address Laboratoire de Biologie et BiotechnologieMarine Universite de Caen 14032Caen CedexFrance email FOrvainiutcaenunicaenfr
3 IFREMER Centre de Brest DELEC-TP BP 70 29280 Plouzane France
Journal of Marine Research 61 823ndash851 2003
823
magnitude of the bed shear stress and the structure of the sediment bed (Mehta andPartheniades 1982 Mehta 1988)
The critical threshold is de ned as the point in time when large quantities of sedimentare resuspended rapidly from a sediment bed This critical threshold is related togeotechnical properties principally water content and sediment density (Mehta andPartheniades 1982 Amos et al 1988 1992) Depending on the consolidation status ofsediment bed affecting water content pro le different modes of erosion (for soft and densebeds) are classically described (Mehta 1988 Amos et al 1992) Both modes of erosionare able to co-occur on the same station in the eld (Amos et al 1992) However thesediment-water interface is not de ned by a sharp gradient but behaves as a continuumgradient (Pearson 2001) and sometimes a single erosion threshold is dif cult to establishParticles may become resuspended at very low current ow velocities on fresh muddydeposits before the critical threshold for bed erosion is achieved (Lavelle and Mofjeld1987) This initial erosion observed just before the critical threshold for bed erosion isgenerally termed ldquo uff layer erosionrdquo (Shimeta et al 2002)
Fluff layer erosion had been described as ambient turbidity or the result of experimentalartefacts since such small quantities of sediment are involved Currently the importanceof the uff layer in sediment erosion studies has been recognized (Amos et al 1997Paterson and Black 1999) The uff layer is a matrix of sediment that is disconnected fromthe underlying sediment bed and it may include deposited aggregates deposit-feeder tracksand faecal pellets and disturbed sediment due to deposit-feeding activities Macrofaunalpopulationsare known to ingest resuspended particles (Willows et al 1998 2000a b) andmacrofaunal bioturbation can substantially enhance uff layer erosion (Widdows et al2000a b) For example it has been demonstrated that bioturbation by the common mudsnail Hydrobia ulvae enhances the erosion rates of consolidated ne-grained surfacesediments (Andersen et al 2002 Orvain 2002) However the subsequent bed erosion wasnot observed in these studies
A model developed by Willows et al (1998) described the effects of the deposit-feederMacoma balthica on surface destabilization This model was suitable for describingsurface sediment destabilization due to Hydrobia ulvae bioturbation activities (Orvain2002) but did not reproduce the bed erosion subsequent to uff layer erosion In order tomodel the effects of H ulvae on the resuspension of natural sediments data are required onboth uff layer erosion and bed erosion
Jumars et al (1981) proposed a model where faecal pellets produced by deposit-feedersare incorporated into a surface compartment that is allowed to behave differently from theunderlying sediment bed Inspired by their approach we used ume experiments toexamine the (1) uff layer erosion after a period of emersion and bioturbation and (2) thesubsequent general bed erosion The experiments were conducted on uid ne-grainedmud at sediments with varying water contents to quantify the effects of H ulvaebioturbationon erosion properties We modi ed an existing 1DV model of the SiAM series
824 [61 6Journal of Marine Research
(Brenon and Le Hir 1999 Le Hir et al 2001) to estimate the resuspension of a separatecompartment that was the uff layer generated by H ulvae grazing activities
2 Flume experiments
a Benthic ume
The ume prototype called HYDROBIOS (ldquoHYDROdynamic amp BIOlogical Synergyrdquoinstalled at the CREMA laboratory LrsquoHoumeau France) is a 3 m long verticallyrecirculating ow system (Fig 1) where water ow is generated by two turbines placed inthe return pipe in the lower part of the ume A frequency regulator regulates the propellervelocity and the system can generate free-stream velocities up to 06 m s21 with anaccuracy of 001 m s21 The test section where the sediment is located is 040 m wide and090 m long and 180 m from the ow entrance The width of the ume in the test sectionis half the size of the entrance width (ie 080 m) in order to reduce wall effects
The curved shape of the walls at the entrance and the use of a honeycomb grid (10 mmgrid diameter) placed across the full width of the entrance generated a fully turbulent anduniform ow across the test section At the exit of the test section where upstream effectscould occur there was minimal interference at the test section and no sign of returncirculation The ume contained 116 m3 of ltered seawater when the water depth at thetest section was 015 m
An ultrasonic velocity meter (Minilab system) was used to measure vertical ow pro lesat 9 points in the test section Estimates were made of ow heterogeneity over the sectionusing bed shear stress roughness length and Reynolds numbers At each point 8 currentpro les were measured for 8 different propeller speeds (Fig 2A) and for each pro le 17velocity measurements were taken The ume set-up produced a stable and unidirectional ow assuring reproducibility of ow conditions No signs of secondary circulation (suchas a deviation of the ow from the main axis of the channel or anomalies in current pro les)were observed
Figure 1 Schematic representationof the benthic ume used in the experiments
2003] 825Orvain et al Bioturbation amp uff layer erosion
Assuming a logarithmic pro le we used the so-called universal von Karman-Prandtlldquolaw of the wallrdquo relationship within the logarithmic layer
u~z 5uk
lnS z
z0D
where u( z) is the mean horizontal velocity at height z (m s21) u is the friction velocity(m s21) k is the von Karmanrsquos constant (041) and z0 is the roughness length (m) Theshear velocity and the roughness length were deduced from the logarithmic part of the owpro le (Fig 2B) where the plot of u( z) versus ln( z) gives a linear relationship with a slopeof ku and an intercept at ln( z0) If the ow is smooth and turbulent (ie characterized bya boundary Reynolds number Re 5) z0 is proportional to the friction velocity and uidviscosity (n 5 1 3 1026 m2 s21) such that z0 5 011yu If the ow is rough andturbulent (ie for Re 70) z0 is a function of the roughness of the bed (denoted by ks)such that z0 5 ks30 If the bed is at (ie not covered by ripples) ks is termed the
Figure 2 Characterization of the recirculating ume conditions (A) Velocity pro les measured atthe center of the test section for 8 different propeller velocities For each pro le velocitymeasurements were made at 17 different depths z from the bottom (n 5 2000) (B) Relationshipbetween ln( z) and u( z) within logarithmicand in nite layers Averaged values of u( z) (crosses)6SD (triangles) are given (C) Relationship between the roughness length ( z0 ) and shear velocity(u) at the center of the test section (D) Spatial heterogeneity of the averaged friction velocity(u) on the test section of the ume for u` 5 05 m s21
826 [61 6Journal of Marine Research
ldquoNikuradse roughnessrdquo and is a function of grain size (D in m) For the at muddy bed weused we obtained a dependence of z0 on shear velocity (Fig 2C) which suggested ahydraulically smooth boundary To verify this we calculated the boundary Reynoldsnumber for the eight current pro les measured at the center of the test section Thiscalculation holds
Re 5uD
n
Even when considering a high grain diameter of 100 mm we obtained a maximum Revalue of 33 which is below the limit of 5 that characterizes a hydraulically smoothboundary
Bed shear stress (tf) was calculated from friction velocity according to tf(Pa) 5 r 3u2 where r 5 water density (1020 kg m23 for the sea water used in our experiments)The top of the logarithmic layer (hlog) was always chosen as 20 of the water depth(3 cm) since this value systematically allowed the best r2 in the determination of u(Figs 2A and 2B) The values of current velocities were not signi cantly different withinthe layer above 3 cm while a signi cant difference was obtained between the value ofcurrent velocity at 2 cm and those above 3 cm The in nite velocity (u` ) is determined byaveraging velocities measured above this distance from the bed hlog 5 3 cm to the waterdepth (d)
u` 5 Ehlog
d
udz
The relationship between u u` and control frequency (denoted Fr) has been establishedfrom velocity pro les measured at the center of the test section We obtained
u 5 458 3 1024 3 F r ~r2 5 097 and u 5 544 3 1022 3 u` ~r2 5 096
Since resuspension begins where bed shear stress is at a local maximum we estimatedthe spatial heterogeneity in units of bed shear stress Using such a spatial characterizationof the ow across the test section allowed us to calculate accurately the critical bed shearstress for resuspension and the succession of bed shear stresses during the experimentsThese calculations showed only a transversal heterogeneity of bed shear stress and nolongitudinal heterogeneity (Fig 2D) Maximum bed shear stresses occurred on both sidesof the middle part of the test section and the maximum bed shear stress was up to 125 timesgreater than the bed shear stress at the center The maximum friction velocity wasdescribed by the following relationship
umax 5 458 middot 1024 3 Fr 3 125
The maximum bed shear stress on a test section was 16 Pa for the highest testedfrequency
2003] 827Orvain et al Bioturbation amp uff layer erosion
b Experimental procedures
Experiments were designed to test two crossed factors sediment density and snaildensity Presence and absence of snails was tested (0 and 10000 snails m22) andthree treatments for sediment dry densities (the targeted sediment dry densities were 260230 and 190 kg m23 respectively denoted as subsets 1 2 and 3 in Table 1) Twoduplicated experiments in each combination of the 3 3 2 factorial design were completedso that a total of 12 ume experiments were conducted
An ldquoinitialrdquo stock of silty mud characterized by 95 particles 63 mm on average anda mean size between 1 to 6 mm (see Gouleau et al 2000 Bassoulet et al 2000 for adetailed description) was collected from Brouage mud at in Marennes-Oleron Bay (SWFrance) Only deep and oxic layers (10ndash20 cm) were used for the stock mud to avoid anyinteraction with active diatom populations in the resuspension experiments The mud wassieved (1 mm) to remove the macrofauna and then homogenized at regular intervalsduring a storage period of 1 month
Fluid sediments were prepared from this stock of ldquoinitialrdquo sediment by adjusting theseawater volumes used for dilution at the beginning of each experiment such that thedesired sediment dry densities would be achieved The sediment dry density (ie rd inkg m23) was calculated from the water content using the following formula
rd ~kg m23 5rs middot 1000
w100 middot rs 1 1000
where rs is the average grain density (2650 kg m23) and w is the water content (g watergdry sediment 3 100) which was measured by drying at 60degC for 3 days The actual drydensities between replicated experiments were different due to incomplete homogeniza-tion Thus the dry density of each prepared sediment bed (denoted r d
j for each experiment
Table 1 Summary of sediment dry densities (in the topmost centimeter) and critical threshold forbed erosion of the three subsets of four experiments
Experimental subsetsDry densities
(kg m2 3)Critical threshold for erosion
(tb in Pa)
Subset 1
27046 6 963 13425514 6 1106 13826074 6 848 10425732 6 741 090
Subset 2
23899 6 1031 08523094 6 728 08222762 6 574 08024504 6 949 083
Subset 3
19009 6 360 05219759 6 1930 06018562 6 1862 07418944 6 570 072
828 [61 6Journal of Marine Research
j) was measured systematically (average dry densities were 26091 6 677 23565 6 788and 19068 6 500 kg m23 for the experiment subsets 1 2 and 3 respectively see Table 1for all values)
Experimental tanks were lled with prepared and mixed sediments and they were placedimmediately in the ume The validity of the independently measured shear stressesdepended on our ability to reproduce similarly at and smooth bottom topographies (asduring ow pro le measurements) It was desirable to minimize edge effects especiallywhere the sediment adjoined the upstream side of the ume base To limit these effects anadditional 10 d m3 of prepared mud was spread over the tank bottom and was shaped toadjoin the ume bottom on both the downstream and upstream edges Nevertheless due tothe nature of mass erosion the bed roughness was expected to change locally during theresuspension experiments
After the installation of the sediment test bed the ume was lled with 10 mm lteredseawater until a thin water layer (5 mm) appeared on the sediment surface The salinity wasadjusted systematically to between 30ndash31 PSU Next 10000 snails m22 were added to thetest section The test bed was walled to prevent the snails from escaping Snails are mobileonly in the presence of water but they remained on the test section where they couldactually climb on the walls at a distance equivalent to the water depth of 5 mm (Orvain andSauriau 2002) In such conditions snails could (1) crawl on sediment bed (2) burythemselves if the upper layer of sediment is uid (only for subset 3) (3) climb on walls at adistance equivalent to the 5-mm water depth and (4) oat at waterair interface Such acovering by a thin layer of water is encountered by snails in most of their habitatsthroughout natural low tide After 5 h of bioturbation under these simulated low-tideconditions walls were removed from the test bed and the ume was lled until the watercolumn height reached 015 m without disturbing the sediment surface The uff layer wasnot washed away due to lling Sediments without Hydrobia ulvae were treated the sameway
For each subset small control boxes were lled with uid mud that was prepared in asimilar way to the ume sediments Three cores were taken from these control boxes usingsyringes (3 cm in diameter) to measure the depth pro les of the dry density The threenonfrozen cores were sectioned every two millimeters over a total of two centimetersThere was little scatter in dry density of the super cial uid layers (Fig 3) The decrease indry density of the topmost sediments was more pronounced for the most uid sediments(ie subset 3) and this probably re ected the differential ldquosedimentationrdquo that took placeduring the 5 h of simulated low tide
Three simple logarithmic functions (ie for each pro le see equations in the descriptionof Fig 3) were tted to the curves of dry density (rd(C)
i for layer i of controls) as a functionof depth of the layer zi
rd~Ci 5 x1ln~zi 1 x2
2003] 829Orvain et al Bioturbation amp uff layer erosion
Independent values of rd( j)0ndash1 (within the topmost centimeter for each experiment j see
Table 1) measured from the ume sediments were used to estimate the dry density pro letypical of each experiment by the following formula
rd~ji 5 rd~C
ird~C
0ndash1
rd~j0ndash1
where rd( j)i is the estimated dry density within layer i and for experiment j rd(C)
i is theadjusted dry density within the layer i of controls (Fig 3) rd(C)
0ndash1 is the dry density ofadjusted pro les within the topmost centimeter of control sediments (Fig 3) and rd( j)
0ndash1 is themeasured dry density within the topmost centimeter of each ume experiment j Further-more critical thresholds were calculated in the models on the basis of these estimated drydensity pro les to describe any speci c differences due to experimental conditions anddepth
Sediment resuspension was quanti ed in response to stepwise increases in currentvelocity (14 increments from 0 to 060 m s21 each lasting 20 min) Since the animalsdispersed very rapidly and randomly during ume lling no animals remained on the testsection and thus did not in uence bed roughness by their shells Turbidity measured as
Figure 3 Dry density pro les (n 5 3) of the three subsets 1 2 and 3 (A B and C respectively)Logarithmic equations were tted to the measured pro les (solid lines) The adjusted equation isrd ( C )
i 5 x1 ln( z i) 1 x2 where rd ( C )i is the dry density in the section i (from 1 to 10) of controls x1
and x2 are the coef cients of the logarithmicpro le (3 differentvalues for each subset) and zi is thedepth of the vertical section (i)
830 [61 6Journal of Marine Research
suspended particulate matter (SPM in kg m23) in the ume was monitored at 15-s intervalsusing an OBS (Optical Backscattering Sensor)
The turbidity calibration was conducted on samples taken at the end of every currentincrement Water samples were taken from the downstream test section and preliminarytests were performed to check water column homogeneity at this location Duplicate watersubsamples (1 d m3) were immediately ltered through pre-weighed Whatman GFC lters which were dried at 50degC for 3 days after ltering and then re-weighed
For each experiment the probe turbidity time series were calibrated from the set ofpooled 28 3 12 SPM data (r2 5 0998 P 0001) Resuspension data were convertedinto sediment mass eroded per unit area (M in kg m22) according to the formula M 5SPM(VS) where V is the ume volume (m3) and S is the test section surface (m2) Thisallowed us to make direct comparisons with in situ or other ume data The thresholdvalues of friction velocity for resuspension (ucr) were determined by regression of SPMagainst log(u) in regions where SPM increased monotonically (Sutherland et al 1998)The best- t regression lines of the data were searched by using a semi-logarithmic equationSPM 5 A 1 B log(u) to search for the in exion point and the solution of the interceptwith the baseline SPM 5 0 was calculatedThe equivalent critical threshold values for bederosion (tb) were then deduced according to tb 5 r 3 ucr
2
c Resuspension results
The values of critical threshold for bed erosion were clearly dependent on the sedimentdry density (Table 1) Mean values of critical threshold for bed erosion were 116 6
023 Pa 082 6 002 Pa and 065 6 010 Pa for subsets 1 2 and 3 respectively Howeverthere was evidence in the resuspension data (Figs 4A 4C and 4E) that there was a ufflayer erosion before the in exion in resuspension data at the critical threshold for bederosion
In all experiments uff layer erosion took place as soon as the critical threshold for ufflayer of 012 Pa was reached (Figs 4A 4C and 4E) Erosion of the uff layer was gradualand the erosion rates were low After each ow increase the amount of eroded materialfrom the uff layer increased measurably during a period of up to 5 min after which aplateau was reached This suggests that all the material from uff layer that was availablefor erosion at a particular bed shear stress was eroded rapidly A new increase in bed shearstress was required to cause a new resuspension of material from the uff layer This givesrise to a very gradual resuspension of the uff layer and especially mucus-rich trackssome of them being able to resist to current velocity up to 40 cm s21 while the main part oftracks were eroded at lower current velocity (Figs 4A 4C and 4E)
During erosion of the uff layer higher quantities of sediment were resuspended afterbioturbation by Hydrobia ulvae than without (Fig 4) The crawling activities of snailsduring the 5-hour simulated low tide left tracks on the sediment surface Substantial partsof uff layer particles were incorporated in mucus-rich tracks that were produced by snailsand that were gradually dislodged from the sediment bed to be easily eroded (visual
2003] 831Orvain et al Bioturbation amp uff layer erosion
Figure 4 Measured time series of the eroded sediment mass (M in g m22 ) during the experimentsSubsets 1 2 and 3 each had a different dry bulk sediment density (ca 261 236 and 190 kg m2 3 respectively) experiments were performed both with Hydrobia ulvae (circles) and without snails(triangles) The biogenic uff layer erosions (note that the Y-axis has been expanded to100 g m22 ) are shown in plots labeled A C and E (for subsets 1 2 and 3 respectively) and thecorrespondingsubsequentbed erosions for the same subsets are depicted in plots B D and F
832 [61 6Journal of Marine Research
observation) Resuspension curves without snails revealed that there were also smallquantities of dislodged particles present on the bed that were not formed by snail activityIn the presence of snails erosion decreased with dry density during the erosion of the ufflayer (Fig 4A 4C 4E) This result was consistent with the observation that individualcrawling rates and the quantity of tracks increase as sediment water content increases(Orvain and Sauriau 2002)
Once resuspension of the uff layer had occurred there was no further in uence of thesnails on erosion patterns (Figs 4B 4D and 4F) Critical thresholds for bed erosion werehigh (09 Pa) for the sediments with the highest dry density values (subset 1 Fig 4B andTable 1) In this case the scatter in critical shear stresses and erosion curves was large andthe maximum eroded masses were between 2000 and 4000 g m22 Bed failure took placeearlier for more uid sediments (subset 3 Fig 4F and Table 1) and began at a critical bedshear stress from 052 Pa to 074 Pa and all the nal eroded masses were ca 2500 g m22Sediments with an intermediate density (subset 2 Fig 4D and Table 1) also hadintermediate values for critical thresholds (between 08 and 085 Pa) erosion rates andtheir scattering magnitudes
There was a continuous release of bed material whatever the applied shear stress anddecreases in erosion rates within individual shear stress steps (Fig 4F) This is consistentwith the erosion of ldquoplacedrdquo beds (Mehta and Partheniades 1982 Mehta 1988) or with thetransitional erosion Type III reported by Amos et al (1992 1997) Houwing (1999) andSanford and Maa (2001) uff layer erosion is equivalent to the type IA erosion that hasbeen described in situ by Amos et al (1997) and Paterson and Black (1999) With respectto more consolidated sediments (Figs 4B and 4D) the decrease in erosion as bed shearstress increased suggested that bed resistance increased which was consistent with themeasured dry density pro les of the test beds (Fig 3)
3 Model development
a Conceptualization
The primary objectives of this study were to develop a model for uff layer erosion andsubsequent erosion of the underlying sediment bed thus it is required that the erosionthreshold value can be varied vertically The model was developed using a 3-stepapproach summarized as follows (1) analyses of uff layer erosion were made using adeterministic dimensionless model (Fig 5A) (2) next analyses of bed erosion were madewith a 1DV model (Fig 5B) and (3) nally the equations developed for uff layer erosionwere incorporated into the 1DV model (coupled model Fig 5C) A 1DV model forsediment erosion is justi ed since the sediment bed of the model is divided into verticallayers The simulation of laboratory ume experiments did not require 1DV resolution inthe water column as no signs of strati cation were apparent
i The model for uff layer erosion At the beginning of the shear stress chronology (t 5
0) the sediment quantity in the uff layer ( At50 in kg m22) is the sum of the sediment
2003] 833Orvain et al Bioturbation amp uff layer erosion
contained in the snail tracks ( Abtb in kg m22) plus other aggregates present on the bedwhen snails are absent ( A9 in kg m22)
A t50 5 Abtb 1 A9 (1)
Conceptually Abtb is the sediment quantity contained in the snail tracks This mass canbe evaluated as the product of the fraction of sediment area covered by snail tracks (fexpressed as a proportion) track height (hbtb in m) and the sediment concentration withinthe tracks (r uff in kg m23) The sediment area covered by snail tracks (f) depends on theindividual snail speed (a) which varies with water content (Orvain and Sauriau 2002)Track formation is therefore a time-dependent process the surface covered by tracksreaches an asymptotic value when the sediment is fully bioturbated (Orvain and Sauriau2002) The general equations describing the combined effects of sediment water contentand snail density on track formation were
Abtb 5 hbtbr ufff 5 hbtbr uff~1 2 e2ant and a 5a0
1 1 e2h~W2W50 (2)
where hbtb is the height of the tracks (m) r uff the dry density within tracks (kg m23) f isthe fraction of sediment area covered by tracks n is the snail density (snail m22) t is thebioturbation time (in hours h) a is the individual snail crawling rate (m2 h21 snail21) a0
is the maximal crawling rate when w reg ` (m2 h21 snail21) and h and W50 are twoempirical coef cients for the increase of crawling rate as a function of water content(Orvain and Sauriau 2002) The density of crawling snails may vary during the simulatedlow-tide periods due to behavioral uctuations (Orvain and Sauriau 2002) In this studythe snail behavior has been cautiously interpreted and modeled and it has been demon-strated that the uctuation in crawling snail density due to behavior (climbing burying oating crawling) was not necessary to estimate the fraction of sediment area covered bytracks (which was the phenomenon responsible for the creation of the uff layer byHydrobia ulvae in the present study)
The height of tracks (hbtb) was assumed to increase with the water content since snailtracks were deeper in uid layers
hbtb 5 c 3 Wu (3)
where c and u are two empirical parametersThe quantity of aggregates A9 (kg m22) detached from the sediment bed in the absence
of snails varied with water content (Fig 3) according to the empirical law
A9 5 l1Wl2 (4)
The uff layer ( At) has its own low critical threshold (tuff in Pa) We assumed a linearrelationship between erosion rate and the quantity At that remained on the sediment bed atany given time This was estimated with a modi ed Partheniades formulation (1965) asfollows
834 [61 6Journal of Marine Research
E uff 5 aAtS tf
t uff2 1D when ~tf t uff else E uff 5 0 (5)
where Euff is the erosion ux from the uff layer to the water column (kg m22 s21) a isan erosion coef cient (s21) and (tf tuff 2 1) represents the excess shear stress Thesediment volume remaining on the sediment bed ( At in kg m22) varies in time as follows
dAt
dt5 2E uff (6)
This formulation has the advantage of accounting for the gradual shear-induced disruptionof aggregates that we observed in our experiments and also generates a logistic pattern oferosion curves during the erosion process similar to those reported by Willows et al (1998)in experiments with Macoma balthica and by Orvain (2002) for Hydrobia ulvae
The reduction of erosion uxes within each shear stress step can be explained by aspatial heterogeneity of resistance to erosion The amount of mucus secreted by the snailsmay alter the erosion properties of their tracks this is consistent with the experimentalobservation that some tracks are more easily eroded than others Thus it is assumed thatthere is a variation in the critical shear stress relative to the quantity of sediment remainingin the uff layer on the sediment bed ( At)
t uff 5 t uffup 1 d
At50 2 At
At50 (7)
At the initial erosion step the critical shear stress for uff layer erosion is equal to t uffup
During uff layer erosion the aggregate quantity ( At) decreases and the critical shearstress for uff layer erosion increases proportionally
ii The 1DV model for bed erosion We used a 1DV sediment transport model of the SiAMseries (Brenon and Le Hir 1999 Le Hir et al 2001) In this model there is a continuousexchange of sediment between the bed and the water column since as soon as the sedimenthas entered the water column part of the sediment particle population settles onto thesediment bed The particles either remain deposited or are re-eroded depending on theamount of excess shear stress (Fig 5B) The sediment enters and leaves the water columnaccording to the bed erosion and deposition terms (Ebed and D in kg m22 s21 respec-tively)
with Ebed 5 E0 3 rdg 3 S tf
tb2 1D and D 5 WS 3 SPM when tf tb else Ebed 5 0 (8)
where tb is the critical shear stress (Pa) for erosion E0 is the erosion coef cient(kg m22 s21) (tf tb 2 1) represents the excess shear stress and g is an empiricalcoef cient having a power law as a function of dry density (rd in kg m23) The bed erosion ux Ebed (kg m22 s21) is expressed according to a modi ed version of Partheniadesrsquo
2003] 835Orvain et al Bioturbation amp uff layer erosion
(1965) formulation in which erosion rates increase with sediment dry density Thisconditionwas necessary for a full reproductionof experimental data (Figs 4B 4D and 4F)
Due to the ume con guration deposition is assumed to be spatially heterogeneousWhile the sediment surface of the eroded zone is the surface of the ume test section (S 5
036 m2) the surface where deposited layers could accumulate is unknown (S9 in m2)Thus the following general equation was solved
dSPM
dt5 Ebed 3
S
V2 D 3
S9
V5 Ebed 3
S
V2 Ws 3 S9 3
SPM
V (9)
The ume contained a volume of seawater V equal to 116 m3 Both parameters S9 and Ws
were unknown equation and their product [Ws 3 S9] was found as a single parameterthrough minimization tests
The sediment volume of the test bed was divided into layers and vertical pro les ofdry densities were estimated for each experiment (see Section 2b) The initial modellayer thicknesses were identical (300 mm height) however the surface layer thicknesswas allowed to change depending on erosion and deposition processes (see Fig 5B)The critical shear stress (tb) depends on dry density (rd in kg m23) according to apower law
tb 5 crdd (10)
where c and d are two empirical coef cients
iii The coupled 1DV model In addition to the sediment bed the uff layer is included inthe 1DV model (Fig 5C) to account for the sediment volume produced by the bioturbationactivities ( At50 in kg m22) of the snails The thickness of the ldquo uff layerrdquo cell may changein time (5Atruff in m) due to track formation (Eq 2) and erosion (Eq 5) during low tideand high tide respectively
The equations for sediment transport in the 1DV model were modi ed to incorporateinto the balance both erosion terms (E uff and Ebed) already described (Eqs 5 and 8)
dSPM
dt5 ~E uff 1 Ebed 3
S
V2 D
S9
V (11)
As soon as the erosion of this sediment volume began water column turbidity is producedand deposited layers are subject to re-erosion according to Eq 8
d Model parameterization
i Fluff layer erosion Fluff layer erosion (Fig 4A 4C and 4E) was estimated using thedimensionless model described in section 3a(i) (Fig 5A) In order to complete minimiza-tion tests of the parameters in Eqs 4 through 7 a second data set of 20 experiments waspooled with the data presented here The additional data set (Orvain 2002) quanti ed the
836 [61 6Journal of Marine Research
density effects of H ulvae (evaluated at 0 1000 5000 10000 and 50000 snails m22) on uff layer erosion using two higher sediment concentrations (rd ranging between 420ndash490 kg m23 and 300ndash340 kg m23) Experimental procedures were the same as the presentstudy and in these cases no bed erosion was observed but only uff layer erosion wasobserved (Figs 9 and 10) These additional data were re-analyzed to evaluate thedependence on sediment water content and snail density using our new equations for ufflayer erosion
First parameters a and At50 in Eqs 5 through 7 were identi ed by minimization ofthe ordinary least squares (OLS) criterion using a direct search (simplex of Nelder andMead 1965) One common value of a was estimated while independent values of At50
were adjusted for each experimental curve (n 5 32) The critical shear stress forany bioturbated layers was xed to 0118 Pa (calculated from the thresholds shownin Figs 4A 4C and 4E) in both Eqs 5 and 7 reasonable agreement (r2 5 098) wasfound between the variations in measured and computed eroded mass (M) Asexpected At50 estimates for experiments with snails were greater than those withoutsnails and also had a strong dependence on dry sediment density (Fig 6) At50
estimates re ected the combined effects of water content and snail density Theestimates of the amount of material in the uff layer had a sigmoidal pattern as afunction of sediment water content and a von Bertalanffy (1938) curve as a function ofsnail density (Fig 6)
Secondly we tested Eqs 1 through 4 for the dependence of At50 on snail density andsediment water content in light of track formation mechanisms (Orvain and Sauriau2002) To achieve this we minimized the parameters of uff layer erosion functionsusing comparisons to the measured kinetics of eroded mass of the 32 experiments(Table 2) Based on observed crawled surfaces Orvain and Sauriau (2002) developed amodel simulating track formation at the sediment-water interface This model allowedvariations in crawling rates as a function of environmental factors to be simulated Inthis study four parameter sets were adjusted to describe the crawled surface in terms ofbioturbation time snail densities and water content under the following conditions(1) low tide and day (2) high tide and day (3) low tide and night and (4) high tideand night The second parameter set (a0 h and W50 in Eq 2) was used to reproducethe 5 hours of crawling activities with respect to the ume conditions (Table 2)All other parameters of Eqs 1 through 4 (ie a [c 3 r uff] u l1 and l2) wereminimized (Table 2) Functions for uff layer erosion with their associated parameterswere also incorporated into the 1DV model to evaluate the reliability of the presentmodel
Functions for uff layer erosion with their associated parameters (Eqs 1ndash4) can beused to provide an estimate of the proportion of the nonbiogenic aggregates to thesediment quantity in the uff layer in the presence of snails by analyzing the variationof the ratio A9At50 3 100 (Eqs 1ndash 4) This ratio increased with water content and in the
2003] 837Orvain et al Bioturbation amp uff layer erosion
presence of 10000 snails m22 for instance a maximal value of 3 was obtained The uff layer formation is thus essentially attributed to crawling activities of snails
ii Bed erosion A reasonable agreement between variations in measured and computederoded masses (M) was obtained by tting parameters of Eqs 8 through 10 (ie at btE0 a g and Ws) No improvement in t was gained by including the probability ofdeposited material remaining on the sediment bed (tf tcd that is used classically inmathematical models of mud transport see eg Ariathurai and Krone 1976 van derHam and Winterwerp 2001) Computed eroded masses realistically accounted for boththe effects of sediment concentration on critical shear stress and the erosion rate withacceptable adjustments (r2 5 073 Fig 7) Adjustments were improved substantiallywith the erosion function we used (Eq 8) as compared to the classical Partheniadesformulation (where erosion rates are not related to dry density)
The experiments with the most concentrated sediments (subset 1) did not t as well asthose from subsets 2 and 3 (Fig 7) Consequently results from subset 1 were responsible
Figure 5 Schematic diagram of the particle exchange in the 3 models that were developed (A)the dimensionless model simulating exchange between the ldquo uff layerrdquo and the water column(ie initial stages of erosion and deposition) (B) the 1DV model without bioturbation whereexchanges takes place between the top section of the sedimentary column and the watercolumn and (C) the coupled model simulating particle exchange from the top section of thesedimentary column to the ldquo uff layerrdquo (ie through the process of snail track formation) andfrom the ldquo uff layerrdquo into the water column (ie the uff layer erosion) and also between thetop section of the sedimentary column and the water column (ie bed erosion and deposition)High erosion and deposition uxes (ie Eq 8 indicated by large arrows on diagrams) occurwhen tf tb while low erosion and deposition uxes (ie Eq 5 indicated by thin arrows ondiagrams) occur when t u f f tf tb
838 [61 6Journal of Marine Research
for a substantial part of the scatter in the plot of model prediction against observed massesThis is due to the observed high variations in critical thresholds irrespective of the scatterin measured sediment density in this case (Subset 1 in Table 1)
iii The coupled model Fluff layer erosion and bed erosion functions were coupledwithin the 1DV model and all parameters of equations for track formation trackerosion and bed erosion were used (Table 2) The model consistently reproduced thesequence of phases of uff layer and bed erosion as observed in the experiments (Fig4) Good adjustments to the observed uff layer erosion phase were obtained (Fig 8)The dependence of erosion rates on snail density and water content was correctlyreproduced by functions for uff layer erosion when compared to results obtainedwith uid sediments (Fig 8) The reduction in eroded mass within each shear stressstep was fairly well reproduced by incorporating the varying resistance of the ufflayer to erosion (Eq 7)
The model also consistently estimated the effects of snail density on the uff layererosion rates of more concentrated sediments (Figs 9 and 10) This result suggests thatvariations in erosion rates of the uff layer can be attributed to the effects of snailbioturbation (track formation) on the surface sediments
Figure 6 A t5 0 estimates (ie quantity of sediment in the uff layer) obtained by minimization ofEqs 5 through 7 as a function of sediment water content (as water) and snail density (as snailsm22 ) The minimization approach was performed on data presented in the current study ( lledcircles) and included a second data set discussed in Orvain (2002) that has been reanalyzed here(open circles)
2003] 839Orvain et al Bioturbation amp uff layer erosion
Table 2 Summary of equations and parameters used in the sediment transport 1DV model withHydrobia ulvae bioturbation
Acronyms Value Unit Description Origin
FORCING VARIABLES
sf Function of time (step-by-step) Pa Bed share stress Measuredn Function of experiment Snail m22 Hydrobia ulvae density Measuredrd Function of experiment kg m23 Sediment dry density Measuredw Derived from rd Sediment moisture content Measured
STATE VARIABLES
MdM
dt 5 E uff 1 Ebed 2 D kg m22 Eroded mass per unit area
AtdAt
dt5 2E uff
kg m22 Aggregate quantity in uff layer
BIOGENIC FLUFF LAYER EROSION FUNCTIONS AND COEFFICIENTS
Crawling activity a 5a0
1 1 e2h~W2W50
a0 422 3 1026 m2snail21h21 Maximum individual crawling rate Orvain and Sauriau (2002)h 518 Rate of increase of crawling rate as a
function of WOrvain and Sauriau (2002)
W50 1998 W-dependent parameter Orvain and Sauriau (2002)Track formation Abtb 5 hbtbruff(1 2 e2ant) and hbtb 5 c 3 Wu
c 3 ruff 616 3 1028 kg m22 Maximum sediment quantityreworked by Hydrobia ulvae
minimized
u 2424 mdash W-dependent coef cient of track height minimizedFluff layer formation At505 Abrb1 l1W
l 2
l1 6386 3 10216 No unit Parameter for aggregates when n 5 0 minimizedl2 4556 No unit Parameter for aggregates when n 5 0 minimized
Critical shear stress for uff layer erosion t uff 5 t uffup 1 d
At50 2 At
At50
tuffup 0118 Pa tuff at sediment-water interface xedd 0744 Pa Rate of increase of tuff minimized
Fluff layer erosion E uff 5 a 3 At 3 S tf
t uff2 1D when tf t uff else E uff 5 0
a 1525 3 1024 s21 Erosion coef cient minimized
GENERAL BED EROSION FUNCTIONS AND COEFFICIENTS
Critical shear stress for bed erosion tb5 at 3 rdbt
at 126 3 1026 Pa rd-dependence coef cient minimizedbt 2502 mdash rd-exponent coef cient minimized
Bed erosion Ebed 5 E0 3 rdg 3 S tf
tb2 1D when tf tb else Ebed 5 0
E0 106 3 10212 kg m22s21 Erosion coef cient minimizedg 3984 mdash rd-exponent coef cient minimized
Deposition D 5 Ws 3 M 3S
V
[Ws 3 S9] 10711023 [m s213 m2] [Settling velocity 3 depositionsurface]
minimized
S 033 m2 Test section surface measuredV 116 m3 Flume volume measured
840 [61 6Journal of Marine Research
Figure 7 Comparison between the model predictionsfor bed erosion and the time series of eroded massfor the 12 experiments conducted with mean dry densities of 261 (subset 1) 236 (subset 2) and190 kg m23 (subset 3) (A) Model results were computed by considering the estimated dry densitypro le of each experiment (B) The relationship between observed and predicted data of bed erosionwas not signi cantlydifferentfrom the theoreticalmodelY 5 X (r2 5 0735F1 16 6 5 460 P 0001)
2003] 841Orvain et al Bioturbation amp uff layer erosion
Figure 8 (A) Comparison between model prediction (diagrams on the right) and data (diagrams onthe left) of the 12 experiments The experimentswith and without Hydrobia ulvae are representedby circles and triangles respectively on the curves (B) The relationship between the modelpredictionand the observationsthat were calculatedon the basis of averaged 80-data of each shearstress step was not signi cantly different from Y 5 X (r2 5 0901 F1 1 0 6 5 973 P 0001)
842 [61 6Journal of Marine Research
4 Discussion and conclusions
a The reliability and the interest of the model
Models of sediment transport that include bioturbation effects are developed with thegoal of extrapolating the results to eld conditions (Wood and Widdows 2002) Theapplicabilityof these models are constrained by having to
Figure 9 Comparison between the time series plots of experimental (A) and computed (B) sedimenteroded mass per unit area (M in g m22 ) in response to shear stress increment on consolidatedsediments (rd 5 4688 6 203 kg m2 3) from experiments that were describedby Orvain (2002)The grey lines on diagrams (A) and (B) represent controls without Hydrobia (crosses) and darklines represent experiments with 1000 5000 10000 and 50000 snails m22 (symbols arediamonds circles triangles and squares for each density respectively) (C) The relationshipbetween the model prediction and the observations that were calculated on the basis of averaged80-data of each shear stress step was not signi cantly different from Y 5 X (r2 5 0942F1 1 6 6 5 1299 P 0001)
2003] 843Orvain et al Bioturbation amp uff layer erosion
(1) use a reduced set of parameters
(2) assess effects under a wide and often largely unknown set of eld conditions (egvarying water contents tidal forcing species and spatio-temporal variations inmacrobenthic populations)
Figure 10 Comparison between the time series plots of experimental (A) and computed (B) sedimenteroded mass per unit area (M in g m22) in responseto shear stress incrementon consolidatedsediments(rd 5 3189 6 156 kg m23) from experiments that were described by Orvain (2002) The grey lineson diagrams A and B represent controls without Hydrobia (crosses) and dark lines representexperimentswith 1000500010000and 50000 snails m22 (symbols are diamondscircles trianglesand squares for each density respectively) (C) The relationshipbetween the model predictionand theobservations that were calculated on the basis of averaged 80-data of each shear stress step was notsigni cantly differentfrom Y 5 X (r2 5 0825 F1 1 66 5 785 P 0001)
844 [61 6Journal of Marine Research
(3) be compatible with sediment bed erosion functions that take into account the effectof sediment consolidationstatus on tb
(4) make predictions of erosion on the basis of biological and sedimentologicalvariables that can be easily measured
(5) account for hydrodynamic forcings that could include the combined effects ofcurrents waves their nonlinear interactions and bed roughness
The present model is robust with respect to these ve conditions
(1) The model uses a set of four minimized parameters for uff layer erosion (a [c 3r uff] and u) and a set of three xed parameters (a0 h and W50) which wasobtained from the development of a model for crawling behavior of snails (Orvainand Sauriau 2002) This set of three parameters can be modi ed as a function oflight and water coverage conditions The contributionof the nonbiogenicaggregatesto the uff layer have been demonstrated to be negligible and should be different innature than in our laboratory study The function for this nonbiogenic uff layerfunction (with associated parameters l1 and l2) will thus not be considered infurther model development simulating eld conditions
(2) The model for uff layer reliably reproduced the erosion of a wide range of ume experiments with a single set of parameters The model is based on thetrack formation mechanisms and simulates the snail density and water contentdependence of uff layer erosion rates within the range of values that can beencountered in the eld Crawling rates also depend on the microphytobenthicpopulations which is the snailrsquos prey The effect of microphytobenthic biomasscan be included in the track formation equations as well as the light and watercoverage conditions (Orvain and Sauriau 2002)
(3) The model allows us to simulate the effects of benthic organisms on uff layererodibility without affecting the bed erosion parameters so that the effect ofphysical factors on bed erodibility (such as the dependence of tcr on sedimentconcentration or consolidation processes) can be taken into account as usual
(4) Snail densities bed shear stress and water contents are the forcing variables ofthe model The variations in snail density are available from studies onpopulation dynamics and spatial patterns of this species (Haubois et al 2002)Values of bed shear stress are available from a hydrodynamics model in theMarennes-Oleron Bay (Le Hir et al 2000) This model also simulates consoli-dation processes hence providing estimates of sediment water content as afunction of emersion time
(5) Both erosion functions (for uff layer and sediment bed) depend on bed shear stresshence allowing consideration of wave effects or bed roughness effects rather thancurrent velocity
2003] 845Orvain et al Bioturbation amp uff layer erosion
We made several simplifying assumptions in the model that proved reasonable (1)the assumed dependence of erosion rates on the quantity of uff layer during theerosion process (Eq 5 and 6) allowed the decrease in erosion rates at higher shearstresses which was observed on consolidated sediments (Figs 9 and 10) to bereproduced (2) assuming a spatial heterogeneity in the resistance of tracks (Eq 7)allowed the observed decrease in erosion rates within shear stress steps (Figs 8 9 and10) to be recreated and (3) considering that the effects of a bioturbated (or crawled)surface (Eq 2) would be to mediate the effects of snail density and sediment watercontent reproduced the observed differences between experimental conditions (Figs8 9 and 10)
The main advantage of our approach is that the same parameter sets can be used tosimulate erosion kinetics even when sediments have different consolidation states andhistories (Figs 8 9 and 10) The bed and uff layer erosions are thus not affected similarlyby water content variations This has not been possible with other models such as amodi ed version of Willowrsquos model (Willows et al 1998 modi ed by Orvain 2002)Thus to the knowledge of the authors this model is the rst that evaluates the contributionof biological versus physical factors on bed erodibility
The dependence of uff layer erosion rates on snail density and water content hasbeen well reproduced by considering the effects of these two variables on trackformation by snails This result provides an argument demonstrating that the mainprocess controlling the effect of Hydrobia ulvae activities on bed erodibility is thetrack formation process The main fraction of the uff layer that is produced by Hulvae can thus be ascribed to tracks
The predictive ability of the model could be limited since only a narrow temporalsequence of the complete tidal cycle (ie diurnal emersion phases) is simulated in thepresent version However the in uence of environmental factors on crawled surfaces wasinvestigated under a wider variety of environmental conditions (Orvain and Sauriau2002) so that the 3-parameter sets of each system (a0 h and W50) can be used in the 1DVcoupled model Such model implementations should provide realistic simulations of snailbioturbation effects over the complete tidal sequence Nevertheless the present modelshould be validated by comparison to additional ume experiments conducted underdifferent conditions of light and water coverage
One of the unique features of the functions for uff layer consists of the ability tosimulate a decrease in erosion rate without requiring a deposition ux This wasachieved by considering that the resistance of individual tracks to erosion is heteroge-neous on sediment surface The decrease in uff layer erosion rate was thus a functionof the variable critical threshold for uff layer erosion and realistic erosion patternscould not be simulated without imposing some level of heterogeneity in the modelConcerning the bed erosion a vertical variation of the critical shear stress was assessedin relation to the sediment density pro le and this implies a reduction in erosion ratedue to the consolidation status In addition a fraction of the total eroded particles was
846 [61 6Journal of Marine Research
allowed to settle on the sediment bed Very low critical thresholds were attributed tothe re-erosion of these deposited particles In the model deposition is thus assessed asa settling ux that occurs at the same time as erosion ( uff layer erosion as well as bederosion) We actually had two possibilities (1) either simulating a deposition termfrom the water column to the uff layer cell or (2) simulating a deposition term fromthe water column to the surface sediment layer According to the case the re-erosion ofdeposited particles could be calculated using either uff layer or bed erosion functionsWe made the second choice to avoid the production of a biogenic uff layer in theabsence of snails and to avoid any numerical artefact in the calculation of thedeposition term due to the inclusion of biological effects The modeling strategy allowsbed erosion and deposition functions to be formulated as is usually seen in sedimenttransport models in the absence of snails
b Destabilizing effects by deposit-feeders
Bioturbationeffects by Hydrobia ulvae on the surface sediments are limited in our umeexperiments to the creation of a uff layer and not the effects of changes in bed roughnessThe tracks themselves do not affect bed roughness and the underlying bed erosionproperties do not depend on snail densities Such fragile uff layers cannot produceobstacles which affect the general bed roughness Irregularities due to tracks may induce amodi cation of the surface roughness but this effect is limited to a very slight temporalwindow of erosion sequence This effect can perhaps contribute to the low threshold for uff layer erosion that we have reported
However the shells of the snails may produce signi cant and robust obstacles during anatural tidal cycle These animals have the ability to resist very strong currents byadherence (visual observation) We controlled the bed roughness in our experiments byletting the animals escape from test section before applying the currents We assume thatunder eld conditions the in uence of snail shells on bed roughness is another potentialprocess and should be incorporated into sediment transport models as data becomeavailable The expected effects of this roughness modi cation by snail shells are high sinceit affects bed erosion
Hydrobia ulvae is a very motile species which dominates macrobenthic populationsof many bays and estuaries over large geographic regions Widdows et al (2000a) havereported from in situ measurements on the Molenplaat (Westerschelde Netherlands)that H ulvae appears to destabilize sediment but to a lesser extent than other bivalves(such as Macoma balthica or Scrobicularia plana) Directly comparing H ulvae andM balthica effects using Willowsrsquo model (Orvain 2002) con rmed this observationAndersen (2001) has demonstrated that at sites dominated by H ulvae erosion rateswere positively correlated with the snail faecal pellet content of the surface sedimentsTheir wide distribution on European intertidal mud ats suggests the snailsrsquo activitiesmay have an appreciable effect on sediment erosion properties In the Marennes-Oleron Bay (France) where this species is dominant the effects of H ulvae on
2003] 847Orvain et al Bioturbation amp uff layer erosion
sediment transport could be simulated by incorporating recent data on the spatio-temporal dynamics of this organism (Haubois et al 2002) The main interest of themodel is that it can be used to analyze the contribution of biological factors in theresuspension of natural sediments since physical processes (eg deposition consolida-tion and bed erosion) and their impact on sediment dynamics are also consideredFuture studies will investigate the impact of the bioturbation by Hydrobia ulvae versusphysical factors on the in situ sediment budget of mud ats in the Marennes-Oleron Bayby applying this model on a large scale
The upper layers of the marine sediments are mixed bulldozed and loosened bymany organisms and especially by deposit-feeders which displace large quantities ofsurface material during the course of their foraging activities (Rhoads and Young1970 Jumars and Nowell 1984 Hall 1994 Paterson and Black 1999 Willows et al1998) Concerning Hydrobia ulvae all these activities contribute to the creation of a uff layer on the surface which is a complex assemblage of ocs micro-organismsmucous tracks pellets and sediment (Blanchard et al 1997 Andersen et al 2002)All the material in the uff layer is not likely to behave the same way in terms ofresuspension and this could explain the heterogeneity in uff layer resistance observedin this study the ocs mucous tracks and micro-organisms being able to resuspend rst while faecal pellets are likely to be more resistant to erosion Faecal pellets arerobust elements which are resistant to bacterial and physical breakdown A series ofstudies (Andersen 2001 Andersen and Pejrup 2002 Andersen et al 2002) haveindicated that the re-deposition and accumulation of faecal pellets probably enhancesthe role of pelletization in the eld in contrast with laboratory experimental conditionsIn future studies the quality of the sediment in the uff layer should thus be taken intoaccount to model the uff layer resuspension and its impact on sediment transport inthe eld
Grouping deposit-feeders into functional groups has been demonstrated to be a reliablemethod in understanding bioturbation effects of different species (Pearson 2001) Theomnipresence of deposit-feeder populations at the sediment-water interface in intertidalsystems (Herman et al 1999) and a speci c functional group of bioturbator (ldquo uff layercreatorrdquo) can be associated with this process In that sense Hydrobia ulvae can beconsidered as a member of this functional group
While models predicting the potential effects of bioturbation on sediment mixing andnutrient distribution in sediments have been the subject of increasing investigation(Francois et al 1997 2002 Dauwe et al 1998 Boudreau 2001 Pearson 2001) modelspredicting sediment stability and erosion on the basis of biological benthic processesremain relatively rare (Willows et al 1998 Orvain 2002) The model and approachpresented in this communication represent a methodology that can be used for investigat-ing the effects of other representative members of the ldquo uff layer creatorsrdquo group andtherefore also represent a potentiallyeffective means of analyzingnot only the contribution
848 [61 6Journal of Marine Research
of H ulvae to uff layer formation but also for exploring interspeci c interactions in thebioturbated environment
AcknowledgmentsThe IFREMER and Regional Council of Poitou-Charentessupported the studywith a doctoral grant awarded to FO We also thank two anonymous referees who made helpfulcomments on earlier drafts
REFERENCESAmos C L T Feeney T F Sutherland and J L Luternauer 1997 The stability of ne-grained
sediments from the Fraser River Delta Estuar Coast Shelf Sci 45 507ndash524Amos C L J Grant G R Daborn and K Black 1992 Sea carouselmdasha benthic annular ume
Estuar Coast Shelf Sci 34 557ndash577Amos C L N A Van Wagoner and G R Daborn 1988 The in uence of subaerial exposureon the
bulk properties of ne-grained intertidal sediment from Minas Basin Bay of Fundy Estuar CoastShelf Sci 27 1ndash13
Andersen T J 2001 Seasonal variation in erodabilityof two temperate microtidal mud ats EstuarCoast Shelf Sci 53 1ndash12
Andersen T J K T Jensen L Lund-Hansen K N Mouritsen and M Pejrup 2002 Enhancederodabilityof ne-grained marine sediments by Hydrobia ulvae J Sea Res 48 51ndash58
Andersen T J and M Pejrup 2002 Biological mediation of the settling velocity of bed materialeroded from an intertidal mud at Estuar Coast Shelf Sci 54 737ndash746
Ariathurai R and R B Krone 1976 Finite element model for cohesive sediment transport JHydraul Div ASCE 102 323ndash338
Bassoulet P P Le Hir D Gouleau and S Robert 2000 Sediment transport over an intertidalmud at eld investigations and estimation of uxes within the ldquoBaie de Marennes-Oleronrdquo(France) Cont Shelf Res 20 1635ndash1653
Bertalanffy von L 1938 A quantitative theory of organic growth Human Biol 10 181ndash213Blanchard G F P-G Sauriau V Cariou-LeGall D Gouleau M J Garet and F Olivier 1997
Kinetics of tidal resuspension of microbiota testing the effects of sediment cohesiveness andbioturbationusing ume experimentsMar Ecol Prog Ser 151 17ndash25
Boudreau B P 2001 A one-dimensional model for bed-boundary layer particle exchange J MarSyst 11 279ndash303
Brenon I and P Le Hir 1999 Modelling the turbidity maximum in the Seine Estuary (France)identi cation of formation processesEstuar Coast Shelf Sci 49 525ndash544
Dauwe B P M J Herman and C H R Heip 1998 Community structure and bioturbationpotential of macrofauna at four North Sea stations with contrasting food supply Mar Ecol ProgSer 173 67ndash83
Francois F M Gerino G Stora J-P Durbec and J-C Poggiale 2002 Functional approach tosediment reworking by gallery-forming macrobenthic organisms modeling and application withthe polychaete Nereis diversicolorMar Ecol Prog Ser 229 127ndash136
Francois F J-C Poggiale J-P Durbec and G Stora 1997 A new approach for the modelling ofsediment reworking induced by a macrobenthic community Acta Biotheor 45 295ndash319
Gouleau D J M Jouanneau O Weber and P G Sauriau 2000 Short- and long-term sedimenta-tion on Montportail-Brouageintertidal mud at Marennes-Oleron Bay (France) Cont Shelf Res20 1513ndash1530
Hall S J 1994 Physical disturbance and marine benthic communities life in unconsolidatedsediments Oceanogr Mar Biol Ann Rev 32 179ndash239
Haubois A-G J-M Guarini P Richard G F Blanchard and P-G Sauriau 2002 Spatio-temporal
2003] 849Orvain et al Bioturbation amp uff layer erosion
differentiation in the population structure of Hydrobia ulvae on an intertidal mud at (Marennes-Oleron Bay France) J Mar Biol Assoc UK 82 605ndash 614
Herman P M J J J Middleburg J van de Koppel and C H R Heip 1999 The ecology ofestuarine macrobenthosAdv Ecol Res 29 195ndash240
Houwing E J 1999 Determination of the critical erosion threshold of cohesive sediments onintertidal mud ats along the Dutch Wadden Sea Coast Estuar Coast Shelf Sci 49 545ndash555
Jumars P A and A R M Nowell 1984 Effects of benthos on sediment transport dif culties withfunctional groupingCont Shelf Res 3 115ndash130
Jumars P A A R M Nowell and R F L Self 1981 A simple model of ow-sediment-organisminteractionMar Geol 42 155ndash172
Lavelle J W and H O Mofjeld 1987 Do critical stresses for incipient motion and erosion reallyexist J Hydraul Eng 113 370ndash388
Le Hir P A Ficht R Silva Jacinto P Lesueur J-P Dupont R La te I Brenon B ThouveninandP Cugier 2001 Fine sediment transport and accumulations at the mouth of the Seine Estuary(France) Estuaries 24 950ndash963
Le Hir P W Roberts O Cazaillet M Christie P Bassoulet and C Bacher 2000 Characterizationof intertidal at dynamics Cont Shelf Res 20 1433ndash1460
Mehta A J 1988 Laboratory studies on cohesive sediment deposition and erosion in PhysicalProcesses in Estuaries J Dronkers and V van Leussen eds Springer-VerlagBerlin 560 pp
Mehta A J and E Partheniades 1982 Resuspension of deposited cohesive sediment beds Proc18th Int Conf Coast Eng The Cape 1569ndash1588
Nelder J A and R Mead 1965 A simplex method for function minimization Computer J 7308ndash313
Orvain F 2002 Modelling the in uence of benthic organisms on cohesive sediment resuspensioninthe Marennes-Oleron Bay (France) Ph D Thesis University of La Rochelle 192 pp
Orvain F and P-G Sauriau 2002 Environmental and behavioural factors affecting bioturbationactivities in the intertidal gastropodHydrobia ulvae J Exp Mar Biol Ecol 272 191ndash216
PartheniadesE 1965 Erosion and depositionof cohesive soils J Hydr Div ASCE 91 105ndash139Paterson D M and Black K S 1999 Water ow sediment dynamics and benthic biology Adv
Ecol Res 29 155ndash193Pearson T H 2001 Functional group ecology in soft-sediment marine benthos the role of
bioturbationOceanogr Mar Biol Ann Rev 39 233ndash267Rhoads D C and D K Young 1970 The in uence of deposit-feeding organisms on sediment
stability and community trophic structure J Mar Res 28 150ndash178Sanford L P and J P-Y Maa 2001 A uni ed erosion formulation for ne sediments Mar Geol
179 9ndash23Shimeta J C L Amos S E Beaulieu and O M Ashiru 2002 Sequential resuspensionof protists
by accelerating tidal ow implications for community structure in the benthic boundary layerLimnol Oceanogr 47 1152ndash1164
Sutherland T F C L Amos and J Grant 1998 The effect of buoyant bio lms on the erodibilityofsublittoral sediments of a temperate microtidal estuary Limnol Oceanogr 43 225ndash235
van der Ham R and J C Winterwerp 2001 Turbulent exchange of ne sediments in a tidal channelin the EmsDollard estuary Part II Analysis with a 1DV numerical model Cont Shelf Res 211629ndash1647
Widdows J M Brinsley P N Salkeld and C H Lucas 2000a In uence of biota on spatial andtemporal variation in sediment erodability and material ux on a tidal at (Westerschelde TheNetherlands)Mar Ecol Prog Ser 194 23ndash37
Widdows J S Brown M D Brinsley P N Salkeld and M Elliott 2000b Temporal changes in
850 [61 6Journal of Marine Research
intertidal sediment erodability in uence of biological and climatic factors Cont Shelf Res 201275ndash1289
Willows R I J Widdows and R G Wood 1998 In uence of an infaunal bivalve on the erosion ofan intertidal cohesive sediment a ume and modeling study Limnol Oceanogr 43 1332ndash1343
Wood R and J Widdows 2002 A model of sediment transport over an intertidal transectcomparing the in uences of biological and physical factors Limnol Oceanogr 47 848ndash855
Received 22 May 2003 revised 8 December 2003
2003] 851Orvain et al Bioturbation amp uff layer erosion
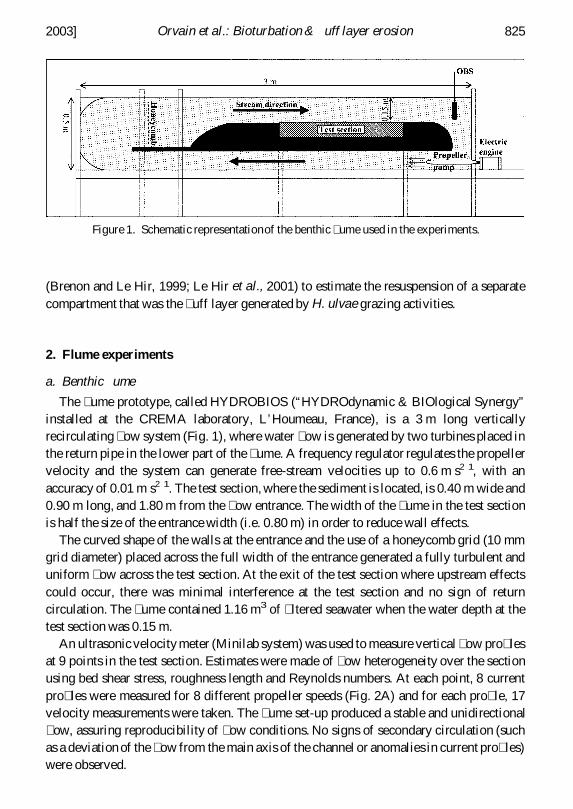
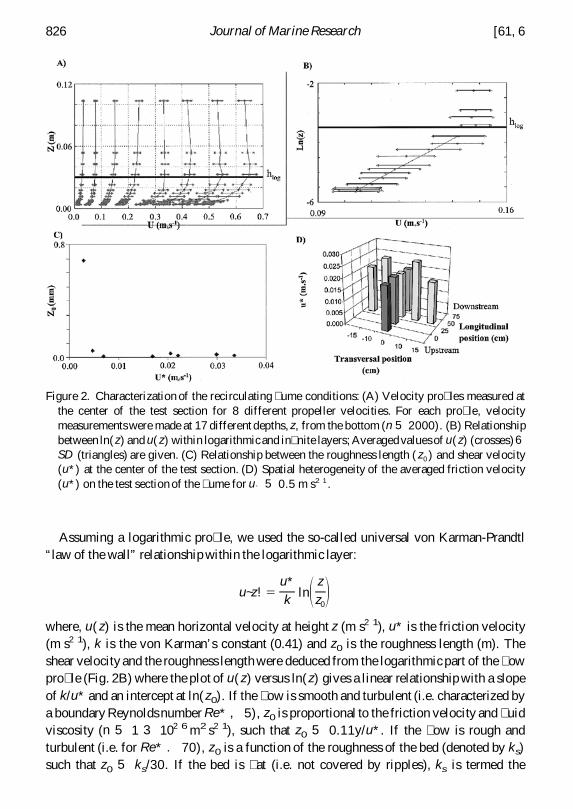
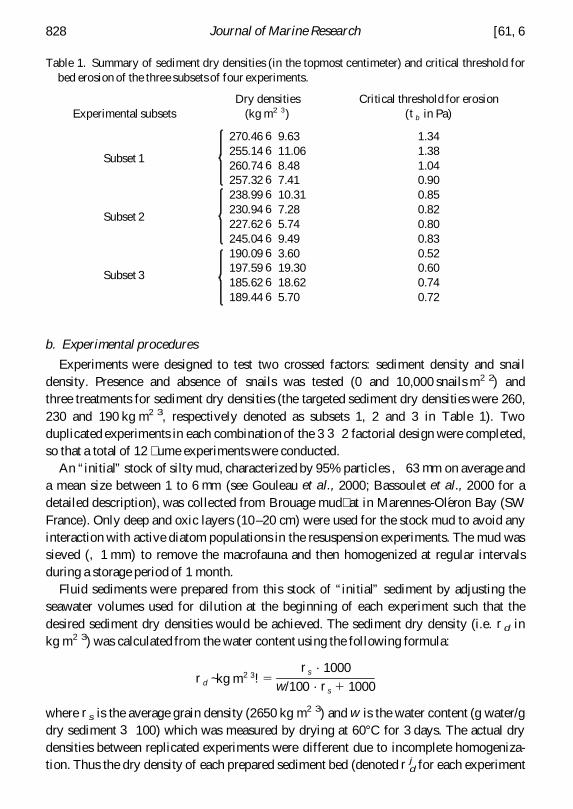
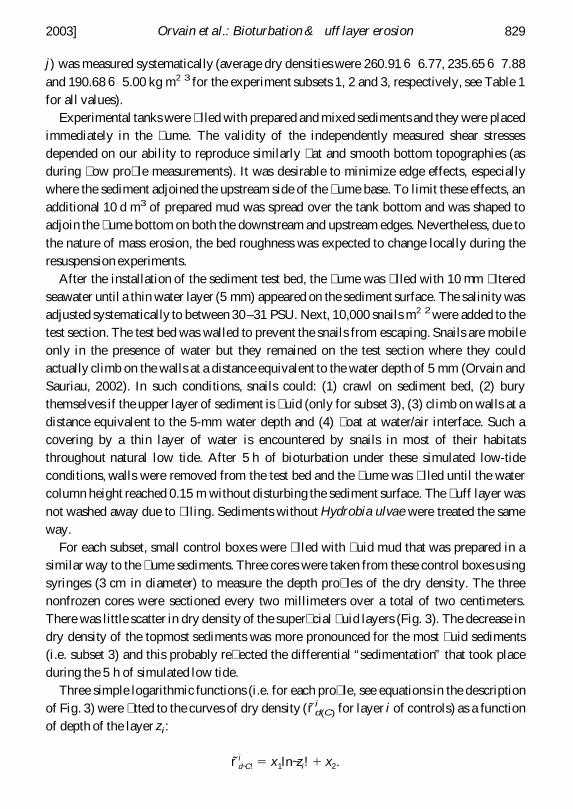
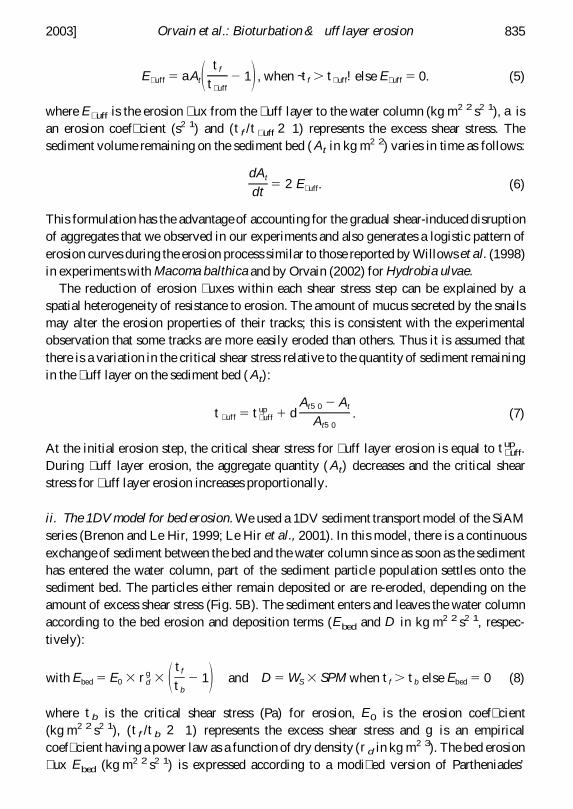
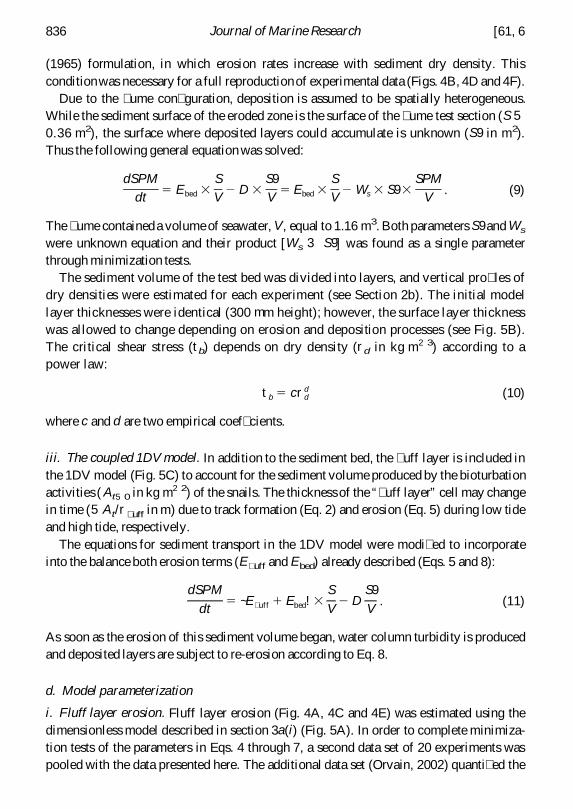
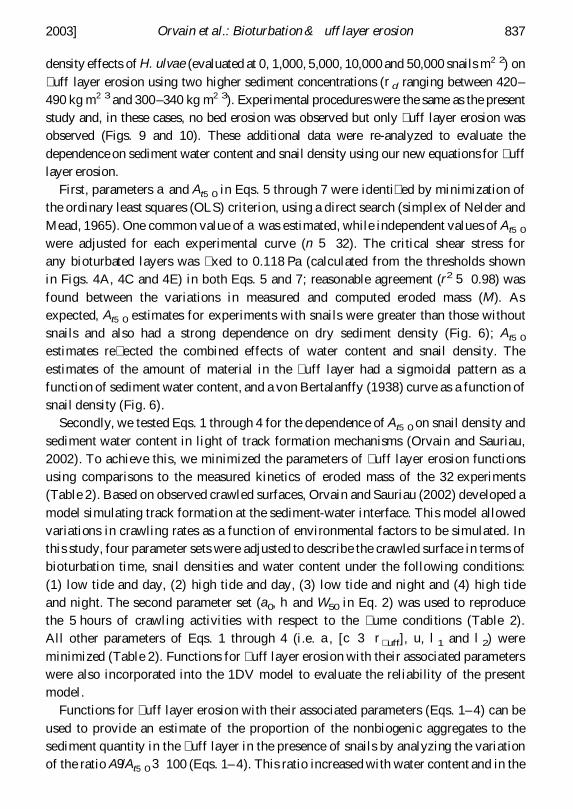
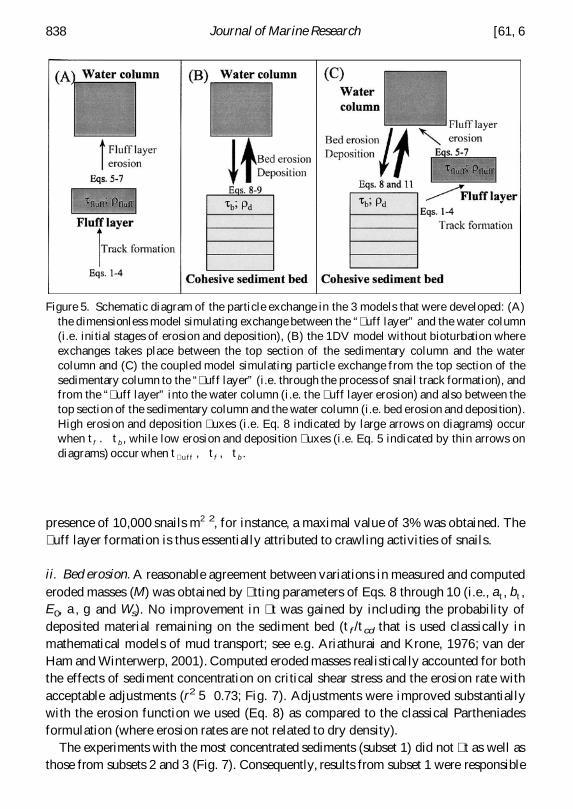
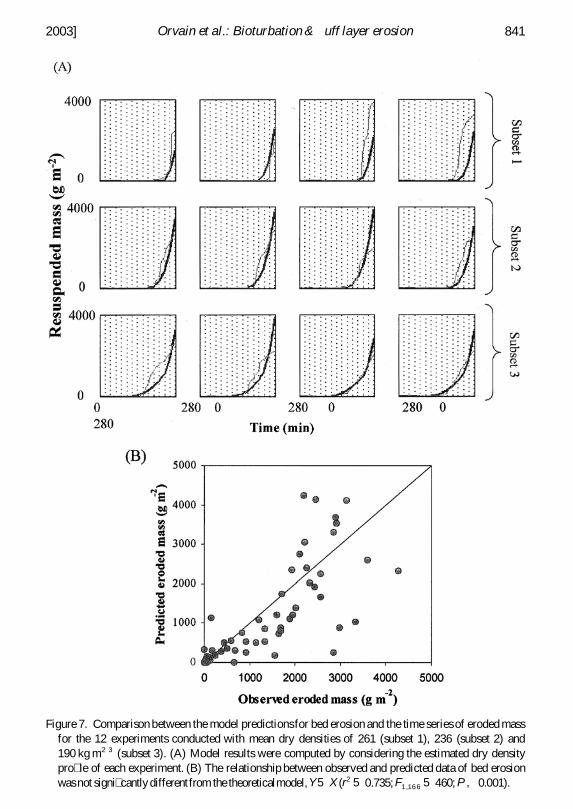
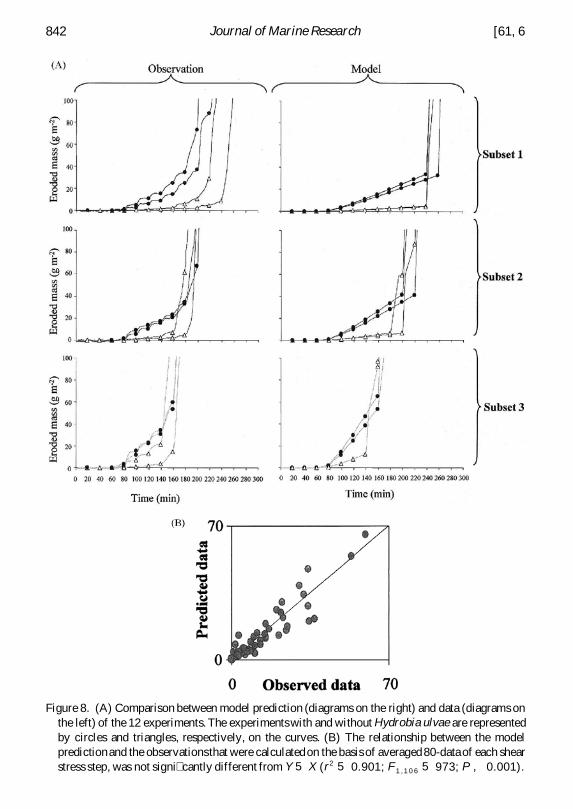
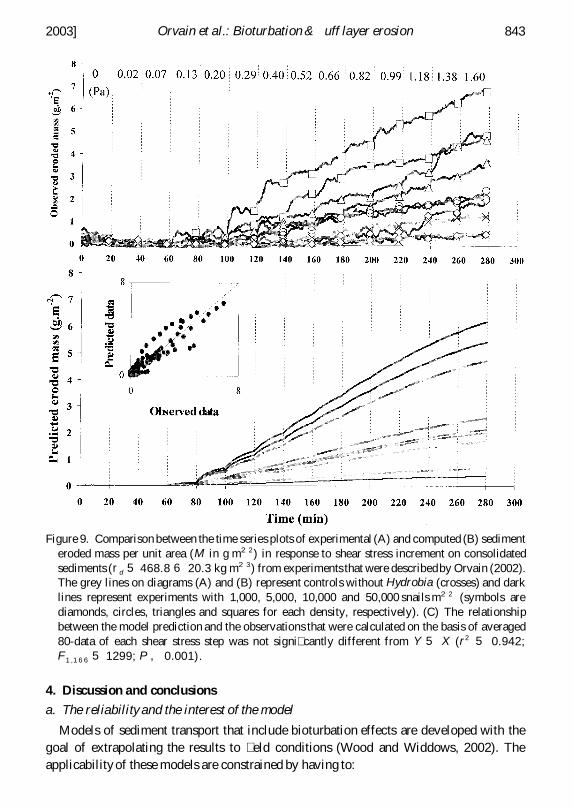
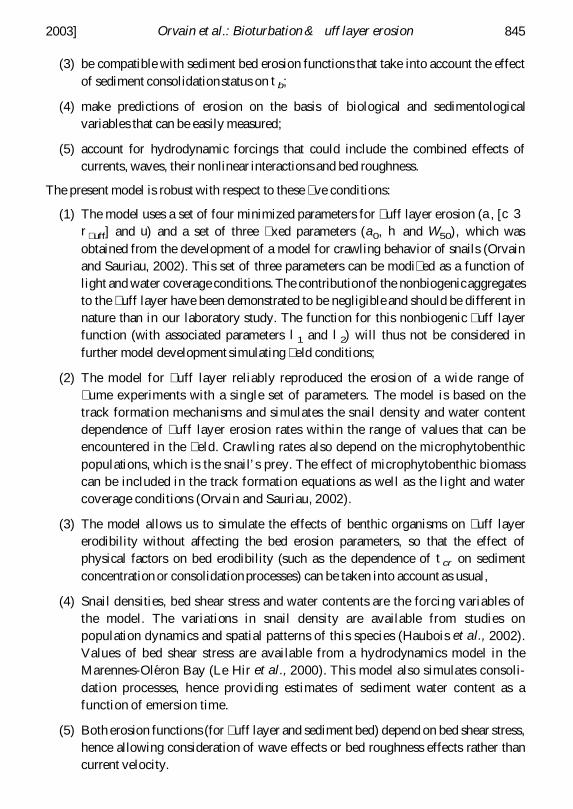
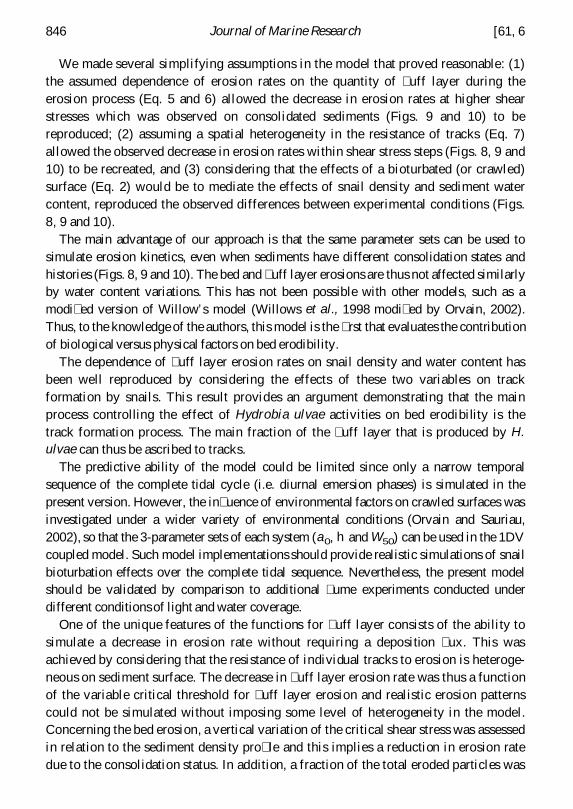
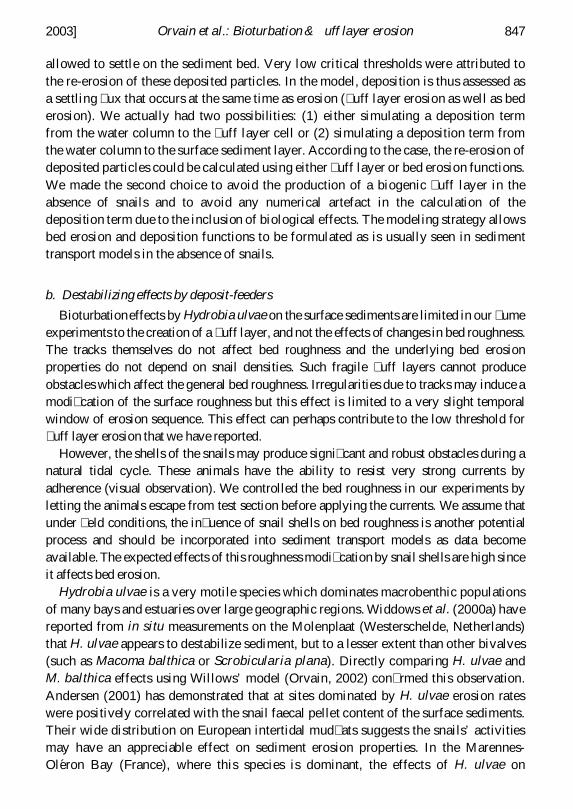