Comparative Analysis of Various Condenser in Vapour Compression Refrigeration System
Upload
independentCategory
view
2download
0
P A U L S C H E R R E R I N S T I T U TINIS-mf—14815
PSI • Annual Report 1995 / Annex IV
Nuclear Energy, Safety
2 7 Us 1 8

P A U L S C H E R R E R I N S T I T U T
J
Annual Report 1995Annex IV
PSI Nuclear Energyand
Safety Research
Editors: J. Birchley, R. Rösel, R. van Doesburg
PSI Department F4 Phone: 056 / 310 2111Nuclear Energy and CH-5232 Villigen PSI Telex: 82 7417 psi chSafety Research Switzerland Fax: 056/310 2199

CORVISinvestigates reactor vessel failure during hypothetical core
melt accidents. Molten thermite is poured into a vessel with adrain line. Melt-through occurs by 5.3 s; the line breaks off
and the melt is released. Temperatures are measuredby infrared thermography. A computer model of the
process allows transfer of the test results to real situations.
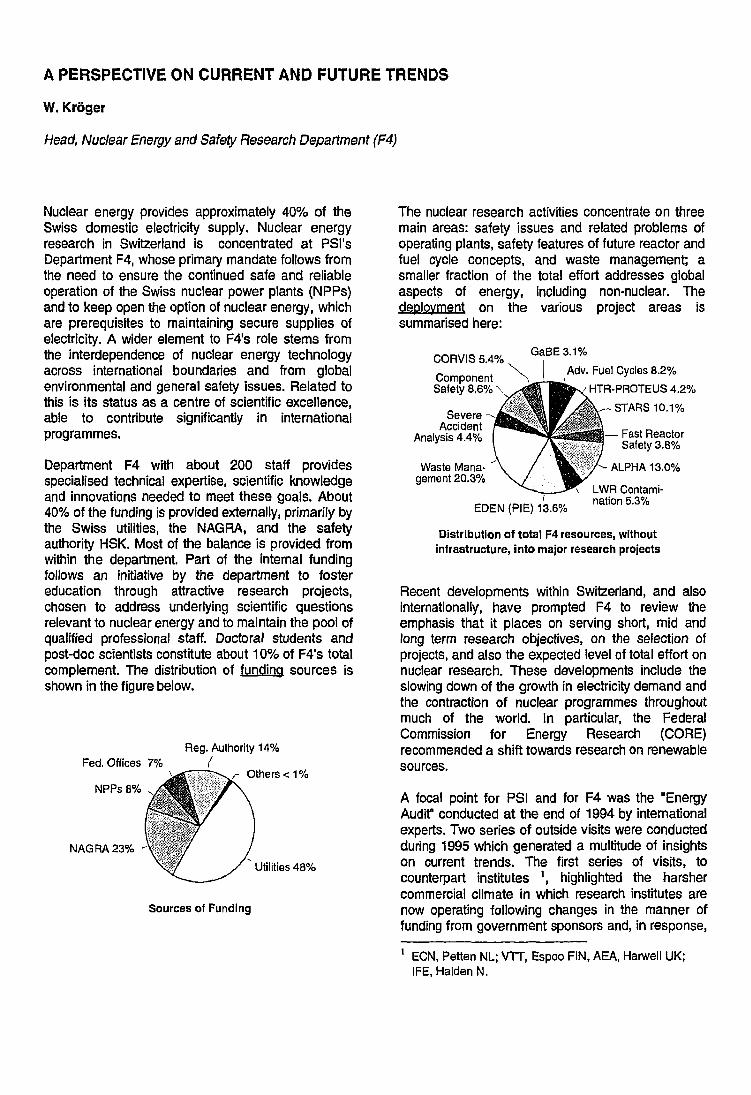
A PERSPECTIVE ON CURRENT AND FUTURE TRENDS
W. Kroger
Head, Nuclear Energy and Safety Research Department (F4)
Nuclear energy provides approximately 40% of theSwiss domestic electricity supply. Nuclear energyresearch in Switzerland is concentrated at PSI'sDepartment F4, whose primary mandate follows fromthe need to ensure the continued safe and reliableoperation of the Swiss nuclear power plants (NPPs)and to keep open the option of nuclear energy, whichare prerequisites to maintaining secure supplies ofelectricity. A wider element to F4's role stems fromthe interdependence of nuclear energy technologyacross international boundaries and from globalenvironmental and general safety issues. Related tothis is its status as a centre of scientific excellence,able to contribute significantly in internationalprogrammes.
Department F4 with about 200 staff providesspecialised technical expertise, scientific knowledgeand innovations needed to meet these goals. About40% of the funding is provided externally, primarily bythe Swiss utilities, the NAGRA, and the safetyauthority HSK. Most of the balance is provided fromwithin the department. Part of the internal fundingfollows an initiative by the department to fostereducation through attractive research projects,chosen to address underlying scientific questionsrelevant to nuclear energy and to maintain the pool ofqualified professional staff. Doctoral students andpost-doc scientists constitute about 10% of F4's totalcomplement. The distribution of funding sources isshown in the figure below.
Reg. Authority 14%Fed. Offices 7%
NPPs 8%
NAGRA 23%
Others < 1 %
Utilities 48%
Sources of Funding
The nuclear research activities concentrate on threemain areas: safety issues and related problems ofoperating plants, safety features of future reactor andfuel cycle concepts, and waste management; asmaller fraction of the total effort addresses globalaspects of energy, including non-nuclear. Thedeployment on the various project areas issummarised here:
CORVIS 5.4%
ComponentSafety 8.6%
SevereAccident
Analysis 4.4%
Waste Mana-gement 20.3%
GaBE3.1%
Adv. Fuel Cycles 8.2%
' HTR-PROTEUS 4.2%
• STARS 10.1%
I— Fast ReactorSafety 3.8%
ALPHA 13.0%
LWR Contami-nation 5.3%
EDEN (PIE) 13.6%
Distribution of total F4 resources, withoutinfrastructure, into major research projects
Recent developments within Switzerland, and alsointernationally, have prompted F4 to review theemphasis that it places on serving short, mid andlong term research objectives, on the selection ofprojects, and also the expected level of total effort onnuclear research. These developments include theslowing down of the growth in electricity demand andthe contraction of nuclear programmes throughoutmuch of the world. In particular, the FederalCommission for Energy Research (CORE)recommended a shift towards research on renewablesources.
A focal point for PSI and for F4 was the "EnergyAudit" conducted at the end of 1994 by internationalexperts. Two series of outside visits were conductedduring 1995 which generated a multitude of insightson current trends. The first series of visits, tocounterpart institutes \ highlighted the harshercommercial climate in which research institutes arenow operating following changes in the manner offunding from government sponsors and, in response,
1 ECN, Petten NL; VTT, Espoo FIN, AEA, Harwell UK;IFE, Halden N.

the increasingly commercial outlook being adoptedby the institutes. A second series of visits, to SwissNPPs, demonstrated the importance that plantoperators place on those research activities whichaddress issues arising from day-to-day operation.Examples concerned with material behaviour includecrack propagation, ageing, remaining lifetime andhigh burnup; examples in the wider operationalcontext include the use of Probabilistic SafetyAssessment, in particular with respect to humanfactors. It is evident that end-users place particularvalue on the fruits of short rather than long termresearch. These trends are not easy to recocile withthe Swiss policy of maintaining a nuclear option,which requires a continuing long term research effort,and with the desire of the NPP operators for PSI tobe more active in the public debate on nuclearenergy.
The approach of F4 is a balance between long termobjectives • future energy needs for Switzerland,commitment to the furtherance of education andscience, and fulfilling its role in the internationalscientific community - while at the same time seekingcloser orientation to the identified needs of the Swissnuclear community.
The work thus comprises three major categories.First, "free" forward-oriented research consistent withPSI's general scientific strategy and driven also bythe belief that nuclear energy will form part a long-term and sustainable energy mix. To this domainbelong
* Safety characteristics of future reactor designs,for example, SBWR;
* Technological and reactor physics concepts ofadvanced fuel cycles, for example, increaseduse/incineration of Pu;
* Phenomena and modelling of severe accidents,for example, confinement of consequences withinsite boundaries.
A second category of programmes addresses theneeds of the Swiss nuclear community, in particularthe continued safe and reliable opeation of the NPPsfor as long as possible, while also fulfilling acceptedresearch criteria. These include
* Material research to understand failure andageing phenomena, for example, prevention offailure, life extension;
* Fuel cycle improvements, for example, highburnup;
* Research on radioactive waste management, forexample, secure long term disposal.
A final category of activities covers tasks of a servicecharacter, where justified by the skills and facilitiesunique to PSI, for example, the hot laboratory.Examples include
* The surveillance programme of the NPPs;
* Post-irradiation examinations, investigations offaults and failures;
* Maintaining competence in selected fields for on-call service.
The above examples provide an indication of therange of research in F4. It will be apparent thatalthough the projects address quite distinct issuesand objectives, the research topics themselvesconstitute a coherent portfolio. The following sectionpresents a synopsis of activities and achievementsduring 1995, under the headings of short, mediumand long term goals. The main body of the presentreport comprises a number of research papers onselected key topics.

TABLE OF CONTENTS
Main Activities 1
[I] Investigations Related to Increased Safety Requirements for Reactivity Initiated Accidents 9
F. Holzgrewe, J,M. Kallfelz and M.A. Zimmermann
[2] Evaluation of a Critical Fuel Rod Enthalpy Versus Burnupunder Reactivity Insertion Accident Conditions 15
CG. Ott and H.K. Kohl
[3] Leningrad Nuclear Power Plant Pressure Tube Failure Investigations 25
H. Bruchertseifer, G. Bart, R. Restani,V.G. Aden, V.Ya. Abramov, V.E. Kalachikov, A.V. Kozlov, A.V. Subbotin and E.A. Smirnov
[4] Comparison of two Crack Growth Criteria in the BDT Zone 33
M. Niffenegger, S. Brosi, K. Reichlin and R. Rösel
[5] Experiments with Couette Autoclaves for the Investigation of Activity Uptakein the Oxide Layer of Stainless Steel under Boiling Water Reactor Conditions 37
A. Hiltpold
[6] Computations of Flows in Experimental Simulations of Reactor Core Melting 43
G. Duijvestijn, K. Reichlin and R. Rösel
[7] The Influence of Organics on the Sorption of Americiumon Far-field Minerals at high ph 51
J. Tits, B. Baeyens and M.H. Bradbury
[8] Linear Response Concept Combining Advection, Limited Rock Matrix Diffusion,and Fracture Network Effects in a Geosphere Transport Model 57
W. Barten
[9] Environmental inventories for Future Electricity Supply Systems for Switzerland 67
R. Dones, U. Gantner and S. Hirschberg
[10] Development and Assessment of a Modified Version of RELAP5/MOD3 79
G. Th. Analytis
[II] The First Panda Tests 87
J. Dreier, M. Huggenberger, C. Aubert, Th. Bandurski, O. Fischer, J. Healzer, S. Lomperski,H.-J. Strassberger, G. Varadi and G. Yadigaroglu

[12] A Model for the Performance of a Vertical Tube Condenser in the Presenceof a Non-condensable Gas 97
A. Dehbi and S. Güntay
[13] New Experimental Insights to the Neutron Physics of Small, Low-enriched,High Temperature Reactor Systems 109
T. Williams, O. Köberl, D. Mathewsand R. Seiler
Teaching Activities and Talks 119
University level and other TeachingTalks {without Proceedings)
Scientific Publications 125
PSI ReportsPublications in Scientific and Technical JournalsConference ProceedingsMiscellaneous Reports

MAIN ACTIVITIES
The main activities during the year covered by thisreport are shortly described below. They include taskswhich were completed in this year, as well as certainprojects still in their early stage. The description isordered under the main headings of short, mediumand long term nature of the issues concerned. Theindividual articles to follow are cited by [number].
Short-term needs
The contractual implementation of a service ("on-call")component into trie STARS [Simulation models forTransient Analysis of Reactors in Switzerland] projectrepresents a significant change. In this framework,two tasks were completed during 1995: The analysisof an inadvertent closure of the main steam isolationvalves without scram (ATWS) for the Leibstadt NPP(KKL) supported the need for a backfit as requestedby the HSK (automatic trip of the feedwater pumps).Under the assumption of this backfit, STARS analy-ses demonstrated a sizeable time window for operatoractions to mitigate the consequences of the assumedaccident. Further, the consequences of reactivity ini-tiated accidents under the new licensing criteria pro-posed recently by the HSK were assessed throughthe analysis of a rod drop accident for a Swiss BWR[1].
For the first time, a direct contract from a Swiss utilitywas awarded to the STARS project early in 1995. Itcomprises the investigation of certain transients underspecial emergency conditions which received recentattention during the licensing process.
The spectrum of the STARS analyses was extended:Within !:he framework of an ongoing safety review of aSwiss PWR, HSK raised some questions with respectto the plant response to extremely small breaks. Thistask has been successfully completed with the con-firmation of the calculations submitted by the plantoperator.
In response to the recommendation of the STARSinternational Review Committee to reduce and ra-tionalise the codes used within the project, it was de-cided to base future transient analyses on the USEPR! code package. The participation in the stabilitybenchmark of OECD/NEA's CSNI/NSC was com-pleted by submitting the requested results for fourcycles of the Swedish Ringhals reactor demonstratingthe capability of STARS for this type of delicateanalysis.
To obtain an overview of the existing uncertaintymethodologies, several candidates were considered.
Of these, the German GRS statistical evaluationmethod SUSA emerged as the most promising. A firstapplication of this method was carried out for a simpli-fied analysis of a rod-drop accident.
The data management and retrieval system IRISforeseen for STARS could not be further developeddue lack of funding. However, based on the experi-ence gained in the elaboration of its concept, a proto-type of an object-oriented information system for thePANDA [passive decay heat removal and depressuri-zation test facility] test rig (PANDA-DINF) was deliv-ered to the Laboratory for Thermo-Hydraulics (LTH).While the coding was conducted by the databasevendor according to PSI specifications, the conceptualdevelopment and the final implementation are beingperformed by the STARS team.
Among the main topics considered within the frame-work of an UAK/PSI contract on LWR-physics calcu-lations, were the investigation of the fast fluencedistribution at the pressure vessel of the Gösgen NPP(KKG) for different core loadings, several compactsteige pool studies and stationary reactor physicsanalyses of the first nine cycles of KKL.
The effects of burnup on fuel behaviour under reactiv-ity insertion accident conditions were investigated witha theoretical model [2].
The understanding of the factors leading to improvedcorrosion resistance of PWR cladding and, therefore,allowing higher burnup is still a major research topic inthe framework of the EDEN (development, applicationand evaluation of post-irradiation analyses) project.The experimental project of the Nuclear Fuels Indus-try Research Group (NFIR-phase II) was completedwith difficult to prepare transmission electron micro-scope views of the metal oxide interface of highlyactive Zircaloy samples. The detailed microstructuralstudy of this interface is expected to shed further lightinto the mechanisms leading to the known improvedcorrosion resistance for certain alloys. Within thesame project it was proven that enhanced lithiumuptake, which significantly deteriorates the claddingcorrosion resistance, is dominated by the prevalenttemperature and boiling conditions within the oxidescale.
Damage analysis work was also performed togetherwith the Russian Institute RDIPE on a zirconium basealloy [3]. It was demonstrated that a broken fuelchannel had experienced before break a temperatureexcursion of 1300-1400 °C. Previous models esti-

mated the probable maximum temperature for suchevents to lie below 900 °C.
Besides fuel integrity at high burnup, questions aboutageing of stainless steel structural components andirradiation-influenced stress corrosion cracking areimportant issues. As pressure build-up due to boroncarbide swelling is still lifetime limiting for control rods,post-irradiation experiments were performed for athird party testing a wide range of chemical andphysical forms of absorber materials. A research is inprogress to follow the irradiation induced lattice defectpattern in stainless steels with fluence and to possiblylink the microstructural changes to the evolution ofmetallographically visible slip planes on polished ten-sile tested specimens.
As KKL experienced extremeiy high eddy current fuelcladding oxide thickness measurements during sum-mer 1995, two fuel rods were immediately sent to thePSI hot laboratory for post irradiation examination.Within 7 intensive working days it was convincinglyshown that the instrumental oxide measurements hadbeen affected by zinc implantation into the claddingcrud layer following zinc injection into the coolant, andthat the actual oxide thickness was within the normallimits.
Medium term issues
In the domain of materials research, further devel-opments in calculation methods for fracture mechan-ics and improved damage models enabled a betterprediction of the various component failure mecha-nisms. The new method was successfully applied tosimulate the emergency cooling of an aged pressurevessel, whose material toughness was reduced byneutron irradiation so far that the transition zone to thebrittle regime was reached [4].
The J-integral testing of material A 533 B1 using pre-cracked CHARPY impact specimens at temperaturesbetween -65 and 235 °C was completed. The onset ofstable crack growth was conspicuous already at lowtemperatures.
Component safety was examined in the event of asteam explosion. The magnitude and time for thepressure peak was estimated from an analysis of theexperimental results. The estimates were used inconjunction with the fracture mechanics relations todetermine the safety margins.
Fracture mechanics specimens were subjected toconstant tensile loads in a hot water loop, designed toprovide a corrosive environment, in order to investi-gate progression towards stress corrosion cracking.The ferritic RPV steels (20 MnMoNi 5 5, A 508 Cl. 2)examined in the hot water loops under quasi-stagnant
and simulated transient BWR coolant conditions(beyond normal operation) show high crack growthrates (3mm/a to 3 cm/a) down to oxygen concentra-tions of 0.4 ppm and a specific conductivity of 0.5uS/cm (mean impurity: Na2SO4). In the future, theinvestigations will focus on normal operating condi-tions, including extension to ferritic and austeniticpiping steels. The installation of a reversed DC poten-tial drop device for the on-line crack growth meas-urements in the autoclaves makes it now possible todifferentiate between the crack nucleation and thecrack growth period. Preliminary technical and admin-istrative work was performed for a round robin test(external partners: MPA Stuttgart, Siemens/KWU,VTT Finland) expected to start in the beginning of1996.
In the framework of the LWR-Contamination project,several combinations of high temperatures and pres-sures were used to model in the laboratory BWR wa-ter circuit conditions (290 °C, 900 MPa, 400 ppb O2).A loop system serves for integral tests under variationof feedwater chemistry and flow rates. Stirred auto-claves are used to study individual parameters whichinfluence circuit corrosion and activity build up. Undercontrolled Couette flow conditions it was demon-strated that the activity uptake on DIN 1.4970 stain-less steel is independent of the water flow rate in aregime of 0-2.5 m/s and nearly linearly increasing withtime up to two thousand hours. It was found that theactivity uptake of 68Co is reduced by addition of acompeting ion such as 59Co. Addition of small quanti-ties of zinc also reduces the uptake [5]. Indeed, lowzinc addition, as applied at KKL, proved to be moreefficient than the tenfold greater concentration rec-ommended by the reactor vendor. Varying surfacefinish and pre-oxidation conditions also influence thecobalt activity build-up within a factor of -10. A newprogram, agreed upon with the HSK, aims at furtherstudies of pre-filming of new and used, freshly decon-taminated component surfaces.
In the domain of severe accident research, a testprogram to verify the containment venting filter, de-veloped by SULZER, was finished successfully afterconducting 18 experiments. The experimental pro-gram showed that the filter can remove aerosol parti-cles from a simulated containment gas environmentwith a decontamination factor between 50000 and200000, for a variety of boundary conditions coveringa range of postulated BWR and PWR severe acci-dents.
10 of the 12 tests planned for the first phase of thePOSEIDON [POol Scrubbing Effect of Iodine Decon-taminatiON] experimental program were successfullyperformed to date. The purpose of the tests is to pro-

vide integral pool scrubbing data needed to assess acomputer program developed jointly by PSI, AEATechnology and GRS. The results of the experimentswill be transmitted to the POSEIDON task forcemembers for data and code validation.
The operator of KKG defined three severe accidentscenarios in order to understand and assess the re-sponse of various systems and to envelope the timerange for the occurrence of significant events. Thescenarios postulate leaks of 5 and 2.5 cm diameter inthe cold leg, respectively, and a station blackout.Several analyses performed for the 5 cm leak indi-cated that, under the highly pessimistic assumptionsmade, the reactor pressure vessel would fail between14 to 18 h after start of the accident. The pressure inthe containment would reach the set point for initiationof containment venting through the filter after about 6days. The calculations indicated that the hydrogenconcentration may reach detonation threshold. Sincea large part of the airborne aerosol concentration inthe containment will be removed by natural processes(gravity settling, etc.), thus reducing the concentrationby 3 to 4 orders of magnitude by the time of the vent-ing, the released activity of the aerosol particles intothe environment will be in a range around 8 Ci. Theaerosol activity release into the environment is de-termined by the efficiency of the containment ventingfilter system. The release of noble gases, however,will be close to 100%. Analyses of the other se-quences are in progress.
The SCDAP/RELAP5 code, obtained via agreementwith the USNRC, provides a coupled treatment of thesystem thermohydraulics and core damage behaviour.Application to the LOCA sequences defined for Gös-gen has yielded insights into the processes that esca-late or ameliorate the accident, which suggest possi-ble accident management measures. The analysesare also helping to improve and validate the code.
A report on Chernobyl Source Term Reassessmentand an opinion paper were prepared for CSNI PWG4,in collaboration with scientists from other internationalorganisations. This report shows that the source term,especially for iodine and cesium, is higher by a factor2.5 to 3 than the values stated in August 1986 by theSoviet experts. The information provided is beingused by the OECD/NEA committee on RadiationProtection and Public Health, who will provide anauthoritative collective statement on the situation atChernobyl regarding health impacts and remainingproblems.
The project CORVIS [Corium Reactor Vessel Interac-tion Studies] comprises experiments and computa-tions of RPV lower head failure. Core melt experi-ments are performed with parts of RPV lower headsboth with and without reactor-typical tube penetra-
tions; an alumina - iron thermite melt serves as thecore melt substitute. The experiments are performedat atmospheric pressure. A suite of finite-elementbased computer codes was developed to predictlower head failure under realistic accident conditions,in particular at high system pressure. The experimen-tal data were used to validate the models.
The experimental facility was improved during 1995including in particular, an enhanced heating system.The automatically controlled facility for retaining andpouring either the aluminium oxide or the iron meltproduced from the thermite melt was successfullytested. At the end of 1994, a large-scale test wasperformed in order to investigate the behaviour of thereactor drain line typical in BWRs of General Electric,such as the Mühleberg NPP (KKM). The turbulentflow of the superheated iron melt caused a strongattack on all steel structures (vessel bottom and drainline) by surface ablation. This led to a drain line failureabout 6 s after the first contact of the lower headstructure with the melt. The experiment showed thatabout 200 kg of iron melt passing through the drainline were sufficient to destroy it. Thus, during a coremelt accident under similar conditions the primarysystem would open and, therefore, depressurise intothe containment. A different mode of lower head fail-ure would occur, however, if a predominantly oxidicmelt were deposited, since flowing oxide melt causesno ablation at the steel surfaces and can also solidifyand block the tube. The behaviour of the drain lineunder these conditions will be investigated in the nextlarge scale experiment.
Applied to this test, the computational model de-scribes the initial build-up of an oxide crust in the drainline, followed up by a re-melting of this crust and afurther ablation of the steel surface [6]. The measuredtemperature histories and the place of drain line fail-ure can be well predicted with this model. Such athermo-fluid-mechanical computation of a system withmoving interfaces between solid structures and melt isextremely complex. The good agreement betweenmeasurement and computation demonstrates a verysatisfying progress in the understanding of RPV lowerhead structural failure.
The aims of the waste management activities are todevelop and test models, and to acquire selected datain support of the performance assessments of Swissnuclear waste repositories. The work is concentratedon further developing our understanding of safetyrelevant mechanisms and processes governing therelease of radionuclides from waste matrices, theirtransport through the engineered barrier system andrepository far-field. The knowledge gained is thenapplied in safety assessments.

From the angle of timely realisation, a repository forshort-lived low and intermediate level wastes (SMA)has first priority. Therefore, as in the past years, mostof our activities were focused on a cementitious re-pository. Three broad fields were addressed: (i) thetemporal evolution of cement pore waters in a hostrock and the transport characteristics of raciionuclides,(ii) the influence of organics in waste and concrete onsuch characteristics and (iii) the generation and char-acterisation of colloids in cement.
The work on cement degradation in groundwater wascompleted. The degradation model developed earlierwas validated along broad lines by a large set of ex-perimental data. Using a model coupling mass trans-port and chemical reactions, it was quantitativelyshown how dissolution of cement by marl groundwaterincreases the cement porosity. On the other handcalcite precipitation in the nearby marl strongly de-creases its porosity and reduces transport rates ofmarl water constituents into the cement and of radi-onuclides out of the repository.
The sorption of some elements in cement is still notwell understood: Batch sorption, through-diffusion andout-diffusion experiments gave incompatible but re-producible results for Nickel and Iodide, whereasthose for Caesium and Chloride were consistent. Thediffusion experiments came to an end and a next stepwili be analysis of the cement disks to get informationon the spatial distribution of radioelements.
Cellulose degradation products were expected tostrongly reduce nuclide sorption (e.g. for Americium)and thus to increase the-source term for leakage fromthe repository. In short-term experiments these expec-tations were fulfilled. However, in long-term experi-ments (a few months) we made a novel discovery:sorption recovers appreciably [7]. The responsiblemechanism is not yet fully understood, but it is evidentthat the effect is very beneficial in a safety assess-ment. In cement pore water cellulose degrades slowlyand it was shown that the important degradationproduct, isosaccharinic acid, sorbs on cement andforms an insoluble calcium salt. All these factors con-tribute positively to the repository safety
With a long-term Caesium experiment, the migrationexperiment at the Grimsel Test Site came to an end.A first evaluation shows good agreement betweenexperimental data and theory thus also corroboratingthe sound modelling in past years. The work onmodelling mass transport in fracture systems wascontinued, and the corresponding computer codeunderwent first verification tests [8].
The work aimed at a mechanistic understanding ofsorption on complex minerals was ongoing. In pursuitof modelling a broad range of data from conditionedmontmorillonite with great success, work has now
started to investigate metal sorption on more realisticmaterials such as unconditioned montmorillonite andillite.
Within the GaBE project {comprehensive assessmentof energy systems), the different options for the Swissenergy supply are being analysed and characterisedby the associated impacts in terms of environmentaleffects, accident risks and costs. Apart from F4 theparticipants in the project include PSI's non-nuclearEnergy research Department (F5) as well as externalpartners from ETHZ (Laboratory for Energy Systems,LES; Centre for Economic Research, WIF; Centre ofRisk and Safety Sciences, KOVERS). The responsi-bility for the co-ordination of GaBE lies within F4.
In the field of environmental inventories (F4, LES), astudy of selected, future electricity supply systemswas carried out using the method of Life Cycle Analy-sis (LCA) [9]. The work was supported by the SwissAssociation of Producers and Distributors of Electricity(VSE).
As regards risk/safety aspects, the accident databaseof the PSI was extended and analysed; it containsnow 3312 energy-related accidents, thereof 1239severe. Different types of accident consequenceswere included, e.g. oil spills and economic losses. TheSwiss dams were examined with respect to the po-tential of severe accidents. Generally, the prevailingcharacteristics of the Swiss dams are favourable fromthe risk point of view. Frequency-consequence curvesand updated normalised fatality curves were obtainedfor the coal, oil, gas, and hydro energy chains. For thenuclear chain a new survey of studies on externalcosts of severe accidents was carried out implement-ing some previous analyses. Full scope Level IIIProbabilistic Safety Assessments as carried out at F4are still rare.
in the domain of decision support aspects (KOVERS),a small scale pilot study using commercial softwarefor multi-criteria analysis was carried out. The deci-sion support framework will be linked to the resultsproduced by the GaBE project.
Further topics are dealt with by the GaBE partners,e.g. environmental impacts of air pollution (F5), large-scale energy-economy models (F5) and sector-specific energy-economy studies (WIF).
Long-term goals
The highlights of the project Advanced Fuel Cycleswere presented at an International Workshop organ-ised -?t PSI. The main purpose of the Workshop wasto lead to recommendations regarding the sustainabil-ity of nuclear energy in Switzerland and the R&D con-tributions to be expected from PSI in this context. The

contributed papers gave a comprehensive picture ofthe achievements in the ongoing R&D-work in bothreactor physics and materials technology activitieswith regard to plutonium incineration in today's LWRand in advanced reactors, on one hand, and actinidetransmutation in accelerator based systems on theother. Aspects of advanced reactor systems and ofthe corresponding fuel cycles were also addressed.The contribution and forward program of PSI werestrongly endorsed. In particular, our physics and ma-terial technology are well placed to address the prob-lems of safety and of the back-end of the nuclear fuelcycle; these are the major issues for the sustainabilityof nuclear energy.
Reactor physics studies have substantiated the fea-sibility of plutonium incinerating LWR based on both100% MOX loading and on uranium-free Pu-Er oxidefuel in an inert ZrO2 matrix, reaching incineration ratesof 30% and 60%, respectively, of the initial plutoniummass. It was shown that such cores could be de-signed to feature operational and safety characteris-tics quite similar to those of present LWR.
The main conclusion of the actinide transmutationsystem studies to date is that transmutation schemesbased on optimised fast spectrum systems using theuranium-plutonium cycle are the most promising. Inthe context of the ATHENA experiments (ATHENA =Actinide Transmutation Using High Energy Accelera-tors), a significant milestone was reached with ifreirradiation of thin UCX, and ThO2 targets in the 0.6 GeVproton beam of PSI's accelerator. This task was ac-complished successfully through a strong multidisci-plinary effort. First results show that all plannedanalysis techniques are applicable. Preliminary ICP-MS measurements have indicated, however, signifi-cant deviations from predictions.
As regards the materials, the technique to fabricate(U, Zr) N pellets was established. The chemical andphysical properties of such ceramics, envisaged forirradiation in the fast reactor Phenix were investi-gated. In the field of advanced Pu consumption inLWRs it was proven that (U, Pu) oxides produced bythe sol-gel process and sintered at low temperatureshow improved dissolution characteristics under re-processing conditions as compared to powderblended fuel. With regard to uranium-free fuel, mate-rials and reactor physics studies were performed todemonstrate that (Pu, Np, Zr) O2 could be produced ina phase ceramic with acceptable neutronics condi-tions throughout the fuel cycle. Once unloaded, suchfuel would be directly disposed in a final repository,having advantageous characteristics with respect toleaching in comparison to vitrified waste.
Future reactor concepts aim to achieve a newsafety quality: The consequences even of extremely
improbable hypothetical accident scenarios should berestricted to the plant itself. Short and long-termemergency measures (sheltering, evacuation, reset-tlement) should not be necessary any more. To thispurpose, passive systems and inherent safetymechanisms, that intervene without the need for hu-man action or external power supplies and bring thereactor to a safe state, are most promising. A centralcomponent of passive safety systems are, amongothers, special condensers that transfer decay heatfrom the containment to the environment. Their op-eration relies only on physical laws.
Participation in the CAMP (Code Assessment andMaintenance Program) of the US NRC is providingaccess to the latest versions of the major transientthermohydraulic systems codes used for LWR(present-day operating reactors) and ALWR (futuredesigns) safety analysis. As part of the Swiss contri-bution to CAMP, a significant improvement to theRELAP5 code was achieved and has been endorsedbytheNRC[10].
Within the framework of the ALPHA project, thefunction of passive containment cooling systems foradvanced LWRs is investigated experimentally andanalytically. The test facility PANDA, that was plannedand built in the preceding years for experimental in-vestigations as the central element of the project, wascommissioned. Facility characterization tests followed,including pressure and leakage tests, heat loss meas-urements and the investigation of the flow/pressuredrop characteristics of the piping [11]. These testsconfirmed the proper design and construction of thefacility in all respects.
Within the framework of smaller ALPHA [ALWR Pas-sive Heat removal and Aerosol retention] sub-projects, the LINX [Large scale Investigation of Natu-ral circulation and mixing] experimental facility wasconfigured for the investigation of a finned contain-ment condenser and commissioning tests were per-formed. A thermohydraulic model was developed todescribe the condensation behaviour in the condenser[12]. The first of seven tests planned for the AIDA[Aerosol Impaction and Deposition Analysis] sub-project was also conducted successfully. The testshowed significant aerosol deposition within the AIDAcondenser which affected somewhat the condensationrate. Analytical work dealt primarily with blind pre-testcalculations for the American safety authority (USNRC) and confirmatory calculations and analyses forplanned and performed experiments, respectively, aswell as with auxiliary calculations for detailed testplanning. The qualification of the computer pro-grammes that are used for safety calculations isthereby significantly advanced through the project.Numerous studies, calculations and model develop-

ment furthered another goal of the project, namely theinvestigation of large-scale mixing and natural circula-tion phenomena.
The PROTEUS LEU-HTR experimental benchmarkprogramme progressed with the investigation of threenew core configurations [13]. In these cores, the ef-fect of an accidental water ingress into the pebble bedwas investigated, providing important insights into thephysical effects involved.
This experimental LEU [Low Enriched Uranium] HTRprogramme is being carried out in the framework of aIAEA coordinated research programme (CRP) withseven participating countries. With the recent comple-tion of the PROTEUS system documentation, ourinternational partners are now able to begin validationof their calculational methods against newer experi-mental data, thus providing invaluable feedback onthe general status of calculational capabilities in thisfield.
The main objective of the proposed LWR PROTEUSexperiments is to reduce the calculational uncertain-ties in the power distribution predictions for BWR fuelassemblies. These uncertainties are relatively large inthe new types of highly heterogeneous fuel assem-blies proposed for use in the Swiss BWRs and have adirect impact on the fuel cycle costs. A draft reportdescribing the proposed experimental programmewas presented to the Swiss utilities anticipated tosupport this programme.
analysis and a tensile testing machine could be re-placed.
For the first time, F4 organised its individual activitiesrelated to the management of own radioactive wasteand liabilities from past research programmes into asingle project RAMP. The main achievements of theproject result from a streamlined and engaged dealingwith this issue. The conditioning of liquid a-waste inthe FIXBOX-1b facility is ongoing significantly aheadof schedule. Several specifications for the intermedi-ate and final storage of this waste were written. Asignificant step was realised with remote encapsula-tion and welding of fuel pin remnants after post irra-diation examination for back transportation to thepower stations. Ail waste from the decommissionedDIORIT reactor was conditioned and correspondingnuclide analyses performed. Next year's efforts willfocus mainly on the transportation of the fuel frompast PROTEUS cores back to Germany and to theresolution of final storage of remaining small amountsof Pu still at PSI.
In parallel progress was made in the SAPHIR de-commissioning: While most of the experimentalinstallations were dismantled in order to prepare thebuilding for its future use, a first batch of 33 spent fuelelements was transported back to the USA. Unirradi-ated fuel elements were delivered to the AustrianSeibersdorf research centre, and neutron diffractome-try hardware was offered to a Hungarian researchcentre.
Infrastructure and Services
PSI's hot laboratory is equipped for the handling ofall types and quantities of the radionuclides built upduring fission and activation with reactor neutrons oraccelerator particle beams. Besides heavy biologicalshielding and safety installations against radionuclideintoxication, emission and theft, the laboratory is alsoequipped with state-of-the-art remotely operated ana-lytical instrumentation for solid state, surface, liquid,trace element, radionuclide and mass spectrometricanalysis.
During 1995 several significant building improvementswere realised. Security was strengthened with new,partly interlocked and computer controlled staff ac-cess doors. An elevator was installed for heavy loadtransfer in the hot cell area and a new storage facilityfor active materials was organised. An important stepwas made concerning the refurbishment of the ana-lytical infrastructure by exchanging the old secondaryion mass spectrometer (SIMS) with a new powerfulAtomica 4000 series system. In addition the computer-ised process control for non-destructive fuel pin
The Reactor School is used for the theoretical basiceducation of the NPP technical staff and for furthertraining of licensed operational staff. To this aim itincludes a federal technical school TS in the field ofnuclear plant technology. In April 1995 a course fortechnicians of 59 week duration (six future reactoroperators) and a reactor engineering course of 27weeks (four future duty engineers) went to end.Meanwhile, the next 59-week course had started inJanuary (eight future reactor operators); this coursewill last until April 1996. In addition, eleven refreshercourses took place in 1995, for a total of 91 licensedreactor operators and shift supervisors of SwissNPPs. Since the foundation of the schools (1965),410 persons have had their theoretical basic trainingthere, in 21 reactor operator courses, 6 technicianlong-courses, 10 reactor engineer courses and 2specialist courses, and 112 TS-diplomas were handedout.
International co-operation
All research activities described above are embeddedin the framework of international co-operations by

means of bi- and multilateral agreements, with andwithout financial obligations. The following table givesan overview of the most important international part-ners in those projects, in which the Department takesa leading role.
The most significant achievement in the past year inthis direction was the admission of four Swiss pro-posals from F4 as joint projects in the 4"1 EuropeanFramework Programme "Fission Safety". Three of
these proposals emerged from within the ALPHAproject and ensure ongoing use of the ALPHA facili-ties in the years to come. The fourth accepted pro-posal puts the CORVIS project in a broader frame-work. A smaller activity deals with the behaviour ofvitrified radioactive waste. Finally, an EU proposal toprovide deeper scientific insight in the aerosol-thermalhydraulic coupling under steam condensation in thepresence of non-condensable species is in prepara-tion.
International Collaboration
GaBE:
Advanced fuel cycles, fuels:
PROTEUS-experiments:
Past reactor safety:
ALPHA:
EDEN, reactor core materials:
Waste Management
Aerosol research, POSEIDON:
Components safety, stress-corrosion cracking:
CORVIS:
within F4 projects
IAEA-Programme, OECD/NEA-Programme, COGEMA (F)
CEA (F), OECD/NSC, PNC (JPN), OECD/NEA-Halden (N), internationalfuel programmes (GEMINI, FIGARO, ARIANE).
Delegated experimentators from USA, D, JPN, PRC, GUS within anIAEA-CRP; additional French participation.
European Fast Reactor, CEA (F).
EPRI (USA), GE (USA), KEMA (NL), IEE (MEX), ENEL (I), EU.
ABB-Atom (S), EPRI/NFIR (USA), COGEMA (F), CEA (F)
Forschungszentrum Karlsruhe (D), EU
EPRI (USA), Framatome (F), AEA Technology (UK), GRS (D).
Forschungszentrum Karlsruhe (D), Siemens/KWU (D), IAEA, MPAStuttgart (D), VTT (FIN).
Contractual participation of 19 institutions from 10 countries in the fra-mework of a Task-Force.
NEXT PA6E(S)left BLANK
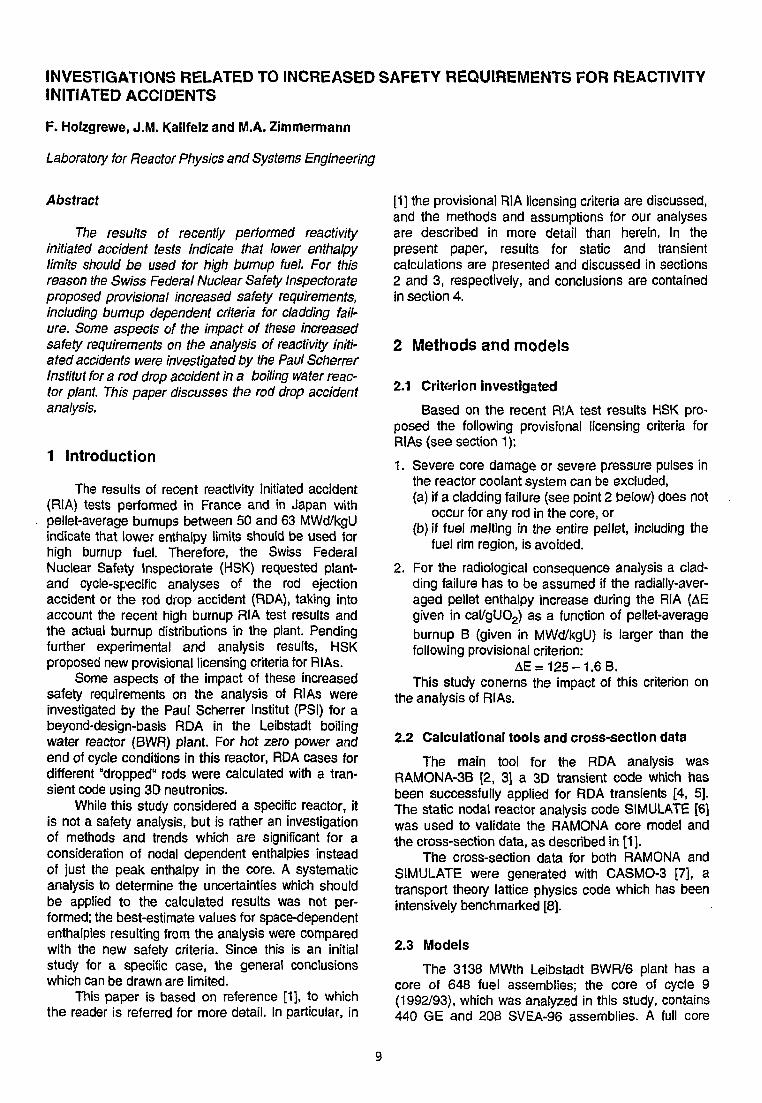
INVESTIGATIONS RELATED TO INCREASED SAFETY REQUIREMENTS FOR REACTIVITYINITIATED ACCIDENTS
F. Holzgrewe, J.M. Kailfelz and M.A. Zimmermann
Laboratory for Reactor Physics and Systems Engineering
Abstract
The results of recently performed reactivityinitiated accident tests indicate that lower enthalpylimits should be used for high burnup fuel. For thisreason the Swiss Federal Nuclear Safety Inspectorateproposed provisional increased safety requirements,including burnup dependent criteria for cladding fail-ure. Some aspects of the impact of these increasedsafety requirements on the analysis of reactivity initi-ated accidents were investigated by the Paul ScherrerInstitut for a rod drop accident in a boiling water reac-tor plant. This paper discusses the rod drop accidentanalysis.
1 Introduction
The results of recent reactivity initiated accident(RIA) tests performed in France and in Japan withpellet-average burnups between 50 and 63 MWd/kgUindicate that lower enthalpy limits should be used forhigh burnup fuel. Therefore, the Swiss FederalNuclear Safety Inspectorate (HSK) requested plant-and cycle-specific analyses of the rod ejectionaccident or the rod drop accident (RDA), taking intoaccount the recent high burnup RIA test results andthe actual burnup distributions in the plant. Pendingfurther experimental and analysis results, HSKproposed new provisional licensing criteria for RiAs.
Some aspects of the impact of these increasedsafety requirements on the analysis of RIAs wereinvestigated by the Paul Scherrer Institut (PSI) for abeyond-design-basis RDA in the Leibstadt boilingwater reactor (BWR) plant. For hot zero power andend of cycle conditions in this reactor, RDA cases fordifferent "dropped" rods were calculated with a tran-sient code using 3D neutronics.
While this study considered a specific reactor, itis not a safety analysis, but is rather an investigationof methods and trends which are significant for aconsideration of nodal dependent enthalpies insteadof just the peak enthalpy in the core. A systematicanalysis to determine the uncertainties which shouldbe applied to the calculated results was not per-formed; the best-estimate values for space-dependententhalpies resulting from the analysis were comparedwith the new safety criteria. Since this is an initialstudy for a specific case, the general conclusionswhich can be drawn are limited.
This paper is based on reference [1], to whichthe reader is referred for more detail. In particular, in
[1] the provisional RIA licensing criteria are discussed,and the methods and assumptions for our analysesare described in more detail than herein. In thepresent paper, results for static and transientcalculations are presented and discussed in sections2 and 3, respectively, and conclusions are containedin section 4.
2 Methods and models
2.1 Criterion investigated
Based on the recent RIA test results HSK pro-posed the following provisional licensing criteria forRIAs (see section 1):
1. Severe core damage or severe pressure pulses inthe reactor coolant system can be excluded,(a) if a cladding failure (see point 2 below) does not
occur for any rod in the core, or(b) if fuel melting in the entire pellet, including the
fuel rim region, is avoided.
2. For the radiological consequence analysis a clad-ding failure has to be assumed if the radially-aver-aged pellet enthalpy increase during the RIA (AEgiven in cal/gUO2) as a function of pellet-average
burnup B (given in MWd/kgU) is larger than thefollowing provisional criterion:
AE = 125-1.6 B.This study conerns the impact of this criterion on
the analysis of RIAs.
2.2 Calculational tools and cross-section data
The main tool for the RDA analysis wasRAMONA-3B [2, 3] a 3D transient code which hasbeen successfully applied for RDA transients [4, 5].The static nodal reactor analysis code SIMULATE [6]was used to validate the RAMONA core model andthe cross-section data, as described in [1].
The cross-section data for both RAMONA andSIMULATE were generated with CASMO-3 [7], atransport theory lattice physics code which has beenintensively benchmarked [8].
2.3 Models
The 3138 MWth Leibstadt BWR/6 plant has acore of 648 fuel assemblies; the core of cycle 9(1992/93), which was analyzed in this study, contains440 GE and 208 SVEA-96 assemblies. A full core

RAMONA model was developed with one hydraulicchannel per neutronic channel and 25 axial nodes. Aseries of static calculations were performed to qualifythis RAMONA model against experiments andSIMULATE results. Details of the validation of thismodel are given in [1].
2.4 Initial and boundary conditions
The RDA is the result of a postulated event inwhich a control rod with a high "worth" (a measure ofthe effect of the rod on the core effective multiplicationconstant) drops from the fully inserted position in thecore. The rod becomes decoupled from its drivemechanism and is assumed to be stuck in place. Afterthe mechanism has been withdrawn, the control rodbecomes unstuck and falls until it reaches the controlrod drive position. This results in a large reactivityaddition and a power excursion.
Protection against the RDA is provided by theconstraints of the banked position withdrawalsequence (BPWS) [9,10], which restricts the possiblecontrol rod patterns and the "dropping distance", andthus limits the worth of the dropped rod. Fig. 1 indi-cates the numbering of the control rods and controlrod groups. The initial control rod configuration for thisanalysis is either the "black and white" control rodpattern (control rod groups 1 to 4 withdrawn) accord-ing to withdrawal sequence A [10], or with rod groups1 to 5 withdrawn.
02 06 10 14 18 2S SB
D U
• ID D D I
Dnoo
DlilÜ !Eü)nJDKiHlSjE^WHI IDfmmmw\
06 10 14 1B 22 26 M 34 36 »2 46 50 M 58
I | Group 1 — j Group Z jijx] Group 3 g/J/j Group 4
Groups j Gioup7 Groups Group 9 ; Group 10
Fig. 1: Numbering of control rods and control rodgroups for the Leibstadt BWR/6 core
For this analysis end of cycle (EOC) conditionswere chosen, to obtain pellet-average burnups greaterthan 50 MWd/kgU. The analysis starts with the initial
conditions for a start-up at hot zero power (HZP)conditions used in the RDA analysis of the plantsafety analysis report [9].
Initial condition:Initial flow rate:Inlet subcooling:System pressure:Xenon distribution:Rod drop velocity:
HZP (3kW)3456 kg/s2.5 K72.3 barNoXe1.5 m/s
2.5 Beyond-design-basis case analyzed
As discussed in [1] for the EOC9 configuration nocontrol rod worths above $1 could be identified whenproper credit was given to the BPWS, and the corre-sponding enthalpy increases for design-basis RDAswere found to be negligible. In order to investigate theappropriate means of analyzing RIAs considering theincreased safety requirements, it was deemed impor-tant to analyze cases for which significant enthalpyincrease results. An obvious way to accomplish this isby considering super-prompt;critical cases. For thisreason, the dropping distance restrictions of theBPWS were neglected, and it was assumed that con-trol rods dropped their total insertable length, 48notches, with the associated group fully inserted. It isimportant to note that, because of this assumption,the transient calculations discussed in the remainderof this article are for beyond-design-basis conditions.
2.6 Power and Burnup Peaking Factors
Local power peaking factors as derived by theassembly code CASMO are factored into the nodalenthalpies calculated by RAMONA to obtain the radi-ally-averaged (over the pin) maximum enthalpy in-crease (henceforth termed "enthalpy increase") in thenodes.
Peaking of the local burnup distribution within theassembly is not accounted for in RAMONA. Hence alocal burnup peaking factor described in [1] is appliedto the nodal burnup values during post-processing, toobtain the maximum pellet-average burnup(henceforth called "pellet-average burnup") in thenodes. Since detailed information about the location ofburnup and enthalpy peaks was not available in thisanalysis, the conservative assumption was made thatthese peaks occur in the same pin (which is not ingeneral to be expected).
3 Static calculations
A series of steady-state RAMONA calculationswere performed to determine static rod worth. Due tothe quarter core rotational symmetry, only one quarterof the core needed to be considered. Most of thepossible rod drops considering the BPWS limitations
10
were calculated, and some of the results are given in[1] for "Design-basis conditions".
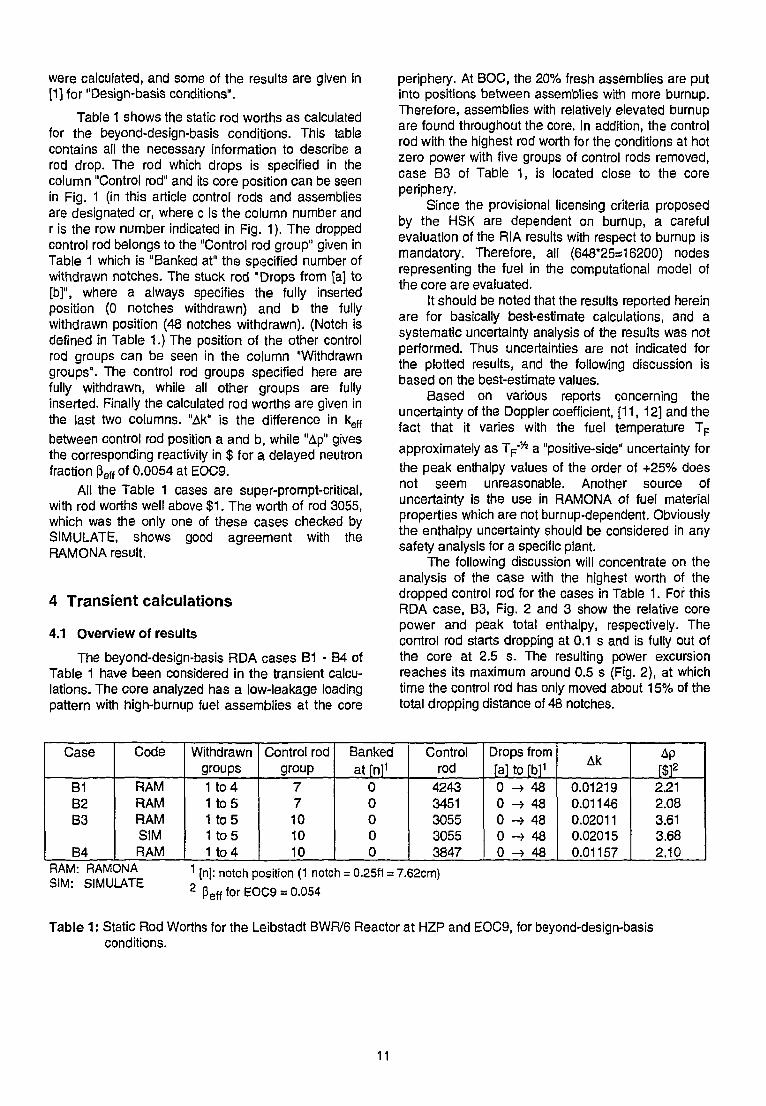
Table 1 shows the static rod worths as calculatedfor the beyond-design-basis conditions. This tablecontains all the necessary information to describe arod drop. The rod which drops is specified in thecolumn "Control rod" and its core position can be seenin Fig. 1 (in this article control rods and assembliesare designated cr, where c is the column number andr is the row number indicated in Fig. 1). The droppedcontrol rod belongs to the "Control rod group" given inTable 1 which is "Banked at" the specified number ofwithdrawn notches. The stuck rod "Drops from [a] to[b]", where a always specifies the fully insertedposition (0 notches withdrawn) and b the fullywithdrawn position (48 notches withdrawn). (Notch isdefined in Table 1.) The position of the other controlrod groups can be seen in the column "Withdrawngroups". The control rod groups specified here arefully withdrawn, while all other groups are fullyinserted. Finally the calculated rod worths are given inthe last two columns. "Ak" is the difference in keff
between control rod position a and b, while "Ap" givesthe corresponding reactivity in $ for a delayed neutronfraction ßeff of 0.0054 at EOC9.
All the Table 1 cases are super-prompt-critical,with rod worths well above $1. The worth of rod 3055,which was the only one of these cases checked bySIMULATE, shows good agreement with theRAMONA result.
4 Transient calculations
4.1 Overview of results
The beyond-design-basis RDA cases B1 - B4 ofTable 1 have been considered in the transient calcu-lations. The core analyzed has a low-leakage loadingpattern with high-burnup fuel assemblies at the core
periphery. At BOC, the 20% fresh assemblies are putinto positions between assemblies with more burnup.Therefore, assemblies with relatively elevated burnupare found throughout the core. In addition, the controlrod with the highest rod worth for the conditions at hotzero power with five groups of control rods removed,case B3 of Table 1, is located close to the coreperiphery.
Since the provisional licensing criteria proposedby the HSK are dependent on burnup, a carefulevaluation of the RIA results with respect to burnup ismandatory. Therefore, all (648*25=16200) nodesrepresenting the fuel in the computational model ofthe core are evaluated.
It should be noted that the results reported hereinare for basically best-estimate calculations, and asystematic uncertainty analysis of the results was notperformed. Thus uncertainties are not indicated forthe plotted results, and the following discussion isbased on the best-estimate values.
Based on various reports concerning theuncertainty of the Doppler coefficient, [11, 12] and thefact that it varies with the fuel temperature TF
approximately as TF'% a "positive-side" uncertainty forthe peak enthalpy values of the order of +25% doesnot seem unreasonable. Another source ofuncertainty is the use in RAMONA of fuel materialproperties which are not burnup-dependent. Obviouslythe enthalpy uncertainty should be considered in anysafety analysis for a specific plant.
The following discussion will concentrate on theanalysis of the case with the highest worth of thedropped control rod for the cases in Table 1. For thisRDA case, B3, Fig. 2 and 3 show the relative corepower and peak total enthalpy, respectively. Thecontrol rod starts dropping at 0.1 s and is fully out ofthe core at 2.5 s. The resulting power excursionreaches its maximum around 0.5 s (Fig. 2), at whichtime the control rod has only moved about 15% of thetotal dropping distance of 48 notches.
Case
B1B2B3
B4
Code
RAMRAMRAMSIMRAM
Withdrawngroups1 to 41 toS1 to 51 to 51 to 4
Control rodgroup
77101010
Bankedat [n]i
00000
Controlrod
42433451305530553847
Drops from[a] to [bV0 -> 480 - * 480 -> 480 -> 480 -> 48
A L*AK
0.012190.011460.020110.020150.01157
Apr$i2
2.212.083.613.682.10
RAM: RAMONASIM: SIMULATE
1 [n]: notch position (1 notch = 0.25ft = 7.62cm)2 ßeff for EOC9 = 0.054
Table 1 : Static Rod Worths for the Leibstadt BWR/6 Reactor at HZP and EOC9, for beyond-design-basisconditions.
11

0.0 0,1 0,2 0.3 0.4 0.5 0.G 0.7 0.S 0.1 1.0 1.1
a
Fig. 2: Case B3 of Table 1: Relative core power
0.0 0.1 0.2 0.3 0.1 O.S 0.6 0.7Tine, (si
0.9 1.0 I.I
Fig. 3: Case B3 of Table 1: Hot spot total enthalpy
Fig. 4 shows the enthalpy increase for theuncontrolled nodes, plotted against pellet-averageburnup at the transient time when the maximumenthalpy in the core of 121.6 cal/g was reached. It isevident that even the best-estimate vaiues for sev-eral assemblies exceed the proposed licensing crite-rion. Also, one assembly with bumup above 40MWd/kgU received enough thermal loading toexceed the criterion for this beyond-design-basisaccident, even though its enthalpy value is well belowthe core maximum.
It is shown in [1] that for the same conditions asin Fig. 4, "controlled" nodes (those for which a controlrod is present) carry a low thermal loading comparedto the "uncontrolled" nodes, and a maximumenthalpy increase of 49 cal/g (at around 20MWd/kgU) is found for the former. For the controllednodes none of the enthalpy increase values exceedthe provisional licensing criterion.
For the results in Fig. 4, the enthalpy values forquite a few nodes are very close to exceeding thecriterion. If an appropriate enthalpy adder for uncer-tainty would be used (as discussed above), morebundles would exceed the criterion. For the othercases analyzed (B1, B2 and B4 of Table 1), none of
the best-estimate values for the uncontrolled or con-trolled nodes exceeded the criterion.
For case B3, the four assemblies surroundingthe dropped control rod 3055 (row 1) carry a highthermal load, as shown in Fig. 5. Although theenthalpy values of the two assemblies with theelevated • burnup are lower than those of the othertwo assemblies, the values for all the assembliesexceed the criterion. The peak enthalpy is found nearthe core top for all of these assemblies, indicating avery "top-peaked" axial power distribution., ,«0
10 20 30 40 SO
Peltet-overoge Burnup [MWd/kgU]
Fig. 4: Case B3 of Table 1: Radially-averaged peakfuel enthalpy increase during the transientversus pellet-average burnup for theuncontrolled nodes.
§ I
£• 20
Assembly 2956Assembly 3156Assembly 2954Assembly 3154
0 10 20 30 40 50 60Pellet-overage Burnup [MWd/kgU]
Fig. 5: Case B3 of Table 1: Radially-averaged peakfuel enthalpy increase during the transientversus pellet-average burnup for the row 1assemblies.
The 12 assemblies surrounding row 1 are des-ignated as row 2. When evaluating the enthalpyincrease for the four row 2 assemblies nearest to thecentre of the core, it was found that for the assemblywith the highest burnup (3152), several points areabove the criterion [1J. As discussed in [1], for aparticular assembly the peak node value might notexceed the criterion although the value for anothernode might be above the criterion. This indicates thatthe evaluation of just the assembly peak values for
12

the fuel enthalpy increase is not adequate for theevaluation of RDA results (for super-prompt-criticaltransients) against the burnup-dependent provisionallicensing criterion.
4.2 Dependence of fuel enthalpy on burnup
For the case with the highest worth of thedropped control rod, case B3 of Table 1, thedependence of the enthalpy increase on burnup isstronger than for the others [1]. For the case B3 theleast-square-fit line is almost parallel to the line rep-resenting the provisional licensing criterion. This is afavourable situation; for the more severe case (B3)relatively less enthalpy is stored in the fuel at highburnup nodes while for cases with a control rod oflower worth (B1, B2, B4) the enthalpy is distributedmore evenly as a function of burnup, but at a muchlower level.
4.3 Dependence of fuel enthalpy on distancefrom the dropped rod
For the four cases B1 - B4 of Table 1 thedependence of the radially-averaged enthalpyincrease on the distance from the dropped rod wasdetermined. The enthalpy increase dependence onthe distance from the dropped rod was the strongestfor the case with the highest rod worth [1 ].
5 Summary and Conclusions
This analysis investigated the impact ofincreased safety requirements on the analysis ofRDAs. A systematic uncertainty analysis was notincluded in this study, and in the following state-ments, conclusions regarding cases which exceedthe cladding failure criterion are for basically best-estimate results.
For design-basis RDAs, in which the control rodpattern and dropping distance restrictions of thebanked position withdrawal sequence (BPWS) areeffective, static control rod worths up to Ak = 0.0027were calculated, and the corresponding fuel enthalpyincreases during these RDAs were found to benegligible.
For beyond-design-basis RDAs, in which thedropping distance restrictions of the BPWS wereneglected and the rods were dropped their totalinsertable length, three RDA cases with static controlrod worths around Ak = 0.012 and one case with Ak= 0.020 were investigated. Only in the latter case didthe calculated enthalpy values exceed the proposedprovisonal fuel failure criterion in some assemblies.
Controlled nodes carry a low thermal load. Noneof the enthalpy increase values for such nodesexceeded the provisional licensing criterion.
The provisional licensing criterion might beexceeded for nodes other than that which has the
maximum assembly enthalpy increase, even thoughfor the fatter the criterion is not exceeded. This indi-cates that the evaluation of all nodes can be nec-essary.
The dependence of the enthalpy increase onburnup was stronger for the case with the highestworth of the dropped control rod than for the othercases. This is a favourable situation; for the moresevere case relatively less enthalpy was stored athigh burnup nodes.
It should be pointed out that the "trends"described above were derived from the analysis of alimited number of cases at the end of a single cycle.Analysis of more cases and of other cycles arenecessary for deriving general trends. In addition, anidentification of the relevant physical phenomena isdeemed necessary.
Acknowledgments
This study was funded in part by the SwissFederal Nuclear Safety Inspectorate (HSK). theauthors appreciate the interest and cooperation of C.Maeder and 1). Schmocker of the HSK, who were co-authors of a joint paper [1] from which this article wasextracted.
We would like to thank W. van Doesburg, R.Lundmark, C. G. Wiktor and H.-U. Zwicky of theLeibstadt nuclear power plant for discussions and forproviding plant data.
References
[1] HOLZGREWE F., KALLFELZ J.M., ZIMMERMANNM.A., MAEDER G. AND SCHMOCKER U.,
"Investigations Related to Increased SafetyRequirements for Reactivity Initiated Accidents",to be published in Proceedings OECDSpecialists' Meeting on Transient Behaviour ofHigh Burn-up Fuel, Centre d'Etudes deCadarache, France, Sept. 12-14, 1995,Commissariat a I'Energie Atomique, France.
[2] WULFF W. et al., "A Description and Assesmentof RAMONA-3B Mod. 0 Cycle 4: A ComputerCode with Three-Dimensional Neutron Kineticsfor BWR System Transients", NUREG/CR-3664,BNL-NUREG-51746, Brookhaven NationalLaboratory, January 1984.
[3] MOBERG L, "User Manual for RAMONA-3B, rev.6", Scandpower, Inc. Kjeller, Norway, June 10,1992.
[4] GRANDI G.M. AND MOBERG L., "Application of theThree Dimensional BWR Simulator RAMONA-3to Reactivity Initiated Events", Proc. of Int. Conf.on Advances in Reactor Physics, Vol. 3, p. 32,Knoxville, April 1994.
13
[5] BELBLIDIA L.A. AND KALLFELZ J.M., "Analyses ofReactivity Insertion Accidents in the MühlebergBoiling Water Reactor", Proc. of Int. Conf. onAdvances in Reactor Physics, Vol.3, p. 134,Knoxville, April 1994.
[6] SMITH K.S. et al., "SIMULATE-3, AdvancedThree-Dimensional Two-Group Reactor AnalysisCode", Studsvik/SOA-92/01, Studsvik ofAmerica, 1992.
[7] EDENIUS M. et a!., "CASMO-3, A Fuel AssemblyBurnup Program", Studsvik/NFA-89/3, StudsvikNuclear, 1992.
[8] EDENIUS M. AND AHLIN A.t "CASMO-3, NewFeatures, Benchmarking and AdvancedApplications", Proc. of the Int. Mtg. Advances in
Reactor Physics and Computation, Vol. 3, Paris,1987.
[9] "KKL Safety Analysis Report", Rev. 94,Leibstadt Nuclear Power Plant, January 1995.
[10] PAONE C.J., "Banked Position WithdrawalSequence", NEDO-21231, 76NED15, GeneralElectric Company, San Jose, January 1977.
[11] FISHER J.R. et al., "Evaluation of AssemblyCross Section Generator Code Discrepancies",Proc. Int. Reactor Physics Conf., Jackson Hole,Wyoming, September 9-12, 1988, p. 11-103,1988.
[12] MOSTELLER R.D. et al., "Benchmark Calculationsfor the Doppler Coefficient of Reactivity", NuclSciEngr. 107, p. 265, 1991.
14
EVALUATION OF A CRITICAL FUEL ROD ENTHALPY VERSUS BURNUP UNDERREACTIVITY INSERTION ACCIDENT CONDITIONS
C. Ott and H. K. Kohl
Laboratory for Materials and Nuclear Processes
Abstract
With the trend to increase the burnup of LWR fuelrods, the actual RIA safety criteria might have to bereformulated due to possible changes in the fuel-cladding properties which seem to lead to a decreaseof the critical fuel enthalpy with increasing burnup.Based on the assumption that the critical fuelenthalpy is reached if the fuel temperature is so-mewhere near the melting point (also off-centre),calculations were carried out using theTRANSURANUS/PSI integral fuel code in order toassess the response of a reference pressurized waterreactor MOX fuel rod in terms of critical fuel enthalpyversus burnup. The influences of the presence of a"rim zone" in the fuel pellet, the width (time at halfmaximum) and the shape of the power excursion we-re also investigated.
reference Pressurized Water Reactor (PWR) MOXfuel rod under RIA conditions.
The main goal of these calculations is the evaluationof the dependence of the critical fuel enthalpy onburnup due to rapid insertion of reactivity. It is assu-med that the critical average radial fuel enthalpy valueis reached when melting is nearly attained somewherein the fuel (also off-centre). In the evaluation of the"critical enthalpy curve" i.e. the critical average ra-dial fuel enthalpy graph versus average burnup, thepresence, at high burnup, of a porous zone in theouter surface of the fuel rod was taken into account. Asensitivity analysis was performed to study the influ-ences of the width (time at half maximum) and theshape (asymmetry) of the power pulse on the radialtemperature distribution and critical fuel enthalpy du-ring the transient.
1 Introduction
The world-wide trend to increase the burnup of LightWater Reactor (LWR) fuel assemblies which todaycan reach more than 60 GWd/tHM is driven by fuelcycle and fuel management economics. A large num-ber of international programmes has demonstratedthat uranium dioxide and Mixed OXide (MOX) fuelrods behave adequately under steady state operationand operational transients. Nevertheless, the recentFrench CABRI test results [1] show that more experi-mental data are needed to describe the behavior ofhigh burnup fuel under accident conditions like, forinstance, the case of Reactivity Insertion Accident(RIA) caused by a hypothetical control rod ejection orwithdrawal. The insertion of a large excess of reactivi-ty causes a rapid overheating of the fuel rods; thiscould lead to a failure, possibly with fuel dispersion.
Most of the actual RIA safety criteria (according tothe countries) are burnup independent and wouldhave to be reformulated by the Safety Authoritiesfollowing possible changes in fuel-cladding proper-ties occurring at high burnup. These changes seem tolead to a decrease of the critical fuel enthalpy withincreasing burnup.
Following a brief description of the main fuel rodtransformations taking place at high burnup, thepresent paper describes the calculations carried outwith the TRANSURANUS-PSI integral fuel behaviourcomputer code (TU/PSI) to assess the response of a
2 Cladding and Fuel alterations at highburnup
It has been suggested from the experience accumula-ted so far, which includes the US-SPERT-CDC andPBF, the French CABRI, the Japanese NSRR and, tosome extent, the IGR Russian tests (hollow pellets)that the response of high burnup fuel under RIA con-ditions might be different from that of low or interme-diate burnup fuel and consequently might affect thesafety criteria.
Fig. 1 shows a compilation of the most relevant expe-rimental results; the filled symbols correspond to rodfailure with or without fuel dispersion.
The material property changes due to high exposurecan modify the behaviour of the fuel rod under such afast transient in a completely different manner thanduring steady state operation.
Three effects can significantly modify the fuel rodbehaviour clad corrosion and hydriding, fissiongas retention and the so-called "r im" effect.
2.1 Cladding corrosion and hydriding
The in-reactor cladding corrosion process of Zirca-loy-4 is the major life time limiting factor for nominalfuel operation. A large amount of experimental corro-sion data [2-3] indicates an acceleration of the corro-sion process at burnup levels greater than 50GWd/tHM. In the upper part of the fuel rod, at highburn-up, oxide layers of more than 100 u.m thickness
15

may be observed. The hydride levels in the claddingincrease proportionally and could be larger than 600ppm wt.
400
IAdi
a
ent
©
5.ax>s<D2I
350
300
250
200
150
100
50
•
n© A ^
9
A) 009
t i l l
• SPERT-CDC*PBFT C A B R I• NSRR
>V
0
0 • v
T
t 1 1
0 10 2 0 3 0 40 5 0 6 0 70
Burnup (GWd/tHM)
Fig. 1 : Compilation of experimental RIA test results(filled symbols mean rod failure with or withoutdispersion)
This corrosion is accompanied by radiation har-dening due to high fast (> 1 MeV) neutron fluencesand to the potential action of aggressive fission pro-ducts on the inner surface of the fuel cladding.
Both phenomena, i.e. cladding hydriding and radiationhardening, seem to cause the decrease in Zircaloy-4cladding ductility at extended burnup levels. Therefo-re, the cladding cannot withstand the same loads athigh fluences and burnups as at lower burnup levels.
2.2 Fission gas retention
At high burnup, the noble gases produced, mainlyXenon and Krypton, are stored within the matrix andfine bubbles. Besides fuel thermal expansion, thesefission gas atoms are probably an additional sourceof cladding loading under transient conditions.
In the case of slow power excursions (minutes tohours) the loading on the cladding is produced by fuelswelling due to gas atom bubble growth and diffusion,whereas during fast transients (in the order of mil-liseconds) the diffusion process becomes less im-portant. Under rapid heating the loading on the clad-ding is most likely due to the release of the gas inven-tory (completely and instantaneously at melting). Thisprocess produces a high internal pressurisation ofthe fuel and the transient fuel swelling before theescape of the gas into the free volumes of the fuelrod.
2.3 Rim effect
The formation of a "rim" zone at the outer surface ofthe fuel pellet at high burnup (rod average burnup ofabout 45 GWd/tHM) is the product of the thermal fluxgradient in the pellet and of resonance captures closeto the fuel surface. It is characterized [4-7] by 1) avery high burnup (more than 2 times the cross-sectional average), 2) a high concentration of plu-tonium, which modifies significantly the radial powerdistribution, 3) a fine subgrain structure (< 1 u.m)resulting in the presence of a large amount of gasbubbles at the grain boundaries, and 4) a high poro-sity (around 30 %) which lowers the thermal con-ductivity. The thickness of the rim zone can reach 200u.m.
The combination of a higher power density and a lo-wer thermal conductivity produces higher fuel tempe-ratures in the outer surface of the fuel. This effect isgreater at higher burnups than lower burnups(assuming the same neutron flux).
During a rapid power excursion the rim zone probablyplays an important role because the already peakingfission density in homogeneous fuel is amplified bythe high Pu content and the increased gas content isboosted by the local high fuel temperatures. In thecase of fuel rod failure, this peripheral zone may befinely fragmented and dispersed into the coolantchannel together with fission gas retained in the fuel [1].
3 Overview of the reference rod test case
3.1 Fuel rod characteristics
A MOX fuel rod, irradiated in a PWR for 5 cycles plusa sixth, simulated cycle has been taken as referenceto perform the calculations. The main characteristicsof the unirradiated fuel rod are summarized in Table1. The initial fuel enrichment of fissile plutonium isabout 4.20%.
Rod characteristics
cladding material
clad outer diameter (mm)
clad inner diameter (mm)
fuel column length (m)
initial diametral cold gap (u.m)
helium prepressurization (bar)
Zr4 CWSR
10.72
9.48
3.0
19023
Table 1: Initial main characteristics of the selectedtest fuel rod
3.2 Power history
During the 6 cycles irradiation period, the fuel pin wastaken to an average burnup of 54.3 GWd/tHM. Fig. 2shows a schematic representation of the linear heat
16
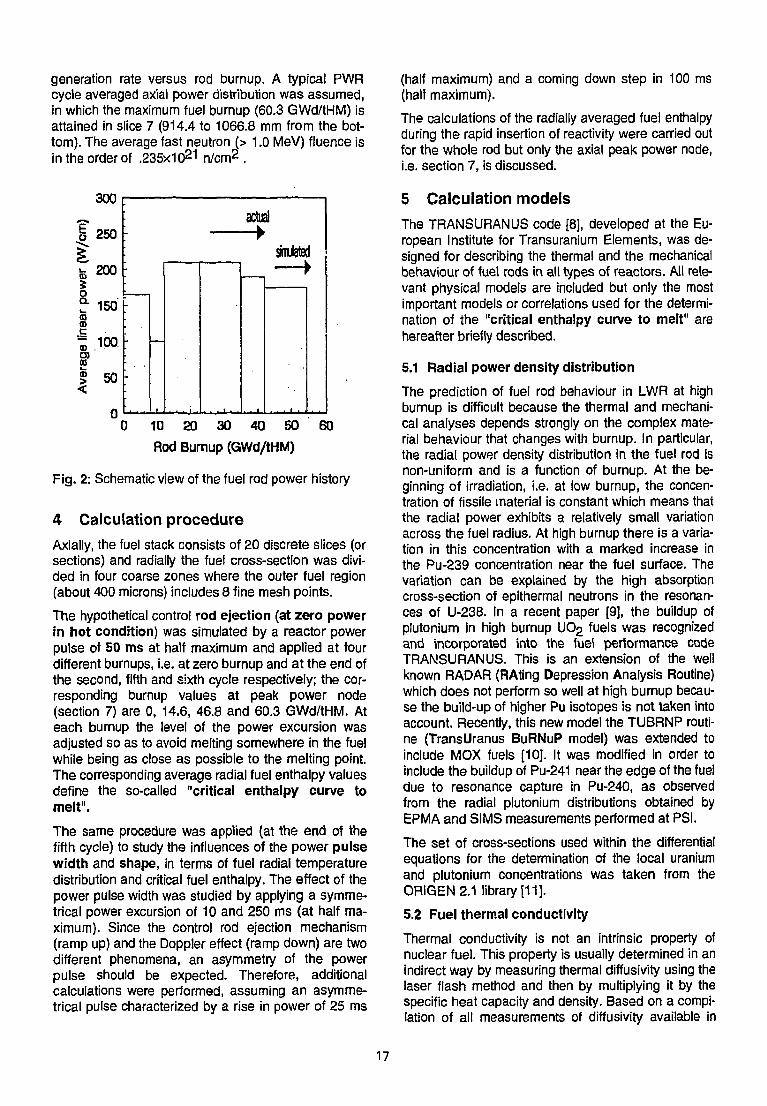
generation rate versus rod burnup. A typical PWRcycle averaged axial power distribution was assumed,in which the maximum fuel burnup (60.3 GWd/tHM) isattained in slice 7 (914.4 to 1066.8 mm from the bot-tom). The average fast neutron (> 1.0 MeV) fluence isin the order of .235x1021 n/cm2 .
300
I 250
fe 200
o? 150asa>
« 100O)
s? 50<
actual
snujfetsd
0 10 20 30 40 50 60
Rod Burnup (GWd/tHM)
Fig. 2: Schematic view of the fuel rod power history
4 Calculation procedureAxially, the fuel stack consists of 20 discrete slices (orsections) and radially the fuel cross-section was divi-ded in four coarse zones where the outer fuel region(about 400 microns) includes 8 fine mesh points.
The hypothetical control rod ejection (at zero powerin hot condition) was simulated by a reactor powerpulse of 50 ms at half maximum and applied at fourdifferent burnups, i.e. at zero burnup and at the end ofthe second, fifth and sixth cycle respectively; the cor-responding burnup values at peak power node(section 7) are 0, 14.6, 46.8 and 60.3 GWd/tHM. Ateach burnup the level of the power excursion wasadjusted so as to avoid melting somewhere in the fuelwhile being as close as possible to the melting point.The corresponding average radial fuel enthalpy valuesdefine the so-called "critical enthalpy curve tomelt".
The same procedure was applied (at the end of thefifth cycle) to study the influences of the power pulsewidth and shape, in terms of fuel radial temperaturedistribution and critical fuel enthalpy. The effect of thepower pulse width was studied by applying a symme-trical power excursion of 10 and 250 ms (at half ma-ximum). Since the control rod ejection mechanism(ramp up) and the Doppler effect (ramp down) are twodifferent phenomena, an asymmetry of the powerpulse should be expected. Therefore, additionalcalculations were performed, assuming an asymme-trical pulse characterized by a rise in power of 25 ms
(half maximum) and a coming down step in 100 ms(half maximum).
The calculations of the radially averaged fuel enthalpyduring the rapid insertion of reactivity were carried outfor the whole rod but only the axial peak power node,i.e. section 7, is discussed.
5 Calculation modelsThe TRANSURANUS code [8], developed at the Eu-ropean Institute for Transuranium Elements, was de-signed for describing the thermal and the mechanicalbehaviour of fuel rods in all types of reactors. All rele-vant physical models are included but only the mostimportant models or correlations used for the determi-nation of the "critical enthalpy curve to melt" arehereafter briefly described.
5.1 Radial power density distribution
The prediction of fuel rod behaviour in LWR at highburnup is difficult because the thermal and mechani-cal analyses depends strongly on the complex mate-rial behaviour that changes with burnup. In particular,the radial power density distribution in the fuel rod isnon-uniform and is a function of burnup. At the be-ginning of irradiation, i.e. at low burnup, the concen-tration of fissile material is constant which means thatthe radial power exhibits a relatively small variationacross the fuel radius. At high burnup there is a varia-tion in this concentration with a marked increase inthe Pu-239 concentration near the fuel surface. Thevariation can be explained by the high absorptioncross-section of epithermal neutrons in the resonan-ces of U-238. In a recent paper [9], the buildup ofPlutonium in high burnup UO2 fuels was recognizedand incorporated into the fuel performance codeTRANSURANUS. This is an extension of the wellknown RADAR (RAting Depression Analysis Routine)which does not perform so well at high burnup becau-se the build-up of higher Pu isotopes is not taken intoaccount. Recently, this new model the TUBRNP routi-ne (TransUranus BuRNuP model) was extended toinclude MOX fuels [10]. It was modified in order toinclude the buildup of Pu-241 near the edge of the fueldue to resonance capture in Pu-240, as observedfrom the radial plutonium distributions obtained byEPMA and SIMS measurements performed at PSI.
The set of cross-sections used within the differentialequations for the determination of the local uraniumand plutonium concentrations was taken from theORIGEN2.1 library [11].
5.2 Fuel thermal conductivity
Thermal conductivity is not an intrinsic property ofnuclear fuel. This property is usually determined in anindirect way by measuring thermal diffusivity using thelaser flash method and then by multiplying it by thespecific heat capacity and density. Based on a compi-lation of all measurements of diffusivity available in
17

the literature, Philipponneau [12] re-calculated theconductivity of MOX fuel by using up-to-date recom-mendations for heat capacity and density leading to areduced scattering of the results.
Conductivity values were analysed in order toestablish a recommendation taking into account theeffects of the deviation from stoichiometry and plu-tonium content, as well as the influence of porosityand burnup.
Burnup induces a great modification of fuel parame-ters which changes the conductivity. A burnup cor-rection term of 0.0044 mK/W per at% is recommen-ded, but this is clearly a domain where knowledge issorely lacking because of the small number of re-sults.
According to the specific characteristics of the "rim"zone, as described above, an additional correctionwas applied in order to take into account the suppo-sed lower thermal conductivity of this region [13]. Adegradation of the thermal conductivity was applied inthe rim zone which is assumed to appear when thelocal fuel burnup exceeds 7 at%,
where
cl = 9/7
c2 = 8
ß = local burnup in at%
This correction assumes a decrease of the fuel ther-mal conductivity by a factor of 10 at a local burnup of14 at%. Fig. 3 shows the fuel thermal conductivitydegradation versus local burnup.
Fig. 3:
8 9 10 11 12 13 14
Local bumup (at%)
Assumed degradation of the fuel thermalconductivity in the rim zone
5.3 Fuel enthalpy
The local fuel enthalpy is the integral of the specific
heat at constant pressure i.e. H=\Cp dT over the
local fuel temperature range (Fig. 4b). The analyticform of the local specific heat at constant pressureconsidered is given by the following correlation [14](Fig. 4a)
C sol =12.54 + Tk(0.017 + 7^ (-0.1 IX10" 4 +
Tkx 0.307 xlO~8))
C = C x 15.4894/(3.6 x lO + 6 )p p,o
where % is the liquid fraction
X = 0 solid, % -1 liquid
T, = fuel temperature (K)
5.4 Solidus and liquidus fuel meltingtemperatures
The MAPLIB-handbook [14] correlation was taken asreference in the determination of the local fuel meltingtemperature value. The solidus, and liquidus fuel mel-ting temperatures are given by
T =Tm,liq m,sol
where
T = local fuel temperature [K]
CPu = local Pu mass fraction [-]
AT^ = bumup correction = 32 x W4 x bu
bu = local burnup [MWd / tU]
No correction for the influence of the oxygen-to-metalratio (stoichiometry) was considered.
18

0.20.180.16
"2 0.14So.12| o ,
0.08^0.06
0.040.02
0
11 • ii
i
: i
; i
: i
i i
- ir
-\ i \ ( I i i
— TRANSURANUS— Barin/Knacke 1973
I
I
I
r
I
•
I
1
.j/f.
1
1
I I 1
i 1 I t i 1 1 1 I i t 1 1 t 1 1
• / *
r
i
t
t i
I i
i I
0 500 1000 1500 2000 2500 3000 3500T, K
400
350
o>300
g250
«200
^ 150
i"ioo50
00 500 100015002000250030003500
T, K
Fig. 4: a) Specific heat at constant pressure andb) Enthalpy of uranium dioxide versustemperature
:
':
" 1 1
c
c. - . . F
, _ _ j
rRANSURANUS3arin/Knacke1973Sodfrey et al. 1966/67:landetal. 1977
cfrTi i . . •.
•
y .
I
ii 1 1 i 1 I 1 i i
A'-/-V
I I I !
6 Calculation results
The calculation results given hereafter emphasize,mainly, the influences of a) the fuel rod burnup b) the"rim" correction c) the width and d) the shape of thepower excursion in terms of critical fuel enthalpy.
6.1 Transient power and fuel enthalpy
The level of the power excursion was choosen accor-ding to the procedure described paragraph 4. Fig. 5ashows the linear power for section 7 (peak power) atthe different burnups. At each burnup, the transientlasted 100 ms with a power increase during 50 msand a decrease also during 50 ms i.e. the time intervalof half maximum power was 50 ms. As the figureshows, the transient power levels at low (0 and 14.6GWd/tHM) and intermediate (46.8 GWd/tHM) burnupsare not very different. In this burnup range, the diffe-rences of the critical power level are due to the de-crease of the fuel melting temperature as well as tothe degradation of the fuel thermal conductivity. At
intermediate burnup (46.8 GWd/tHM) the influence ofthe outer porous fuel zone (about 50 microns) interms of critical energy deposition remains low. At ahigh average burnup (60.3 GWd/tHM) the burnup inthe outer fuel zone (see below) increases very muchand decreases therefore both the melting temperatureand the fuel thermal conductivity in the rim zone(about 200 microns). The consequence is a drasticallydecreased transient power so that in the outer fuelzone the fuel temperature is on the verge of melting.For instance, an increase of the transient rod powerfrom 2800 to 2850 kW/m will already cause fuel mel-ting in the outer fuel zone.With lower transient power and lower fuel temperaturethe fuel enthalpy also decreases, Fig. 5b. As the tem-perature increases during 50 to 100 ms, the fuel ent-halpy also increases during this time interval and be-gins slowly to decrease after this time.
15000
12500.E
iiOOOO
I 7500oa.
3 5000
2500
0300
250
200
-
Av.BU = 0.0Av. BU = 14.6 GWd/tHMAV. BU = 46.8 GWd/tHM
— - • Av.BU= 60.3 GWd/tHM
:
\
''•- / /
''• i*
1 t
Ä
- 7~
' - ' ' * ' ! " "" -t t t i 1 i i i t
a)
\ s
25 50 75Time, ms
100
•5*
S
f 150
% 100
;-
\
1
1
1
/ ' • • • '
„„I,,,,
•
1
' ' M f ' ' ' ' m i
b):
- _ t —
T- -
•
, M l l , M .
50
00 25 50 75 100 125 150 175 200
Time, ms
Fig. 5: a) Power transientsb) Fuel enthalpy at different burnups(section 7)
19
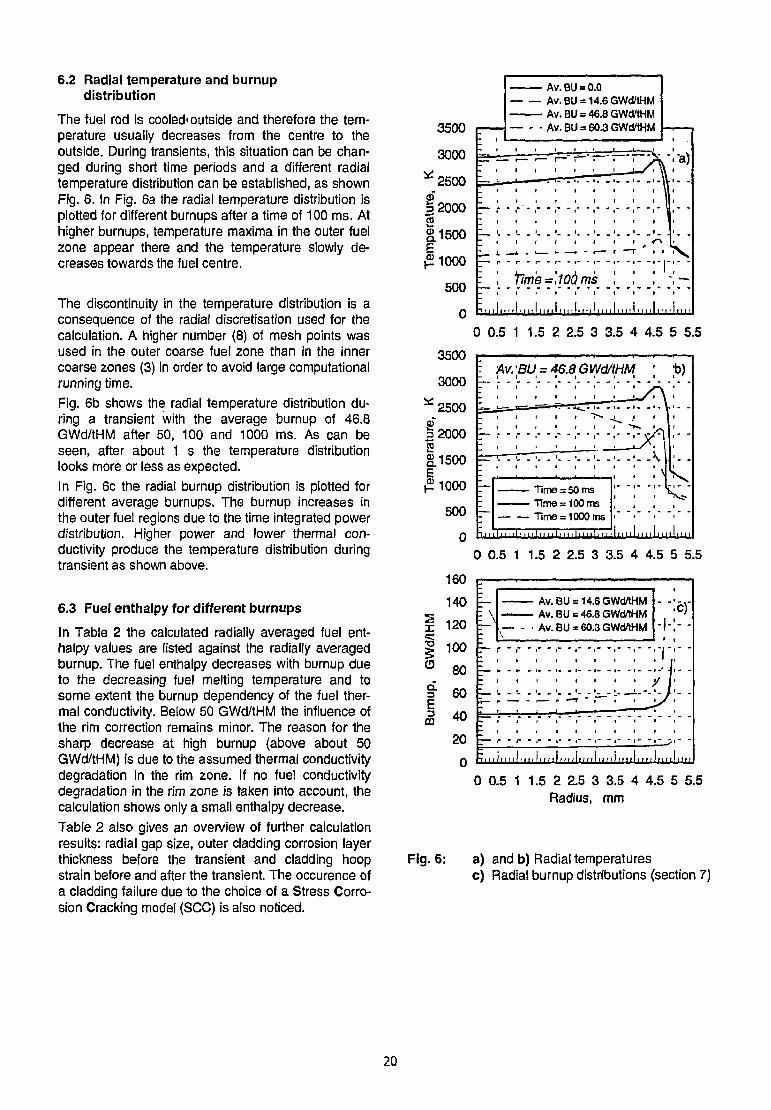
6.2 Radial temperature and burnupdistribution
The fuel rod is cooled'outside and therefore the tem-perature usually decreases from the centre to theoutside. During transients, this situation can be chan-ged during short time periods and a different radialtemperature distribution can be established, as shownFig. 6. In Fig. 6a the radial temperature distribution isplotted for different burnups after a time of 100 ms. Athigher burnups, temperature maxima in the outer fuelzone appear there and the temperature slowly de-creases towards the fuel centre.
The discontinuity in the temperature distribution is aconsequence of the radial discretisation used for thecalculation. A higher number (8) of mesh points wasused in the outer coarse fuel zone than in the innercoarse zones (3) in order to avoid large computationalrunning time.
Fig. 6b shows the radial temperature distribution du-ring a transient with the average burnup of 46.8GWd/tHM after 50, 100 and 1000 ms. As can beseen, after about 1 s the temperature distributionlooks more or less as expected.
In Fig. 6c the radial burnup distribution is plotted fordifferent average burnups. The burnup increases inthe outer fuel regions due to the time integrated powerdistribution. Higher power and lower thermal con-ductivity produce the temperature distribution duringtransient as shown above.
6.3 Fuel enthalpy for different burnups
In Table 2 the calculated radially averaged fuel ent-halpy values are listed against the radially averagedburnup. The fuel enthalpy decreases with burnup dueto the decreasing fuel melting temperature and tosome extent the burnup dependency of the fuel ther-mal conductivity. Below 50 GWd/tHM the influence ofthe rim correction remains minor. The reason for thesharp decrease at high burnup {above about 50GWd/tHM) is due to the assumed thermal conductivitydegradation in the rim zone. If no fuel conductivitydegradation in the rim zone is taken into account, thecalculation shows only a small enthalpy decrease.
Table 2 also gives an overview of further calculationresults: radial gap size, outer cladding corrosion layerthickness before the transient and cladding hoopstrain before and after the transient. The occurence ofa cladding failure due to the choice of a Stress Corro-sion Cracking model (SCC) is also noticed.
3500
3000
•2500 ~
§2000£2g.1500E£1000
500
0
•I ,
- 1
- •
1
" 4
t
Li,
AiAT
AT
/. BU — 0.0
/. BU = 46,8 GWd/tHM
t 1
1 |
_1 - i—tim'e =
u •
Wdmi
— -
r —
i
J
-
u / l i
'A1 1
1•
•a)
i i i i i i i i i
• 11 •^ 111 111111111(i111111111IIir1iii i ! I M 111 M i
0 0.5 1 1.5 2 2.5 3 3.5 4 4.5 5 5.5
3500
3000 t-
*2500 L-i==-0
5 2000S2.1500E
£1000
500
0
;
Ss-
~—
Av. BU = 416.8Gl
———
VdA
Time = 50 msTime = 100 msTime = 1000 ms
" • . I . | M I . | I , , . , ! , , , ,
IHM
i n i
f •i
i
iM M I M I
p)
1I l l l t
0 0.5 1 1.5 2 2.5 3 3.5 4 4.5 5 5.5
160
140
I 120| 100
° 80I 60| 40
20
II I I
I 1 1 1 t 1 T
1 _
T | | |
Av. BU = 14.6 GWd/tHMAv. BU = 46.8 GWd/IHM
, • Av.BU = 60.3GWdrtHM -1-. . , - , - - , - - . - - • - - • • - • - - ; |
/ j
I J ( I • i t
1 I ' f l < f f M I M 11 f ff f ' ' ' ' ' ' ' f 1 1 1 ! 1 ' 1 M 1 '
c)'
1 1 1 1 1 M M
0 0.5 1 1.5 2 2.5 3 3.5 4 4.5 5 5.5Radius, mm
Fig. 6: a) and b) Radial temperaturesc) Radial burnup distributions (section 7)
20

Pellet burnup
(radially averaged}
[GWd/tHM]
0.0
14.6
46.8
60.3'
Peak linear power
[kW/mJ
13825
13445
11277
3036*
Fuel peak
temperature
IK]
3072.8
3022.2
2906.1
1412.0*
Crit. fuel enthalpy
(radially averaged)
[cal/g]
238.6
228.8
194.7
67.5
Radial gap size
(before transient)
[um]
85.9
34.1
6.2
10.3
Outer cladding
corrosion layer
Dim]
0.3
6.5
19.7
25.7
Cladding hoopstrain
(before/at transient)
t%]
0.07/2.68
(no failure)
-0.29/2.79
(no failure)
•0.25/2.93
(clad failure)
0.05/0.53
(clad failure)
(*) A power increase of about 2% gives a fuel peak temperature of 2974 K and a fuel enthalpy of 71.3 cal/g.
Without "rim" correction
60.3 10843 2833.8 184.6 5.1 25.7
-0.07/2.93
(clad failure)
Table 2: Overview of TU/PSI calculation results. Power excursion width (at half max.) 50 ms.
Power excursion
width (half maxi-mum)
[ms]
10
50
250
125
Power excursion
(SorA)*
[-1
s
s
s
A
Peak linear power
[kW/m]
43372
11277
2711
5204
Fuel peak
temperature
[K]
2897.4
2906.1
2926.8
2918.3
Crit. fuel enthalpy
(radially averaged)
[cal/g]
159.9
194.7
212.0
211.3
Cladding hoopstrain
(before/at transient)
l%]
-0.25/2.21
(clad failure)
-0.25/2.93
(clad failure)
-0.25/2.09
(clad failure)
-0.25/1.95
(clad failure)
(*) S: symmetrical power excursion shape, A: asymmetrical shape
Table 3: Overview of TU/PSI calculation results. Influences of the power excursion width and shape. Av. burnup: 46.8 GWd/tHM.
21
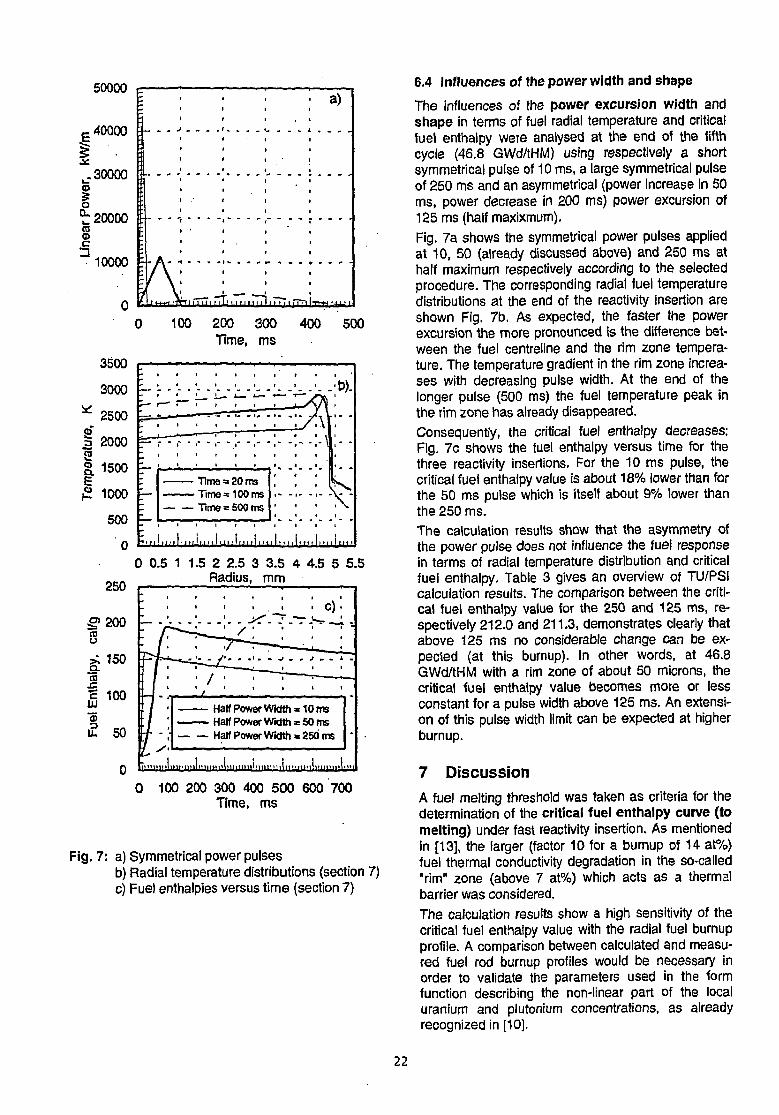
50000
E 40000
t.30000
It 20000en©
"J1OO0O
j
A,t n 1111 > i 1 f 1 M f 111
a)
TTT1 11A4 t
0 100 200 300 400 500Time, ms
3500
3000
* 2500
I 2000S
g. 1500
£ 1000
500
t>).
Tiina a 20 msTime« 100 msTime = 5O0 ms
H ! 11.' ! i * i H.
0 0.5 1 1
250
H,,I.J.,I.,.,L.,I,...I,...I....I,
5 2 2.5 3 3.5 4 4.5 5 5.5Radius, mm
Half Power Width» 10 msHalf Power Width = 50 msHalf Power Width «250ms
0 100 200 300 400 500 600 700Time, ms
Fig. 7: a) Symmetrical power pulsesb) Radial temperature distributions (section 7)c) Fuel enthalpies versus time (section 7)
6.4 Influences of the power width and shape
The influences of the power excursion width andshape in terms of fuel radial temperature and criticalfuel enthalpy were analysed at the end of the fifthcycle (46.8 GWd/tHM) using respectively a shortsymmetrical pulse of 10 ms, a large symmetrical pulseof 250 ms and an asymmetrical (power increase in 50ms, power decrease in 200 ms) power excursion of125 ms (half maxixmum).
Fig. 7a shows the symmetrical power pulses appliedat 10, 50 (already discussed above) and 250 ms athalf maximum respectively according to the selectedprocedure. The corresponding radial fuel temperaturedistributions at the end of the reactivity insertion areshown Fig. 7b. As expected, the faster the powerexcursion the more pronounced is the difference bet-ween the fuel centreline and the rim zone tempera-ture. The temperature gradient in the rim zone increa-ses with decreasing pulse width. At the end of thelonger pulse (500 ms) the fuel temperature peak inthe rim zone has already disappeared.Consequently, the critical fuel enthalpy decreases:Fig. 7c shows the fuel enthalpy versus time for thethree reactivity insertions. For the 10 ms pulse, thecritical fuel enthalpy value is about 18% lower than forthe 50 ms pulse which is itself about 9% lower thanthe 250 ms.
The calculation results show that the asymmetry ofthe power pulse does not influence the fuel responsein terms of radial temperature distribution and criticalfuel enthalpy. Table 3 gives an overview of TU/PSIcalculation results. The comparison between the criti-cal fuel enthalpy value for the 250 and 125 ms, re-spectively 212.0 and 211.3, demonstrates clearly thatabove 125 ms no considerable change can be ex-pected (at this burnup). In other words, at 46.8GWd/tHM with a rim zone of about 50 microns, thecritical fuel enthalpy value becomes more or lessconstant for a pulse width above 125 ms. An extensi-on of this pulse width limit can be expected at higherburnup.
7 DiscussionA fuel melting threshold was taken as criteria for thedetermination of the critical fuel enthalpy curve (tomelting) under fast reactivity insertion. As mentionedin [13], the larger (factor 10 for a burnup of 14 at%)fuel thermal conductivity degradation in the so-called"rim" zone (above 7 at%) which acts as a thermalbarrier was considered.
The calculation results show a high sensitivity of thecritical fuel enthalpy value with the radial fuel burnupprofile. A comparison between calculated and measu-red fuel rod burnup profiles would be necessary inorder to validate the parameters used in the formfunction describing the non-linear part of the localuranium and plutontum concentrations, as alreadyrecognized in [10].
22

Some of the models selected to assess the fuel rodbehaviour are not specific to fast reactivity insertionsimulations. For instance:
• the fuel swelling model (described in detail in [3])depends on the burnup increment which is low duringthe fast transient;
- the SCC model has been calibrated only for normalreactor operation conditions;
- the nonslip option of the pellet-cladding mechanicalinteraction model suffers from severe limitations and
cannot account for a correct treatment if the fuelsticks to the cladding.
All the calculation results are plotted versus rod bur-nup in Fig. 8 with the set of relevant experimentaldata. The main objective of this figure is only toposition the critical enthalpy curve in the frame-work of the existing experimental data but not tomake a direct comparison between calculated andmeasured results.
400
ON350Z)
lT 300
COJO
250
200
i 150
i,03
50
0
i*I
I'2 A
"X* . .
oo
•0
SPERT-CDC(US)PBF(US)CABRI(FRANCE)NSRR(JAPAN)Calculated(TU/PSI)
- . Rep Nax 4 ^ 25/250 ms
Rep3
V \
. without"rim" correction
00
0
8
, RepNa
v'X v
Rep Na
with"rim" correction
0 10 20 30 40 50 60 70
Burnup (MWd/tHM)
Fig. 8: Calculated (TU/PSI) and experimental average radial critical fuel enthalpies versus rod burnups (filled symbols correspond to rod failure with or without fuel dispersion)
8 Summary
The TRANSURANUS/PSI integral fuel behaviourcomputer code has been used to assess the fuel re-sponse under RIA conditions in terms of critical aver-age radial fuel enthalpy versus burnup. A critical fuel
enthalpy value (for melting) is assumed to be reachedwhen melting is nearly attained somewhere in thefuel.The calculations were performed based on thecharacteristics of a reference MOX fuel rod irradiatedduring 6 cycles in a pressurized water reactor re-aching an end of life burnup of 60.3 GWd/tHM. In
23

order to simulate the expected lower thermal con-ductivity of the "rim" zone (local burnup higher than 7at%) in the fuel, an additional burnup degradationincrement was introduced in the thermal conductivitycorrelation of Philipponneau.
The RIA conditions were simulated by a power pulseof 50 ms at half maximum. The level of the powerexcursion was adjusted in order to avoid melting any-where in the fuel but to be as close as possible at themelting point. Calculations were carried out at fourdifferent burnups.
A gradual decrease of the average radial critical fuelenthalpy is observed as the bumup increases to 47GWd/tHM due to the decrease of the melting tempe-rature and the fuel thermal conductivity. At this burnupthe rim zone is quite small (about 50 microns) and,consequently, does not significantly influence thecritical fuel enthalpy value. At higher burnup, thecalculation results show a drastic decrease of thecritical fuel rod enthalpy due to the influence of thedegradation of the thermal conductivity in the "rim"zone.
Due to the high sensitivity of the critical fuel enthalpyvalue to the radial fuel burnup profile, further investi-gations are needed, and a comparison betweencalculated and measured fuel rod burnup profileswould be necessary in order to confirm the validity ofthe fitting parameters included in the form functionused for the determination of the local uranium andPlutonium concentrations, i.e. the radial power profile.
The influences of the power pulse width and shapewere studied at a constant burnup of 46.8 GWd/tHMusing respectively a short symmetrical pulse of 10 ms,a large symmetrical pulse of 250 ms and an asymme-trical (50 ms up, 200 ms down) power excursion of125 ms (half maximum). The calculation results showthat the critical fuel enthalpy decreases with decrea-sing power witdth (time). Above 125 ms the criticalfuel enthalpy value remains quite constant. This limitcan be expected to be larger for higher fuel burnup.
The calculation results show that the asymmetry ofthe power pulse does not influence significantly thefuel rod response in terms of radial fuel temperatureand critical fuel enthalpy.
We have shown that, if the fuel has been irradiated athigh burnup levels, the fuel pellet rim temperature canincrease up to melting point in the event of even aminor rapid power excursion and if thermal conductivi-ty degradation is relevant.
9 References
[1] PAPIN, J., et al, "The Behaviour of Irradiated Fuelunder RIA Transients: Interpretation of the CABRIExperiments" CSNI Specialist Meeting on Transi-
ent Behaviour of High Burnup Fuel, Cadarache,France 12th-14th September 1995.
[2] KLIP, G. R. et al. "Corrosion Experience with Zirca-loy and 2IRLO in operating PWRs" ANS/ENS In-ternational Topical Meeting on LWR Fuel Perfor-mance, Avignon, France, (1991) 730-741.
[3] LIMBACK, M., et al. "Corrosion and Hydriding Per-formance of Zircaloy-2 and Zircaloy-4 CladdingMaterials in PWRs", ANS/IAEA International Topi-cal Meeting on LWR Fuel Performance, WestPalm Beach, Florida, (1994) 286-295.
[4] CUNNINGHAM, M. E. et al. "Development and Cha-racteristics of the Rim Region in High Burnup UO2Fuel Pellets" J. of Nucl. Mat. 188 (1992) 19-27.
[5] KAMEYA, T., et al. "Analysis of Rim Structure For-mation in Batelle High Burnup Program",ANS/ENS International Topical Meeting on LWRFuel Performance, Avignon, France, (1991) 620-626.
[6] THOMAS et al. "Microstructural Analysis of LWRSpent fuel at High Burnup", J. of Nucl. Mat. 188(1992)80-89.
[7] MATZKE, H. "On the Rim Effect in High BurnupUO2 LWR Fuels" J. of Nucl. Mat. 188, (1992) 141-148.
[8] LASSMANN, K., "TRANSURANUS: a fuel rod ana-lysis code ready for use", J. of Nucl. Mat. 188(1992)295-302.
[9] LASSMANN, K., et al. "The Radial Distribution ofPlutonium in High Burnup UO2 Fuels, J. of Nucl.Mat. 208 (1994) 223-231.
[10] O'CARROLL, C, et al., "Validation of the TUBRNPModel with the Radial Distribution of Plutonium inMOX Fuel evaluated by SIMS and EPMA", WaterReactor Fuel Element Modelling at High Burnup,Windermere, Sept. 19-23,1994.
[11] CROFF, A., G., "ORIGEN 2: A Versatile ComputerCode for Calculating the Nuclide compositionsand Characteristics of Nuclear Material", NuclearTechnology (1983) 62.
[12] PHILIPPONNEAU, Y. "Thermal conductivity of(U,Pu)C>2-x mixed oxide fuel", Nuclear Materialsfor Fission Reactors", EMRS, Strasbourg, Nov.4-7,1991.
[13] LASSMANN, K., "Thermal Analysis", Scientific Is-sues in Fuel Behaviour, OECD Documents,Nuclear Energy Agency, January 1995.
[14] SCHUSTER, "Darstellung der Stoffdaten des Sy-stems MATLIB", KFK-EXT.,877-1(1977).
24

LENINGRAD NUCLEAR POWER PLANT PRESSURE TUBE FAILURE INVESTIGATIONS
H.Bruchertseifer*, G.Bart*, R.Restani*
V.G.Aden**, V.Ya.Abramov**, V.E.Kalachikov**, A.V.Kozlov", A.V.Subbotin**, E.A.Smirnov***
* Laboratory for Materials Behaviour
** Research and Development Institute of Power Engineering (RDIPE), Moscow and Sverdlovsk, Russia
*** Moscow Engineering Physics Institute, Moscow, Russia
Abstract
During March 1992 a fuel pressure tube of a reactorchannel of the Leningrad Nuclear Power Plantunderwent a temperature excursion after a coolantflow blockage and was destroyed. In the following,within the Swiss Eastern European aid program acollaboration was set up for a project between theMoscow Research and Development Institute ofPower Engineering, the designer of the RBMK-reactors, and the Paul Scherrer Institute. An intensivefailure analysis program was started, based onmodern equipment available at PSI for analysis ofhighly radioactive material and on the experience ofboth institutes in investigating failures of reactorstructure materials, with the goal of establishing theaccident temperature evolution in time. This reportpresents the results of studies undertaken in order todetermine the parameters which govern the eventsduring the accident obtained from an analysis of thetube failure material together with evaluations of theapparent phase and structure changes. Our analysisof experimental data for oxygen distribution and thediffusion coefficient calculations showed that thetemperatures exceeded 1300°C, which is much higherthan results from previous studies performed instandard failure post-irradiation examination. Theresults obtained are important in that they haveallowed to revise the previous assessments of theinitial thermal conditions of the accident progression.In particular, they already served as a basis fordetermining the efficiency of the RBMK safetyimprovement measures carried out in response to theaccident.
Accident analysis as a Swiss-Russiancooperation
The experimental determination of the characteristicdata of nuclear reactor materials and of theirmodification during an accident is an essential part ofa post-accident analysis. It is especially important forthe investigation of damage to reactor structuralcomponents, such as pressure tubes, fuel element
assemblies and fuel pin cladding, which enclose andhermetically seal the highly radioactive fuel.
The process describing the individual real damagesallows one to judge the stability of the reactorconstruction material under accident conditions and toimprove the operation, or even the construction ofreactors.
After the Tschernobyl accident, the improvement ofthe safety of the Russian RBMK nuclear powerreactors has been the main content of internationalresearch programs.
The joint Swiss-Russian project "Pressure tube failureinvestigation" of a recent reactor accident is acontribution to this research field. The accident,involving a fue! channel pressure tube rupture due tocoolant flow reduction, took place at the third block ofthe RBMK-Leningrad Nuclear Power Plant (LNPP,situated near the Russian town of St.Petersburg) on24. March, 1992. The fuel channel broke close to thetop of the upper fuel element before the reactorscrammed.
Within the Swiss Department for Foreign Affairs(SDFA) Eastern European aid program, acollaboration was set up for a project between thedesigner of the RBMK-reactors, the MoscowResearch and Development institute of PowerEngineering (RDIPE), and the Paul Scherrer Instituteto
- intensify the damage analysis program of thisaccident with the complementary analytical equipmentavailable at the two hot laboratories of PSI andRDIPE,
- reach a thorough understanding of the damagesequence based on the experimental results and onthe understanding of the materials behaviour, as wellas on the engineering knowledge of both parties,
- provide to both institutes the possibility for a visitexchange to get to know their respective analyticalcapabilities and limits, which in the future could lead tofurther fruitful co-operation in emergency cases.
25
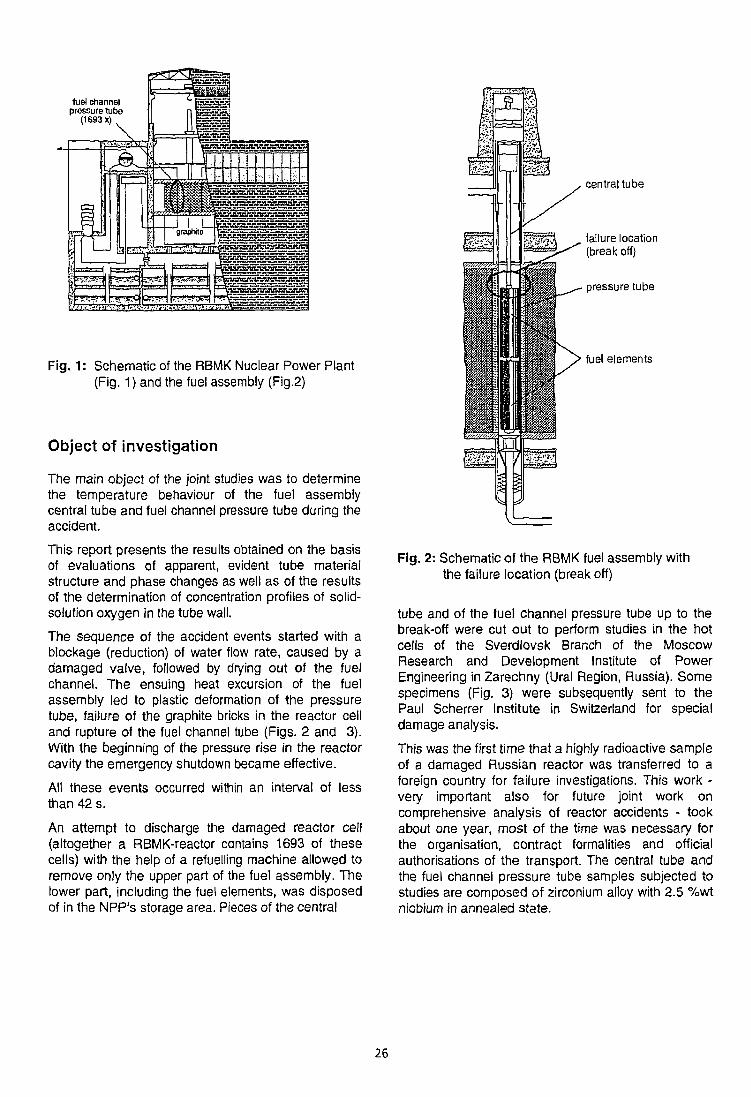
fuel channelpressure tube
(1S93X)
Fig. 1: Schematic of the RBMK Nuclear Power Plant(Fig. 1) and the fuel assembly (Fig.2)
Object of investigation
The main object of the joint studies was to determinethe temperature behaviour of the fuel assemblycentral tube and fuel channel pressure tube during theaccident.
This report presents the results obtained on the basisof evaluations of apparent, evident tube materialstructure and phase changes as well as of the resultsof the determination of concentration profiles of solid-solution oxygen in the tube wall.
The sequence of the accident events started with ablockage (reduction) of water flow rate, caused by adamaged valve, followed by drying out of the fuelchannel. The ensuing heat excursion of the fuelassembly led to plastic deformation of the pressuretube, failure of the graphite bricks in the reactor celland rupture of the fuel channel tube (Figs. 2 and 3).With the beginning of the pressure rise in the reactorcavity the emergency shutdown became effective.
All these events occurred within an interval of lessthan 42 s.
An attempt to discharge the damaged reactor cell(altogether a RBMK-reactor contains 1693 of thesecells) with the help of a refuelling machine allowed toremove only the upper part of the fuel assembly. Thelower part, including the fuel elements, was disposedof in the NPP's storage area. Pieces of the central
centrat tube
failure location(break off)
pressure tube
fuel elements
Fig. 2: Schematic of the RBMK fuel assembly withthe failure location (break off)
tube and of the fuel channel pressure tube up to thebreak-off were cut out to perform studies in the hotcells of the Sverdlovsk Branch of the MoscowResearch and Development Institute of PowerEngineering in Zarechny (Ural Region, Russia). Somespecimens (Fig. 3) were subsequently sent to thePaul Scherrer Institute in Switzerland for specialdamage analysis.
This was the first time that a highly radioactive sampleof a damaged Russian reactor was transferred to aforeign country for failure investigations. This work -very important also for future joint work oncomprehensive analysis of reactor accidents - tookabout one year, most of the time was necessary forthe organisation, contract formalities and officialauthorisations of the transport. The central tube andthe fuel channel pressure tube samples subjected tostudies are composed of zirconium alloy with 2.5 %wtniobium in annealed state.
26

B
Fig. 3: Schematic of the demaged fuel assembly(A: central tube; B: fuel channel pressure tube;1-6: locations of sampling for determination ofoxygen profiles in tube metal)
Standard failure post-irradiationexamination
Immediately after the accident, an extensive materialtesting programme, consisting of the standard tests offractography, metallographic investigations, electronmicroscopy, microradiographic y-spectrum analysisand X-ray diffraction analysis, was performed at theSverdlovsk branch of the RDIPE to study thecondition of the zirconium alloy tubes and fuelassemblies.At the end of this work it was possible to reconstructthe general evolution of the accident.
The results of these first investigations were publishedin the same year [1].
A general description of the failure was presented andthe evaluation of likely temperature distribution overcore height was given. Indeed, it was the principalobjective of the standard failure post-irradiationstudies to determine the pressure tube temperaturebehaviour during the accident.
The temperature history can be determined in severalways, but in all of them only indirectly.
The first, purely computational way, is to performnuclear-physical as well as thermo-physicalcalculations of the process, taking into account theactual complicated geometry, the convectionprocesses, the radiation heating and the exothermicreaction of tube material oxidation in high pressure
superheated steam. However, results of computationsat such a level of sophistication must be carefullyexamined with sound judgment because of theinsufficient knowledge of the parameters values andof the complicated interaction of the variousprocesses taking place.
The second way is a part of standard failure post-irradiation. It is an empirical structure and phaseanalysis, using the results of metallography, electronmicroscopy and X-ray phase analysis.
The experimental data of failure post-irradiationexamination at the Sverdlovsk Branch of the RDIPEallowed to find that a crystal structure characteristicfor fast cooling from the upper part of the ß-Zr-areathat corresponds to temperatures about 1000-1200°Cwas produced on the pressure tube material near thefracture location.
For more precise temperature determination bycomparing the accident failure material morphologyand structure with high temperature laboratory resultsthe currently available data basis is still too small.Such systematic laboratory experiments should leadto an atlas of zirconium alloy structures (or of othermaterial of interest) reached as a function of thermalcycling times and temperature gradients.
Such a data bank would be a useful tool for a first fastaccident evaluation and it should be an element of thetasks of a future co-operation.
Determination of oxygen distribution overthe central tube wall thickness.
In order to describe more precisely the materialbehaviour at the damage locations in the pressuretube, the post-accident material condition, theconcentration and distribution of oxygen as well as thetemperature reached during the progression of theaccident are of particular importance [2,3].
Oxygen diffusion concentration profiles through ZrO2
into the zirconium matrix were measured at PSI withinthe remainder of the broken fuel element central andpressure tube wall by electron probe microanalysis.
The Electron Probe MicroAnalysis (EPMA) is apowerful tool for studying diffusion effects, surfacecoatings, identifying segregation at grain boundaries,and analysing fine precipitates. It combines thetechniques of electron microscopy (recently also ofscanning electron microscopy) with X-rayspectroscopy, allowing one to perform highly localisedmeasurements of the chemical composition of aspecimen. Very small quantities of material aredetectable. Heavy metal shielding is used to protectthe operator from radiation exposure and to decreasethe intensity of radiation entering the spectrometers.
27

In order to respect the strong local safety regulationsconcerning the handling of radioactive materials andto keep a high level of operational flexibility, it was
decided to set up the microanalyser in a box as well.The hotcell line for electron probe microanalysis isshown in Fig. 4.
Fig. 4: Hotcell line for preparations and measurements of radioactive samples by EPMA
Analysis of oxygen, niobium and zirconiumdistribution was performed with the PSI - EPMA-system CAMECA CAMEBAX SX/R/5C. equippedwith a synthetic TAP/PC1 crystal, which allows todetermine the content of elements having atomicnumber greater than 3.
The sample volume, excited by electron beam,varied in the analysis within 0.5-2.0u.m3
Microsection specimens were cut out from the fuelchannel pressure tube and from the central tube atvarious distances from the break location and wereanalysed (Fig. 3). The prepared samples wereloaded into the specimen holder and coated with acarbon layer.
The scanned specimens from the pressure channelwere sampled from its inner surface, whereas thespecimens from the central tube were taken from theouter surface, i.e. from the coolant side. Thescanning pitch was 2-5u.m.
The concentrations of zirconium, niobium (Fig. 5)and oxygen (Fig. 6) in dependence of the distancefrom the metal/oxide interface show very clearly thestructure changes and the oxygen solid solutionpenetration in the metal (compare also Fig.7).
4.0
35
3.0
/ 2.5
- 2.0
1.0
* °S
95
" SO
85
80
- 75
" - „ 70
<
[ Niobium
" 1
Is! 11" 1
1 1 1 ( 1 1 1 ( 1 1 f 1 1 1 1 1 I t 1
if Zirconium
' «/
» f i 1 i 1 t 1 t ! i 1 t f r 1 | | 1
•
-
-
. -
) „ 20 40 60 80 100 120 140 160 180 200 .
Distance from metaVoxide interface, pm .. •
Fig. 5: Results of zirconium and niobium distributiondetermination by EPMA in the outer wall of thecentral tube
28

30
25
20
1
fiion\7t
5
v- V Oxygen
: \
0^' ' '—' ' ' n
0 30 60 90 12 15 18 21 240 270 300 330 360 390 420Distance from metal/oxide interface, jim
Fig. 6: Oxygen diffusion profile through fuel channelcentral tube wall close to the break position
Oxygen profiles were detected across the pressuretube and central guidance tube wall and the profilesshowed clearly1 a drop in oxygen concentration whenmoving away from the fracture position towards thecooler upper parts. Figure 6 shows as an examplethe oxygen profile in the rupture region.Owing to these results, the EPMA efforts wereintensified and the analysis at PSI was finalised witha flanking scanning electron microscope analysis ofthe fracture front.
Data analysis and diffusion coefficientscalculations
An analysis of data on oxygen diffusion in metal andformation of oxygen-solid solution was carried out onthe basis of knowledge acquired from amathematical model and allowed to get moreaccurate estimates of the "effective" accident metaltemperature. This "effective" temperature T dependson the "effective" oxygen diffusion time t during theaccident (Fig.7). The diffusion coefficients, andconsequently the derived T-values, were calculatedfor a conventional time t = 10 s [4]. The task tomathematically describe the diffusion process wasperformed at RDIPE Moscow. To this end, most ofthe reliable literature data relating to oxygen diffusionin alpha-zirconium for a wide range of temperatures400-1200°C was reviewed.
The model of the process of oxygen solutionformation and oxygen diffusion was relatively simplein principle, but in practice it still turned out to becomplex since three crystallographic phases had tobe distinguished (Fig.7).
"Effective" Temperature fordifferent "effective" lime
a t % Oxygen
19001700150013001100 900 20 40 60 80 100120 urnTemperature, °C Distance from oxyde-metal boundary
Fig. 7: Relation between the oxygen-zirconium phase diagram and the oxygen solid solution penetration [4].
The values of the oxygen diffusion coefficients for thedifferent phase regimes were taken from the literature;the resulting temperatures for a given profile werefound to be consistent. The oxygen diffusion processleading to the solid solution of oxygen in a-zirconium
was computationally modelled taking into account theeffect of the temperature dependence of the phasetransformation on the moving interface boundaries.Oxygen diffusion coefficients were calculated basedon the estimated dryout excursion times for both the
29

a- and p-phase regions of the diffusion profiles of allanalysed samples (Fig.7). For the whole temperaturerange, the nonlinear dependence of the diffusioncoefficient in a-zirconium on temperature wasobtained in the form of a sum of three exponentialterms.
Results of measurements and of computations aresummarised in fitere 8, which shows the maximumtemperature distribution in the central tube as afunction of the distance from the rupture location.
At PSI, however, the results of the electron probemicroanalysis of the pressure and central tube wereevaluated together and the oxygen profilesinterpreted. The outcome of this comprehensiveanalysis was that the profiles reveal higher upperaccident temperature limits than previously estimatedbased on meial'ographic analyses only. The"effective" temperature of the pressure tube wasestimated to lie in the range of 1300°C <T<1500°C byanalysing distributions of solid solution oxygen.
üo
£
1t.2
1400
1300
1200'
1100
-
- r
\
100 - 200 ' 300«> - Distance from Break-off,
'~400mm I
Fig. 8: Calculated maximum temperature distributionin fuel channel central tube by oxygendiffusion evaluation
The profiles reveal upper accident temperature limitshigher than those previously estimated from thestandard failure post-irradiation examination.
Maximum accident temperature
Considering thermomechanical, physical and chemicalaspects, the maximum temperature that might haveoccurred during fuel channel dryout had previouslybeen estimated to be less than 900°C.
It was assumed that the zirconium 2.5%Nb pressuretube would fail in the temperature range 800-850°C.Steam from the drum separator would then haveprevented a further increase in temperature.
The detailed post-irradiation examination at theSverdlovsk branch of the RDIPE, however, resulted inthe finding that the fuel channel central tube close tothe fracture had experienced a temperature in therange of 1000-1200°C before rupture and cooling; atemperature value below the lower limit could beexcluded.
Conclusions
The temperature which the central tube of the fuelassembly actually reached was thus much higher thanwas previously believed to be possible. The presentfinding is also at variance with the results of theprevious theoretical assessments based on the heatbalance, in which allowance was made for the heatrelease in fuel rods and for the convective andradiative heat transfer. This fact called into questionthe previous evaluation of the time and temperatureprior to the exothermic, high temperature zirconium-steam reaction. To assess the role of this reactionmechanism itself, more accurate experimental dataabout the reaction processes and the maximumtemperature values of the accident would be needed.
Consequently, the next stage of the co-operationbetween the PSI and RDIPE will be to evaluate inmore detail and with higher accurracy the effect of thetime-temperature profile on diffusion processes andon the condition of the material.
The results of the oxygen electron probemicroanalysis performed at the Hot Laboratory of PSImade it feasible to set up an improved model todescribe the damage sequence. Apart from thesimulation of this past accident, such a model, beingderived from extensive and detailed measurementsfrom a real NPP accident, provides grounds forconfidence in the application to detecting the onset ofa similar excursion. It would then be possible to takethe appropriate measures at a sufficiently early time toprevent, or at least to reduce, any damage.
The results obtained are of great importance in termsof revising the initial thermal conditions of the accidentprogression. They have served as a basis forassessing the efficiency of the RBMK safetyimprovement measures carried out in response to theaccident in question.
Acknowledgements
The authors are grateful to Messrs. R. Briitsch,H. Schweikert, P. Pörschke, and Mrs. I. Kusar for
30

performing SEM measurements, sample preparations,data evaluation and presentation.
References
[1] Nuclear Engineering International, v. 38, no. 457,pp 12-11 (1992)
[2] RDIPE Report No. 27.075 (1992); "Estimation ofthermic and deformation behaviour of fuel ofreduced throughput of cooling water
[3] SB RDIPE, RDIPE, LNPP Report No. F.03.876(1993); "Investigation of the fuel channel pressuretube of LNPP unit 3 from reactor cell 52-16"
[4] ADEN V.G. et al. RDIPE-PSl-Report (1996);"Studies on metal state in fuel channelcomponents and in central tube of processchannelfuel assembly at LNPP unit 3" in preparation
[5] BART G. et al„ Nuclear Europe Worldscan, 1-2,43(1996); "Leningrad RBMK: probing pressure tubefailure"
31

COMPARISON OF TWO CRACK GROWTH CRITERIA IN THE BRITTLE-TO-DUCTILETRANSITION ZONE
M. Niffenegger, S. Brosi, K. Reichlin, R. Rösel
Laboratory for Safety and Accident Research (LSU)
Abstract
With the finite element method we calculate the crackbehaviour in the Brittle-to-Ductile Transition (BDT) zoneof a thick-walled cylinder under internal pressure, ax-ial tension and thermal shock loading; the results arecompared with experimental findings. A local approachthat is usually valid only for brittle fracture turned outto perform better than the JR approach intended forductile fracture.
1 IntroductionThe safety margin against crack growth of present-dayreactor components is mainly guaranteed by the useof high toughness material. However, during an emer-gency cooling of a structurally flawed component thetemperature at the crack tip may fall below the high-toughness region, especially if the component has suf-fered neutron embrittlement.
At MPA Stuttgart this important safety issue wasinvestigated with large-scale experiments. In the testNKS-6 (Stumpfrock et al. 1993 [1]) a thick-walled cylin-der with a circumferential inner surface crack was sub-jected to internal pressure, axial tension and thermalshock loading. A low-toughness material with a BDTzone around an unusually high temperature was cho-sen in order to simulate end of life conditions. Thecrack length made a jump by cleavage followed by ar-rest and by a second, ductile extension.
We present the results of our analysis based on thefinite element calculation which we performed at PS I,within the OECD/CSNI project FALS1RE1. The crackgrowth is simulated with the node shift/release tech-nique based on two tentatively chosen crack growthcontrol criteria: first with the so called JR approach(see section 4) commonly used to investigate toughcrack growth, and secondly with a local approach suit-able for brittle fracture.
2 The NKS-6 experimentThe NKS-6 test specimen (Figure 1) is a 1.1 m longcylinder with outer diameter of 0.8 m and wall thicknesst = 0.2 m. It consists of three different parts, a pre-cracked ring of the low-toughness steel KS222 whichis embedded in a high-toughness ring3 shaped by weldbuild-up. The latter acts as an interface to the carrierpart material 20MnMoNi5 5. The initial depth a of thecircumferential surface crack at the inner cylinder wallwas 34 mm {a/t = 0.17). The entire configuration isaxisymmetric.
1 Fracture Analyses of Large-Scale International Reference Experiments2 17MoV84, Upper Shelf Energy = 30J, BDT zon« around 250°C3 S 3 N i M o l , USE = 220J, BDT zone around -30°C
20MnMoNi5 5
Fig. 1: NKS-6 test specimen.
Initial temperatures were 320°C/280°C at theouter/inner surface, initial pressure 13MPa; in additionthe constant tension Fa = 25 MN was applied. The totalinitial loading was just below the crack growth initiationload.
The thermal shock was generated by squirting30 °C cold water from an axial tube with perforatedwalls onto the inner surface of the test cylinder, therebyachieving a temperature distribution constant in the ax-ial direction, but varying in time. The temporal variationof the wall temperature follows the local water tem-perature shown in Figure 2a. The outer temperatureTo remained about constant. The pressure was main-tained by a remote pump; Figure 3 shows the pressuremeasured near the wall.
300
O200\ -
-
50 100 150 200Time / s
Fig. 2: Water temperature Tw
33

30'
S 1 O -CL
-
-
-
A
/
1
-
-
50 100Time / s
150 200
Fig. 3: Conditions of pressurized cooling water.
The mechanically and thermally induced stressescaused the intended crack growth, which was moni-tored by acoustic emission. After the experiment, twocrack growth phases were observed by fractography.First there was a crack jump of 20 mm which occurredat 35 s. Then, after a standstill of 17 s, the crack modechanged from cleavage fracture into a completely duc-tile fracture mode and the crack grew continuously fur-ther 41 mm to its final length of 95 mm, where it wasstopped by the tough welded material at time 76 s.
3 Computational model and global speci-men behaviourWe analyse the experiment with the finite element pro-gram ADINA. The axisymmetric model consists of 6218-node isoparametric elements with square elements(side length = 2.2 mm) in the ligament. The calculationis performed in two steps:
First we calculate the transient temperature field inthe cylinder wall (Figure 4) with temperature-dependentheat conduction and heat capacity. It shows the typicalthermal shock behaviour with high temperature gradi-ents near the cooled surface. The calculated temper-atures are in an excellent agreement with the experi-mental values.
350-
300-
ü
time/s
Calculationo Experiment
.20(inner)
.25 .30Radius / m
.35 .40(outer)
Fig. 4: Temperature distribution.
In the second step, we determine the mechanical re-sponse of the cylinder under the combined load of cal-
culated temperatures, applied static axial tension andmeasured transient pressure. The plastic material be-haviour is taken into account by a multilinear stress-strain curve. All material properties are temperaturedependent.
At every time step of the transient event, the cracklength in the finite element mesh has to be increasedby the increment obtained from the crack growth con-trol criterion used which is described in detail below.
The crack tip (which is always at an element cor-ner node) is shifted into the ligament; the elementsare deformed accordingly (Figure 5). If the given crackgrowth increment is larger than the element edge, boththe old crack tip node and the element midside nodeare released in crack opening direction and the crackgrowth modelling is continued by shifting the next ele-ment corner node which now represents the crack tip.
crack plane
o initial crack tip node locationA shifted and released nodeso this node not shifted, because
the crack grew past it in onetime increment
ligament
current crack tipunreleased nodes
Fig. 5: Node shift/release technique.
Figure 6 compares the measured and calculatedmechanical transient part of the strains at point D3,located 184 mm from the crack plane (Figure 1).
100 150 200
Time / s
Fig. 6: Strains at point D3.
The difference between calculated and measuredstrains in the most interesting time interval (until 100 s)
34
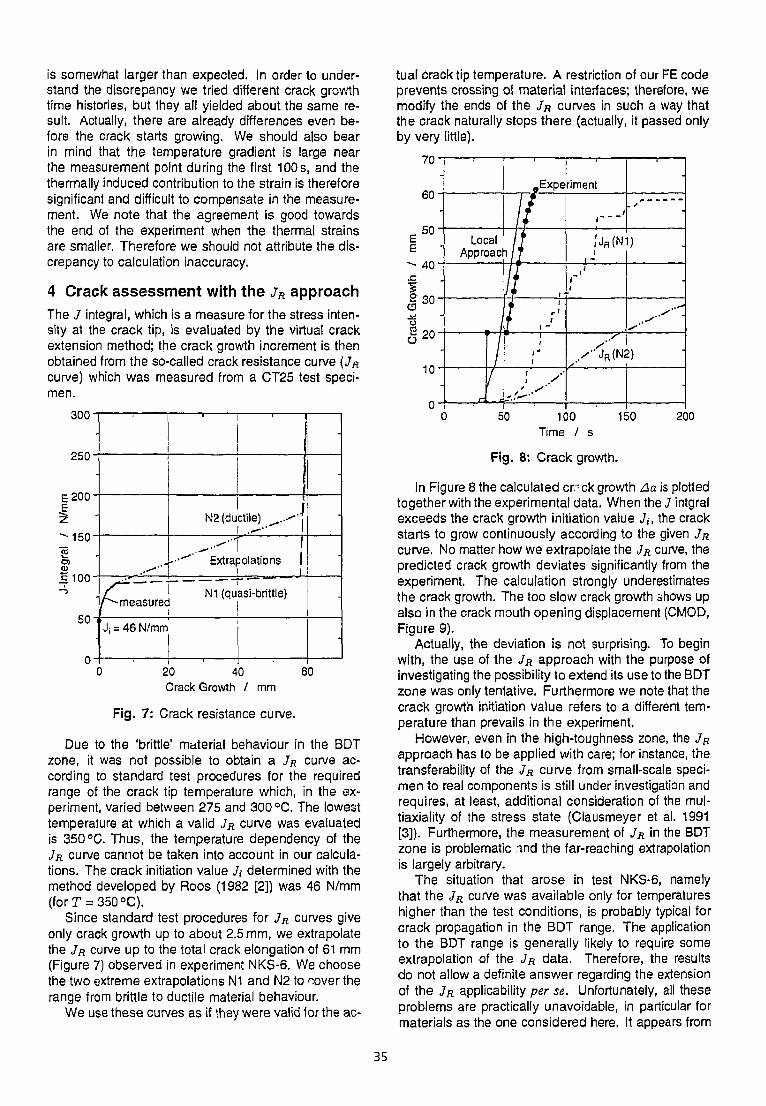
is somewhat larger than expected. In order to under-stand the discrepancy we tried different crack growthtime histories, but they all yielded about the same re-sult. Actually, there are already differences even be-fore the crack starts growing. We should also bearin mind that the temperature gradient is large nearthe measurement point during the first 100s, and thethermally induced contribution to the strain is thereforesignificant and difficult to compensate in the measure-ment. We note that the agreement is good towardsthe end of the experiment when the thermal strainsare smaller. Therefore we should not attribute the dis-crepancy to calculation inaccuracy.
4 Crack assessment with the JR approachThe J integral, which is a measure for the stress inten-sity at the crack tip, is evaluated by the virtual crackextension method; the crack growth increment is thenobtained from the so-called crack resistance curve (JRcurve) which was measured from a CT25 test speci-men.
250-
E200-E2
m
c100-
50 T
o -c
r^measurec
J, = 46 N/mm
N2(du
-•••*" Extra|
ictile) ^..<""
1Dolations 1
N1 (quasi-brittle)
-
-
•
-
•
) 20 40 60
Crack Growth / mm
Fig. 7: Crack resistance curve.
Due to the 'brittle' material behaviour in the BDTzone, it was not possible to obtain a JR curve ac-cording to standard test procedures for the requiredrange of the crack tip temperature which, in the ex-periment, varied between 275 and 300 °C. The lowesttemperature at which a valid JR curve was evaluatedis 350 °C. Thus, the temperature dependency of theJR curve cannot be taken into account in our calcula-tions. The crack initiation value J,- determined with themethod developed by Roos (1982 [2]) was 46 N/mm(forT = 350°C).
Since standard test procedures for JR curves giveonly crack growth up to about 2.5 mm, we extrapolatethe JR curve up to the total crack elongation of 61 mm(Figure 7) observed in experiment NKS-6. We choosethe two extreme extrapolations N1 and N2 to oovertherange from brittle to ductile material behaviour.
We use these curves as if they were valid for the ac-
tual crack tip temperature. A restriction of our FE codeprevents crossing of material interfaces; therefore, wemodify the ends of the JR curves in such a way thatthe crack naturally stops there (actually, it passed onlyby very little).
70
60 '
I5 0 '~- 40 'JC
2 30
I 20
10
-
-
LocalApproacl
-
•
- I
.Expe
/ /
i If
I?1 1
r '» 1
1 -
I
;' y
riment
i '
I 'JR(N'I
i -
i™i
•
)
•
s-' 1,/-JR(N2)
y
•
50 100Time / s
150 200
Fig. 8: Crack growth.
In Figure 8 the calculated cr.= ck growth Aa is plottedtogether with the experimental data. When the J intgralexceeds the crack growth initiation value J,-, the crackstarts to grow continuously according to the given JRcurve. No matter how we extrapolate the JR curve, thepredicted crack growth deviates significantly from theexperiment. The calculation strongly underestimatesthe crack growth. The too slow crack growth shows upalso in the crack mouth opening displacement (CMOD,Figure 9).
Actually, the deviation is not surprising. To beginwith, the use of the JR approach with the purpose ofinvestigating the possibility to extend its use to the BDTzone was only tentative. Furthermore we note that thecrack growth initiation value refers to a different tem-perature than prevails in the experiment.
However, even in the high-toughness zone, the JRapproach has to be applied with care; for instance, thetransferability of the JR curve from small-scale speci-men to real components is still under investigation andrequires, at least, additional consideration of the mul-tiaxiality of the stress state (Clausmeyer et al. 1991[3]). Furthermore, the measurement of JR in the BDTzone is problematic ind the far-reaching extrapolationis largely arbitrary.
The situation that arose in test NKS-6, namelythat the JR curve was available only for temperatureshigher than the test conditions, is probably typical forcrack propagation in the BDT range. The applicationto the BDT range is generally likely to require someextrapolation of the JR data. Therefore, the resultsdo not allow a definite answer regarding the extensionof the JR applicability per se. Unfortunately, all theseproblems are practically unavoidable, in particular formaterials as the one considered here. It appears from
35

the present results that the JH approach is unreliablein the BDT zone.
5 Local approachWe concluded that the (global) Jn approach which de-scribes tough crack behaviour is inadequate to predictthe unstable crack growth in the BDT zone. Therefore,in a subroutine to our FE program we implemented alocal approach in which the crack growth is controlledby the stress state at the crack tip. We chose a sim-ple failure criterion based only on the stress a- normalto the crack plane. As soon as <r at the evaluation pointin the ligament nearest to the crack tip is higher thana critical value ae, the crack starts to grow. The cracktip node is released without a foregoing shift, and thenext node on the ligament becomes the n3W crack tipnode.
Once the crack has started to grow it runs until <xfalls below an arrest value aa (< <TC ). Then the FEcalculation is continued for the next time step, the stiff-ness matrix is computed anew and the stresses arecalculated with the new load array. The limiting valuesac and ffa are directly set to be the stresses acting inthe experiment at the first crack growth initiation andarrest. This avoids scaling problems that would arise ifdata obtained from small scale specimens were trans-ferred to the present situation.
Figures 8 and 9 show that both the calculated crackgrowth and the CMOD are much closer to the exper-iment than they were with the JR approach over thewhole range of the crack extension. This was not ex-pected, since our local approach was originally thoughtto be valid only in the brittle range. The material ap-pears to exhibit both tough and brittle characteristics;in respect of crack behaviour the latter dominates.
1.4
1.2
1.0
1.8
I-6Ü
.4
.2
.0
-
-
-
-
•J
s
/
-•-*- ExperimeLocal ApJR(N1)
•
-
proach
— - JR(N2)
• •
6 ConclusionsWe calculated the crack growth - as previously mea-sured in a large-scale experiment - in a thick-walledcylinder under pressurized thermal shock and axial ten-sion in the Brittle-to-Ductile Transition (BDT) zone. Wecompared results obtained using two different crackgrowth criteria, the JR approach and a local stress cri-terion, suitable for tough and brittle crack growth be-haviour respectively,
• Calculated and measured temperatures are al-most identical; thus the input for the stress cal-culation is correct.
• The calculated strain field appears to be in rea-sonably good agreement with the experiment;however, results could be compared at one pointonly.
• The prediction using the JR approach failed alto-gether. In hindsight we can say that our attemptat far-flung extrapolation of a JR curve, valid ata temperature about 70 °C higher than the actualcrack tip temperature, was overly optimistic.
• The simple local approach, which considers thenormal stress to be responsible for crack exten-sion, performed much better.
• As regards the material in the BDT zone, it ap-pears to be rather brittle. This would be in linewith the success of the local approach.
AcknowledgementsWe wish to express our gratitude to our colleagues Dr.J. Birchley and A. Duijvestijn for their valuable collab-oration in this project.
References[1] STUMPFBOCK L, ROOS E., HUBER H. & WEBER U.:
"Fracture mechanics investigations on cylindri-cal large-scale specimens under thermal shockloading"; Nuclear Engineering and Design 144:31-44 (1993).
[2] Roos E.: "Erweiterte experimentelle und the-oretische Untersuchungen zur Quantifizierungdes Zähbruchverhaltens am Beispiel desWerkstoffs 20 MnMoNi 5 5"; Technisch-wissenschaftlicher Bericht, Staatliche Material-prüfungsanstalt Universität Stuttgart, Heft 82-01 (1982).
[3] CLAUSMEYER H., KUSSMAUL K., & Roos E.: "In-fluence of stress state on the failure behaviorof cracked components made of steel"; ApplMech Rev 44/2: 77-92 (1991).
50 100Time / s
150 200
Fig. 9: Crack mouth opening.
36

EXPERIMENTS WITH COUETTE AUTOCLAVES FOR THE INVESTIGATIONOF ACTIVITY UPTAKE IN THE OXIDE LAYER OF STAINLESS STEEL UNDER BOILINGWATER REACTOR CONDITIONS
A. Hiltpold
Laboratory of Materials and Nuclear Processes (LWR)
Abstract
The purpose of this work is to determine, quantify andvalidate experimentally the principal parameters of theactivity uptake by stainless steel samples underBoiling Water Reactor conditions. The final goal of thisinvestigation is a set of procedures to minimise theactivity uptake by means of a special water-management and/or a pre-treatment of the stainlesssteel surface. In experiments with Couette autoclavesthe activity uptake on stainless steel samples wasmeasured, the assumed influence of different flowregimes tested, the interaction of corrosion andactivity uptake investigated and the dependence ofthe activity uptake Wider different water chemistrieswas established.
1 Introduction
The deposition of activated corrosion products in therecirculation system of a Boiling Water Reactorproduces increased radiation levels that lead to acorresponding increase in personnel radiation doseduring shut down and maintenance. The major part ofthis dose is -due to Co-60. In the past 25 years theradiation field of nuclear power plant loops outside thecore zone has been the object of investigations inmany countries. At PSI the facilities of a Light WaterReactor contamination loop and several autoclaveshave been used to investigate the complexphenomena of activity deposition from the primarywater. From the literature [1] empirical data isavailable, but the understanding of the physical andchemical processes and of the important parameterswhich control the activity build-up is deficient. Weperformed experiments which enabled the detectionand quantification of parameters determining theactivity build-up, and finally modelled theseprocesses on a semi-empirical scale [2], The principalinterest is to examine the influence of the flow regimeon the activity build-up. For this purpose Couetteautoclaves were designed which allow flow controlover a wide range of Reynolds numbers. In ourinvestigation we have two processes: corrosion of thestainless steel and the activity uptake due to thepresence of activated nuclides in the water. Inpractice both these phenomena occur simultaneouslyand operate to a certain degree in mutual interaction.However, as will be shown, the corrosion rate and theactivity uptake are not strictly correlated.
2 Flow regime in a Couette autoclave
2.1 Couette flow
Couette flow occurs in a fluid between two concentriccylinders if one or both rotate. In the Couetteautoclave at PSI only the inner cylinder is rotated andthe outer cylindrical boundary comprises of threeringlike samples of stainless steel (Fig. 2). TheReynolds number of the flow depends among otherthings on the angular velocity of the rotating cylinder.The incompressible flow is described analytically bythe continuity and Navier-Stokes equations:
V-«=0
pj ~f-
p: density [kg/m3], u: dynamic viscosity [Pa-s],IT. velocity-vector [m/s], p. pressure [N/ms],/: time [s], F: Forces per volume [N/m3].
We seek solutions expressed in terms of cylindricalco-ordinates (r,O,z). The following conditions forCouette flow need to be fulfilled:
1. Steady state flow;2. The axial and radial flow velocities are zero:
u2=u=0;3. The viscosity is constant;4. Bulk forces F are negligible;5. The no-slip assumption is valid. This
boundary condition on the inner and outercylinder implies:
fl,: inner radius [m]; Ro: outer radius [m];
Q: angular velocity [rad/s].
We seek a solution of the formu = {ur,M«,MZ} = {0,»4,0}, where u~u<t>= u(r) is
independent of <&, z.
The solution for the velocity is:
37

The angular velocity of the rotating cylinder is aconvenient parameter for experimental determinationof the Reynolds number in the autoclave. Detailsconcerning Couette flow can be found in [3], [4]. ForCouette flow the Reynolds number is defined as:
R ^ R.,(R0 -
2.2 Eddies and instabilities
The simple Couette flow (A) is only stable if the Re <200. With increasing Reynolds number the flowbecomes by stages less symmetric and more chaoticas Fig. 1 shows. The Taylor flow pattern (B) arises ifRe < 500, the wavy flow (C) if Re < 2000 and forhigher Reynolds numbers we observe even chaoticflow behaviour (D).
The experimental set-up of a Couette apparatus hassome influence on the flow regimes and their range ofReynolds numbers. Especially the surface roughnessand geometrical unsymmetries at the bottom and topof the autoclave may have some effect on thedifferent flow regimes, therefore the Reynoldsnumbers mentioned above have to be understoodmore as estimates.
—)-
—h-
~ ^
- > - Q! ioO] jOö Öo o SI
O\ jO
21* l ;%
(A) (B) (C) (D)
Fig. 1: Different flow patterns and eddies in aCouette autoclave as a function of theReynolds number [12].
A Couette apparatus with both cylinders rotatingadditionally provides a daunting number of flowregimes [3], [6]. For our purpose, the regimes up tothe wavy flow are appropriate because the dominantrole of the circular velocity is preserved and additionalmixing in the fluid along the z-axis helps to stabilisethe homogeneity of the fluid. To provide concretedata, experimental tests with injected ink in the waterflow in a transparent model of the Couette autoclavewere performed [7].
3 Experimental set-upA rotating cylinder in the middle of the autoclaverepresents the inner boundary and opposite threesamples fixed in a sample holder provide the outer
boundary of the flow. The experiments are performedunder BWR conditions (290°C, 90 bar, 400 ppboxygen, and conductivity of the water: 0.1-0.5|iS/cm).The autoclave works as a plug-through reactor and tothe pure water flow of 1 l/h small amounts of Co-58and/or Zn-65 as radioactive tracers are injected, aswill eventually other chemical species. Theinstrumentation of the experiments measures in-line:temperature and pressure, at-line: pH, conductivityand the concentrations of oxygen and hydrogen at theinlet and outlet of the autoclave.
The experimental Couette autoclave is shown inFig. 2.
ink* outlet
toftonuol
autoclavesample
sompMicfcm
Fig. 2: Sectional drawing of the Couette autoclavewith a gap of 2 mm for the flow medium bet-ween samples and rotating cylinder.
4 Results4.1 Activity build-up on stainless steel samples
In long term experiments the activity uptake of theoxide layer of originally electropolished samples wasinvestigated. The mechanism of corrosion underBWR-conditions is only partly understood [8] and theformation of spinels at the sites where activated ionsare incorporated within the oxide is also a field ofactive research [9]. The concentration of all tracerslies in the range from 1500 up to 1700 Bq/I. In Fig. 3(lower) the active Co-58 uptake in untreated reactorwater over a period of more than 4000 hours ispresented. This time period is necessary to see thecharacteristic of the time dependence. The level ofinactive cobalt in this water is lower than the detectionlimit with atomic absorption spectroscopy (<1 ppb)
38

and we assume a concentration level of a few ppt.The important hypothesis concerning the saturationlevel for cobalt in the spinel phase in the oxide layeras postulated in [1] and [2] can not be properlyverified with this level of inactive cobalt concentration.In the upper part of Fig. 3 the activity build-up underthe same conditions but with addition of inactivecobalt with concentrations from 10 up to 200 ppb isdisplayed.
60k
160k
UOk
80k
40k
0
—O— ppb20O; —O— ppb100—X—ppb4S; — T-ppb iO••• model function
300 600 900 1200 1500
Co-59 concentration ""—•— ^ O ppb Co-59 ...- - - model function
0 1000 2000 3000 4000
time (hours)
Fig. 3: lower: Activity uptake under unmodified BWR-conditions and Co-58 Tracer (1600 Bq/I)upper: Activity uptake with addition of inactivecobalt
It is evident that different saturation levels are reacheddepending on the inactive cobalt addition. Theincreasing concentration of inactive ions shortens thetime of the activity uptake significantly and the totalactivity uptake decreases likewise. The modelfunction is the solution of an inhomogeneous, linearordinary differential equation of first order as proposedin [2]
A: activity uptake[cps/cm2], Plnd0I: parameters.
This delivers a good approximation for the data asshown in Fig.3. Up to now the set of parameters P, isnot completely determined, but it comprises of theconcentrations of cations in the reactor water, theaverage flow velocity of the fluid and some bulkproperties of the samples. For the time being theexpressions IIP, in the model function play the role offit parameters. The results in Fig. 3 demonstrate thatby appropriate water chemistry management theactivity uptake in the oxide can be lowered. Thereplacement of inactive cobalt by suitable other ionslike zinc will be investigated in the next series ofexperiments.
4.2 Influence of the flow regime and corrosion
From the literature on corrosion [10], [11] it is evidentthat the corrosion rate is correlated with the flowregime. Higher flow velocity means higher corrosionrate. In the model approach [2] a dependence of the
activity uptake with the flow velocity has beenpostulated. Against this frequently adoptedassumption, that the flow velocity shows a clear effecton the activity uptake, our data measured by y-spectrometry exhibit a clear independence of theactivity uptake of the stainless steel samples for flowregimes with Reynolds number from 100 to 21000,see Fig. 4 .
ina.
0)
2c
Sk-
4k
3k
2k- V[m/s]; Re[-]- H - 0.01; 100-Q-0 .24 ; 2000- A - 1.2; 10000- ^ - 2 . 4 ; 21000
100 200 300
time (hours)
400 500
Fig. 4: The influence of the fluid velocity on theactivity uptake is not significant.
Fig. 5 shows for the first cycle of operation (120hours) the oxygen concentration at the in- and outletof the Couette autoclave and the temperature inside.From this and other data we can calculate a timerange of 150 up to 300 hours of significant butdecreasing corrosion rate of the stainless steelsamples. After this, time the corrosion rate ispractically negligible but the activity uptake still goeson as presented in Fig. 3 (lower). The time to reachthe saturation level for the activity in the oxide layer isone to two orders of magnitude greater than the build-up of the primary corrosion layer.
600
_ 500-no-&• 400Heo
ffl 300
§ 200-
8100-
oxygen inputoxygen output
300
250 5 "oa>
200 5
2150 a.
CD
100 ""
50
20 40 60 80
time [hours]
100 120
Fig. 5: Measurement of the oxygen concentration inthe inlet and outlet of the Couette autoclave.The difference between input and outputconcentration representsthe consumption ofoxygen due to the corrosion of stainless steelsamples.
39
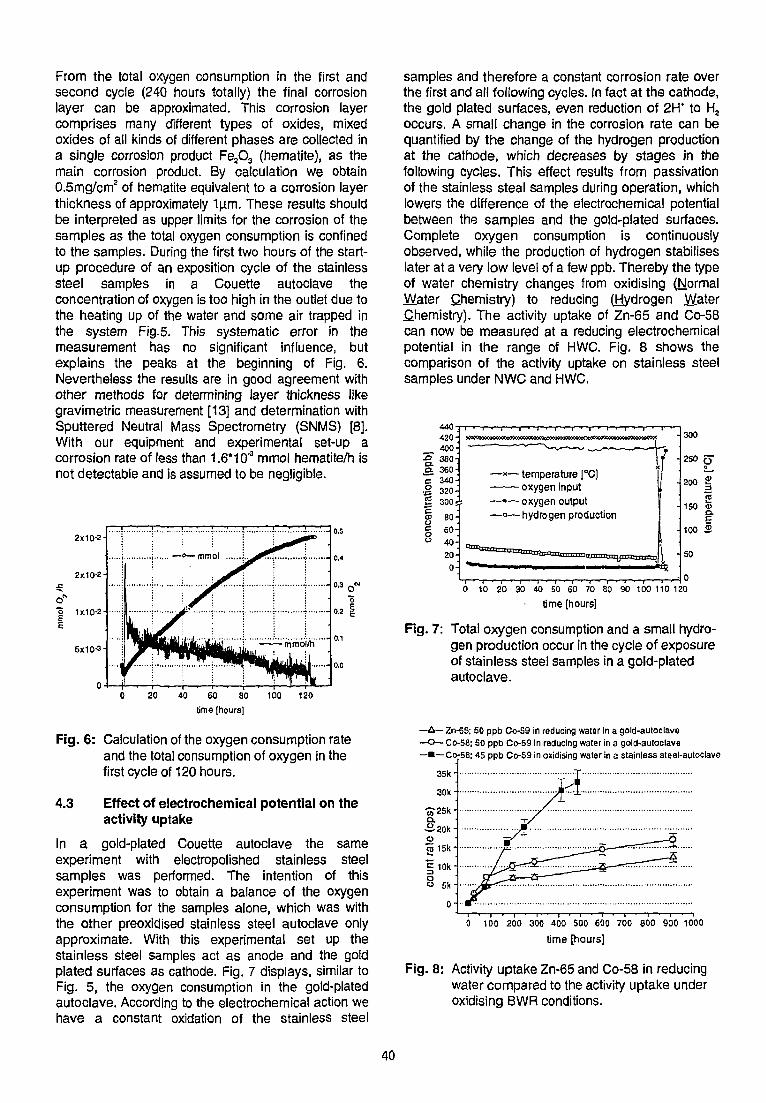
From the total oxygen consumption in the first andsecond cycle (240 hours totally) the final corrosionlayer can be approximated. This corrosion layercomprises many different types of oxides, mixedoxides of all kinds of different phases are collected ina single corrosion product Fe2O3 (hematite), as themain corrosion product. By calculation we obtainO.Smg/cm2 of hematite equivalent to a corrosion layerthickness of approximately 1u.m. These results shouldbe interpreted as upper limits for the corrosion of thesamples as the total oxygen consumption is confinedto the samples. During the first two hours of the start-up procedure of an exposition cycle of the stainlesssteel samples in a Couette autoclave theconcentration of oxygen is too high in the outlet due tothe heating up of the water and some air trapped inthe system Fig.5. This systematic error in themeasurement has no significant influence, butexplains the peaks at the beginning of Fig. 6.Nevertheless the results are in good agreement withother methods for determining layer thickness likegravimetric measurement [13] and determination withSputtered Neutral Mass Spectrometry (SNMS) [8].With our equipment and experimental set-up acorrosion rate of less than 1.6'tO"3 mmol hematite/h isnot detectable and is assumed to be negligible.
2x10⁻²
2x10⁻²
1x10⁻²
5x10⁻³
:..nyk£r !
o— mmol .. .
s /h
- 0.4
0,0
0 20 40 60 80 100 120
time [hours]
Fig. 6: Calculation of the oxygen consumption rateand the total consumption of oxygen in thefirst cycle of 120 hours.
4.3 Effect of electrochemical potential on theactivity uptake
In a gold-plated Couette autoclave the sameexperiment with electropolished stainless steelsamples was performed. The intention of thisexperiment was to obtain a balance of the oxygenconsumption for the samples alone, which was withthe other preoxidised stainless steel autoclave onlyapproximate. With this experimental set up thestainless steel samples act as anode and the goldplated surfaces as cathode. Fig. 7 displays, similar toFig. 5, the oxygen consumption in the gold-platedautoclave. According to the electrochemical action wehave a constant oxidation of the stainless steel
samples and therefore a constant corrosion rate overthe first and all following cycles. In fact at the cathode,the gold plated surfaces, even reduction of 2H* to Ha
occurs. A small change in the corrosion rate can bequantified by the change of the hydrogen productionat the cathode, which decreases by stages in thefollowing cycles. This effect results from passivationof the stainless steal samples during operation, whichlowers the difference of the electrochemical potentialbetween the samples and the gold-plated surfaces.Complete oxygen consumption is continuouslyobserved, while the production of hydrogen stabiliseslater at a very low level of a few ppb. Thereby the typeof water chemistry changes from oxidising (NtormalWater Chemistry) to reducing (Hydrogen WaterChemistry). The activity uptake of Zn-65 and Co-58can now be measured at a reducing electrochemicalpotential in the range of HWC. Fig. 8 shows thecomparison of the activity uptake on stainless steelsamples under NWC and HWC.
440420
„ 400•O 380a 360C 340•§. 3202 300E 80
—x— temperature [CC]
oxygen input
—•—oxygen output
— ° — hydrogen production
300
250 Q*
O
200 2
2150 <u
a.
100 2
50
0 10 20 30 40 50 60 70 80 90 100 110 120
time [hours]
Fig. 7: Total oxygen consumption and a small hydro-gen production occur in the cycle of exposureof stainless steel samples in a gold-platedautoclave.
—A—Zn-65; 50 ppb Co-59 in reducing water in a gold-autoclave—O— Co-58; SO ppb Co-59 in reducing water in a gold-autoclave—•— Co-58; 45 ppb Co-59 in oxidising water in a stainless steel-autoclave
35k-
30k-
320k-
2 15k-
1 10k-o" 5k-
o -
0 100 200 300 400 500 600 700 800 900 1000
time [hours]
Fig. 8: Activity uptake Zn-65 and Co-58 in reducingwater compared to the activity uptake underoxidising BWR conditions.
40

The results can be summarised in the following way:
1. The activity uptake in the oxide layer is significantlyreduced under hydrogen water chemistry (HWC)and therefore the electrochemical potential is animportant parameter for modelling the activitybuild-up.
2. The corrosion rate is definitely not correlated withthe activity uptake. A constant corrosion rate doesnot imply a constant activity uptake.
3. The Zn-65 and Co-58 activity build-up happenproportionally to each other.
4. Finally, the model function for the activity uptakeunder BWR-conditions seems to fit also forreducing water chemistry with the restriction thatthe final saturation level of activity build-up islower.
5 ConclusionsCouette autoclaves are a powerful tool to investigateactivity uptake under different flow regimes, withdifferent water chemistries and varying flow rates. Upto now the following results have been obtained:
• For a constant activity in the input water theactivity uptake by electropolished stainless steelsamples reaches a saturation level.
• The activity saturation level and the time to attain itdepend on the water chemistry and can beapproximated by a simple exponential function. Byan appropriate water management the uptake ofactivity can be reduced.
• Local changes in the electrochemical potential as ithappens in practice effect the activity build-up. Theactivity uptake in the oxide layer is reduced if thepotential changes from oxidising to reducing. Theelectrochemical potential is an importantparameter for a model approximating the activityuptake on stainless steel under reactor conditions.
• The finish and the pre-treatments, mostlypassivation procedures, of the surfaces of thestainless steel samples is of utmost importance,but needs further investigation for quantification.
• Contrary to the commonly proposed assumptionthat the flow regime (Reynolds number) whichinfluences corrosion processes, and thereforeimplicitly the activity uptake, we havedemonstrated that the activity uptake in therelevant range of Reynolds numbers, 100 up to21000, is not significantly changed. In a firstapproximation the corrosion process is notcorrelated with the activity uptake of the stainlesssteel samples.
6 AcknowledgementFinancial and technical support by the Swiss FederalNuclear Safety Inspectorate (HSK) is gratefullyacknowledged.
7 References
[I] GRAUER R. "Zum Aktivitätsaufbau an denUmwälzschieiren von Siedewasserreaktoren",EIR-Bericht Nr. 613, (1987), Paul ScherrerInstitut
[2] COVELU B., ALDER HP. "Zum Aktivitätsaufbau anden Umwälzschleifen von BWR: Grundlagen zurModellierung der Transport- und Ablagerungs-vorgänge", PSI-Bericht No. 2, (1988), PaulScherrer Institut
[3] TRITTON DJ . "Physical fluid dynamics", VanNostrand Reinhold, (1988)
[4] SCHADE H., KUNZE E. "Strömungslehre", (1989),Walter de Gruyter
[5] TAYLOR G.I. "Stability of viscous liquid containedbetween two rotating cylinders", Phil. Trans.,A223, pp. 289-343 (1923)
[6] CHOSSAT P., IOOSS G. "The Couette-Taylor-Problem", Springer Applied Math. Sciences Vol.102,(1994)
[7] HILTPOLD A. "Theoretischer Teil: DieCouetteströmung und zwei Modelle zumStofftransport . in der. GrenzphaseMetalloberfläche/Wasser unter LWR-Bedingungen", TM-43-95-08, (1995), PaulScherrer Institut
[8] BUCKLEY D. "Surface Analysis of 316T1 SteelExposed to Simulated BWR Conditions ", TM-43-93-16, (1994), Paul Scherrer Institut
[9] ROBERTSON J. "The mechanism of hightemperature aqueous corrosion of steel",Corrosion Science, (1989), Vol. 29, No. 11/12,pp. 1275-1291
[10] EVANS U.R. "Einführung in die Korrosion derMetalle", Verlag Chemie GmbH., D-Weinheim/Bergstrasse, (1965)
[II] KAESCHE H. "Die Korrosion der Metalle", SpringerVerlag, 2. Auflage, (1979)
[12] GUSTAFSON K.E. "Partial Differential Equationsand Hubert Space methods", John Wiley & Sons,2nd Edition (1987)
[13] HILTPOLD A. "Möglichkeiten und Grenzen dergravimetrischen Bestimmung von Oxidschichtenauf austenitischen Werkproben aus Couette-Autoklaven Versuchen ", TM-43-94-13, (1994),Paul Scherrer Institut
41

42

COMPUTATION OF FLOWS IN EXPERIMENTAL SIMULATIONS OFREACTOR CORE MELTING.
G. Duijvestijn, K. Reichlin, R. Rösel
Laboratory for Safety and Accident Research (LSU)
Abstract
We describe a numerical computation, based on thefinite element method, of an experiment simulating aparticular failure of a Reactor Pressure Vessel, a coremelt accident in which the vessel melts. We investigatethis melt-through as it occurs in a steel crucible. Wefound that a crucial parameter in the definition of thefailure sequence is the build-up of heat-driven flows. Tocharacterize the expected natural convection flow pat-terns, a number of additional, small-scale experimentswere performed. We present results from calculationson both these sets of experiments and compare themwith the presently available measurements.
1 IntroductionIn the CORVIS project, the Laboratory for Safety andAccident Research (LSU) at the Paul Scherrer Insti-tute investigates the failure of a nuclear Reactor Pres-sure Vessel (RPV) when, following a severe accidentcaused, for example, by a loss of coolant, the core ismolten to a multi-component fluid fcorium"). CORVISincludes both a series of experiments [1], in which thebottom plate of a crucible carrying penetrations as intypical nuclear power plants in Switzerland is attackedby a thermite melt, and the development of a com-putational model [2] in order to numerically simulatethe failure process. The computational model must besufficiently trustworthy that it can reliably be used topredict the failure process under high pressure, whichcannot be verified experimentally.
In the first phase of the experimental programme wefound that the heat-driven flows within the melt canplay a decisive role in the failure process. These flowsinfluence the behaviour of the RPV so strongly that wefound it necessary to investigate them in detail. At theKernforschungszentrum Karlsruhe (KfK) a number ofsmall-scale experiments with water as fluid [3,4] wereperformed to investigate the natural convection in arectangular vessel, but with a geometry otherwise sim-ilar to the one of the CORVIS tests.
In this paper we present the finite element compu-tations relating to the heat-driven flows and to the in-herent thermal problem. FE techniques have not beenapplied in thermal hydraulics for as long a time as insolid mechanics; in flow problems, usually Finite Vol-ume or Finite Difference techniques were used.
In section 1 we present the calculations on the sim-plified natural convection problem and compare themwith KfK's experimental results. In sections 2 and 3we show the calculations of the transient flow with hightemperature gradients of the meit, as it occurs in the
CORVIS experimental crucible. In section 2, there isno additional heating, which is introduced in section 3.
The advance of the temperature front is described,and a method to simulate the arrest of the flow due tosolidification is presented. Measurements in CORVISwere of course very difficult; as many comparisons aspossible with the computations were made, the onesrelevant to the problem treated here are shown.
2 Water natural convection experiments2.1 Description of the experiments
At KfK, a rectangular tank (Fig. 1) was chosen insteadof the cylindrical geometry in CORVIS, because this fa-cilitated the measurements [4]. The experiments were
ISOLATION (STYRODUR)
PLEXIGLAS
WATER ISOLATION(TEFLON)
! HEATER PLATE| (COPPER)
TANK
CROSS SECTION A-A
Fig. 1; KfK natural convection tests.
performed with water at room temperature. A detaileddescription of the experimental setup is in [3]. The sidewalls and the fluid top surface were thermally insulated.A submerged copper plate was used as heater. Testswere run with different heating power, here only thosewith 400 W input are presented. Also the height h ofthe heater plate above the bottom of the tank was var-ied, but here only the results for h=90mm are shown.At the beginning, the whole system is at 17°C, andthe water is at rest. At time t=Os the heater is turnedon until the end of the test at t=5400 s. The purpose
43
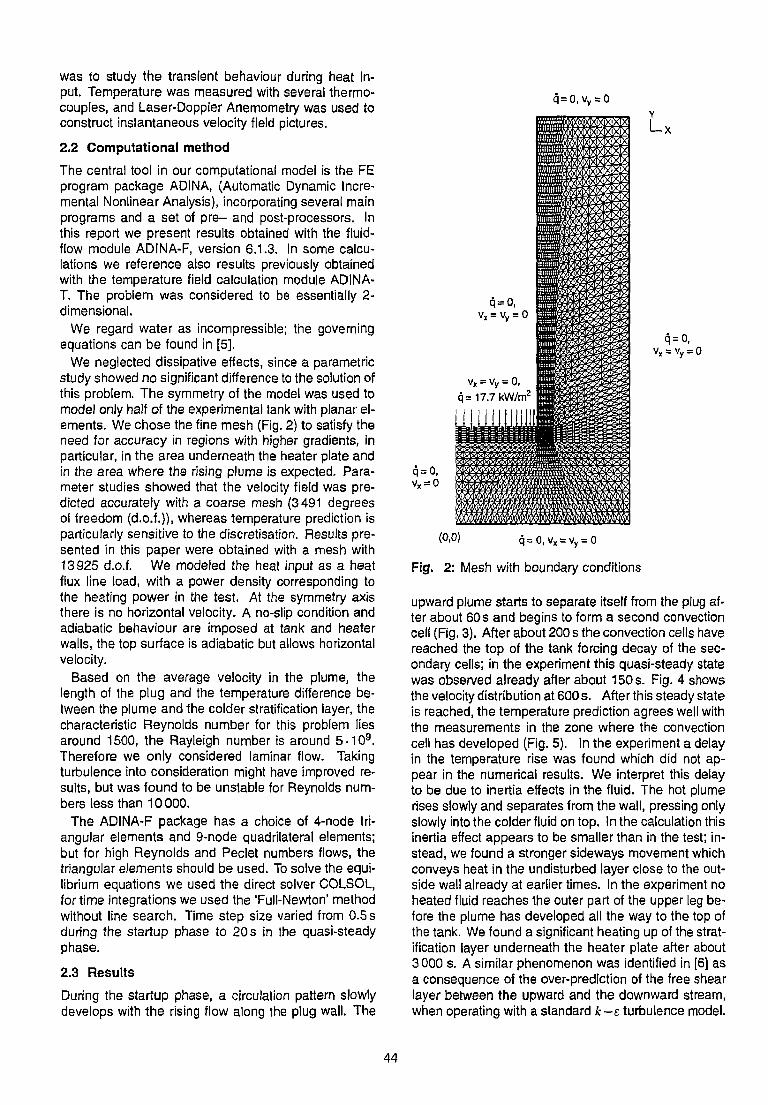
was to study the transient behaviour during heat in-put. Temperature was measured with several thermo-couples, and Laser-Doppler Anemometry was used toconstruct instantaneous velocity field pictures.
2.2 Computational method
The central tool in our computational model is the FEprogram package ADINA, (Automatic Dynamic Incre-mental Nonlinear Analysis), incorporating several mainprograms and a set of pre- and post-processors. Inthis report we present results obtained with the fluid-flow module ADINA-F, version 6.1.3. In some calcu-lations we reference also results previously obtainedwith the temperature field calculation module ADINA-T. The problem was considered to be essentially 2-dimensional.
We regard water as incompressible; the governingequations can be found in [5].
We neglected dissipative effects, since a parametricstudy showed no significant difference to the solution ofthis problem. The symmetry of the model was used tomodel only half of the experimental tank with planar el-ements. We chose the fine mesh (Fig. 2) to satisfy theneed for accuracy in regions with higher gradients, inparticular, in the area underneath the heater plate andin the area where the rising plume is expected. Para-meter studies showed that the velocity field was pre-dicted accurately with a coarse mesh (3491 degreesof freedom (d.o.f.)), whereas temperature prediction isparticularly sensitive to the discretisation. Results pre-sented in this paper were obtained with a mesh with13925 d.o.f. We modeled the heat input as a heatflux line load, with a power density corresponding tothe heating power in the test. At the symmetry axisthere is no horizontal velocity. A no-slip condition andadiabatic behaviour are imposed at tank and heaterwalls, the top surface is adiabatic but allows horizontalvelocity.
Based on the average velocity in the plume, thelength of the plug and the temperature difference be-tween the plume and the colder stratification layer, thecharacteristic Reynolds number for this problem liesaround 1500, the Rayleigh number is around 5-109.Therefore we only considered laminar flow. Takingturbulence into consideration might have improved re-sults, but was found to be unstable for Reynolds num-bers less than 10000.
The ADINA-F package has a choice of 4-node tri-angular elements and 9-node quadrilateral elements;but for high Reynolds and Peclet numbers flows, thetriangular elements should be used. To solve the equi-librium equations we used the direct solver COLSOL,for time integrations we used the 'Full-Newton' methodwithout line search. Time step size varied from 0.5 sduring the startup phase to 20 s in the quasi-steadyphase.
2.3 Results
During the startup phase, a circulation pattern slowlydevelops with the rising flow along the plug wall. The
q=o, vy =
vx = vy = o,q=17.7kW/m2
q=0,vx = vy = 0
Fig. 2: Mesh with boundary conditions
upward plume starts to separate itself from the plug af-ter about 60s and begins to form a second convectioncell (Fig. 3). After about 200 s the convection cells havereached the top of the tank forcing decay of the sec-ondary cells; in the experiment this quasi-steady statewas observed already after about 150 s. Fig. 4 showsthe velocity distribution at 600s. Afterthis steady stateis reached, the temperature prediction agrees well withthe measurements in the zone where the convectioncell has developed (Fig. 5). In the experiment a delayin the temperature rise was found which did not ap-pear in the numerical results. We interpret this delayto be due to inertia effects in the fluid. The hot plumerises slowly and separates from the wall, pressing onlyslowly into the colder fluid on top. In the calculation thisinertia effect appears to be smaller than in the test; in-stead, we found a stronger sideways movement whichconveys heat in the undisturbed layer close to the out-side wall already at earlier times. In the experiment noheated fluid reaches the outer part of the upper leg be-fore the plume has developed all the way to the top ofthe tank. We found a significant heating up of the strat-ification layer underneath the heater plate after about3000 s. A similar phenomenon was identified in [6] asa consequence of the over-prediction of the free shearlayer between the upward and the downward stream,when operating with a standard k-e turbulence model.
44

Velocity
f 20mm/s
Fig. 3: Velocity field at 150 s. Fig. 4: Velocity field at 600 s.
However, in the case of a laminar model, this effectwas not proven, and a number of other reasons arealso suspected to cause this effect. With an overpre-diction of the boundary layer thickness the mass flowof hotter fluid up to the top of the tank is overestimated,therefore the relatively cold portion of the fluid outsideof the region of the mounting plume is forced downtoo quickly causing a too strong heating up of the stillcolder parts below the heater plate.
Secondly, if the meshing and time-stepping is not fineenough some numerical diffusion can take place: thenumerical heat transfer may be larger than the physicalheat transport.
The boundary layer (the region of the mountingplume) behaviour is calculated satisfactorily, althougha certain instability in the boundary layer was observedin the experiment which we did not find reproduced inthe results, which were based on laminar flow. (Tur-bulent velocity fluctuations would not show up anyway,only macroscopic effects.) The thermocouples closestto the wall of the plug show a number of tempera-ture "collapses", where colder water from regions fur-ther away from the plug runs down the plug wall andmixes with the upward stream. This is an indicationfor the transition towards turbulent flow. Velocity pro-files (Fig. 6) show a growing boundary layer towardsthe top of the plume. In the experiment, it is hardto determine a boundary layer thickness based on thevelocities. Particle pictures show a width of around
8 mm. Based on the results obtained from the horizon-tally mounted thermocouples, the temperature bound-ary layer thickness is about 3 mm, whereas in the cal-culation it is around 5 mm. The calculated gradientacross this boundary layer is very low compared to themeasured one. In the early stages the calculated valueis around 0,4K/mm, later it drops to 0.2K/mm.
The vertical temperature profiles (Fig. 7) show threezones. Above the heater plate at y=90 mm, tempera-ture rises uniformly with time at the same rate across
60
50
E. 40a
1 30CD
a 20
10
1000 2000 3000 4000 5000 6000
Time [s]
Fig. 5: Comparison of calculations and experiment atx=108, y=271. (FLUTAN: Finite Volume code)
•
•
\
\
ExperimentADINA-FFLUTAN
•
•
•
\
45
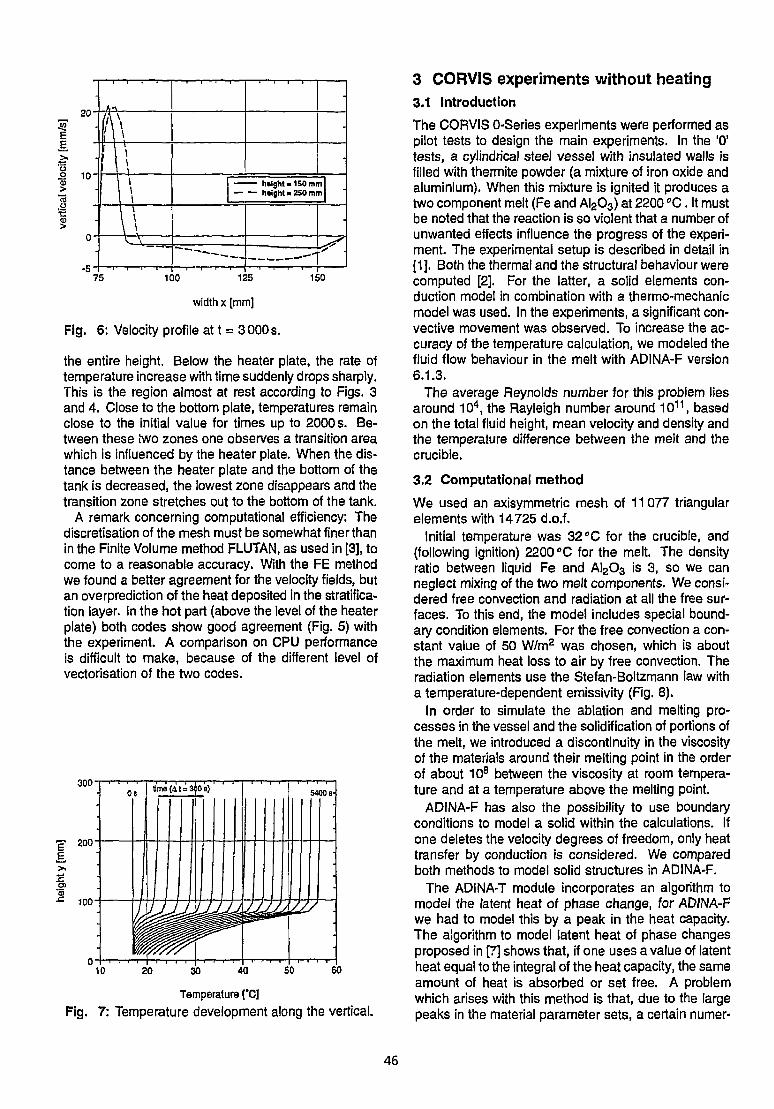
-
•\I'-
•
-
•
— — h»lghl»1S0mmh«lghl«2S0mm
- • — — . .—•"
•
20
1 10
I
75 100 125 150
width x [mm]
Fig. 6: Velocity profile at t = 3000 s.
the entire height. Below the heater plate, the rate oftemperature increase with time suddenly drops sharply.This is the region almost at rest according to Figs. 3and 4. Close to the bottom plate, temperatures remainclose to the initial value for times up to 2000 s. Be-tween these two zones one observes a transition areawhich is influenced by the heater plate. When the dis-tance between the heater plate and the bottom of thetank is decreased, the lowest zone disappears and thetransition zone stretches out to the bottom of the tank.
A remark concerning computational efficiency: Thediscretisation of the mesh must be somewhat finer thanin the Finite Volume method FLUTAN, as used in [3], tocome to a reasonable accuracy. With the FE methodwe found a better agreement for the velocity fields, butan overprediction of the heat deposited in the stratifica-tion layer. In the hot part (above the level of the heaterplate) both codes show good agreement (Fig. 5) withthe experiment. A comparison on CPU performanceis difficult to make, because of the different level ofvectorisation of the two codes.
10 20 30 40 SO 60
Temperature ("C]
Fig. 7: Temperature development along the vertical.
3 CORVIS experiments without heating3.1 Introduction
The CORVIS O-Series experiments were performed aspilot tests to design the main experiments. In the '0'tests, a cylindrical steel vessel with insulated walls isfilled with thermite powder (a mixture of iron oxide andaluminium). When this mixture is ignited it produces atwo component melt (Fe and AI2O3) at 2200 °C. It mustbe noted that the reaction is so violent that a number ofunwanted effects influence the progress of the experi-ment. The experimental setup is described in detail in[1], Both the thermal and the structural behaviour werecomputed [2]. For the latter, a solid elements con-duction model in combination with a thermo-mechanicmodel was used. In the experiments, a significant con-vective movement was observed. To increase the ac-curacy of the temperature calculation, we modeled thefluid flow behaviour in the melt with ADINA-F version6.1.3.
The average Reynolds number for this problem liesaround 104, the Rayleigh number around 1011, basedon the total fluid height, mean velocity and density andthe temperature difference between the melt and thecrucible.
3.2 Computational method
We used an axisymmetric mesh of 11 077 triangularelements with 14725 d.o.f.
Initial temperature was 32 "C for the crucible, and(following ignition) 2200°C for the melt. The densityratio between liquid Fe and AI2O3 is 3, so we canneglect mixing of the two melt components. We consi-dered free convection and radiation at all the free sur-faces. To this end, the model includes special bound-ary condition elements. For the free convection a con-stant value of 50 W/m2 was chosen, which is aboutthe maximum heat loss to air by free convection. Theradiation elements use the Stefan-Boltzmann law witha temperature-dependent emissivity (Fig. 8).
In order to simulate the ablation and melting pro-cesses in the vessel and the solidification of portions ofthe melt, we introduced a discontinuity in the viscosityof the materials around their melting point in the orderof about 108 between the viscosity at room tempera-ture and at a temperature above the melting point.
ADINA-F has also the possibility to use boundaryconditions to model a solid within the calculations. Ifone deletes the velocity degrees of freedom, only heattransfer by conduction is considered. We comparedboth methods to model solid structures in ADINA-F.
The ADINA-T module incorporates an algorithm tomodel the latent heat of phase change, for ADINA-Fwe had to model this by a peak in the heat capacity.The algorithm to model latent heat of phase changesproposed in [7] shows that, if one uses a value of latentheat equal to the integral of the heat capacity, the sameamount of heat is absorbed or set free. A problemwhich arises with this method is that, due to the largepeaks in the material parameter sets, a certain numer-
46

80
LN—
S 1000 2000^ Temperature [-C]
O)
y y j
I 1000 2000Temperature ['C]
1 0 1 0
g.10»
10-
1.0
3<.2 0.5a>
Hi
I
I \ v
I V -1000 2000
Temperature [*C]
Y/ •
J1000 2000
Temperature [*C]
wall
bottom plate
Fig. 9: Detail of isothermals at t = 20 s.
IronAl2O3
Melting DensityPoint atmeWng[•C] [kg/m3]
1540 75002050 2900
Fig. 8: Material parameters.
ical instability develops, so that fine time-stepping andmeshing is required. A similar algorithm as incorpo-rated in ADINA-T will be included in a future versionof ADINA-F. A topic which needs attention in naturalconvection problems is the hydrostatic pressure. Tosolve the governing equations, one must use the dy-namic pressure p = p - pgtxi; thus the body forceterm pg{ must be excluded, and this involves takingthe difference between two very large, almost equalnumbers, with the consequent loss of leading digits.We found it necessary to use this option for both prob-lems in section 2 and 3.
Again, the direct solver was used, together with the'Full-Newton' method with line search. The time stepsvaried from 0.1 s to 2 s.
3.3 Results
The velocity vector plots show a strong initial convec-tive movement in the melt, which settled after around30 seconds, when the temperature difference betweencrucible and melt decreases. In the first 20 secondsthe downward movement is concentrated at the bot-tom corner of the crucible. This suggests that a ringshaped hot area was formed, as was observed in theexperiment. In the course of the calculation both partsof the melt remain liquid, the time elapsed is too shortfor solidification. A slight discontinuity of the velocityprofile can be seen on the interface of the iron partand the oxidic part of the melt. However, only littlemixing is expected, given a density ratio of 3. Calcu-lated velocities are around 30 mm/s.
We were not able to observe any significant wash-outof the bottom plate in the calculations. However, the
corner region of the bottom plate showed a slight move-ment which indicates a somewhat larger heat transportinto the bottom plate in that region (Fig. 9). The heatconveyed there turned out to be lower when the struc-ture was modeled by fixing the velocities. The restof the bottom plate shows an even heating up overthe entire diameter. Without this downward convec-tion the hottest area of the bottom plate would be thecenter. The corner area of the melt between wall andbottom plate tends to keep its temperature for a longertime than in the calculations with ADINA-T. At around170 s, the center point (Fig. 10) has reached a tempe-rature of 1200°C which was indicated in [2] to be thetemperature of failure.
3.4 Comparison of fluid flow and temperature fieldcalculation
The corner cooling effects predicted with ADINA-Fwere smaller than those predicted with ADINA-T. Whenwe consider a flow model with natural convection in-duced only by cooling, and use a solid elements con-duction model for the structure, only a small differencein the temperature distribution can be seen.
When we introduce a discontinuity around the melt-ing point in the temperature dependent viscosity forthe solid structures, we found better agreement withthe experimental results. We surmise that the naturalconvection of a hot fluid being cooled within a muchcolder vessel provides a mechanism which accountsfor only marginally larger thermal attack on the con-taining structure than could be expected in a pure heatconduction case when no convection is assumed.
The experiment showed, however, a failure patternof the bottom plate in an annulus ("toroidal mode"),which leads to believe in a strong, thermally driven con-vection. This phenomenon could be explained with anumber of reasons. The thermite load was ignited inthe crucible, and the violent reaction might have gen-erated temporary convection cells. The observation oftwo similar experiments, where the only experimentalparameter changed was the dry-out time of the insula-tion layer prior to the experiment, showed a difference
47

1500
y, 1000
sQ.
© 500
•
•
•
•
1 ExfMrtmentADINA-TADINA-F -
•
50 100
Time [s]
150 200
Fig. 10: Temperature history at the center point of thebottom plate. (CORVIS 0/3)
in failure times. This material contains water as pro-cessing medium, the explosive evaporation might havedriven a strong flow. In the temperature history of thecenter point, an acceleration of the heat-up was ob-served around 40 s; this would indicate initiation of aforced convection of the melt. A possible further mod-eling step could be to introduce such an outer drivingforce in the numerical calculation.
4 CORVIS experiments with heating4.1 Introduction
Opposed to the pilot experiment as described in section2, in the main CORVIS test the burning of the thermitewas effected in a separate crucible, whence after com-pletion of the reaction the melt is tapped off and pouredinto the main test crucible. This was done in order toavoid the effects due to the violent reactions during thecombustion. Since the volume of the thermite powderis far greater than that of the resulting melt, in this wayit is possible to produce greater amounts of melt. Inthese tests, 300 kg of thermite were burnt, compared tothe 100 kg in the previously described ones. The heightof the melt in the test crucible cannot be observed,due to the overly intense glare; it was calculated withthe respective densities of ferritic and aluminium-oxydiccomponents and the displacement of the submergedelectrode. However, the pouring process would againexert a strong scouring action by the jet impingementon the bottom plate. To reduce this effect, a deflectorplate is mounted some 30 mm above the bottom; weexpect it to melt eventually, when the pouring is done.Furthermore, to compensate for the heat loss duringthis operation — and, indeed, to simulate the continu-ous decay heat generation in the reactor corium — thefluid is heated. The way of heating which was foundto be least interfering with the experiment itself is sub-merged electric arc heating. To this end, two cylindri-cal, concentric graphite electrodes are introduced intothe crucible. They are separated by an insulating gap;the arc should burn at the lower end, forming a plasma
between the center and the outer electrode. The arc isdriven by 124 kW d.c. mean electric power, resulting inabout 100 kW heat input to the fluid; some 10% of thepower is already lost by the internal resistance of thegraphite. The initial temperature of the crucible was120 "C. Also this experimental setup is fully describedin [1],
The results presented here refer to a 'shakedown'experiment, performed with a crucible with a smallerinner diameter of 500 mm, leaving a gap of only 70 mmbetween outer electrode and crucible wall. Hence lessconvective movement developed.
Even with all these precautions, the experiment re-mains intrinsically unstable, as far as the detailed evo-lution of the process is concerned. Therefore, detailedcomparisons are of no significance, and only the globalresults can be verified; fortunately, only these are ofphysical interest. Actually, the main point of interest isthe heat-up behaviour of the containing crucible and itseventual structural failure. Thus we have to consider-ably widen the scope of the calculations.
4.2 Computations
The axisymmetric mesh consisted of 10712 triangularelements with 14177 d.o.f. The method is roughly thesame as before, but with the addition of the heat in-put flux. We introduced a distributed heat flux loadingapplied to a line with the length equal to the outer elec-trode radius. We neglected the heat capacity effects ofthe electrodes. At the contact surface we imposed noslip, adiabatic boundary conditions. Therefore a num-ber of loss factors must be considered. A certain lossoccurs due to evaporation, abrasion and heating up ofthe electrode material. The deflector plate was simplymodeled by appropriately prescribing the initial tempe-rature.
We did not apply the method described above tomodel the latent heat of phase change in this case,because of the occurring instabilities, but we made anestimate of the error with help of the ADINA-T code.This heat can however influence the developed fluidstate, especially together with the contribution of solid-ifying material, and hence also the heat transfer.
Time steps varied from 0.01 s in the starting phaseand in the phase of solidification close to the heatsource up to 5 s after the upper part of the melt hassolidified.
4.3 Results
A first observation from the velocity plots is that themelt solidifies almost immediately close to the cruciblewalls, opposed to the experiment described in section2. The narrow gap between the submerged electrodeand crucible wall does not allow for strong convection.The contact temperature of the hot melt and the coldbottom plate lies below the melting temperature of theiron melt. The velocity plots show a quick solidificationof the melt on the bottom plate. This is an indicationthat a crust is being formed.
The metallurgic analysis after the experiment [9]
48
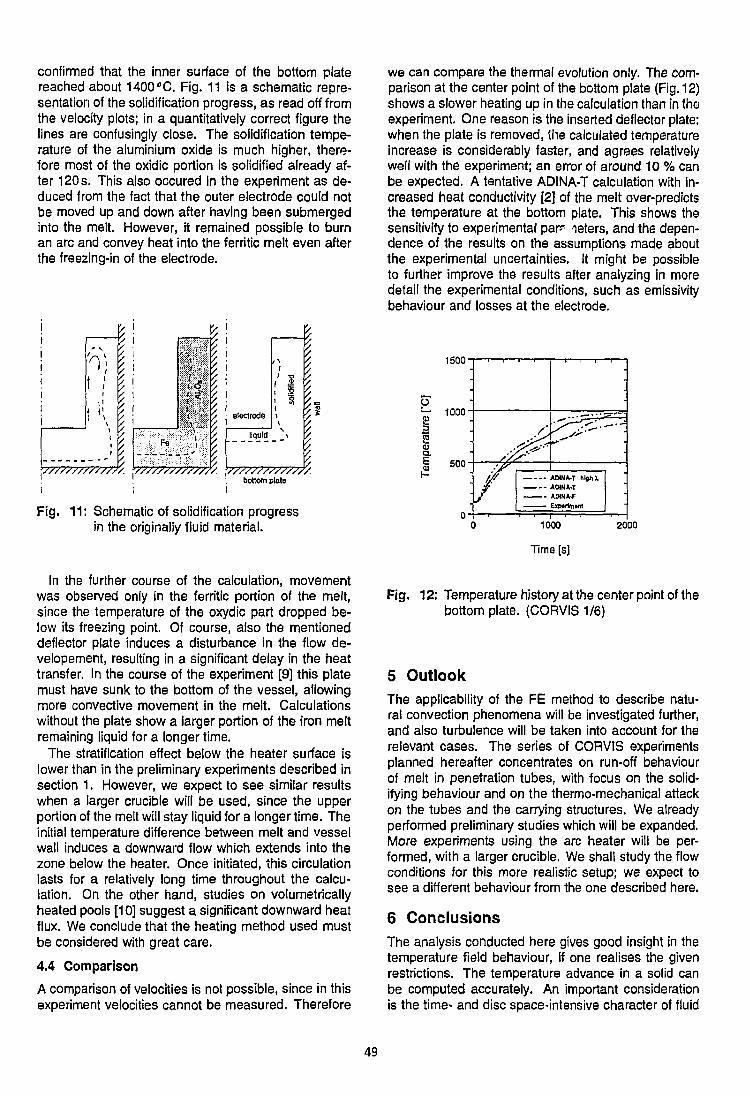
confirmed that the inner surface of the bottom ptatereached about 1400°C. Fig. 11 is a schematic repre-sentation of the solidification progress, as read off fromthe velocity plots; in a quantitatively correct figure thelines are confusingly close. The solidification tempe-rature of the aluminium oxide is much higher, there-fore most of the oxidic portion is solidified already af-ter 120 s. This also occured in the experiment as de-duced from the fact that the outer electrode could notbe moved up and down after having been submergedinto the meit. However, it remained possible to burnan arc and convey heat into the ferritic melt even afterthe freezing-in of the electrode.
bottom plata
Fig. 11: Schematic of solidification progressin the originally fluid material.
In the further course of the calculation, movementwas observed only in the ferritic portion of the melt,since the temperature of the oxydic part dropped be-low its freezing point. Of course, also the mentioneddeflector plate induces a disturbance in the flow de-velopement, resulting in a significant delay in the heattransfer. In the course of the experiment [9] this platemust have sunk to the bottom of the vessel, allowingmore convective movement in the melt. Calculationswithout the plate show a larger portion of the iron meltremaining liquid for a longer time.
The stratification effect below the heater surface islower than in the preliminary experiments described insection 1. However, we expect to see similar resultswhen a larger crucible will be used, since the upperportion of the melt will stay liquid for a longer time. Theinitial temperature difference between melt and vesselwall induces a downward flow which extends into thezone below the heater. Once initiated, this circulationlasts for a relatively long time throughout the calcu-lation. On the other hand, studies on volumetricallyheated pools [10] suggest a significant downward heatflux. We conclude that the heating method used mustbe considered with great care.
4.4 Comparison
A comparison of velocities is not possible, since in thisexperiment velocities cannot be measured. Therefore
we can compare the thermal evolution only. The com-parison at the center point of the bottom plate {Fig. 12)shows a slower heating up in the calculation than in theexperiment. One reason is the inserted deflector plate:when the plate is removed, the calculated temperatureincrease is considerably faster, and agrees relativelywell with the experiment; an error of around 10 % canbe expected. A tentative ADINA-T calculation with in-creased heat conductivity [2] of the melt over-predictsthe temperature at the bottom plate. This shows thesensitivity to experimental par? oeters, and the depen-dence of the results on the assumptions made aboutthe experimental uncertainties. It might be possibleto further improve the results after analyzing in moredetail the experimental conditions, such as emissivitybehaviour and losses at the electrode.
1500
ü~ 1000-
aoa.
500
-
-
•
/
•fr''''
AUNAT hlghL
1000
Time [s]
2000
Fig. 12: Temperature history at the center point of thebottom plate. (CORVIS 1/6)
5 OutlookThe applicability of the FE method to describe natu-ral convection phenomena will be investigated further,and also turbulence will be taken into account for therelevant cases. The series of CORVIS experimentsplanned hereafter concentrates on run-off behaviourof melt in penetration tubes, with focus on the solid-ifying behaviour and on the thermo-mechanical attackon the tubes and the carrying structures. We alreadyperformed preliminary studies which will be expanded.More experiments using the arc heater will be per-formed, with a larger crucible. We shall study the flowconditions for this more realistic setup; we expect tosee a different behaviour from the one described here.
6 ConclusionsThe analysis conducted here gives good insight in thetemperature field behaviour, if one realises the givenrestrictions. The temperature advance in a solid canbe computed accurately. An important considerationis the time- and disc space-intensive character of fluid
49

flow calculations with the FE method. As can be seenfrom the comparison in both section 2.3 and 3.3, thetemperature field calculations with ADINA-T are rea-sonably accurate. In mutual validation of the two codesone can improve the results obtained by ADINA-T,avoiding the need to model the entire scenario withADINA-F.
The major difference between the KfK experimentsand CORVIS is the temperature difference betweenthe melt and the test vessel at the beginning of theexperiment. In the CORVIS case heat is transportedtowards the bottom plate of the test vessel through dif-ferent mechanisms. As seen from studies [10] with vol-umetrically heated pools, the mode of heat input intothe melt pool clearly influences the thermal behaviour.
An area which needs further research is the ablationof material from the solid structures by the melt. Withsome adaptive assumptions a good estimation can bemade with the method presented in this paper. ForRPV failure assessment it is necessan/ to obtain reli-able results on the thermal response of the structure,since the decisive factor in predicting failure will remainthe thermo-mechanic behaviour of the solid structures.
AcknowledgementsWe wish to express our gratitude to our colleagues S.Brosi, M. Niffenegger and T. Dury for their support tothe present work and to the researchers of the Insti-tut für Angewandte Thermo- und Fluiddynamik at theKfK for their cooporation and expertise. We gratefullymention the financial assistance from the Swiss Fed-eral Nuclear Safety Inspectorate and from the SwissFederal Office of Energy.
References[1] PATORSKI J., HIRSCHMANN H., PETERS K.:
"CORVIS: Investigation of LWR Lower HeadFailure Modes, Experimental Programme";Transactions of the 12th SMIRT ConferenceU07/2,133-139, Stuttgart, Germany (1993).
[2] DUIJVESTIJN G., RÖSEL R., BROSI S.: "CORVIS:Investigation of LWR Lower Head FailureModes, Computational Analysis of StructuralBehaviour"; Transactions of the 12th SMIRTConference U07/3, 141-147, Stuttgart, Ger-many (1993).
[3] KAPULLA R.: 'Transiente Untersuchungen zurNaturkonvektion in einem Wassertank mit hor-izontal beheizter Platte"; Diplome thesis, Uni-versity of Karlsruhe, Germany (1993).
[4] HOFFMANN H. ETAL: Transient Investigationson Natural Convection in a Tank with Hori-zontally Arranged Heater Plate"; Conferenceon New Trends in Nuclear System Hydraulics,Pisa, Italy (1994).
[5] BATHE K. J., DONG J.: "Studies of finite ele-ment procedures - the use of ADINA-F in fluidflow analysis "; Comput. Struct., 32, 499-516(1989).
[6] SMITH B. ET AL: "Analysis of single-phasemixing experiments in open pools"; ASMEHTD 209,101-109, Thermal Hydraulics of Ad-vanced and Special Purpose Reactors' (1992).
[7] ROLPH m, W. D., BATHE K. J.: "An efficient al-gorithm for analysis of nonlinear heat transferwith phase changes"; Int. J. num. Meth. En-gng. 18, 119-134(1982).
[8] SEIFERT H. P.: "CORVIS: Spezifischer elek-trischer Widerstand des Elektrodengraphits ";PSI-AN-49-94-04(1993).
[9] TIPPING P. ET AL: "Metallurgical, Chemicaland Hardness Examination; Assessment ofthe Thermal History of the CORVIS Test Sec-tion from Experiment 01/6 "; PSI-AN-49-94-03(1994).
[10] KYMÄLÄINEN O. ET AL: "Heat flux distributionfrom a volumetrically heated pool with highRayleigh number"; J. Nucl. Eng. Des., 149,401-408 (1994).
50
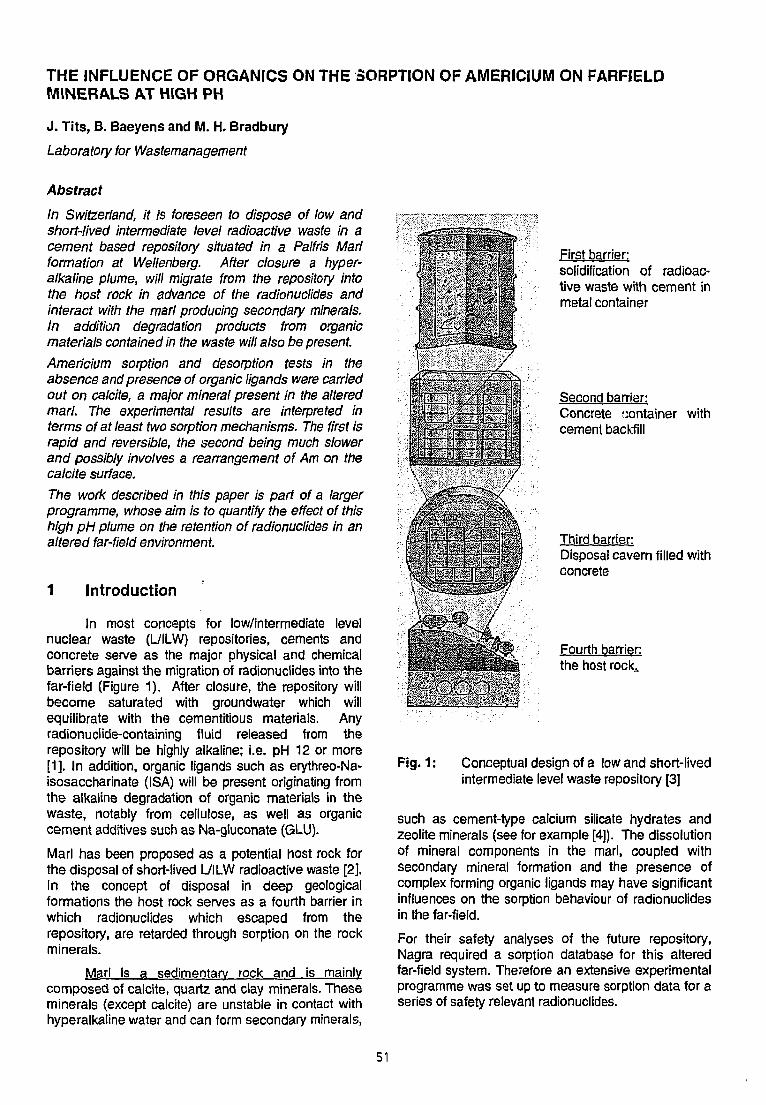
THE INFLUENCE OF ORGANICS ON THE SORPTION OF AMERICIUM ON FARFIELDMINERALS AT HIGH PH
J. Tits, B. Baeyens and M. H. Bradbury
Laboratory for Wastemanagement
Abstract
In Switzerland, it is foreseen to dispose of low andshort-lived intermediate level radioactive waste in acement based repository situated in a Palfris Marlformation at Wellenberg. After closure a hyper-alkaline plume, will migrate from the repository intothe host rock in advance of the radionuclides andinteract with the marl producing secondary minerals.In addition degradation products from organicmaterials contained in the waste will also be present.
Americium sorption and desorption tests in theabsence and presence of organic ligands were carriedout on catche, a major mineral present in the alteredmarl. The experimental results are interpreted interms of at least two sorption mechanisms. The first israpid and reversible, the second being much slowerand possibly involves a rearrangement of Am on thecalcite surface.
The work described in this paper is part of a largerprogramme, whose aim is to quantify the effect of thishigh pH plume on the retention of radionuclides in analtered far-field environment.
1 Introduction
In most concepts for low/intermediate levelnuclear waste (L/ILW) repositories, cements andconcrete serve as the major physical and chemicalbarriers against the migration of radionuclides into thefar-field (Figure 1). After closure, the repository willbecome saturated with groundwater which willequilibrate with the cementitious materials. Anyradionuclide-containing fluid released from therepository will be highly alkaline; i.e. pH 12 or more[1], In addition, organic ligands such as erythreo-Na-isosaccharinate (ISA) will be present originating fromthe alkaline degradation of organic materials in thewaste, notably from cellulose, as well as organiccement additives such as Na-gluconate (GLU).
Marl has been proposed as a potential host rock forthe disposal of short-lived L/ILW radioactive waste [2],In the concept of disposal in deep geologicalformations the host rock serves as a fourth barrier inwhich radionuclides which escaped from therepository, are retarded through sorption on the rockminerals.
Marl is a sedimentary rock and . is mainlycomposed of calcite, quartz and clay minerals. Theseminerals (except calcite) are unstable in contact withhyperalkaline water and can form secondary minerals,
First barrier:solidification of radioac-tive waste with cement inmetal container
Second barrier:Concrete container withcement backfill
Thjrd barrier:Disposal cavern filled withconcrete
Fourth barrier:the host rockA
Fig. 1: Conceptual design of a low and short-livedintermediate level waste repository [3]
such as cement-type calcium silicate hydrates andzeolite minerals (see for example [4]). The dissolutionof mineral components in the marl, coupled withsecondary mineral formation and the presence ofcomplex forming organic ligands may have significantinfluences on the sorption behaviour of radionuclidesin the far-field.
For their safety analyses of the future repository,Nagra required a sorption database for this alteredfar-field system. Therefore an extensive experimentalprogramme was set up to measure sorption data for aseries of safety relevant radionuclides.
51

The types of secondary minerals that form inaltered marl and their contribution to the overallmineralogy are very difficult to predict with anycertainty. However marl contains up to 75 wt. %.calcite which remains virtually unaffected byhyperalkaline fluids. Therefore the experimentalapproach adopted in this study was based on asimplified concept for the altered far-field which wasviewed as consisting of only calcite in equilibrium witha cement pore water at pH~13.3 simulated by aNaOH solution. This approach is seen asconservative because from all minerals that canpossibly form in such an altered far field, calcite isbelieved to be the least sorbing mineral. The organicsISA and GLU were used to simulate cellulosedegradation products and cement additives,respectively.
This paper presents the experimental results forthe sorption behaviour of Am on calcite in thepresence and absence of the above mentionedorganic ligands. Sorption experiments were carriedout using americium because it is a potentiallyimportant radionuclide in safety assessment studiesfor the Swiss L/ILW-repository concepts.
2 Materials and methods
2.1 Materials
All solutions were prepared from reagent grade (orbetter) chemicals in deionised water degassed byboiling and cooling under N2.
Labelled solutions were prepared from anisotopically pure z41Am stock solution in 0.8 M HNO3.
Sorption experiments were carried out on anatural calcite sample, taken from cores obtainedfrom borehole SB2 at a depth of 979.04 m below thesurface at Wellenberg and denoted as 'WLB-calcite'.Specimens were crushed in a tungsten coated ballmill and sieved to provide samples with a particle sizefraction < 63 u.m which were used in the sorptiontests. The mineral composition of the WLB-calcitesample is given in Table 1 .
MineralCalciteAnkeriteQuartzAlbiteK-feldsparClay mineralsFluoriteOrganic carbon
Weight %91.8<17.4 - 7.9<1<10.2 - 0.6<10.02
2.2 Sorption experiments
The sorption of Am in the absence and presence ofISA and GLU was measured in batch tests as functionof time. Desorption experiments were carried out byaddition of large concentrations of organiccomplexant.
All batch sorption experiments were carried outin controlled N2 atmosphere glove boxes. (The O2 andCO2 concentrations were - 5 ppm.)
Appropriate amounts of crushed calcite wereadded to 40 ml of 0.3 M NaOH solution contained inpolyallomere centrifuge tubes. (From an experimentalview point, the optimal solid to liquid ratio was foundto be 0.125 g I"'.) These suspensions were allowed toequilibrate for one day prior to labelling with S41Amfrom the stock solution, after which they were shakenend-over-end for the desired time-period.Subsequently they were removed from the glove boxand centrifuged for 1 hour at 95000 g max. using aBeckman L7 Ultracentrifuge. Two 10 ml aliquots weretaken from the supernatant before determining the pHin the remaining solution.
"1Am solutions were radio-assayed using aCanberra Packard Tri-carb 2500TFI/AB liquidscintillation counter equipped with an a/ßdiscrimination device. Two scintillation cocktails wereused: Instagel™ for total a counting (10 ml sampleplus 10 ml cocktail), and Ultimagold AB™ for low levelmeasurements with ct/ß discrimination (10 ml sampleplus 14 ml cocktail).
The initial 241Am concentrations used in mostbatch sorption experiments were ~10'11M,corresponding to a total activity of - 103 cpm per 40ml. Preliminary experiments at similar Amconcentrations, with sampling intervals of 1,7, and 21days followed by ultra-centrifugation, showed thatsolutions at such concentrations were stable.
Sorption data are presented in terms of adistribution coefficient, Rd, which refers to the ratio ofthe mass or activity of Am present per unit solidphase, to the mass or activity of Am present per unitliquid phase and can be calculated directly from theAm-activity measurements as follows:
("total ~ ^walls "solution / L
= : F(1)
^solution
Table 1: Mineralogical composition of the WLB-calcite samples (M. Mazurek, pers.comm.)
where: A = 241Am activity in the appropriate unitsL = volume of liquid phase (I)S = mass of solid phase (kg)
The Am activity associated with the solid phase(Acaiciio) i s calculated from the difference between theinitial total activity inventory (A,0J, and the activitiesmeasured in the supernatant (A^^,,) and on thecontainer walls
52

The effects of wall sorption were quantified andcorrected for as given in equation (1). Aqueousactivity measurements in batch tests made before andafter centrifugation (1 hour at 95,000 g max.)measured in the supernatant (A^^) and on thecontainer walls (A^J .
The effects of wall sorption were quantified andcorrected for as given in equation (1). Aqueousactivity measurements in batch tests made before andafter centrifugation (1 hour at 95,000 g max.)indicated that CaCO3 colloids present did not haveany significant influence on the R„ determinations.
Estimates of the uncertainties on the sorptionvalues were obtained via an analysis of the spread ofthe data obtained in replicate tests (10 replicates wereanalysed in the absence and presence of organicligands).
3 Results
3.1 Sorption kinetics in the absence of organicligands
Sorption kinetic experiments showed that theuptake of Am by calcite is rapid and strong, reachinglog Rd values of 5.6±0.3 I kg within a few hours. ThisRd value is very large and remained constant over themonitoring period of eight weeks.
3.2 Sorption kinetics in the presence of organicligands
The influence of the main cellulose degradationproduct, ISA, (VAN LOON, pers. comm.) and thecement additive GLU, on the sorption kinetics of Amon calcite was investigated.
3.2.1 Influence of the experimental set-up
Batch sorption tests in the presence of ISA were car-ried out in two different ways. In a first set ofexperiments z41Am and ISA were added quickly, one
a.
5.0
45 -
"C 4.0 -
s 3v3.ol
<
(T
r I J
• 1
, i , i . i I.
I.
I.
I.
I.
I
after the other, to a calcite suspension so that therewas simultaneous competition for the Am between thesorbent and the complexing ligand. The results ofthese tests are shown in Figure 2a. At the added ISAconcentration of 2-10"1 M the initial reduction in sorp-tion was very large; a factor of -300 compared withthe sorption values in the absence of ISA (log Ra = 5.6I kg1).
The sorptior. then began to increase so that ona time scale of ~6 days the difference wasapproximately a factor of 50.
In a second experiment, the Am was allowed tocomplex with ISA for ~24 hours before being added tothe calcite suspension. The subsequent sorptionbehaviour is illustrated in Figure 2b. The initialsorption was again less than had occurred in theabsence of organic ligands, but by a factor of only-10, compared with a factor of ~300 when theprevious sequence was used. However the sorptionthen continues to fall, reaching a minimum afterapproximately one day before recovering. After areaction time of ~6 days there is no significantdifference in the sorption values measured using thetwo different methods. (Similar behaviour wasmeasured on a number of occasions in experimentscarried out under varying conditions.) Thus, thesequence of addition in such experiments makes onlya difference to the sorption values whenmeasurements are made on a short time scale.
3.2.2 Sorption reduction due to the presence oforganic ligands
Having noted that the sorption kinetics might dependon the experimental set-up, we now discuss theeffects of two different organic ligands, ISA and GLU.In the presence of 3-^ M GLU, sorption reductionfactors for Am of - 100 were measured (Figure 3a).
Reduction factors of this magnitude areinterpreted as being due to the formation of aqueousorganic complexes and are more or less compatible
6 9Equilibration (me (days)
12 15
3.5
3.0
2.56 9
Equilibration time (days)12 15
Fig. 2: Am sorption kinetic experiments on WLB-calcite in the presence of 210 " M ISA.Influence of the sequence of addition of ISA and Am.a. ISA and Am added quickly, one after the other, to the calcite suspension.b. Am-ISA complex added to the calcite suspension.
53

with solubility enhancement factors reported in theliterature for such organic ligands [5]. However thispicture changes dramatically when the sorptionbehaviour is followed over a much longer time-period.
Figure 3b illustrates clearly that after a contacttime of -150 days the sorption recovers so that thereduction is barely a factor of ~5.
Similar observations are made with ISA.Sorption experiments in the presence of 2-10"4 M ISAexhibit initial reductions in sorption of up to 3 orders of
magnitude (Figure 4a) but sorption strongly recoversover timescales up to 170 days and the data areindicating that the recovery process may becontinuing (Figure 4b).
Experiments carried out at higher ISA and GLUconcentrations (10"3 M) indicated that in the case ofISA a similar recovery process took place, but wasless pronounced. For GLU, which is clearly a muchmore powerful complexant, no sorption wasmeasurable and no recovery occurred within 30 days.
b.6.0
5.0
4.0
3.0 -
! No organic* I-;']:J ::{;.!.;.!
hi \
2 4 6Equilibration time (days)
2.050 100 150
Equilibration time (days)200
Fig. 3: Sorption kinetics of Am on WLB-calcite in the absence (•) and in the presence (A) of GLU (3-10*M)atpH13.3a. Short term kinetics
• b. Long term kinetics
a. b.
6-°r Jf I • t
=% 4.0cr
oI I
3 .0 * - ^
2,0' I | I
73
a:CDO
2 4 6 8Equilferation time (days)
10 50 100 150Equilibration time (days)
200
Fig. 4: Sorption kinetics of Am on WLB-calcite in the absence (•) and in the presence (•) of ISA (2-10"1
M)atpH13.3a. Short term kineticsb. Long term kinetics
54

3.3 Desorption kinetics
Having investigated the kinetics of Am sorptionon calcite the complementary desorption Kinetic testswere performed. The reversibility of sorption is ofgeneral importance in radioactive waste management,but is of particular interest with respect to radio-element transport by colloids. In somecircumstances, desorption studies can provideadditional information on the processes occurring.
Normally desorption is achieved by decreasingthe aqueous radionuclide concentration by dilutionafter sorption. In the particular case here, this methodproved to be impractical because of the extremely lowdesorption rates and activities involved. Instead, therelease of Am into solution was studied following theaddition of high concentrations of GLU. Increasingthe organic ligand concentration results in increasedcomplexation which shifts the system equilibriumtowards lower sorption i.e. tends to promotedesorption. (Note that we assume here thatcomplexes do not undergo sorption themselves.)
In order to obtain a thorough overview of thedesorption process, desorption kinetics were studiedas a function of the time allowed for sorption. Thebasic technique was to sorb Am onto calcite fordifferent times (10 minutes, 1 hour, 1 day and 3weeks) before adding the organic ligand. GLU wasadded as "desorbing agent" at a concentration of 10'3
M, which is a current best estimate of the maximumconcentrations expected in hyperalkaline plume. Asalready mentioned above, sorption tests showed that10'3 M GLU was sufficient to keep all of the Am insolution.
The desorption results in the presence of 10"3 MGLU are summarised in Figure 5. (Note that atdesorption time zero, the fraction sorbed isapproximately unity.)
0.30*
0.20 -
0.10 -
0.0O1
Fig. 5:
200 400Equilibration time (hours)
The influence of sorption time on thedesorption of Am carried out in thepresence of 103 M GLU. ( • ) 10 minutessorption time, ( • ) 1 hour sorption time,( • ) 1 day sorption time, ( • ) 3 weekssorption time.
Clearly, the desorption kinetics are a function of•he sorption time, as are the quantities of Amremaining sorbed. Only for the shortest sorption timeof 10 minutes was it possible to desorb all the Am.Unfortunately, the longest desorption time was only500 hours and although it appears that the desorptionrates are tending to zero, it is not possible on thebasis of these data to distinguish between irreversiblesorption and very slow desorption kinetics.
4 Discussion
The foregoing results show unambiguously thatshort term sorption/desorption tests are notappropriate for characterising the uptake of Am oncalcite. It is also clear that in the presence of thestrongly complexing organic ligands investigated here,the overall behaviour cannot be simply interpreted asa combination of a rapid sorption reaction competingwith an equally rapid aqueous complexation reaction.The implication of this is that the influence of suchorganic ligands on sorption values cannot bedetermined from speciation calculations using theappropriate complexation constants. Such anapproach, involving the calculation of so called"sorption reduction factors" [6], may, at most, reflectthe very short term behaviour, but is far toopessimistic to describe the more important long termeffects (see Figure 3 and 4).
The uptake of Am on calcite appears to follow aprocess with at least two steps; a very rapid sorptionreaction which is over in approximately one hour,followed by some as yet unidentified surfacerearrangement reaction, which has much slowerkinetics but leads to a much stronger binding of theAm. The slower reaction is not seen in the normalsorption tests because the first step is so rapid andstrong. However, in the desorption kineticexperiments performed as a function of the sorptiontime (Figure 5), evidence of this two stage processcan be seen. It also becomes apparent in the sorptionkinetic measurements carried out in the presence ofGLU and ISA (Figure 3 and 4). Similar observations tothe latter were made by DAVIS et al. [7] in theCaCO3-Cd-EDTA system where the results wereinterpreted in terms of a rapid exchange reaction ofCd with Ca followed by the incorporation of Cd into ahydrous calcite surface layer.
Another possibility is that the Am-organiccomplexes themselves can undergo sorption. Such anuptake mechanism is seen as a process which isoccurring in addition to, and not in place of, the twotypes of kinetic reactions given above. Furtherexperimental work in this direction is being carried out.
5 Summary and conclusions
The sorption of Am on natural calcite fromWellenberg in the absence of organic ligands is strong
55

(log Rd = 5.6±0.3 I kg"1) and fast. In the presence ofISA and GLU large sorption reduction factors aredetermined on short time scales (< 1 week).However, when sorption is measured over longer timeperiods (up to -6 months) a clear recovery takesplace. This may be, at least in part, due to thesorption of Am-organic complexes. The strength ofthe recovery and the kinetics are dependent on theinitial organic complexant concentration. The"desorption kinetics" are slow, and it remains unclearas to whether the uptake of Am on WLB-calcite iscompletely reversible.
These observations led us conclude that theuptake of Am by WLB-calcite is complex and probablyproceeds via at least two mechanisms which havedifferent kinetics. The first mechanism is rapid andreversible on a short time scale. The second processis slower and possibly involves surface rearrangementreactions producing surface precipitates or nearsurface solid solutions. The influence of organicligands such as ISA and GLU on the sorption of Amon WLB-calcite is considerably less than would beexpected from thermodynamic speciation calculations;Use of the latter would lead to highly pessimisticevaluations for sorption of radionuclides.
6 AcknowledgementsThe authors would like to thank S. Haselbeck and P.Eckert for their contribution to the experimental work.Partial support was provided by NAGRA.
7 References
[1] NEALL, F. B. Modelling the Near-Field Chemistry ofa SMA Repository at the Wellenberg Site. PSI-
Bericht Nr. 94-18. Paul Scherrer Institute, Villigen,Switzerland and Nagra Technical Report NTB 94-03(1994).
[2] NAGRA Bericht zur Langsicherheit des EndlagersSMA am Standort Wellenberg (GemeindeWolfenschiessen, NW). Nagra Technical ReportNTB 94-06, Nagra, Wettingen, Switzerland (1994).
[3] NAGRA Beurteilung der Langzeitsicherheit desEndlagers SMA am Standort Wellenberg(Gemeinde Wolfenschiessen, NW). NagraTechnical Report NTB 93-26, Nagra, Wettingen,Switzerland (1993).
[4] CRAWFORD, M. B. and SAVAGE D. The Effects ofAlkaline Plume Migration from a CementitiousRepository in Crystalline and Marl Host Rocks.British Geological Survey, Technical Report,WE/93/20C(1993).
[5] MORETON, A. D. Thermodynamic Modelling of theEffect of Hydrocarboxylic Acids on the Solubility ofPlutonium at High pH. Mat. Res. Soc. Symp.Proc. 294,753(1993).
[6] BRADBURY, M. H. and SARROT, F. A. SorptionDatabases for the Cementitious Near-Field of aL/ILW Repository for Performance Assessment. .PSI-Bericht Nr. 95-06. Paul Scherrer Institute,Villigen, Switzerland and Nagra Technical ReportNTB 93-08 (1994).
[7] DAVIS, J. A., FULLER, C. C. and COOK , A.. A Modelfor Trace Metal Sorption Processes at the CalciteSurface: Adsorption of Cds* and SubsequentSolid-Solution Formation. Geochim. Cosmochim.Ada 51,1477 (1987).
56
LINEAR RESPONSE CONCEPT COMBINING ADVECTION, LIMITED ROCK MATRIXDIFFUSION, AND FRACTURE NETWORK EFFECTS IN A GEOSPHERE TRANSPORT MODEL
W. Barten
Laboratory for Waste Management
Abstract
This contribution presents fundamentals and first testsof a model for transport of nuclides in the geospherebetween the near-field of a radioactive wasterepository and the next high conductivity fractures.The geosphere is modelled as a network of fracturesthat are mapped onto a network of channels. Ahierarchical linear response concept using Laplacetransformation techniques is developed for solution ofthe balance equations (a) on the scale of a channelnetwork, (b) in the individual channels, and (c) in therock matrix adjacent to the channels. Different rockmatrix geometries are shortly considered. Firstquantitative tests of the new geosphere transportcode PICNIC are presented.
1 Introduction
The movement of radionuclides in saturated fracturedrock, e.g. granite, from a radioactive waste repositoryto the next high conductivity fractures, has to bemodelled as a part of the model chain for repositoryperformance assessment. The more site specific databecome available on water flow paths and the rock inthe far-field of a repository, the more it is necessary toincorporate this information in our model approaches.Aspects of geosphere geometry and heterogeneitythat are not incorporated in the today's performanceassessment models, are addressed in this article.
When radionuclides leave the engineered barriersystem of a radioactive waste repository, they will betransported mainly by water flowing in a system of lowconductivity fractures through the rock until they reachhigh conductivity fractures that are assumed to beclosely connected to the biosphere. This is supportedby observations in field experiments, e.g. in theFanay-Augeres mine in France [1] and the Stripamine in Sweden [2, 3]. Due to the complex geometryconsidered and the large time scales, care must betaken to select the relevant processes and to useefficient mathematical and numerical methods. Thechief purpose for developing a new transport modelwas to take account of the heterogeneity of the flowpaths (network effects), that cannot be accounted forby the today's geosphere transport model RANCHMD[4-6] used in Swiss safety assessment of radioactivewaste repositories.
Advanced fracture network transport models [7, 8]that take account of this heterogeneity weredeveloped and tested in field experiments by (i)Herbert and Lanyon [9, 10] (an extension of the
NAPSAC code [11]), (ii) Cacas et al. [1], (iii) Dverstorpet al. [2], and (iv) Nordquist et al. [12]. For all thesemodels a three-dimensional fracture network systemis generated by defining a finite number of two-dimensional fractures with relatively simple geometry,i.e., rectangles or disks. Extension, position in space,and geometry of each fracture are defined usingappropriate probability distribution functions. Then thestationary water flow for given boundary conditions isdetermined with the help of the Darcy equation,followed by the time-dependent transport calculation.Two-dimensional water flow is calculated in thefractures in model (i), while models (ii) to (iv) definedifferent kinds of channels as flow paths in thefractures. To allow for variability of the flow pathswithin the fracture planes, model (iv) uses residencetime spectra instead of one single residence time.Concluding, all the network models (i) to (iv) takeaccount for macro-dispersion and micro-dispersion.Macro-dispersion means that different flow pathsthrough the network have different advection times,since different fractures or channels in the networkhave different water flow velocities and differentlengths. This concept contains also the effect ofretarded advection by linear sorption of the nuclides,i.e., nuclides in the water and nuclides sorbed on therock are in an instantaneous and linear chemicalequilibrium. Micro-dispersion means that in a channelor fracture different flow paths exist with differentadvection times. Matrix diffusion is an important linearretardation effect, e.g., [13-16, 6], that has not beenconsidered until recently in fracture networkmodelling. A recently and independently developedapproach by (v) Küpper et al. [17,18] takes unlimitedmatrix diffusion into account in combination withnetwork effects. Matrix diffusion describes nuclidesdiffusing, from the flowing water in the fractures, intothe stagnant water of the surrounding rock matrix.Limited matrix diffusion, as considered, e.g., byRANCHMD, takes into account that the available rockmatrix is finite. Unlimited matrix diffusion ismathematically easier to deal and is for somepurposes a good approximation for nuclide diffusioninto stagnant rock pore water. But this approach doesnot take into account the finite extension of theavailable rock matrix and can give non-conservativeresults, especially for large times.
The effects and transport phenomena that canbe accounted for by the new model are as follows:(a) macro-dispersion due to network effects;(b) micro-dispersion;(c) limited matrix diffusion into different rock
geometries;
57

(d) inear sorption of nuclides in the fractures andthe rock matrix;
(e) radioactive decay of nuclide chains.
The linear response concept in combination withLaplace transformation, that is the base of the newmodel, is presented in Section 2 and related to earlierwork. For purpose of clearer presentation of theconcept, in this article (b) micro-dispersion and (e)radioactive decay are omitted. Radioactive decay of asingle nuclide can easily be incorporated. In Section 3the balance equations in a single channel are given,and the response functions are derived in time spaceand in Laplace space by introducing a responsecoefficient function for the rock matrix. Thiscalculation is continued in Section 5 explicitly for achannel with an adjacent one-dimensionalhomogeneous rock matrix. In Section 4 the responsecoefficient function of the rock matrix to be enteredinto the channel response functions js calculatedexplicitly in Laplace space. To calculate the responsecoefficient for different one-dimensional rock matrixgeometries, a rock matrix response tensor isintroduced. In Section 6 the network responsefunction is given in Laplace and time space for a one-dimensional homogeneous rock matrix. Section 7contains first quantitative tests of the transport codePICNIC. Section 8 gives concluding remarks.
2 Linear Response Concept
The model starts with a predefined fracture networkand water flow in that network. Then the fracturenetwork is mapped onto a channel network with, forinstance, the fracture centers or the fractureintersections as nodes of the network, see [19] for ashort discussion. The probability of a nuclide in a nodeof the network using a specific channel is determinedby the water flow. The set, w = l,...,W, of the
possible pathways between the repository and thehigh conductivity fractures is also determined by thewater flow. For shortness of representation, here, therepository is considered to have one single inflowposition, in, into the channel network. A pathway w
may consist of the successive channelsn = 1, ...,NW. So far this is the same procedure
used in model types (i) to (iv). In addition to advectionretarded by linear sorption, the new approach takesinto account the effect of rock matrix diffusion indifferent geometries, as in the dual porosity mediumapproach — dispersion will be discussed later. Thisdefines a residence time spectrum of a channel(tt,w) for pulse (or 5-function) shape nuclide inflow
into it, as considered in model (iv) for channels with atwo-dimensional field of variable conductivity.Because matrix diffusion and advection are lineareffects, in the sense of partial differential equations,the residence time spectrum can be considered as a
linear response function yijj.nw(out;t) of the
nuclide flow Jf.nw(out;t) of the channel, out
denotes the outflow position of the channel. Thechannel spectra can be assembled to a networkresidence time spectrum. This was also done(neglecting matrix diffusion) in model (iv) [12]. Thisnetwork residence time spectrum can be consideredas the linear response function of the network,
w(1)
W=J
that is the weighted sum of the response functions ofthe pathways. ww is the probability of a nuclide to
follow the pathway w. hcf denotes the outflow
positions of the network into the high conductivityfractures. Numerically, this is an expensive procedurebecause, for each pathway considered betweenrepository and high conductivity fractures, theassemblage of the channel residence time spectra toa pathway residence time spectrum means a multipleevaluation of a convolution integral,
%.f;w(hcf;t)=
(convolution)
A widely used and efficient method to solve linearpartial differential equations is the Laplacetransformation method, e.g. [20,16, 21]. The Laplace
transformed function f(s) for a time-dependent
function fit) is defined by
= \dte~stf(t) (3)
A convolution of time dependent functions transformsto a simple product of functions in Laplace space.Thus the response function in Laplace space of apathway,
%.f:n.Jout;s), (4)n=Nw
(product)
and also of a channel network,
%f(hcf;s) = % (5)
is easily calculated from the response functions inLaplace space of the single channels. For a timedependent nuclide inflow Jj.nyv(in;t) into the
channel network, the nuclide outflow
J ;t)=%if (hcf;t)*Jf (in;t)=
ldf^Jf(hcf;t-t')Jf(in;f),(6)
58

is calculated by evaluation of a single convolutionintegral. When the Laplace transformed of the nuclideinflow is known, the time dependent nuclide outflowcan directly be calculated by inverse Laplacetransformation of
Jf (hcf; s) = %if (hcf; s) Jf (in; s). (7)
The applicability of the concept is demonstrated usingsome exampies, cf. later. If we take into account theeffects of advection, radioactive decay, and unlimitedone-dimensional matrix diffusion, we can calculate theresponse function of a network analytically, as well inLaplace as in time space. This has beendemonstrated independently in model (v) [17]. If weconsider limited one-dimensional matrix diffusion, westill can calculate the response functions in Laplacespace analytically. But the inverse Laplacetransformation has to be performed numerically to getthe time dependent solution. Appending a secondone-dimensional region accessible for matrix diffusionand more complicated examples can still be dealtanalytically in Laplace space. Numerical inverseLaplace transformations have been suggested andapplied successfully for transport in single channels,e.g. by [21-24] using the method of Talbot [25].
3 Single ChannelIn this section we discuss transport in a singlechannel. The time dependent balance equations in thechannel and the surrounding rock matrix are given,together with the boundary conditions, and theLaplace transformed equations.
3.1 Time Dependent Balance Equations
We consider a single rectangular channel of length Lin the z direction. The channel is filled with a porousmedium, the infill of the channel, with flow porositye^-. Water flows with constant velocity (qf IZf) ez
through the channel where q/\s the specific discharge
of the channel. Cf (z;t) denotes the nuclide con-
centration in the flowing water of the channel. The
channel is surrounded by a rock matrix with porosity
zp where the pores are filled with stagnant water.
Transport of nuclides is described by the balanceequations in the (one-dimensional) flow path
3, Nf (z;t) = -Azdz Jf (z;t)-2Jp (x=b,z;t) (8)
for the content of nuclides Nf = VfRftfCf\x\ the
flowing water in a small volume elementVf = AfA.z of the channel. Af =4bxby is the
crossection of the channel, cf. Fig. 1.
area 1 e.
Fig. 1: Sketch of a crossection through a parallel platechannel with an adjacent rock layer accessible formatrix diffusion. Thickness of the water conductingfeature is 2bx. Thickness of the rock matrix below
and above the water conducting feature, that isavailable for matrix diffusion, is dr
The retardation factor fkdesribes the effect of linearJ
sorption of nuclides on the infill and the walls of thechannel. Assuming advection dominated transportand thereby neglecting dispersion within the channelyields the nuclide flow
= QfCf(z;t) (9)
where Qf = Af qf is the discharge of the channel.
The nuclide transport in the rock matrix is describedby the balance equations
dt Np (x,z;t) = -Axdx Jp (x,z;t) (10)
for the content of nuclides Np = VpRpep Cp in the
surrounding rock matrix in a small volume elementVp =Ap Ax; there the area Ap = 2bxAzCp is
the nuclide concentration in the pore water. Theretardation factor Rp describes the effect of linear
sorption of nuclides on the rock. The nuclide flow
Jp=-ApzpDpdxCp (11)
in the rock matrix is diffusive. Jp(x=b,z\t) gives
the nuclide flow between flowing water and thestagnant water of the surrounding rack matrix.
For the balance equation in the flowing water, asboundary condition the nuclide flow at the inlet of thechannel Jf(in;t) is given. At the interface of the
channel to the rock matrix, the continuity condition
is assumed. This means that the entire pore volume isconnected. For the limited matrix diffusion considered
59
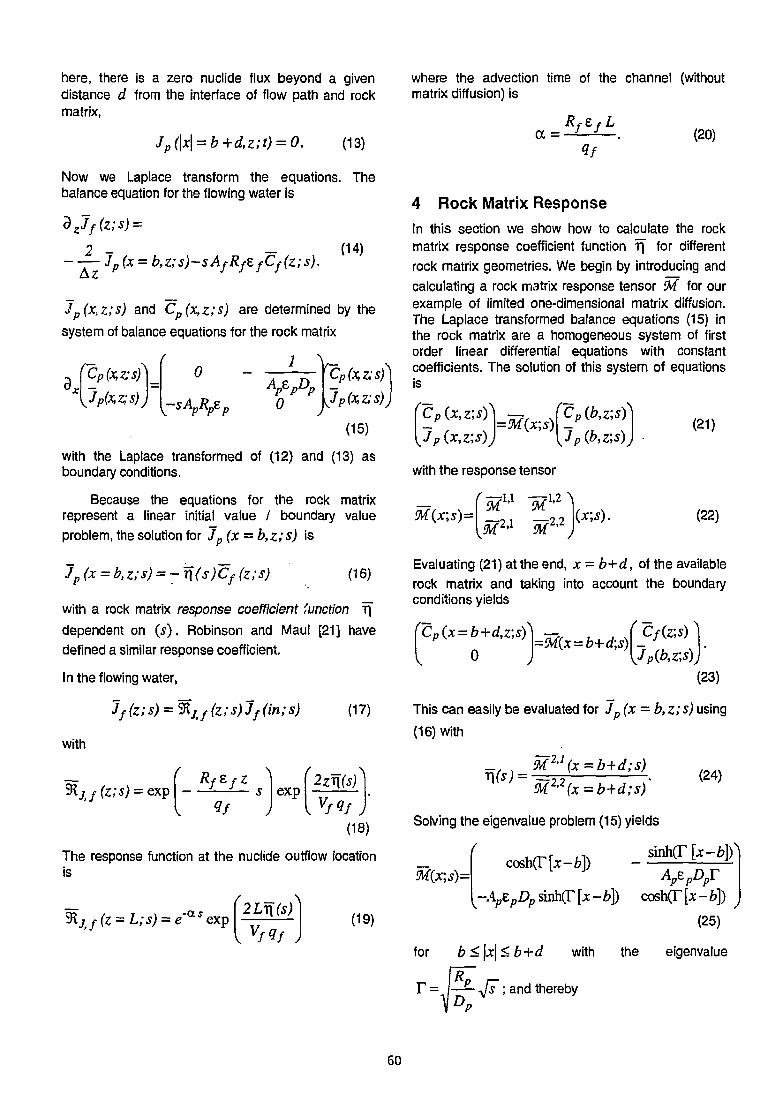
here, there is a zero nuclide flux beyond a givendistance d from the interface of flow path and rockmatrix,
where the advection time of the channel (withoutmatrix diffusion) is
Jp(\x\ = b+d,z;t) = O. (13) a= (20)
Now we Laplace transform the equations. Thebalance equation for the flowing water is
dz7f(z;s) =
2 - - (14)-—— Jp(x = b,z;s)~sAfRfZfCf(z;s).
lp(x,z;s) and Cp(x,z;s) are determined by the
system of balance equations for the rock matrix
a J -CP(x,z;s))
Jp(x,z;s))
0
{sApRpep 0
Cp(x,z;s)\
Jp(x,z;s))
(15)
with the Laplace transformed of (12) and (13) asboundary conditions.
Because the equations for the rock matrixrepresent a linear initial value / boundary valueproblem, the solution for Jp (x = b,z;s) is
Jp (x = b, Z;s) = -r\ (s)Cf (z;s) (16)
with a rock matrix response coefficient function J\
dependent on (s). Robinson and Maul [21] have
defined a similar response coefficient.
In the flowing water,
Jf(z;s) - Sf{jj(z;s)Jf(in;s)
with
(17)
{Vf1f J(18)
The response function at the nuclide outflow locationis
(19)]Vf4f J
4 Rock Matrix ResponseIn this section we show how to calculate the rockmatrix response coefficient function r\ for differentrock matrix geometries. We begin by introducing andcalculating a rock matrix response tensor SWf for ourexample of limited one-dimensional matrix diffusion.The Laplace transformed balance equations (15) inthe rock matrix are a homogeneous system of firstorder linear differential equations with constantcoefficients. The solution of this system of equationsis
(21){Jp(.x,z;s)J
with the response tensor
M(x;s)=\ _ 2 , 2 \(x;S). (22)
Evaluating (21) at the end, x = b+d, of the available
rock matrix and taking into account the boundaryconditions yields
o(Cf(z;s))
;s)\-
(23)
This can easily be evaluated for Jp (x = b,z;s) using
(16) with
(24)
Solving the eigenvalue problem (15) yields
/ sinhtrfc-fc])')M(x;s)=
cosh(T[x-b])
-ApEpDpsaih(r[x-b]) cosh(r[x-ö]) ̂
(25)
for b < \x\ < b+d with the eigenvalue
RF = I—— -J7; and thereby
D
60

(a) area 1 ez
, (26)
cf. also [21], For unlimited matrix diffusion, i.e.V(s)d » l,tanh(T(s)d) = 1 we get
(27)
4.1 Diffusion into Two Rock MatrixRegions
Unlimited and limited one-dimensional rock matrixdiffusion are the simplest cases of diffusion into rockmatrix. To demonstrate that our linear responseformalism is not restricted to these cases, we shortlyconsider two more complex geometries for ,ock matrixdiffusion. Let us begin with the case where there aretwo regions of rock matrix in series with differentproperties (ep,Dp, etc.). Fig. 2a shows the
geometry.
The first region may be considered as altered rock,while the second region as fresh rock. For this systemwe can define a rock matrix response tensor
^x(x;s) for the first region and Mz{x;s) for thesecond region. From assuming conservation of massand continuity of the nuclide concentration in the rockpore water at the interface x = b+d1, we can
directly define a rock matrix response tensor for theentire rock matrix
(28)
Figure 2: Sketch of a crossecticn through a parallelplate channel (a) with two rock layers in series, (b)with two orthogonal rock layers accessible for matrixdiffusion.
for (b < \x\ < b+dj) and
; s) = M2(x; s)Mj(b+dj;s) (29)
ior(b+dj <\x\<b+d}+d2). We can also definethe response coefficient function for this geometry[26]:
{APEPDPT\ [ tmh(T2d2)
[AptpDpY}2 t a n h O ^ ; (30)
{ApepDpTp}-+tanh (T1 d1) tanh(T2d2)
The procedure shown here can be applied to the caseof three or more rock regions in series accessible forone-dimensional matrix diffusion.
Let us now consider the case that nuclides can notonly diffuse in the x direction, into the surroundingrock matrix, but also in the y direction, as shown inFig. 2b. We can still use a rock matrix responsecoefficient function T\, but now we must define acoefficient function for diffusion in the x direction,r\x, as well as in the y direction, r\y, and
T\=nx + T\y (31)
61

5 Single Channel with Matrix Diffusion:Continued
Now we insert the above calculated rock matrixresponse coefficient function. For limited one-dimensional matrix diffusion, the channel responsefunction in Laplace space (19) is
j (z = L;s) = e s a exp ( -
(32)
which is characterized by the advection time (withoutmatrix diffusion) of the channel
a =RfzfL
(33)
the square root of the rock matrix diffusion time
(34)
and the square root of the rock matrix delay time
If(35)
The last parameter includes the surface to volumeratio
8 = (36)vf
which is equivalent to 5 y = l i b for the geometry
considered. We arrive at the time dependent channelresponse function
8 (t-a)L'1 {exp (-y Vs tanhfß-Js))}(t-a),(37)
where the inverse Laplace transformation has to beperformed numerically. 6 is the Heaviside jumpfunction. For more complicated rock matrixgeometries, only a numerical inverse Laplacetransformation is possible.
5.1 Unlimited Matrix DiffusionIn the case of unlimited matrix diffusion, ß—»°° and
according to (32) the channel response function inLaplace space is
j i f (z =L;s) = esa e x p ( - y (38)
and the time dependent channel response functioncan still be evaluated analytically:
•1-3/2(39)
As an aside, we mention that for a 5-function orshort, pulse-like nuclide inflow, a non-decaying nuclide
shows the typical t~3/2 finger print [5, 27] of(unlimited) matrix diffusion in the nuclide outflow ofthe channel:
3/2 (40)Jf(t) ~ [t-ay
for large times, 4(7-a] » y2.
6 Channel Network
For a network consisting of several pathways, but withonly one source location, we can now combine theindividual channel response functions to the networkresponse function.
6.1 Limited One-Dimensional Matrix Diffusion
For limited one-dimensional matrix diffusion, cf.Section 4, the network response function
%,}(hcf;t) =
where the inverse Laplace transformation has to beperformed numerically. The parametersan,w» ß«,>v. a p d Yn.w a r e determined according to(33), (34), and (35) for each channel (n, w) and
Nw
n=l
62

6.2 No Matrix Diffusion
If there is no diffusion of nuclides into the rock matrix,the network response function can be written in termsof the Dirac delta function 6 (f) as
Sljj(hcf;t)=w
(43)
The time dependent nuclide flow into the highconductivity fractures is
wJf(hcf;t) = J w , Jf(in;t-aw) (44)
w=l
This is similar to the result of the nuclide transportcalculations of [1,2] and a variant of [10], in which thissolution is approximated using a particle trackingmethod VJ\\U stochastically selected pathways.
6.3 Unlimited Matrix Diffusion
In the case of unlimited matrix diffusion, ß, , ,^-»0 0 ,
by argument analogous to that of Section 5.1, thetime dependent network response function can still beevaluated analytically as a superposition of thepathway response functions:
with (46)
n=l
As a qualitative demonstration of network effects, letus consider the network of Fig. 3a. It consists of 16channels which constitute 8 different pathwaysbetween the repository and a high conductivityfracture. Radioactive decay is neglected. Theweighted time dependent response functions of thepathways, ww5Ry,/;H>(zw = Lw;t), (thin lines) and
the network response function, <3iJj(hcf;t), (thick
line) are shown in Fig. 3b. In this example time hasarbitrary units. One pathway (dashed line in Fig. 3b),comprising of the channels (a,n,o,p), has a muchlarger advection time than the other pathways,resulting in a double-peaked, long-tailedsuperimposed breakthrough curve (or responsefunction of the network) in time space.
small network
0
I? 1bL
hcf
"ej ,
n\
3
A
•
d
7*1
0
/
8
10
*^g (
m
P
hcf
0.02
0.015 -
-c 0.01 -
0.005
1 1
: (b)
-
j
• i • i • i •
\ l
\ :\ \ _\ \\ \
\ ^W
N ^^^^
^ — p j20 40 60 80 100
t
Figure 3: (a) As an example a channel network issketched consisting of 16 individual channels whichmake up 8 different pathways between a repository, atin, and a high conductivity fracture, at hcf. Theweighted time dependent response functions of thepathways (thin lines) assuming unlimited matrixdiffusion and their superposition, the responsefunction of the network (thick line), are given in (b).One pathway (dashed line in (b)) consisting of thechannels (a.n,o,p) has a much larger advection timeresulting in a marked double-peaked break-throughcurve.
7 PICNIC: First Quantitative Tests of theCode
Based on the response concept a numerical code isdeveloped in collaboration with QuantiSci (UK). Thename of the code is PICNIC (PSI/QuantiSciinteractive Code for .Networks of InterconnectedChannels). PICNIC utilizes Talbot's method [25] fornumerical inverse Laplace transformation. In itspresent form the code can handle limited,homogeneous, one-dimensional matrix diffusion inparallel plate and tubular channels, but also micro-dispersion (for 3 different kinds of boundaryconditions), and decay of nuclide chains. Taking intoaccount for micro-dispersion means, that for thenuclide flow in the flowing water
63

r i i
L Pe J
a =2970762 {(^[year], ß2 = 4.872360 l(T2[year],
(47)
substitutes for (9). Pe is the channel Peclet number.For nuclide chains the response concept described inSection 2 still holds [19, 28], but a second rank tensorof response functions has to be calculated for thevector of nuclide flows of the different nuclides.PICNIC can also deal with tubular channels.
The code is now in the stage of verification. Totest the accuracy for a single channel, PICNIC resultsare compared in quantitative detail with results fromRANCHMD [29, 4-6]. In Fig. 4 the breakthroughcurves for two different channels are presented.
10' 2
10"3
10"4
d- 3 "
10,-s .
10-6 .
///
////;
iiii i
\\
/
//
s>
-
\\I i
10" 10-t [year]
Figure 4: Breakthrough curves of Strontium (case I,full line) and Uranine (case II, dashed line) arepresented in a double logarithmic scale. Adopted fromW. Heer.
The two cases simulate the dipole experiments in theGrimsel rock laboratory with Strontium (case I, fullline) and Uranine (case II, dashed line) over 5m. Totest the capability of the code for very short times fornuclide injection, the calculations assume injection ofJflQf= 31.25004 [mol/nrf3] over 1 minute, while in
the experiments the injection time was 1 hour. For adescription of the experiments and detailedquantitative modelling with RANCHMD, cf. Heer andHadermann [5, 27], especially [5, Tab. 6 and Chap.4.2.2, 4.3.3]. The parameters in the calculations forcase I are
a = 297076210"4 [year], ß2 = 44.1124[year],
Y2 = ail20528|>ar], Pe = 20.(48)
Since the rock matrix diffusion time ß2 is much largerthan the considered time interval, the system appearsto behave as if rock matrix diffusion were unlimited.But for case II there is no sorption in the rock matrix,thus reducing ß and y :
The agreement of PICNIC and RANCHMDcalculations for these two cases is excellent, cf. Tab.1. Further tests of PICNIC are on the way.
time
5 10"5
10-4
2 10-4
5 10-4
10-3
2 10"3
510"3
10-2
2 10-2
5 10-2
IO-1
2 10"1
5 10'1
1
max
case I.
OdO'11)
7.848 10'8
3.936 10"6
4.869 10"5
2.95310"4
4.943 10"4
4.838 10-4
2.641 10"4
1.26410-4
5.264 10"5
1.477 10"5
5.410 10"6
5.183 IQ"4
'max II 1.38 10-2
dev.
-4.24
-1.49
-0.65
-0.28
-0.17
-0.10
0.01
0.01
0.07
0.01
0.02
-0.03
case II.
0(10'10)
3.396 10-4
6.650 I C 2
6.037 10'2
1.031 10^2
2.669 10'3
5.791 10-4
2.137 10*4
1.091 10"4
2.582 10"5
2.349 10"6
1.921 10-8
1.302 10"1
3.0 10"4
dev.
-1.44
-0.19
0.08
0.01
-0.02
0.04
-0.01
0.02
-0.07
-0.33
-0.92
0.06
Table 1: Comparison of PICNIC and high resolutionRANCHMD calculations. In the first column, time isgiven in units of [yeai]. In the second and fourthcolumn the result of RANCHMD for JjIQf is given
in units of [mol/m3] for case I and case II, respectively.In the third and fifth column the relative deviation ofthe PICNIC results from the RANCHMD results arepresented. The two bottom rows give the maximum,max, and the time of the maximum, f , of the
breakthrough curve. For /max PICNIC and RANCHMD
agree within the resolution of the RANCHMD typeout.
8 Conclusions
This paper presents a linear response concept [30,26] for nuclide transport in a fracture network alongwith the rationale for developing a new model whichcalculates nuclide transport in a fracture networkmapped onto a channel network. Small-scale balanceequations are given which take into account theeffects of one-dimensional matrix diffusion in additionto advection and linear sorption in parallel platechannels. Radioactive decay of a single nuclide caneasily be incorporated. The results of transportcalculations in single channels are efficiently
64
combined using a linear response concept togetherwith the Laplace transformation method. Using a rockmatrix response tensor allows different geometries forrock matrix diffusion. For example, unlimited or limitedmatrix diffusion and the effect of more than one layerof rock matrix that can be accessed by matrixdiffusion, can be taken into account.
To more clearly present the linear responseconcept, this paper focusses on the effects ofadvection in combination with the importantgeosphere retardation effect rock matrix diffusion.However, in principle our linear response conceptworks for all linear effects with time independentparameters [30, 26]. The very efficient and fast linearresponse concept and numerical inverse Laplacetransformation [25, 21, 23] are used to build a newtransport code, PICNIC, that takes also account ofmicro-dispersion and decay of nuclide chains. [19, 28,31] In its present version PICNIC deals with limitedone-dimensional matrix diffusion in parallel plate andcylindrical geometry, but it is shown in Section 4 howto proceed to account also for more complex rockgeometries. While the tests of the new code areclearly in an early stage, first quantitative tests showan excellent accuracy of PICNIC when compared withresults from RANCHMD. The code is ready for firstapplications, however, getting site-specific transportparameters of a natural system for a network modelwill be a non-trivial task.
All in all, the new geosphere transport modelPICNIC shows best prerequisitions to be the newgeosphere transport code for Swiss safetyassessment of radioactive waste repositories,complementing RANCHMD. [32] The mainweaknesses of PICNIC are, that it cannot account fornonlinear effects, like nonlinear Sorption, and it cannotaccount for time dependent parameters, like waterflow or porosity. Main strengths of the very efficientand fast model are the flexibility of accounting for thelarge scale heterogeneity of the flow paths (networkeffects) and the small scale heterogeneity (variabilityand extension of the rock, that is available for matrixdiffusion). It will also be very useful for safetyassessments, that PICNIC can account for decay ofnuclide chains.
9 Acknowledgments
I wish to thank J. Hadermann, W. Heer, A. Jakob, andP. C. Robinson for valuable discussions. The PICNICproject has been established in cooperation withNagra and QuantiSci to provide a new geospheretransport model for Swiss safety assessment ofradioactive waste repositories. PICNIC is beingdeveloped in collaboration with QuantiSci and is beingcoded by QuantiSci. RANCHMD calculations wereperformed by W. Heer. Partial financial support byNagra is gratefully acknowledged.
References
[I] CACAS, M.C., E. LEDOUX, G. DE MARSILY, A.
BARBREAU, P. CALMELS, B. GAILLARD, and R.
MARGRITTA, Modelling Fracture Flow with aStochastic Discrete Fracture Network:Calibration and Validation, 2. The TransportModel, Water Resour. Res. 26,491-500,1990.
[2] DVERSTORP, B., J. ANDERSSON, and W.
NORDQUIST, Discrete Fracture NetworkInterpretation of Field Tracer Migration inSparsely Fractured Rock, Water Resour. Res.28,2327-2343,1992.
[3] GNIRK, P., Stripa Project 1980-1992, OverviewVolume II, Natural Barriers, Nagra TechnicalReport, NTB 93-42, Wettingen, 1993.
[4] JAKOB, A. , and J. HADERMANN, INTRAVALFinnsjön Test— Modelling Results for someTracer Experiments, PSI-Bericht Nr. 94-12,Würenlingen and Villigen, 1994; and NagraTechnical Report NTB 94-21, Wettingen, 1994.
[5] HEER, W., and J. HADERMANN, Grimsel TestSite, Modelling Radionuclide Migration FieldExperiments, PSI-Bericht Nr. 94-13,Würenlingen und Villigen, 1994; and NagraTechnical Report NTB 94-18, Wettingen, 1994.
[6] NAGRA (National Cooperative for the Disposalof Radioactive Waste), Kristallin-I, Safety-Assessment Report, Technical Report NTB93-22, Wettingen, 1994.
[7] BEAR, J., C. F. TSANG, and G. de MARSILY
(Edts.), Flow and Contaminant Transport inFractured Rock, Academic Press, San Diego,1993.
[8] BERKOWITZ, B., Modelling Flow andContaminant Transport in Fractured Media, inAdvances in Porous Media, Volume 2, edited byM. Y. Corapcioglu, Elsevier, Amsterdam, p. 397-451,1994.
[9] HERBERT, A. W., Development of a TracerTransport Option for the NAPSAC FractureNetwork Computer Code, Harwell Report AEA-D&R-0023, Harwell, 1990.
[10] HERBERT, A. W., and G. LANYON, ModellingTracer Transport in Fractured Rock at Stripa,Stripa Project Technical Report Nr. 92-01,1992.
[II] GRINDROD, P., A. W. HERBERT, D. ROBERTS, and
P. C. ROBINSON, NAPSAC TechnicalDocument, Stripa Project Technical ReportNr. 91-31, 1991.
65

[12] NORDQUIST, A. W., Y. W. TSANG, C. F. TSANG,
B. DVERSTORP, and J. ANDERSSON, A VariableAperture Fracture Network Model for Flow andTransport in Fractured Rock, Water Resour.Res. 28, 1703-1713,1992.
[13] FOSTER, S. S.D., The Chalk GroundwaterTritium Anomaly — A Possible Explanation,J.Hydrol. 25, 159-165, 1975.
[14] GRISAK, G. E., and J. F. PICKENS, SoluteTransport Through Fractured Media: 1. TheEffect of Matrix Diffusion, Water Resour.Res. 16,719-730,1980.
[15] NERETNIEKS, I., Diffusion in the Rock Matrix: AnImportant Factor in Radionuclide Retardation?,J. Geophys. Res. S 4379-4397,1980.
[16] TANG, D. H., E. O. FRIND, and E. A. SUDICKY,
Contaminant Transport in Fractured PorousMedia: Analytical Solution for a SingleFracture, Water Resour. Res. 17,555-564,1981.
[17] KÜPPER, J. A., F. W. SCHWARTZ, and P. M.
STEFFLER, A Comparison of Fracture MixingModels, 1. A Transfer Function Approach toMass Transport Modeling, J. Contain. Hydrol.18,1-32,1995a.
[18] KÜPPER, J. A., F. W. SCHWARTZ, and P. M.
STEFFLER, A Comparison of Fracture MixingModels, 2. Analysis of Simulation Trials,J. Contam. Hydrol. 18, 33-58,1995b.
[19] BARTEN, W., Input File and Fundamentals forthe First Phase of PICNIC, PSI internal report,TM-44-95-01, Würenlingen and Villigen, 1995.
[20] HADERMANN, J „ Radionuclide TransportThrough Heterogeneous Media, Nucl.Technol. 47, 312-323,1980.
[21] ROBINSON, P.C., and P.R. MAUL, Someexperience with the numerical inversion ofLaplace transforms, Math. Eng. Ind.111-131,1991.
[22] HODGKINSON, D. P., and D. A. LEVER,
Interpretation of a Field Experiment on theTransport of Sorbed and Non-sorbed Tracers
3,
Through a Fracture in Crystalline Rock,Harwell Report AERE-R 10702, Harwell, 1982.
[23] WORGAN, K., and P. C. ROBINSON, CRYSTAL:A Model of Contaminant Transport in aDensely Fissured Geosphere, Intera InternalReport, 9105-1, Henley-on-Thames, 1992.
[24] ROBINSON, P.C., Approaches to Modelling MatrixDiffusion in More Complex Geometries, InteraInternal Report, IM3803-1, Henley-on-Thames,1993.
[25] TALBOT, A., The Accurate Numerical Inversionof Laplace Transforms, J. Inst. Maths Applies 23,97-120,1979.
[26] BARTEN, W., Linear Response ConceptCombining Advection and Limited Rock MatrixDiffusion in a Fracture Network TransportModel, preprint, 1995.
[27] HADERMANN, J., and W. HEER, The GrimselMigration Experiment: Integrating FieldExperiments, Laboratory Investigations andModelling, J. Contam.Hydrol., 1995, in print.
[28] ROBINSON, P.C., Technical Issues for theDevelopment of PICNIC, Henley-on-Thames,1995; PICNIC Version 1.0, Technical Details,Intera IM4286-1 Version.2,.Henley-on-Thames, 1995.
[29] JAKOB, A., J. HADERMANN, and F. RÖSEL,
Radionuclide Chain Transport with MatrixDiffusion and Non-Linear Sorption, PSI-Bericht Nr. 54, Würenlingen and Villigen, 1989;and Nagra Technical Report, NTB 90-13,Wettingen, 1990.
[30] BARTEN, W., Konzept eines linearen Respons-Modells für Transport in einem Kluftnetzwerk,PSI internal note, AN-44-94-11, Würenlingenund Villigen, 1994.
[31] BARTEN, W., and P. C. ROBINSON, in
preparation.
[32] SCHNEIDER, J., The PICNIC Project:Geosphere Parameters, Nagra internal note,AN 95-147, Wettingen, 1995.
66

ENVIRONMENTAL INVENTORIES FOR FUTURE ELECTRICITY SUPPLY SYSTEMSFOR SWITZERLAND
R. Dones, U. Gantner, S. Hirschberg
Systems/Safety Analysis Section
Abstract
The Swiss Association of Producers and Distributorsof Electricity (VSE) identified a number of possiblesupply mix options to meet the future electricitydemand in Switzerland. In this context, PSI, in co-operation with ETHZ, analysed environmentalinventories for the selected electricity supply systems.Life Cycle Analysis (LCA) was used to establish theinventories, covering the complete energy chainsassociated with fossil, nuclear and renewablesystems. The assessment was performed on threelevels: (1) individually for each system considered;(2) comparison of systems; (3) comparison of supplymix options. In the absolute value the emissions of themajor pollutants considered are reduced incomparison with the currently operating systems, inmost cases very significantly. Due to the considerableadvancements in fossil power plant technologies, therelative importance of other activities in the fossilenergy systems increases. Selected results forsystems and supply options are given in the presentpaper.
1 Background
Since 1991, the Swiss Federal Institute ofTechnology Zurich (ETHZ) and Paul Scherrer Institute(PSI) have been engaged in a co-operationconcerning the establishment of comprehensiveenvironmental inventories (i.e., material and energyrequirements and emissions) for different fuel chains.The approach used in this context is based on the LifeCycle Analysis (LCA). In the first phase of this work,currently operating Swiss and UCPTE1 electricitysupply and heating systems were assessed [1],Present activities in this area, pursued within theproject "Comprehensive Assessment of EnergySystems" — Project GaBE "GanzheitlicheBetrachtung von Energiesystemen" [2], [3] —address, among other topics, environmentalinventories associated with future alternativeconfigurations of the Swiss electricity supply. The fullanalysis is reported in [4]. The project was supportedby VSE (Verband Schweizerischer Elektrizitätswerke).The results were used by VSE as the environmentalanalysis part in a study of future supply options forSwitzerland [5].
2 Future electricity supply mix options
The current domestic Swiss electricity supply isprimarily based on hydro power (approximately 61%)and nuclear power (about 37%). The contribution offossil systems is, consequently, minimal (theremaining 2%). In addition, long-term (but limited intime) contracts exist, securing imports of electricity ofnuclear origin from France. The total yearly netelectricity generation by domestic power plants in thehydrological year 1993/1994 was 62.9 TWh; thedomestic demand was 51.0 TWh (including7% losses). During the last two years, the electricityconsumption has been almost stagnant, although the80s recorded an average annual increase rate of2.7%.
The future development of the electricity demandis a complex function of several factors with possiblycompeting effects, like increased efficiency ofapplications, changes in the industrial structure of thecountry, increase of population, further automation ofindustrial processes and services. Under the basicassumption of economic growth, two possibleelectricity demand level cases were postulated byVSE: a high-growth demand case corresponding to ayearly increase of 2% from year 1995 to year 2010and 1% from year 2010 to year 2030, and a low-growth demand case corresponding to a yearlyincrease of 1% from year 1995 to year 2010 and 0.5%from year 2010 to year 2030.
The electricity generating systems whosecapacity, according to VSE, is either secured or likelyto grow are herewith referred to as the "base" supply.In the time horizon envisaged, it is dominated byhydropower plants (87.3%) with much smallercontributions from combined heat-and-power plants(CHPP, 5.1%), small gas turbines (30 MW GT, 2.7%),what remains at that time of the already securedcontracts with foreign utilities (nuclear plants, 4.5%),besides photovoltaics (PV) and other renewables(0.4%)2. Communal waste incinerators are expectedto contribute marginally to the electricity generation inSwitzerland. They have not been included in theanalysis because, according to our chosenmethodology, the emissions from waste incineratorsare allocated to the origin of the waste rather than tothe electricity which is a by-product.
1 Union pour la Coordination de la Production et du Transport deI'Electricite.
2 VSE assumes a constant annual growth of electricity generatedby renewables by 4 GWh per year, which is the present (1994)total generation in Switzerland.
67

Due to decommissioning of the currentlyoperating nuclear power plants and expiration of long-term electricity import contracts there will eventuallyopen a gap between the postulated electricity demandand the base supply. The assumed projected demandcases as well as the secured yearly electric energysupply are shown in Figure 1 for the period of interest.
1990
irnrm Mxlear (Imported)Actual Demand
2000 2010Year
I Fossil
2020 2000
fSSSl Njdear (Cfcrrestic)- - • HcfvGwthDerrsid
Fig. 1: Electric energy demand cases consideredby VSE and the secured yearly electricitysupply for the period 1995-2030.
Supply systems
Base
Supply
Supply tocover gap
Total
Hydro
Nuclear(imported)
CHPP
GT 30 MW
Incinerators
Photovoltaicand other
renewables
Total forBase supply
7 Options forsupply mix
Annual electricenergy
generation
(TWh)
33.54
1.71
1.961.03
0.57
0.14
38.4(38.95)"46.2 H27.2 L
84.5 (85.1)" He5.6(66.S)"L
Annual share to total{%)
H = high-growthdemand
39.7
2.0
2.3
1.2. „ *
0.2
45.4
54.6
100
L = low-growthdemand
51.1
2.6
3.0
1.6*
0.2
58.5
41.5100
* Excluded from LCA study.•* Including incinerators.
Table 1 : Electric energy demand cases, basesupply and supply gap assumed by VSEfor year 2030.
The yearly electric energy demand for the twocases assumed by VSE for year 2030 is shown inTable 1 where the systems considered for the basesupply are separated from the ones covering the gap.
VSE defined seven options to cover the expectedgap, specified in terms of mixes with differentcontributions from fossil, nuclear and renewable (inparticular PV) plants; in this context a distinction wasalso made with respect to shares of domestic andimported electricity. The definition of the supply mixoptions assumed by VSE to cover the electricity gapis given in Table 2.
Gas and hard coal power plants were identifiedby VSE as the possible options for fossil systems.Specifically, gas Combined Cycle (CC) power plants(with the option of using oil as the alternative fuel) andadvanced hard coal power plants burning high-qualitycoal (Pulverized Coal Combustion Plant, PC;Pressurized Fluidized Bed Combustion Plant, PFBC)are considered as the most suitable candidates for thefossil systems. Moreover, the specific technologieschosen for new nuclear were limited to two typicaladvanced nuclear power plant designs (AP600 andABWR).
Cogeneration was included to a relatively smallextent, in connection with small gas turbines andCHPPs but not for the gas combined cycle powerplants. According to VSE, this assumption issupported by the low economic potential ofcogeneration. An existing CHPP of 160 kWe operatingin Base! since 1987 was analysed. For photovoltaicsystems only roof panels were considered in theanalysis, being the most attractive option for the
Supply mix options
1
2
3
4
5
6
7
Conventional thermal
Nuclear
Mix Nuclear/Gas
Import 100%
Import 50%
Conventional thermal+ PV
Mix Nuclear/Gas+ PV
System shares in the coldseason to cover the gap of
electric energy
50% CC(gas); 25% CC(oil);25% Coal
100% Nuclear domestic
Today's installed nuclearcapacity; rest of supply CC(gas)
10% CC(gas); 30% Coal;60% Nuclear
Import: 10% Coal;40% Nuclear.
Domestic: 25% CC(gas);25% Nuclear.
as Option 1 with PV substituting5%
as Option 3 with PV substituting5%
Table 2: Definition of the supply mix optionsassumed by VSE to cover the futureelectricity gap.
Swiss conditions. The advanced technologiesconsidered are in some cases expected to becommercially available in the not very distant future,while in some cases they represent the bestperformance available already today. Thus, norevolutionary technologies were included. Thisreduces the speculative element in the analysis andmakes it more conservative, defensible and possiblyrealistic. Basically, the performance parameters
68

chosen should in most cases be representative fortechnologies that could be implemented on a largescale between 2010 and 2020.
3 Analysis approach and its limitations
LCA is process-oriented, involving explicitconsideration of the individual technologies of interest.Complete energy chains are covered and all systemsare described on a "cradle to grave" basis, with eachstage in the chain being decomposed intoconstruction, operation and dismantling phases.
Not only direct (concentrated) emissions from theplants are covered but also indirect ones (so-calledgrey or diffuse), in order to provide an as complete aspossible description of the fluxes from and to theenvironment. Input of materials, transportation needsand disposal services are considered in connectionwith all steps of an energy chain; also constructionmachines and materials for road and rail infrastructureare included in the analysis. These were based oncurrent conditions, without extrapolation to the future.
With respect to spatial boundaries all energy andmaterial fluxes are accounted for, regardless ofgeographic or political boundaries; this stems from theLCA methodology which, when consistently applied,covers the whole energy chain from the stage ofextracting raw materials from the environment downto the end point of emissions to the environment.
The previous analyses of energy systemscurrently in operation [1], combined with informationon the development trends, allowed to focus thepresent work on parts of the energy chains which aresubject to major changes. These are: for the gassystems the transport of natural gas and the powerplant; for coal systems, mining, coal transport andpower plant; for nuclear systems, mining/milling,enrichment, power plant, and reprocessing; for hydrosystems the power plant; and, for photovoltaicsystems the manufacturing of solar cells.
For the different energy chains the mostimportant changes in relation to the existing analysisof currently operating systems were:
• Gas systems: reduction of gas leakage,improvements of power plant burner performancecharacteristics and of overall power plantefficiency;
• Hard coal systems: partial methane recovery inunderground mining, improvements in power plantabatement technology and of overall power plantefficiency;
• Nuclear systems: reductions of long-term radonemissions from mine/mill tailings, reductions ofelectricity consumption and CFC emissions inenrichment by replacement of diffusion bycentrifuges or laser technologies, power plantimprovements (particularly life time extension and
increased burn-up), use of actual emissions from amodern reprocessing facility, reduced volume ofconditioned radioactive solid wastes;
• Hydro systems: overall power plant efficiencyimprovements (turbine); and,
• PV systems: improvements in the manufacturingof monocrystalline-silicon (m-Si) and amorphous-silicon (a-Si) solar cells (yield, electricityconsumption) and in cell efficiencies.
The LCA methodology has been developed forand primarily applied to operating systems.Consequently, the input is normally based on theactual experience. Furthermore, the standardapproach is static and its applications to futuresystems require extensions, extrapolations and anumber of additional assumptions. The extension ofthe existing data to include and characterise newtechnologies was based on literature, directinformation from the industry and consultants, and onexpert judgement. Availability of relatively detailedprocess information and knowledge about the relativeimportance of the various sources of emissions madeit possible to focus the analysis and economise theuse of our resources. In view of the objectives of theproject the parameters of primary interest were:emissions, efficiencies, material amounts (forconstruction and operation), and transportationrequirements.
When a range of possible emissions, efficienciesor other key parameters was available, the valuescorresponding to the best performance were normallychosen. When in doubt, conservative rather thanspeculative values were applied. It is inevitable in thistype of analysis that a mixture of data must be used,although an effort was made to be as consistent aspractically possible under the constraints of thisproject.
The "new" systems generally show betterperformance and lower emissions than the "old" ones.For this reason, it was necessary to makeassumptions with respect to the market penetration ofthe "new" systems, in order to establish the relativeshares of "old" and "new" systems within the mixes;this was done individually for each energy source,taking into account its specificity and the expecteddevelopments.
The focus of this work was on selectedemissions to air (CO2, CH4, SOx, NOx, Non-MethaneVolatile Organic Compounds (NMVOC), particles andradioactivity), and on materials/energy requirements.Emissions to water, solid wastes and land use havenot been treated in detail for all future systems(detailed results exist for currently operating systemsin [1]).
The work performed addresses only theinventory of emissions. Therefore, the data presentedhere give no direct information about the
69

environmental impacts that may result from theemissions.
The analysis addresses the emissionsassociated with the normal operation of the systemsanalysed. n nis includes also expected releases inconnection with incidents but excludes large releasesthat could result from rare severe accidents.
The demand-side management is implicitlyreflected in the demand levels provided by VSE as aninput to this work. Here, only the production of energycarriers and their use in energy systems is covered.
No new processes for material production(except for the solar cell manufacturing) and no newmeans of transportation were considered. Thisintroduces a definite conservative bias, although forthe basic materials the efficiency of the currentprocesses is considered to be high. On the otherhand, the possibility that extraction of raw materialsmight become more difficult due to reduced availabilityof easily accessible ones (and lead to more extensiveenvironmental burdens), was not taken into account.
For CHPP no extrapolation was made to accountfor the potential future improvements of the technicaland environmental performance; furthermore, only agas-based CHPP system was analysed.
The final requirements and emissions reported in[4], although based on the conditions assumedspecifically for the Swiss electricity supply, are notrestricted by geographical boundaries. Theadjustment to Swiss-specific conditions applies to thefuel origin and quality, materials production, electricitymixes, infrastructure, transportation, etc.
For electricity inputs needed for the modulesexternal to Switzerland, a UCPTE mix for year 2010was defined, based on the extrapolation of a forecastby the International Energy Agency for year 2005 [6].As compared to the current situation the mix reflectsthe expansion of gas, reduction of oil shares and arelatively small but significantly increased contributionof photovoltaic. Coal, hydro and nuclear remain onabout the same level. All material production is basedon this UCPTE mix. Also for Switzerland a mix foryear 2010 was used as an input; this mix wasprovided by VSE and includes a large share ofimported electricity of nuclear origin.
The environmental inventory analysis wasperformed on three levels: (1) individually for eachsystem considered; (2) comparison of systems;(3) comparison of supply mix options. The evaluationsof the seven options were carried out only for the year2030. This choice of year provides the upper limitsthat can be calculated for the yearly emissions fromthe whole electricity sector in the time intervalconsidered.
4 Systems comparisons
The values for the systems were normalised bythe unit of electricity produced at the busbar by the
power plant (or device) of the same system, i.e.distribution lines were not included in thecomparisons. If the distribution lines had beenincluded, CHPP and PV, which are deliveringelectricity directly to the appliances would, incomparison with the other systems, exhibit asomewhat improved environmental performance.CHPP is included for completeness but care shouldbe taken in drawing conclusions for this particularsystem.
The characteristics compared in [4] includeselected energy, material requirements, and selectedemissions to air.
Table 3 at the end shows selected directemissions from future power plants as well asnumerical results calculated for the full chains. In thefollowing, only greenhouse gases (GHG), SOx, NOx,and radioactivity emissions to air will be brieflydiscussed as examples of results obtained for thesystems. Even when full energy chains areconsidered, fossil-based systems exhibit the largestemissions of combustion products. Among them, thechain associated with gas combined cycle plants isclearly the best performer. Use of oil as a fuel in thistype of plant results in a quite dramatically larger SOxemissions from the power plant itself as well as fromthe associated oil chain, while emissions of suchpollutants as NOx increase to levels comparable withthose from the hard coal fuel chain.
Direct GHG emissions from power plants andthe total from the full chains are shown in Figure 2 interms of tonnes of CO2-equivalent calculated usingthe warming potentials recommended byIPCC1994[7]; they include CO2, CH4, N2O, CF4,CFCs, HCFCs, and HFCs3. The figure shows thedirect emissions from the power plants separate fromall other contributions.
The lowest value for the fossil systems has beencalculated for CC fired with gas, the highest for thecoal systems. The fossil power plants are by far thehighest contributors to the total (78-88%), where thelowest share has been found for CHPP, the highestfor PFBC. A PFBC power plant produces directlyabout twice as much t(CO2-eq.)/GWh as a CC powerplant fuelled by gas. Renewable and nuclear systemsshow the lowest GHG emissions; these are almostentirely originating from indirect sources as well asfrom upstream/downstream steps and only innegligible quantities from the power plants
3 The CO2-equivalent is based on the Global Warming Potential(GWP) relative to carbon dioxide with 100 year time horteon. Inparticular: ChU has GWPioo=24.5; N2O has GWPioo=32O; CF-thas GWPi oo=63OO. It is assumed that CFCs are released asCFC-114 with GWPioo=93OO, HCFCs are released as HCFC-22with GWPIOO=1700, and HFCs are released as HFC-134a withGWPioo=1300. The GWPs of CFCs and halons take into accountdirect effects only. The indirect effects through stratosphericozone depletion, which tend to strongly reduce their GWPs, werenot considered.
70

themselves. These systems release one to two ordersof magnitude lower GHGs than the fossil systems.
800
600
cr 400CD
O 200
04 mD From Chain
excludingPower Plant
I Direct fromPower Plant
" s S
Fig. 2:
elf I I°- ü ~~ £ C
Contribution of power plants to totalgreenhouse gas emissions from theanalysed future full energy chains.
As shown in Figure 3 for all analysed chains, thelargest contribution to total GHG emission is carbondioxide. The contributions of CFCs, HCFCs and HFCsare negligible. Emissions of CF4 (from aluminiumproduction) contribute approximately 5-9% to the totalCO2-eq. for photovoltaic systems and are negligible forother energy systems. The only system whichgenerates a substantial N2O contribution relative tothe total CO2-eq. is PFBC, from the power plant(approximately 7%).
100%
80% f
60% -
40%]-
20%
0%
CFCs
CF4
N2O
fJH4
CO2
ü O £•
°- E 9.°- 8
(0CD
-ST iö 2 co rä
ir. 3 x o P-
gas systems, particularly CHPP (12.5%). This is dueto the assumption of higher methane leakage ratefrom the low-pressure grid for local natural gasdistribution which delivers gas to CHPP, as comparedto the high-pressure grid for regional distribution whichsupplies gas to other gas power plant types. Hardcoal systems show methane release values ofapproximately 5% of total CO2-eq., and gas systemsbased on turbines and CC about 6% (see Figure 3).Gas systems (except CHPP) show lower totalmethane emissions than coal systems due to theassumed values for the leakages in the long-distancetransportation of natural gas compared to the directemissions from coal mines.
Figure 4 shows a comparison of GHG emissionsfrom current European [8] and future Swiss-relevantfull energy chains. In particular, PV systems, whichwere assessed for Swiss conditions, are representedby four classes : large plants4; 3 kWpeak slanted roofpanels (load factor of approximately 10%) using m-Siand p-Si technologies5; and, a-Si roof panels, whichwere assessed only for future systems.
Future electricity generation systems based onfossil chains have the potential to reduce GHGsemissions by 35-50% in comparison with presentaverage UCPTE fossil systems, but remain thelargest GHGs producers (two orders of magnitudehigher than hydro and nuclear, one order higher thanPV). The relative importance of some specific GHGsemitted from fossil systems changes (e.g., dramaticincrease of N2O emissions from PFBC in the coalsystems). For PV systems there appears to exist apotential for reduction of GHGs emissions by a factorof 2 to 8 with respect to current systems (under Swissaverage conditions). CFC emissions from the nuclearfuel chain are expected to decrease dramatically dueto substitution in enrichment diffusion plants andincreasing share of the centrifuge and, possibly, laserplants.
Figures 5 and 6 show SOx and NOx emissionsto the atmosphere, respectively. Direct emissionsfrom the power plants are given separately from allother contributions. As expected, CC burning oilexhibits the greatest direct emissions of SOx at thepower plant (47% of the total) as well as from theentire chain. Coal systems and gas systems have thesecond and third highest emissions, respectively.
&
Fig. 3: Contribution of different species to totalgreenhouse gas emissions from theanalysed future full energy chains.
All the power plants considered give negligiblecontribution to the total methane emission. Thehighest relative contribution of methane to the totalCO2-eq. from the associated chain was calculated for
The value shown is an average between 1721(CO2-eq.)/GWhcalculated for the PHALK 500 kW plant at Mont Soleil, Jura,using m-Si panels with 13.7% load factor, and237 t(CO2-eq.)/GWh calculated for the SSW 100kWpeak plantalong the Swiss highway N13, using polycrystalline-silicon (p-Si)panels.
The values shown for current m-Si and p-Si systems areaveraged over ranges of 83-214 t(CO2-eq.)/GWh and135-270 t(CO2-eq.)/GWh, respectively.
71

10000
O
D"a>
CvJOO
1000 -:|=l*
100
10
cCD
•i,
III
—|.ni
11
-i,1•i1
I.
—(-
—r
WI1
1i1
—
—
\i9,
1-A•>!I|
—: 1
I1
*i
1
;
B
I
ii
—
oQ.
Coa
lH
ard
09;
• •
CL
rdC
o
Oil
Ö (0\\)
Ü
O
to
OO
oCO
a
0.Q-
o 3
ca
COQ .
Q.
CO
ICO
a
Q .CL
ICO
CL
iCO
Q .
3kW
CL
^ PresentSystems(1990)
• FutureSystems(2030)
Fig. 4: Greenhouse gas emissions from current and future full energy chains.
A PFBC power plant has very small sulphur oxidesemission compared to an advanced PC thanks to itsmode of operation; it will emit only approximately 8%of the calculated total from the associated full chain.The direct emissions from the gas power plant arenegligible compared to the other fossil systems (only2% of the total calculated for the gas chain).
1000
800-
600-
400-
200-
D From ChainexcludingPower Plant
I Direct fromPower Plant
Fig. 5: Contribution of power plants to total SOxemission to air for future systems.
As shown in Figure 6, the chain associated withPC shows the highest total emissions of nitrogenoxides (47% directly from the power plant), but the GTchain has the highest direct emissions of NOx fromthe power plant. A PFBC power plant has the lowestNOx emissions compared to the other fossil plants(only 14% of the total from the relevant full energychain). Among the gas systems, CC has the lowest
NOx. emissions from the power plant as well as thelowest total from the chain; GT plants emit about twothirds of the total emissions from the associatedchain. Oil and hard coal upstream steps showcontributions to total nitrogen oxides emissionscomparable with the direct ones from gas turbines.
800i
D From ChainexcludingPower Plant
• Direct fromPower Plant
p O •=• -5TCL CD n ro
0- u — o 2
Ü
CL ° -
Fig. 6: Contribution of power plants to total NOxemission to air for future systems.
Figures 7 and 8 show the emissions of SOx andNOx, respectively, divided into direct releases takingplace in Switzerland, direct external to Switzerlandand indirect (or "grey") ones. The direct emissionsinclude releases from the operation of power plants,mines and processing factories, transport systemsand building machines. The indirect emissions includeall releases associated with material processing,electricity consumption and infrastructure. For most
72
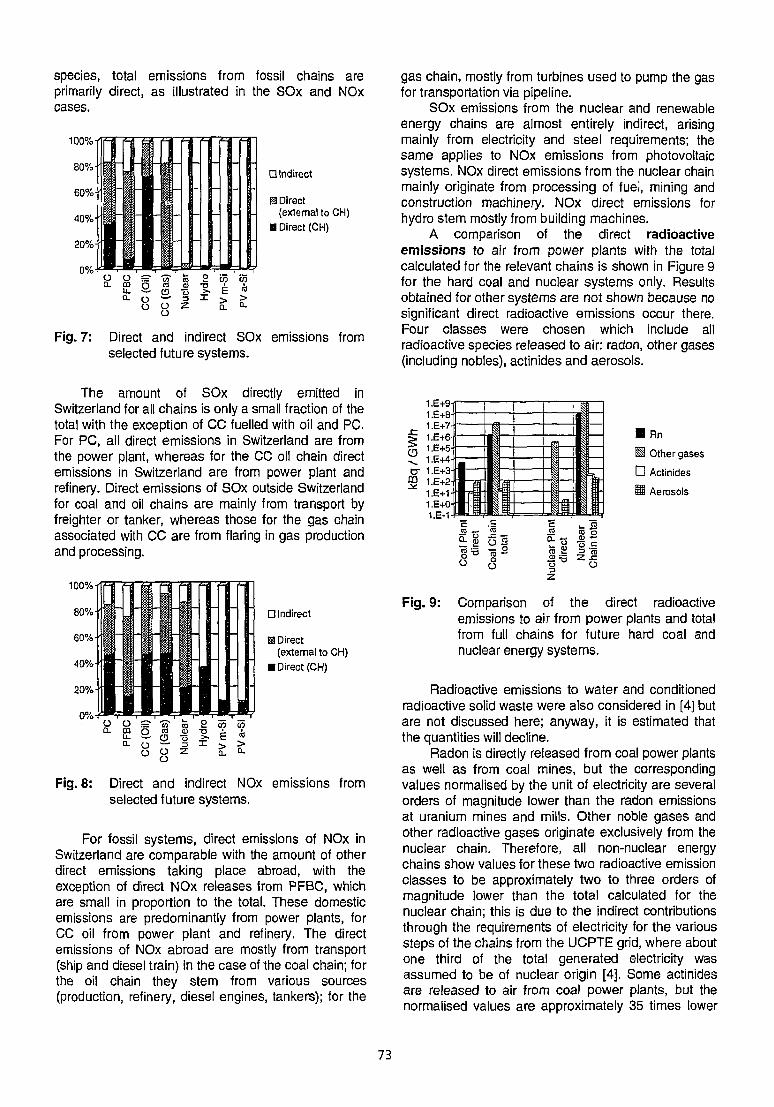
species, total emissions from fossil chains areprimarily direct, as illustrated in the SOx and NOxcases.
100% iff
D Indirect
@ Direct(external to CH)
B Direct (CH)
0%
Fig. 7: Direct and indirect SOx emissions fromselected future systems.
The amount of SOx directly emitted inSwitzerland for all chains is only a small fraction of thetotal with the exception of CC fuelled with oil and PC.For PC, all direct emissions in Switzerland are fromthe power plant, whereas for the CC oil chain directemissions in Switzerland are from power plant andrefinery. Direct emissions of SOx outside Switzerlandfor coal and oil chains are mainly from transport byfreighter or tanker, whereas those for the gas chainassociated with CC are from flaring in gas productionand processing.
D Indirect
E3 Direct(external to CH)
• Direct (CH)
Fig. 8: Direct and indirect NOx emissions fromselected future systems.
For fossil systems, direct emissions of NOx inSwitzerland are comparable with the amount of otherdirect emissions taking place abroad, with theexception of direct NOx releases from PFBC, whichare small in proportion to the total. These domesticemissions are predominantly from power plants, forCC oil from power plant and refinery. The directemissions of NOx abroad are mostly from transport(ship and diesel train) in the case of the coal chain; forthe oil chain they stem from various sources(production, refinery, diesel engines, tankers); for the
gas chain, mostly from turbines used to pump the gasfor transportation via pipeline.
SOx emissions from the nuclear and renewableenergy chains are almost entirely indirect, arisingmainly from electricity and steel requirements; thesame applies to NOx emissions from photovoltaicsystems. NOx direct emissions from the nuclear chainmainly originate from processing of fuei, mining andconstruction machinery. NOx direct emissions forhydro stem mostly from building machines.
A comparison of the direct radioactiveemissions to air from power plants with the totalcalculated for the relevant chains is shown in Figure 9for the hard coal and nuclear systems only. Resultsobtained for other systems are not shown because nosignificant direct radioactive emissions occur there.Four classes were chosen which include allradioactive species released to air: radon, other gases{including nobles), actinides and aerosols.
CD
m
£+9i£+8E+7-£+6H+5-E+4.E+3-E+2E+1-E+0.E-1
• RnH Other gases
D Actinides
B Aerosols
1Ü
c'co
O .2ooO
>- Bto o
£1o
Fig. 9: Comparison of the direct radioactiveemissions to air from power plants and totalfrom full chains for future hard coal andnuclear energy systems.
Radioactive emissions to water and conditionedradioactive solid waste were also considered in [4] butare not discussed here; anyway, it is estimated thatthe quantities will decline.
Radon is directly released from coal power plantsas well as from coal mines, but the correspondingvalues normalised by the unit of electricity are severalorders of magnitude lower than the radon emissionsat uranium mines and mills. Other noble gases andother radioactive gases originate exclusively from thenuclear chain. Therefore, all non-nuclear energychains show values for these two radioactive emissionclasses to be approximately two to three orders ofmagnitude lower than the total calculated for thenuclear chain; this is due to the indirect contributionsthrough the requirements of electricity for the varioussteps of the chains from the UCPTE grid, where aboutone third of the total generated electricity wasassumed to be of nuclear origin [4], Some actinidesare released to air from coal power plants, but thenormalised values are approximately 35 times lower
73

than the total assessed for the nuclear chain (mostlyfrom uranium mining/milling and reprocessing). Thetotal (direct plus indirect) release of actinides to aircalculated for the coal chain is about 1.5 times higherthan the release from coal power plants. Theradioactive aerosols release calculated for the coalchain is mainly due to direct emissions from the powerplant. The total release of radioactive aerosolscalculated for the coal chain is lower by a factor ofapproximately two than the corresponding total for thenuclear chain; however, the relative compositionsdiffer drastically (natural radioactive isotopes Po-210,Pb-210 and K-40 released during hard coalcombustion vs. radioactive isotopes of Cs, I, Ru, Srmostly from reprocessing of nuclear spent fuel,Po-210 and Pb-210 from uranium mines and mills).The highest contributors to the radioactive aerosolsfrom the nuclear chain are reprocessing andmining/milling, while the power plant contributes only1% (mostly iodine).
5 Comparisons of supply mix options
Imported electricity from nuclear and coalsystems is assumed to be generated by a mix ofpower plants of the current and future generations.The imported electricity by gas systems is fromcombined cycle power plants, assuming the samecharacteristics as for the Swiss plants. Given theseassumptions, the breakdown into contributions fromspecific electricity supply systems can be establishedfor the seven supply mix options considered.
Table 4 at the end provides selected numericalresults for the supply mix options considered.Generally, accounting for the full energy chains, theoptions with fossil systems show the highest releasesof typical combustion gases while the options withnuclear systems present the lowest. On the otherhand, the nuclear options exhibit the highestemissions of radioactivity. In the following, onlygreenhouse gases will be discussed; these are shownin Figure 10 for both demand cases. Other emissionfactors were also considered in [4].
The discussion is focused on the results obtainedfor the high-growth demand case options (labelledH1-H7) because they are qualitatively similar to thecorresponding options for the low-growth demandcase (L1-L7). If we exclude either option 3 or 5, therelative ranking is the same, whether based on low- orhigh-growth demand. However, if both 3 and 5 areincluded, option 3 ranks higher than 5 in thehigh-growth demand case but lower in the low-growthdemand case. This is due to the shares of nuclear
High-growthDemand
Low-growthDemand
Fig. 10: Greenhouse gas emissions for the 7 supplymix options of the high- and low-growthdemand cases in year 2030.
and gas systems to cover the gap in L3 which differfrom the corresponding values in H3. This factderives, in turn, from the definition of the optionnumber three, where it is assumed that in both low-and high-growth demand cases the presently installedtotal nuclear capacity is maintained, i.e. future nucleardomestic systems supply on the yearly basis thesame electricity as generated yearly by the currentSwiss nuclear power plants (and hence a fraction ofnuclear in H3 which is different from L3).
Figure 11 shows, for the high-growth case only,the direct emissions from power plants separate fromthe total. The "fossil" option H1 exhibits the highesttotal yearly emission of GHGs that originate from theentire chains of the various systems included. A totalGHG emission of 26.2 Mt(CO2-eq.)/yr is calculated forH1, of which 84% directly produced by the powerplants; 92% of the total is from the systems coveringthe gap. The "nuclear" option H2 shows the lowesttotal yearly production of greenhouse gases from therelevant whole chains. About 2.3 Mt(CO2-eq.)/yr areproduced in this option, merely 12% thereof are fromthe nuclear energy chain covering the gap.
• From ChainsexcludingPower Plants
H Direct fromPower Plants
H1 H2 H3 H4 H5 H6 H7
Fig. 11: Contribution of power plants to total GHGemissions for the 7 options of the high-growth demand case in year 2030.
74

The other options have intermediate values in therange 9.2 to 24.3 Mt(CO2-eq.)/yr (or 35% to 93% ofthe value calculated for H1). For these intermediateoptions, the contribution of the gap to the total(including the base) varies between 78% and 92%.Direct contribution from the fossil power plants to thetotal greenhouse gas emissions from all the relevantchains is between 65% and 84% for the different high-growth demand options.
Relative contributions of methane to total CO2-eq.are 5.5-9.5% for the various high-growth demandoptions. Relative contributions of N2O to the totalCO2-eq. are 0.1-2.4%. Emissions of CF4 have anegligible impact on the option-specific resultsbecause they contribute only with a small share to thetotal CO2-eq. for photovoltaic systems.
To put in perspective the calculated total GHGemissions from the electricity sector, the varioussupply mix options can be compared with thecorresponding present inventories for Switzerland.The total GHG emission from the current Swisselectricity mix calculated using LCA in [1] is nearly0.9 Mt(CO2-eq.)/yr, of which about 63% is from theenergy chain associated with the oil power plant inVouvry, which contributes only about 1.2% to the totalelectricity generated.
Figure 12 shows a comparison of the presentSwiss GHG emission inventory with LCA results forthe supply mix options for the high-growth demandcase in year 2030. The total emission inventory ofGHG actually within Switzerland was estimated as66.2 Mt(CO2-eq.)/yr in terms of CO2-eq. based onIPCC1992 GWPs[9], [10]. Using for consistencyIPCC 1994 GWPs, the total changes to approximately72.2 Mt(CO2-eq.)/yr. Therefore, the total GHG thatwould be emitted from the electricity sector (includingfull chains, inside and outside Switzerland) in the caseof the "fossil" option H1 in 2030 corresponds to about36% of the current total Swiss domestic GHGinventory.
80
ri-al§401Ü
141n
Lnrin n20- •
Present SwissGHG Inventory
1 2 3 4 5 6 7
BC02lromTraffic
0CO2fromHouseholds
m CO2 from Industry& Services
D Other GHG s
O Electricity SectorGap 2030, High-Growth Demand
• Electricity SectorBase Supply 2030
Fig. 12: Comparison of the present Swiss GHGemission inventory with LCA results for high-growth demand case options for year 2030.
The highest share of the present inventory isfrom carbon dioxide, 68% or 49.1 Mt(CO2)/yr.Halocarbons represent the second largest contributorat the level of about 19% (approximately14 Mt(CO2-eq.)/yr), but there is a trend towardssubstituting them in the near future with othersubstances that do not harm the stratospheric ozonelayer and whose warming potential might be lower.Methane contributes 8%, N2O 5% of the total (about5.8 and 3.4 Mt(CO2-eq.)/yr, respectively).
CO2 emissions in Switzerland originate primarilyfrom energy sources (91% or 44.6 Mt(CO2)/yr); theremaining contributions are from waste incineration(4%) and cement industry (5%). Of the energysources, 37% (16.5 Mt(CO2)/yr) stems from thetransport sector, 28% (12.5 Mt(CO2)/yr) fromhouseholds, 15% (6.7 Mt(CO2)/yr) from services and14% (6.2 Mt(CO2)/yr) from manufacturing industry [9].
6 Summary and outlook
It appears that, in the time span here envisaged,there will be greater improvements in fossil powerplant technologies than in the rest of the respectivechains. Therefore, the relative importance of otheractivities in the fossil chains as well as oftransportation and material processing increases. Asexpected, for all systems analysed the overallemissions of major pollutants are significantly reducedin the absolute sense. As with current systems, thehydropower chain exhibits the smallest emissions ofcombustion products, followed by nuclear and solar.The improvements in photovoltaic systems in relationto the performance of presently commerciallyavailable technologies are so far assumed to becomesignificant; of particular importance are the reducedelectricity requirements in the cell manufacturingprocesses, leading to the corresponding reductions of"grey" emissions. The radioactive emissions arenaturally highest for the nuclear fuel chain; however,the relative contribution of the power plant itself is inthis context very small.
The results of the systems analyses are clearlyreflected in the findings for the particular optionsconsidered. Supply options which include a significantshare of fossil systems (either as a domestic sourceor as a source of imported electricity) lead tosubstantial increases in the emissions of combustionproducts (in comparison with today). Nuclear-basedoptions are much more favourable in this respect.With respect to emitted radioactivity the nuclear-based options exhibit LCA-results that are one orderof magnitude higher than the ones associated with theother options.
In view of the limitations of the present analysisthe following LCA-specific extensions are of interestfor future activities:1. Overall and continuous database improvements.
75

2. Scope extensions: full coverage of emissions towater; consideration of some additional energysources (e.g. wind, biomass, geothermal) andtechnologies (e.g. fuel cells); inclusion ofrevolutionary processes (e.g. CO2 storage);consideration of possible further changes in theupstream steps of fossil chains; consideration offuture advancements in material processing andtransportation; analyses of additional scenarios.
3. Sensitivity analyses concerning uncertain butresult-driving factors.
4. Further disaggregation of results for energy chains.
5. LCA-based impact assessment according toenvironmental impact classes.
Other activities within the Project GaBE aim toprovide a multi-disciplinary perspective on the energyplanning for Switzerland, ultimately in an integratedmanner. These include:
• Scenario-based simulation of environmentalimpacts (primarily for fossil systems); thisapproach allows explicit modelling of thedispersion and chemical transformation of thepollutants and, consequently, goes far beyond thesimplified LCA-based impact assessment.
• Health effects of normal operation.
• Impacts associated with severe accidents.
• Economic consequences of environmental policies.
• Decision support.
References
[1] FRISCHKNECHT R., HOFSTETTER P., KNOEPFEL I.
(ETHZ-LES), AND DONES Pi., ZOLLINGER E. (PSI),"Ökoinventare für Energiesysteme —Grundlagen für den ökologischen Vergleich vonEnergiesystemen und den Einbezug vonEnergiesystemen in Ökobilanzen für dieSchweiz", 1st Ed., ETHZ/PSI, Zurich (1994).
[2] HIRSCHBERG S. ET AL., "Assessment of EnergySystems (Ganzheitliche Betrachtung vonEnergiesystemen - GaBE). Detailed Outline ofthe Project, 2nd Version", PSI (July 1993).
[3] HIRSCHBERG S., "Framework for and CurrentIssues in Comprehensive ComparativeAssessment of Electricity Generating Systems",Invited paper presented at the InternationalSymposium on "Electricity, Health and theEnvironment: Comparative Assessment inSupport of Decision Making", organised by EC,ESCAP, IAEA, IBRD, IIASA, OECD/NEA,OPEC, UNIDO, WMO, Vienna, 16-19 Oct. 1995(Proceedings to be published by IAEA).
[4] DONES R., GANTNER U., HiRSCHBERG S., (PSI),AND DOKA G., KNOEPFEL I. (ETHZ),"Environmental Inventories for Future ElectricitySupply Systems for Switzerland", PSI ReportNo. 96-07(1996).
[5] VERBAND SCHWEIZERISCHER ELEKTRIZITÄTSWERKE
(VSE), "Vorschau 1995 auf die Elektrizitäts-versorgung der Schweiz bis zum Jahr 2030",VSE, Zurich (Sept. 1995).
[6] OECD/IEA, "Energy Policies of IEA Countries,1993 Review", Paris (1994).
[7] HOUGHTON J.T. ET AL. (Eds.), "Climate Change1994 — Radiative Forcing of Climate Changeand An Evaluation of the IPCC 1992 IS92Emission Scenarios", Cambridge UniversityPress, Cambridge, UK (1995).
[8] DONES R., HiRSCHBERG S. (PSI), AND KNOEPFEL I.(ETHZ), "Greenhouse Gas Emission InventoryBased on Full Energy Chain Analysis", presentedin IAEA Workshop/Advisory Group Meeting "FullEnergy Chain Assessment of Greenhouse GasEmission Factors for Nuclear and Other EnergySources", Beijing, China, 4-7 October 1994 (to bepublished in IAEA TECDOC "Comparison ofenergy sources in terms of their full-energy-chainemission factors of greenhouse gases").
[9] Swiss FEDERAL OFFICE OF ENVIRONMENT,
FORESTS AND LANDSCAPE (BUWAL), "Report onthe Environment 1993 — The State of theEnvironment in Switzerland", EDMZ, Berne(1994).
[10] Swiss FEDERAL OFFICE OF ENVIRONMENT,
FORESTS AND LANDSCAPE (BUWAL), "Globale
Erwärmung und die Schweiz: Grundlagen —Umwelt-Materialien Nr.9: Internationales",BUWAL, Berne (1994).
76

Pollutant/Group
SOx
(kg/GWh)
NOx
(kg/GWh)
CO2-eq.
(t/GWh)
CH4a
(kg/GWh)
NMVOC
(kg/GWh)
Particles
(kg/GWh)
Radioactivity
(GBq/GWh)
ElectricitySystem
direct PP
full chain
direct PP
full chain
direct PP
full chain
direct PP
full chain
direct PP
full chain
direct PP
full chain
direct PP
full chain
PC
216
611
360
780
664
762
7
1612
14.3
148.6
36
1719
0.004
14.6
PFBC
34
425
68
482
679
771
7
1608
13.6
143.4
34
2103
0.004
14.6
CC
(Oil)
421
888
209
648
445
551
6
645
6.6
1347.1
1
221
0
7.6
CC(Gas)
3
153
119
278
331
392
18
921
10.2
105.0
1
88
0
1.3
GT
30 MW
4
209
414
626
456
540
32
1275
28
158.0
1
119
0
1.8
CHPP(1995)
5
281
186
445
532
679
216
3460
19.5
33i: 3
0
207
0
3.3
Nuclear
0
31
0
23
0
6
0
12
0
10.3
0
46
0.280
1014.1
Hydro
0
7
0
13
0
4
0
7
0
3.4
0
229
0
0.8
PV3kWpm-Si
0
157
0
69
0
44
0
78
0
53.9
0
164
0
22.5
PV
3kWp
a-Si
0
104
0
42
0
28
0
57
0
47.7
0
0.164
0
8.8
PP = Power Plant. Also included in CO2-equivalent. Total, obtained adding up the radioactive emissions without weighing factors.
Table 3: Selected emissions to air from future electricity supply systems included in VSE supplymix options for Switzerland [4].
Pollutant/Group
SOx
(1000 t/yr)
NOx
(1000 tyr)
CO2-eq.
(Mt/yr)
CH4a
(1000 t/yr)
NMVOC
(1000 t/yr)
Particles
(1000 t/yr)
Radioactivity11
(1000TBq/yr)
Emissionsfrom the
BaseSupply
1.1
2.0
2.0
8.3
1.0
8.3
1.8
Emissions from the Supply Mix Options
DemandCases
H
L
H
L
H
L
H
L
H
L
H
L
H
L
9
17.7
10.4
20.4
12.0
24.2
14.3
49.2
29.0
15.4
9.1
28.7
16.9
0.3
0.2
©
1.4
0.8
1.0
0.6
0.3
0.2
0.5
0.3
0.5
0.3
2.1
1.2
46.9
27.6
®
4.5
1.6
7.5
2.2
10,0
2.6
23.5
6.0
2.9
0.9
3.2
1.5
21.2
21.2
•
11.1
6.5
11.1
6.5
12,0
7.1
26.9
15.9
2.4
1.4
28.3
16.7
30.5
18.0
©
5.8
3.4
6.4
3.8
7.2
4.2
16.4
9.7
1.8
1.1
11.7
6.9
33.8
19.9
e
16.6
9.8
18.8
11.1
22.2
13.1
45.3
26.7
13.7
8.1
27.6
16.3
0.3
0.2
©
4.5
1.7
6.6
1.9
8.5
2.1
20.0
4.8
2.6
0.8
3.5
1.8
21.3
20.0
H = High-growth demand; L = Low-growth demanda Also included in CO2-equivalent.b Total, obtained adding up the radioactive emissions without weighing factors.
Table 4: Selected results for the yearly emissions to air obtained for the VSE-defined supply mixoptions for year 2030 (including full chains) [4].
77
NEXT PAQE(S}Be«
DEVELOPMENT AND ASSESSMENT OF A MODIFIED VERSION OF RELAP5/MOD3
G. Th. Analytis
Laboratory for Thermal Hydraulics
Abstract
We present a number of modifications introduced inRELAP5/M0D3 to address deficiencies identified dur-ing assessment of the code. The modified code is as-sessed against a number of separate-effect and inte-gral test experiments and in contrast to the frozen ver-sion, is shown to result in physically sound predictionswhich are close to the measurements.
1 Introduction
RELAP5/MOD3 (henceforth to be referred to as R5M3)is an advanced, best-estimate thermohydraulics com-puter code for analysis of transients and hypotheticalaccidents in Pressurized Water Reactors (PWRs). It isthe latest version in the series of RELAP5 codes de-veloped by the Idaho National Engineering Laborato-ries in the USA for the Nuclear Regulatory Commission(NRC) and is an off-spring of the RELAP5/MOD2 andMOD2.5; however, it differs from its predecessors in anumber of ways. The code is used both in the USAand in Europe and it is under continuous developmentand assessment. The aim of this effort is to provide atool for general application to PWR thermal-hydraulicstransient analysis. At present, however, deficienciesrestrict its range of application.
Recently, extensive assessment [1-4] of R5M3 [5,6]was pursued at the Thermal Hydraulics Laboratory atPSI and a number of model deficiencies and problemareas were identified. The most striking one was the in-ability of the code to even remotely capture the physicsof reflooding; this was due to a number of reasonswhich have been extensively elaborated upon else-where [1,7]. Consequently, a rather broad develop-mental program has been undertaken, and a number ofimprovements covering an extensive area were made
In this work, we shall report on the model changesand code modifications introduced into R5M3. Thesewill be summarized in section 2 and include a numberof items which we shall list and discuss. In section 3,we shall compare the predictions of the modified codewith the ones of the frozen version (by which we meanthe original unmodified code) as well as with measure-ments for a number of separate-effect and integral testexperiments and wherever possible, we shall discussthe origin of the differences in predictions. Finally, we
shall conclude in section 4 with some recommenda-tions.
2 Summary of modifications in R5M3
In this section, we shall briefly outline the code mod-ifications and model changes we found necessary tomake in R5M3.
(a) The modified Bestion interfaciaf shear correla-tion for bubbly/slug flow (which had been implementedin the MOD2.5 after our recommendations) was re-activated and used for pressures less than 10 bar [7-9];that is
65a(l-a)3/3g 2
Ji = 2) ' a 9 ~ ° l' ' '
where pg and Du are the steam density and hydraulicdiameter, respectively. The value of the distributionparameter Co is set equal to 1.2 For pressures greaterthan 20 bar, the EPRI interfacial shear correlation [5]already implemented in the code is used, and a lin-ear interpolation is used between the pressures of 10and 20 bar. There are a number of reasons for re-activating the modified Bestion correlation, one of thembeing that, as already shown in Ref.5, it results in verygood predictions for low pressures. In addition, recentwork has shown that the highly complex EPRI correla-tion, due to its dependence on a large number of localvariables which in a transient calculation are usually os-cillating, may induce an unacceptably large mass-error.Hence, although the EPRI correlation, due to the factthat it is a fit to a large number of data points, is boundto generally result in better predictions than other cor-relations, we would generally recommend employinga simpler bubbly/slug interfacial shear correlation forpipes, similar to the one used in codes like TRAC-BF1[10].
(b) In order to avoid vapour de-superheating, theaverage droplet diameter D'o defined via the Webernumber We was arbitrarily increased in R5M3 by thecode developers by first increasing We to 12 (in RE-LAP5/MOD2.5, it had the value of 3). Furthermore,the minimum allowed droplet diameter D'm in the post-dryout regime is defined (ad-hoc) as a function of the
79
pressure p as follows:
D'm = 0.0025 for p < 0.025,
D'm = 0.0025-4.444 (0.0025 - 0.0002) (p - 0.025)for 0.025 < p < 0.25,
D'm = 0.0002 for p > 0.25
(2)
p = p/pcri p is the pressure and pcr is the criticalpressure. Finally, th average droplet diameter Do usedis defined by
Do = (3)
where D'm is defined by (2). Hence, as can be seenfrom (3), for p < 5.4 bar Do is not allowed to be lessthan 0.0025 m. The droplet interfacial area per unitvolume Sdr is defined as [5,6]
(4)3.6 (1 - a)
bdr ~ Do •
In R5M3, the interfacial shear is proportional to Sdrand since the droplets are large (small interfacial area),in a number of situations, they cannot be lifted by thevapour. Hence, we set the Weber number back to3 and assumed a minimum Do of 0.0015m. Here, weshould emphasize that in a 2-fluid model code one can-not define an average droplet diameter since there isonly one liquid field. The assumed value of 0.0015m(which in itself may also be relatively high since the av-erage droplet diameters measured in FLECHT did notexceed 0.001 m) is based on a compromise and engi-neering judgement rather than on rigorous arguments.Furthermore, there are a number of other importanteffects induced by the presence of spacers (dropletsbreak-up, rewetting of spacers etc.) and which are notmodelled in R5M3.
(c) The logic for selecting the pre- or the post-CHFinterfacial closure laws in R5M3 is as follows: Onedefines
Tgs = Tg-Ts-l. (5c)
<xB is the void fraction for transition from bubbly toslug flow and Tg and Ts are the vapour and satura-tion temperatures, respectively. If now P is equal tounity, the code selects the post-dry out closure laws.This indirect selection logic is due to the fact that theinterfacial closure laws subroutines are not "commu-nicating" with the ones for the wall heat transfer, andone would like to have some consistency between thetwo (which, by the aforementioned indirect procedure,cannot always be achieved). We found that the def-inition of P' given by (5b) is too restrictive. Hence,we modified equation (5b) back (as it was defined inRELAP5/MOD2.5 [9] to,
P' = 1.0000454 (1 - e"0-5 T<"), (6a)
where now (as we modified it already in the past inRELAP5/MOD2.5) if the component in question is abundle,
Tgs = Tg-Ts- 29, (6b)
while otherwise, Tgs is given by (5c). This modifi-cation has a large effect on a number of predictions.The selection of the value 29 in the above equationwas made based on inspection of a number of pre-dicted void fraction profiles during reflooding which,with the original formulation, were exhibiting discon-tinuities near the quench front (QF) as in the case ofRELAP5/MOD2.5 [9]. Conceptually, a decrease (in-crease) of this value results in employing the post-CHFinterfacial closure laws at a lower (higher) vapour tem-perature.
(d) During reflooding calculations, if the wall heat fluxexceeds the critical heat flux (CHF), we implemented inthe code a heat transfer package based on the empir-ical wall-to-liquid heat transfer coefficient (HTC) usedin the French code CATHARE. We modified the heattransfer logic in a similar way we modified it for TRAC-BF1 [11]. For the post-CHF wall heat transfer regime,we first define
P = max 0, min(l, P'(0.4 - aB)10) (5a)
where P is defined by
P' = min(l, Pwind Tgs) (5b)
and Pwind = 2/30 for p < 1/40, Pwind = 1/60 forp > 0.25 and a linear interpolation is used betweenthese two values of p. Also,
where AZQF is the distance from the QF, hßR isthe original Bromley correlation and F(a) is a func-tion of a. Different values have been used for / j , /2and F(a) by the CATHARE developers; here, we usefx = 1400, h = 1880 and F{a) = min( l - a , 0.5).Subsequently, we define
80
(7b)
where now hpR is the Forslund-Rohsenowwall-to-droplets contact HTC [9]. Finally, we define thewall-to-liquid post-CHF HTC by
hwi = max (7c)
where hwi^B) 's the Weismann transition boiling cor-relation given by
wi(TB) =0.2
GRJ
We chose for the constant f=0.03 and [9]
2CHF- Ts
AT = TW- TCHF,
(8a)
(8b)
(8c)
where TCHF and Ts are the wall temperature atCHF and saturation temperature, respectively, G isthe total mass-flux and (7^=67.8 kg/m2/s. No ex-plicit TMIN is used in this formalism. Furthermore,we ramped the Weismann correlation linearly to 0 fordistances between 0.1 m and 0.2 m from the QF, ie
hw\(TB) - hwi(TB) f o r &ZQF < 0.1 "I, hwUTB) = 0for AZQF > 0.2 m, and a linear interpolation in be-tween. The reason for this is that we wanted to avoid"spurious" quenching of a node (eg. due to a high valueattained by (8a)) if the quench front is not in the vicin-ity of this node. This model should be applicable if theflooding velocities are not exceeding 0.2-0.3 m/s. Weremark that, in conjunction with the aforementioned ap-proach, one should, in principle, utilize a QF velocitycorrelation, and this is precisely the approach followedin CATHARE. Since our aim is to improve the phys-ical models in the R5M3 without (for the time being)introducing radical changes to its basic structure andphilosophy, we did not try to utilize such a QF velocitycorrelation. Note that as a result of (8d), "spontaneousquenching" is inhibited at locations remote from the QF.
(e) For the cases when the reflooding trip is not ac-tive, we implemented a different wall - to - liquid heattransfer package, which is similar to the one of TRAC-BF1 [10]. For this case, we define the wall-to-liquidfilm boiling HTC hwi by
where hw^BR) is the modified Bromley correlation.Additionally, we defined a TMIN and the transition boil-ing wall-to-liquid HTC (if Tw < TMIN) by the Bjornardquadratic interpolation between the CHF point and thefilm-boiling wall-to-liquid HTC hwi{FB) (= hwi{BR) ( 1 -o)) in the usual way [10,11]
J-VJ ~( 9 b )
where
r=TCHF -
(9c)
and all the symbols have their usual meaning. Forthe time being, we use a constant TMIN equal to 710K.
(f) It has been shown [1,2,7] that during transients,for low \G\, the Groeneveld look-up table CHF exhibitsoscillations which are fed back into the HTC, hence ad-versely affecting the predicted rod surface temperature(RST) histories. For this reason, for low mass-fluxes\G\, we modified the CHF qCHF in the code by settingqcHF = qzu f°r \G\ < 50 kg/m2/s, qCHF = 9GT for\G\ > 150 kg/m2 /s and using a linear inerpolationbetween these two values of \G\. qzu a nd qGr are themodified Zuber CHF and the CHF predicted from theGroeneveld tables, respectively.
(g) For post-dry-out situations (this includes low pres-sure reflooding), the droplet interfacial shear coefficientcdr is restricted in the code by the following erroneouscondition
cdr ~ mm(c<£r, 0.45)
instead of the intended condition
(10a)
cdr = rcLax(cdr, 0.45). (10b)
(h) The interfacial closure coefficients are "old-timeaveraged" (under-relaxed) in order to smooth largelydifferent values occuring during flow-regime transitions[5]. The scheme used for under-relaxing the interfacialshear and heat transfer coefficients can be summa-rized as follows: The new-time under-relaxed coeffi-<r<: nt fri+1 (where the subscript " i " stands for liquid orw oour) is defined by
Ji
fn\R(11)
Kl = ~ °0 (9a)
where /• is the explicitly evaluated interfacial coef-ficient, and the exponent R is a complicated functionof the phasic velocities, time-step, Courant limit, relax-ation time-constants etc. We have shown that these
81

schemes may lead to time-step dependent code pre-dictions [1]. Hence, as an option, we almost com-pletely eliminated the under-relaxation schemes by set-ting R = 0 in (11), except the one for the liquidinterface-to-liquid heat transfer which we kept as it isin the code if /:' > jf. We remr.rk that there may becases for which this elimination of the under-relaxationschemes might give problems and this might well bethe case with transients which are using relatively largetime-steps; hence, this procedure may not always bepractical.
(i) We have implemented (also as an option) a lin-earization procedure for the interfacial shear termsin the momentum equations (both for the semi- andnearly-implicit hydro-dynamic solution schemes; sub-routines vexplt and vimplt, respectively and alsojchoke). Briefly, in the code, the new-time (super-script n + 1) phasic velocities V*f£x and Vj1^ at
the junctions j + \ are solved in terms of, among othervariables, the old-time velocities (superscript n) Vn.,,
SJ+5
and V.71., i . The interfacial shear term fn+\ refers to
time-step n + 1 and is given by (in general)
where
\~OLCO
l - o *
(12a)
(12b)
The exponent q is an integer (in the case of RELAP5,q = 2), and Co and Cio are flow-regime dependentcoefficients. Hence, to be able to express the new-timevelocities in terms of the old-time ones, one has eitherto use a simple approximation for (14a), eg.
(and this is the assumption made both in R5M2 andin R5M3), or one can use a second order linearizationscheme as in TRAC-BF1 [10], (13) is a good approxi-mation provided
6V,R.j'riyn
RJ
(14)
where 6VR<j+i is the change in V ^ i during onetime-step. Hence, we shall adopt the more general lin-earization scheme and we shall linearize the interfacialshear term / n + \ to second order as follows:
',3+2
(15)
Clearly, in contrast to the approximation given by (13)which is valid provided (RA) c 1 (where (RA) isdefined by (14)), one can readily show that the ap-proximation given by (15) is valid for (RA)2 < 1 andhence, much larger changes of the phasic velocitiesbetween two successive time-steps are allowed with-out the danger of exciting numerical instabilities. Thismodification is bound to improve the numerical robust-ness of the code, either when the nearly-implicit solu-tion scheme is used, or when the semi-implicit methodis used with time-steps which are large and higher thanthe material Courant limit.
(j) A number of additional options have been intro-duced in the code like the Andersen's drift-flux-basedinterfacial shear correlations (as in TRAC-BF1 [10]),the first upwind scheme in the momentum equationsand the inclusion of the spatial derivatives in the virtualmass term. We shall not comment on these differentoptions here.
3 Comparison of code predictions
We shall now compare the predictions of the frozenand modified version of the code with measurementsfrom separate-effect and integral test experiments. Weshall present and discuss four different cases: A sim-ple constant inlet liquid velocity bottom flooding test ina heater rod bundle at PSI, the LOFT LP-LB-1 experi-ment [14], the LOBt SB-LOCA BL34 experiment and atwo loop commercial PWR LB-LOCA calculation [16].
We shall start by discussing the low flooding rateNEPTUN experiment Nr. 5036 (P = 4.1 bar, ATS =10 K, V/jv = 0.015 m/s) [13]. Other reflooding exper-iments were also analyzed with both versions of thecodes [1]. Fig. 1 shows the measured and predictedRST histories (A) and the predicted total HTC (B) atan axial elevation of 0.946 m. Clearly, the modifiedversion predicts the RST history very well, while thefrozen version of the code predicts a totally unrealisticand unphysical RST history. The main reason for thisis the unphysical modeling of the HTC during reflood-ing, as well as a number of other reasons related tothe unphysically low droplet interfacial shear. This canbe seen in the highly oscillatory total HTC predicted bythe frozen version.
We shall now present some results from the LOFTLP-LB-1 experiment by using the input deck of Ref.14, as well as a hypothetical 200% LB-LOCA case in acommercial two-loop PWR, with an input deck supplied
82
to us by Lübbesmeyer [16]. Fig. 2 shows the mea-sured and predicted RST histories at axial elevationsof 27 (A) and 31 (B) inches for the LOFT LP-LB-1 test.Although the RST histories are still under-predicted,there is a considerable improvement over the predic-tions obtained by using frozen version. Additionally,in order to demonstrate the sensitivity of the resultsto the assumed interfacial shear correlations, we showthe RST histories predicted by the code when the wet-wall interfacial shear correlations of Ishii-Andersen [10]are used if the component is a pipe. One sees that theRSTs are now closer to the measured ones. In Fig.2 (C), we compare the RST predictions of the modi-fied and frozen versions [16] for the hot rod in the highpower channel at axial elevations of 2.37m (peak axialpower level) for the hypothetical 200% LB-LOCA testcase. One can see that the predictions of the frozenversion exhibit a sharp RST decrease at approximately7.5s after the break opens, due to the problematicChen transition/film boiling correlation which attains avery high value at |G|=271 kg/m2/s; when later \G\decreases, the RSTs start increasing again. A conse-quence of this is that the peak RSTs predicted by thefrozen version of the code are much lower than theones predicted by the modified version(s) since withthe former code, a large amount of stored energy isremoved during the first 12s of the transient. Sensi-tivity studies have also shown that the peak RSTs arestrongly dependent on the assumed interfacial shearduring the first few seconds of the transient, but alsoon the assumed value of the TMIN-
Finally, we shall present some results from the LOBISB-LOCA BL34 experiment [16] for which the reflood-ing option is not activated. Fig. 3 shows measured andpredicted RST histories at two axial elevations, as wellas the collapsed level in the core. Neither our modi-fied code nor the frozen version predict the first dry-out;however, the modified version predicts the RSTs sig-nificantfy better than the frozen version.
4 ConclusionsIn this work, we outlined a number of modifications andmodel changes introduced in R5M3 which result in bet-ter and more physically sound predictions. Some of themain code deficiencies we identified were in the mod-eling of the wall-to-liquid post-CHF heat transfer coeffi-cient, the adverse effects of the oscillatory behaviour ofthe CHF predicted from the Groeneveid look-up table(mainly for low mass-fluxes), the unphysically small in-terfacial shear at lower pressures (which greatly affectsthe code predictions during reflooding), the effect ofthe under-relaxation schemes of the interfacial closurecoefficients (particularly in the presence of numerical
oscillations), as well as a number of other minor pointswhich can show up and become important under cer-tain conditions.
A number of separate-effect and integral test exper-iments were analyzed with the modified code, and thepredictions were compared with the ones obtained bythe frozen version and (when possible) with the mea-surements. Without exception, the predictions of themodified code were closer to the measurements, inmany cases free of unphysical oscillations, and alwaysmore physically sound than the ones of the frozenversion. These tests included reflooding in NEPTUN,the LOFT LB-LOCA LP-LB-1, the LOBI 6% SB-LOCABL34 and a hypothetical 200% LB-LOCA in a two-loopcommercial PWR. Although a wider assessment of thisversion with more transients is required before one canmake final and absolute statements about its improvedpredicting capabilities, it can clearly be said that boththe new heat transfer package used during refloodingand the re-activation of the modified Bestion correlationgreately contributed to the improved predicting capabil-ities of the code and should be adopted by the codedevelopers.
AcknowledgementsWe would like to thank Dr. Dirk Lübbesmeyer for mak-ing available to us his PWR and LOFT LP-LB-1 inputdecks. We are also grateful to the University of Pisa,Italy, and in particular, to Prof. F. D'Auria for providingus with the LOBI input deck.
References[1] ANALYTIS G. TH.: "A summary of model
changes and options in RELAP5/MOD3"; pa-per presented at the 2nd CAMP Meeting,May 10-13,1993, Brussels, Belgium.
[2] ANALYTIS G.TH.: The effect of CHF model-ing on some numerical oscillations of RE-LAPS/MODS during reflooding"; paper pre-sented at the International Working GroupMeeting on CHF Fundamentals, March 3 - 4,1993, University of Braunschweig, Germany.
[3] SENCAR M., AKSAN S.N.: "Evaluation of re-flooding models in RELAP5/MOD2.5, RE-LAP5/MOD3/v5m5 and RELAP5/MOD3/v7jcodes by using Lehigh University and PSI-NEPTUN bundle reflooding experiments";TM-42-92-19, PSI Internal Report, presentedat the 2nd CAMP Meeting, Brüssel, 10 -13May, 1993.
83

[4] SENCAR M., AKSAN S.N: "Evaluation andAssessment of Reflooding Models in RE-LAP5/MOD2.5 and RELAP5/MOD3 Codesusing Lehigh University and PSI-NEPTUNBundle Experimental Data"; NURETH-7 Con-ference, NUREG/CP-0142, Vol. 3, pp 2280 -2289 (1995).
[5] CARLSON K.E. ET. AL: "RELAP5/MOD3 CodeManual Volume IV: Models and correlations(Draft)"; June 1990.
[6] RANSOM V.H. ET. AL.:URELAP5/MOD2 Code
Manual Volume 1: Code Structure, SystemModels and Solution Methods"; NUREG/CR-4312, (1985).
[7] ANALYTIS G.TH.: "Development and as-sessment of a modified version of RE-LAP5/MOD3: A search for excellence "; In-vited paper presented at the RELAP5 In-ternational User's Seminar, Baltimore, Mary-land, USA, August 29 - September 1, 1994.
[8] ANALYTIS G.TH., RICHNER M.: Trans. Amer.Nucl. SOC, 53, 540 (1986).
[9] ANALYTIS G.TH., RICHNER M., AKSAN S.N.:"Assessment of Interfacial Shear and HeatTransfer of RELAP5/MOD2/36.02 During re-flooding "; EIR Report Nr. 624, 1987.
[10] TAYLOR D.D. ET. AL: TRAC-BD1: An Ad-
vanced Best-Estimate Computer Program forBoiling Water Reactor Transient Analysis ";NUREG/CR-3633(1984).
[11] ANALYTIS G.TH.: "Developmental Assess-ment of TRAC-BF1 with Separate-Effect andIntegral Reflooding Experiments"; NURETH-5 Conference, 21-24/9/1992, Salt-Lake City,Utah, U.S.A. Vol. I, pp 287 - 293.
[12] ANDREANI M.: Private Communication (1993).
[13] GRÜTER H., STIERLI F., AKSAN S.N., VARADI G.:
"NEPTUN Bundle reflooding experiments:Test Facility description ", EIR Report Nr.386(1980).
[14] LÜBBESMEYER D.: "Post-Test-Analysis and
Nodalization Studies of OECD LOFT Experi-ment LP-LB-1 with RELAP5/MOD2/CY36.02"; PSI Report Nr.91 (1991).
[15] D'AURIA F., GALASSI G. M: "Assessment of RE-
LAP5/MOD2 code on the Basis of Experi-ments performed in LOBI Facility"; NuclearTechnology, Vol 90, Nr. 3 (1990)
[16] LÜBBESMEYER D.: Private communication(1992).
O. 50.
TIME (s)
15 0 .
1100
1150.
TIME ( s )
i200.
Fig. 1: NEPTUN bottom flooding exp. Nr. 5036. RST (K) and HTC (W/m2/K) at ai'..--?| elevation 0.946 m(A,B). (—): Modified R5M3; ( ): R5M3 frozen version; (-.-.-): measurements.
84

U3O
10
a
1300.-
1010.-
BOO.-
750.-
eoo.-
»10.-
303.
ki
i
. ^ >
i
V
A
t
H.
'\
--
Xx -1t _I
*-Üi-~
8na
30. 45. «0.
TIME (s)
IIOO—
1050.-
»00.-
750.-
600.-
450.-
300.
n
1 i • ' i—
r,••V--
B
• i • ' i '
"—r^1—•"
* t.
\ '
1 • •
"I \
^ \
\1
\
T ' •
1 ' • 1 •
-
-
\ —\ t
'A '
I |bÖSHS
T ' I1'0. 13. 30.
I I T60. . 75. 80.
TIME (s)
to>— 900.
a£0> 700.-
I'1 ' ' I T'~ r
' I • • I • • • I • • ' 1 ' ' ' I • ' • • I • • • I ' ••<>• 20. 4O. 60. 80. 100. 120. 140. ISO
TIME (s)
Fig.2: LOFT LP-LB-1. Predicted RST (K) histories at axial elevations of 27 (A) and 31 (B) inches. ( ):modified R5M3; ( ): R5M3 frozen versio. ; (-.-.-.): modified R5M3 + Andersen's wet wall interfacialshear for pipes; (- -.- -.): measurements. (C)-" Hypothetical LB-LOCA in a PWR; Predicted peak RSThistories (K) with modified ( ) and frozen versions ( ) of R5M3.
85

bOO.-
7OO.~
5 0 0 . -
400 . -
JOO.t
"1
jjjji
i\
• i
A
* • » -• — —
• i i ••
.
I
!j"
I
;]
ii
i•;!\\'.•i
lii
I
j
I :
l !
i!i !
-
-
•"I I I •'•'•"I'
0. 50O. 1000. I&OO. 2000. 2500.
TIME (s)
O SCO.I I
looa, isou.
TIME (s)
I ' ' ' r ' '2000. 2&00.
SOO. 1000. 1S00. 2000. 2500. 3000.
TIME (s)
Fig 3- LOBI BL34 SB-LOCA test. Predicted RST histories at two axial levels (A and B) and collapsed levelin the core (C). ( ): modified R5M3; (-.-.-.-.): R5M3 frozen version; ( ): measurements.
86

THE FIRST PANDA TESTS
J. Dreier, M. Huggenberger, C. Aubert, Th. Bandurski, O. Fischer, J. Healzer, S. Lomperski,H.-J. Strassberger, G. Varadi, and. G. Yadigaroglu
Thermal-Hydraulics Laboratory
Abstract
The PANDA test facility at PSI in Switzerland is usedto study the long-term Simplified Boiling WaterReactor (SBWR) Passive Containment CoolingSystem (PCCS) performance. The PANDA testsdemonstrate performance on a larger scale thanprevious tests and examine the effects of any non-uniform spatial distributions of steam and non-condensables in the system. The PANDA facility is in1:1 vertical scale, and 1:25 "system" scale (volume,power, etc). Steady-state PCCS condenserperformance tests and extensive facilitycharacterization tests have already been conducted.A series of transient system behavior tests have beencompleted by end of 1995. Results from the first threetransient tests (M3 series) are reviewed. The firstPANDA tests exhibited reproducibility, and indicatedthat the SBWR containment is likely to be favorablyresponsive and highly robust to changes in thethermal transport patterns.
1 Introduction: The ALPHA Project andPANDA
In 1991 the Paul Scherrer Institute (PSI) inSwitzerland initiated the ALPHA project for theexperimental and analytical investigation of the long-term decay heat removal from the containment of thenext generation of "passive" Advanced Light WaterReactors (ALWRs); the effects of aerosols oncontainment performance are also addressed. Thedynamic containment response of such systems,including containment phenomena, were to beinvestigated. The ALPHA project includes integralsystem tests in the large-scale (1:25 in volume)PANDA facility; the smaller-scale separate-effectsLI NX series of tests related to various passivecontainment mixing, stratification, and condensationphenomena in the presence of non-condensablegases; the AIDA tests on the behavior of aerosols inPassive Containment Cooling Systems (PCCS); andsupport'ng analytical work. The project has been, sofar, mainly directed to the investigation of the GeneralElectric (GE) Simplified Boiling Water Reactor(SBWR) PCCS and related phenomena.
The PANDA integral-test results discussed herewere initially expected to bring only confirmatoryinformation for the certification of the SBWR by theUnited States Nuclear Regulatory Commission (USNRC). Recent developments have made the first
series of experiments to be conducted in PANDA arequired experimental element in the certificationprocess; thus, the tests have gained in importanceand are now performed according to the NQA-1Quality Assurance procedure.
The SBWR confirmatory research and later thecertification effort have been conducted incollaboration with a large international team. Theclosest PSI partners in this team are the ElectricPower Research Institute (EPRI), the General ElectricCompany (GE) and the University of California-Berkeley (UCB) in the US, the Netherlands EnergyResearch Foundation (ECN) and KEMA in theNetherlands, the Toshiba Corporation in Japan, theInstituto de Investigaciones Electricas (HE) in Mexico,and the Italian national utility ENEL, as well as ENEA,Ansaldo, and SIET in Italy. Elements of the SBWRinternational program closely linked to the ALPHAproject are:• Single-tube condensation experiments at UCB [1],
[2] and at MIT [3].• The smaller scale (1:400) integral test facility
GIRAFFE, operated by Toshiba [4].• The full-scale PCCS condenser qualification
PANTHERS experiments performed by SIET inItaly [5].
In addition to the large-scale PANDA tests,small-scale experiments and numerous analyses wereconducted at PSI to better understand basicphenomena and SBWR system behavior and toprovide preliminary data for the development ofcomputational models.
After a short summary of the conceptual designand scaling of the PANDA facility in Section 2, Section3 gives an overview of the instrumentation and dataacquisition & control systems used in PANDA. Adescription of the auxiliary systems used forpreconditioning of the PANDA facility is given inSection 4. Sections 5, 6 and 7 describe theexperimental results of the PCC CondenserQualification Tests, the Facility CharacterizationTests, and the M3 Series Transient System BehaviorTests, respectively. Finally some preliminaryconclusions from the experimental results are drawnin Section 8.
2 The PANDA Large-Scale Facility
The PANDA general experimental philosophy,facility design, scaling, and measurement concepts
87

are described by [6]. During the early project definitionperiod, it was decided to build a large-scale facilitycapable of simulating SBWR behavior during the long-term (or PCCS-cooling) phase of the postulated Loss-of-Coolant Accident (LOCA). The tests cover thephase of the LOCA that starts typically one hour afterscram. They are intended mainly to investigate anythree-dimensional effects that may arise during thisphase. Thus, in relation to the SBWR certificationeffort, the PANDA transient test objectives are todemonstrate that:• Containment performance is similar in a larger-
scale, multidimensional system to that previouslydemonstrated with the smaller-scale GIRAFFEtests.
• Any non-uniform distributions in the containmentdo not create significant adverse effects.
• There are no adverse effects associated withmulti-unit PCCS operation and with interactions
• The tests also extend the data base available forcode qualification in general and, in particular,serve to validate further the system code TRACG[7].
2.1 Conceptual Design
Early during the conceptual design phase of thePANDA facility, it was decided to model the SBWRcontainment volumes by simple cylindrical vesselsinstead of preserving an exact geometrical similarity[6]. To allow any multidimensional effects to takeplace under well controlled boundary conditions, themain containment compartments (DW & WW) aremodeled in each case by two interconnected vessels.
Following this genera! philosophy, the SBWR ReactorPressure Vessel (RPV) and the Gravity-DrivenCooling System (GDCS) pools are each representedby one vessel. The Drywell (DW) and SuppressionChamber (SC or Wetwell) are represented both bytwo separate, interconnected vessels (Figures 1). TheRPV contains a 1.5 MW electrical heat source. Theelectric "core" geometry and the heat rod dimensionsare not intended to match those of the SBWR reactorcore; they merely provide the specified amount ofheat to the RPV. The RPV internals (chimney height,etc.) resemble those of the SBWR. The parameters ofimportance for global system behavior, namely, theRPV water inventor with other components of thereactor system.y and water level are accuratelyscaled.
25 m PCCRxl ICFbd
Om
SBWR PANDAScaling:Height 1 :1Volume 1 :25Power 1 :25
Fig. 1: SBWR versus PANDA
There is a total of three PCCS condensersrepresenting the corresponding three units in theSBWR and a single Isolation Condenser System(ICS) condenser representing two of the three
corresponding SBWR units. (The two SBWR ICScondenser units correspond to the 2x50 % designvalue of the cooling capacity; the third ICS condenseris an extra 50 % redundant unit.) The condensers are
88

connected to the two DW vessels, as shown in Fig. 2. behavior or creates flows between the two DWs, evenThe fact that there are three PCC units and only two with equal flow areas from the RPV to the two DWDW volumes allows some degree of asymmetric volumes.
VBBPl m Vacuum
Breaker
* For stBady state tests only
Fig 2: Piping Connections and Process Lines of the PANDA Facility(symbols within filled circles denote flow rate measuremf.nts).
89

There are two vacuum breakers connecting thetwo DWs to the two SCs in PANDA. The operation ofthe actual vacuum breakers of the SBWR is simulatedin PANDA by the controlled opening of valves; theseare opened and closed by the facility control systemwhen the measured differential pressure signalbetween the DWs and SCs exceeds an upper and alower limit, respectively. Figure 2 shows some of thedetails of the piping interconnecting the variousvolumes.
2.2 Scaling of the PANDA Facility
In relation to scaling, both "top-down" and"bottom-up" [8] scaling considerations and criteriawere developed. General, "top-down," scaling criteriaare derived by considering the processes controllingthe state of classes of containment sub-systems(e.g. containment volumes, pipes, etc.). Closeexamination of specific phenomena or systemcomponents (e.g. thermal plumes, vents, etc.) leadsto "bottom-up" scaling rules.
A rigorous scaling study [9] describes the scalingrationale and scaling details of the PANDA facility.Additional work [10, 11] covers certain particularaspects of scaling. In the following only a shortsummary of the results of the extensive scaling workis presented.
From the top-down scaling analysis and the factthat prototypical fluids under prototypical conditionsare used in PANDA, the following variables which aregoverned by the "system scale' R (i.e. ratio betweenthe corresponding scales of prototype and model) areidentified: power, volume, horizontal area in volume,mass flow rate, heat transfer areas. For PANDA the'system scale1 R is 25. Bottom-up scaling [9] wasapplied for phenomena and facility components thatwere selected as being of particular importance by aPhenomena Identification and Ranking Table (PIRT).One of the main outcome of the Bottom-up scaling isthat the heat capacity and heat losses of theexperimental facility cannot be made to match thoseof the SBWR. This issue can be addressed, however,during data reduction by an accurate system heatbalance based on measurements and heat losscalibrations.
3 instrumentation and Data Acquisition
The facility is heavily instrumented with some600 sensors for temperature, pressure, pressuredifference, level or void fraction, flow rate, gas(oxygen or air) concentration, electrical power, valveposition, and conductivity (presence of phase)measurements. Thus, the instrumentation includes, inaddition to the classical instruments, also non-condensable fraction (oxygen) sensors, phasedetectors and "floating thermocouples" measuring thesurface temperature of pools.
Many thermocouples measure fluid tempera-tures, and a comparable number of facility componenttemperatures (vessel and pipe wall temperatures);both sets are used to obtain accurate heat balancesand to estimate the heat losser, from the variousfacility components.
The data acquisition system can sample andstore all instrumentation channel readingscontinuously with a frequency of 0.5 Hz and for shortperiods of time with a "burst" frequency of 5 Hz. Thefacility is operated and controlled remotely andinteractively by a computer-screen-based system. Inkeeping with the passive nature of the SBWR, veryfew operator interventions need to take place duringthe tests.
4 Preconditioning: Establishment of theProper Initial Conditions for the Tests
The PANDA facility is equipped with auxiliary airand water supply systems for preconditioning thecontents of the various system components, inparticular:
1. An auxiliary air supply system (connected to thetop of each vessel), used to pressurize anyvessel.
2. A demineralized water supply system (that can beconnected to the RPV and to the auxiliary watersystem), used to initially fill any system volume.
3. An auxiliary water system, connectable to the topand bottom filling ports in all vessels and pools.The system includes cooling and heatingcapability; for heating, heat is drawn from the RPVvia the auxiliary water system heat exchanger.Draining ports are also provided in all vessels andpools.
4. An auxiliary steam system: steam from the RPVcan be directed to any vessel for preheating thestructures and gas space.
5. An auxiliary vent system that can be connected toany vessel; the system includes a pressure ortemperature controlled vent valve.
Systems 4 and 5 in combination can be used forventing vessels (to establish, for example, a puresteam atmosphere). Directing the water supplied bythe auxiliary water system to either the top or thebottom filling port of a vessel allows the establishmentof either stratified or well-mixed conditions in thewater space at the beginning of the tests.
As specified by the preconditioning procedures,the various containment volumes are isolated, filledwith the required fluids, and heated using heat fromthe RPV via a preconditioning-system heatexchanger. When the required initial conditions havebeen reached, the vessel connections are opened andthe test begins. Experience from the first tests has
90

shown that the specified initial conditions could bematched within remarkably tight bounds (e.g., fortemperatures within less than ± 2 K, for pressureswithin ± 4 kPa, and for levels within ± 0.1 m or less).The uniformity of temperature within the variouspressure vessels was also excellent (as measured,variation of the mean was less than 1 K). Thespecified core power decay curve could be followedperfectly and smoothly thanks to the automatic controlsystem that was programmed to sequentially activateand control (in small steps) the power of the electricheaters simulating the core.
5 Steady-State PCCS CondenserQualification Tests
The first series of PANDA experimentsconducted at the beginning of 1995 were steady-statePCCS condenser performance tests, as counterparttests to certain tests conducted in the PANTHERSand GIRAFFE facilities. In this first series, the effectof noncondensables on the condenser performancewas investigated. Thus most of the tests wereconducted at the same steam flow rate and differentnoncondensable mass fractions.
In these tests, one of the PCCS condenser units(the most extensively instrumented one) wasconnected directly to the RPV by a specially built line,indicated in Figure 3. Thus, the RPV provided therequired steam flow rate. The requirednoncondensable gas flow rate was injected directlyinto the same pipe, sufficiently above the inlet of thecondenser to ensure adequate mixing. The liquiddrain flow was discharged via the PCC drain to theGDCS pool and from there it was returned to theRPV. The vent flow was directed to the empty SC.
100
75
r
• experiment
— TRACG calculation
0 5 10 15 20
Noncondensabla Gas Mass Fraction [%}
Fig. 3: Steady-state condenser characterizationtests: measured consenser efficiency,compared to TRACG pretest predicitons.
The DWs were isolated. The GDCS and the SCswere connected and preheated to avoid subcooling ofthe condensate and hence condensation of any steamvented from the condensers. The pressure
downstream of the condensers, in the SC and theGDCS, was controlled by venting to the atmosphere.For pure-steam tests, the condenser vent line wasclosed and the pressure in the RPV was allowed tofind its own equilibrium value; this pressurecorresponded to full condensation rate.
After achieving stable operation at the requiredcondenser inlet and downstream pressure conditions,the test data were recorded for at least 10 minutes.The test was judged to be successfully completedwhen the specified conditions had been maintainedwithin a given tolerance and for a given period, forexample, + 5% for 10 minutes for the steam flow.Repeatability tests showed differences in condenserperformance of only a few percent.
Figure 3 shows the condenser efficiency, definedas the fraction of inlet steam condensed, as a functionof the noncondensable mass fraction, at the referencesteam flow rate. As expected, the condenserefficiency diminishes as the noncondensable massfraction increases. Also shown are the pre-testpredictions obtained with the TRACG code. Thesepredictions were completed and submitted to the USNRC before running any of the tests. The trendspredicted by TRACG are in excellent agreement withthe experimental ones, although the TRACG valuesare quantitatively slightly conservative (i.e., theyunderstate condenser performance).
6 Facility Characterization TestsAn extensive series of facility characterization
tests was completed in July 1995: the facility leakrates, heat losses and the pressure-drop vs. flow-ratecharacteristics of the various lines were obtained.These are needed for planning of experiments andinterpretation of results (e.g. code input models).
The facility was first pressurized with air to 5bars. The individual vessels were then isolated byclosing the valves on the lines connecting them. Thepressure decrease in each individual vessel due toleakage was recorded for 62 hrs. and corrected for airtemperature effects. The leakages measured this waywere lower than 0.08 % per day for all vessels exceptfor the RPV at 3.7 % per day.
For the heat loss tests, the vessels were initiallyinterconnected, purged of any air and filled withsaturated steam at 4 bars. The vessels were thenisolated from each other and from the environmentand left to cool down. The heat losses were estimatedfrom the vessel gas-space and wall temperatures.The total heat loss did not exceed 7% of the scaledreactor decay heat power 24 hrs after scram, i.e. itwas experimentally proven that one of the mostimportant design target (10% heat loss) was evenexceeded. The losses during a typical test will beeven lower, since the SCs will be at a lowertemperature.
The PANDA facility includes flow rateinstruments in almost all its lines, as shown in Figure2. The flow rates and the pressure drops were
91

measured in most of the instrumented lines. For mostlines, these testswere conducted in a quasi-steadystate fashion with air. Since the vessels are large, thepressure variation during recording was very small.For the two Main Steam Lines and the three PCCSfeed and vent lines, the tests were also conductedusing steam produced in the RPV. Tests were carriedout using water for the GDCS return line to the RPVand for the equalization line between the WW's andthe RPV. The results showed that the total pressurelosses in the various system lines had been correctlyengineered (based on the SBWR values). They alsoprovide the loss coefficients for use in computermodels.
In summary, the facility characterization testsdemonstrated that the facility mass and heat leakageswere below the design criteria and that the pressure-drop characteristics of the lines matched those of theSBWR.
7 The M3 Series Transient SystemBehavior Tests
A test matrix for containment and systemsinteraction tests for SBWR certification wasformulated and agreed. The test matrix is defined toprovide parametric variations around a set of baseconditions, which is counterpart to one of theGIRAFFE tests. Thus any effects of system scale andof non-uniformities in the system will becomeapparent.
The tests discussed here (tests M3, M3A andM3B, referred to as the M3 Series) are MSL Break(MSLB) tests. The initial conditions for these testscorresponded to one hour after scram during theLOCA; at that time the DW contains mostly steamand almost ail the air has been pushed into the SC.The tests are similar to a GIRAFFE MSLB test withuniform DW conditions. The three PCC condenserswere connected to the two DWs (PCC-1 to DW-1 andPCC-2 and PCC-3 to DW-2), as shown in Fig. 2. TheIC condenser was valved off. The corresponding ICSpool was empty for tests M3, and M3A and full of hotwater for test M3B.
The effect of the water level and inventory in thePCC pools on system performance was investigated.The PANDA pools have a scaled cross-sectional areaabout three times smaller than the SBWR pool area.Water can be added during the tests to provide themissing water inventory. The pool conditions can,however, be modified by such water makeups to thepools. To investigate these effects, the tests wereconducted as follows:
• For test M3 the three PCC pools wereinterconnected and there was no water makeup.At the end of test M3, the water level in the PCCpools had dropped about 0.5 m below the top ofthe tubes.
• Test M3A was conducted with the three PCCpools isolated; cold water was added from the
bottom fill line (Fig. 2) to each pool individually, tokeep its nominal water level constant wit! ;in ± 0.3m.
• For test M3B, the three pools were interconnectedand cold water was added simultaneously to allthree (using the connecting bottom-fill line) tokeep again the nominal water level within ± 0.2 m.
All three tests were conducted with identicalinitial conditions and decay power and with initiallysaturated water in the PCC pools.
The gradual decrease by evaporation of thewater level in the pools provides an effective measureof the total heat removed by the PCC condensers. Fortest M3A (isolated pools), individual heat balances onthe three PCC units could be performed. Theseconfirmed certain findings regarding the non-uniformoperation of the three PCC units.
The DW and WW pressures followed similarglobal trends in the three tests. The peak DWpressures reached were very close to one another.After an initial increase lasting about two hours, theDW pressure stabilized and varied very littlethereafter, as shown in Figs. 4, 5 and 6 for tests M3,M3A, and M3B, respectively.
0,50 r
0.20 rl
0.10 T
Fig. 4: Test M3: Variation of the DW and WWpressures (top) and of the flow rates receivedby the three PCC condensers (bottom).
92

80000.
.lout limesf V/B opening
0.50
80000.
Fig. 5: Test M3A; Recorded PCCS Pool levelsshowing the procedure followed for main-taining an approximately constant level(top) and DW and WW pressures showingtwo clusters of vacuum breaker openings(bottom).
The pressure increase period corresponded roughly tothe time needed to purge the air from the DW.Thereafter, the difference between the DW and WWpressures remained almost constant (except near thevacuum breaker openings); the differencecorresponded to the submergence depth of the PCCvent in the Pressure Suppression (PS) pool.
Test M3 showed quite uniform behavior of thethree PCC units up to about 35'000 s, as shown inFig. 4. Then, PCC-2 started condensing progressivelyless steam, while slightly more steam was "sucked" bythe other two units (PCC-1 and PCC-3). The reducedperformance of PCC-2 was verified by a number ofindicators (for example, subcooling of the lower part ofthe PCC-2 pool, strong reduction of boiling in thePCC-2 pool) and apparently results from a partialfilling of the PCC-2 condenser tubes withnoncondensables. Despite this imbalance, no vacuumbreaker opening took place in test M3, and the threePCC units essentially shared the load and condensedthe exact amount of steam provided by the RPV.Figure 4 shows the variation of the DW pressure andof the PCC feed flows during this test.
g 0.30
a»
? 0.20
0.10 lr
: ( WW'
i
• i - 1 — .
- — \ *
i
- — i — ' - - > — ' — :
nitml i i •
I I *:
\ | two times •I I _/*V/Bopening :
n -II :IIII 'itn '•it . . -
20000. 40000.
Tims [s]
60000. 80OO0.
Fig. 6: Test M3B Recorded PCCS Pool levelsshowing the procedure followed for maintain-ing an approximately constant level (top) andDW and WW pressures showing a singlecluster of vacuum breaker openings.
As noted, the lesser water inventory in the PANDApools and the absence of water makeup in M3resulted in a non-prototypical, low water level in thepools; for this reason, tests M3A and M3B wereperformed. In these two tests the water level in thepools was kept constant. The pools were isolated andfilled individually with cold water during test M3A, asshown in Fig. 5. The cold water was introduced fromthe bottom of the pools and apparently remained atthe bottom until its level reached the bottom of thecondenser tubes. This triggered a chain of processesinvolving mixing of the pool water, reduction of thepool temperature, a consequent increase in the heattransfer rate and eventually an increase of thecondensation rate. This drove the DW pressure belowthat of the WW and caused the vacuum breakers toopen. After each opening the pressure in the WWdropped slightly and there was consequent increasein air content in the DW. The effect of vacuum breakeropening did not last long, however, and the DW andWW pressures recovered to their former levels in lessthen an hour.
93

With or without vacuum breaker openings, theDW pressure decreased slightly after refilling of thepools in tests M3A and M3B, as shown in Figs. 5 and6; the effect was strongest for later refills, when thecold water that was injected at the bottom of the poolwas able to rise sufficiently and mix with the upperlayers of the pool.
Vacuum breaker openings were more frequentduring test M3A, where apparently the individual fillingof the pools had a stronger effect, as shown in Fig. 5.Only a single occurrence of a cluster of two vacuumbreaker opening took place late during test M3B,where apparently the "milder" changes in the pooltemperatures produced a lesser effect. This is shownin Fig. 6.
The air content of the DWs increasedmomentarily following the vacuum breaker openingsand the condensation rates of the individual PCC unitswere temporarily reduced. However, because of thevery large margin built into the system, the three PCCunits always managed to share the load and the long-term behavior of the DW pressures was not affected.
Following a drop in DW pressure due to filling ofa poo!, in cases when the DW was full with almostpure steam, the pressure recovery was slow, due tothe high rates of condensation. This is shownfollowing the first DW pressure drops in Figs.5 and 6,after which a long time elapsed before the PCC tubeswere partially refilled with air. By contrast, when therewas air in the DW, the pressure recovery wasrelatively rapid (as shown for the later DW pressuredrop transients in Figs. 5 and 6). In this case airpresent in the DW was then able to accumulate ratherrapidly in the PCC tubes and reduce their heatremoval capability.
8 Conclusions
The first transient series of tests (M3) wasconducted successfully in October 1995. Regardingfacility design and operation, these testsdemonstrated the following:
• The facility can be operated and controlled verywell, and very narrowly defined initial andboundary conditions (e.g. initial states of variouscontainment volumes, power input) can beachieved.
• The pre-conditioning equipment worked verysuccessfully in this respect.
• The instrumentation performed with high accuracyand reliability.
• The tests showed excellent reproducibility ofoverall system behavior (DW and SC pressures).
From the findings of the PANDA tests, thefollowing preliminary conclusions may be drawnconcerning the SBWR.
• The global behavior of the containment will befavorably responsive and robust to changes in thethermal transport patterns.
• The PCCS units have ample heat transfercapacity for the range of conditions covered bythe tests performed to date, with sufficient marginto accommodate differences in the distribution ofcondensation load.
An interesting effect was demonstrated regardingthe distribution of noncondensables and their effectson the PCCS system. Small amounts ofnoncondensables can affect the performance of thecondensers operating in parallel. The global operationof the PCCS system was not, however, degraded bysuch dissymetries and three-dimensional effects. Thisis a reassuring verification of the PANDA design,which was built to investigate such effects.
The data from the M3 test series are still beinganalyzed in detail and compared with pre- and post-test calculations. Final conclusions will be obtainedafter examination and analysis of all the data.
Acknowledgments
The ALPHA project, conducted at PSI incooperation with the Electric Power Research Institute(EPRI) and the General Electric Company (GE),receives financial support from the Nuclear PowerCommittee of the Swiss Utilities (UAK), the (former)Swiss National Energy Research Foundation (NEFF)and GE; these financial contributions are gratefullyacknowledged.
This paper results from the collaboration of alarge number of persons both inside PSI as well asoutside. The authors particularly acknowledge thecontributions of PSI collaborators P. Coddington andB. Uebelhart during the early phases of the project, ofL. Voser for design, construction and resolution ofmany instrumentation problems, and of P. Gritsch, W.Bulgheroni, P. Rasmussen and L. Sekolec for facilitycontrols and data acquisition systems. The authorsare also indebted to J. Yedidia of EPRI who wasinstrumental in organizing the ALPHA program and totheir numerous GE colleagues who contributed timeand effort, in particular to A. Rao, J. Fitch, B.Shiralkar, J. Torbeck, A. Arretz, B. Usry and B.Wingate.
References
[1] VlEROW, K.M. AND SCHROCK, V. E., 1992,"Condensation in a Natural Circulation Loop withNon-Condensable Gases, Part I Heat Transfer,"Proc. Int. Conf. Multiphase Flows, Tsukuba,Japan, September 1991.
[2] KUHN, S.Z., SCHROCK, V.E. AND PETERSON, P.F.,
1995, "An Investigation of Condensation from
94

Steam-Gas Mixtures Flowing Downward Inside aVertical Tube," pp. 312-335 in Proceedings ofthe 7th Int. Meeting on Nuclear Reactor Thermal-Hydraulics NURETH-7, Saratoga Springs, NewYork, September 10-15, 1995, NUREG/CP-0142, Vol. 1.
[3] SlDDIQUE, M., QOLAY, M.W., AND «AZIMI, M.S.,1993, "Local Heat Transfer Coefficients forForced Convection Condensation of Steam in aVertical Tube in the Presence of a Non-Condensable Gas," Nucl. Technol., Vol. 102, p.386.
[4] YOKOBOR!, S., NAGASAKA, H., TOBIMATSU, T.,1991, "System Response Test of IsolationCondenser Applied as a Passive ContainmentCooling System," 1st JSME/ASEM JointInternational Conf. on Nuclear Engineering(ICONE-t), Nov. 1991, Tokyo.
[5] Bom, S. ET AL., 1994, "Tests on Full ScalePrototypical Condensers for SBWR Application,"European Two-Phase Flow Group Meeting,SET, June 6-8,1994.
[6] CODDINGTON, P., HUGGENBERGER, M., GÜNTAY,S., DREIER, J., FISCHER, O., VARADI, G., AND
YADIGAROGLU, G., 1992, "ALPHA: The Long-Term Decay Heat Removal and AerosolRetention Programme," pp. 203-211 in 5thInternational Topical Meeting on Nuclear Reactor
Thermal Hydraulics (NURETH-5), Salt Lake City,USA, Sept. 1992.
[7] ANDERSEN, J.G.M. ET AL , 1993, "TRACGQualification," Licensing Topical Report, NEDE-32177P, Class 3 (February 1993).
[8] ZUBER N., 1991, "Hierarchical, Two-TieredScaling Analysis," Appendix D to "An IntegratedStructure and Scaling Methodology for SevereAccident Technical Issue Resolution," NuclearRegulatory Commission Report NUREG/CR-5809, EGG-2659 (November 1991).
[9] YADIGAROGLU, G., 1994, "Scaling of the SBWRRelated Tests", GE Nuclear Energy reportNEDC-32288 (July 1994).
[10] CODDINGTON, P. AND ANDREANI, M., 1995,"SBWR PCCS Vent Phenomena andSuppression Pool Mixing," pp. 1249-1271 inProceedings of the 7th Int. Meeting on NuclearReactor Thermal-Hydraulics NURETH-7,Saratoga Springs, New York, September 10-15,1995, NUREG/CP-0142, Vol. 2.
[11] ANDREANI, M. AND TOKUHIRO, A., 1995,"Condensation in the Spout Region of a Gas-Vapour Plume Rising in a Subcooled WaterPool," pp. PC2-17-24 in Proceedings, The 2ndInt. Conference on Multiphase Flow '95, Kyoto,April 3-7,1995, Kyoto, Japan, Vol. 2.
95

96

A MODEL FOR THE PERFORMANCE OF A VERTICAL TUBE CONDENSER IN THEPRESENCE OF NONCONDENSABLE GASES
A. Dehbi, S. Güntay
Laboratory for Safety and Accident Research (LSU)
Abstract
Some proposed vertical tube condensers are de-signed to operate at high noncondensable fractions,which warrants a simple model to predict their perfor-mance. Models developed thus far are usually not self-contained as they require the specification of the walltemperature to predict the local condensation rate. Thepresent model attempts to fill this gap by addressingthe secondary side heat transfer as well.Starting with a momentum balance which includes theeffect of interfacial shear stress, a Nusselt-type alge-braic equation is derived for the film thickness as afunction of flow and geometry parameters. The heatand mass transfer analogy relations are then invokedto deduce the condensation rate of steam onto thetube wall. Lastly, the heat transfer to the secondaryside is modelled to include cooling by forced, free ormixed convection flows. The model is used for para-metric simulations to determine the impact on the con-denser performance of important factors such as theinlet gas fraction, the mixture inlet flowrate, the totalpressure, and the molecular weight of the noncondens-able gas. The model performed simulations of someexperiments with pure steam and air-steam mixturesflowing down a vertical tube. The model predicts thedata quite well. The model described also provides abasis under which the presence of aerosol particles inthe gas steam could be analyzed.
1 Introduction
Film condensation inside vertical tubes is an impor-tant engineering topic. The original work of Nusselt re-lated to condensation on flat surfaces [1] has been ex-tended to include such effects as thermal advection inthe film [2], vapor drag [3] and vapor superheat. Sometheoretical investigations tackled the problem of puresteam condensation in a vertical tube starting from theconservation equations for both the liquid and vaporphases. Dobran and Thorsen [4] simplified the gover-ning equations and used an integral method to solvethe problem. Bellinghausen and Renz [5] incorporatedthe k - e turbulence model and solved the resultingequations using finite difference techniques.
It is important to note that most of the studies todate dealt with condensation in the absence noncon-
densable gases. In practice, small amounts of non-condensable gases are usually present in condensersdue, among other things, to the sub-atmospheric op-erating conditions encountered in many of these appli-cations. Moreover, some proposed condensers suchas the Passive Containment Cooler (PCC) in the nextgeneration Simplified Boiling Water Reactor (SBWR)are in fact designed to operate at high noncondensablefractions. Theoretical and experimental investigationshave consistently shown that noncondensable gaseshave a strong impeding effect on steam condensationin unconfined geometries such as on vertical flat plates[6].[7].[8], and on the outside of horizontal [9] or vertical[10] cylinders. In general, the greater the free streamgas fraction, the greater the resistance tc condensa-tion. For a given gas fraction, the impeding effect ofnoncondensable gases is more pronounced when theflow is naturally driven, or forced but at small velocities.
Lately, the effect of noncondensable gases on vaporcondensation inside tubes has been studied both the-oretically and experimentally by a number of authors.
Wang and Tu [11] studied the condensation of a tur-bulent vapor-gas mixture flowing down a vertical tube.The model uses the heat and mass transfer analogyrelations to deduce the local condensation rate in amarching procedure. The model predicted nicely someexperimental data; however, it is not self-contained asit necessitates the specification of the tube wall tempe-rature, while the latter is a by-product of the dynamicsbetween the cold and hot sides of a condenser tube.
Siddique et. al. [12] presented a similar analysis asabove, with the additional inclusion of film roughness,entrance length effects and property changes acrossthe diffusion boundary layer. The model predicted rea-sonably well the data obtained by the authors earlier[13]. However, as with reference [11], the results ofthe model depend on the the specification of the ex-perimentally determined wall temperature.
Kaiping and Renz [14] addressed the heat and masstransfer problem by solving the gas-phase mass, mo-mentum, energy and species equations in conjunctionwith a Nusselt-type treatment of the condensate film.The predictions fitted the authors' data reasonably wellbut the overall approach is too complicated for design »purposes.
Recently, Ghiaasiaan et. al [15] proposed a two-fluid
97

model for tube condensation in the presence of non-condensables. The model compares satisfactorily withsome experimental data; nonetheless, the large num-ber of equations and necessary closure relations makethe model somewhat complicated. As with previousformulations, the channel boundary condition requiresthe specification of a wall temperature or a wall heatflux.
In the present paper, it is intended to develop a sim-ple model to estimate the performance of a vertical con-denser tube in the presence of noncondensable gases.The model is integral in nature. The secondary side isalso taken into consideration so that the model is fullypredictive and depends only on geometry and thermalhydraulic inlet conditions for the hot and cold sides ofthe condenser.
2 Theoretical Model
2.1 Governing Equations
Referring to Figure 1, one can write the z-momentumbalance for a small liquid element. The classical Nus-selt assumptions are made, i.e.
• The condensate film is laminar,
The gas is incompressible,
Ax
CondensateFilm
Sleam-NbncondensableGas Mixture
Fig. 1: illustration of the Film Condensation Model
where 7y is the interfacial shear stress {pLtdexerted by the vapor on the condensate film.
If the approximation ut « U is made, r,- can beexpressed as
Ti = \pV2f. (3)
In the above expression, the mixture density and velo-city are defined in the usual manner:
P =
• Advection in the film is neglected,
• dp/ dy = 0,
• tt£(O) = 0.
The force balance for steady-state motion is
d2ue dp(1)
Integrating (1) twice with respect to y, one obtains thevelocity profile in the liquid film:
u^v) = r-(§:" P^)U2 - sy) + ?», (2)
pUS = mm = mv + mg = mv—-—.— ,
where W is the noncondensable mass fraction,
W =mg
A momentum balance for the gas yields the followingexpression for the pressure gradient:
dp = 2r,- | d(pU2)dx T dx (4)
At any vertical location x, one can readily find the con-densate mass flowrate by simply integrating over thefilm thickness 6. Since 6 is negligible compared tothe tube radius r, the condensate flow rate can be ex-pressed as:
rS
= / 2-Krptuidy =Jo
1-KT(5)
98
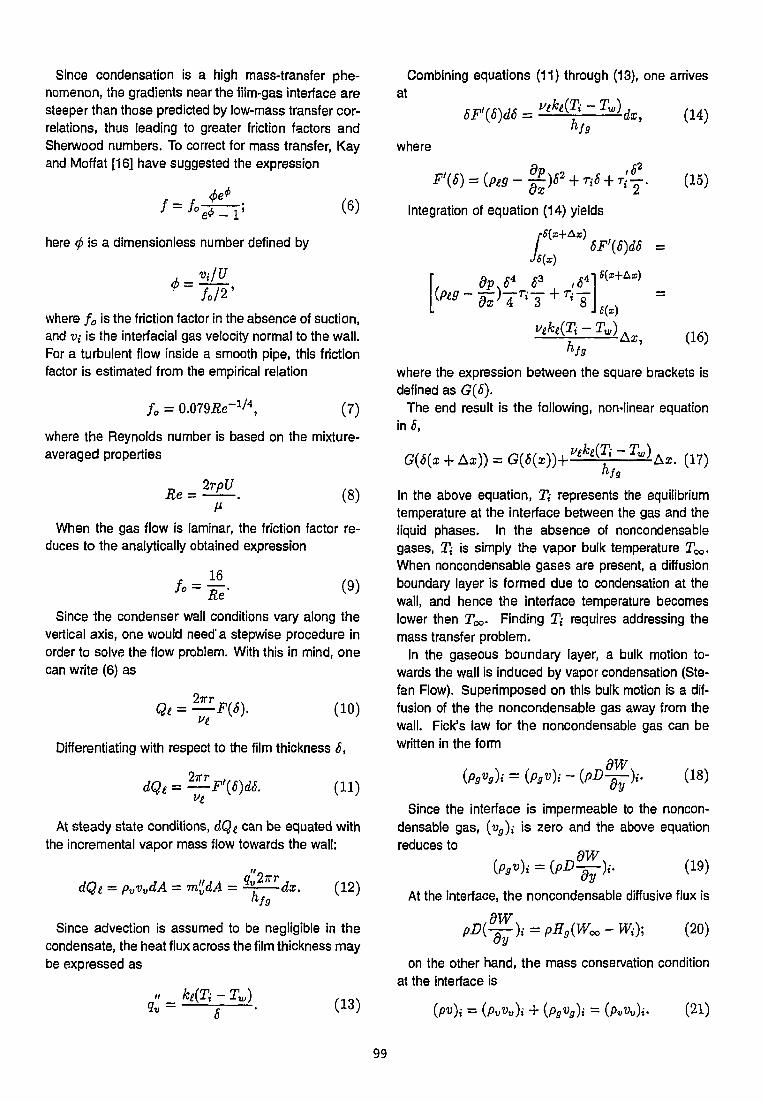
Since condensation is a high mass-transfer phe-nomenon, the gradients near the film-gas interface aresteeper than those predicted by low-mass transfer cor-relations, thus leading to greater friction factors andSherwood numbers. To correct for mass transfer, Kayand Moffat [16] have suggested the expression
f=fo (6)
here ^ is a dimension less number defined by
*- fo/2'
where f0 is the friction factor in the absence of suction,and Vi is the interracial gas velocity normal to the wall.For a turbulent flow inside a smooth pipe, this frictionfactor is estimated from the empirical relation
So = 0.079Re-V4, (7)
where the Reynolds number is based on the mixture-averaged properties
Re =2rpU
(8)
When the gas flow is laminar, the friction factor re-duces to the analytically obtained expression
Re' (9)
Since the condenser wall conditions vary along thevertical axis, one would need'a stepwise procedure inorder to solve the flow problem. With this in mind, onecan write (6) as
(10)
Differentiating with respect to the film thickness S,
dQe = —F'(6)d6. (11)
At steady state conditions, dQe can be equated withthe incremental vapor mass flow towards the wall:
dQe = PvVvdA = m'^dA = *£—dx. (12)
Since advection is assumed to be negligible in thecondensate, the heat flux across the film thickness maybe expressed as
_ kt(Tj - Tw)(13)
Combining equations (11) through (13), one arrives
SF'(S)dS =
at
where
Integration of equation (14) yields
rS(x+Ax)
(14)
T'iSj, (15)
' 6F'(6)d6 =
j - Tw)
fgAx, (16)
where the expression between the square brackets isdefined as G(S).
The end result is the following, non-linear equationin<5,
G{6{x + As)) = G{6{x))+ -Ax. (17)
In the above equation, Ti represents the equilibriumtemperature at the interface between the gas and theliquid phases. In the absence of noncondensablegases, T,- is simply the vapor bulk temperature T^.When noncondensable gases are present, a diffusionboundary layer is formed due to condensation at thewall, and hence the interface temperature becomeslower then T V Finding Ti requires addressing themass transfer problem.
In the gaseous boundary layer, a bulk motion to-wards the wall is induced by vapor condensation (Ste-fan Flow). Superimposed on this bulk motion is a dif-fusion of the the noncondensable gas away from thewall. Fick"s law for the noncondensable gas can bewritten in the form
(18)-~)i.
Since the interface is impermeable to the noncon-densable gas, (vg)i is zero and the above equationreduces to
(Pgv){ = (pD^)i. (19)
At the interface, the noncondensable diffusive flux is
dy
on the other hand, the mass conservation conditionat the interface is
i = {pvvv)i + {pgvg)i = {pvvv)i. (21)
99

After manipulation of these equations, and using therelation (p3i>)t = Wi(pv){, the impermeability condi-tion becomes
' l-(ReiSc/ShY
where the Sherwood number is
(22)
and(2rpvvv)j
ß
The diffusive mass transfer of the gas can be esti-mated by invoking the heat and mass transfer anal-ogy valid for Sc numbers close to unity. For low masstransfer conditions, the mass transfer rate can be es-timated using the Gnielinski [17] correlation which fitsquite well a variety of experimental data,
Sho =(fo/2)(Re -12.7(/0/2)1/2(5c2/3-l)'
(23)
However, as with friction, one must correct the aboverelation for high mass transfer rates. As suggested byKays and Moffat [16], the correction takes the form
Sh = Sh0 (24)
Steam-Non condensableGas Mixture
If the wall temperature is known, the preceding set ofequations is sufficient to solve the heat transfer prob-lem.
Up to this point, we have concentrated on the trans-port within the gas-vapor mixture and liquid film. Wenow consider the heat sink side. In actual condensers,the wall temperature is not known a-priori, and its localvalue depends on the flow dynamics and heat trans-fer conditions on both the hot and cold sides. There-fore, for variable wall temperatures, the above equa-tions must be supplemented with relations which ex-press the heat balance between the condenser hot andcold sides. Referring to Figure 2, the steady-state heatflux can be written in three different forms, namely:
q" = ^ ( 2 * -
<f =r
2.2 Solution Procedure
n,cyiwo —
(25)
(26)
(27)
In order to predict the heat removal in the condenser,the following parameters are needed:
• The geometry of the condenser,
• The inlet mixture temperature, pressure, noncon-densable fraction , and inlet vapor flowrate,
• The coolant flowrate and inlet temperature.
The solution algorithm depends on the direction ofthe gas and coolant flows. What follows is the pro-cedure for the case when the vapor flows from top tobottom while the coolant flows in the countercurrentdirection:
1. Guess an exit coolant temperature Tcfiut-
2. Guess an inside wall temperature Tw.
3. Guess an interface noncondensable mass fraction
Fig. 2: Illustration of the Heat Transfer in aCondenser Tube
where
4. Obtain the corresponding interface temperature 7}using the Gibbs- Dalton ideal gas mixture relationand the assumption that steam is at saturationconditions:
100

and
Pv,i = P-.
T{ = Tsat(pv,i).
In the above expression, the relationship betweenT{ and pvj is obtained following the'recommen-dations in [18].
5. Calculate the friction correction factor as well asthe interface shear stress.
6. Solve equation (17) for the film thickness S(x +Ax).
7. Obtain an improved interface mass fraction W,-from equation (22).
8. Go back to step 4 until the Wi iteration converges.
9. When the Wi iteration has converged, then:
(a) Compute the heat flux across the conden-sate film using equation (25).
(b) Compute the outer wall temperature Two us-ing equation (27).The coolant-side heat transfer coefficient hc
is obtained from different correlations de-pending on the flow regime.
(c) Compute an improved inner wall tempera-ture Tw using equation (26).
10. If the Tw iteration has not converged then go backto step 3.
11. When the Tw iteration has converged, prepare forthe next axial location by calculating the new val-ues for U, pVl0O, Tco, Woo, Tc, Ti, r/ (calculatednumerically) and go back to step 2.
12. Stop the calculation if, at the end of the tube, thepredicted inlet coolant temperature is equal to thespecified value TCiiniet. If not:
(a) Calculate the total heat removed qt =JofdA
(b) Obtain an improved exit coolant temperature
Tc,out — TCliniet + (<7t)/(m=cp)
(c) Go back to step 2.
It should be noted that as long as no aerosol parti-cles flow with the gas, the updated mixture velocity instep 11 is calculated in a straightforward manner byperforming a mass balance on the vapor flow
However, when aerosols are present, a significantfraction of the steam can be removed by condensationon the insoluble particles or by suction due to the hy-groscopic aerosols. The mass balance of the steamcan then be written
dmv = — dQi — (30)
The impact of aerosols will be dealt with in a laterinvestigation. dm,-nj)0; and dmhygro
a re taken as zeroin the following work.
3 Results and Discussion
3.1 Parametric Simulations
The model described above was used for parametricstudies to determine the impact on the tube perfor-mance of important factors such as the inlet gas frac-tion, the mixture flowrate, the total pressure, and themolecular weight of the noncondensable gas. The tubedimensions are taken to be the same as those in thedesign of the SBWR PCC tube, i.e. a length of 1.8 m,an inside di&meier of 4.75 r;n, and a thickness of 1.65mm. In the simulations of this section, the wall tempe-rature is assumed constant, and air was chosen as thenoncondensable gas. The local heat transfer is givenin terms of the local Nusselt number which is definedas
2r
mv(x) = (28)
kt
3.1.1 Effect of the Inlet Noncondensable Gas Frac-tion
The effect of the inlet noncondensable mass fractionwas studied by calculating the local Nusselt numberfor air mass fractions of 0,0.05, and 0.1 while holdingthe other parameters constant. As shown in Figure 3,the performance of the condensing tube is strongly de-graded as the inlet noncondensable fraction increases.
3.1.2 Effect of the Mixture Mass Flowrate
The effect of the mixture inlet flowrate is shown in Fi-gure 4. As expected, the higher the inlet mass flowrate,the greater the heat transfer rate because as the velo-city is increased, the shear stress on the film inducesa higher condensate flowrate for the same film thick-ness (see (6)). Furthermore, the effect of the noncon-densable gas is more pronounced for the low mixtureflowrate case as displayed by the very different slopes
101

of the two curves in Figure 4. The is readily explainedby the greater rate of increase in the noncondensabiegas fraction for the low mixture flowrate case.
3.1.3 Effect of the Mixture Inlet Temperature
The dependence of the heat transfer on the incomingmixture temperature is shown in Figure 5. The walltemperature subcooling is kept constant at 20°C forboth the high (130°C) and the low (100°C) tempera-ture cases. As can be seen from the plot, the averageNusselt number is almost independent of the inlet mix-ture temperature. Based on the Nusselt expression forstagnant steam, one would expect higher heat transfervalues at higher temperatures because the heat trans-fer coefficient is inversely proportional to ß1/4. How-ever, with flowing steam, the velocity is lower at highertemperatures (pressures) for a given mass flowrate.This causes a reduction in the shear effect on the film,with a subsequent decrease in the condensation rate.
3.1.4 Effect of the Molecular Weight of the Noncon-densabie Gas
In the event of a severe accident in an SBWR, the non-condensable gas might be the hydrogen which wouldbe released following fuel oxidation. It is therefore ofinterest to predict the degradation of the heat trans-fer which would occur if hydrogen replaces air as thenoncondensabie gas.
In the first calculation, the prediction is made for aninlet noncondensabie mass fraction of 0.05. As seenin Figure 6, hydrogen causes a greater heat transferdegradation since it occupies more volume than air andhence acts as an efficient shield against condensation.The difference in the heat transfer coefficients for thetwo mixtures is especially pronounced at the begin-ning of the tube where the condensation rates are thelargest. Towards the end of the tube, the heat transferrates are of similar magnitude as the noncondensabiefraction of the air/steam mixture increases rapidly ow-ing to the greater condensation rates in the first seg-ment of the tube.
In the second calculation, the prediction is made foran inlet noncondensabie mole fraction of 0.05. Thiscorresponds to a mass fraction of 0.078 for air and0.0058 for hydrogen. This time, the inlet mixtures havethe same number of noncondensabie moles. As a re-sult, the heat transfer coefficients are of the same mag-nitude as shown in Figure 7. On a mole basis, air is alittle bit more inhibitive to condensation because of itslower diffusion coefficient.
3.2 Comparison with Experimental Data
3.2.1 Comparison with Pure Steam Data
The model can readily be applied to pure steam casesby simply bypassing the T,- iteration in the solutionprocedure outlined above. Several experiments havebeen carried out for pure steam condensation insidevertical tubes. Two references [19], [20] are chosenhere to serve as a test for the present model. In theseinvestigations, the wall temperatures were reported tobe relatively constant owing to the high cooling ratesused, and thus only an averaged value is given. Theheat transfer results are given in terms of a mean Nus-selt number for the entire tube. In the course of thecalculation, the film physical properties were evaluatedat Tw + 0.31 * (Ti - Tw) in accordance with the recom-mendation in [7]. The agreement between the modeland the data is satisfactory as shown in Table 1.
3.2.2 Comparison with Steam-NoncondensableData
A number of experimental investigations ([12], [21])have been conducted in support of the Passive Con-tainment Cooling System (PCCS) condensers whichare designed to transfer decay heat from the SBWRDrywell to a stagnant pool of water located outside thecontainment. In both experiments [12] and [21], thedata scatter was quite large and the correlations ob-tained yielded significantly different values for the localheat transfer coefficient. A plausible explanation forthese discrepancies is the unreliable method used formeasuring the bulk coolant temperature. In both exper-iments, the coolant thermocouples were inserted in thenarrow jacket channel where large temperature gradi-ents existed. A more careful investigation was carriedout lately by Kuhn et al. [22], The set-up consistedof a vertical tube surrounded by a cooling water jacket.The condenser was a steel tube with a length of 2.4 m,an inside diameter of 4.75 cm, and a wall thickness of1.65 mm. The cooling jacket had an inside diameterof 7.36 cm and was insulated from the outside to pre-vent heat losses to the environment. The steam-gasmixture ran from top to bottom while the cooling waterran in the countercurrent direction. The temperaturedistribution (and hence bulk temperature) in the cool-ing annulus was deduced by solving the turbulent flowequations in the coolant annulus subject to the exper-imentally measured temperatures at both boundariesof the flow channel. This method for determining thelocal heat flux was more accurate than in the preced-ing investigations, which explains the smaller scatter inthe data.
The experimental runs were conducted with pure
102

steam, steam-air, and steam-helium mixtures. TheKuhn investigation produced a set of correlations withrepresent the extensive experimental data quite accu-rately.
Five steam-air runs were chosen to test the theoret-ical model. The noncondensable mass fraction variesfrom 0 to 0.396. The experimental parameters aresummarized in Table 2.
Since the coolant flowrate was quite small, and thetemperature difference between the outer tube wall andthe coolant quite high, turbulent mixed convection isthe relevant flow regime for the annulus flow. Accord-ingly, the following correlation was used for the sec-ondary side heat transfer [23],
Nunc is given by the Bayley correlation for turbulentnatural convection along a vertical wall, while Nujc issimply the well known Dittus-Boelter formula for turbu-lent forced internal flows:
Nunc =
Nufc = ^ /The parameters in t,hese correlations were evaluatedat the average temperature between the wail and thecoolant.
As shown in Figures 8 through 12, the model predictsquite accurately the various trends in the experimentaldata. The total heat removal rate was estimated withless than 5% error except for Run 1-1-1 where it isoverpredicted by 15%.
ConclusionA simple and self-contained model was presented forthe prediction of heat transfer inside a condenser tubein the presence of noncondensable gases. The theo-retical simulations agreed quite well with a variety of ex-perimental data. The model can be easily extended toinclude the effect of hygroscopic aerosols flowing withthe vapor-gas mixture. The experimental evidence aswell as the simulations performed in this work show thatit is important to take into consideration the secondaryside heat transfer because the wall temperature variesappreciably along the vertical axis of the condenser.
600
500
4O0
300
> Noncond9nsable= Air- \ m = 0.02 kg/sec
\ T =130'C\ «".Inlet
I- \ T = 110°C
\ L=1 m
~ v \
• \ \ W
w
- x>o1 , 1 . 1 ,
inlet'
Inlet"
~ - -
« > .
= 0
= 0.05
= 0.10
1 . 1
0.2 0.4 0.6
x, m
0.8 1.0
Fig. 3: Effect of the Inlet Noncondensable Fractionon the Local Nusselt Number
450
400
350
300
250
200
- V
\\\\\\\
\\
N
-
i . i .
Noncondensabla= AirT =130"C
- , Inlot
T =110°Cv W^ • ^ 1 = 1 m
m - o,02 Kg/secs,Inlet•* — ***m = 0.008 kg/secs.inlet
i . l . i . l
0.00 0.02 0,04
w0.06 0.08 O.10
», inlel
Fig. 4: Effect of the Steam Flowrate on the AverageNusselt Number
103

260
240
220
200
180
• •
i
-
-
i
Noncondensable= Airm
s , i n i m = 0 - 0 1 k s / s e c
•N T»,,n,s,-V20"C
\ \ L=1.8m
X-_
—-v
1 1 1 1 1 1
130
110
l
-c•c
^""^, 1
0.00 0.02 0.04
W0.06
>, inlQt
0.08 0.10
350
300
250
200
150
inn
-
-
\
' v \\ >
— \s
\
-
-
m5
T
T =w
Nbo
\
Inlet, =130
= 110°C
= 0.05
kg/sec
"C
HydrogenAir
0.5 1.0
X, ID
1.5
Fig. 5: Effect of the Mixture Inlet Temperature on theAverage Nusselt Number
Fig. 7: Effect of the Molecular Weight of theNoncondensable Gas on the Local Nusselt Number,
(Mole Fraction Basis)
300
250
200
150
100
' \ "\ W
=
•>, i n l e t "
= 110
», Inlet"
\
0.01 kg/sec
130 °C
°C
0.05
AirHydrogen
0.5 1.0
x, m
1.5
üo
iCL
I
100-
80-
60-
4 0 -
<-~-—^
~~~~* — .
• •
• T«., sat, oxp'i
wo, exp't
c, expi
Theory
1 _
0.0 0.5 1.0
x, m1.5 2.0
Fig. 6: Effect of the Molecular Weight of theNoncondensable Gas on the Local Nusselt Number
(Mass Fraction Basis) Fig. 8: Comparison with Kuhn's Run 1-1-1
104
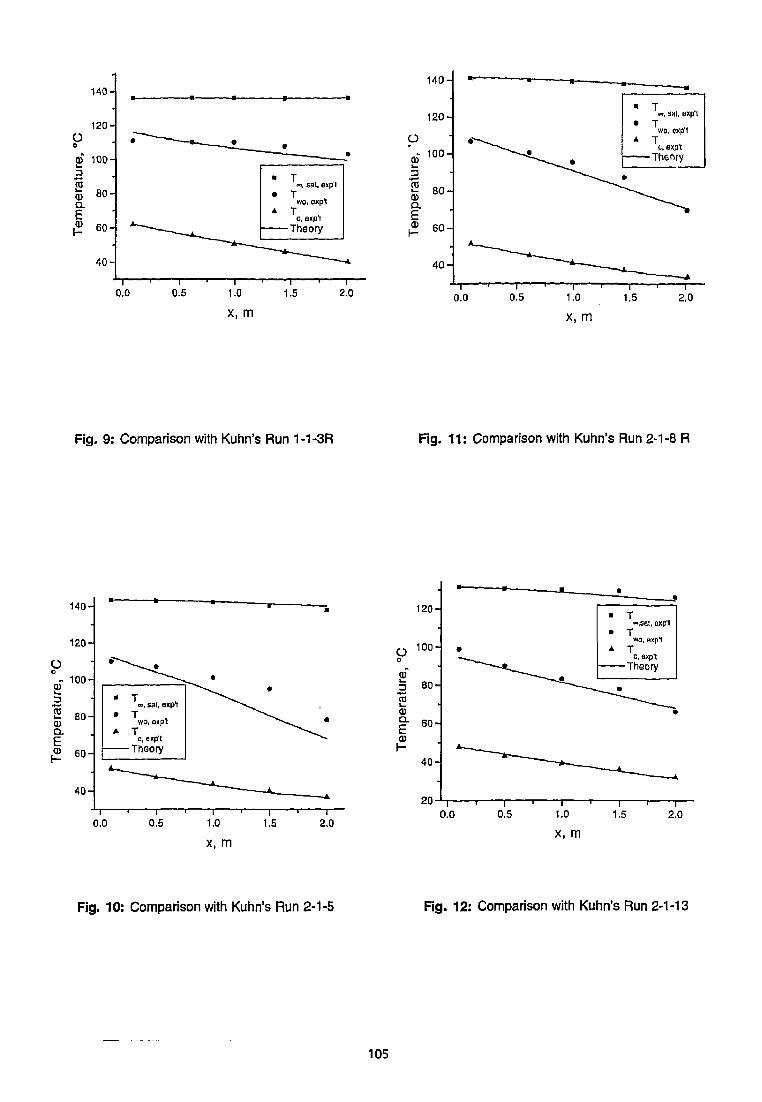
140-
120-
o0
jjf 100-
4-»
CO5 eonQ.
Ei® 60-]
40-
0.0 0.5 1.0
x, m
•», sat, exp'l
wo, exp i
c, exp't
-Theory
1.5 2.0
O
CL
E
140-
120-
80 -
6 0 -
4 0 -
0.0 0.5 1.0
x, m
I1.5 2,0
Fig. 9: Comparison with Kuhn's Run 1-1-3R Fig. 11: Comparison with Kuhn's Run 2-1-8 R
140-
120-
2 aoH
E£ 60-
40-
s°, sat, expi
wo, sxp't
c, exp'l
Theory
0.0 0.5 1.0
x, m
1.5 2.0
120-
ÜO
I20)Q.
E
100-
8 0 -
6 0 -
40 -
20-0.0
I0.5 1.0
x, m
~,sat, oxpi
• TWO, gxp l
c, expl
Theory
i1.5 2.0
Fig. 10: Comparison with Kuhn's Run 2-1-5 Fig. 12: Comparison with Kuhn's Run 2-1-13
105

Nomenclature
A : tube wall areacp : coolant heat capacityD : diffusive coefficientDF: degradation factor/ : friction factorg : gravitational accelerationH : mass transfer coefficienth : heat transfer coefficienthfg : latent heat of steamhg : mass transfer coefficientk : thermal conductivityL : tube lengthm: mass flowratem" : mass fluxM : molecular weight of noncondensableNu : Nusselt numberN : noncondensable gas mole fractionp: total pressurePT : Prandtl numberqt: total heat removed by the coolantq" : heat fluxQt: condensate film flowrater : tube inner radiusÄ c : Rayleigh numberRe : Reynolds numberS: flow area5c : Schmidt numberT : TemperatureU£ : liquid velocityU : gas vertical velocityv : velocity normal to the wallW : noncondensable mass fractionx : vertical distancey: horizontal distance
Greek
p : gas mixture densityPi: liquid film densityH : gas mixture dynamic viscosityHt: liquid dynamic viscosityvi: liquid kinematic viscosity6 : liquid film thickness<j>: correction parameter for friction$ : correction parameter for mass transferT,-: shear stress at the gas-liquid interfaceT[ : derivative of the shear stress with respect to S
Subscripts
c: coolantI: liquid/ : filmfc: forced convectiong '. noncondensablei: liquid-gas interfaceoo : bulk gas mixtureinsol: insoluble aerosolhygro: hygroscopic aerosolm : mixturenc: natural convectiono : no-suction valueout: outletsat: saturationv \ vaporw : inside wallwo: outside wall
References[1] NUSSELT W.: "Die Oberflächenkondensation
des Wasserdampfes "; 2. VDI, Vol. 60, 541-546,569-575(1916).
[2] ROHSENOW W.M, WEBBER J.H., LING A.T: "Ef-
fect of Vapor Velocity on Laminar and TurbulentFilm Condensation"; Trans. Am. Soc. Mech.Engrs., 1637-1643(1956).
[3] KOCH J.C.Y, SPARROW E.M, HARNET J.P.: TheTwo Phase Boundary Layer in Laminar filmCondensation"; Int. J. Heat Mass Transfer, 2,69-82,139(1961).
[4] DOBRAN F., THORSEN R.: "Forced Flow LaminarFilmwise Condensation of a Pure Saturated Va-por in a Vertical Tube"; Int. J. Heat Mass Trans-fer, 23,161-177(1979).
[5] BELLINGHAUSEN R., RENZ U.: "Heat Transfer andFilm Thickness during Condensation of SteamFlowing at High Velocity in a Vertical Pipe";Int. J. Heat Mass Transfer, 35, No 3, 683-689(1992).
[6] SPARROW J.W., LIN S.H.: "Condensation HeatTransfer in the Presence of a NoncondensableGas"; J. Heat Mass Transfer, 9,430(1964).
106

[7] MINKOWYCZ W J , SPARROW E.M: "Condensa-tion Heat Transfer in the Presence of Noncon-densables, Interfacial Resistance, Superheat-ing, Variable Properties, and Diffusion"; Int. J.Heat Mass Transfer, 9, 1359-1144(1966).
[8] AL DIWANI H.K, ROSE J.W.: "Free ConvectionFilm Condensation of Steam in the Presenceof Noncondensable Gases"; Int. J. Heat MassTransfer, 16,1359-1366(1972).
[9] ROSE J.W.: "Approximate Equations for ForcedConvection Condensation in the Presence of aNoncondensing Gas on a Flat Plate and Hor-izontal Tube"; int. J. Heat Mass Transfer, 23,539(1980).
[10] DEHBI A., GOLAY M.W, KAZIMI M.S.: "Condensa-
tion Experiments in Steam-Air and Steam-Air-Helium Mixtures under Turbulent Natural Con-vection"; National Heat Transfer Conference,AlchE Proceedings,19-28, Minneapolis (1991).
[11] WANG C, TU C : "Effects of Non-condensableGas on Laminar Film Condensation in a Verti-cal Tube"; Int. J. Heat Mass Transfer, 31, 2339,(1988).
[12] SIDDIQUE M., GOLAY M.W, KAZIMI M.S.: "LocalHeat Transfer Coefficients for Forced Convec-tion Condensation of Steam in a Vertical Tubein the Presence of a Noncondensable Gas";Nucl. Technol., 102, 386(1993).
[13] SIDDIQUE M., GOLAY M.W, KAZIMI M.S.: 'Theo-retical Modeling of Forced Convection Conden-sation of Steam in a Vertical Tube in the Pres-ence of a Noncondensable Gas"; Nucl. Tech-nol., 31, 2339(1994).
[14] KAIPING P., RENZ U.: Thermal Diffusion Effectsin Turbulent Partial Condensation"; Int. J. HeatMass Transfer, 34, No 10, 2629-2639(1991).
[15] GHIAASIAAN S.M., KAMBOJ B.K, ABDEL-KHALIK S.I.:
'Two-fluid Modeling of Condensation in thePresence of Noncondensables in Two-PhaseChannel Flows "; Nuclear Science and Engi-neering, 119, 1-17(1994).
[16] KAYS W.M., MOFFAT R.J.: "The Behavior of
Transpired Turbulent Boundary Layers", Stud-ies in Convection"; Academic Press, New York(1975).
[17] GNIWLINSKI V.: "New Equations for Heat andMass Transfer in Turbulent Pipe and ChannelFlow"; Int. Chem. Eng., 16, 359(1976).
[18] "UK Steam Tables in SI Units."; EdwardArnold(1970).
[19] JACOB M.: "Heat Transfer in Evaporation andCondensation -ll"; Mech. Engng, 58, 729-740(1936)
[20] GOODYKOONTZ H., DORSCH R.G.: "Local Heat-Transfer Coefficients for Condensation ofSteam in Vertical Downflow Within a 5/8 InchDiameter Tube"; NASATN D-3326(1966).
[21] VIEROW A.t SCHROCK V.E.: "Condensation in
a Natural Circulation Loop With Noncondens-able Gases Part I - Heat Transfer"; Proc. Intl.Conf. on Multiphase Flows,193-186, Tsukuba,Japan(1991).
[22] KUHN S.Z., SCHROCK V.E, PETERSON P.F: "An
Investigation of Condensation from Steam-GasMixtures Flowing Downward Inside a VerticalTube"; NURETH 7, Saratoga Springs(1995).
[23] CHURCHILL S.W.: "A Comprehensive Correlat-ing Equation for Laminar, Assisted, Forced,and Free Convection"; AlchE J., 23,10(1977).
107

Ref.
1 (Fig.6)
1 (Fig.6)
1 (Fig.6)
1 (Fig.6)
1 (Fig.6)
1 (Fig.6)
1 (Fig.6)
1 (Fig.6)
2 (Run 5)
2 (run 13)
Uinletm/s
20
40
20
40
20
10
10
20
20
26.5
Lm
1.21
1.21
1.21
1.21
1.21
1.21
1.21
1.21
2.32
1.86
Dcm
0.04
0.04
0.04
0.04
0.04
0.04
0.04
0.04
0.0148
0.0158
Too°C100
100
100
100
100
100
100
100
130
127
-too ~ J-iii
°c28
11
28
11
4
6
12
20
23.5
29.5
Nuexv
325
475
369
491
460
363
340
353
112
154
Nutheory
325.7
414.3
441.3
571.4
590.7
453
371
365.7
112.4
127.5
Table 1: Comparison between the model Predictions andPure Steam Data
Parameter
T • . °/"*•Lsat,xnlet' '-'
Tnv<iniet,kg/$ec
•* co,inlet
mc, kg/see
•*-c,inleti ^
Run 1-1-1
104.0
0.01672
0
0.278
39.0
1-1-3R
136.0
0.01653n o
0.308
40.0
Run 2-1-5
143.5
0.01430
0.0589
0.343
36.5
Run 2-1-8 R
141.4
0.01422
0.148
0.257
33.2
Run 2-1-13
131.8
0.01391r 0.396
0.2106
32.0
Table 2; Parameters in the Experimental Runs by Kuhn
108
NEW EXPERIMENTAL INSIGHTS TO THE NEUTRON PHYSICS OF SMALL,LOW-ENRICHED, HIGH TEMPERATURE REACTOR SYSTEMS
T. Williams, O. Köberl, D. Mathews and R. Seiler
Laboratory for Reactor Physics and Systems Engineering
Abstract
The current programme of integral experiments at thePROTEUS zero-power, critical facility comprises in-vestigations of the safety-related reactor physicsproperties of graphite-moderated systems fuelled withlow-enriched uranium. The programme addressesspecific topics of high temperature reactor design inaddition to more generic aspects such as neutronstreaming, reactor kinetics and doubly heterogeneousfuel. One of the main areas of interest is the criticalityof "easy-to-interpret" benchmark configurations for thevalidation of reactor physics methods and data. Speci-fically, the reactivity effects of neutron streaming andof accidental water ingress on the typically under-moderated cores and the interplay of these two effectsare of particular importance. This paper presents aselection of results from the current programme andindicates how the PROTEUS experiments are provi-ding new insights to the reactor physics of this type ofsystem.
1 Introduction
The basic High Temperature Reactor (HTR) concept,namely high-integrity, ceramic-type fuel in the form ofpyrocarbon and SiC coated microspheres embeddedwithin a graphite matrix, helium cooled and containedwithin a structural graphite reflector, originated as earlyas the late 1950s [1]. The concept was further develo-ped and tested over the following years in a number ofcritical experiments and prototype reactors in the USA[2], UK [3], Japan [4], France [5], Germany [6] andRussia [7], as summarised in Table 1 overleaf.
The table indicates the two distinct variations on theHTR theme, namely block-type systems, developedpredominantly in the USA and Japan, and pebble-bedsystems, which have been mainly associated with theGerman and Russian programmes. It is seen that themajority of systems have been of the block-type andwere based upon the high-enriched uranium/thorium(HEU/Th) fuel cycle. Furthermore, the prototype de-signs have been predominantly orientated towardslarge diameter systems (3-5m) in which, due to a rela-tively low reflector importance, it was neccessary toprovide some form of shutdown-/contro!-rod mecha-nism within the core region itself. In addition to variousneutron-physical disadvantages, this approach hasbeen shown to possess a number of further problems,particularly in pebble-bed systems, in which the locati-on of absorber rods within the pebble-bed itselfpresents a number of serious engineering difficulties.
In the 1980s, as a result of non-proliferation consi-derations, and due to the lack of the neccessaryHEU/Th fuel route infrastructure, the design emphasisturned to low enriched uranium (LEU) systems. Also,the modular-HTR concept was introduced in which thetypical core diameter was significantly reduced (-2m)in order to increase neutron leakage to the reflector sothat control-rods in the core region were no longerrequired. This avoids the problems mentioned above,but with the disadvantage that a relatively strong re-activity increase can be experienced in the event ofaccidental water ingress to the core.
Looking again at Table 1 it is seen that, althoughsome measurements had been made in LEU systems,there was nevertheless a perceived need in the mid1980s for validation data relating to small- and medi-um-sized, LEU-HTR systems, in particular with respectto properties relating to the effects of water ingressand neutron streaming. The PROTEUS experimentswere designed to fill this gap in the validation databasevia benchmark quality measurements in clean, easy-to-interpret critical configurations, using pebble-typefuel.
Although the countries responsible for the originaldevelopment of the HTR design are currently showingminimal interest in the further application of the con-cept, there is a new wave of interest being shown,noteably in those countries currently having little or nolight-water reactor infrastructure. The current series ofLEU-HTR experiments are providing direct help tothese countries via an IAEA Coordinated ResearchProgramme [8] in which PROTEUS plays a central roleand which eight seperate institutes, representing se-ven countries, are actively involved.
2 Neutron streaming and water ingress
As a result of economic considerations and due to thedesire to increase reflector importance, the core regi-ons of modular HTR systems are typically undermode-rated. In addition to the fact that the reactivity effect ofsupplying additional moderating material to the core isthen positive [9] the worths of reflector-based absorberrods are also significantly reduced [10]. These twoeffects are demonstrated in Fig. 1 in which calculatedchanges in system multiplication (ken) and the worth ofabsorber rods situated in the radial reflector are plot-ted as a function of water density in the core regionof a typical PROTEUS configuration.
109

Reactor/CriticalPEACH BOTTOMHTGRHTLTRHITREX-2CESAR-IIARGONAUTKAHTERSHEA/HTRCCNPSGROG/ASTRA
DRAGONAVRPEACH BOTTOMFORT ST. VRAINTHTR 300HTTR
HTR-PROTEUS
Period59-6266-6970-7171-7570-7270s73-7575-9587-8980s
64-7566-8867-7574-8983-8997-
92-96
CountryUSAUSAUSAUSAFranceAustriaGermanyJapanUSARussia
UKGermanyUSAUSAGermanyJapan
Switzerland
MW(th)1
00
00000000
204611584275030
0
B/P2
BBBBPPPBBP
BPBBPB
P
Control3
cccC+R--
cccC+RRNOSESC
cC+RC+R
R
H/D(m)4
1.2/1.51.8/2.13.0/1.52.0/2.5•
-
2.8/2.22.4/2.41.1/1.21.0-4.2/1.0-3.5
1.6/1.12.8/3.02.3/2.74.8/5.95.0/5.02.9/2.3
1.2/1.2
Fuel Type(HEU(93%)/Th)(HEU(93%)/Th)(Pu, HEU(93%VTh)LEU (3.5%)LEULEU (driven system)HEU(93%)/ThLEU (2-20%)LEU(20%)LEU(6.5-10%)
HEU(93%)/ThHEU(93%)/Th+LEUHEU(93%)/ThHEU(93%)yThHEU(93%)miLEU
LEU
Cto 2 MU 5
27752700570010300•
-
75502000-1600030002500-7680
-
377020003000--
5600-120001 System power z (B)lock or (P)ebble type Control rods in (C)ore or (R)eflector (H)eight/(D)iameter Typical values
Table 1 : A summary of the critical experiments and prototype reactors constructed in support of HTR design
The peak in the reactivity curve occurs when the coreis optimally moderated; at this point the only effect ofadding water is an increase in neutron absorption.
20
0 5 t) E 20 25
Water Density in % of Void Space Betw een Pebbles
= critical
Fig. 1: System reactivity and shutdown-rod worth as afunction of water density between pebbles(Void fraction = 0.4, C to ^ U ratio = 5660)
In the analysis of any system containing significantamounts of void- or other low absorption materials, theproblem of neutron creaming must be addressed. Theusual, reaction-rate conserving, homogenisation of aregion containing voids comparable in size to the neu-tron mean free path in that region does not conservethe neutron diffusion properties of the region, whichgenerally means a greater observed neutron trans-parency of the system than is predicted. Consequent-ly, as computational methods and hardware are still
not sufficiently advanced to allow the explicit represen-tation of repetitive void regions in reactor design, theso-called streaming corrections must be applied [11].In the case of accidental water ingress, the presenceof water not only changes the moderation properties ofthe core but also its streaming characteristics. Theanalysis of such systems therefore presents a greatchallenge and is the main topic both of this paper andof the HTR-PROTEUS programme in general [12].
3 Description of the PROTEUS facility
The PROTEUS facility, shown schematically in Fig. 2,comprises a graphite cylinder of 3.26m diameter and3.3m height with a cylindrical cavity 1.25m in diameter
SHUTDOWN-RODS
1
GfWPHTE \
| I
S6T3
Fig. 2: A side view of the HTR-PROTEUS facility(dimensions in mm)
110
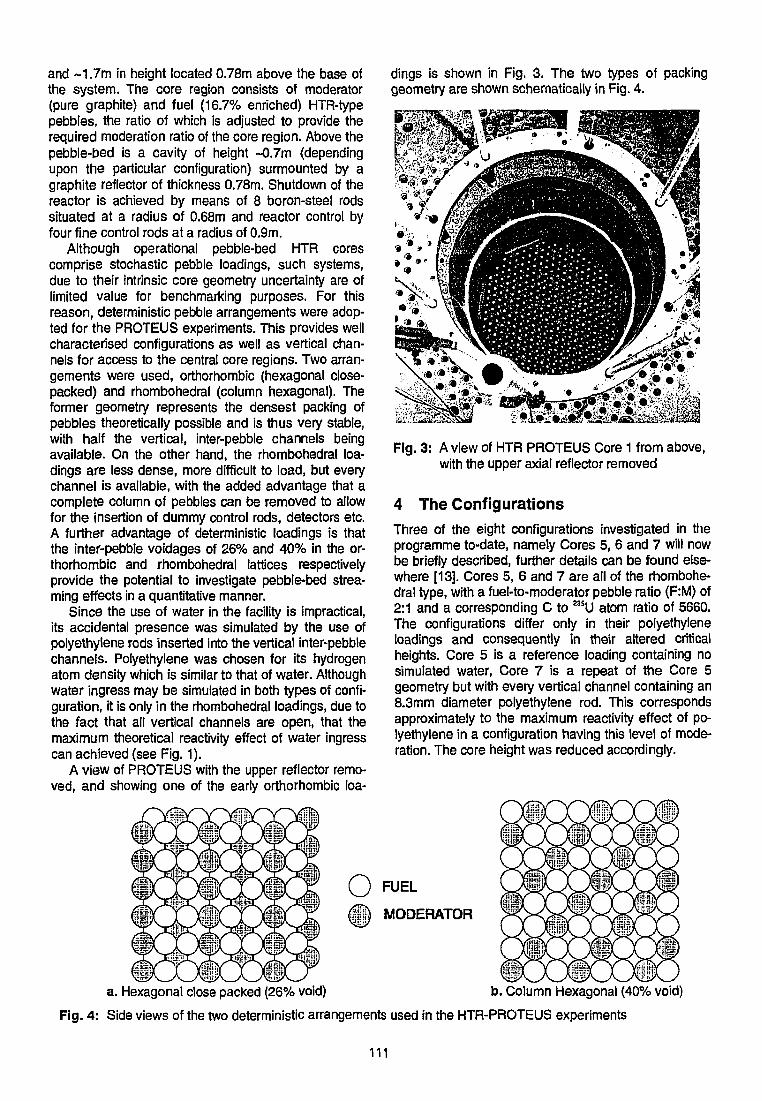
and ~1.7m in height located 0.78m above the base ofthe system. The core region consists of moderator(pure graphite) and fuel (16.7% enriched) HTR-typepebbies, the ratio of which is adjusted to provide therequired moderation ratio of the core region. Above thepebble-bed is a cavity of height -0.7m (dependingupon the particular configuration) surmounted by agraphite reflector of thickness 0.78m. Shutdown of thereactor is achieved by means of 8 boron-steel rodssituated at a radius of 0.68m and reactor control byfour fine control rods at a radius of 0.9m.
Although operational pebble-bed HTR corescomprise stochastic pebble loadings, such systems,due to their intrinsic core geometry uncertainty are oflimited value for benchmarking purposes. For thisreason, deterministic pebble arrangements were adop-ted for the PROTEUS experiments. This provides wellcharacterised configurations as well as vertical chan-nels for access to the central core regions. Two arran-gements were used, orthorhombic (hexagonal close-packed) and rhombohedral (column hexagonal). Theformer geometry represents the densest packing ofpebbles theoretically possible and is thus very stable,with half the vertical, inter-pebble channels beingavailable. On the other hand, the rhombohedral loa-dings are less dense, more difficult to load, but everychannel is available, with the added advantage that acomplete column of pebbles can be removed to allowfor the insertion of dummy control rods, detectors etc.A further advantage of deterministic loadings is thatthe inter-pebble voidages of 26% and 40% in the or-thorhombic and rhombohedral lattices respectivelyprovide the potential to investigate pebble-bed strea-ming effects in a quantitative manner.
Since the use of water in the facility is impractical,its accidental presence was simulated by the use ofpolyethylene rods inserted into the vertical inter-pebblechannels. Polyethylene was chosen for its hydrogenatom density which is similar to that of water. Althoughwater ingress may be simulated in both types of confi-guration, it is only in the rhombohedral loadings, due tothe fact that all vertical channels are open, that themaximum theoretical reactivity effect of water ingresscan achieved (see Fig. 1).
A view of PROTEUS with the upper reflector remo-ved, and showing one of the early orthorhombic loa-
dings is shown in Fig. 3. The two types of packinggeometry are shown schematically in Fig. 4.
Fig. 3: A view of HTR PROTEUS Core 1 from above,with the upper axial reflector removed
4 The Configurations
Three of the eight configurations investigated in theprogramme to-date, namely Cores 5, 6 and 7 will nowbe briefly described, further details can be found else-where [13]. Cores 5, 6 and 7 are all of the rhombohe-dral type, with a fuel-to-moderator pebble ratio (F:M) of2:1 and a corresponding C to asU atom ratio of 5660.The configurations differ only in their polyethyleneloadings and consequently in their altered criticalheights. Core 5 is a reference loading containing nosimulated water, Core 7 is a repeat of the Core 5geometry but with every vertical channel containing an8.3mm diameter polyethylene rod. This correspondsapproximately to the maximum reactivity effect of po-lyethylene in a configuration having this level of mode-ration. The core height was reduced accordingly.
O FUEL
# 1 MODERATOR
a. Hexagonal close packed (26% void) b. Column Hexagonal (40% void)
Fig. 4: Side views of the two deterministic arrangements used in the HTR-PROTEUS experiments
111
Core 6 was an attempt to separate the effects of wa-ter ingress and core height reduction, the positivereactivity effect of the polyethylene being approxi-mately balanced by lengths of high purity copper wireheld within each polyethylene rod. Further details ofthe three configurations are given in Table 2.
5 Transport / diffusion theory calculations
The configurations described above were analysedusing both diffusion theory and discrete-ordinatestransport theory.
For the diffusion theory calculations, the presentPSI production version of the 2DB code, referred toas 2DTB [14], was used, along with a 13 group XSLIBformat cross-section library [15] prepared with edition14 (29.9.94) of the MICROX-2 code [16], from theJEF-1 based nuclear data library [17]. Separate cross-sections were prepared for the core and reflector re-gions using relevant weighting spectra.
The transport theory calculations were made withthe present PSI version of the TWODANT discreteordinates code [15] using the cross sections descri-bed above and with a Pi Legendre expansion and S-Jangular quadrature (S-a for reaction-rate distributions).No streaming corrections were applied in any of thecalculations.
The kinetics parameters ße« and A were calculatedusing the PSI version of the perturbation theory codePERT-V [18], using forward and adjoint fluxes fromTWODANT and separate velocities for the core andreflector regions [19].
In addition to the calculations made using the JEF-1 library, an additional sensitivity study of the effect onkeif of using the JEF-2.2 and ENDF-B/VI libraries inTWODANT was also carried out.
6 Critical loadings and reactivity balances
Table 2 contains experimental results for the criti-cal loadings of the three core configurations. It wasnot possible in any of the cases to achieve criticalitywith a top layer having the nominal core average F:Mratio. Instead, partially fueled layers were loadedwhich enabled a critical balance to be achieved withinthe range of the fine control rods. The true loadings
are reflected in the respective numbers of fuel andmoderator pebbles given in the penultimate column.
Although, of course, the nominal, effective multipli-cation factor keif of each critical state is 1.0, this valuehas been corrected, in the table, for the reactivityexcess in the system due to those components whichare not considered to be a part of the "clean configu-ration". This includes, for instance, effects due tocontrol-rod insertion, presence of nuclear and tempe-rature instrumentation, start-up sources etc., the ma-gnitude of each such effect having been either mea-sured or estimated for each configuration. The valuesof ketf thus corrected are given in the final column ofTable 2. The reactivity excess is seen to be typicallyof the order of 0.5-1% with an uncertainty of -0.05%(-7C). This uncertainty is not associated with the ac-curacy with which the critical state can be determined(±0.10) but rather with the experimental uncertaintiesarising from the measurement and estimation of thevarious components of the reactivity excess. A typicalbreakdown of the reactivity excess components forCore 7 is as follows:
control rod insertion 48±10
control absorber channels 1 ±10
automatic control rod 7±10
various voids in radial reflector 14±30
instrumentation 7±20
total correction 93±50
corrected ko« (ßetf=0.0072) 1.0068±0.0004
The results of the analyses of the critical balancesof cores 5, 6 and 7, compared with the experimentalresults from in Table 2 are summarised in Table 3.Looking firstly at the Core 5 and Core 7 results for theJEF-1 data library, a similar trend of increased calcu-lation-to-experiment ratio (C/E) with increased coremoderation is observed for both TWODANT and2DTB. In Core 6, however, which contains a largerpolyethylene loading than Core 7, the C/E value iscloser to 1.0 than in the latter configuration, suggestingthat the reduced core height and consequently largercavity in Core 7 may play an important role.
112

CORE
5
6
7
M:Fn
2:1
2:1
2:1
FF2
0.60
0.60
0.60
CHJNCORE
none
41.43kgm'3
32.63kgrn3
CuINCORE
none
14.34kgm'3
none
COREHEIGHT
138cm
132cm
108cm
NUMBEROF LAYERS
23 layers
22 layers
18 layers
NO. OFPEBBLES
Mod.
2870
2758
2277
Fuel
5433
5184
4221
MEASURED keff3
1.0111 ±0.0005
1.007510.0004
1.006810.0004
1 M:F = moderator to fuel pebble ratio 2 FF = pebble filling factor
Table 2: Critical balances for cores 5, 6 and 7
corrected for reactivity excess
CORE
5
6
7
MEASURED keff
1.0111 ±0.0005
1.0075+0.0004
1.0068+0.0004
CALCULATED keff
TWODANT
JEF-1
1.01412(+0.3+0.05)%
1.024202(+1.7+0.04)%
1.031696(+2.5+0.04)%
JEF-2.2
(+0.5+0.05)%-
(+2.510.04)%
ENDF/B-VI
(+0.4+0.05)%-
(+2.410.04)%
2TDB
JEF-1
1.008785(-0.2+0.05)%
1.017830(+1.0+0.04)%
1.020734(+1.410.05)%
Table 3: Comparison of measured and calculated values of keff for HTR-PROTEUS cores 5,6 and 7(figures in brackets indicate deviation of the calculated value from the measurement)
It also appears that the transport theory solutiongenerally agrees somewhat less well with experimentthan does the diffusion theory; at least for the morehighly moderated cases. Looking at the effect of thealternative data libraries we can see that the influenceis slight, with even a suggestion of a slight worseningof the C/E value for Core 5 when the more recentdata ia used.
An extensive calculational benchmark study [20],specified by PSI and calculated by 8 independentinstitutions, in which a range of HTR-PROTEUS typeconfigurations was specified has revealed only a mo-dest (<1%) spread in the results of k0» calculationsfrom the individual institutions, indicating that the re-sults presented here are representative of currentcalculational capabilities.
It is not altogether surprising that C/E discrepan-cies are observed here, considering that no attemptwas made to take into account the effects of neutronstreaming. However, the application of streamingcorrection factors, especially in transport theory, is notstraightforward and it is thus preferable to first try tounderstand the physical processes involved beforeattempting to apply corrections. So, although it is as-sumed that the application of suitable corrections willreduce the discrepancies, it will now be shown howcomplementary measurements, made in cores 5 and7 can be used as diagnostic tools to enable semi-
quantative conclusions to be drawn as to the validityof the assumption, and thus to shed some light uponthe level of sophistication required in order to satisfac-torily predict the physical behaviour of these systems.
7 Reaction-rate distributionsThe vertical channels available in the deterministicpebble loadings facilitate the insertion of activationfoils or miniature fission chambers for the mapping ofaxial and radial reaction-rate distributions between thepebbles. Channels in the lower and upper axial reflec-tors allow traverses to be made over the total systemheight of -3300mm. In this work, axial reaction-ratetraverses for fission in ^ U and ̂ U (F5 and F8) will bepresented as indices of fast and thermal neutron fluxdistributions respectively.
Due to their convenience and high sensitivity, theuse of miniature fission chambers is the generallypreferred technique, with the additional use of activa-tion foils serving to further reduce systematic uncer-tainties. The 6.7 mm diameter foils were attached toaluminium strips inserted into the vertical channels.For the measurement of fast neutron reaction-rates(F8), the fission chambers and foils were shieldedwith cadmium to eliminate the need to correct for theinevitable presence of trace amounts of thermallyfissile impurities in the aBU.
113
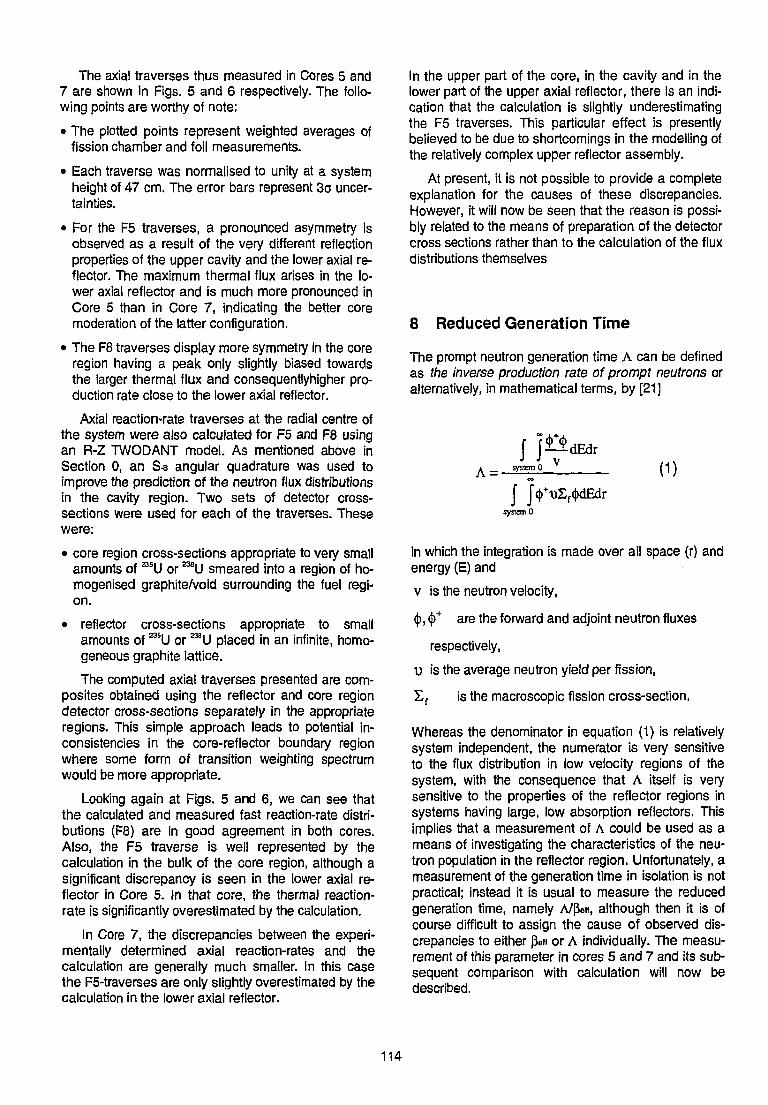
The axial traverses thus measured in Cores 5 and7 are shown in Figs. 5 and 6 respectively. The follo-wing points are worthy of note:
• The plotted points represent weighted averages offission chamber and foil measurements.
• Each traverse was normalised to unity at a systemheight of 47 cm. The error bars represent 3o uncer-tainties.
• For the F5 traverses, a pronounced asymmetry isobserved as a result of the very different reflectionproperties of the upper cavity and the lower axial re-flector. The maximum thermal flux arises in the lo-wer axial reflector and is much more pronounced inCore 5 than in Core 7, indicating the better coremoderation of the latter configuration.
• The F8 traverses display more symmetry in the coreregion having a peak only slightly biased towardsthe larger thermal flux and consequentlyhigher pro-duction rate close to the lower axial reflector.
Axial reaction-rate traverses at the radial centre ofthe system were also calculated for F5 and F8 usingan R-Z TWODANT model. As mentioned above inSection 0, an S-a angular quadrature was used toimprove the prediction of the neutron flux distributionsin the cavity region. Two sets of detector cross-sections were used for each of the traverses. Thesewere:
• core region cross-sections appropriate to very smallamounts of 235U or ^ U smeared into a region of ho-mogenised graphite/void surrounding the fuel regi-on.
• reflector cross-sections appropriate to smallamounts of Z35U or ^ U placed in an infinite, homo-geneous graphite lattice.
The computed axial traverses presented are com-posites obtained using the reflector and core regiondetector cross-sections separately in the appropriateregions. This simple approach leads to potential in-consistencies in the core-reflector boundary regionwhere some form of transition weighting spectrumwould be more appropriate.
Looking again at Figs. 5 and 6, we can see thatthe calculated and measured fast reaction-rate distri-butions (F8) are in good agreement in both cores.Also, the F5 traverse is well represented by thecalculation in the bulk of the core region, although asignificant discrepancy is seen in the lower axial re-flector in Core 5. In that core, the thermal reaction-rate is significantly overestimated by the calculation.
In Core 7, the discrepancies between the experi-mentally determined axial reaction-rates and thecalculation are generally much smaller. In this casethe F5-traverses are only slightly overestimated by thecalculation in the lower axial reflector.
In the upper part of the core, in the cavity and in thelower part of the upper axial reflector, there is an indi-cation that the calculation is slightly underestimatingthe F5 traverses. This particular effect is presentlybelieved to be due to shortcomings in the modelling ofthe relatively complex upper reflector assembly.
At present, it is not possible to provide a completeexplanation for the causes of these discrepancies.However, it will now be seen that the reason is possi-bly related to the means of preparation of the detectorcross sections rather than to the calculation of the fluxdistributions themselves
8 Reduced Generation Time
The prompt neutron generation time A can be definedas the inverse production rate of prompt neutrons oralternatively, in mathematical terms, by [21]
J ]**A __ system 0
J J<t>+i)Zf<])dEdr(1)
system 0
in which the integration is made over all space (r) andenergy (E) and
v is the neutron velocity,
(j), <}>+ are the forward and adjoint neutron fluxes
respectively,
D is the average neutron yield per fission,
£ f is the macroscopic fission cross-section.
Whereas the denominator in equation (1) is relativelysystem independent, the numerator is very sensitiveto the flux distribution in low velocity regions of thesystem, with the consequence that A itself is verysensitive to the properties of the reflector regions insystems having large, low absorption reflectors. Thisimplies that a measurement of A could be used as ameans of investigating the characteristics of the neu-tron population in the reflector region. Unfortunately, ameasurement of the generation time in isolation is notpractical; instead it is usual to measure the reducedgeneration time, namely A/ßs«, although then it is ofcourse difficult to assign the cause of observed dis-crepancies to either ße« or A individually. The measu-rement of this parameter in cores 5 and 7 and its sub-sequent comparison with calculation will now bedescribed.
114

o
"E
n~CO
oc
ra
|••s
3CE0)
5acr
40 80 120Height (cm)
160 200 240 280
Fig. 5 Axial reaction-rate traverses F5 and F8 in Core 5
Upper AxialReflector
I'c3
0)N
"to
o
CDm
DC
O
toCDGC
5cu
(X
^ • FS, Experiment
-f- • F8, Experiment
F5, Calculation
F8, Calculation
-80 -40 0 40 80 120 160 200 240 280
Height (cm)
Fig. 6 Axial reaction-rate traverses F5 and F8 in Core 7
115

For the measurement, use is made of the pulsedneutron source (PNS) technique [22]. By subjectingthe subcritical system to a regular series of briefneutron pulses, it is possible to measure the respon-se function of the system. Typical response functi-ons for several subcritical states are shown in Fig. 7,in which it is possible to identify the prompt and de-layed neutron responses. The prompt decay which,in the absence of harmonic effects, can be represen-ted by a single exponential exp(otot) and which canbe obtained from a non-linear least-squares fit to theresponse is a direct measure of the
100000-
U3
1O0OO:
1000
= -0.13$
p = -0.49$
p = -0.90$
prompt decay
delayed decay
100 200 300 400 500
CHANNEL NUMBER (WIDTH=0.0015s)
Fig. 7: Typical responses to pulsing in PROTEUSshowing variation with subcriticality
prompt neutron lifetime and in the critical state (p =reactivity = 0), can be related to A/ßeff by
(2)
where
(XQ is the prompt decay constant at criticality,
bj , ^ i are the delayed neutron constants,
where
and the superscript c indicates the critical state.
Unfortunately, due to the increasing difficulty inseparating the prompt decay from the delayed back-ground when close to criticality (see Fig. 7), it is notpossible to measure ecu directly. Thus an alternative
technique is normally adopted, in which the promptdecay constants at several, well-known subcriticalstates are measured and an extrapolation is made tothe critical state, using a function which expressesthe correct form of the a vs. p relationship aroundcriticality [23]. This procedure was carried out incores 5 and 7, and the results are summarised inTable 4.
c0RE
5
6
7
MEAS.
A/ßeff
0.278±0.002
-
0.207±0.005
TWODANT
(Jeff
0.007201
0.007216
0.007270
A/ßeff
0.2583
0.1598
0.1835
C/E
A/ßeff
0.931 ±0.007
-
0.886±0.02
Table 4: Comparison of measured and calculatedvalues of reduced generation time
The main point to be noted from the table is thatthe calculations for both configurations show a signi-ficant underestimation of the reduced generationtime, specifically 7% in core 5 and 11% in Core 7.Although no measurements of ßaff are currentlyavailable, the calculated value of ßa« is seen to varyonly slightly (<1%) over a wide range of core mode-ration. This can be physically understood by the factthat the system contains just two fissionable iso-topes, namely a5U and 238U, and that only 2 or 3 % ofthe total fissions occur in the M U . Changes in themoderation will only induce changes of a fraction ofa percent in this value and will thus only slightly af-fect ßetf. It will therefore be assumed here that thediscrepancy in A/ßeff arises from the calculation of A.This implies that in undermoderated systems (core5), A is being underestimated by around 7% and inoptimally moderated systems (core 7) by around11%.
9 Summary and discussionA considerable amount of information has beenpresented here which can be used together to provi-de an in-depth picture of the neutron physics of thistype of system. Before the implications of the obser-vations are discussed, some of the results wiü besummarised once more inTable 5. The table shows:• an overestimation of ke« which increases with in-
creasing moderation.• an overestimate of the thermal detector reaction-
rates in the reflector which decreases with increa-sing moderation.
• an underestimate of the generation time whichincreases in absolute terms with increasing mode-ration
keff
integrated F5 inlower reflector
A/ßeff
Core 5
+0.3%
+8.0%
-7%
Core 7
+2.5%
+0.3%
-11%
Table 5: Calculation-experiment deviations for pa-rameters measured in cores 5 and 7
116

Looking first at the overestimation of ka«, it could bethe result of a number of factors, including:
• modelling and/or data inadequacies
• overestimation of neutron productions (fissionableinventory)
u underestimation of the system absorption, particular-ly in the reflector region
• underestimation of leakage
Of course the katf results alone can provide nofurther information as to the origin of the inadequacyin the cafculation. Therefore, turning to the A/ßaff re-sults, the pronounced underestimation could corre-spond to an underestimation of the thermal flux in thereflector, which in turn implies either an underestimateof the neutron leakage or an overestimate of the re-flector absorption properties. However, a reduction inthe reflector absorption would have the undesirableeffect of increasing the calculated keff and so the im-plication is that the overestimation in the core 5 A/ßo„value is associated with an underestimate of thethermal neutron flux* in the reflector. This result isconsistent with the assumption that a failure to takeinto account neutron streaming in the calculation willlead to lower core leakage and subsequently lowerthermal fluxes in the reflector regions.
It could be expected that Core 7, having reducedstreaming/leakage by virtue of reduced core voidageand increased core moderation should exhibit a C/Evalue closer to one than Core 5. That this is not thecase can be explained as follows: although leakagefrom Core 5 is clearly greater than from Core 7, thefact that Core 5 is significantly undermoderated me-ans that fast neutrons leaking to the reflector are mo-derated, and a significant fraction return to enhancethe thermal population in the core. Thus, the negativeeffect of neutron leakage is compensated by the posi-tive effect of enhanced moderation. In core 7, which isalready optimally moderated, this compensation doesnot occur leaving only the negative effect of neutronleakage and thus larger streaming effects.
Turning now to the reaction-rate distributions, asomewhat different picture is seen. In this case thecalculation is seen to be overestimating thermal re-action-rates in the lower axial reflector, which could beconstrued as being inconsistent with the above argu-ment. Two points should be remembered however inthis respect: the reaction-rate distributions presentedhere were measured axially in the radial centre of thesystem. The streaming/leakage effects discussedabove are more significant in the radial reflector bothbecause the volume of the radial reflector is muchgreater and because the predicted streaming in theradial direction is some 50% greater than in the axialdirection in this configuration [24]. In short, the reacti-on rate results presented here are not necessarilyrepresentative of the whole reactor properties.
• as mentioned above, the validity of the detectorcross-section generation procedure used is somewhatdoubtful, with the consequence that discrepancies inthe reaction-rate distributions must not necessarily beassociated with errors in the flux distributions. Itshould nevertheless be mentioned, that, in the case ofreaction rates, the application of streaming correctionswould worsen the C/E discrepancies (increased lea-kage to reflector leading to greater calculated thermalfluxes here).
Although the picture presented here is far fromcomplete, it has been shown that the use of severalindependent but complementary measurements pro-vides a deeper insight both to the neutron physics ofthe system, and to the general adequacy of thecaiculational techniques (and not solely the ability toreproduce keff)
It is planned to carry out additional measurementsand analyses which, it is hoped, will help to completethe picture and thus to answer some of the openquestions arising out of the work presented here. Thisadditional work will include:
• ße« measurements in core 5 to help confirm the as-sumption that the C/E discrepancies in A/ßerr can beattributed mainly to A,
• analysis of control rod worth measurements in theradial reflector to check consistency with the abovearguments, particularly with respect to the predictionof flux distributions in the radial reflector which aredifficult to measure with the fission chamber/foittechniques described here,
• application of more sophisticated cross-section ge-neration methods for the analysis of the reactionrate distributions,
• the measurement of core centre reaction-rate ratiosto investigate the components of the neutron balan-ce within the system
• a study of the effectiveness of streaming correctionsin reducing the discrepancies reported here.
10 Acknowledgements
The authors would like to thank the operational staff ofPROTEUS, namely P. Bourquin, M. Fehlmann and T.Steiner for the safe and efficient operation of the facili-ty during the course of these experiments.
11 References
[1] BBROWN, J.R., DRAKE, M.K., VAN HOWE, K.R.,
"Correlation of Calculations and ExperimentalMeasurements Made Using a Partial CoreMockup of the Peach Bottom HTGR," GA-3799,General Atomics, San Diego, Mar. 1963.
117
[2] BBROWN,, J. R. et a l . , " Physics Testing at FortSt. Vrain - A Review," Nucl. Sei. & Eng., 97,104(1987).
[3] DELLA LOGGIA, V. E. et al., "Zero Energy Expe-riments on the Dragon Reactor Prior to ChargeIV Startup," DP820, Dragon Project, AEEW,Winfrith, UK, Jan. 1973.
[4] KANEKO Y., et al.," Critical Experiments on Enri-ched Uranium Graphite-moderated Cores,"JAERI 1257, June 1978.
[5] SCHERER, W. et al.," Das kritische HTR Experi-ment CESAR-II; ein Test der Aussagekraft neu-tronphysikalischer Berechnungen zur Auslegungvon Hochtemperaturreaktoren," JÜI-975-RG,1973.
[6] DRÜCKE, V. et al.," The Critical HTGR TestFacility KAHTER - An Experimental Program forVerification of Theoretical Models, Codes andNuclear Design Bases," Nucl. Sei. & Eng, 97, 30(1987).
[7] BOGOMOLOV, A. M-, KAMINSKY, A.S. PARAMOV.
V. et al., "Main Characteristics of GROG CriticalFacility and Problem of HTGR Physics Study",VANT issues Atomic-Hydrogen Energy andTechnology, 3(10), Moscow ISSN 0206-4960p.p. 17-21 (1981).
[8] SCHERER, W.," Summary of Discussions on theFuture HTGR PROTEUS Experiments andOther Planned Experiments," IAEA Specialists'Meeting, Villigen, 1990; proc. IAEA-IWGGCR/24,p. 145, 1991.
[9] PELLONI, S. et al, "Parameter Study on WaterIngress in a High Temperature Reactor," Kem-tec/vJ//c,53(3),233(1989).
[10] SEIILER, R. et al., "Experimental Investigation ofReactivity Effects Caused by Water Ingress in aLEU HTR," Proc. IAEA Tech. Mtg. on Responseof Fuel, Fuel Elements and Gas Cooled ReactorCores under Accidental Air or Water IngressConditions, Oct. 25-27,1993, Beijing.
[11] LIIEBEROTH, J. and STOJADINOVIC, "NeutronStreaming in Pebble Beds," Nucl. Sei. & Eng.,76,336(1980).
[12] CHAWLA, R. "Generic Reactor Physics Studies inthe Framework of the PROTEUS LEU-HTRProgramme," Invited Paper IXth Brazilian Mtg.on reactor Physics and Thermal Hydraulics, Oct25-29,1993, Caxambu, Brazil.
[13] WILLIAMS, T./LEU-HTR PROTEUS: Configura-tion Descriptions and Critical Balances for Cores1-7, PSI Internal Report TM-41-95-18, Novem-ber 1995.
[14] LITTLE Jr., W.W. and HARDIE, R.W.," 2DB User'sManual - Revision 1," Report BNWL-831, Rev. 1(1968).
[15] MATHEWS, D.," 24 July 1995 CRAY version ofthe 2DTB Code," PSI Internal Report TM-41-95-11, July 1995.
[16] ALCOUFFE, R.E. et al.," User's Guide for TWO-DANT: A Code Package for Two-Dimensional,Diffusion accelerated, Neutral Particle Trans-port," Loa Alamos National Laboratory ReportLA-10049-M, revised, February 1990.
[17] MATHEWS, D., KOCH, P.," MICROX-2 An Impro-ved Two-Region Flux spectrum Code for the Ef-ficient Calculation of group Cross-sections," Ge-neral Atomic Co. Report GA-A15009, Volume I(1979).
[18] VONTOBEL, P. and PELLONI, S.," JEF/EFF BasedNuclear Data Libraries," EIR-Report 636,December 1987.
[19] HARDIE, R.W. and LITTLE Jr., W.W.,"PERT-V: A
Two-Dimensional Perturbation Theory Code forFast reactor Analysis," Batelle-Northwest,Richland, Wash. Pacific Northwest Laboratory,Report BNW-1162, September 1969.
[20] MATHEWS, D.," The PSI Version of the PERT-VCode," PSI Internal Report TM-41-91-29, Sep-tember 1991.
[21] WILLIAMS,, T.,"The Calculation of Kinetics Datafor Use in the Analysis of Reactivity Measure-ments in HTR-PROTEUS," PSI Internal ReportTM-41-93-36, June 1994.
[22] MATHEWS, D.," Compilation of IAEA CRP Re-sults for the LEU-HTR PROTEUS CalculationalBenchmarks," PSI Internal Report TM-41-93-02(1996).
[23] LEWINS, J . , " The Use of the Generation Time inReactor Kinetics," Nuclear Sei. and Eng. 7,122-126(1960).
[24] KEEPIN, G.R., "Physics of Nuclear Kinetics,"Addison-Wesley publishing Co., Reading, Mas-sachusetts (1965).
[25] WILLIAMS,, T.," On the Choice of Delayed Neu-tron Parameters for the Analysis of Kinetics Ex-periments in !35U Systems", Ann. Nucl. Energy,(accepted for publication Nov 1995).
[26] MATHEWS, D., THIBULSKI, V., CHAWLA R.,
"Anisotropie Diffusion Effects in DeterministicPebble Bed Lattices," Trans Am Nucl Soc,68(A), 438(1993).
[27] MATHEWS, D.,"Diffusion- versus Tranport-TheoryResults for HTR-PROTEUS and the Effect ofNeutron Streaming', PSI Internal Report TM-41-92-37, Nov. 1993.
118

TEACHING ACTIVITIES AND TALKS
University level and other Teaching
In the framework of the enhanced co-operation be-tween PSI and the Universities, DR. W. KRÖGER, headof the Nuclear Energy and Safety ResearchDepartment at PSI, is Professor for SafetyTechnology at the ETH Zürich; DR. G. YADIGAROGLU,
head of the Laboratory for Thermal-Hydraulics at PSI,is Professor of Nuclear Engineering at the ETHZürich; DR. R. CHAWLA, head of the Laboratory forReactor Physics and Systems Engineering at PSI, isProfessor for Reactor Physics at the EPF Lausanne.Their university course lectures are not mentionedbelow.
DANGV.N.
"SLIM - A Method for Using Expert Judgement in HRA(and Case Study)", Nachdiplomkurs „Risiko und Si-cherheit", Vertiefungsmodul V2, Teil 1, „Sicherheit undZuverlässigkeit energiewandelnder Systeme", ETHZürich, Witikon, Switzerland, 13-15. Dec. 1995
DEGUELDRE C."Comportement des radionuclides dans les eauxsouterraines", Universite de Geneve, SH 95/96
DEGUELDRE C.
„Impact d'un reacteur nucleaire dans I'environnement"Universite de Geneve, SH 95/96
HIRSCHSERG S.
"Life Cycle Analysis Applications in the Energy Sec-tor", Nachdiplomkurs „Risiko und Sicherheif, ModulG3: Sicherheit für Mensch und Umwelt am Beispielder technischen Chemie, ETH Zürich, Switzerland,20. April 1995
HIRSCHBERG S.
"Human Reliability Analysis", Nachdiplomkurs „Risikound Sicherheit", Modul G4: Human Factors, ETHZürich, Wädenswil, Switzerland, 5. May 1995
HIRSCHBERG S.
"PSA Methodology Overview; Data Sources andissues/Use of Expert Judgement; Dependencies/Common Cause Failures; Human Reliability Analysis;Analysis Integration and Computer Codes for Level IPSA/QRA; External International Review", Nach-diplomkurs „Risiko und Sicherheit", VertiefungsmodulV2, Tei!1, "Sicherheit und Zuverlässigkeit energie-wandelnder Systeme", ETH Zürich, Witikon, Switzer-land, 13-15. Dec. 1995
HIRSCHBERG S., MOCK R.1
"Overview of the Fundamentals and Methodology ofProbabilistic Safety Assessment", SVA Vertiefungs-kurs „Sicherheit von Kernkraftwerken im Stillstand",SVA Brugg-Windisch, Switzerland, 29-31. March 19951 ETH Zürich, Switzerland
KRÖGER W., FOSKOLOSK., DURISCH W.
"Einführung in energiewandelnde Systeme mit BlicKauf sicherheitsrelevante Aspekte (Kernenergie undPhotovoltaik als Beispiele)", ETH Zürich, Switzerland,Jan. 1995
KRÖGERW."Einleitung, Begriffe, Methodische Ansätze", ETHZürich, Switzerland, Jan. 1995
KRÖGER W."Tendenzen in der Bewertung von Technik", Nach-diplomkurs Risiko und Sicherheit, Hochschule St.Gallen, Switzerland, 13. June, 1995
KRÖGER W."Risikoaspekte energiewandelnder Systeme", Nach-diplomkurs Risiko und Sicherheit 95, Modul V2,Zürich, Switzerland, Dec. 1995
T. THOENEN"Petrologie I", Universite de Fribourg, SH 95/96
Talks
delivered at Conferences, Workshops andSpecialists' Meetings (without Proceedings)
AKSANN., D'AURIAF.1, FALUOMI V.1
"A Comparison and Assessment of Some CriticalHeat Flux Predicton Models Used in ThermalhydraulicSystem Codes", First Research Coordination Meetingon Thermohydraulic Relationships for AdvancedWater Cooled Reactors, IAEA, Vienna, Austria, 5-8.Sept. 19951 University of Pisa, Italy
AKSAN N."Report of Activities (94/95) of Task Group on Ther-malhydraulic System Behaviour (TG-THSB)", and"Proposal for Some New Activities, Planning andPriorities (TG-THSB)", Meeting of OECD/NEA/CSNIPrincipal Working Group 2 on Coolant System Behav-iour, Paris, France, 27-29. Sept. 1995
119
ALDER H.P.
"Lob der Chemie - auch die Reaktorforschung brauchtsie", Seminar des Labors für Werkstoffverhalten amPSI, Switzerland, 22. Dec, 1994
ALDER H.P., HAUSMANN W.
"Analysis of Human Factors in Incidents Reported bythe Swiss Nuclear Power Plants to the Inspectorate",IAEA Technical Committee Meeting "OrganizationalFactors Influencing Human Performance in NuclearPower Plants", Ittingen, Switzerland, 10-14. July 1995
ALDER H.P.
"Non-Invasive Monitoring of LWR Water Chemistry byOptical Methods", IAEA Research CoordinationMeeting "High Temperature On-Line Monitoring ofWater Chemistry and Corrosion (WACOL)", Pennsyl-vania State University, USA, 16-20. Oct. 1995
ALDER H.P.
"Review of the Role and Analysis of Radiolysis Prod-ucts in the Boiling Water Reactor", IAEA ResearchCoordination Meeting "High Temperature On-LineMonitoring of Water Chemistry and Corrosion(WACOL)", Pennsylvania State University, USA, 16-20. Oct. 1995
ANALYTISG.TH.
"The Importance of Two-Phase Flow and HeatTransfer in Nuclear Engineering, Part 1: IntroductoryConcepts and General Approach", Dept. of ReactorPhysics, Chalmers University of Technology, Göte-borg, Sweden, 14. Dec. 1995
ANALYTIS G.TH.
"The Importance of Two-Phase Flow and HeatTransfer in Nuclear Engineering, Part II: TransientAnalysis Thermalhydraulics System Codes and theirApplications", Dept. of Reactor Physics, ChalmersUniversity of Technology, Göteborg, Sweden, 18.Dec. 1995
BART G., HERMANN A .
"Statement of Work for Additional Post IrradiationExaminations on Gösgen Rods", 27th Nuclear FuelIndustry Research Steering Committee Meeting, Al-bany, Oregon, USA, 25-28. April 1995
BART G., GARZAROLLI F.1, GEBHARDT O., HERMANN A.,
RAY l.LF.""Gösgen Project - Post Irradiation Characterization:Finalization of Experimental Program", 27th NuclearFuel Industry Research Steering Committee Meeting,Albany, Oregon, USA, 25-28. April 19951 Siemens KWU, Erlangen, Germany2 European Institute for Transuranium Elements,
Karlsruhe, Germany
BART G., BRUCHERTSEIFER H., HEGEDÜS F.,
KROMPHOLZ K.
"Tools and Experience in Post Irradiation Examinationof Structural Core Components at PSI-Hotlaboratory",International Workshop on Aged and Decommis-sioned Material Collection and Testing for StructuralPurposes, Mol, Belgium, 27-28. June 1995
BART G., GROESCHEL F., HERMANN A., RAY I.L.F.1
"Fuel Cladding Integrity at High Burnups: AdditionalPIE on Gösgen Rods (Project X103-15)", 28thNuclear Fuel Industry Research Steering CommitteeMeeting, Halden, Norway, 1-3. Nov. 19951 European Institute for Transuranium Elements,
Karlsruhe, Germany
BARTHS.1, WERNLIB., KOPAJTICZ., HEINRICHCH.A.1,
VON QUADT A.1, SCHMIDT D.Z, GERWINSKI W.Z
"Boron Isotope Application for Tracing MixingProcesses and Anthropogenic Contamination in anEstuarine Transition Zone (Elbe-North Sea)", Geolo-gical Society of America, 1995 Annual Meeting, NewOrleans, Louisiana, USA, 6-9. Nov. 19951 ETH Zurich, Switzerland2 Bundesamt für Seeschiffahrt und Hydrographie,
Hamburg, Germany
BROGLI R.
"Swiss Fast Reactor Research Program", Int. WorkingGroup on Fast Reactors, IAEA, Vienna, Austria, 9-11.May 1995
BROGLI R.
"Die Gefährdung der Schweiz durch Superphenix",BEW-Tagung "Superphenix", ETH Zürich, Switzer-land, 31. May 1995
BROGLI R.
"Swiss LWR Research Activities", Int. Working Groupon Fast Reactors, IAEA, Vienna, Austria, 15-18. Oct.1995
BROGLI R., VON WEISSENFLUH TH.1
"Schnelle Brüter, Entwicklung in Frankreich undJapan", Studiengruppe Energieperspektiven, Baden,Switzerland, 16. Nov. 19951 EWI Zürich, Switzerland
BROSI S.
"Die Methode der Finiten Elemente - Werkzeug oderForschungsobjekt?", Workshop on ComputationalSciences, PSI, Villigen, 18. Dec. 1995
BRUCHERTSEIFER H., DRESSLER R., FISCHER ST.1,
GAEGGELER H.
"Hochauflösende Gammaspektrometrie bei der on-lineAnalyse von Kernreaktionsprodukten", 3. Workshop:"Chemie der schwersten Elemente", Mainz, Germany,16-17. March 19951 Technische Universität Dresden, Germany
120

BRUCHERTSEIFER H.
"Investigation of High Flux Irradiated Material", Mee-ting on Target, Ion Source and Pulsed Ion Beam Pro-blems, CERN, Geneve, Switzerland, 22-23. May 1995
BRUCHERTSEIFER H.
"Chemische Aspekte der Konditionierung von Pluto-nium- und anderen Actiniden-Abfällen", FB Kern-chemie, Philipps-Universität, Marburg, Germany, 26.Oct. 1995
DE CACHARD F.
"Prominent Effects and Variables in Inverted-AnnularFilm-Boiling", European Two-Phase Flow GroupMeeting, 's Hertogenbosch, Netherlands, 30. May - 2.June 1995
CHAWLA R.
"Perspectives for Energy from Nuclear Fission andthe Role of Reactor Physics Research", 37eme Coursde Perfectionnement, Association Vaudoise desCrtercheurs en Physique (AVCP), Grimentz, Switzer-land, 27. March - 1 . April 1995
CODDINGTON P.
"Safety Analysis of Swiss Nuclear Power Plants",Mexican Nuclear Society, 6th Annual InternationalMeeting, Huatulco, Mexico, USA, 17-20. Sept. 1995
CORTESI A.
"Entrainment and Mixing in Stably-Stratified FreeShear Layers Using Direct Numerical Simulation(DNS)", Euromech Colloquium 339, Lyon, France, 6-9.Sept. 1995
DANG V.N., HIRSCHBERG S.
"Swiss HRA Research and ongoing Work in theFrame of the Coordinated Research Programme",Seminar, IAEA, Vienna, Austria, 3-7. April 1995
DANG V.N.
" 1 . Simulations Operateur-Centrale du Graupe deMIT. 2. La Methode SWM", Electricite de France,Clamart, France, 15. Sept. 1995
DEGUELDRE C.
"Concept of Colloidal Distribution", VGB-Informationsveranstaltung KKW Philippsburg,Philippsburg, Germany, 5-6. April 1995
DEGUELDRE C.
"Charakterisierung von Grundwasserkolloiden bezüg-lich nuklidspezifischen Migrationseigenschaften",Institutskolloquium Forschungszentrum Rossendorf,Dresden, Germany, 30. May 1995
DEGUELDRE C.
"Groundwater Colloid Characterization: from a Spe-cific Site to a Global Approach", Symposium on Col-
loids in Aquatic Environment, Universite de Geneve,Geneve, Switzerland, 19-20. Oct. 1995
DEGUELDRE C, KASEMEYER U., BOTTA F., LEDERGER-
BER G."Plutonium Incineration in LWR's by a Once-ThroughCycle with a Rock-Like Fuel", Material Research So-ciety, Boston, MA, USA, 27. Oct. 1995
DEHBIA.
"Up-Date on the PSI-ROSEIDON Experiments", 12thMeeting of the European Pool Scrubbing Group, Köln,Germany, 23-24. May 1995
DESMARTIN PH.G.1, KOPAJTIC Z., HAERDI W.1
"Strontium-90 Analysis by Ionic Chromatography andOn-Line Liquid Scintillation-Counting", 5th Symposiumon our Environment and 1st Asia-Pacific Workshop onPesticides, Singapore, 5-8. June, 19951 Universite de Geneve, Switzerland
DONES R.
"Environmental Inventories for Future Electricity Sup-ply Systems for Switzerland: Results for GreenhouseGases", IAEA Advisory Group Meeting on Assess-ment of Greenhouse Gas Emission from the FullEnergy Chain for Nuclear Power and Other EnergySources, IAEA, Vienna, Austria, 26-28. Oct. 1995
DURYT.V.,
"Benchmark Calculations Using CFDS-Flow3D forTurbulent Jet Flow in Sodium and Water", 8th Meetingof the IAHR Working Group on Advanced NuclearThermal Hydraulics, Rez, Czech Rep., 13-15. June1995
DURYT.V., SMITH B.L
"Simulation of Turbulent Flow in a Cylindrical DrumWith Multiple Outlets", IMACS-COST Conference onCFD:"Three Dimensional Complex Flows", EPFLLausanne, Switzerland, 5. Sepember 1995
GEBHARDTO., HERMANN A.
"Microscopic and Electrochemical Impedance Spec-troscopy Analyses of Zircaloy Oxide Films Formed inHighly Concentrated LiOH Solution", 3rd InternationalConference on Electrochemical Impedance Spec-troscopy, EIS '95, Nteuwport, 7-12. May 1995
GEBHARDTO., HERMANN A., BARTG., BLANK H.1, GAR-
ZAROLLI F.2, RAY I.L.F.3
"Investigation of In-Pile Grown Corrosion Films onZirconium Based Alloys", 11th International Confer-ence on Zirconium in the Nuclear Industry, Garmisch-Partenkirchen, 11-14. Sept. 19951 FZ, Karlsruhe, Germany2 Siemens, KWU, Erlangen, Germany3 TUI, Karlsruhe, Germany
121

GEBHARDTO., AERNE E.T., MARTIN M., WlTTMAACK K.1
"SIMS Depth Profile and Line Scan Analyses at theMetai/Oxide Interface of Corrosion Films on ZirconiumBased Alloys", 10th International Conference onSecondary Ion Mass Spectrometry and RelatedTechniques, SIMS X, Münster, Germany, 1-6. Oct.1995' GSF - Institut für Strahlenschutz, Neuherberg,Germany
GEBHARDT O., AERNE E.T., MARTIN M., TAO S.,
LOIBL N.1, WlTTMAACK K.2
"High Lateral Resolution Imaging at the Metal/OxideInterface of Zirconium Based Alloys by Secondary IonMass Spectrometry", 6th Conference on Applicationsof Surface and Interface Analysis, ECASIA'95, Mon-treux, Switzerland, 9-13. Oct. 1995' Atomika Instruments, Oberschleissheim, Germany2 GSF - Institut für Strahlenschutz, Neuherberg,
Germany
GÜNTAY S.
"Update on PSI Activities on Fission Products andAerosol Research", OECD/NEA Principal WorkingGroup 4 "Fission Products in Containment", Meeting,Paris, France, 20. March 1995
GÜNTAYS.
"Severe Accident Research at Paul Scherrer Institut",Advisory Group Meeting on Severe Accident Analysisand Simulations, IAEA, Vienna, Austria, 10-12. April1995
GÜNTAY S.''Planning of Experimental Research on 'Agl-RadiolyticStability at PSI", International ACE-EX, TechnicalAdvisory and Project Board Meetings, Chicago-PaloAlto, USA, 19-22. June 1995
GÜNTAY S."Update on the Severe Accident Research Activitiesat PSI", OECD/NEA CSNI Principal Working Group 4Meeting, Paris, France, 26-27. Sept. 1995
GÜNTAY S., BlRCHLEY J., DUIJVESTIJN G."In-Vessel Severe Accident Phenomenology for aLarge PWR Plant", Technical Committee Meeting onAdvances in and Experience with Accident Conse-quences Analysis, IAEA, Vienna, Austria, 27-29. Sept.1995
HENNIG D.
"NEA Stability Benchmark Task - Remarks to PSIResults", OECD/NEA NRC Specialists' Meeting onLight Water Reactors, Paris, France, May 1995
HENNIG D.
"Stabilität von Siedewasserreaktoren - eine aktuelleThematik reaktorphysikalischer Forschung", Tech-nische Universität Dresden, Germany, 8. Dec. 1995
HERMANN A., BARTG.
"Experimental Preparations and Sampling Plans forCladding Integrity Investigations", 27th Nuclear FuelIndustry Research Steering Committee Meeting, Al-bany, Oregon, USA, 25-28. April 1995
HERMANN A., BARTG.
"Fuel Cladding Integrity at High Burnups: Shipmentsand Sample and Test Methods Preparation", 28thNuclear Fuel Industry Research Steering CommitteeMeeting, Halden, Norway, 1-3. Nov. 1995
HIRSCHBERG S.
"Multi-disciplinary Assessment of Energy Systems",Joint Research Centre Ispra, Italy, 23. March 1995
HIRSCHBERG S.
"Current Status of Analysis of External Costs ofPower Generation", EAES Combined Meeting, Ribe,Denmark, 20-24. May 1995
HIRSCHBERG S., DANGV.N.
"HRA Methods: Comparative Strengths and Weak-nesses", KSA, Würenlingen, Switzerland, 7. July 1995
HIRSCHBERG S.
"Status of Task 94-1 on Human Interactions: CriticalOperator Actions and Data Issues", OECD/NEA Prin-cipal Working Group 5, Workshop, Engelberg, Swit-zerland, 3-4. April 1995 and OECD/NEA PrincipalWorking Group 5, Annual Meeting, Paris, France, 11-13. Sept. 1995
HlRSCHBERG S.
"Framework for and Current Issues in ComprehensiveComparative Assessment of Electricity GeneratingSystems", International Symposium on "ElectricityHealth and the Environment: Comparative Assess-ment in Support cf Decision Making", Vienna, Austria,16-19. Oct. 1995,
HlRSCHBERG S.
"Comparative Assessment of Energy Systems", IAEAResearch Coordination Meeting on ComparativeHealth and Environmental Risks of Nuclear and OtherEnergy Systems, Athens, Greece, 13-17. Nov. 1995
HUMMEL W., GLAUS M.A., VAN LOON L.R.
"Bindings of Radionuclides by Humic Substances: the"Conservative Roof" Approach", 5th InternationalConference on the Chemistry and Migration Behav-iour of Actinides and Fission Products in theGeosphere, MIGRATION '95, St. Malo, France, 10-15. Sept. 1995
KLOS R.
"Biosphere Modelling for Waste Disposal Assess-ments at PSI", Nirex, Harwell, U.K., 20. March 1995
122
KLOS R."Status of the Complementary Studies Exercise",Spring 1995, Intermediate Meeting of the Biomovs li,Complementary Studies Working Group, ImperialCollege, London, England, 22-26. May 1995
KLOS R.
"Status of the Complementary Studies Exercise",Autumn 1995, Biomovs II - 6th Meeting, IAEA, Vi-enna, Austria, 2-6. Oct. 1995
KOPAJTIC Z.
"Analytische Chemie in der Nuklear-Energiefor-schung", Informationstagung über das neue Kompe-tenzzentrum Analytische Chemie, EAWAG,Dübendorf, 20. June 1995
KOPAJTIC Z., RÖLLIN S., WERNLI B„ HOCH-
STRASSER CH., LEDERGERBER G., JURCEK P.'"Determination of Trace Element Impurities in NuclearMaterials by Inductively Coupled Plasma MassSpectrometry in a Glove-Box", 1995 European WinterConference on Plasma Spectrochemistry, Cambridge,UK, 8-13. Jan. 19951 University of Chem. Technology, Prague, Czech
Republic
KROGER W."Risiko und Sicherheit, Analyse von Sicherheitsrisikenals Basis der Prävention", 25. Weiterbildungskurs,Schweizerischer Ingenieur- und Architekten-Verein, 9.Feb. 1995
KRÖGER W."Nuclear Power Plant Safety in the Framework ofFuture Energy Systems", Paul Scherrer Institute,Villigen, Switzerland, 10-12. Nov. 1994 and IAEA,TCM-Meeting, Vienna, Austria, 29-30. May 1995
KRÖGERW."Sozio-ökonomische Energieforschung am PSI",Kurzpräsentation an der Begleitgruppensitzung„EWG", Bern, Switzerland, 30. June 1995
KRÖGER W.
"Sicherheit im Wandel - aus technischer Sicht", Eröff-nungsfeier des Schweizerischen Instituts zurFörderung der Sicherheit, Zürich, Switzerland, 10.Oct. 1995
LEDERGERBER G.
"Status of Research and Development on SphereFabrication at PSI", Power Reactor and Nuclear FuelDevelopment Corporation, Tokai Works, Japan, 7.March 1995
LEDERGERBER G."Fuel and Target Materials Prepared by the InternalGelation Methode at PSI", JAERI, Tokai-mura, Japan,9. March 1995
LEDERGERBER G., WENGER H.U., RÖLLIN S., BOTTA F.,KOPAJTIC Z., GAVILLET D., LINDER H.P., CHAWLA R."Status of Research on Transmutation Targets in PSI,Proton Irradiation of Actinides, ATHENA-1", Meetingof the Japanese Transmutation Research Subcom-mittee, JAERI, Tokai-mura, 16. March 1995
LEDERGERBER G „ INGOLD F., BOTTA F., STRAT-
TON R.W.1
"Preparation of Fuel Materials for LWR by the InternalGelation Process", Workshop on ManufacturingTechnology and Processes for Reactor Fuels, JAERI,Tokai-mura, Japan, 22-23. March 19951 NOK, Baden, Switzerland
LEDERGERBER G. , INGOLD F., KOPAJTIC Z. , BOTTA F.
"Fuel and Target Materials Prepared by Gel Co-Con-version for Burning Plutonium and Minor Actinides",1995 Spring Meeting of Nuclear Fuel Technical Divi-sion of Atomic Energy Society of Japan, Tokyo Insti-tute of Technology, Tokyo, Japan, 30. March 1995
MAUL J.L.1, AERNE T., FREI R."The Atomika SIMS 4000 R: a New SIMS System forthe Analysis of Highly Radioactive Samples", 10thInternational Conference on Secondary Ion MassSpectrometry and Related Techniques, SIMS X,Münster, Germany, 1-6. Oct. 19951 Atomika Instruments, Oberschleissheim, Germany
NlFFENEGGER M., BROSI S., R E I C H U N K., RÖSEL R.,
STUMPFROCK L.1
"Comparison of two Crack Growth Criteria in the Brit-tle-to-Ductile Transition Zone", 13th InternationalConference on Structural Mechanics in ReactorTechnology, Porto Alegre, Brazil, 13-18. August 19951 Materialprüfungsanstalt Stuttgart, Germany
PELLONI S.
"The Effect of Different Nuclear Data on the Calcu-lated Sodium-Void Coefficient in Advanced Fast Re-actors", (JEF-Meeting), NEADB, Paris, France, 14.June 1995
PFINGSTEN W."Coupled Modelling of Reactive Transport in the Near-Field of a Radioactive Waste Repository", NaturalWaters and Water Technology, ERF-Conference,Lenggries, Germany, 3-8. Nov. 1995
POTV., APPERTC.1, ZALESKIS.2
"Evaporation Results with Liquid-Gas Model in 2 and3 Dimensions", Seminar, Universite Libre deBruxelles, Bruxelles, Belgium, 11. Oct. 19951 Ecole Normale Superieure, Paris, France2 Universite P.M. Curie, Paris, France
123

POTV., KARAPIPERIS T.
"A Two Species Lattice-Gas Model", Seminar Uni-versite Libre de Bruxelles, Bruxelles, Belgium, 12.Oct. 1995
RÖLLIN S., KOPAJTICZ., WERNLI B., MAGYAR B.1
"Bestimmung von Lanthanoiden und Actinoiden inUran-/Plutoniumbrennstoffen mittels HPLC-ICP-MS"FISONS, ICP-MS User Meeting, Mainz-Kastel, Ger-many1ETH Zürich, Switzerland
RÖLLINS., KOPAJTICZ., WERNLI B., MAGYAR B.'
"Determination of Lanthanides and Actinides in Ura-nium Materials by HPLC with Inductively CoupledPlasma Mass Spectrometric Detection", InternationalIon Chromatography Symposium, Dallas, Texas,USA, 1-5. Oct. 19951 ETH Zürich, Switzerland
SCHENKER E., NOBBENHUIS-WEDDA H.
"Kolloideigenschaften des SWR-Kühlmittels", VGB-Informationsveranstaltung KKW Phiiippsburg,Philippsburg, Germany, 5-6. April 1995
TAO S., GEBHARDTO., GROESCHEL F.
"Precipitate Size Distribution in the Zircaloy-4 Tub-ings", 28th Meeting of the NFIR Steering Committee,Halden, Norway, 31. Oct. - 3. Nov. 1995
TAUT ST.1, BRUCHERTSEIFER H., SCHUMANN D.\
DRESLER R. \ FISCHER ST.1, MlSIAK R.2, BINDER R.3,
TRAUTMANN N.\ NÄHLER A.4, EBERHARDT K.4, Nrr-
SCHE H.5
"Schnelle on-line lonenaustauschversuche mit träger-freien Zr, Nb, und Mo in schwach HCI/HF-saurenLösungen", 3. Workshop: „Chemie der schwerstenElemente", Mainz, Germany, 16-17. March 1995' Technische Universität Dresden, Germany2 Institute of Nuclear Physics, Krakow, Poland3 University of Leipzig, Germany4 University of Mainz, Germany5 Forschungszentrum Rossendorf, Germany
TIPPING PH.
"A Quick Overview of Some Swiss Ageing-RelatedStudies/Research", International Working Group onLife Management of NPP (IWGLMNPP), Vienna,Austria, 30. August - 1 . Sept. 1995
VAN LOON L.R.
"Physico-Chemical Aspects of the Soil-to-PlantTransfer of Technetium", Nuclear, (Radio) Chemicaland Environmental Aspects of Technetium, TechnicalUniversity, Delft, The Netherlands, 6. June 1995
VARADI G., DREIER J., BANDURSKI TH., FISCHER O.HUGGENBERGER M., LOMPERSKI S., YADIGAROGLU G.
"The PANDA Tests for SBWR Certificaton", 23rdWater Reactor Safety Research Information Meeting,Bethesda, Maryland, USA, 23-25. Oct. 1995
WENGER H.U., BOTTAF., RÖLLINS., LINDERH.P.,
GAVILLET D., KOPAJTIC Z., LEDERGERBER G.,
CHAWLA R., HEGEDÜS F.
"First Results from Thin-Target Irradiations of Acti-nides with 0.6 GEV Protons", GLOBAL 1995, Ver-sailles, France, 11-14. Sept. 1995
WERNLI B.
"Burnup Analysis at PSI", Belgonucleaire, Bruxelles,Belgium, 15. Feb. 1995
WILLIAMS T.
"Status of the HTR-PROTEUS Experiments", 6thIAEA RCM on Validation of Safety Related PhysicsCalculations for Low-Enriched Gas-Cooled Reactos,Vienna, Austria, 12-14. Dec. 1995
YADIGAROGLU G. , VARADI G., DREIER J „ DE CACHARD
F., SMITH B.f GÜNTAY S., BANDURSKI TH.
"The Status of the ALPHA-Project", IAEA, TechnicalCommittee Meeting on Safety Systems for AWCRs,Piacenza, Italy, 16-19. May 1995
124
SCIENTIFIC PUBLICATIONS
PSI Reports
BAEYENS B., BRADBURY M.H.
"A Quantitative Mechanistic Description of Ni, 2n andCa Sorption on Na-Montmorillonite, Part I: Physico-Chemical Characterisation and Titration Measure-ments", PSJ Report 95-10, Nagra NTB 95-04
BAEYENS B., BRADBURY M.H.
"A Quantitative Mechanistic Description of Ni, Zn andCa Sorption on Na-Montmorillonite, Part II: SorptionMeasurements", PSI Report 95-11, Nagra NTB 95-05
BERNER U.
"Kristallin I: Estimates of Solubility Limits for SafetyRelevant Radionuclides", PSI Report 95-07, NagraNTB 94-08
BRADBURY M.H., SAROTT F.-A.
"Sorption Databases for the Cementitious Near-Fieldof a L/ILW Repository for Performance Assessment",PSI Report 95-06, Nagra NTB 93-08
BRADBURY M.H., BAEYENC B.
"A Quantitative Mechanistic Description of Ni, Zn andCa Sorption on Na-Montmorillonite, Part III: Model-ling", PSI Report 95-12, Nagra NTB 95-06
INGOLD F., LEDERGERBER G.
„Preparation of TRU Fuel and Target Materials for theTransmutation of Actinides by Gel Co-Conversion",PSI - Annual Report 1994 / Annex IV - NuclearEnergy and Safety Research Progress Report 1994,61-68
LlCHTNER P.C.1, ElKENBERG J .
"Propagation of a Hyperalkaline Plume into the Geo-logical Barrier Surrounding a Radioactive WasteRepository", PSI Report 95-01, Nagra NTB 93-161 CNWRA, San Antonio, Texas, USA
PFINGSTEN W., CARNAHAN C.L.1
"Heterogeneous Redox Reactions in GroundwaterFlow Systems - Investigation and Application of TwoDifferent Coupled Codes", PSI Report 95-08, NagraNTB 95-01,1 LBL, USA
SMITH P.A.1, CURTI E."Some Variations of the Kristallin-I Near-Field Model"PSI Report 95-141 QuantiSci, Melton Mowbray, U.K.
VAN LOON L.R., HUMMEL W.
"The Radiolytic and Chemical Degradation of OrganicIon Exchange Resins: Effects on Radionuclide Spe-ciation", PSI Report 95-13, Nagra NTB 95-08
Publications in Scientific and TechnicalJournals
D'AURIA F.\ FALUOMI V.', AKSAN N.,"A Methodology for the Analysis of a Thermal-Hy-draulic Phenomenon Investigated in a Test Facility",Kerntechnik 60/4 (1995), 166-1741 University of Pisa, Italy
BARTEN W„.LÜCKE M.1, KAMPS M.2, SCHMITZ R.3
"Convection in Binary Fluid Mixtures: I. ExtendedTraveling Wave and Stationary States", Physical Re-view E51 (1995), 5636-56611 Universität des Saarlandes, Saarbrücken, Germany2 Forschungszentrum Julien, Germany
BARTEN W., LÜCKE M.1, KAMPS M.2, SCHMITZ R.2
"Convection in Binary Fluid Mixtures: II. LocalizedTraveling Waves", Physical Review E51 (1995), 5662-56801 Universität des Saarlandes, Saarbrücken, Germany2 Forschungszentrum Jülich, Germany
BILLEN T H . \ DOMINIK J.1, LOIZEAU J.L.1, PARDOSM.1,
GOUDSMIT G.3 , MATTERNBERGER C.2, WÜEST A.2,
DEGUELDRE C , LIENEMANN CH.-PH.3, MAVROCOR-
DATOS D.3, PERRET D.3, BIBER M."
"Repartition of BE-7 on Particulate and Colloidal Mat-ter in Surface Water of Lake Lugano, Switzerland",Oceanographie-CH, (1995) 32-3311nstitut F.-A. Fore!, Universite de Geneve,
Switzerland2 EAWAG, Dübendorf, Switzerland3 Institut de Chimie Minerale et Analytique, Universite
de Lausanne, Switzerland4 Departement de Chimie Minerale, Analytique et
Appliquee, Universite de Geneve, Switzerland
BROSI S., NIFFENEGGER M., RÖSEL R., KOBES E.\
SCHRAMMEL D.2
"Precracked Pipe under Waterhammer Action",Nuclear Engineering and Design 158 (1995), 177-1891 Staatl. Materialprüfungsanstalt (MPA), Stuttgart,Germany
2 Forschungszentrum Karlsruhe GmbH (FZK),Karlsruhe, Germany
125

DEGUELDREC., BILEWICZ A.1, ALDER HP.
"Behavior and Removal of Radionuclides Generatedin the Cooling Water of a Proton Accelerator", NuclearScience and Engineering 120, (1995) 65-7111nstitute of Nuclear Chemistry and Technology,Warsaw, Poland
DEGUELDRE C.
"Retention of Redox Sensitive Elements in Aquifers -the Case of Neptunium", J. Environ. Radioactivity29/1,(1995)75-87
DOKA G.1, FRISCHKNECHT R.\ KNOEPFEL I.',
HOFSTETTER P.1, SUTER P.1, WÄLDER E.1, DONES R."Oekoinventare für Energiesysteme: Beispiel Re-generative Energiesysteme", BWK 47/10 (1995) 426-431' ETH Zürich, Switzerland
DONES R., HOFSTETTER P.1 FRISCHKNECHT R. \KNOEPFEL I.', SUTERP.1, WÄLDER E.1
"Oekoinventare für Energiesysteme: Beispiel Nuklear-system", BWK, 47/5 (1995), 208-2131 ETH Zürich, Switzerland
DUUVESTIJN G., REICHLIN K., RÖSEL R."Computations of Flows in Experimental Simulationsof Reactor Core Melting", Computers & Structures56/2-3 (1995), 239-247
FOSKOLOS K."Siegel der Reaktorsicherheit", SchweizerischeTechnische Zeitschrift 12 (1 995), 33-35
FRISCHKNECHT R.1, KNOEPFEL I.', HOFSTETTER P.\ SU-
TER P.1, WALDER E.1, DONES R.
"Ökoinventare für Energiesysteme: Beispiel Erdöl-und Brenngassystem", BWK, 47/3 (1995) 71-77' ETH Zürich, Switzerland
GALPSRIN A.1, GRIMM P., RAIZES V.1
"Modelling and Verification of the PWR Burnable Poi-son Designs by ELCOS Code System", Annals ofNuclear Energy 22 (1995) 317-3251 Ben Gurion University, Beer-Sheva, Israel
GEBHARDT O., GEHRINGER M., GRABER TH., HER-
MANN A.
„Investigation of Corrosion Films on Zirconium BasedAlloys by Electrochemical and Microscopic Methods",Materials Science Forum 192-194 (1995) 587-598
GLAUS M.A., HUMMEL W., VAN LOON L.R.
"Equilibrium Dialysis-Ligand Exchange: Adaptation ofthe Method for Determination of Conditional StabilityConstants of Radionuclide-Fulvic Acid Complexes"Analytica Chimica Acta 303 (1995) 321-331
GLAUS M.A., HUMMEL W., VAN LOON L.R.
"Stability of Mixed-Ligand Complexes of Metal Ionswith Humic Substances and Low Molecular WeightLigands", Environmental Science & Technology 29(1995)2150-2153
HIRSCHBERGS."External Costs of Electric Power Generation. AreAccidents Adequately Treated?" Schweizer Ingenieurund Architekt 20 (1995) 469-473
HIRSCHMANN H., HOSEMANN J.P., JÄCKEL B.S.
"CORVIS - Researching Reactor Pressure VesselMelt Through", Nuclear Engineering International40/490(1995)34-36
HOFSTETTER P.1, FRISCHKNECHT R. \ KNOEPFEL I. 1,
SUTER P.1, WÄLDER E. \ DONES R.
"Ökoinventare für Energiesysteme: Beispiel Braun-und Steinkohlesystem", BWK, 47/1-2 (1995) 23-321 ETH Zürich, Switzerland
HOLZGREWEF., HEGEDÜS F., PARATTE J.M.
"Calculation and Benchmarking of an Azimuthai Pres-sure Vessel Neutron Fluence Distribution Using theBOXER Code and Scraping Experiments", NuclearTechnology 109 (1995) 383-397
JONEJA O.P.1, ROSSELET M.1, ÜGOU J . \ GARDEL P.2
"Development of a Pencil Type Single-Shield GraphiteQuasi Adiabatic Calorimeter and Comparison of itsPerformance with a Double-Shield Graphite Calo-rimeter for the Measurement of Nuclear Heat Deposi-tion Rate in a Fusion Environment", Fusion Tech-nology 28 (1995), 1651-16621 EPFL Lausanne, Switzerland2 UNIL Lausanne, Switzerland
JONEJA O.P.1, ROSSELET M.\ LÜTHI A.1, LlGOU J.1,ANAND R.P.2, BUCHILLIER T.3
"Heat Deposition Rate Measurements Using a Graph-ite Quasi Adiabatic Calorimeter and Thermolu-miniscent Dosimeters in a Fusion Environment of theLOTUS Facility", Fusion Technology, 28 (1995), 1663-16731 EPFL Lausanne, Switzerland2 BARC Bombay, India31.A.R. Lausanne, Switzerland
KALLFELZ Ü.M., BELBLIDIA L.A., GRIMM P.
"Fuel-Temperature Coefficient for Boiling Water Re-actor Transient Calculations: Its Dependence on Re-actor Conditions", Nuclear Science and Engineering121 (1995), 301-311
126

KARAPIPERIS T.
"Cellular Automaton Model of Precipitation//Dissolution Coupled with Solute Transport", Journalof Statistical Physics 81 (1995) 165-180
KOPAJTIC Z., RÖLLIN S., WERNLI B., HOCH-STRASSER CH., LEDERGERBER G., JURCEK P.1
„Determination of Trace Element Impurities in NuclearMaterials by inductively Coupled Plasma MassSpectrometry in a Glove-Box", Journal of AnalyticalAtomic Spectrometry, 10 (1995) 947-9531 University of Chem. Technology, Prague, CzechRepublic
LÜCKE M.1, BARTEN W., KAMPS M.2, SCHMITZ R.2
"Spatially Extended and Localized Traveling WaveConvection in Binary Fluid Mixtures", "Structure andDynamics of Nonlinear Waves in Fluids", AdvancedSeries in Nonlinear Dynamics 7 (1995) 316-3231 Universität des Saarlandes, Saarbrücken, Germany2 Forschungszentrum Jülich.Germany
PARATTE J.M., CHAWLA R.
"On the Physics Feasibility of LWR Plutonium FuelsWithout Uranium", Annals of Nuclear Energy 22/7(1995)471-481
PLEINERT H., DEGUELDRE C.
"Neutron Radiographic Measurement of Porosity ofCrystalline Rock Samples: a Feasibility Study", Jour-nal of Contaminant Hydrology 19 (1995) 29-46
TIPPING PH., INEICHEN U., CRIPPS R.C.
"Materials in the Nuclear Environment - How Do TheyPerform?", Nuclear Europe Worldscan 15 (1995) 37
TIPPING PH., CRIPPS R.C.
"Meyer Hardness Test to Detect Neutron IrradiationEffects in Low Alloy Pressure Vessel Steel", Work-shop on Ageing of NPP Component Materials"PROMETEY", St. Petersburg, Russia, 1 (1995) 25-27
TIPPING PH., CRIPPS R.C.
"Neutron Irradiation Sensitivities of Mock-Up ASTMA508 Class 2 PV Base Plate and Automatically De-posited Weld Material; A Comparitive Study UsingMeyer's Hardness", International Journal of PressureVessels and Piping 61 (1995) 77-86
YADIGAROGLU G., VARADI G., DREIER J.
"Passive ALWR Safety: The ALPHA Project at Swit-zerland's PSI - A Progress Report", Nuclear EuropeWorldscan, Journal of ENS 15/9-10 (1995) 54-55
Conference Proceedings
AKSAN N., SENCAR M.1
"Evaluation and Assessment of Reflooding Models inRELAP5/Mod2.5 and RELAP5/Mod3 Codes UsingLehigh University and PSI/NEPTUN BundleExperimental Data", 7th International Meeting onNuclear Reactor Thermal-Hydraulics, SaratogaSprings, New York, USA, 10-15. Sept. 1995, Proc.Vol. 3, NUREG/CP-0142, 2280-23021 Colenco, Baden, Switzerland
AKSAN N, D'AURIA F.1, GLAESER H.2, LIUNGTON J.3,
POCHARD R.4, RICHARDS C.3, SJÖBERGA.5
"Further Evaluation of the CSNI Seperate Effect TestActivity", 7th International Meeting on Nuclear ReactorThermal-Hydraulics, Saratoga Springs, New York,USA, 10-15. Sept. 1995, Proc. Vol. 3, NUREG/CP-0142, 2904-29151 University of Pisa, Italy2 GRS Garching, München, Germany3 AEA Technology, Winfrith, U.K.4 CEA/IPSN Fontenay-aux-Roses, France5 Studsvik AB, Nyköping, Sweden
AKSAN N, D'AURIA F.\ GLAESER H.2, POCHARD R.3,
RICHARDS C.4, SJÖBERG A.S
"Overview on CSNI Separate Effects Tests ValidationMatrix", 7th International Meeting on Nuclear ReactorThermal-Hydraulics, Saratoga Springs, New York,USA, 10-15. Sept. 1995, Proc. Vol. 3, NUREG/CP-0142,2303-23341 University of Pisa, Italy2 GRS Garching, München, Germany3 CEA/IPSN Fontenay-aux-Roses, France4 AEA Technology, Winfrith, U.K.5 Studsvik AB, Nykoping, Sweden
ANALYTISG.TH.
"A Comparison of the Effect of the First and SecondUpwind Schemes on the Predictions of the ModifiedRELAP5/Mod3", 7th International Meeting on NuclearReactor Thermal-Hydraulics, Saratoga Springs, NewYork, USA, 10-15. Sept. 1995, Proc. Vol. 3,NUREG/CP-0142, 2011-2020
ANALYTISG.TH.
"Development and Assessment of a Modified Versionof RELAP5/Mod3", 7th International Meeting onNuclear Reactor Thermal-Hydraulics, SaratogaSprings, New York, USA, 10-15. Sept. 1995, Proc.Vol. 3, NUREG/CP-0142,2067-2078
ANALYTISG.TH.
"Analysis of a Hypothetical LB-LOCA in a BWR-4Using TRAC-BF1", 1995 ANS Winter Meeting, SanFrancisco, California, USA, 29. Oct. - 2. Nov. 1995,Trans. Vol. 73, 512-513
127

ANALYTISG.TH.
"Effect of Wet-Wall Interfacial Shear Correlations onthe Mass-Error of RELAP5/Mod3.1", 1995 ANSWinter Meeting, San Francisco, California, USA, 29.Oct. - 2. Nov. 1995, Trans. Vol. 73, 513-514
ANDREANI M., TOKUHIRO A.
"Condensation in the Spout Region of a Gas-VapourPlume Rising in a Subcooled Water Pool", 2nd Inter-national Conference on Multiphase Flow, Kyoto,Japan, 3-7. April 1995, Proc. Vol. 2, PC2/17-PC2/24
ANDREANI M., ANALYTIS G.TH., AKSAN N.
"A Study of the Dispersed Flow Interfacial HeatTransfer Model of RELAP5/Mod3", 7th InternationalMeeting on Nuclear Reactor Thermal-Hydraulics,Saragota Springs, New York, USA, 10-15. Sept.1995, Proc. Vol. 3, NUREG/CP-0142, 2079-2101
AOUNALLAH Y.
"On the Modelling of Vapour Bubble Nucleation", Int.Symposium on Two-Phase Flow and Experimen-tation, Rome, Italy, Oct. 1995, Proc. Vol. 1, 325-330
BRUCHERTSEIFER H., BART G., GEBHARDTO.,
HERMANN A., HOFER R., SCHLEUNIGER P.
"Experience in LWR Post Irradiation Examination ofCore Components at PSI Hotlaboratory", TechnicalCommittee on Recent Developments on Post-Irradia-tion Examination Techniques for Water Reactor Fuel,Cadarache, France, 17-21. Oct. 1994, IAEA-TECDOC-822, 83-108
DE CACHARD F.
"Development, Implementation and Assessment ofSpecific Two-Fluid Closure Laws for inverted-AnnularFilm-Boiling", 7th International Meeting on NuclearReactor Thermal-Hydraulics, Proc. Vol. 1,166-191
CHAPMAN N.\ ANDERSSON. J.2, BOGORINSKI P.3,
CARRERA J . \ HADERMANN J., HODGKINSON D.1,
JACKSON P.S, NERETNIEKS I.6, NEUMAN S.7, SKAGIUS K.8,
NICHOLSON T.9, TSANG C.-F.10, VOSS C.11
"Developing Groundwater Flow and Transport Modelsfor Radioactive Waste Disposal - Six Years of Expe-rience from the INTRAVAL Project", GEOVAL *94Validation Through Model Testing, Paris, France, 11-14. Oct. 1994, Proc. 45-58I QuantiSci, Melton Mowbray, U.K.2SKI, Stockholm, Sweden3 GRS, Köln, Germany4 UPC, Barcelona, Spain5 AEA, Harwell, U.K.6 KTH, Stockholm, Sweden7 UAz, Tucson, USA8 Kemakta, Stockholm, Sweden9 NRC, Washington, USA10 LBL, Berkeley, USAI I Golder, Redmond, USA
CHAWLA R., LEDERGERBER G.
"Proposed Future Activities on Advanced FuelCycles", Workshop on Advanced Fuel Cycles, VilligenPSI, Switzerland, 18-19. Sept. 1995, Proc. 18-23
CODDINGTON P., ANDREANI M.
"SBWR-PCCS Vent Phemomena and SuppressionPost Mixing", 7th International Topical Meeting onNuclear Reactor Thermal-Hydraulics NURETH-7,Saratoga Springs, New York, USA, 10-15. Sept.1995, Proc. Vol. 2,1249-1271
DANG V.N., HIRSCHBERG S., CHAKRABORTY S.1
"The Swiss Human Reliability Research Program",Halden Japan Joint Symposium , Tokyo, Japan, 22-26. May 19951 HSK Villigen, Switzerland
DAUMAS S., LEDERGERBER G., INGOLD F., BAUER M.1,
PRUNIER C.1
'Nitride Targets Elaborated by Sol-Gel Processing forActinide Incineration", GLOBAL 1995, Internationa!Conference on Evaluation of Emerging Nuclear FuelCycle Systems, Versailles, France, 11-14. Sept. 1995;Vol.2, 1638-16461CEA Cadarache, France
DEHBI A., GCINTAY S.
"A Model for the Performance of a Vertical Tube Con-denser in the Presence of Non-Condensible Gases",NURETH7, 10-15. Sept. 1995, NUREG ICP, Proc.Vol. 0142,402-422
DESMARTIN PH.G.1, KOPAJTICZ., HAERDI W.1
"Strontium-90 Analysis by Ionic Chromatography andOn-Line Liquid Scintillation-Counting", Neue Schwei-zerische Chemische Gesellschaft, Herbstversamm-lung 1995, Universität Bern, Bern, Switzerland, 20.Oct. 1995, CHIMIA 1995 49/7-8, 271 Universite de Geneve, Switzerland
DUIJVESTIJNG., REICHLIN K., RÖSELR.
"Computations of Flows in Experimental Simulationsof Reactor Core Melting", Non Linear Finite ElementAnalysis and ADINA, Cambridge, Massachusetts,USA, 21-23. June 1995, Proc. Vol. 10,239-247
ElSERT P.1, GRÜNER P.1, KUNTZE W.\ STRUB C.2, PlNIA.3, IKONEN K.4, DUIJVESTIJNG.
"Comparisons of Structural Mechanical Calculationsof the Lower Head of Reactor Pressure Vessel atHigher Temperatures", 21. MPA-Seminar, Stuttgart,Germany, 5-6. Oct. 1995, Tagungsband, Vol. 2, 48.1-48.171 GRS Köln, Germany2 CEA Paris, France3 AN PA, Italy* VTT Energy Helsinki, Finland
128

FALUOMI V.', D'AURIA F.1, AKSAN N."A Comparison and Assessment of Some CriticalHeat Flux Prediction Models Used in Thermal Hy-draulic System Codes", 49th National Congress,Associazione Termotecnica Italiana (ATI), Perugia,Italy, 26-30. Sept. 1994, Proc. Vol. 1,2225-22391 University of Pisa, Italy
GAVILLET D., BRUCHERTSEIFER H., GEBHARDTO., HER-
MANN A., KOPAJTIC Z., OTT CH., RESTANI R., RÖL-
LIN S., SCHLEUNIGER P., WERNLI B.
"Analytical Techniques for MOX Post-Irradiation Ex-amination at PSI", Workshop on Advanced Fuel Cy-cles, Villigen PSI, 18-19. Sept. 1995, PSI Proc. 95-01,Nov. 1995,184-191
HADERMANN J.
"Trends in Safety Assessment of Radioactive WasteRepositories", Energietage '94, Villigen PS!, Switzer-land, 10-12. Nov. 1994, Proc. 225-230
HlRSCHBERG S., SUTER P.'
"Methods for the Integral Assessment of Energy-Re-lated Problems", Energietage '94, Villigen PSI, Swit-zerland, 10-11. Nov. 1995, Proc. 259-2791 ETH Zürich, Switzerland
HOSEMANN J.P., R O S E L R .
"International Cooperation in Safety Research: TheCORVIS Project of the Paul Scherrer Institute",TOPSAFE '95, Budapest, Hungary, 24-27. Sept.1995, Proc. Vol. 1,29-36
HUDINA M., VARADI G., SIGG B.
"Thermal-Hydraulic Investigations for AdvancedNuclear Reactors in Switzerland", 8th IAHR WG-Meeting on Advanced Nucl. Reactor Thermal-Hy-draulics, Rez, Czech Rep., 13-15. June
HUMMEL W., GLAUS M.A., VAN LOON L.R.
"Binding of Radionuclides by Humic Substances",Binding Models Concerning Natural Organic Sub-stances in Performance Assessment, Zurzach, Swit-zerland, 14-16. Sept. 1994, Proc. OECD Doc. ISBN92-64-14527-3, 1995,251-262
HUMMEL W.
"Competition of Other Complexes: TheoreticalAspects", Binding Models Concerning Natural OrganicSubstances in Performance Assessment, Zurzach,Switzerland, 14-16. Sept. 1994, Proc. OECD Doc.ISBN 92-64-14527-3,1995, 215-222
INGOLD F., DAUMAS S., PILLON S.', BAUMANN M.,
LEDERGERBER G.
"Materials Development and Testing at PSI", Work-shop on Advanced Fuel Cycles, Villigen PSI, 18-19.Sept. 1995, PSI Proc. 95-01, Nov. 1995, 249-2591CEA/CEN, Cadarache, France
KASEMEYER U., PARATTE J.M., CHAWLA R.
"Reactor Physics Characteristics of Possible FuelMaterials for Plutonium-Incinerating LWRs", IAEATechnical Committee Meeting on UnconventionalOptions for Plutonium Disposition, Obninsk, Russia,7-11. Nov. 1994, Proc. IAEA-TecDoc-840, 1995, 135-147
KASEMEYER U., CHAWLA R., GRIMM P., PARATTE J.M.
"Conceptual Study for a PWR Core Employing Ura-nium-Free Plutonium Fuel", International Conferenceon Evaluation of Emerging Nuclear Fuel Cycle Sys-tems (GLOBAL 95), Versailles, France, 11-14. Sept.1995, Proc. Vol. 2, 1330-1337
KLOS R., VAN DORP.F.1
"Assessment of the Radiological Impact of NuclearWaste Repositories, the Swiss Experience", Interna-tional Symposium on Environmental Impact of Radio-active Releases, IAEA, Vienna, Austria, Proc. SM-3391 NAGRA, Wettingen, Switzerland
NEALL F.B., BAERTSCHI P.1, MCKINLEY I.G.\ SMITH
P.A.2, SUMERLINGTJ.3, UMEKI H.""Comparison of the Concepts and Assumptions inFive Recent HLW Spent Fuel Performance Assess-ments", MRS Scientific Basis for Nuclear Waste Man-agement, Kyoto, Japan, 23-26. Oct. 1994, Proc. Vol.353, 503-5101 NAGRA, Wettingen, Switzerland2 QuantiSci, Melton, Mowbray, U.K.3 SAM, Reading, U.K.* PNC, Tokyo, Japan
PARATTE J.M., KASEMEYER U., GRIMM P., DEGUELDRE
C, CHAWLA R.
"Characteristics of Plutonium Burning MOX and Ura-nium-Free PWRs", Workshop on Advanced FuelCycles, Villigen PSI, Switzerland, 18-19. Sept. 1995,128-142
PEARSON F.J., SCHOLTIS A.1
"Controls on the Chemistry of Pore Water in a Marl ofVery Low Permeability", 8th International Symposiumon Water-Rock Interactions, Vladivostok, Russia,August 1995, Proc. 35-381 NAGRA, Wettingen, Switzerland
PELLONI S., JONEJA O.P.1, LÜTHI A.1, RIMPAULT G.2,FORT E.2, JACQMIN R.2
"Methods and Data Investigations for Pu-Burning FastReactor Configurations", Workshop on Advanced FuelCycles, Villigen PSI, Switzerland, 18-19. Sept. 1995,Proc. 208-2341 EPFL Lausanne, Switzerland2 CEA Cadarache, France
129
PELLONI S.
"The Impact of Different 237Np Data on the Perform-ance of the PHOENIX Transmutation System", Inter-national Conference on Nuclear Data for Science andTechnology, Gatlinburg, TN, USA, 9-13. May 1994,Proc. Vol. II, 806-808
PlLLON S.1, INGOLD F., BAUER M.\ LEDERGERBER G.,WARIN D.1
"Properties of Mixed Oxide with High Plutonium Con-tent as a Function of their Fabrication Route",GLOBAL 1995, Versailles, France, 11-14. Sept. 1995,Vol. 1,328-3361 CEA Cadarache, France
RÖLLIN S., HERMANN A., KOPAJTIC Z., LEDERGERBER G.
"Determination of Lanthanides in Uranium MaterialsUsing High Performance Liquid ChromatographieSeparation and ICP-MS Detection", 4th InternationalConference on Plasma Source Mass Spectrometry,Durham, UK, 11-16. Sept. 1994, Proc. in Vol. „RecentAdvances in Plasma Source Mass Spectrometry" (Ed.Grenville Holland) 1995,28-35
SEILER R., CABRILLAT J.C.1
"The Possibilities of Complementary CtA/PSl PhysicsExperiments",Workshop on Advanced Fuel Cycles,Villigen PSI, Switzerland, 18-19. Sept. 1995, Proc.158-1661CEA Cadarache, France
SEILER R., CHAWLA R., HAGER H., MATHEWS D.,
WILLIAMS T.
"Experimental Investigations of Reactivity EffectsCaused by Water Ingress in a LEU-HTR Pebble-bedCore", IAEA Technical Committee Meeting onResponse of Fuel, Fuel Elements and Gas CooledReactor Cores under Accidental Air or Water IngressConditions, Beijing, China, 25-27. Oct, 1993,Proc. IAEA-TECDOG-784, 44-50
SMITH B.L.
"Thermal-Hydraulics of the ESS Liquid Metal Target",4th Plenary Meeting of the European SpallationSource Project, ESS, Weinfelden, Switzerland, 16-19.Nov. 1995, Proc. Vol. 2, 577-593
SMITH B.L., HEUSSER P.1, HOFHEINZ F.1
"A Numerical Algorithm for Handling SpatialDiscontinuities in Boiling Channels", InternationalSymposium on Two-Phase Flow Modelling andExperimentation, Rome, Italy, 8-11. Oct. 1995, Proc.Vol. 1,133-1401 ETH Zürich, Switzerland
SMITH P.A.1, UMEKI H.2, NEALL F.B., MCKINLEY I.G.3
"Common Aspects of the PNC and NAGRA Assess-ments of Deep Repositories for Vitrified HLW", MRSScientific Basis for Nuclear Waste Management,
Kyoto, Japan, 23-26. Oct. 1994, Proc. Vol. 353, 527-5331 QuantiSci, Melton Mowbray, U.K.2 PNC, Tokyo, Japan3 NAGRA, Wettingen, Switzerland
TIPPING PH.
"Lifetime and Ageing Management of Nuclear PowerPlants: A Brief Overview of some LWR componentAgeing Degradation Problems and Ways of Mitiga-tion", CAPE '95 3rd International Colloquium ofAgeing of Materials and Methods of Assessment andExtension of Lifetimes of Engineering Plants,Wilderness, Rep. of South Africa, 28-31. March 1995,Proc. 14-22
TIPPING PH., SEIFERT H.P., CRIPPS R.C.
"How Accurately Can Surveillance Specimens Reflectthe TRUE State of Reactor Pressure Vessel Mate-rials?", International Workshop on Aged and Decom-missioned Material Collection and Testing for Struc-tural Integrity Purpose (OECD-NEA), Mol, Belgium,27-28. June 1995, Proc. 75-104
VOSSEBRECKER H.1, STANCULESCU A.
"Plutonium Utilization from the View Point on Non-Proliferation", Workshop on Advanced Fuel Cycles,Villigen PSI, Switzerland, 18-19. Sept. 1995, Proc. 46-691 Bergisch Gladbach, Germany
WENGER H.U., BOTTA F., RÖLLIN S., LINDER H.P.,
GAVILLET D., KOPAJTIC Z., LEDERGERBER G., CHAWLA
R..HEGEDÜSF."Results from the Athena Experiments at PSI", Work-shop on Advanced Fuel Cycles, Paul Scherrer Institut,Villigen, Switzerland, 18-19. Sept. 1995, Proc. 283-292
WENGER H.U., BOTTA F., RÖLLIN S„ UNDER H.P.,
GAVILLET D., KOPAJTIC Z., LEDERGERBER G., CHAWLA
R.,HEGEDÜSF.
"First Results from Thin-Target Irradiations of Acti-nides with 0.6GeV Protons", International Conferenceon Evaluation of Emerging Nuclear Fuel Cycle Sys-tems (GLOBAL 95), Versailles, France, 11-14. Sept.1995, Proc. Vol. 1,863-871
WILLIAMS T., CHAWLA R., HAGER H.
"Experimental Findings on Reflector Control-RodWorths in an MHTGR-like System", DevelopmentStatus of Modular MTGRs and Their Future Role",Petten, Netherlands, 28-30. Nov. 1994, ECN ReportECN-R-95-026,194-205
WYDLERP., YOUINOUG.1
"Impact of Different Transmutation Strategies on theRisk from the Radioactive Waste", Workshop on
130

Advanced Fuel Cycles, Villigen PSI, Switzerland 18-19. Sept. 1995. Proc. 274-2821 CEA Cadarache, France
WYDLERP., YOUINOUG.1
"A Physical Assessment of the Impact of DifferentLong-Term Transmutation Strategies on the Radio-logical Risk", International Conference on Evaluationof Emerging Nuclear Fuel Cycle Systems (GLOBAL95), Versailles, France, 11-14. Sept. 1995, Proc. Vol.2,1480-14871 CEA Cadarache, France
YADIGAROGLU G., CODDINGTON P. DE CACHARD F.,
DREIER J., SMITH B., VARADIG. GCINTAYS.
"The ALPHA-Project: A Progress Report", 1995 JointPower Generation Conference, Minneapolis, Minne-sota, USA, 9-11. Oct. 1995, Proc. NE-17, Vol. 2,Nuclear ASME (1995), 57-65
Miscellaneous Reports
AKSAN N, D'AURIA F.1, STÄDTKE H.Z
"User Effects on the Transient System Code Calcula-tions", OECD/NEA, Paris, France, NEA/CSNI (94) 35,Jan. 19951 University of Pisa, Italy2 CEC Ispra, Italy
BANWARTS.1, DEGUELDREC."The Redox Experiment in Block Scale", SKB, Stock-holm, Sweden, Progress Report 25-95-06, April 1995,1 SKB, Stockholm, Sweden
BART G., GEBHARDT O., AERNE E.T., MARTIN M."Experience in the Application of a Shielded Secon-dary Ion Mass Spectrometer for Nuclear MaterialsResearch", IAEA TECDOC-822 (1995) 337-338
DANG V.N., HIRSCHBERG S."Human Reliability in Probabilistic Safety Assess-ments - Current Issues, the Swiss Studies and Op-tions for Research", HSK, Villigen, Switzerland, HSK-An-2887, Dec. 1995
DUIJVESTIJN G., NAKADA K.
"Computational Analysis of the CORVIS Experiment01/6", 3rd Meeting of the CORVIS Task Force, Feb.1995
HERMANN A., BARTG., BRUCHERTSEIFER H., KROMP-
HOLZK.
"Fuel Cladding Integrity at High Burnups: SamplingPlans and Experimental Condition", Elektric Power
Research Institute, Palo Alto, Ca., USA, NFIR-III-RP-01/02, March 1995
HIRSCHMANN H.
"Recent Work, Overview of CORVIS Tests No. 01/4,01/5, 01/6 and 03/1", 3rd Meeting of the CORVISTask Force, Part 8, Feb. 1995
JÄCKEL B.S., CRIPPS R.C., HIRSCHMANN H., PATORSKI
J.A., SEIFERT H.P.
"Review of CORVIS-Test 03/1", 3rd Meeting of theCORVIS Task Force, Part 10, Feb. 1995
KADI Y.A
"Transmutation des actinides mineurs: Analyse desystemes bases sur un accelerateur de protons etvalidation des methodes de calcul", These soumise äla Faculte des Sciences pour la candidature audiplöme de Docteur en Science de I'Universite deProvence (Departement de Physique et de Modeli-sation des Systemes Energ&iques), Oct. 1S951 presently: CEA Cadarache, France
KROGERW."Nullrisiko gibt es nicht", Die Zeit 22,26. May 1995
KROGER W., KNOGLINGER E."Beiträge aus dem PSI zur Verbesserung der Sicher-heit von Ost-Reaktoren des Tschernobyl-Typs(RBMK)", Energienachrichten, Dec. 1995
LONER H."Einfluss der Wasserinhaltsstoffe auf den Aktivitäts-transport im Wasserkreislauf eines Siedwasserreak-tors", Diss. ETH 11001 (1995)
NEALLF.B., SMITH P.A.1, SUMERLING T.J.2, UMEKI M.3
"Putting HLW Performance Assessment Results inPerspective", NAGRA, Bulletin 25 (1995) 47-55,Wettingen, Switzerland,' QuantiSci, Melton Mowbray, U.K.2 SAM Reading, U.K.3 PNC, Tokyo, Japan
NEALL F.B.
"Kristallin-I: Results in Perspective", NAGRA NTB 93-23, Wettingen, Switzerland, Jan. 1995
PATORSKI J.A.
"GORVIS 03/1 Thermographic Temperature FieldMeasurement", 3rd Meeting of the CORVIS TaskForce, Part 11, Feb. 1995
SEIFERT H., TIPPING P., CRIPPS R., TIRBONOD B."Metallurgical Examination: Assessment of the Ther-mal History of the Test Plate from CORVIS 01/6", 3rdMeeting of the CORVIS Task Force, Part 9, Feb.1995
131

P A U L S C H E R R E R I N S T I T U T
Paul Scherrer Institute Phone 056 310 2111CH-5232 Villigen PSI Fax 056 310 2199
i.0 U 34254
Copyright © 2022 FDOKUMEN