A Microcontroller Based System for Controlling Patient ...
11
A Microcontroller Based System for Controlling Patient Respiratory Guidelines Leticia Morales 1 , Manuel Domínguez Morales 2 , Andrés Jiménez-Ramírez 1 , and M.J. Escalona 1 1 Departamento de Lenguajes y Sistemas Informáticos, Universidad de Sevilla, Seville, Spain [email protected], {ajramirez,mjescalona}@us.es 2 Departamento de Arquitectura y Tecnología de Computadores, Universidad de Sevilla, Seville, Spain [email protected] Abstract. The need of making improvements in obtaining (in a non-invasive way) and monitoring the breathing rate parameters in a patient emerges due to (1) the great amount of breathing problems our society suffer, (2) the problems that can be solved, and (3) the methods used so far. Non-specific machines are usually used to carry out these measures or simply calculate the number of inhalations and exhalations within a particular timeframe. These methods lack of effectiveness and precision thus, influencing the capacity of getting a good diagnosis. This proposal focuses on drawing up a technology composed of a mechanism and a user application which allows doctors to obtain the breathing rate parameters in a comfortable and concise way. In addition, such parameters are stored in a database for potential consultation as well as for the medical history of the patients. For this, the current approach takes into account the needs, the capacities, the expectations and the user motivations which have been compiled by means of open interviews, forum discussions, surveys and appli- cation uses. In addition, an empirical evaluation has been conducted with a set of volunteers. Results indicate that the proposed technology may reduce cost and improve the reliability of the diagnosis. Keywords: Respiratory rate Á Arduino Á Wearable devices 1 Introduction The process that living things use to introduce oxygen in their body and get rid of carbon dioxide that is not need is what is commonly known as breathing. According to the World Health Organization (WHO) in 2004 there were 64 million people suffering from respiratory diseases and, at least, 3 million died for this reason [1]. brought to you by CORE View metadata, citation and similar papers at core.ac.uk provided by idUS. Depósito de Investigación Universidad de Sevilla
-
Upload
khangminh22 -
Category
Documents
-
view
1 -
download
0
Transcript of A Microcontroller Based System for Controlling Patient ...
A Microcontroller Based Systemfor Controlling Patient Respiratory Guidelines
Leticia Morales1, Manuel Domínguez Morales2,Andrés Jiménez-Ramírez1, and M.J. Escalona1
1 Departamento de Lenguajes y Sistemas Informáticos,Universidad de Sevilla, Seville, [email protected],
{ajramirez,mjescalona}@us.es
2 Departamento de Arquitectura y Tecnología de Computadores,Universidad de Sevilla, Seville, Spain
Abstract. The need of making improvements in obtaining (in a non-invasive way) and monitoring the breathing rate parameters in a patient emerges due to (1) the great amount of breathing problems our society suffer, (2) the problems that can be solved, and (3) the methods used so far. Non-specific machines are usually used to carry out these measures or simply calculate the number of inhalations and exhalations within a particular timeframe. These methods lack of effectiveness and precision thus, influencing the capacity of getting a good diagnosis. This proposal focuses on drawing up a technology composed of a mechanism and a user application which allows doctors to obtain the breathing rate parameters in a comfortable and concise way. In addition, such parameters are stored in a database for potential consultation as well as for the medical history of the patients. For this, the current approach takes into account the needs, the capacities, the expectations and the user motivations which have been compiled by means of open interviews, forum discussions, surveys and appli-cation uses. In addition, an empirical evaluation has been conducted with a set of volunteers. Results indicate that the proposed technology may reduce cost and improve the reliability of the diagnosis.
Keywords: Respiratory rate � Arduino � Wearable devices
1 Introduction
The process that living things use to introduce oxygen in their body and get rid ofcarbon dioxide that is not need is what is commonly known as breathing.
According to the World Health Organization (WHO) in 2004 there were 64 millionpeople suffering from respiratory diseases and, at least, 3 million died for this reason [1].
brought to you by COREView metadata, citation and similar papers at core.ac.uk
provided by idUS. Depósito de Investigación Universidad de Sevilla
The Spanish Society of Pneumology and Thoracic Surgery (SEPAR in Spanish)conducted a study which concluded that on January 5, 2016, five of the ten diseasesthat cause more mortality in the world occur in the respiratory field. Furthermore,according to data published by the National Statistics Institute (INE in Spanish) ofSpain in 2014, the diseases that have recorded the highest increase in hospital dischargeare related to respiratory pathologies [2].
Early diagnosis may be the key to deal with some of these respiratory diseases [3],among many others. Such diagnosis passes through the recognition of patterns that areabnormal, similar to those formulated when monitoring the respiratory rate.
The respiratory rate corresponds to the number of inhalations and exhalations that ahuman being performs in a unit of time. The respiratory rate of a persons in resting stateis considered as the normal respiratory rate. The normal rate depends on several factorssuch as age, sex, etc.
Monitoring a normal respiratory rate may reveal abnormal patterns that mayindicate many health problems [4]. There are several studies which state the healthbenefits that the recognition of respiratory rate provides [5–10].
Probably, the small impact that this measure has on the daily clinic practice is dueto the lack of technology for obtaining and monitoring the respiratory rate in anon-invasive, easy, comfortable and reliable way.
Nowadays, the methods to measure the respiratory rate in a non-invasive way gothrough the direct vision, monitors of impedance and with capnographs. However,these methods are limited and have a poor accuracy in getting results.
For all aforementioned facts, this paper presents a design, implementation and testof a low cost and easily usable instrument which obtains the respiratory rate in anon-invasive, precise and accurate way. Furthermore, such instrument connects to auser application so that the breathing rate can be monitored and stored, saving therelevant information in a database along with other data.
The rest of the paper is structured as follows. Section 2 shows the proposal and thedetails of its development. Section 3 describes how the satisfaction generated by theproposed technology has been measured. Section 4 discusses the proposals that existand the main differences between them. Finally, Sect. 5 includes a brief summary of theidea, the strengths and weaknesses, and the lines that are open to continue working.
2 Contribution
2.1 Proposed System
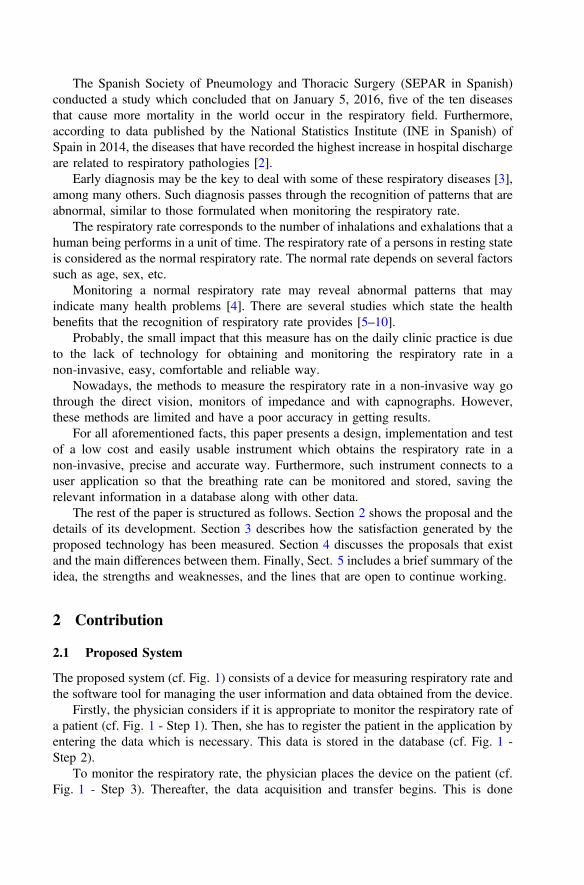
The proposed system (cf. Fig. 1) consists of a device for measuring respiratory rate andthe software tool for managing the user information and data obtained from the device.
Firstly, the physician considers if it is appropriate to monitor the respiratory rate ofa patient (cf. Fig. 1 - Step 1). Then, she has to register the patient in the application byentering the data which is necessary. This data is stored in the database (cf. Fig. 1 -Step 2).
To monitor the respiratory rate, the physician places the device on the patient (cf.Fig. 1 - Step 3). Thereafter, the data acquisition and transfer begins. This is done
through a Bluetooth connection to the application where a graphic is painted accordingto such data (cf. Fig. 1 - Step 4).
Finally, the health personnel can analyze the data obtained, save and consult therelevant information when necessary (cf. Fig. 1 - Step 5).
2.2 Development Details
For the process of development of the proposed technology, a user-centered method-ology is followed. This methodology encompasses a heterogeneous set of method-ologies and techniques that share a common goal: to know and understand the needs,objectives, motivations, limitations, behavior and characteristics of the user [11].
In order to clearly understand the development process that has been followed toobtain the technology which proposed in this paper, it is divided into two stages:
2.2.1 Stage 1. Knowing the End Users ThoroughlyIn order to learn about the scenario and its users, open interviews, discussion groupsand surveys are carried out. This is intended to explain the proposal to users and receivean opinion about it. With the help of these methods, the necessary changes can be madeto make the study more fruitful and better adapted to reality.
The end users of this technology are both patients—who need to be monitored—and physicians—who take control of this monitor. Therefore, the technology shouldfulfill their needs. On the one hand, it should be comfortable for the patient and on theother hand, it should be easy to handle for the doctors, among other things.
In addition, the needs that physicians have when obtaining and storing the infor-mation of the different patients have been known. Consequently, a set of functional
Fig. 1. Overview of the proposal.
requirements have been stipulated for the proposed technology, i.e., a device in chargeof obtaining the respiratory rate, a user application where the doctor manages suchdevice and the information concerning the patient, and a database where all theinformation is stored.
Once this stage is finished, the data that the application and the database mustcontain and the functional requirements that the application and the device mustcomply with are known. Thereafter, the development of each part may start.
2.2.2 Stage 2. Development of the New TechnologyAt this stage, the development of the different parts of the proposed technology isexplained separately.
Development of the Device. The development of this part is performed over anArduino system [12, 13]. For the detection of sound, a microphone KY-037 is con-nected to the hardware part of Arduino through its analog output since it is the one thatobtains a voltage signal in real time. This microphone captures the small changes in theair pressure that occur when one breathes and then, converts such changes into ameasurable electrical signal which is analogous to the sound that want to be measured.
The hardware part connects to the Arduino software part wirelessly through aBluetooth device (i.e., Bluetooth JY-MCU). The software part states the COM portwhere Bluetooth is anchored and the Arduino board model which is used. Additionally,a program based on the language Processing [14] (i.e., Arduino programming lan-guage) is developed to indicate the data that want to be obtained.
Development of the Application. For the development of the desktop application,Microsoft Visual Studio 2015 has been used [15] together with the C# programminglanguage.
The application consists of a graphical interface that allows to manage the data ofthe patients, their clinical histories as well as the data related to the respiratory rate. Thegraphical interfaces of the application are created through different forms. Each formrepresents one of the screens that can be accessed in the application. These screens aredesigned using the graphical components which are provided by Visual Studio.
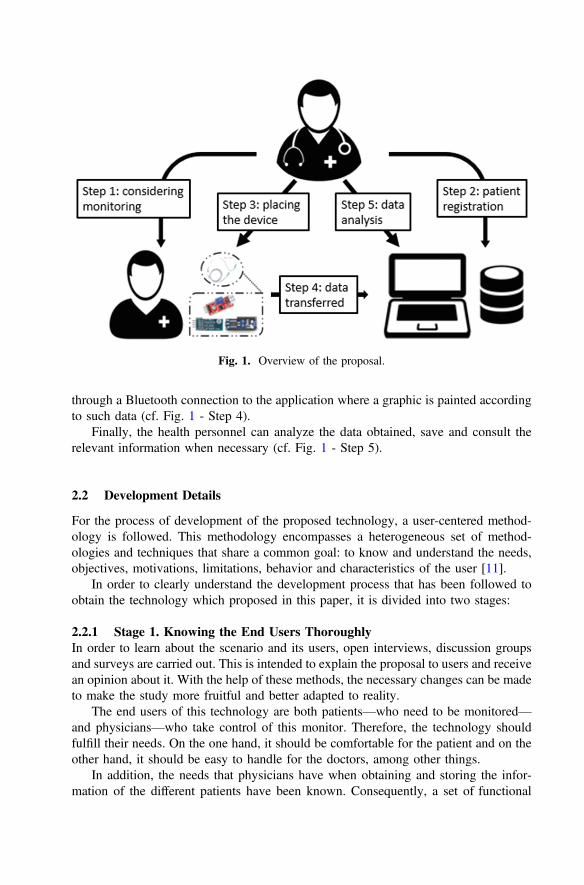
Figure 2 shows the graphical interface developed for the analysis of the respiratoryrate. As shown, a plot is depicted according to data which is being obtained from thedevice.
When the stipulated time for the test expires, the physician can save the generateplot which is assigned to the patient and contains the date and time when the plot wasperformed. The peaks of the plot correspond to the expirations that the patient performsthroughout the respiratory cycle.
Related to the communication of the application, in the one hand, it maintains abluetooth communication with the device to obtain the data that the sensor captures andto paint a plot with them. In the other hand, the application communicates with adatabase developed with Microsoft Access.
To summarize, the development of this software comprises 9 forms with 18 C#classes which contain 4500 lines of code in total. In addition, the prototype wasdeveloped by one undergraduate student in 820 h.
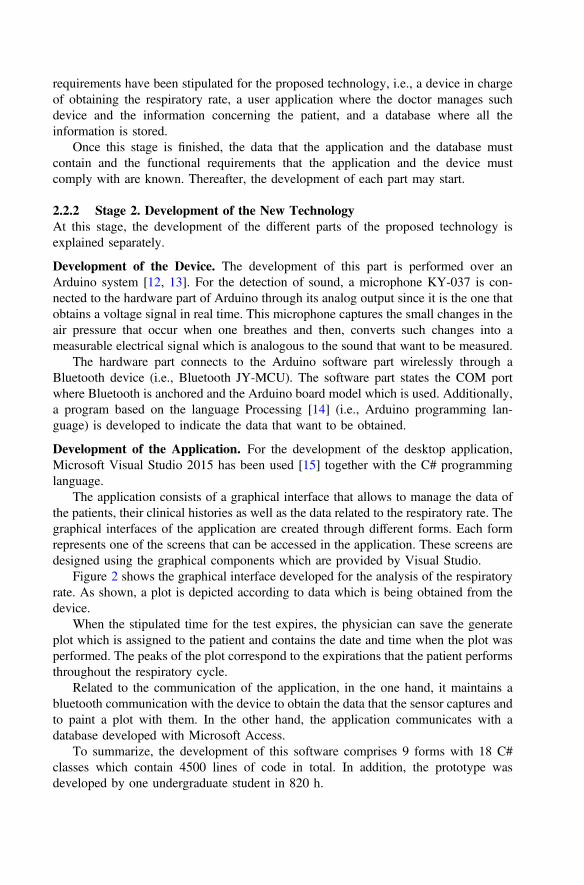
Design of the Data Base. For the process of designing the database (cf. Fig. 3) thesteps proposed in the book “El nuevo PHP. Conceptos avanzados” by Vicente JavierEslava Muñoz have been followed [16].
The design is divided into three stages:
• Conceptual DesignAt this stage an information schema is constructed which is known as a conceptualschema.The conceptual schema is constructed using the information that is collected instage 1 of the development. When constructing this scheme, one understands themeaning of the data that are necessary and the entities, attributes and relationshipsare found.
Fig. 2. Part of the graphical interface
Fig. 3. Medical table design
The objective of this scheme is to understand the perspective that the user has of thedata, i.e., the nature of it. In addition, this design has been used to convey to theusers what has been understood about the information that this one wants to handle.
• Logical DesignAt this stage the conceptual schema is transformed into a logical schema. In thiscase, the relational model has been used.Normalization is a technique that is used to verify the validity of logical schemesbased on the relational model, since it ensures that the relations (i.e., tables)obtained do not have redundant data. In this case the third normal form is reached.
• Physical DesignThe physical design is the process of producing the description of the implemen-tation of the database in the database management system that has been chosen, inthis case Microsoft Access.
3 Evaluation
After the development of the proposed technology, the system passed to the testingphase. Then, a set of tests were performed to a group of real users, consisting of the useof this technology. Specifically, 20 users participated, of which 10 were doctors and 10patients.
These users are told the traditional methods that exist for the taking of the respi-ratory rate so that they are put into situation.
Once everything was understood regarding what is currently used, some envelopedwere delivered with two satisfaction surveys. The first survey was intended to measurethe satisfaction of the existing methods and the second to measure the satisfaction ofthe proposed method. These surveys were anonymous, so there was no kind of con-ditioning when expressing what they really thought.
After the first surveys were filled, the operation of the technology was explained inorder to be tested. They had about half an hour to test the proposed technology. Duringthe tests, the group of users were observed and analyzed in order to know how they usethe application and the device. As a result, on the one hand, any change in functionalrequirements was required and, on the other hand, a set of non-functional requirementswas detected.
Finally, once the test is finished, users were asked to fill in the second survey, i.e.,related to the satisfaction of the proposed method. And once completed, both surveyswere inserted in the envelope and delivered.
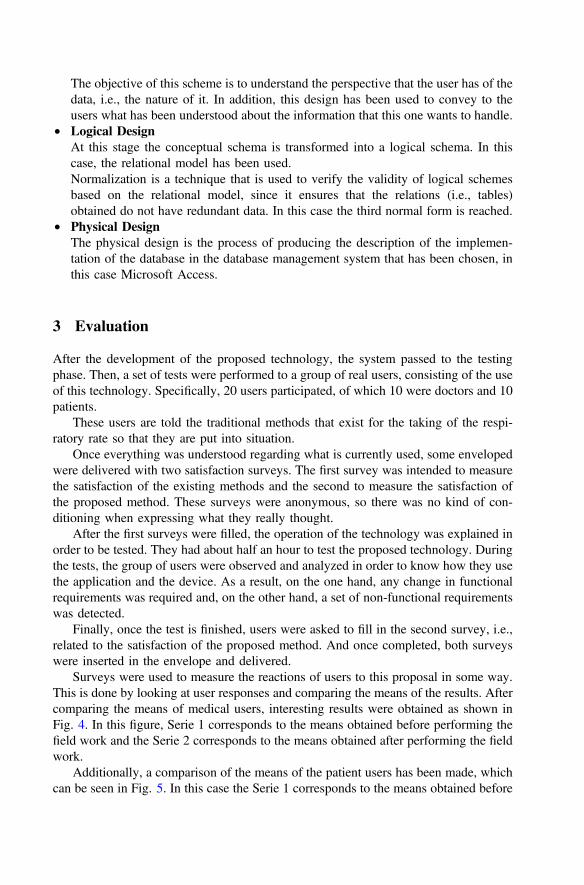
Surveys were used to measure the reactions of users to this proposal in some way.This is done by looking at user responses and comparing the means of the results. Aftercomparing the means of medical users, interesting results were obtained as shown inFig. 4. In this figure, Serie 1 corresponds to the means obtained before performing thefield work and the Serie 2 corresponds to the means obtained after performing the fieldwork.
Additionally, a comparison of the means of the patient users has been made, whichcan be seen in Fig. 5. In this case the Serie 1 corresponds to the means obtained before
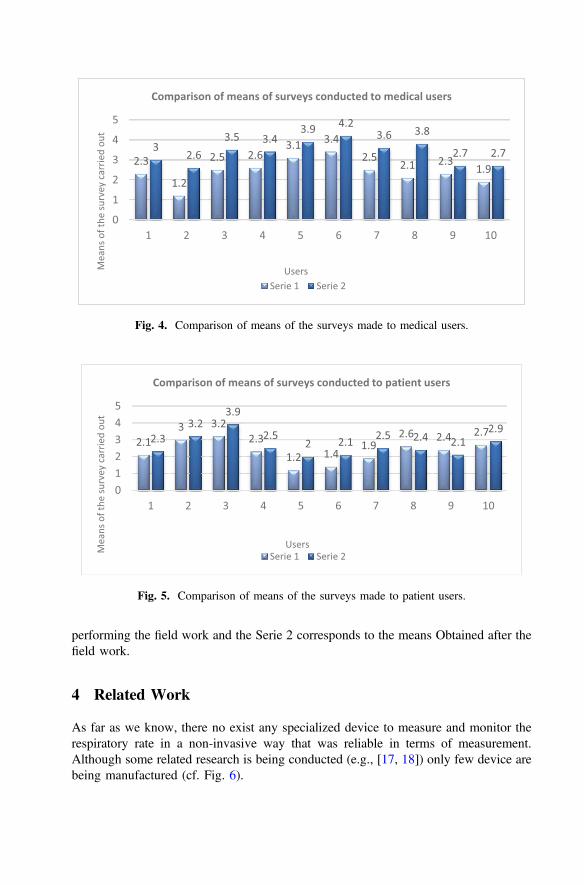
performing the field work and the Serie 2 corresponds to the means Obtained after thefield work.
4 Related Work
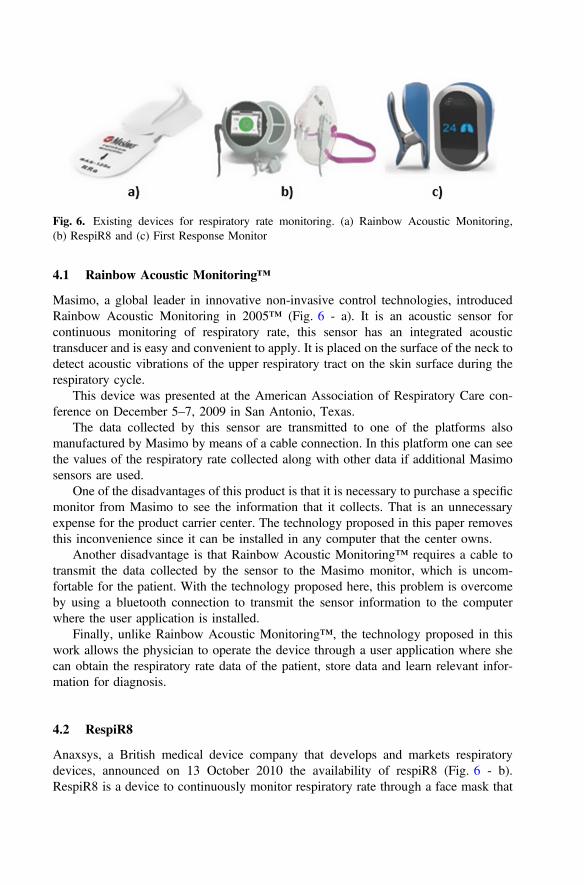
As far as we know, there no exist any specialized device to measure and monitor therespiratory rate in a non-invasive way that was reliable in terms of measurement.Although some related research is being conducted (e.g., [17, 18]) only few device arebeing manufactured (cf. Fig. 6).
Fig. 4. Comparison of means of the surveys made to medical users.
Fig. 5. Comparison of means of the surveys made to patient users.
4.1 Rainbow Acoustic Monitoring™
Masimo, a global leader in innovative non-invasive control technologies, introducedRainbow Acoustic Monitoring in 2005™ (Fig. 6 - a). It is an acoustic sensor forcontinuous monitoring of respiratory rate, this sensor has an integrated acoustictransducer and is easy and convenient to apply. It is placed on the surface of the neck todetect acoustic vibrations of the upper respiratory tract on the skin surface during therespiratory cycle.
This device was presented at the American Association of Respiratory Care con-ference on December 5–7, 2009 in San Antonio, Texas.
The data collected by this sensor are transmitted to one of the platforms alsomanufactured by Masimo by means of a cable connection. In this platform one can seethe values of the respiratory rate collected along with other data if additional Masimosensors are used.
One of the disadvantages of this product is that it is necessary to purchase a specificmonitor from Masimo to see the information that it collects. That is an unnecessaryexpense for the product carrier center. The technology proposed in this paper removesthis inconvenience since it can be installed in any computer that the center owns.
Another disadvantage is that Rainbow Acoustic Monitoring™ requires a cable totransmit the data collected by the sensor to the Masimo monitor, which is uncom-fortable for the patient. With the technology proposed here, this problem is overcomeby using a bluetooth connection to transmit the sensor information to the computerwhere the user application is installed.
Finally, unlike Rainbow Acoustic Monitoring™, the technology proposed in thiswork allows the physician to operate the device through a user application where shecan obtain the respiratory rate data of the patient, store data and learn relevant infor-mation for diagnosis.
4.2 RespiR8
Anaxsys, a British medical device company that develops and markets respiratorydevices, announced on 13 October 2010 the availability of respiR8 (Fig. 6 - b).RespiR8 is a device to continuously monitor respiratory rate through a face mask that
Fig. 6. Existing devices for respiratory rate monitoring. (a) Rainbow Acoustic Monitoring,(b) RespiR8 and (c) First Response Monitor
uses its own technology through a patented sensor that responds quickly and reliably todifferences in the degree of humidity of the inhaled air with respect to exhaled one.
The data collected by the sensor can be read by a screen arranged on a smallmonitor. The mask and the monitor are connected by cable.
Similarly to Rainbow Acoustic Monitoring™, one needs her own monitor to viewthe data that the mask collects from the respiratory rate. As stated above, this drawbackdoes not exist with the technology proposed here.
Also, the connection between the monitor and the RespiR8 device is wired which isuncomfortable for patients. As discussed above, the proposed device transmits the datawirelessly.
Another thing worth noting is that the price of the consumables of the proposedtechnology (i.e., a nasal cannula) is much lower than that of RespiR8.
4.3 First Response Monitor
Finally, Cambridge Design Partnership, a leader in technology and product design,announces on August 6, 2015 that they have created a vital sign monitor for reliable,fast measurement and for real-time display of respiratory rate (Fig. 6 - c). This monitoris shaped like a clip to be placed on the nose. Once placed, the control of the breathingrate begins immediately.
The collected data can be visualized through a screen that is already incorporated ortransmitted in real time to a Smartphone or Tablet via Bluetooth.
This technology is not yet in the market so its pros and cons cannot be knownaccurately. Nonetheless, one of its cons would be that it cannot save relevant infor-mation about the patient who the test is being performed to, or store the respiratory ratedata information that is obtained.
5 Conclusions and Future Work
This work presents the development of a device from a microcontroller and a respi-ratory rate detection system with microphone which obtains statistics of the respiratoryrate and reflect them in a user application on the computer. The information that iscaptured by the device is packaged and sent wirelessly using a bluetooth device.
Therefore, the developed technology speeds up obtaining vital parameters and cancarry out early diagnosis of diseases in an easier way. To do this, the plots that aregenerated with the information regarding the respiratory rate that is captured by thesensor are stored the medical equipment. This information includes relevant data of thepatient to whom the monitoring of the respiratory rate will be carried out. Thisinformation is what has been considered necessary according to the requirements of thedoctors.
In short, all the objectives that had been set at the beginning of the work werefulfilled.
Based on the results obtained in the testing part of the system, the development ofthe technology proposed here is feasible, thus enabling to obtain more information onthe evolution of the patient.
Due to the simplicity to the developed system is more comfortable for the patient.In addition the patient will have more confidence in the results of his test, because theproposed technology provides more reliable results compared to the currenttechnology.
Probably, the proposed technology is feasible since the requirements and reactionsof end users have been taken into account, i.e., their needs, objectives, motivations,limitations and behavior. Therefore, a greater satisfaction and experience of use isobtained with the minimum effort of the users.
In summary, this technology would achieve, among other things, economic sav-ings, greater reliability in the results and therefore more reliable diagnostics.
Throughout the work have been proposed ideas to improve this technology and theinformation that is obtained, but lack for time and material, among other things, has notbeen possible. Some of them correspond to the following:
• Use of sensor with greater accuracy for a better quality and accuracy of the obtaineddata.
• Extension of the application and graphic interface with the objective of obtainingmore information from both the health professional and the patient.
• Implementation of new sensors to be able to measure other vital signs and thusobtaining a more exhaustive examination.
• Optimize the code in order to reduce the software execution time.• The use of Wi-Fi technology instead of Bluetooth technology in order to reduce the
time spent when transferring large files.• Expansion of the database to store more information.• Database in the cloud.• Local storage in the microcontroller.• Activity alarms.• For the images that are generated from the respiratory rate, use of the DICOM
standard (Digital Imaging and Communication in Medicine) [19].
Acknowledgements. This research has been supported by the Pololas project(TIN2016-76956-C3-2-R) and by the SoftPLM Network (TIN2015-71938-REDT) of the Spanishthe Ministry of Economy and Competitiveness.
References
1. OMS|Enfermedad pulmonar obstructiva crónica (EPOC). WHO. http://www.who.int/respiratory/copd/es/. Accessed 09 June 2016
2. SEPAR NP Morbilidad hospitalaria neumología.pdf, Google Docs, 5 ene 2016. https://drive.google.com/file/d/0B3-GelWPMn4dNjdCUThzMS00MkE. Accessed 09 June 2016
3. SEPAR_NP La educacion de los profesionales mejorará el diagnosttico de la FPI.pdf, 2November 2015, Google Docs. https://drive.google.com/file/d/0B3-GelWPMn4dUi02TVhHb2NPbnM/view?pref=2&pli=1&usp=embed_facebook. Accessed 09 June 2016
4. Frecuencia respiratoria normal|Salud y bienestar. http://lasaludi.info/frecuencia-respiratoria-normal.html. Accessed 21 Jan 2016
5. Fieselmann, J.F., Hendryx, M.S., Helms, C.M., Wakefield, D.S.: Respiratory rate predictscardiopulmonary arrest for internal medicine inpatients. J. Gen. Intern. Med. 8(7), 354–360(1993)
6. Subbe, C.P., Davies, R.G., Williams, E., Rutherford, P., Gemmell, L.: Effect of introducingthe modified early warning score on clinical outcomes, cardio-pulmonary arrests andintensive care utilisation in acute medical admissions. Anaesthesia 58(8), 797–802 (2003)
7. Goldhill, D.R., McNarry, A.F., Mandersloot, G., McGinley, A.: A physiologically-basedearly warning score for ward patients: the association between score and outcome.Anaesthesia 60(6), 547–553 (2005)
8. Cretikos, M., et al.: The objective medical emergency team activation criteria: a case-controlstudy. Resuscitation 73(1), 62–72 (2007)
9. Goldhill, D.R., McNarry, A.F.: Physiological abnormalities in early warning scores arerelated to mortality in adult inpatients. Br. J. Anaesth. 92(6), 882–884 (2004)
10. Cook, C.J., Smith, G.B.: Do textbooks of clinical examination contain information regardingthe assessment of critically ill patients? Resuscitation 60(2), 129–136 (2004)
11. Hassan Montero, Y., Ortega Santamaría, S.: Informe APEI sobre usabilidad12. Arduino - ArduinoBoardNano. https://www.arduino.cc/en/Main/ArduinoBoardNano.
Accessed 09 June 201613. Arduino - Software. https://www.arduino.cc/en/Main/Software#. Accessed 09 June 201614. Processing. MIT Press. https://mitpress.mit.edu/books/processing-0. Accessed 04 Jan 201715. Webster, L.: Any Developer, Any App, Any Platform, Visual Studio, 16 November 2016.
https://www.visualstudio.com/es/. Accessed 04 Jan 201716. Muñoz, V.J.E.: El nuevo PHP. Conceptos avanzados, Vicente Javier Eslava Muñoz (2013)17. Reyes, B.A., Reljin, N., Chon, K.H.: Tracheal sounds acquisition using smartphones.
Sensors 14(8), 13830–13850 (2014)18. Nam, Y., Reyes, B.A., Chon, K.H.: Estimation of respiratory rates using the built-in
microphone of a smartphone or headset. IEEE J. Biomed. Health Inform. 20(6), 1493–1501(2016)
19. DICOM Homepage. http://dicom.nema.org/. Accessed 09 June 2016