A method for rostrocaudal integration of morphometric information from transmitter-identified cell...
19
Journal of Neuroscience Methods, 10 (1984) 83-101 83 Elsevier NSM 00361 Research Papers A method for rostrocaudal integration of morphometric information from transmitter-identified cell groups. A morphometrical identification and description of 5-HT cell groups in the medulla oblongata of the rat * L.F. Agnati 1, K. Fuxe 2 L. Calza 1, I. Zini 1 T. H6kfelt 2, A. Steinbusch 2 and A. Verhofstad 3 I Departments of Human PhysioloD' and Endocrinology, Unwersity of Modena, Modena, (Italy), 2 Department of Histology, Karolinska Institutet, Stockholm (Sweden) and 3 Department of Anatomy and Embryology, Catholic University, Nijmegen (The Netherlands) (Received February 4th, 1983) (Revised September 28th, 1983) (Accepted December 23rd, 1983) Key words: morphology--5-HT--morphometry--immunocytochemistry--cell body parameters--cell group parameters--rostro-caudal integration--medulla oblongata A method has been developed to integrate rostrocaudal information from morphometrically char- acterized 5-HT nerve cell groups visualized by means of the indirect immunofluorescence technique in single coronal sections of the neuroaxis. The present method has been applied to the 5-HT positive cells of the medulla oblongata of the rat. 5-HT cell body and cell group parameters were measured by the use of a semiautomatic image analyzer (Kontron, MOP AMO 2) plugged into an Apple II computer. The density distribution of 5-HT positive cells was also studied by dividing the area analyzed into unitary squares (about 120× 120 p,m) and then by considering the number of 5-HT cells falling in each of these squares. The existence of a 5-HT cell group was determined by testing the randomness of the 5-HT profiles per unitary square. The entire population of 5-HT positive cells as well as the 5-HT cell groups were described in terms of gravity center coordinates, mean maximal diameter and homogeneity index. A rostrocaudal representation of the gravity centers and of the dispersion of the 5-HT nerve cell groups around them provided an exact three-dimensional description of the respective locations of the 5-HT cell groups within the medulla oblongata. These methods can be applied to all types of transmitter-identified cell groups and at any level of the neuroaxis. * In memory of Professor Giorgio Montanari, professor at the Medical Faculty of Modena. Correspondence." K. Fuxe, Department of Histology, Karolinska Institutet, Box 60400, S-104 01 Stock- holm, Sweden. 0165-0270/84/$03.00 © 1984 Elsevier Science Publishers B.V.
-
Upload
independent -
Category
Documents
-
view
4 -
download
0
Transcript of A method for rostrocaudal integration of morphometric information from transmitter-identified cell...
Journal of Neuroscience Methods, 10 (1984) 83-101 83
Elsevier
NSM 00361
Research Papers
A method for rostrocaudal integration of morphometric information from
transmitter-identified cell groups. A morphometrical identification and description of 5-HT cell groups in
the medulla oblongata of the rat *
L.F. Agnati 1, K. Fuxe 2 L. Calza 1, I. Zini 1 T. H6kfelt 2, A. Steinbusch 2 and A. Verhofstad 3
I Departments of Human PhysioloD' and Endocrinology, Unwersity of Modena, Modena, (Italy), 2 Department of Histology, Karolinska Institutet, Stockholm (Sweden) and 3 Department of Anatomy and
Embryology, Catholic University, Nijmegen (The Netherlands)
(Received February 4th, 1983) (Revised September 28th, 1983)
(Accepted December 23rd, 1983)
Key words: morpho logy- -5 -HT- -morphomet ry - - immunocy tochemis t ry - -ce l l body parameters--cel l group parameters--rostro-caudal in tegrat ion--medul la oblongata
A method has been developed to integrate rostrocaudal information from morphometrically char- acterized 5-HT nerve cell groups visualized by means of the indirect immunofluorescence technique in single coronal sections of the neuroaxis. The present method has been applied to the 5-HT positive cells of the medulla oblongata of the rat. 5-HT cell body and cell group parameters were measured by the use of a semiautomatic image analyzer (Kontron, MOP AMO 2) plugged into an Apple II computer.
The density distribution of 5-HT positive cells was also studied by dividing the area analyzed into unitary squares (about 120× 120 p,m) and then by considering the number of 5-HT cells falling in each of these squares. The existence of a 5-HT cell group was determined by testing the randomness of the 5-HT profiles per unitary square. The entire population of 5-HT positive cells as well as the 5-HT cell groups were described in terms of gravity center coordinates, mean maximal diameter and homogeneity index. A rostrocaudal representation of the gravity centers and of the dispersion of the 5-HT nerve cell groups around them provided an exact three-dimensional description of the respective locations of the 5-HT cell groups within the medulla oblongata. These methods can be applied to all types of transmitter-identified cell groups and at any level of the neuroaxis.
* In memory of Professor Giorgio Montanari, professor at the Medical Faculty of Modena. Correspondence." K. Fuxe, Department of Histology, Karolinska Institutet, Box 60400, S-104 01 Stock- holm, Sweden.
0165-0270/84/$03.00 © 1984 Elsevier Science Publishers B.V.
~4
Introduction
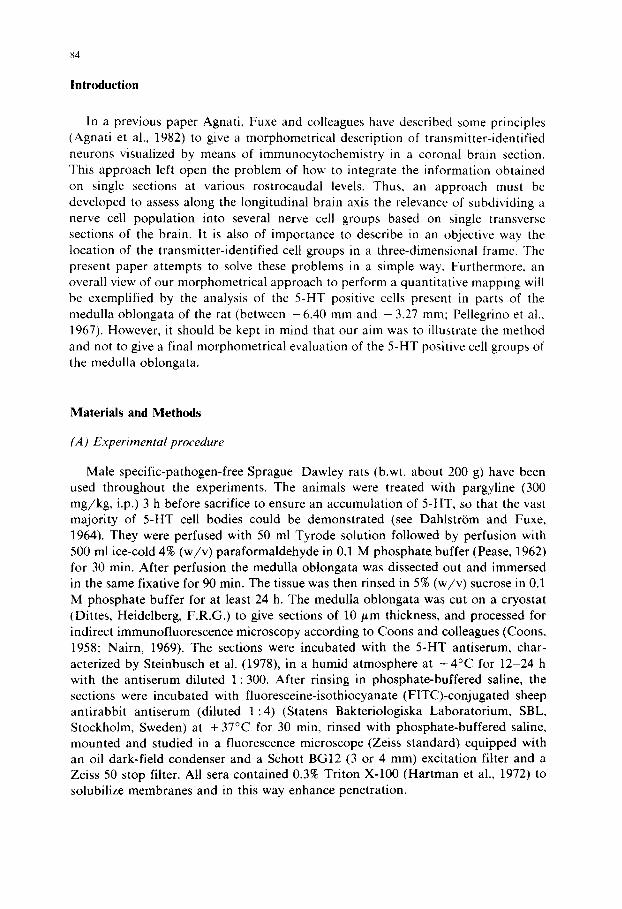
In a previous paper Agnati, Fuxe and colleagues have described some principles (Agnati et al., 1982) to give a morphometrical description of transmitter-identified neurons visualized by means of immunocytochemistry in a coronal brain section. This approach left open the problem of how to integrate the information obtained on single sections at various rostrocaudal levels. Thus, an approach must be developed to assess along the longitudinal brain axis the relevance of subdividing a nerve cell population into several nerve cell groups based on single transverse sections of the brain. It is also of importance to describe in an objective way the location of the transmitter-identified cell groups in a three-dimensional frame. The present paper attempts to solve these problems in a simple way, Furthermore, an overall view of our morphometrical approach to perform a quantitative mapping will be exemplified by the analysis of the 5-HT positive cells present in parts of the medulla oblongata of the rat (between - 6.40 mm and - 3.27 mm: Pellegrino et al., 1967). However, it should be kept in mind that our aim was to illustrate the method and not to give a final morphometrical evaluation of the 5-HT positive cell groups of the medulla oblongata.
Materials and Methods
(A) Experimental procedure
Male specific-pathogen-free Sprague-Dawley rats (b.wt. about 200 g) have been used throughout the experiments. The animals were treated with pargyline (300 mg/kg , i.p.) 3 h before sacrifice to ensure an accumulation of 5-HT, so that the vast majority of 5-HT cell bodies could be demonstrated (see Dahlstr~Sm and Fuxe, 1964). They were perfused with 50 ml Tyrode solution followed by perfusion with 500 ml ice-cold 4% (w/v) paraformaldehyde in 0.1 M phosphate buffer (Pease, 1962) for 30 min. After perfusion the medulla oblongata was dissected out and immersed in the same fixative for 90 min. The tissue was then rinsed in 5% (w/v) sucrose in 0.1 M phosphate buffer for at least 24 h. The medulla oblongata was cut on a cryostat (Dittes, Heidelberg, F.R.G.) to give sections of 10/~m thickness, and processed for indirect immunofluorescence microscopy according to Coons and colleagues (Coons, 1958; Nairn, 1969). The sections were incubated with the 5-HT antiserum, char- acterized by Steinbusch et al. (1978), in a humid atmosphere at + 4°C for 12-24 h with the antiserum diluted 1:300. After rinsing in phosphate-buffered saline, the sections were incubated with fluoresceine-isothiocyanate (FITC)-conjugated sheep antirabbit antiserum (diluted 1:4) (Statens Bakteriologiska Laboratorium, SBL, Stockholm, Sweden) at + 37°C for 30 min, rinsed with phosphate-buffered saline, mounted and studied in a fluorescence microscope (Zeiss standard) equipped with an oil dark-field condenser and a Schott BG12 (3 or 4 mm) excitation filter and a Zeiss 50 stop filter. All sera contained 0.3% Triton X-100 (Hartman et al., 1972) to solubilize membranes and in this way enhance penetration.
85
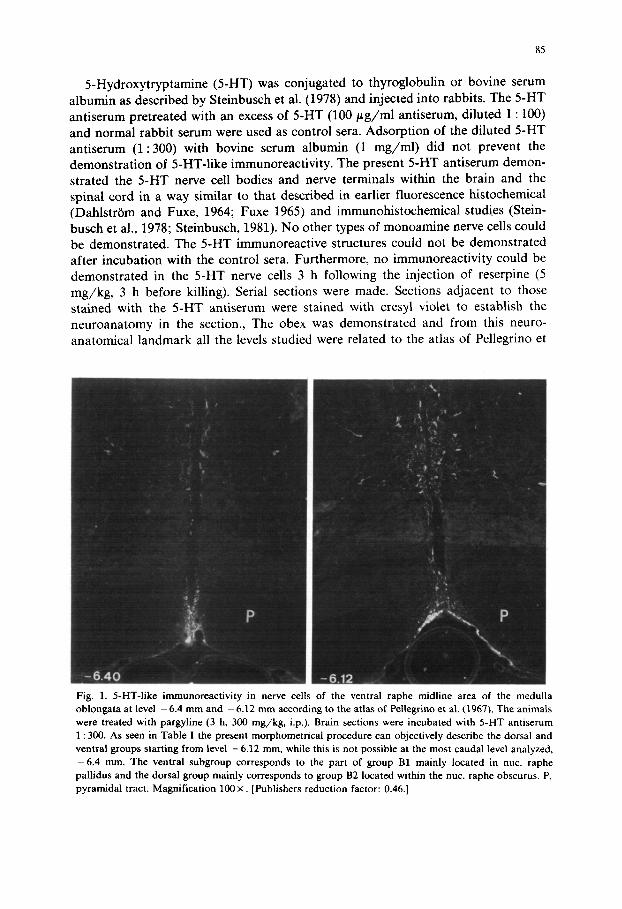
5-Hydroxytryptamine (5-HT) was conjugated to thyroglobulin or bovine serum albumin as described by Steinbusch et al. (1978) and injected into rabbits. The 5-HT antiserum pretreated with an excess of 5-HT (100 # g / m l antiserum, diluted 1 : 100) and normal rabbit serum were used as control sera. Adsorption of the diluted 5-HT antiserum (1:300) with bovine serum albumin (1 mg/ml) did not prevent the demonstration of 5-HT-like immunoreactivity. The present 5-HT antiserum demon- strated the 5-HT nerve cell bodies and nerve terminals within the brain and the spinal cord in a way similar to that described in earlier fluorescence histochemical (Dahlstrbm and Fuxe, 1964; Fuxe 1965) and immunohistochemical studies (Stein- busch et al., 1978; Steinbusch, 1981). No other types of monoamine nerve cells could be demonstrated. The 5-HT immunoreactive structures could not be demonstrated after incubation with the control sera. Furthermore, no immunoreactivity could be demonstrated in the 5-HT nerve cells 3 h following the injection of reserpine (5 mg/kg, 3 h before killing). Serial sections were made. Sections adjacent to those stained with the 5-HT antiserum were stained with cresyl violet to establish the neuroanatomy in the section., The obex was demonstrated and from this neuro- anatomical landmark all the levels studied were related to the atlas of Pellegrino et
Fig. 1. 5-HT-like immunoreactivity in nerve cells of the ventral raphe midline area of the medulla oblongata at level - 6.4 mm and - 6.12 mm according to the atlas of Pdlegrino et al. (1967). The animals were treated with pargyline (3 h, 300 mg/kg, i.p.). Brain sections were incubated with 5-HT antiserum 1 : 300. As seen in Table I the present morphometrical procedure can objectively describe the dorsal and ventral groups starting from level -6 .12 mm, while this is not possible at the most caudal level analyzed, - 6 . 4 mm. The ventral subgroup corresponds to the part of group B1 mainly located in nuc. raphe pallidus and the dorsal group mainly corresponds to group B2 located within the nuc. raphe obscurus. P, pyramidal tract. Magnification 100 ×. [Publishers reduction factor: 0.46.]
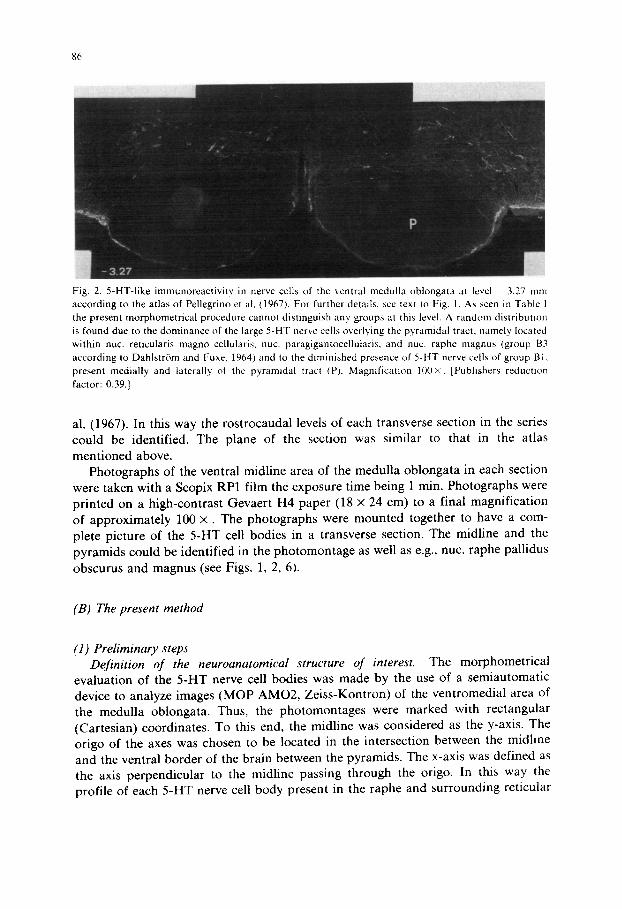
Fig. 2. 5-HT-like immunoreactivity in nerve cells of the ventral medulla oblongata at level 3.27 mm according to the atlas of Pellegrino et al. (1967). For further details, see text to Fig. 1. As seen in Table 1 the present morphometrical procedure cannot distinguish any groups at this level. A random distribution is found due to the dominance of the large 5-HT nerve cells overlying the pyramidal tract, namely located within nuc. reticularis magno cellularis, nuc. paragigantocellularis, and nuc. raphe magnus (group B3 according to Dahlstr~Sm and Fuxe, 1964) and to the diminished presence of 5-HT nerve cells of group BI, present medially and laterally of the pyramidal tract (P). Magnification 100×. [Publishers reduction factor: 0.39.]
al. (1967). In this way the rostrocaudal levels of each transverse section in the series could be identified. The plane of the section was similar to that in the atlas mentioned above.
Photographs of the ventral midline area of the medulla oblongata in each section were taken with a Scopix RP1 film the exposure time being 1 min. Photographs were printed on a high-contrast Gevaert H4 paper (18 x 24 cm) to a final magnification of approximately 100 x . The photographs were mounted together to have a com- plete picture of the 5-HT cell bodies in a transverse section. The midline and the pyramids could be identified in the photomontage as well as e.g., nuc. raphe pallidus obscurus and magnus (see Figs. 1, 2, 6).
(B) The present method
(1) Preliminary steps Definition of the neuroanatomical structure of interest. The morphometrical
evaluation of the 5-HT nerve cell bodies was made by the use of a semiautomatic device to analyze images (MOP AMO2, Zeiss-Kontron) of the ventromedial area of the medulla oblongata. Thus, the photomontages were marked with rectangular (Cartesian) coordinates. To this end, the midline was considered as the y-axis. The origo of the axes was chosen to be located in the intersection between the midline and the ventral border of the brain between the pyramids. The x-axis was defined as the axis perpendicular to the midline passing through the origo. In this way the profile of each 5-HT nerve cell body present in the raphe and surrounding reticular

87
nuclei of the medulla oblongata, will obtain a position which can be described by means of its coordinates.
Definition of the profiles considered. Usually in morphometrical studies it is advantageous to count nucleoli rather than nuclei or cell bodies since this would reduce the error (Haug, 1979). However, after immunocytochemical visualization of nerve cells it is not possible to detect nucleoli. Therefore, we relied either on the presence of the nucleus in the profile or on the profile size. Thus, only profiles with a maximal diameter not smaller than 30% of the largest maximal diameter present in the section were considered. Profile coordinates, as well as a number of parameters (see e.g., Weibel, 1979) such as profile diameter (Ferret's diameter, and maximal diameter), profile perimeter, profile area, volume fraction and shape factor (equal to 1 for a perfect circle and 0 for a segment of a straight line) can be measured and then fed into the Apple II computer, which was connected with the Kontron MOP AMO 2 device for further possible elaborations (see Table in Figs. 3, 4 and 5).
Assessment of the area of analysis. A grid of unitary squares (side: 5 times the mean of the maximal diameter of the profiles present in the section) has been
1200
1000
8 0 0
6OO
4 0 0 ,
OENSITT DISTRIBUTION OF 5HT CELLS (-6.60}
s I
t
I
s 1 •
I I 2 "
I
I
2
e1
" . 1 1 t
i I
I
2 0 0
- 6 0 0 - 4 0 0 - 2 0 0 0 2 0 0 4 0 0 6 0 0 BOO
MICRONS
O R I E N T A T I O N
4
m
LRTERRL >
< L~TERAL
HORPHOHETRIC EVRLURTION
OF THE CELL GROUP
PROFILE NURBER 17 FERRET DIAHETER
- ALONG THE X RXI$ 2¢ .05 - ALONG THE ¥ AXIS 26 .07
REAH PROFILE PERIHETER ?8.54 HEAH PROF|LE AREA 370.3K SHAPE FACTOR .75
VOLUHE FRACTION 4 .74E-03 NERN FREE DISTRNCE 695 ,7 GRRV]TT CENTER
- ALONG THE X RX|$ ~38 - ALONG THE T RX]S 1174.01
Fig. 3. Density distribution of 5-HT-like immunoreactive nerve cells in the ventral part of the medulla oblongata at level - 6 . 4 mm according to the atlas of Pellegrino et al. (1967). A density map is shown and the number of 5-HT immunoreactive cells is indicated per square. The square has a side of 140/~m (i.e. about 5 times the maximal diameter of the 5-HT nerve cells). The y-axis is parallel to the midline and the origo is located at the point where the midline reaches the ventral surface of the brain. Cell body and cell group parameters are shown in the table of the figure. The unbroken line outlines the quadrilateral from which, by means of the procedure presented in the text, the sampled area delimited by the dotted line has been obtained.
88
DENSITY OISTRIBUTION OF SHT
I I [ I I I l l l ~ IIL "
2000 I ; t l ]1
m ~ [ i [
! ~ 1 1 £ i t J '1i I j ] 1211111
o i
- 2 0 0 0
i i r t t !~ - -~ -T , ~ . . . . i _ r lllllj tl
| I111"[ I I 1 I l 11111U" i i l 1 1 131311111.] I I I I I i [IH31"l I 'L I I 11 Fql l l [ 'J ] I I [ [ 2 i l l ] . [ [ I | I [3111 I - " [ [ I I
[ [ I " ; I I I ] ] 1 4 1 1
O 2 0 0 0
MICRONS
CELLS { - 6 . 12}
0~1ENTF~T ] ON
LATERRL < 4 - - - - >
L~'ER.L i~
MORPHOMETRIC EVgLUATION OF IHE CELL GROUP
PROFILE NUMBER 46 FERRET D]BMETER - BLBNG THE X @XIS 22 3 - ~L~NG THE T RXIS 2616
MEaN PROFJLE PERJBETER 7BOB MEaN PROFILE ~RE~ 306/6 SM~PE F~CTOR 63
V~LU~E FR~CT]gN 8 49£ 03 REBN FREE DISTRNCE 1096 41 GR~V]TT CENTER - PLANS T~E X PXIS 45
RLONG THE T ~XJ5 956 95
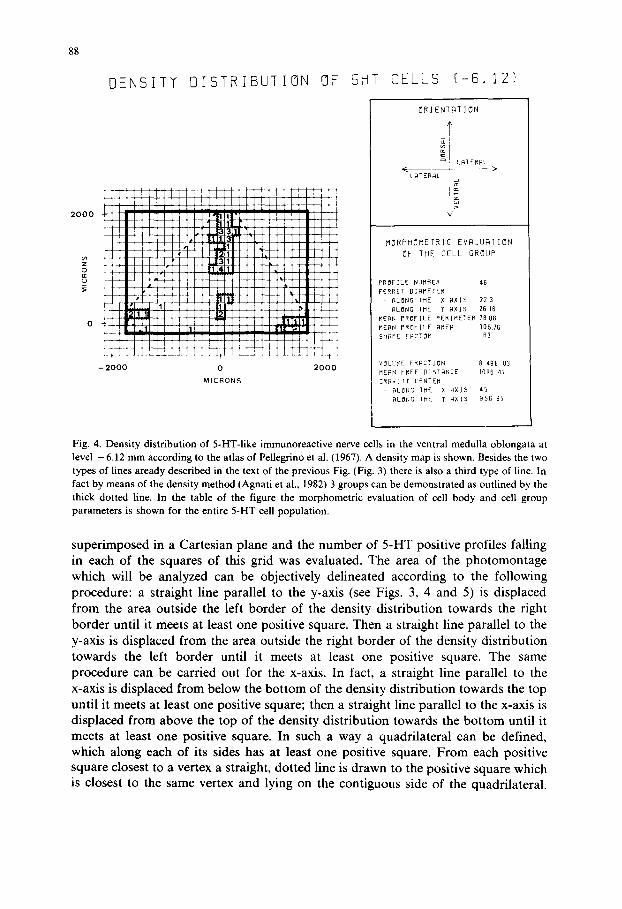
Fig. 4. Density distribution of 5-HT-like immunoreactive nerve cells in the ventral medulla oblongata at level - 6.12 mm according to the atlas of Pellegrino et al. (1967). A density map is shown. Besides the two types of lines aready described in the text of the previous Fig. (Fig. 3) there is also a third type of line. In fact by means of the density method (Agnati et al., 1982) 3 groups can be demonstrated as outlined by the thick dotted line. In the table of the figure the morphometric evaluation of cell body and cell group parameters is shown for the entire 5-HT cell population.
super imposed in a Cartesian plane and the number of 5 -HT posit ive profiles falling in each of the squares of this grid was evaluated. The area of the photomontage which will be analyzed can be objectively delineated according to the fol lowing procedure: a straight line parallel to the y-axis (see Figs. 3, 4 and 5) is displaced from the area outside the left border of the density distribution towards the right border until it meets at least one posit ive square. Then a straight line parallel to the y-axis is displaced from the area outside the right border of the density distribution towards the left border until it meets at least one posit ive square. The same procedure can be carried out for the x-axis. In fact, a straight line parallel to the x-axis is displaced from below the bo t tom of the density distribution towards the top until it meets at least one posit ive square; then a straight line parallel to the x-axis is displaced from above the top of the density distribution towards the b o t t o m until it meets at least one posit ive square. In such a way a quadrilateral can be defined, which along each of its sides has at least one posit ive square. From each posit ive square closest to a vertex a straight, dotted line is drawn to the posit ive square which is closest to the same vertex and lying on the cont iguous side of the quadrilateral.
1 2 0 0
0
DENSITY
- 2 0 0 0
DISTRIBUTION OF 5HT
I 2OO0
M I C R O N S
89
CELLS [ - 3 . 2 7 ]
ORIENT@TION
¢= LATERAL
( LATERAL ~ >
MORPHOMETRIC EVBLUBTION
OF THE CELL GROUP
PROFILE NUMBER 36
FERRET DIAMETER - ALONG THE X AXIS 3 1 . 1 - RLONG TME T AXIS 27.5
MEAN PROFILE PERIMETER 92.95 MERN PROFILE AREA 4 7 3 . 8 9 SHAPE FACTOR . 6 9
VOLUME FRACTION 7.37E-03 MEAN FREE OISTANCE 1003.6 GRAVITY CENTER
- ALONG THE X @XIS 32 - ALONG TME T AXIS 647
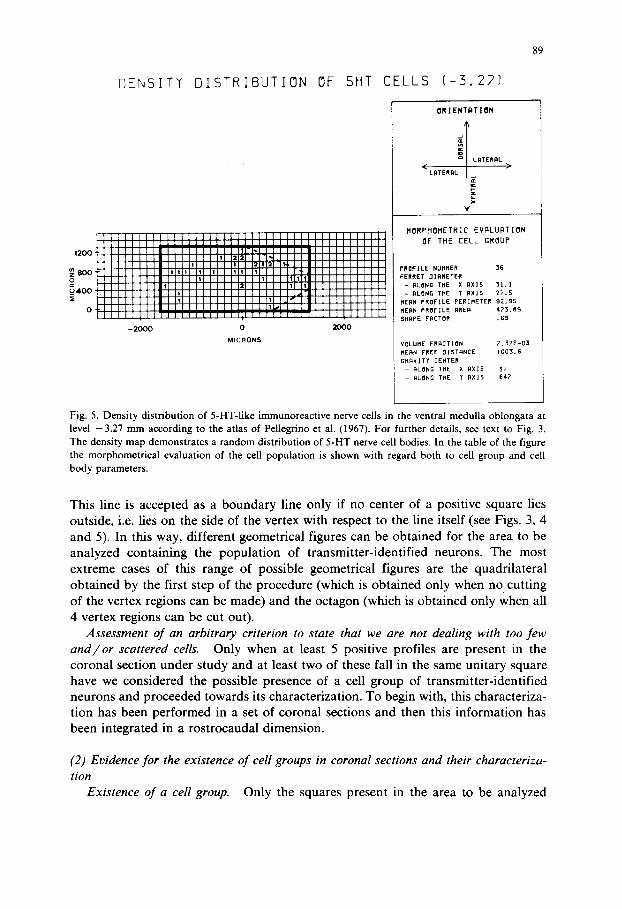
Fig. 5. Density distribution of 5-HT-like immunoreactive nerve cells in the ventral medulla oblongata at level -3.27 mm according to the atlas of Pellegrino et al. (1967). For further details, see text to Fig. 3. The density map demonstrates a random distribution of 5-HT nerve cell bodies. In the table of the figure the morphometrical evaluation of the cell population is shown with regard both to cell group and cell body parameters.
This line is accepted as a b o u n d a r y line only if no center of a posi t ive square lies outs ide, i.e. lies on the side of the vertex with respect to the line i tself (see Figs. 3, 4 and 5). In this way, different geometr ica l figures can be ob ta ined for the area to be ana lyzed conta in ing the popu la t i on of t ransmi t te r - iden t i f ied neurons. The most ex t reme cases of this range of poss ible geometr ica l figures are the quadr i la te ra l ob ta ined by the first s tep of the p rocedure (which is ob ta ined only when no cut t ing of the vertex regions can be made) and the oc tagon (which is ob ta ined only when all 4 vertex regions can be cut out).
Assessment of an arbitrary criterion to state that we are not dealing with too few and~or scattered cells. Only when at least 5 posi t ive profi les are present in the corona l sect ion under s tudy and at least two of these fall in the same un i ta ry square have we cons idered the poss ible presence of a cell group of t ransmi t te r - iden t i f ied neurons and p roceeded towards its character izat ion. To begin with, this character iza- t ion has been pe r fo rmed in a set of coronal sections and then this in fo rmat ion has been in tegra ted in a ros t rocauda l d imension.
(2) Evidence for the existence o f cell groups in coronal sections and their characteriza- tion
Existence of a cell group. Only the squares present in the area to be analyzed
90
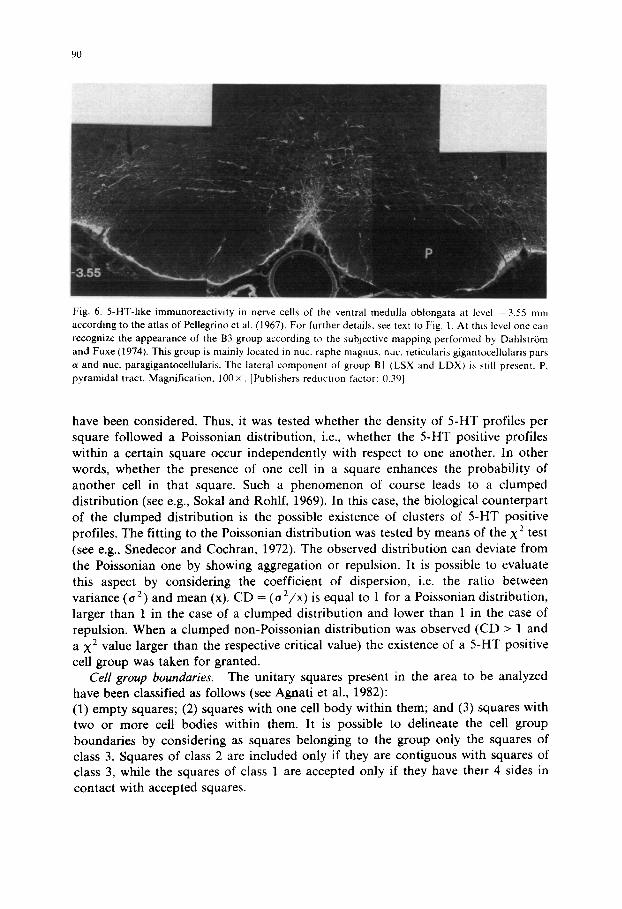
Fig. 6. 5-HT-like immunoreactivity in nerve cells of the ventral medulla oblongata at level 3.55 mm according to the atlas of Pellegrino et al. (1967). For further details, see text to Fig. 1. At this level one call recognize the appearance of the B3 group according to the subjective mapping performed by Dahlstrom and Fuxe (1974). This group is mainly located in nuc. raphe magnus, nuc. reticularis gigantocellularis pars c~ and nuc. paragigantocellularis. The lateral component of group BI (LSX and LDX) is still present. P. pyramidal tract. Magnification. 100 ×. [Publishers reduction factor: 0.39]
have been considered. Thus, it was tested whether the densi ty of 5 -HT profi les per square followed a Poissonian d is t r ibut ion , i.e., whether the 5 -HT posi t ive profi les within a cer tain square occur independen t ly with respect to one another . In other words, whether the presence of one cell in a square enhances the p robab i l i t y of ano ther cell in that square. Such a p h e n o m e n o n of course leads to a c lumped d i s t r ibu t ion (see e.g., Sokal and Rohlf, 1969). In this case, the biological coun te rpa r t of the c lumped d is t r ibu t ion is the poss ible existence of clusters of 5 -HT posi t ive profiles. The f i t t ing to the Poissonian d is t r ibu t ion was tested by means of the X 2 test (see e.g., Snedecor and Cochran, 1972). The observed d is t r ibu t ion can deviate f rom the Poissonian one by showing aggregat ion or repulsion. I t is poss ible to evaluate this aspect by consider ing the coefficient of dispersion, i.e. the ra t io between var iance (o 2) and mean (x). C D = ( o 2 / x ) is equal to 1 for a Poissonian d is t r ibut ion , larger than 1 in the case of a c lumped d is t r ibut ion and lower than 1 in the case of repulsion. When a c lumped non-Poissonian d is t r ibu t ion was observed (CD > 1 and a X 2 value larger than the respective crit ical value) the existence of a 5 -HT posi t ive cell group was taken for granted.
Cell group boundaries. The uni ta ry squares present in the area to be analyzed have been classif ied as follows (see Agna t i et al., 1982): (1) empty squares; (2) squares with one cell body within them; and (3) squares with two or more cell bodies within them. It is poss ible to del ineate the cell group boundar i e s by consider ing as squares be longing to the group only the squares of class 3. Squares of class 2 are inc luded only if they are cont iguous with squares of class 3, while the squares of class 1 are accepted only if they have their 4 sides in
contac t with accepted squares.
91
Cell group description. The cell body parameters have to be distinguished from the cell group parameters. As stated above, a number of cell body parameters has been considered. Furthermore, cell group parameters such as the coordinates of the gravity center (M x, My) and the mean free distance among 5-HT positive cells have been evaluated. In fact, the coordinates of the gravity center (M x, My) are equal to the means of the x- and y-coordinates of all the 5-HT positive profiles present in the group. A measure of the dispersion around the gravity center can be obtained by considering the standard deviation of M x and My, respectively. A parameter can be calculated, the mean free distance, which gives a measurement of the degree of clustering of the 5-HT positive profiles of the group. This parameter can be calculated by means of the x- and y-coordinates of the profiles and the pitagorian expression for distance in a Cartesian plane (Batschelet, 1975; Fuxe et al., 1980; Agnati et al., 1982). A further parameter can be obtained from the mean free distance, namely the homogeneity index which is the ratio between the mean free distance observed in a certain group and the mean free distance in the entire population of 5-HT-positive cells present in the analyzed area. This index gives an indication of the degree of clustering of the cells within the group with respect to the clustering of the cells of the entire population.
(3) Evidence for the existence of 5 -HT positive cell groups and their characterization in a rostrocaudal dimension
Cell group boundaries. The cell group is considered to start and end at the first and last coronal levels, respectively, where the criterion for the existence of a cell group has been fulfilled. Thus, by using the information obtained on coronal sections we can give the cell group boundaries in the rostrocaudal dimension.
Cell group description. The first parameter to be considered is the number of cells present in the group (N). We can use the number of profiles (Pi) counted in each of the n coronal sections (Pi with i = 1, 2 . . . n ) for which the existence of the group has been assessed. Then, by means of the formula (see Konigsmark, 1970):
t Ni = Pi
t + 2 ( ( D / 2 ) 2 - ( K / 2 ) 2
where t is the section thickness, D the mean maximal diameter, K is the minimal size which is identifiable as a fragment of the counted unit (in the present approach equal to 30% of the mean maximal diameter), the actual number of profiles can be obtained. It should be underlined that since we are dealing with ellipsoids and not with spheres this formula is only an approximation. Furthermore, an estimation of the total number of cells present in the group has been calculated by means of the expression:
n
iNi N 1 L
n t
where L is the rostrocaudal length of the cell group. The volume fraction (Vv) , at each rostrocaudal level, has been obtained, for each group, by means of the image

92
analyzer as shown, e.g., in the tables of Figs. 3, 4 and 5 for the entire cell popula t ion . The es t imat ion of the present volume fract ion for the cell group under s tudy has been ca lcula ted by means of the expression:
i(V v )i
Vv = I -100 n
Arbitrary criterion to assess the existence o f a cell group. Thus, for each cell group the respective volume fract ion can be es t imated. This pa r ame te r can be used to have an ind ica t ion of the relevance of that cell group. In fact, the lower the volume fract ion the more scat tered are the t ransmi t te r - ident i f ied cell bodies within the volume of nervous tissue, which has been a t t r ibu ted to the cell group. It may be suggested that below a certain volume fract ion (e.g. 2%) we are not deal ing with a cell group, but ra ther with scat tered cells.
Cell group representation. Final ly , the gravity center locat ion can be given in a th ree-d imens iona l f rame (see Fig. 7). The pa t t e rn of changes of this loca t ion for the y-coord ina tes can be fully apprec ia ted in Fig. 8. In this f igure also a representa t ion of the scat ter a round the gravity center is given by means of an ell ipse which has as axes the s t andard devia t ion of the M~ and My values.
2OOG
15OO
a: E o ~
-370
0 20GO- 6 2~ -2000 -~500 -1000 -,SGO 0 500 1000 1500 L~TATERAL !LATERAL
( ~ m )
Fig. 7. Rostrocaudal representation of the gravity centers of the 5-HT immunoreactive cell groups demonstrated within the ventral medulla obiongata of the rat and their relationship to the original neuroanatomical mapping of these cell groups by Dahlstr6m and Fuxe (1964).
93
Ipml
14OO-
1200.
1000.
800-
uJ
x <
400-
200-
38 30
/ \ 10 34 / \
3511 \ 42 \ 29
i ~ ) /
/ /
\ \ //
7 [ ] 26 , 3 , 0
\ \ \ / \ / N / 6 \ / X 9 / 9 /
,0, '@-- e'
0- i i I i 11
-5.26 -5.12 -4.98 -4.83 -4.69 -4.55 -4.41 -4.27 (ram)
CAUDO.-ROSTRAL LEVELS
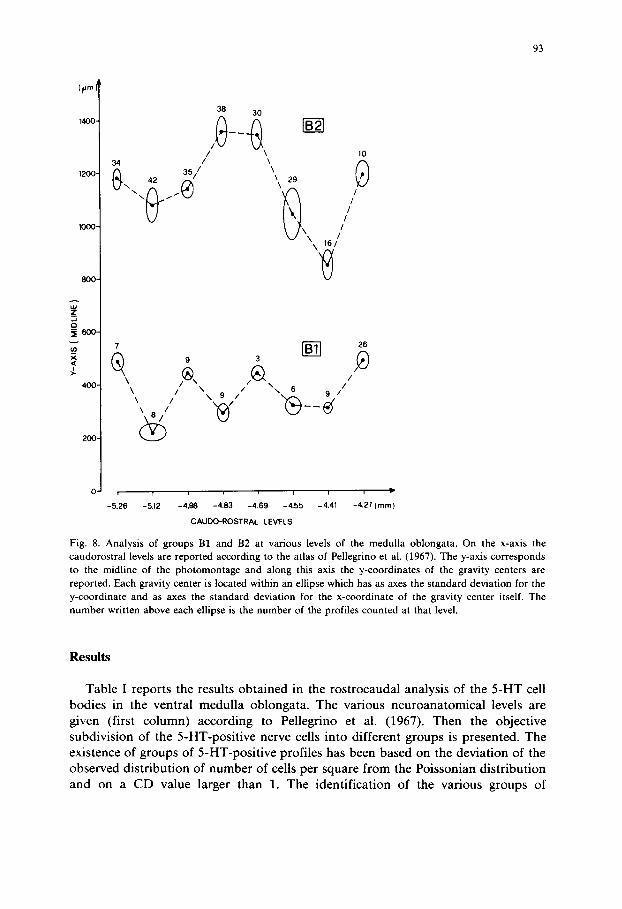
Fig. 8. A n a l y s i s o f g r o u p s B1 and B2 at various levels of the medulla oblongata. On the x-axis the caudorostral levels are reported according to the atlas of Pellegrino et al. (1967). The y-axis c o r r e s p o n d s
to the m i d l i n e o f the photomontage and along this axis the y-coordinates of the gravity centers are reported. Each gravity center is located within an ellipse which has as axes the standard deviation for the y-coordinate and as axes the standard d e v i a t i o n for the x-coordinate of the gravity center itself. The n u m b e r w r i t t e n a b o v e e a c h e l l ipse is the n u m b e r o f the p r o f i l e s counted at that level.
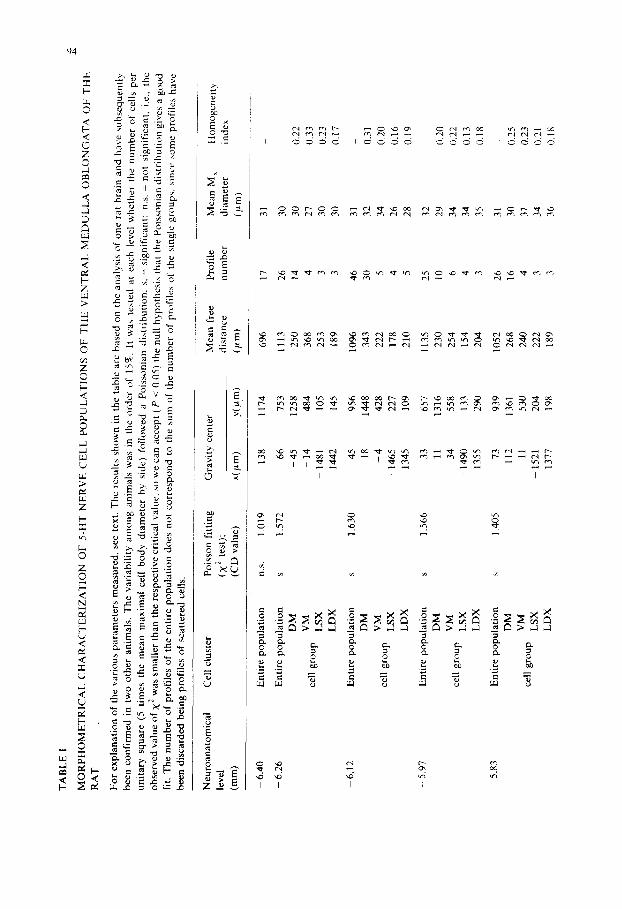
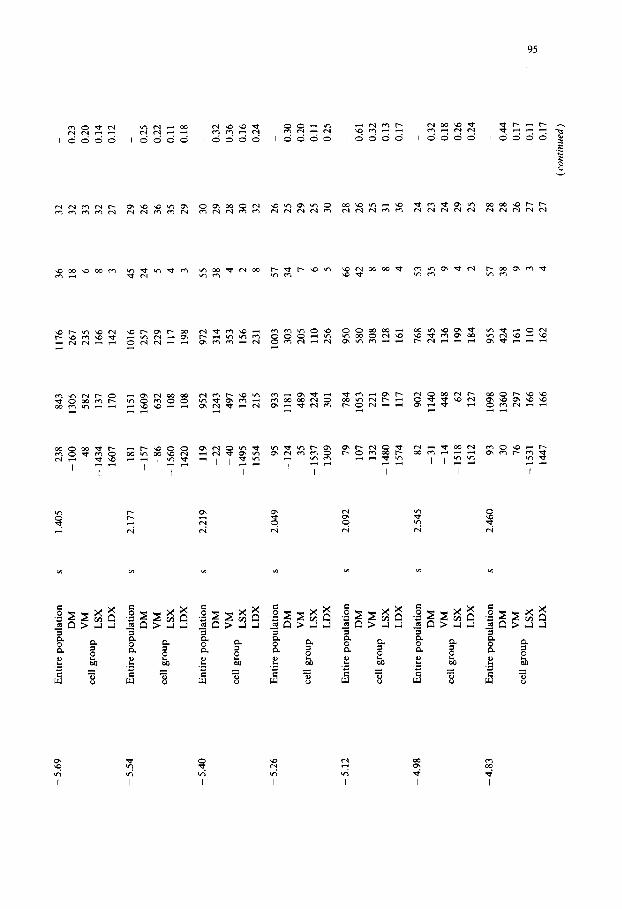
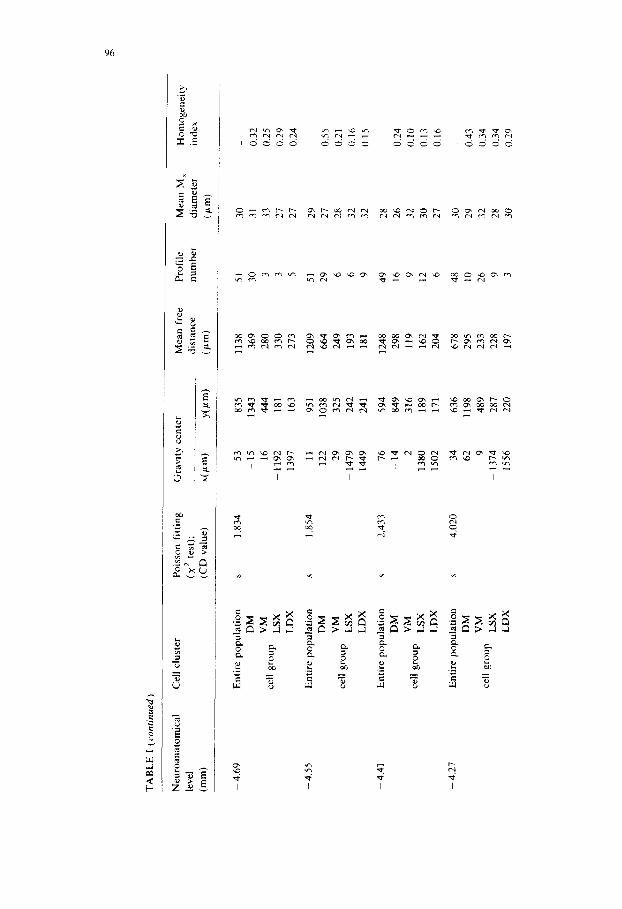
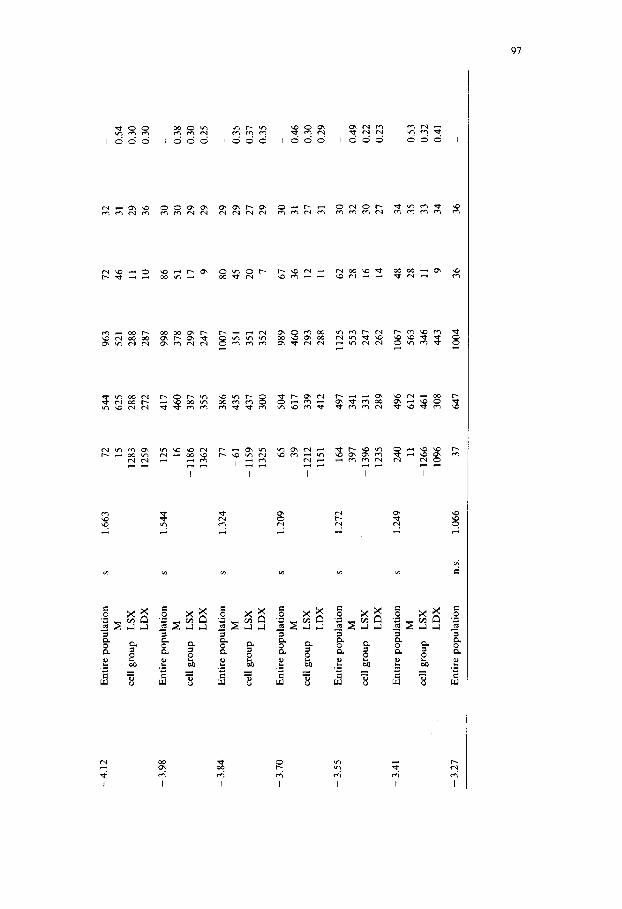
Results
Table I reports the results obtained in the rostrocaudal analysis of the 5-HT cell bodies in the ventral medulla oblongata. The various neuroanatomical levels are given (first column) according to Pellegrino et al. (1967). Then the objective subdivision of the 5-HT-positive nerve cells into different groups is presented. The existence of groups of 5-HT-positive profiles has been based on the deviation of the observed distribution of number of cells per square from the Poissonian distribution and on a CD value larger than 1. The identification of the various groups of
0 ~ . ,~ ~
~ N ~ H I-- ~ ~ ~ . ~ o
~ o ~
= . ~
©
z ~ ~ 0 .... ~
r l~ . -
{
'-6
r= 2
0
Z ~
" " ~ 7 " 5
,._: ,...; ~ - .,-;
I I I I I
95
I I I I I I I I
0 ~'~ 0 I~ 0 ~" 0 0., 0 ~" 0 ~ 0
I I I I I I I
96
r ~
I I I I
I I I I
97
I I I I I I
I I I I I I I
9~
5-HT-positive profiles has been obtained by means of the method of Agnati, Fuxe and colleagues (Agnati et al., 1982).
At each rostrocaudal level the entire population of 5-HT-positive cells as well as (whenever it was possible) the groups in which the entire population could be subdivided have been described according to the following parameters: gravity center coordinates, mean free distance, profile number, mean maximal diameter and also the homogeneity index.
By means of this approach it is possible not only to give a clearcut description of the most caudal and rostral levels at which the existence of a clustering of the 5-HT immunoreactive nerve cells in the medulla oblongata ( - 6 . 2 6 mm and -3 .41 mm, respectively) can be demonstrated, but also to subdivide in an objective way the entire distribution of 5-HT positive profiles into welt-defined groups. Thus, from - 6 . 2 6 mm up to -4 .27 mm four groups, could be identified viz. a dorsomedial (DM) group corresponding mainly to part of nuc. raphe obscurus (group B2 of DahlstrOm and Fuxe, 1964), ventromedial (VM) group, corresponding mainly to part of nuc. raphe pallidus (group B1 of DahlstrOm and Fuxe, 1964), a left lateral (LSX) and a contralateral right lateral (LDX) group corresponding mainly to nuc. interfascicularis hypoglossi (the lateral component of group B1 of DahlstrOm and Fuxe, 1964). From the levels -4 .12 mm up to -3 .41 mm only 3 groups could be identified, since the two medial groups could no longer be delimited. Only one medial (M) group was present due to the appearance of nuc. raphe magnus and adjacent reticular nuclei (corresponding mainly to group B3 of Dahlstr6m and Fuxe, 1964)). The two lateral groups (LSX and LDX) represent the rostral continuation of the lateral components of group B1 (see also Chan-Palay, 1979). It should be noted
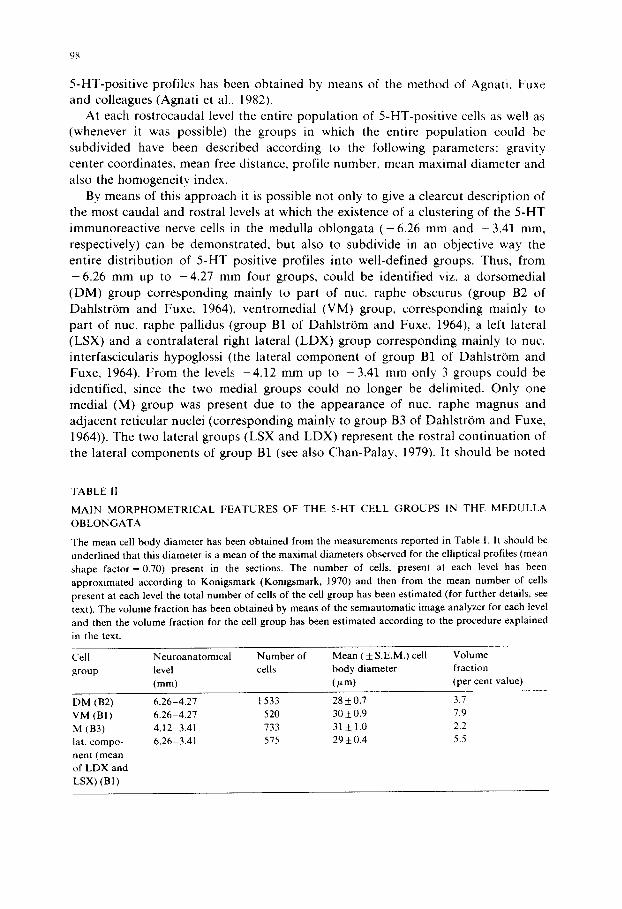
TABLE 11
MAIN MORPHOMETRICAL FEATURES OF THE 5-HT CELL GROUPS IN THE MEDULLA
OBLONGATA
The mean cell body diameter has been obtained from the measurements reported in Table 1. It should be underlined that this diameter is a mean of the maximal diameters observed for the elliptical profiles (mean shape factor = 0.70) present in the sections. The number of cells, present at each level has been approximated according to Konigsmark (Konigsmark, 1970) and then from the mean number of cells present at each level the total number of cells of the cell group has been estimated (for further details, see text). The volume fraction has been obtained by means of the semiautomatic image analyzer for each level and then the volume fraction for the cell group has been estimated according to the procedure explained
in the text.
Cell Neuroanatomical Number of Mean ( _+ S.E.M.) cell Volume group level cells body diameter fraction
(mm) (p,m) (per cent value)
DM (B2) VM (B1) M (B3) lat. compo- nent (mean of LDX and LSX) (B1)
6.26-4.27 1 533 28 _+ 0.7 3.7 6.26-4.27 520 30 _+ 0.9 7.9 4.12-3.41 733 31 ± 1.0 2.2 6.26-3.41 575 29_+0.4 5.5
99
that not at all levels do these lateral components reach the minimal number of profiles (5) and density distribution (2 in the same unitary square) to be considered as a cell group. These components surely become groups according to our criteria at the rostral levels after the disappearance of the B1/B2 groups.
Finally, in the analysis of the DM and VM groups between the levels - 5 .26 mm and -4 .27 mm it has been observed that not only do the gravity centers tend to change rather markedly in the dorsoventral location, but also does the VM group possess cells distributed less preferentially in the ventrodorsal direction than the DM group (see Fig. 8).
Finally, in Table II, the general features, e.g., the number of cells, the mean cell body diameter and the volume fraction, of these cell groups have been given. The volume fraction gives an indication of the relevance of the cell group. It should be noted that the 5-HT positive cell bodies in these groups represent only between 2 and 8% of the volume of nervous tissue.
Discussion
The present paper completes the previous work in this field of Agnati, Fuxe and colleagues (1982) giving a method to integrate rostrocaudally the morphometrical characterization, which can be performed on single coronal sections of cell groups of transmitter-identified neurons. It is of substantial interest that such a longitudinal analysis confirms the original classification based on subjective evaluations (Dahlstr6m and Fuxe, 1964). Thus, the VM group coincides with the medial component of the B1 group, the DM group coincides with the B2 group. At the most rostral level (from - 4 . 1 2 mm) the M group appears, while the DM group has disappeared. The M group is due to the appearance of the B3 group.
At the levels - 6.40 mm and - 3.27 mm the 5-HT cell population switches into a random distribution leading to a disruption of the 5-HT subgroups. To test the randomness we have evaluated the best fitting to the Poissonian distribution. It should be mentioned that other tests of randomness have been suggested to study the nerve cell distribution (see Aherne and Diggle, 1979). However, these tests have always been applied to non-transmitter-identified neurons, and thus to a large number of cells distributed in a large area. The large area is necessary, since part of the sampled region has to be discarded in selecting the area to be analyzed to avoid the 'edge effect'. Obviously, since we are dealing with transmitter-identified cells, which can be few a n d / o r sometimes distributed in a thin strip (see e.g. B1 and B2 groups around the midline) it becomes rather difficult to subsample the area to be analyzed using these methods.
The present analysis has been carried out by examining in a random fashion the full sequence of coded slides, so that no interference with the well-known and accepted classification can be present. It is interesting to note (see Table I) that the homogeneity index is lower for the VM group than for the DM group in 12 out of 15 levels. The homogeneity index for the lateral groups is much more variable in view of the small number of 5-HT positive profiles present. The volume fraction is rather

100
low but it shou ld be cons ide r ed that we on ly measu re the 5 - H T - p o s i t i v e cell bodies .
Thus , the p rocesses (which m a y even r ep resen t the m a j o r par t of the neuron) as well
as the smal le r p rof i les a re neglected. F u r t h e r m o r e , o t h e r types of neu rons and glial cells m a k e up the v o l u m e of the cell g roup .
In conc lus ion , the p resen t a p p r o a c h p rov ides a s imple m e t h o d to give a
r o s t r o c a u d a l i n t eg ra t ion o f t r ansmi t t e r - i den t i f i ed cell g roups m o r p h o m e t r i c a l l y iden-
t i f ied by analys is of s ingle co rona l sections.
Acknowledgements
This w o r k has been s u p p o r t e d by a g ran t ( M H 25504) f r o m the N I H , Bethesda .
U .S .A. , by G r a n t s (04X-715; 04X-3887) f r o m the Swed i sh Med ica l Resea rch C o u n -
cil, f r o m the K n u t & Al i ce W a l l e n b e r g ' s F o u n d a t i o n and by a C N R I n t e r n a t i o n a l
G r a n t . L .F . A g n a t i was a r ec ip ien t of a v is i t ing scient is t fe l lowship f rom the Swed i sh
M e d i c a l R e s e a r c h C o u n c i l (14V-5732-02) and f rom the K a r o l i n s k a Ins t i tu te t . W e
t h a n k Professor I. Sca rdov i and Professor P. M o n a r i for thei r useful d i scuss ions and
Miss E. Sandqv i s t , Mrs. Lena Sunnfis and Miss G. C a s t e l l a n o for exce l len t secre-
ta r ia l ass is tance.
References
Agnati, L.F., Fuxe, K., Zini, I. Benfenati, F., Hokfelt, T. and de Mey, J. (1982) Principles for the morphological characterization of transmitter-identified nerve cell groups, J. Neurosci. Meth., 6: 157-167.
Agnati, L.F., Fuxe, K., Benfenati, F., Calza, L., Battistini, N. and Ogren, S.-O. (1983) Receptor-receptor interactions: possible new mechanisms for the action of some antidepressant drugs. In E. Usdin, M. Goldstein, A.J. Friedhoff and A. Georgotas (Eds.), Frontiers in Neuropsychiatric Research, MacMil- lan, London, pp. 301-318.
Aherne, W.A. and Diggle, P.J. (1978) The estimation of neuronal population density by a robust distance method, J. Microsc., 114: 285-293.
Batschelet, E. (1975) Introduction to Mathematics for Life Scientists, Springer, Berlin. Chan-Palay, V. (1979) Combined immunocytochemistry and autoradiography after in vivo injections of
monoclonal antibody to substance P and 3H-serotonin: coexistence of two putative transmitters in single raphe cells and fiber plexuses, Anat. Embryol., 156: 241-254.
Conover, J.W. (1971) Nonparametric Statistics, Wiley, New York. Coons, A.H. (1958) Fluorescent antibody methods. In J.F. Danielli (Ed.), General Cytochemical Methods.
Academic Press, New York, pp. 399-442. Dahlstr6m, A. and Fuxe, K. (1964) Evidence for the existence of monoamine containing neurons in the
central nervous system. 1. Demonstration of monoamines in cell bodies of brain stem neurons, Acta physiol, scand., 62 Suppl. 232: 1-55.
Fuxe, K. (1965) Evidence for the existence of monoamine containing neurons in the central nervous system. IV. The distribution of monoamine terminals in the central nervous system, Acta physiol. scand., 64(247): 39-85.
Fuxe, K., Agnati, L.F., Andersson, K., Locatelli, V., Eneroth, P., HOkfelt, T., Mutt, V., McDonald, T.. El Etreby, M.F., Zini, I. and Calza, L. (1980) Concepts in neuroendocrinology with emphasis on neuropeptide-monoamine interactions in neuroendocrine regulation. In F. Brambilla, G. Racagni and D. de Wied (Eds.), Progress in Psychoneuroendocrinology, Elsevier/North-Holland Biomedical Press, Amsterdam, pp. 47-61.
101
Fuxe, K., Agnati, L.F., H6kfelt, T., Calza, L., Benfenati, F. and Goldstein, M. (1982) Immunocytoche- mistry of central neurons. In: WHO's Scientific meeting of Neuroplasticity and Repair in the Central Nervous System, Geneva 28 June-2 July, 1982, Raven Press, New York, in press.
Fuxe, K., Ogren, S.-O., Agnati, L.F., Benfenati, F., Cavicchioli, L., Fredholm, B., Andersson, K., Farabegoli, C. and Eneroth, P. (1982) Regional variations in 5-HT receptor populations and in 3H-imipramine binding sites in their responses to chronic antidepressant treatment. In E. Usdin, M. Goldstein, A.J. Friedhoff and A. Georgotas (Eds.), Frontiers in Neuropsychiatric Research, MacMil- lan, London, pp. 33-54.
Hartman, B.K., Zide, D. and Udenfriend, S. (1972) The use of dopamine fl-hydroxylase as a marker for the central noradrenergic nervous system in rat brain, Proc. Nat. Acad. Sci. U.S.A., 69: 2722-2726.
Haug, H. (1979) Nervous tissue. In E.R. Weibel (Ed.), Stereological Methods, Vol. I, Academic Press, London, pp. 311-322.
HOkfelt, T., Ljungdahl, J.M. Steinbusch, H., Verhofstad, A., Nilsson, G., Brodin, E., Pernow, B. and Goldstein, M. (1978) lmmunohistochemical evidence of substance P-like immunoreactivity in some 5-hydroxytryptamine-containing neurons in the rat central nervous system, Neuroscience, 3: 517-538.
Konigsmark, B.W. (1970) Methods for the counting of neurons. In W.J.H. Nauta and S.O.E. Ebbeson (Eds.), Contemporary Research Methods in Neuroanatomy, Springer, New York.
Nairn, R.C. (1969) Fluorescence Protein Tracing, E.S. Livingstone, Edinburgh, pp. 503. Pease, D.C. (1962) Buffered formaldehyde as a killing agent and primary fixative for electron microscopy,
Anat. Res., 142: 342. Pellegrino, L.J., Pellegrino, A.S. and Cushmann, A.H. (1967) A Stereotaxic Atlas of the Rat Brain,
Plenum, Press, New York. Snedecor, G.W. and Cochran, W.G. (1972) Statistical Methods, The Iowa State University Press, Ames,
Iowa. Sokal, R.R. and Rohlf, F.J. (1969) Biometry, Freeman, San Francisco. Steinbusch, H.W.M., Verhofstad, A.A.J. and Joosten, H.W.J. (1978)Localization of serotonin in the
central nervous system by immunohistochemistry: description of a specified and sensitive technique and some application, Neuroscience, 3: 811-819.
Steinbusch, H.W.M. (1981) Distribution of serotonin-immunoreactivity in the central nervous system of the rat: cell bodies and terminals, Neuroscience, 6: 557-618.
Weibel, E.R. (1979) Stereological Methods, Vol. 1, Academic Press, London.