a meta-analysis of feuerstein's instrumental enrichment - Open ...
169
A META-ANALYSIS OF FEUERSTEIN'S INSTRUMENTAL ENRICHMENT BY JANET LILLIAN SHIELL B.Ed. (Secondary), The University of British Columbia, 1976 M.Ed. (Counselling Psychology), The University of British Columbia, 1984 A THESIS SUBMITTED IN PARTIAL FULFILMENT OF THE REQUIREMEN15FOR THE DEGREE OF DOCTOR OF PHILOSOPHY In THE FACULTY OF GRADUATE STUDIES Centre for the Study of Curriculum and Instruction We accept this thesis as conforming to the required standard THE UNIVERSITY OF BRITISH COLUMBIA April 2002 © Janet Lillian Shiell, 2002
-
Upload
khangminh22 -
Category
Documents
-
view
0 -
download
0
Transcript of a meta-analysis of feuerstein's instrumental enrichment - Open ...
A M E T A - A N A L Y S I S OF F E U E R S T E I N ' S I N S T R U M E N T A L E N R I C H M E N T
B Y
J A N E T L I L L I A N S H I E L L
B .Ed . (Secondary), The University of British Columbia, 1976 M . E d . (Counselling Psychology), The University of British Columbia, 1984
A T H E S I S S U B M I T T E D I N P A R T I A L F U L F I L M E N T O F T H E REQUIREMEN15FOR T H E D E G R E E O F
D O C T O R OF P H I L O S O P H Y
In
T H E F A C U L T Y OF G R A D U A T E S T U D I E S
Centre for the Study of Curriculum and Instruction
We accept this thesis as conforming to the required standard
T H E U N I V E R S I T Y OF B R I T I S H C O L U M B I A
Apr i l 2002
© Janet Li l l i an Shiell, 2002

In presenting this thesis in partial fulfilment of the requirements for an advanced
degree at the University of British Columbia, I agree that the Library shall make it
freely available for reference and study. I further agree that permission for extensive
copying of this thesis for scholarly purposes may be granted by the head of my
department or by his or her representatives. It is understood that copying or
publication of this thesis for financial gain shall not be allowed without my written
permission.
The University of Vancouver, Canada
Department of
DE-6 (2/88)
Abstract
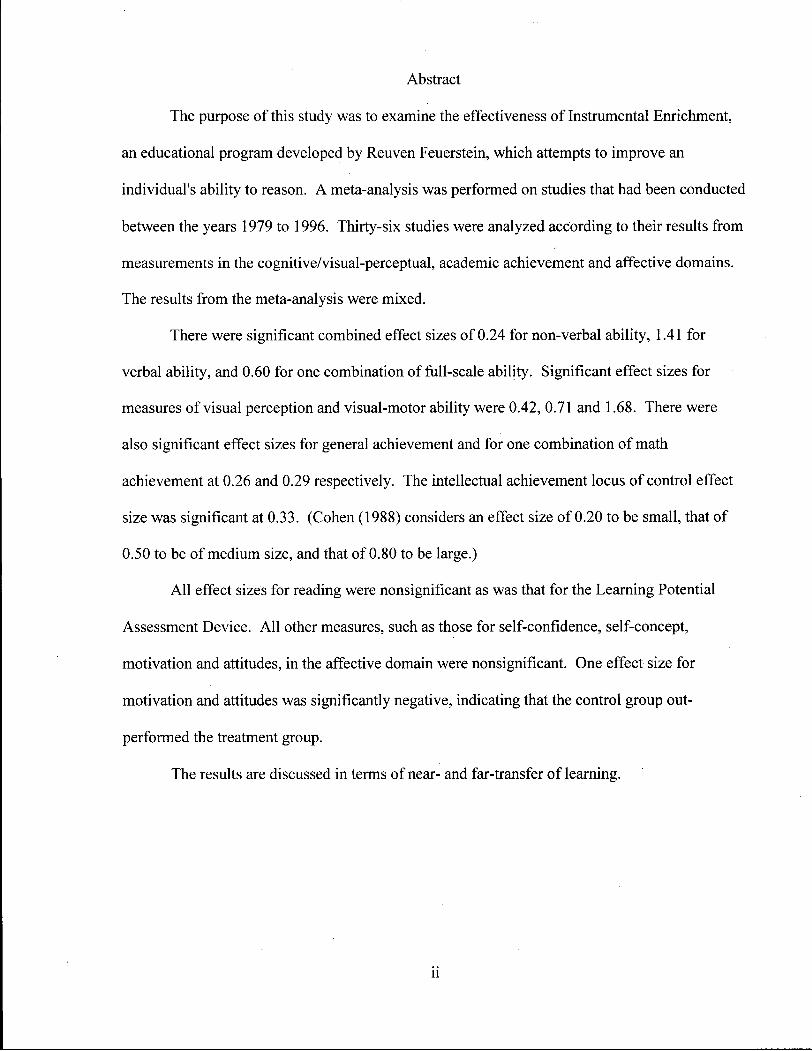
The purpose of this study was to examine the effectiveness of Instrumental Enrichment,
an educational program developed by Reuven Feuerstein, which attempts to improve an
individual's ability to reason. A meta-analysis was performed on studies that had been conducted
between the years 1979 to 1996. Thirty-six studies were analyzed according to their results from
measurements in the cognitive/visual-perceptual, academic achievement and affective domains.
The results from the meta-analysis were mixed.
There were significant combined effect sizes of 0.24 for non-verbal ability, 1.41 for
verbal ability, and 0.60 for one combination of full-scale ability. Significant effect sizes for
measures of visual perception and visual-motor ability were 0.42, 0.71 and 1.68. There were
also significant effect sizes for general achievement and for one combination of math
achievement at 0.26 and 0.29 respectively. The intellectual achievement locus of control effect
size was significant at 0.33. (Cohen (1988) considers an effect size of 0.20 to be small, that of
0.50 to be of medium size, and that of 0.80 to be large.)
A l l effect sizes for reading were nonsignificant as was that for the Learning Potential
Assessment Device. A l l other measures, such as those for self-confidence, self-concept,
motivation and attitudes, in the affective domain were nonsignificant. One effect size for
motivation and attitudes was significantly negative, indicating that the control group out
performed the treatment group.
The results are discussed in terms of near- and far-transfer of learning.
i i

Table of Contents
Abstract Table of Contents List of Tables Acknowledgements
Chapter One: Cognitive Orientations to Curriculum Theoretical Background
The Beginnings: Piaget's Stages and Vygotsky's Zone of Proximal Development Theories of Critical Thinking
Instrumental Enrichment Structural Cognitive Modifiability Mediated Learning Experience ( M L E ) 1
Chapter Two: Literature Review of Feuerstein's Instrumental Enrichment 1 Goals 1 Curriculum 1 Literature Review 2
Individual Studies 2 Groups of Studies
Intelligence Summary of Evaluations Importance of the Study
Chapter Three: Literature Review of Meta-Analysis Definitions Usefulness • Critique
Theory Development Type II Errors Validity Reliability Homogeneity
Sources of Variation and Generalizability Bias
The File-Drawer Problem Quality Multiple Publications Sample Size Studies With More Than One Statistic Unbiased Estimate of Effect Size
Procedure Literature Search Inclusion-exclusion criteria Data Collection Statistical Analysis
Choosing Estimates of Effect
i i i

Calculations for the Unbiased Estimator of Effect Size for Each Study 55 Interpretation of Effect Sizes 56
Chapter Four: Methodology 58 Methodology • 58
Criteria Used to Include or Exclude Specific Studies 58 Quality of Individual Studies 61 Statistical Methodology 63 The File-Drawer Problem 64 The Hawthorne Effect 64
Chapter Five: Results •• 66 Overall Effect Sizes 66 Near and Far Transfer 67
Chapter Six: Discussion 71 Near Transfer 73 Mid-Transfer 74 Far Transfer 75 Subgoals of Instrumental Enrichment .76
Chapter Seven: Implications for Practice and Research 78 Implications for Practice 78
Affective Domain Instruction ~. 78 Counselling 79 Academic Instruction and IE 80
Implications for Research 81 The L P A D 81 Teacher Effectiveness and Bridging 82 Further Analysis of Data in this Meta-Analysis 83 Brain Research 83
Limitations of this Study 84
References 86
Appendix A : Summary of Studies Used, Measures and Effect Sizes 96 Appendix B : Summary of Studies Not Used 142 Appendix C : Results from Random Effects Analysis 146 Appendix D : Significant Results Information 152 Appendix E : Nonsignificant Results Information , 156 Appendix F: Effect Sizes from F-Tests and Reported Effect Sizes 161
iv

List of Tables
1. Summary of Included and Excluded Studies 61 2. Summary of Transfer Results 70
v
Acknowledgements
I would like to express my deep appreciation to the members of my doctoral committee
for their guidance and support. Thanks to Dr. Hi l l e l Goelman for shepherding the dissertation
process through university administration, and for his encouragement and humour when I
despaired. Thanks to Dr. Michael Schulzer for his patience while explaining many statistical
methods and formulae. The meta-analysis was a complicated procedure and Michael 's
assistance was invaluable. Thanks also to Dr. Mar i lyn Samuels for her insightful comments
regarding the Instrumental Enrichment program and research related to it.
yi
Chapter One
Cognitive Orientations To Curriculum
The purpose of this study is to examine the effectiveness of an educational program,
developed by Reuven Feuerstein and colleagues, which attempts to improve an individual's
ability to reason. Trained as a clinical psychologist, Feuerstein became involved in the
psychological assessment of Jewish children who were being resettled in Israel after World
War II. Many had experienced poverty and deprivation, and many were Holocaust survivors.
The majority of these children also scored on standardized intelligence tests in the retarded
range. Because of these circumstances, Feuerstein began to reconsider traditional notions of
intelligence and its measurement. He also began to explore the development of an educational
intervention to enhance cognitive functioning during adolescence. That intervention, the focus
of this study, is known as "Instrumental Enrichment" (Feuerstein, Kle in , and Tannenbaum,
1991; Feuerstein, Rand, M . B . Hoffman, & Mil ler , 1980; Yates, 1987).
Although there are many programs designed to encourage or improve cognitive
development, I have chosen Feuerstein's Instrumental Enrichment (FIE or IE) for several
reasons. In the early 1990's, I was trained to teach the first half of the Instrumental Enrichment
program and to administer its related assessment tool, the Learning Potential Assessment
Device. I was very impressed by the methods used and the enthusiastic acceptance of them by
participants in the learning groups. I reviewed the literature to see what had been written
about the effectiveness of FIE and found a mixture of results. Most authors, at least on an
intuitive level, believed the program was, or could be, effective, but there seemed to be more
success in some areas than in others. I did a small meta-analysis in 1993 to explore FIE's
overall effectiveness and found that it appeared to be most successful when measured with
assessment instruments closest to the material used in the program, and it did not seem to be
1

effective at all in the affective domain. There were methodological difficulties in the
execution of my analysis, however, and I wanted to do a more thorough and carefully designed
meta-analysis with as many studies, published and unpublished, as I could obtain. This w i l l be
an exploratory, descriptive study, not meant to prove or disprove the effectiveness of FIE or
the theory behind it. I had no a priori hypotheses at the beginning of the study; the research
questions arose from the literature review.
Before discussing Feuerstein's theory and methods in detail later in this chapter and in
Chapter Two, I w i l l first describe the contributions of other theorists toward our understanding
of intelligence and the process of learning. This is so we can be aware of the background
within which Feuerstein formed his ideas. The first half of the chapter w i l l present theories
under the sub-headings: The Beginnings and Theories of Critical Thinking. The second half of
the chapter w i l l present an introduction to FIE and a presentation of Feuerstein's theories of
Structural Cognitive Modifiability and the Mediated Learning Experience ( M L E ) .
Theoretical Background
The Beginnings: Piaget's Stages and Vygotsky's Zone of Proximal Development
Jean Piaget.
Jean Piaget, whose model encompasses mainly the first 15 years of life, wrote about
cognition in relation to the developmental process (Piaget, 1952, 1971,1985). He argued that
the major function of intelligence is to help children adapt to the environment. Children
construct their own logical structures through interaction with the environment and move from
one stage to another through the process of equilibration. They experience disequilibrium
when they confront aspects of the environment that cannot be resolved using their currently
available schemes. The process of equilibration, that is, finding a balance between the
assimilation of new information to cognitive schemes (organized patterns of thinking) and
2

accommodation by the learner to that information, was a means of resolving cognitive conflict.
Cognitive conflict promoted the growth of personal logic systems by confrontation between
new and stored knowledge (Samuels, Kle in , and Haywood, 1994).
Feuerstein was influenced by Piaget's position that the organism, or child, influenced
more complex learning than that explained in the Skinnerian, behaviourist view of direct
stimulus-response mechanisms. The Skinnerian model could be illustrated as S->R while
Piaget's model was S - » 0 - » R . Feuerstein modified Piaget's model to include a human
mediator in his theory of the Mediated Learning Experience ( M L E ) (Kaniel and Feuerstein,
1989). The theory w i l l be discussed in more detail later in this chapter.
Lev Vygotsky.
Lev Vygotsky was a Russian psychologist who believed that all psychological
processes are originally encountered within a social context. Children first experience
cognitive activities such as problem-solving in the presence of significant others. They
gradually begin to share in the cognitive activity and to internalize such functions until,
eventually, cognitive work can be performed independently (Haywood, Brown, and
Wingenfeld, 1990; Samuels, et al., 1994). Within Vygotsky's theory of cognitive development
is the concept of a "zone of proximal development," originally explained in 1934, which is the
difference between the actual and the potential level of a child's cognitive functioning
(Vygotsky, 1962). Vygotsky's definition was "the distance between the actual developmental
level as determined by independent problem-solving and the level of potential development as
determined through problem-solving under adult guidance or in collaboration with more
capable peers" (Vygotsky, 1978, p.86).
The notion is that adults can help a child perform tasks and solve problems
meaningfully by asking questions, directing attention, providing cues, monitoring
3
performance, and in general, serving as an executive function for the duration of the task.
Over time, children come to perform the tasks by themselves. In this process they internalize
the roles taken by their adult helpers and develop the higher order functions that were
performed by the adults (Das and Conway, 1992; Secada, 1991).
Vygotsky saw the zone of proximal development as a way of understanding the kinds
of psychological processes that children would be capable of in the next phase of their
development and used the analysis of the zone to identify the type of instruction needed to
realize this potential (Samuels et al., 1994).
Although not directly influenced by Vygotsky, Feuerstein was inspired by a colleage of
Piaget's, Andre (Feuerstein and Feuerstein, 1991). In a manner similar to Vygotsky, Rey
(1934, 1962) encouraged test administrators to interact with subjects in order to gain more
information about their processes of learning. This w i l l be discussed further in the
Instrumental Enrichment section of this chapter.
Theories of Critical Thinking
This section is included because Feuerstein's Instrumental Enrichment is taught
according to one of the critical thinking approaches, and, in Chapters Six and Seven, results of
this meta-analysis are related to critical thinking approaches.
The beginnings of contemporary views of critical thinking are evident in the work of a
number of philosophers of education. John Dewey used the term "reflective thinking" to refer
to "the kind of thinking that consists in turning a subject over in the mind and giving it serious
consecutive consideration (Dewey, 1933, p. 3). He stressed the idea of a problem-solving
focus to learning. He also emphasized the necessity for education to go beyond the teaching of
the subject matter alone and to address the teaching of thinking.
4

Robert Ennis became highly influential in terms of promoting interest in, and debate
about, critical thinking when he described his conception of critical thinking in a paper in
1962. His somewhat narrow definition, "the correct assessing of statements" in that paper has
been replaced by a broader one: "reasonable, reflective thinking that is focused on deciding
what to believe or do" (Ennis, 1985a, p. 46). In this conception, critical thinking is composed
of both skills (abilities) and dispositions (attitudes). Current usage of the term "critical
thinking" generally reflects Ennis' broad definition.
Another theorist, John McPeck, refers to critical thinking as the appropriate use of
reflective skepticism within the problem area under consideration (McPeck, 1981). McPeck
believes that the criteria that determine the appropriateness of thinking arise entirely from
within particular disciplines or problem areas (Bailin, 1994; Kennedy Fisher, & Ennis, 1991).
Within the field, there is debate about whether critical thinking is subject specific or
generalizable across subject areas (Bailin, 1994; Kennedy et al., 1991). McPeck (1981, 1990)
argues against the existence of general skills because thinking is always about a subject, so
general thinking ability detached from a subject cannot conceptually exist. In his view, critical
thinking would be taught specific to a particular subject. He is a proponent of the "immersion"
instructional approach in which students become deeply immersed in the subject, and are
encouraged to think critically about it, but in which general critical thinking principles are not
made explicit.
Other authors, such as Swartz (1987), who favour subject-specific instruction follow an
"infusion" approach in which, not only is there thought-provoking instruction of the subject,
but general principles of critical thinking dispositions and abilities are also made explicit
(Ennis, 1992).
5

On the other hand, there are those that maintain that there are general principles of
critical thinking and that these should be taught separately from the standard subject areas.
Feuerstein's method follows this approach (Feuerstein et al., 1980).
A fourth view of critical thinking is that it is a combination of using a set of general
dispositions and abilities along with specific experience and knowledge within a particular
area of interest. Ennis (1985b) and Sternberg (1987) have pointed out that each approach has
its advantages and that a mixed model of providing a separate critical thinking course along
with the insertion of critical thinking approaches into specific subjects should reinforce all
skills taught (Kennedy et al., 1991).
Part of the generalizability debate concerns how, or if, critical thinking skills transfer
after they have been taught. Transfer refers to the carry-over and use of skills and knowledge
to domains other than the ones in which they were taught. This can mean transfer across
academic disciplines or from the academic to the nonacademic world of the student. McPeck
(1992) believes thinking is always about a subject; he agrees that some general skills exist, but
that their usefulness is limited. The most useful skills, he claims, tend to be limited to narrow
domains. For example, some skills, such as counting, may seem quite narrow, but their
domains of application are quite large.
Blatz (1992) accepts that people can be taught to think in general ways, but this does
not guarantee that they w i l l have learned to think in ways that are constrained by different
community paradigms and information contexts. Several other authors state that whether or
not critical thinking is generalizable depends on what critical thinking is. Although Ennis'
definition is generally used, there is, nevertheless, extensive debate on the definition of critical
thinking (See, for example, Johnson, 1992; Norris, 1992; Siegel, 1992).
6

Closely related to the discussions among philosophers over the transfer of critical
thinking are those among educators and psychologists over the transfer of learning. Salomon
and Perkins (1989) and Perkins and Salomon (1987) synthesized findings concerned with
transfer and speculate on two mechanisms, the "low road" and the "high road" to transfer.
L o w road transfer happens when stimulus conditions in the transfer context are similar enough
to those in a prior context of learning to trigger well-developed semiautomatic responses. This
is a relatively reflexive process and occurs most often in near transfer. High road transfer
depends on thoughtful abstraction from the context of learning or application to a new one and
a deliberate search for connections. It occurs often in far transfer situations. The two roads
can work together in that some connections can occur reflexively while others are sought out
(Perkins & Salomon, 1994).
Perkins and Salomon (1987) also discuss two broad instructional strategies to foster
transfer: hugging and bridging. Hugging is used for reflexive transfer. It recommends
approximations to the performance desired. For example, a teacher might give trial exams to
students rather than just talking about exam technique. The learning experience, therefore,
"hugs" the target performance, maximizing the later likelihood of automatic low road transfer.
Bridging is used for high road transfer. The instruction encourages the formulation of
abstractions, searches for possible connections, thoughtfulness and metacognition. For
example, a teacher might ask students to create an exam strategy based on their past
experience. The instruction would emphasize deliberate abstract analysis and planning
(Perkins & Salomon, 1994).
Instrumental Enrichment
Feuerstein's Instrumental Enrichment (FIE) belongs within the model of critical
thinking which holds that there are general principles of critical thinking that can be taught
7
separately from the standard subject areas. I w i l l begin with a brief description of the program,
the history of its development, and a description of its main theoretical components,
"Structural Cognitive Modifiability" and "Mediated Learning Experience." FIE's purpose,
goals and curriculum w i l l be discussed in Chapter Two.
The Instrumental Enrichment program is a program consisting of 13 to 15 "instruments"
made up of paper-and pencil exercises to be completed in 1-hour lessons three to five times a
week for two to three years. Each instrument focuses on a specific "cognitive deficiency" and
contains exercises that are meant to provide experience in overcoming it. F IE uses abstract,
content-free, organizational, spatial, temporal, and perceptual exercises which are meant to
involve a wide range of mental operations and thought processes. The exercises are not intended
to substitute for, but to supplement, the traditional content materials of the regular classroom.
According to Feuerstein et al. (1980), the aim of the FIE program is to change the overall
cognitive structure of "retarded" performers by transforming their passive and dependent cognitive
style into that characteristic of autonomous and independent thinkers. Feuerstein and his
colleagues believe that low cognitive performance need not be regarded as a stable characteristic
of an individual and that systematic intervention, directed at the correction of deficient functions,
w i l l improve the condition by producing a change in the cognitive structure of the individual.
Feuerstein believes that, except in the most severe instances of genetic and organic impairment,
the human organism is open to modifiability at all ages and stages of development.
M u c h of the original evidence in support of Feuerstein's theory of modifiability derives
from the results of his work with Youth Al iyah , an institution dedicated to the task of the
ingathering and integration of Jewish children into Israel. Initially, during the pre-war period of
the 1930's, Youth Al iyah was involved in rescuing children threatened by the Naz i regimes in
Germany and Austria. During and after the war, the rescue operation spread throughout Western
8

and Eastern Europe in an effort to reach orphaned children who had survived the Holocaust.
Feuerstein began to work with Youth Al iyah and between 1950 and 1954 he and his colleagues
examined large numbers of adolescents in transit camps in Morocco and southern France. The
young people came from many cultures, some non-industrialized, in Asia , Africa and Europe.
They had to be received, settled, classified and schooled for citizenship in a new country with a
unique and thoroughly modern technological culture. Tests of many kinds were given as a basis
for planning their education after immigration. But existing tests proved inadequate to the task
because they reflected what the children had failed to learn, not what they could learn, and their
achievement status, not their learning potential (Feuerstein, Feuerstein, & Gross, 1997; Feuerstein
etal., 1980).
Feuerstein was inspired by Piaget and his associate at the University of Geneva, the
clinical psychologist, Andre Rey (Feuerstein & Feuerstein, 1991). In a manner similar to
Vygotsky, Rey (1934, 1962) believed that process-oriented tests would reveal information about
the processes of learning and would help assess changes behind adaptive responses. He also
encouraged examiners and subjects to interact in order to help discover any processes responsible
for low test performance (Haywood, 1977; Haywood et al. 1990). Influenced by these ideas,
Feuerstein began work leading to a radical shift from a static to a dynamic approach in which
testing situations were changed into learning experiences for the children. The Learning Potential
Assessment Device ( L P A D ) and his instructional approach, cognitive modification with
Instrumental Enrichment, developed from this work.
Structural Cognitive Modifiability
The FIE program arises from Feuerstein's theory o f "Structural Cognitive Modifiabil i ty"
(Feuerstein, Mi l le r , M . B . Hoffman, Rand, Mintzker, & Jensen, 1981; Feuerstein, Rand, Malka
Hoffman, Mendel Hoffman and Mil ler , 1979); it describes the capacity of human beings to change
9

or modify the structure of their cognitive functioning in order to adapt to the changing demands of
life situations. The theory contends that it is useful to view intelligence as a set o f cognitive
functions, or modes of thought.
Feuerstein believes it is possible to teach basic cognitive processes after the time of their
normal acquisition, and an essential feature of this approach is that it is directed not merely at the
remediation of specific behaviours and skills but at changes of a "structural" nature that alter the
course and direction of cognitive development. Structural changes refer not to isolated events but
to an individual's manner of interacting with, that is, acting on and responding to, sources of
information. Thus, a structural change, once set in motion, w i l l determine the future course of an
individual's development.
Cognitive modifiability depends on the individual's ability to learn to react to external and
internal stimuli with strategies, that is, methods and general plans, and to be his or her own teacher
and modifier. The individual with cognitive modifiability accumulates information, classifies and
organizes it, seeks surrounding laws, raises hypotheses and examines them. He or she makes use
of these processes on a wide variety of subject matters. Cognitive modifiability is considered
possible irrespective o f etiology, age or severity of condition. Feuerstein has described three main
characteristics that define structural modifiability. The first is permanence which refers to the
endurance of the cognitive changes over time, or durability. The second is pervasiveness which is
related to a "diffusion" process in which changes in one part affect the whole. Finally, the third is
centrality which reflects the self-perpetuating, autonomous and self-regulating nature of cognitive
modifiability (Kaniel and Feuerstein, 1989; Tzuriel, 1991; Tzuriel and Haywood, 1992).
Cognitive functions are learned in the normal course of development, primarily through an
adult-directed process called "mediated learning," the chief function of which is to assist children
in organizing perceptual data, inducing and applying rules, monitoring behaviour, and developing
10

intrinsic motivation to learn. Such mediation is claimed to be essential to adequate cognitive
development. When adequate mediated learning does not take place, cognitive development, and
consequently effectiveness of learning and problem solving, w i l l be impaired (Feuerstein et al.,
1980).
Mediated Learning Experience (MLE)
Although Feuerstein was inspired by Piaget, he noted what he believed were shortcomings
to Piaget's theory. According to Feuerstein, in the Skinnerian, behaviourist view, learning
occurred by direct stimulus-response mechanisms such as classic pr operant conditioning, or
S —» R. B y crediting the organism (i.e., the child), its level of maturation and its stage of
development with an important role in the accommodation and elaboration of stimuli, Piaget
interposed the organisim between stimulus and resonse, or S - » O —> R. Feuerstein, however,
believed that this model underestimated the role played by an adult, or other human (H). His
S (H) -> O —» R model holds that for optimum learning to occur, a mediator must deliberately
place himself or herself between the stimulus and organism with the intention of altering both
(Feuerstein & Feuerstein, 1991; Feuerstein & M . B . Hoffman, 1982; Kaniel & Feuerstein, 1989;
Sewell & Price, 1991). A n expansion of Feuerstein's above model is S (H) - » O <-> (H) - » R. It
is described by Jensen, Feuerstein, Rand, Kaniel , and Tzuriel (1988) as follows:
The mediator (H) selects stimuli from the environment (S) transforming them according to
purposes and goals before they reach the systems of the learner (O). The mediator (H)
selects responses produced by the learner (O) shaping and transforming them to develop
response modalities (R). MLE establishes prerequisites and instills need systems required
by higher levels of modifiability. Following mediation the learner (O) is able to interact
effectively with the environment (S-O-R) without mediation and adapt to needs to change.
(P- 67)
11

Feuerstein calls the human mediation process the Mediated Learning Experience ( M L E ) .
According to him, adequate cognitive development cannot take place without the active
participation of mediators. Deficient cognitive functions are seen to be the result of inadequate
mediated learning experience rather than of social class, poor education of parents, or
psychopathology in children or parents, variables which are often cited by developmental and
educational psychologists and sociologists. Although biological, social and environmental factors
are acknowledged as possible "distal," or more removed causes of intellectual differences among
individuals and groups, the "proximal" or more immediate cause of intellectual performance is
assumed to be M L E . A lack of M L E , Feuerstein argues, drastically limits the meaning and
significance of experienced events because these experiences are grasped in an episodic manner
without being related to other events experienced by the individual. Therefore, the effects of a
lack of M L E may be thought of as depriving individuals of the prerequisites of higher mental
processes, despite potentially normal capacities inherent in them (Feuerstein et al., 1980;
Feuerstein etal. , 1981).
Feuerstein believes that, through the process of mediation, culture-characteristic modes of
thought can be passed from one generation to the next. When he was working in Geneva and then
France with the young people from different cultures prior to their emigration to Israel, he came to
believe that the differences in test performance between these children and those from Geneva
came from two sources, "cultural differences" and "cultural deprivation." While the culturally
different individual displayed the capacity to become modified through direct exposure to stimuli,
the culturally deprived individual did not. His observations, along with those of Andre Rey, led
him to consider the culturally different as individuals equipped with learning capacities which they
acquired while being exposed to, and affected by, their own culture. This enabled the individual
to benefit from formal and informal opportunities to learn. The culturally deprived, however, had
12
to "learn to learn" via mediation. Children in this group were defined as culturally deprived
because they were not exposed to their own culture and therefore became unable to benefit from
direct exposure to sources of stimuli. Their "modifiability" was more or less restricted (Feuerstein
and M . B . Hoffman, 1982; Feuerstein and Feuerstein, 1991; Jensen et al., 1988).
According to Kopp-Greenberg (1991), many theorists such as Vygotsky (1929) would
agree with Feuerstein that mediation occurs naturally as part of an adult's need to pass on culture
from one generation to the next. They believe that cultural transmission through adult transactions
usually involves relating cultural values and norms in such a way that they transcend the
immediate needs of the particular circumstances and, therefore, foster mediated learning.
According to Feuerstein, Rand, and M . B . Hoffman (1979), Feuerstein, Rand, Malka
Hoffman, Mendel Hoffman et al.(1979), Feuerstein et al. (1980), Feuerstein, Rand, Jensen, Kaniel ,
and Tzuriel (1987), Feuerstein and Feuerstein (1991), and Tzuriel and Haywood (1992), there are
11 to 12 characteristics of M L E , with only the first three considered necessary and sufficient for
an interaction to be classified as a mediated interaction: intentionality and reciprocity, meaning,
and transcendence. Several other authors, however, believe that the first five or six criteria are
important (see, for example, Haywood, 1987; Missiuma and Samuels, 1988). The first six,
discussed in Feuerstein and Feuerstein (1991), Greenberg and Woodside (1994), L idz (1991), and
Tzuriel and Haywood (1992) are described below.
Intentionality and Reciprocity. Intentionality refers to the mediators' intentional efforts
to produce in children a state of vigilance in order to help them to register some information.
Reciprocity refers to the level of receptivity of the children to the intentions of the mediators.
Meaning. This refers to interactions in which the presented stimuli pose affective,
motivational and value-oriented significance. The mediator attaches importance and
13
enthusiasm to the stimuli verbally and nonverbally and the mediation answers the questions of
"why" and "what for."
Transcendence. Transcendence refers to both the character and the goal of M L E
interactions. The objective is to transcend the immediate needs and specific situation and
reach out for goals that might have nothing to do with the original activities. It is any
transcendent connection between the content of the given domain and the content of some
other domain.
Mediation offeelings of competence. The mediator communicates to the children in
various verbal and nonverbal ways that the children are capable of functioning independently
and successfully.
Regulation of behaviour. The mediator controls the system of the children's response
prior to overt behaviour in order to inhibit impulsive behaviour or to accelerate the children's
activity, depending on the tasks' characteristics and children's responses. It refers to any
means the mediator employs to assist children in controlling their approach to a given activity.
Mediation of sharing. Sharing is the energetic component that permits transmission of
information; it reflects the need of individuals to move in the direction of participating with
others and to make the others participate with them.
The assumption in Feuerstein's theory is that i f our thinking ability is deficient, the reason
is mainly due to a lack of mediated learning experiences. Further, once cognitive deficiencies are
identified, they can be strengthened. Biological, social or environmental factors are not as limiting
as traditional educators believe. This is the main purpose of the FIE program. In the next chapter
I w i l l describe the program's purpose, as well as its goals and curriculum. I w i l l also review the
literature to see how it has been evaluated to date, and I w i l l use this review to develop the
questions this study w i l l attempt to answer.
14

Chapter Two
Literature Review of Feuerstein's Instrumental Enrichment
According to Feuerstein, M . B . Hoffman, Rand, Jensen, Tzuriel, and D . B . Hoffman (1986),
a purpose of Feuerstein's Instrumental Enrichment (FIE) is to enhance the ability of children to
benefit from their direct exposure to new experiences in both formal and informal situations. F IE
is a "substitute for early mediated learning experience. It is a phase-specific method and technique
for the alleviation of the i l l effects resulting from the lack of mediated learning experience..."
(Feuerstein et al., 1980, p. 1). One of the expected results is that children w i l l become more aware
of their cognitive processes and abilities. That is, they w i l l increase their metacognitive
awareness; this should give them greater control over their cognitive styles and therefore greater
consistency in the use o f their cognitive processes.
Goals
Although the general goal of FIE is to increase the cognitive modifiability of learners,
there are six specific subgoals that can be regarded as a set of strategies for achieving the general
goal (Egozi, 1991; Feuerstein et al., 1980).
> First is the correction of any deficient cognitive functions that, in the theory, are regarded as
the result of inadequate and insufficient early mediated learning experiences. These
deficiencies can be in the "input," phase of information processing where all necessary
information is gathered, the "elaboration" phase where the gathered information is used or the
"output" phase where the solution to a problem is expressed. The following descriptions are
from Egozi (1991), Feuerstein et al. (1997), Feuerstein, Rand, Haywood, M . B . Hoffman, and
Jensen (n.d.) and the FIE Curriculum Training Handbook, Vancouver School District (n.d.).
Impaired cognitive functions affecting the input level include:
15
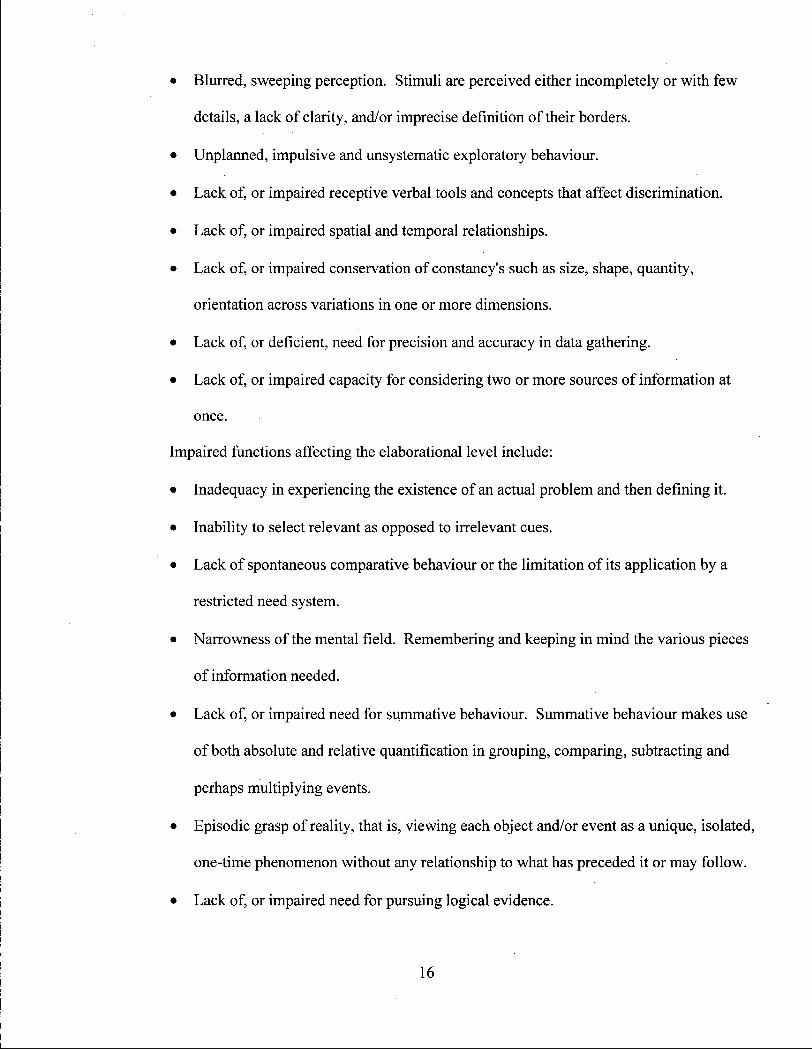
• Blurred, sweeping perception. Stimuli are perceived either incompletely or with few
details, a lack of clarity, and/or imprecise definition of their borders.
• Unplanned, impulsive and unsystematic exploratory behaviour.
• Lack of, or impaired receptive verbal tools and concepts that affect discrimination.
• Lack of, or impaired spatial and temporal relationships.
• Lack of, or impaired conservation of constancy's such as size, shape, quantity,
orientation across variations in one or more dimensions.
• Lack of, or deficient, need for precision and accuracy in data gathering.
• Lack of, or impaired capacity for considering two or more sources of information at
once.
Impaired functions affecting the elaborational level include:
• Inadequacy in experiencing the existence of an actual problem and then defining it.
• Inability to select relevant as opposed to irrelevant cues.
• Lack of spontaneous comparative behaviour or the limitation of its application by a
restricted need system.
• Narrowness of the mental field. Remembering and keeping in mind the various pieces
of information needed.
• Lack of, or impaired need for summative behaviour. Summative behaviour makes use
of both absolute and relative quantification in grouping, comparing, subtracting and
perhaps multiplying events.
• Episodic grasp of reality, that is, viewing each object and/or event as a unique, isolated,
one-time phenomenon without any relationship to what has preceded it or may follow.
• Lack of, or impaired need for pursuing logical evidence.
16
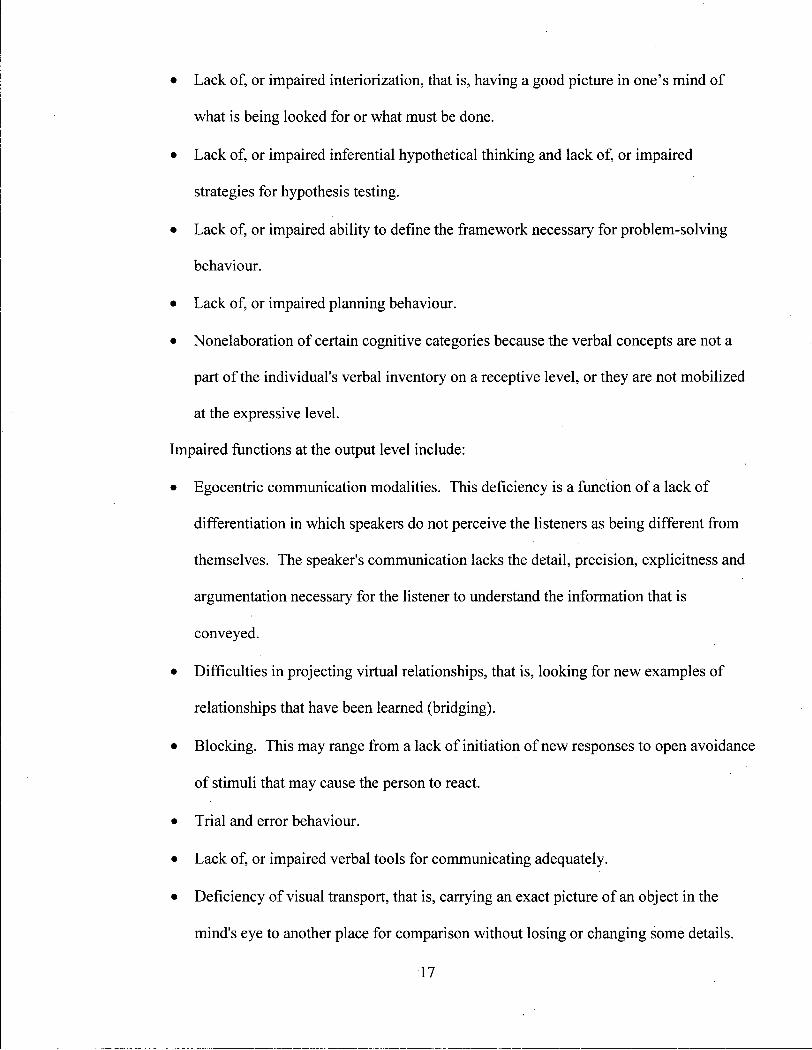
• Lack of, or impaired interiorization, that is, having a good picture in one's mind of
what is being looked for or what must be done.
• Lack of, or impaired inferential hypothetical thinking and lack of, or impaired
strategies for hypothesis testing.
• Lack of, or impaired ability to define the framework necessary for problem-solving
behaviour.
• Lack of, or impaired planning behaviour.
• Nonelaboration of certain cognitive categories because the verbal concepts are not a
part of the individual's verbal inventory on a receptive level, or they are not mobilized
at the expressive level.
Impaired functions at the output level include:
• Egocentric communication modalities. This deficiency is a function o f a lack of
differentiation in which speakers do not perceive the listeners as being different from
themselves. The speaker's communication lacks the detail, precision, explicitness and
argumentation necessary for the listener to understand the information that is
conveyed.
• Difficulties in projecting virtual relationships, that is, looking for new examples of
relationships that have been learned (bridging).
• Blocking. This may range from a lack of initiation of new responses to open avoidance
of stimuli that may cause the person to react.
• Trial and error behaviour.
• Lack of, or impaired verbal tools for communicating adequately.
• Deficiency of visual transport, that is, carrying an exact picture of an object in the
mind's eye to another place for comparison without losing or changing some details.
17

• Lack of, or impaired need for precision and accuracy in communicating one's response.
• Impulsive, acting out, behaviour affecting the nature of the communication process.
> The second subgoal of F IE is the enrichment of cognitive repertoire, including the vocabulary,
cognitive operations, strategies, concepts and relationships necessary to complete FIE tasks.
> The third subgoal is the production of intrinsic motivation, or the need to learn, through the
formation of new habitual strategies, operations and principles.
> Subgoal four is the production of reflective, insightful thinking processes.
> The fifth is to increase task-intrinsic motivation and to motivate students toward task-oriented
abstract goals, that is, the readiness to perceive the performance of an activity as a goal in
itself, solely for the pleasure of doing it.
> The sixth and final subgoal is to change students' self-perception from that of being a passive
recipient of information to that of being originators of new information and to encourage their
creativity.
Curriculum.
A complex curriculum has been developed to help teachers use M L E with students. It
consists of 13 to 15 instruments that are generally taught three to five times weekly for 2 to 3 years
or approximately 200 to 350 hours in total. (The hourly amount varies depending on the author).
Materials are organized into a series of units, each of which focuses on a cognitive function and its
related cognitive deficits. Below is a list o f 13 instruments, from Link (1991, pp. 9-10), which
would cover 3 years of instruction. Cognitive functions that are addressed for the four instruments
in the first year are also given (Vancouver School District, n.d.).
In the first-year curriculum, students use the following instruments:
1. Organization of Dots. These materials are intended to help students find the
relationships, (i.e., shapes, figures, and other attributes) among a field of dots, a task similar to
18
picking out constellations in the night sky. In this way students begin developing strategies for
linking perceived events into a system yielding comprehensible information that can be a basis for
understanding and logical response. The instrument is designed to develop the following
cognitive functions: formation of relationships, representational behaviour, use o f concepts, stable
systems of reference, precise and accurate communication, definition of the problem, visual
transport, use of two or more sources of information simultaneously, systematic work,
hypothetical/inferential thinking and data gathering.
2. Orientation in Space I. The aim of this instrument is to promote the creation of specific
strategies for differentiating frames of reference in space, such as left, right, front, and back. The
materials are designed to develop the following cognitive functions: formation of relationships,
representational behavior, use of concepts, stable systems of reference, precise and accurate
communication, definition of the problem, visual transport, use of two or more sources of
information simultaneously, systematic work, hypothetical/inferential thinking, and data
gathering.
3. Comparisons. This instrument is intended to foster precise perception, the ability to
discriminate by attribute (i.e., equal/unequal, similar/dissimilar), and the judgment necessary to
identify and evaluate similarities and differences. It is designed to develop the following cognitive
functions: spontaneous comparative behaviour, clear, stable perception, thorough, systematic
exploration, precision/accuracy, discrimination, judgement of similarity, projection of
relationships, evaluation, judgements, conclusions, classification, planning behaviour, the use of
two or more sources of information simultaneously, and the use of verbal tools, discrimination,
and summation.
4. Analytic Perception. This instrument addresses the ability to analyze component parts
in order to find how they relate to each other as well as how they contribute to the overall
.19

character of the whole they compose. It is designed to develop the following cognitive functions:
comparisons, hypothetical thinking, visual transport, precision/accuracy, systematic search and
work, strategy definition, labelling, projection of relationships, and spontaneous use of two or
more sources of information.
In the second-year curriculum, students use these instruments:
5. Categorization. The materials are designed to help students learn the underlying
principles and strategies for creating conceptual sets and categories, a vital prerequisite for higher
mental processing.
6. Instructions. This instrument emphasizes the use of language as a system for both
encoding and decoding operational processes on levels of varying complexity. Exercises focus on
critiquing instruction, rewriting instructions to supply missing relevant data, and creating
instructions and directions for other to follow.
7. Temporal Relations. The materials address chronological time, biological time, and
other temporal relations. Students learn to isolate the factors involved in evaluating or predicting
outcomes (i.e., time, distance, and velocity) and to find the inter-relationships among those factors.
8. Numerical Progressions. The instrument promotes the ability to perceive and
understand principles and formulas manifested in numerical patterns.
9. Family Relations. The instrument promotes understanding of how individual roles in
hierarchical organizations define the network of relationships that are encountered in daily life and
work.
10. Illustrations. The materials encourage spontaneous awareness that a problem exists,
analysis o f why it exists, and projection of cause-and-effect relationships.
In the third-year curriculum, students are introduced to four instruments:
20
11. Transitive Relations and Syllogisms. The materials are designed to foster higher-level
abstract and inferential thought. Transitive Relations focuses on drawing inferences from
relationships that can be described in terms of "greater than," "equal to," or "less than." Syllogisms
addresses formal prepositional logic and is intended to promote inferential thinking based on local
evidence. Students learn to critique analytic premises and propositions.
12. Representational Stencil Design. The instrument requires students to analyze a
complex figure, identify its components, and then recreate the whole mentally in colour, shape,
size and orientation.
13. Orientation in Space II. The materials complement earlier instruments by extending
students' understanding of relative positions from a personal orientation to the stable, external
system represented by the points of the compass.
Literature Review
There have been a variety of perspectives on the value of FIE and I have presented them
below. These differing perspectives aided me in distilling features that led to the research
questions. I w i l l present them without comment at this time and return to selected opinions in my
discussions in Chapter Six. I w i l l begin with reviews and reports of individual studies and w i l l
then present reviews of groups of studies; they w i l l be in chronological order. I w i l l then highlight
approaches to intelligence other than Feuerstein's so that we have a context within which to
consider FIE.
Individual Studies
After reviewing the data from Feuerstein's study (Feuerstein et al., 1980), Bradley (1983)
observed that on the Primary Mental Abilities test, Project Assessment Battery and Classroom
Participation Scales, validity, reliability and other psychometric data were not reported. H o w
then, he questioned, can we be certain the tests measure what they are said to measure, and how
21
well they do it. Further, there was no comment in the study regarding control of experiment-wide
error rates. A failure to control for experimental error rate would result in the probability levels of
the statistical tests being much higher than the .05 level that was set. In addition, because of the
large number o f participants in the study, the power of the statistical tests would produce statistical
significance even i f the differences among means were very small.
Bradley (1983) also drew a parallel between the current interest in cognitive skills training
and the optimism in the 1960s among special education circles for the diagnosis and remediation
of learning difficulties. These difficulties were related to psychoneurological processes (e.g.
auditory, visual, attention or sequencing processes) and training those process was important.
However, throughout the 1970s, a series of studies concluded that the tests of processing abilities
did not relate well to cognitive or academic performance, and the methods for training processes
had failed to produce desired gains in cognitive, academic or even process abilities (Hammill ,
1993).
Arbitman-Smith, Haywood, and Bransford (1984) demonstrated that F IE students improve
greatly in their ability to master tasks that they are taught directly and to solve domain specific
transfer problems and domain independent problems. They also found that FIE students benefited
more from instruction unrelated to FIE, in part because they were more attentive and more
motivated to engage in learning tasks. On normative measures of intelligence, results were
encouraging but not overwhelming.
Arbitman-Smith et al. (1984) concluded that one necessary condition for cognitive change
seemed to be the teachers, in that they must be trained to carry out the program effectively. They
also asked how much cognitive education would be enough. According to the authors, the FIE
program is designed to be taught 300 to 350 hours for a period of 2 to 3 years. However, teachers
usually average only 70 to 80 hours per year, and often cannot continue beyond the first year.
22

Another question the authors would like answered is, "Who benefits from FIE - normal, but low
academic functioning, educable mentally retarded, or the learning disabled?"
Another researcher, Blagg (1991), reported on an extensive study o f FIE in Somerset,
England. Beginning in 1983, the project ran for 5 years with a formal evaluation over 3 years of
the effects of FIE on 14- to 16-year old low-achieving adolescents, their teachers, and schools.
During this period, approximately 1,000 pupils were exposed to FIE and 30 teachers and three
psychologists were trained in the program. Over a 2-year period, 250 children and 30 teachers
were closely monitored. The study failed to confirm any increase in IQ scores associated with
FIE. Further, there was no evidence to imply that it had a positive influence on attainments or
work-study skills. There was some basis for mild optimism about positive attitudinal and
behavioural change in the pupils and clearer evidence of benefits for the teachers who became
more positive about their roles and about the potential of low-functioning students. However,
Blagg believes that, "The major stumbling block with FIE appears to be its failure to teach for
transfer" (p. 135).
Groups of Studies
Sternberg (1984) and Sternberg and Bhana (1986) bring several concerns to our attention.
In their review of the literature they state that very little information is available on the constructs
of insight and motivation, both of which the program is intended to develop. They question how
well the instruction w i l l transfer or generalize to other areas of students' lives, partly because the
extent of transfer depends greatly on how well teachers are able to conduct the required bridging.
Sternberg and Bhana (1986) also saw no evidence of improvement in insightful, creative, or
synthetic thinking abilities. Nevertheless, they state that the program would likely be useful and to
be most appropriate for students of average or below average ability at the junior high school level
and for students who do not grow up with standard white, North American middle class
23

experiences. Further, they believe that the program may have the potential to improve students'
standardized scores in the areas of abstract reasoning and spatial visualization.
Sternberg (1984) views the strengths of the IE program as the following:
• It can be used for children in a wide age range and for children o f a wide range o f ability levels
and socioeconomic groups.
• It is well liked by children and appears to be effective in raising their intrinsic motivation and
self-esteem.
• It is well packaged and readily obtainable.
• It appears effective in raising children's scores on IQ tests.
The weaknesses, according to Sternberg (1984), are:
• The program requires extensive teacher training, which must be administered by a designated
training authority for the duration of the program.
• The isolation of the problems from any working knowledge or discipline base (such as social
issues or reading) raises questions regarding the transferability of the skills to academic and
real-world intellectual tasks, especially over the long term.
• Despite Feuerstein's dislike of IQ tests, the program trains primarily those abilities that IQ tests
tap rather than a broader spectrum of abilities that go beyond intelligence as the tests test it.
Savell, Twohig, and Rachford (1986) examined reports of empirical research on FIE as a
method of teaching thinking skills. They began with studies conducted in Israel, the first of which
was conducted in the early 1970s (Feuerstein et al., 1980; Rand, Tannenbaum, & Feuerstein,
1979). The second was a follow-up study conducted 2 years later. Savell et al. concluded that the
reports suggest the possibility that, at least with what Feuerstein considered to be culturally
disadvantaged students, F IE is capable of producing some lasting improvement in the ability of
some students to do well on at least some measures of intellectual ability. However, the similarity
24

between FIE-material and dependent-measure material raised the question as to whether or not the
studies produced nothing more than mastery or near-transfer or practice effects. Further, the
authors state that there is the question of how to interpret the studies' failure to find statistically
significant effects on self-concept measures.
Savell et al. (1986) also reviewed reports from Venezuela, the United States, and Canada,
and they arrived at the following generalizations:
• Statistically significant FIE/non FIE comparison group differences had been observed in these
countries, including Israel, in middle and low social class groups, in groups considered normal
as well as groups considered culturally or educationally disadvantaged, and in groups
classified as hearing-impaired.
• The effects most commonly reported in these studies had been those on certain standard
nonverbal measures of intelligence that are largely measures of skil l in processing figural and
spatial information. Effects on other types of measures, such as self-esteem, impulsivity,
classroom behaviour, academic achievement and course content were absent, inconsistent or
difficult to interpret.
• The effects that had been reported have been observed almost entirely with individuals who
were in elementary or secondary school (ages 12-18). A few studies used college or college-
age subjects, but generally the intervention used was too weak to provide a satisfactory test.
One study suggested that FIE may be able to produce effects with individuals who are beyond
adolescence.
• Studies showing experimental/comparison group differences had a number of things in
common: at least a week of training for FIE instructors, generally 80 hours or more of student
exposure to FIE over a 1- or 2-year period, and FIE taught in conjunction with some other
subject matter of interest and importance to the student.
25
Savell et al. (1986) ended with conclusions and questions for future research. First they
perceived the need for data that:
• Goes beyond positive near-transfer results (transfer from FIE material to FIE-l ike material
such as nonverbal tasks) to positive far-transfer results (transfer to dissimilar behaviours such
as planning ability),
• Relate to students' ability to learn when placed in standard learning situations, and
• Address snowballing, that is, the increasing magnitude of positive FIE results over time.
Then these authors ask, in part:
• Is FIE effectiveness related to age?
• To what extent can FIE effects be observed in populations other than those originally studied
in Israel?
• Why have measures of self-esteem generally failed to show FIE effects?
• H o w much FIE instruction on how many instruments are needed to produce the effects
intended by FIE theorists?
• H o w much training and support is needed to prepare teachers to provide effective instruction?
• H o w does bridging take place and do regular teachers who are trained in FIE teach their other
classes differently than before?
• What is the best way to measure FIE effects, that is, what are the best instruments for
particular constructs?
• H o w large an effect is it reasonable to look for? (pp. 402-403)
In his review of FIE, Burden (1987) found that more attention needed to be given to the
bridging aspects of mediation, that FIE had been criticized for being too close to a teach-to-test
program, and that the issue of "optimum engaged time" had not been given much attention from
26

researchers. In addition, studies incorporating measures of self-concept had shown little, i f any,
positive effects of FIE.
Yates (1987) reviewed 18 studies conducted from 1979 to 1985. She found that there was
little controlled research published regarding FIE effects and no follow-up data had been reported.
Most of the studies were small-scale ones and less than the recommended amount of instruction
was given (400 hours, according to Yates). There had been no attempt to analyze IE's impact on
such factors as time-on-task, instructional support, success rate or academic learning time. A
number of studies reported modest gains in intellectual measures, and many studies reported that
teachers responded enthusiastically to the IE materials.
Samuels and Conte (1987) also examined the research on Instrumental Enrichment. They
reported that although initial studies carried out by Feuerstein and his colleagues (for example,
Feuerstein et al., 1980) indicated that Instrumental Enrichment could make significant changes on
the intellectual functioning of culturally disadvantaged children, results of follow-up studies in
North America were less encouraging. There were, however, problems with the research. First,
students often received less than the recommended amount of instruction, which, according to
Samuels and Conte, should be no less than 3 hours a week with a total minimum of 200 hours.
Second, studies did not monitor teacher behaviour to assess how well the teachers had adopted a
mediated teaching style.
Regarding the evaluative instruments used in the research, the measures used were
standardized tests of intelligence, achievement, self-esteem and so on. Samuels and Conte (1987)
wrote that the tests had been criticized for a lack of sensitivity to the processes and strategies being
taught. In their own research with learning-disabled students at a vocational school, the authors
found that although results first appeared to be disappointing, there was an effect due to
differential attrition over the term of the study. Poor students were encouraged to remain in school
27
and higher functioning students were encouraged to transfer to other schools offering academic
programmes.
Frisby and Braden (1992) examined studies by Perry (1986), Bachor (1988), Haywood,
Towery-Woolsey, Arbitman-Smith and Aldridge (1988), and a study by Shayer and Beasley
(1987) on data from three research programs. Shayer and Beasley gave effect sizes for results
reported by Feuerstein (1979) and Haywood, Arbitman-Smith, Bransford, Towery, I .L. Hannel,
and M . V . Hannel (1982) and from their own study. In the first study, the FIE program did not
result in improvement of school-related behaviours. The second succeeded on near-transfer tasks,
and the third, involving hearing-impaired students, also showed significant gains mainly on
measures of nonverbal ability and spatial relations. In the Shayer and Beasley study, most
achievement subtest effect sizes were nonsignificant. Further, effect sizes that did achieve
significance translated into a few subtest points difference, carrying little practical significance.
Frisby and Braden (1992) also wrote a detailed critique of Feuerstein's dynamic approach
to assessment. In the critique, they challenged Feuerstein's use of the term "cognitive
modifiability." They refer to Eysenck (1988), stating that arguments over the extent to which
intelligence is modifiable w i l l become hopelessly muddled unless the level of intelligence that is
referred to is carefully clarified. Frisby and Braden believe that this clarification requires a
distinction between biological intelligence, psychometric intelligence and social intelligence.
According to Frisby and Braden, biological intelligence refers to individual differences in
the structure, physiology and biochemistry of the human brain that are determined by one's genetic
code. Psychometric intelligence refers to a person's general level of functioning on objective,
standardized, intelligence tests. Social intelligence is meant by the authors to refer to the ability to
function and adapt within social or everyday situations according to the accepted standards of
28
one's culture. The authors believe that judgments of social intelligence vary with the persons
making the judgment and the context within which judgments are made.
Frisby and Braden (1992) claim that, because many noncognitive factors enter into the
determination of social intelligence, the consideration of noncognitive factors helps to explain why
social intelligence is highly modifiable. They conclude that the behaviour and attitude changes that
occur as a result of exposure to FIE training fall under the domain of what they define as social
intelligence. They state that modifiability in this situation should not be confused with cognitive
test score changes or qualitative shifts in thinking typically associated with biological maturation.
Frisby and Braden (1992) also claim that attempts to draw links between ethnic/social class
group differences in cognitive performance and associated differences in childrearing styles
cannot prove or disprove an ad hoc M L E hypothesis, because such accounts do not control for
genetic kinship, environmental or school factors. (Feuerstein would likely claim that these factors
are not very relevant because they are "distal" causes of intellectual performance. See page 12 in
Chapter One). There are those, however, who would disagree with Frisby and Braden. The theory
has become attractive to minority educators in the United States and Canada as an explanation for
the low academic performance of poor minority and aboriginal children relative to more
advantaged students (for example, Wilgosh & Mulcahy, 1993). Emerson (1991) presents a case
for the use of M L E in the education of Native Americans. He writes that,
Increased cognitive efficiency and knowledge of native cultural information can prove to
be very beneficial for contemporary native cultural survival and development. The tribal
elder who sat down and mediated both the meaning behind an object and the process of its
development allowed both culture and cognition to flourish in the minds o f its youth,
making them more susceptible to change and to learning, (p. 155)
29

Intelligence
In this section I w i l l highlight other theoretical approaches to the way we discuss
intelligence in order to provide a context within which FIE can be considered.
In a report to the American Psychological Association, Neisser, Boodoo, Bouchard,
Boykin , Brody, Ceci , Halpern, Loehlin, Perloff, Sternberg, and Urbina (1996) reviewed the
literature on various concepts of intelligence. They attempted to "prepare a dispassionate survey
of the state of the art" (p. 78) and review four concepts of intelligence: the psychometric approach,
multiple forms of intelligence, biological approaches, and developmental progressions. Their
concepts of psychometric and biological intelligence appear to be similar to those of Frisby and
Braden. In their description of developmental progressions of intelligence, Neisser et al. included
the theories of Jean Piaget and Lev Vygotsky.
David Wechsler originally defined intelligence as the capacity of the individual to act
purposefully, to think rationally, and to deal effectively with his environment" (Wechsler, 1944, p.
3). He believed that intelligence was not only a global entity but also an aggregate of specific
abilities. Later, he explored "nonintellective" factors of intelligence, including the abilities to
perceive and respond to social, moral and aesthetic values (The Psychological Corporation, 1997;
Wechsler, 1975). These intellectual factors appear to be similar to the concepts o f social
intelligence as described by Frisby and Braden, and to Feuerstein's concepts of cognitive
modifiability and mediated learning experiences.
According to Sternberg (1994), "we need to move away from a conception of intelligence
as constituting a fixed set of abilities, regardless of the number, and toward a conception of
intelligence as involving capitalization on strengths and compensation for and remediation of
weaknesses" (p. 563). He believes that we can teach intelligence to at least some degree, but
cannot effect radical changes at this time (Sternberg, 1996).
30

Perhaps the discussion of whether or not intelligence can be modified would be more
fruitful i f we consider Haywood's "transactional" theory. In this model, "individual differences in
intellectual development and expression are seen to be products of genetic endowment engaged in
a series of 'transactions' with environmental circumstances, and with a person-characteristic
trajectory of development for each individual" (Haywood, Tzuriel, and Vaught, 1992, p. 45).
Haywood believes that intelligence is only modestly modifiable, but cognitive processes (or
Piagetian "cognitive structures"), that is, durable and generalizable modes of thinking, are highly
modifiable. He contends that components of intelligence include several factors all related to so-
called "pure" ability variables, but components of cognitive processes may include both cognitive
"structures," and motivational/attitudinal/affective variables. This view appears to be consistent
with the views of Wechsler (1944) and Sternberg (1994), and with Feuerstein's theory of
Structural Cognitive Modifiability. So, when we discuss the effectiveness of cognitive
modification, we can think, not of intelligence, but of modes of thinking and behaving.
Summary of Evaluations
The evaluations of empirical research, above, contained not only negative but positive
aspects. However, there were many questions and areas noted for further investigation.
Several authors were concerned about an appropriate amount of required teacher training, as
well as about teachers' skills with a mediational teaching style and with bridging. They were
also concerned about the length of time that was spent teaching Instrumental Enrichment, often
far less than a recommended amount. There were questions about the generalizability of IE,
that is, whether positive effects were only on near-transfer tasks or when students were tested
with instruments similar to IE instruments. There also seemed to be little success on measures
in the affective domain.
31

Reviewers wanted information on what types of populations benefited most from IE
and at what age. They wondered how large an effect size would be considered important.
They also recommended that large follow-up studies should be conducted, including
evaluations of students who left the IE program before the end of a study. Factors such as
time-on-task, teacher support and which instruments were most important for which
behaviour/learning changes also needed research. Finally, many reviewers noted the need for
more rigorously controlled studies.
The review of the literature has, therefore, highlighted gaps in our understanding of
Instrumental Enrichment. There appear to be three areas for consideration regarding the
effectiveness of IE: first, there are factors which have an impact on the curriculum; that is, the
amount of teacher training required, the skil l level of the teachers, the time spent teaching IE,
and the type and number of instruments used. The second area concerns factors that have an
impact on the results of IE, that is, whether IE transfers to the cognitive and affective domains.
The third area for study is related to the populations that IE effects, that is, whether different
groups benefit from the instruction.
The research questions, arising from the literature review, are:
1. What is the optimal amount of teacher training required in order to best teach Instrumental
Enrichment?
2. H o w skilled were teachers with a mediational teaching style and with bridging, and did this
make a difference to student outcomes?
3. What is the optimal length of time that should be spent teaching Instrumental Enrichment
for best results?
4. H o w many instruments are needed to produce optimal results?
32

5. H o w far does Instrumental Enrichment transfer? That is, specifically:
5a) Are there significant effect sizes for cognitive tasks such as full scale reasoning ability,
and verbal and nonverbal reasoning ability for students who have participated in
Instrumental Enrichment programs?
5b) Are there significant effects for measures of academic achievement and in the affective
domain on measures of self-esteem, self-confidence, self-concept, motivation to learn,
behaviour and attitudes?
5c) Are significant effect sizes restricted to tasks similar to those in the FIE curriculum, for
example, visual-spatial tasks, visual-motor tasks and dynamic assessment with the
Learning Potential Assessment Device?
6. What types of populations benefited from IE instruction? Populations that have been
studied include those related to gender, ethnicity, socioeconomic status, age, physical
handicaps, intellectual ability, learning disabilities, and emotional and behavioural
handicaps.
Although these are questions that could be addressed, because of the nature of the data
analysis (described in Chapter Four), results of this meta-analysis w i l l be discussed in terms of
Question 5, that is, i f results were significant for measures of near and far transfer.
Importance of the Study
I believe this exploratory investigation is important because so many o f the results of
individual studies have been inconclusive or contradictory and a meta-analysis is a rigorous
method of combining all of their results. Information from variables I am able to analyze may
provide insight into the chosen research question, above. A meta-analysis is also important
because, as Bradley (1983) and Savell et al. (1986) note, it is necessary to calculate more than
statistical significance between groups. In order to make effective educational decisions we
33

should know how large the difference can be between the groups. It may be that in certain
circumstances, the amount of improvement is not enough to justify expenditures; in others, the
difference could be enough to justify pursuing a vigorous complete or partial program.
In Chapter Three I w i l l describe meta-analysis in more detail, that is, why it is
appropriate and how it is performed.
34

Chapter Three
Literature Review of Meta-Analysis
This chapter w i l l describe the purpose and methodology of meta-analysis. I w i l l begin
with definitions of what meta-analysis is and why it is a useful methodological tool. I w i l l then
present a critique from the literature about meta-analysis. The critique offers discussions on
theory development, Type II errors, validity, reliability, homogeneity, generalizability and bias.
The bias section contains discussions on the "file-drawer" problem, quality of studies, multiple
publications, sample size, studies with more than one statistic, and the unbiased estimate of effect
size. I w i l l then describe the usual steps followed in performing a meta-analysis. These include
the literature search, developing inclusion-exclusion criteria, data collection and the statistical
analysis. There are many decisions to be made as the meta-analysis progresses and many of these
w i l l be made as an iterative process as studies are collected, read and recorded. The decisions and
their rationale w i l l be described in Chapter four.
Definitions
Meta-analysis was developed by Gene Glass (1976, 1977). He defined meta-analysis as
the analysis of analyses. According to Glass, a meta-analysis is
. . . the statistical analysis of a large collection of analysis results from individual studies for
the purpose of integrating the findings. It connotes a rigorous alternative to the casual,
narrative discussions of research studies that typify our attempts to make sense of the
rapidly expanding research literature. (1976, p. 3)
K u l i k and K u l i k (1989) state that a meta-analysis covers review results from large numbers
of studies found in objective searches of a research literature. They describe it as an application of
statistical tools to summary statistics, not raw data. The observations, according to Cooper (1998)
and K u l i k and Ku l ik , are means, standard deviations, odds ratios and results from t and F
35

statistical tests. Correlation coefficients can also be used. A meta-analysis may focus on size of
treatment effects, not just statistical significance.
According to Cohen (1988), the concept of treatment effects is important because in most
educational studies statistical tests do not provide any insight into the strength o f the relationship
or effect of interest, so it is desirable to provide indexes of effect size.
Without intending any necessary implication of causality, it is convenient to use the phrase
"effect size" to mean "the degree to which the phenomenon is present in the population,"
or "the degree to which the null hypothesis is false." Whatever the manner of
representation of a phenomenon in a particular research in the present treatment, the null
hypothesis always means that the effect size is zero. (pp. 9-10)
Usefulness
Combining Study Results
According to L'Abbe, Detsky, and O'Rourke (1987), meta-analysis is especially useful
when results from several studies are inconclusive with regard to magnitude or direction of effect,
when sample sizes are individually too small to detect an effect and label it statistically significant,
or when a large trial is too costly and time-consuming to perform. Although meta-analysis has
often been applied to combine the results of randomized trials, there are many topics for which
randomized trials are impossible, and meta-analyses of nonexperimental studies are also common.
For nonexperimental studies, the method is also most useful when there are many studies with low
statistical power (Petitti, 1994). Many of these situations arise with studies of Feuerstein's
Instrumental Enrichment. Along with the problem of effect sizes generally not being reported in
FIE research, these are the reasons why the methodology of meta-analysis has been chosen. Many
FIE studies have inconclusive or contradictory results, sample sizes are often small, most, i f not
al l , studies are nonexperimental, and many have low statistical power.
36

Critique
Theory Development
For several reasons, researchers believe that meta-analysis can contribute to our
development of theories. Researchers can show that, although there may be statistical significance
associated with a relationship, the effect size can be so small that the relationship is relatively
unimportant and so does not support a theory. Meta-analysis can lead to a deeper analysis of new
or additional variables o f theoretical interest. Researchers can compare strengths of theoretical
relations that have not been compared before and offer alternative explanations for phenomena.
Meta-analysis can also show us where the gaps are in research (Asher, 1990; Hal l , Rosenthal,
Tickle-Degnen, & Mosteller, 1994). This may be the case with Feuerstein's Instrumental
Enrichment, where, for example, few studies have been found relating to teacher training and
effectiveness. It should be noted that a meta-analysis could also give a false positive effect
because of the large number of data points.
According to L 'Abbe et al., (1987) consistent findings in different populations under
different circumstances that may be shown through meta-analysis may strengthen the case for a
causal association. Hal l et al. (1994) do not believe, however, that we can confidently assign
causality to a relationship based on meta-analytic review evidence alone. They believe that the
boundaries to how much we can learn about causation with research synthesis are defined by the
underlying primary studies. If most of the primary studies are experimental and have high internal
validity with, for example, randomly assigned subjects to conditions, these authors believe that
then a synthesist might attempt to address questions of causation. If most of the primary studies
have low internal validity with, for example, non-experimental treatments on pre-existing groups
(as is the case with FIE), a synthesist can ask whether two variables covary, but cannot confidently
address questions of causation. Procedures that may suggest causal inference, like random
37

assignment of subjects to conditions and control over the intervention, are available to the primary
researcher. The authors acknowledge that meta-analyses may, however, provide guidance for the
directions for new primary research.
Hunter and Schmidt (1990), and Schmidt (1992), on the other hand, believe that meta
analysis can have more of a role in theory development. Schmidt states that theories are causal
explanations of the processes that take place in a phenomenon. In the behavioural and social
sciences, the methods of path analysis can be used to test causal theories when the data meet the
assumptions of the method. The relationships revealed by meta-analysis, that is, the empirical
building blocks for theory, can be used in path analysis to test causal theories whether or not the
defined relationships are observational or experimental. Hunter and Schmidt state that it is
necessary only to transform effect size values into correlation coefficients.
It is the purpose of this investigation to explore relationships and evaluate Feuerstein's
Instrumental Enrichment, not to develop theories. Other researchers, however, may choose to use
the results to do so.
Type II Errors
According to Asher (1990), Hunter and Schmidt (1990), and Schmidt (1992), combining
studies in meta-analyses is important because Type II errors can be predominant in primary
studies. This is because individual studies may not have enough data points to increase the power
of the statistical tests.
Rosenthal (1991) recommends that primary researchers always report both an estimate of
effect size and a test of significance or confidence interval to protect against inferential invalidity
with Type I and Type II errors. He contends there is little doubt that in the social and behavioural
sciences Type II errors are far more likely that Type I errors. He believes that the frequency of
Type II errors can be reduced by attention to the magnitude of the estimated effect size. If that
38

estimate is large and there is a nonsignificant result, researchers should not assume that the means
of two groups are the same. Only i f the pooled data of many replications result in both a very
small effect size on the average and a combined test of significance that does not reach a desired
alpha level are researchers justified in concluding that no nontrivial relationship exists among the
variables. A meta-analysis is the best way to investigate the data.
Validity
It has been claimed by Eysenck (1978), Gallo (1978), and Presby (1978) among others that
logical conclusions cannot be drawn by comparing and aggregating studies that include different
measuring techniques, definitions of variables, and subjects because they are too dissimilar.
According to W o l f (1986), this criticism has been referred to as the "apples and oranges problem,"
in which it is argued that diversity makes comparisons inappropriate. However, W o l f believes
that this issue may be dealt with empirically by coding the characteristics for each study and
statistically testing whether these differences are related to the meta-analytic results.
L A b b e et al. (1987) agree, stating that meta-analysis offers the opportunity to explore the
effects of these differences through comparison of the magnitude of the treatment effect across
studies, and in the overall meta-analysis result. Through sensitivity analysis, studies with different
design characteristics can be included or excluded from the meta-analysis, and the effect of
combining results from potentially dissimilar studies may be explored.
Further, Cronbach and Meehl (1955) advocated the multimethod-multitrait approach of
analyzing variable differences to develop construct validity. In this method, there should be
several types, approaches and methods of assessing treatment and criteria variables, and these
should be used for several types of populations. Although this is seldom done in any one research
study, Asher (1990) believes that general construct validity can be established quite powerfully
39

with meta-analysis as the researcher considers the homogeneity of results using different types of
treatments, criteria variables, populations, experimenters and methods.
Regarding the generalizability of an effect, Hal l et al. (1994) believe that research
synthesis is the ideal method. They contend that meta-analytic techniques allow for empirical
assessment of external validity to an extent rarely available to a single primary study. In primary
research, confidence in the external validity of results is based solely on the judgment that the
populations of subjects, situations and procedures that are of interest are adequately represented by
the study. They believe that i f the phenomenon is conceptually broad and therefore should be
demonstrated over a wide variety of contexts, then studies that vary extensively in subjects,
situations and procedures may be appropriate for inclusion.
Reliability
When conducting a meta-analysis, it is necessary to consider the reliability, or consistency,
of locating research results. W o l f (1986) suggests that we must ask how likely it is for
independent analysts to locate and include the same studies, and how comprehensive the collection
of studies is. Another important issue is the degree of reliability in coding the features of studies.
There are guidelines to enhance intercoder reliability (for example, Orwin, 1994, and Petitti,
1994). However, these caveats assume that more than one person w i l l be working on the meta
analysis, and in this case there w i l l be only one, myself.
Another reliability issue is the degree of consistency in the calculating and recording of the
significance levels and effect size estimates of studies. Many of these outcome results are not
reported directly in the primary studies, and W o l f (1986) believes that the possibility of errors in
their calculations and coding needs to be minimized.
40
Homogeneity
In order to quantitatively synthesize all studies in one meta-analysis, it is assumed that
each study provides a sample estimate of the size of effect that is representative of the population
effect size. If a series of independent studies provide a common, or homogeneous, estimate of the
population effect size, then it is more likely that the various studies are testing the same
hypothesis. The underlying assumption in combining individual study results to arrive at a
summary measure is that their differences are due to chance alone (sampling variation), and,
therefore, all study results are homogeneous, that is, that they reflect the same "true" effect. In
other words, when results are combined, random error is reduced and many observations are better
than one (L'Abbe et al., 1987; Wolf, 1986).
Tests of homogeneity among the estimates of effect size are often performed before
researchers examine moderator variables. The tests measure whether a group of effects is more
variable than one would expect based on sampling variation. A significant test means that greater
variability than expected by sampling error is present (Hall et al., 1994). If the estimates are
heterogeneous, then the question arises as to whether each study is testing the same hypothesis.
Heterogeneity provides a warning that it may not be appropriate to combine and synthesize all the
study results in one meta-analysis. The investigator would need to consider whether to conduct
separate meta-analytic syntheses for different subsets of studies, each of which represent
homogeneous results (Cooper, 1998; Wolf, 1986).
The power of statistical tests of homogeneity is low, and the failure to reject the hypothesis
that the studies are homogeneous does not prove that the studies are measuring the same quantity
(Petitti, 1994). However, the analyst can use a higher alpha level, for example, .10 instead of the
usual .05, to decrease the risk of having a Type II error.
The issue of homogeneity/heterogeneity wi l l be discussed in more detail below.
41
Sources of Variation and Generalizability
The decision about whether or not to use a fixed or random effects model to analyze the
data depends upon the degree of homogeneity of the individual studies. According to Petitti
(1994), in all the methods based on the assumption of fixed effects, the variance component of the
meta-analytic estimate of pooled effect size is composed only of terms for the within-study
variance of each component study. The assumption of the random-effects model that studies are a
random sample from some population of studies makes it necessary to include a between-study as
well as a within-study component of variation in estimation of effect size and statistical
significance. Because the random-effects model incorporates a between-study component of
variance, it w i l l be more "conservative" than an analysis of the same data based on a method that
assumes fixed effects. That is, an analysis based on a random-effects model w i l l generally yield a
wider confidence interval and wi l l be less likely to declare a significant difference than an analysis
based on fixed effects.
A s the between-study variance becomes large, that is, as heterogeneity increases, the
between-study variance term w i l l dominate the weights assigned to the study using the random-
effects model, and large and small studies w i l l tend to be weighted equally. In this situation, the
results of an analysis based on the fixed-effects model, which weights studies according to their
sample size, and the random-effects model may differ considerably. When there is not much
heterogeneity, the fixed-effects and the random-effects models w i l l both tend to weight studies
primarily according to sample size and they wi l l yield results that are similar.
Petitti (1994) contends that there is no empirical basis for preferring the fixed-effects
model over the random-effects model or vice versa. The choice of fixed-effects model and a
random-effects model is secondary to the examination of the reasons for lack of homogeneity. If
studies are homogeneous, then the choice between the fixed-effects model and the random-effects
42

model is unimportant, as the models w i l l yield results that are similar. It has been argued that one
should not pool disparate study results at all . Rather, the results should be reported and modeled,
or the reasons for the lack of homogeneity should be examined. Petitti states that the use of the
random-effects model is not considered to be a defensible solution to the problem of
heterogeneity. The desire to be conservative is a reason to use the random-effects model, but only
in the absence of heterogeneity.
Cooper (1998), on the other hand, writes,
The question we must ask is whether the effect sizes in a data set are affected by a large
number of these uncontrollable influences, such as differences in teachers, schools, family
structures, and so on. If the answer is "yes, they probably are," then the meta-analyst
chooses a statistical model that takes these additional sources of random variance in effect
sizes into account. If the answer is "no, probably not," then random variance in effect
sizes is ignored (or more accurately, set to zero) and a fixed-effects statistical model is
used. (pp. 150-151)
According to Petitti (1994), in an analysis based on a fixed-effects model, inference is
conditional on the studies actually done. In an analysis based on a random-effects model,
inference is based on the assumption that the studies are a random sample o f some
hypothetical population of studies. The statistical methods used to combine study results when
fixed effects are assumed differ from the methods used when random effects are assumed.
However, it has been shown that differences in the results of meta-analysis based on fixed-
effects and random-effects models arise only when the study results are not homogenous.
There are strong opinions about the appropriateness of both models. Several
statisticians have expressed a preference for the fixed-effects approach, while others favour the
random-effects approach (Cooper, 1998; Petitti, 1994). It is generally agreed, however, that
43
the questions addressed by analysis based on the fixed-effects model and based on the random-
effects model are different. According to Petitti, the random-effects assumption means that the
analysis addresses the question, " W i l l the treatment produce benefit 'on average'?" The model
is appropriate i f the question is whether the treatment, or the risk factor, will have an effect.
The fixed-effects assumption means that the analysis addresses the question, " D i d the
treatment produce benefit on average in the studies on hand?" If the question is whether the
treatment has caused an effect in the studies that have been done, then the fixed-effects model
is appropriate.
Hedges (1994) uses the term "universe" to denote the hypothetical collection of studies
that could be conducted in principle and about which the analyst wishes to generalize. He uses
the term study "sample" to denote the collection of studies that are used in the review and that
provide the effect size data used in the research synthesis.
In the fixed effects, or conditional, model, the universe to which generalizations are
made consists of collections of studies identical to those in the study sample except for the
particular people, or primary sampling units, that appear in the studies. Thus, the studies in the
universe differ from those in the study sample only as a result of the sampling of people into
the groups o f the studies.
The model is called the conditional model because it can be conceived of as a model
that is conditional on the studies observed. The conditional model in research synthesis is in
the same spirit as the usual regression model and fixed effects analysis of variance in primary
research.
In conditional models inferences to other cases are, in the strictest sense, limited to
cases in which the collection of values of the predictor variables is represented in the sample.
44

However, Hedges believes that inferences may be generalized to all studies in the universe i f
the studies sampled are sufficiently similar to those in the universe.
In the random effects, or unconditional, model, the study sample is presumed to be
literally a sample from a hypothetical collection, or population, of studies. The universe to
which generalizations are made consists of a population of studies from which the study
sample is drawn. Studies in this universe differ from those in the study sample along two
dimensions. First, the studies differ from one another in study characteristics and in effect size
parameter because the effect size parameter has a distribution. The generalization is not, as it
was in the fixed effects case, to a universe consisting of collections of studies with
corresponding members of the collections having identical characteristics and effect size
parameters. Instead the studies in the study sample (and their effect size parameters) differ
from those in the universe by as much as might be expected as a consequence of drawing a
sample from a population. Second, in addition to differences in study characteristics and effect
size parameters, the studies in the study sample also differ from those in the universe as a
consequence of the sampling of people into the groups of the study. This results in variation
of observed effect sizes about their respective effect size parameters.
This model is called the unconditional model because, unlike the fixed effects model, it
does not condition, or hold fixed, the characteristics of studies that might be related to the
effect size parameter. The random effects model in research synthesis is in the same spirit as
the correlation model or the random effects analysis of variance in primary research. There are
two sources of uncertainty in estimates and tests in random effects analyses: one due to the
sample of the treatment effects themselves and the other due to the sampling of individuals (in
particular, outcome scores) into each treatment.
45

Inferences are not limited to cases with predictor variables represented in the sample.
Instead, the inferences apply to the universe of studies from which the study sample was
obtained. Because the universe contains studies that differ in their characteristics, and those
differences find their way into the study sample by the process of random selection,
generalizations to the universe pertain to studies that are not identical to those in the study
sample.
B y utilizing a random effects model of generalization, the analyst does not have to ask,
"How similar is similar enough?" as with the fixed effects model. Instead, the question is, "Is
this new study part of the universe from which the study sample was obtained?" In meta
analysis the universe is usually rather ambiguously specified, and consequently the ambiguity
in generalization based on random effects models is that it is difficult to know precisely what
the universe is. In contrast, the universe is more clear in fixed effects models, but the
ambiguity arises in deciding i f a new study might be similar enough to the studies already
contained in the study sample. This can be tested with, for example, a test of homogeneity.
Bias
The File-Drawer Problem.
L'Abbe et al. (1987) and W o l f (1986) write that published research is biased in favour of
significant findings because nonsignificant findings are rarely published, and this leads to biased
meta-analysis results. Rosenthal (1979, 1984) also believes it is unlikely that a literature review
w i l l uncover every study of a hypothesis that has been conducted. He called this the "file-drawer
problem" because of the tendency for studies supporting the null hypothesis of no significant
results to likely be buried away in file drawers. Rosenthal claims that this may enhance the
likelihood of a Type I publication bias error in finding more positive results than would be the
case i f all studies could be located and included in an analysis. Rosenthal suggested that we
46

address this problem by calculating the number of studies confirming the null hypotheses that
would be needed to reverse a conclusion that a significant relationship exists. This has been called
the "Fa i l Safe N " (Cooper, 1998; Wolf, 1986).
Petitti (1994), however, recommends against using Rosenthal's method. She maintains
that the statistical theory that would allow this to be done is not well developed, and the methods
that claim to allow these calculations to be made are all ad hoc. W o l f (1986) believes that the
analyst can overcome the problem by reviewing results in books, dissertations, unpublished papers
presented at professional meetings, and so on.
Another proposed solution to the problem of publication bias is the use of a Funnel Plot, or
Graph (Greenhouse & Iyengar, 1994; Petiti, 1994). With this procedure, described by Light and
Pillemer (1984), the effect measure is plotted on the horizontal axis and the sample size on the
vertical axis. Since small studies usually show more variability among the effect sizes than larger
studies, and there w i l l typically be fewer of the latter, the plot should look like a funnel that is
viewed with the large opening down and the tip pointed up and centred on the true effect size.
When there is publication bias against, for example, studies showing small effect sizes, the left
side of the plot w i l l be distorted or missing. Petiti reports that although the sensitivity of funnel
plots as a method for detecting the existence of publication bias has not been systematically
assessed, bias should be suspected when a plot is distorted.
Quality.
The internal validity of meta-analysis depends on complete and accurately reported
information in published articles. Surveys of the literature have shown that important information
is often unreported. This is not a weakness of meta-analysis itself, but points to the need for more
standardized and comprehensive reporting in the clinical literature (L'Abbe et al., 1987).
47

In addition, there is the belief that meta-analysis disregards the quality of studies, in that
only "good" studies should be aggregated (Eysenck, 1978). Slavin (1986) believes that only the
best evidence should be used in forming a judgment about effects in an area of study. He
compares the research reviewer to a judge in a court of law. The judge would use the best possible
evidence in reaching a decision, and the researcher should do the same. According to K u l i k and
K u l i k (1989), Slavin's study-inclusion criteria unnecessarily reduces the number of studies
available for analysis and with reduced pools of studies he and his colleagues were able to carry
out only the most rudimentary statistical analyses. K u l i k and K u l i k also concluded that Slavin's
best-evidence approach did not provide sufficient safeguards against personal biases of the
analyst.
Glass, M c G a w , and Smith (1981) and K u l i k and K u l i k (1989) believe that meta-analysts
should be tolerant of possible methodological flaws. They include studies that vary in quality and
source and those which are true experiments and quasi-experiments. They believe that meta
analyses w i l l provide good answers only i f analysts examine studies that vary in their features.
L A b b e et al. (1987) and W o l f (1986) write that meta-analysis can incorporate the assessment of
study quality by varying inclusion and exclusion criteria, using a weighting scheme when pooling
results, or by coding the quality of the design employed in each study and examining whether the
results differ for poorly and well designed studies. Other suggestions for examining validity
include coding for the degree of experimenter blindness, randomization, sample size, controls for
recording errors, type of dependent variable, and, as discussed above, publication bias (Wolf,
1986).
Multiple Publications.
Information from the same study should contribute only once to the summary estimate of
effect. Failure to exclude multiple reports of the same study has the potential to cause bias in the
48
summary estimate of effect (Petitti, 1994). Petitti recommends that the criteria for choosing
among results from multiple publications be defined.
Sample Size.
Some studies in a meta-analysis may be based on very small or unrepresentative samples
of subjects, while others may use more carefully designed randomized control group designs with
large numbers of subjects. To give these studies equal weight could lead to the less representative
studies contributing just as much weight to the results of the analysis as the more well-designed
studies (Wolf, 1986). Hedges and Olk in (1985) note that the variance of the estimator depends on
the sample size, so that estimates from studies with larger sample sizes are more precise than those
from studies with smaller sample sizes. They suggest that when the primary studies do not have a
common sample size, there should be some weighting and they offer methods for combinations of
linearly equatable, that is, homogeneous, measures. They demonstrate that the weights that
minimize the variance of the overall effect sizes are inversely proportional to the variance of the
estimates in each study (pp. 108-114).
Studies With More Than One Statistic.
Multiple results from the same study are often used. This may bias or invalidate the meta
analysis and make the results appear more reliable than they really are because these results are
not independent. To overcome the difficulty, some analysts choose to perform separate analyses
for each different outcome, others choose to lump them into the same analysis, some choose to
limit themselves to a fixed number of results from each study, while others take the average of all
results from the same study (Cooper, 1998; Wolf, 1986). K u l i k and K u l i k (1989) argue that using
multiple results, or what they term inflation of sample sizes, is a major problem in statistical
analyses of effect sizes. Many meta-analysts attempt to "dredge" multiple estimates from the
studies. This w i l l have to be addressed with Feuerstein's work where it is common that many
49

disparate measures are used in individual studies to test the significance o f the effects of
Instrumental Enrichment.
Several approaches have been used for this problem of multiple dependent variables.
K u l i k and K u l i k (1989) report that they seldom code more than one effect size from one study for
any given analysis, but they often carry out more than one separate analysis in a report. For
example, in an analysis of the effects of elementary computer-based education, they conducted
separate sets of analyses of several subgroups such as sex, grade-level, subject matter, attitude, and
so on. However, in each analysis, the number of effect estimates was equal to the number of
studies with the relevant data.
W o l f (1986) believes that conducting separate meta-analyses for different classes of
outcome dependent variables addressing different hypotheses of interest is a practical solution to
the "apples and oranges" criticism of meta-analysis. He states that the approach enhances the
conceptual clarity and interpretation of the results as each category of outcome or dependent
variable is examined in a separate meta-analytic synthesis. In this way, he says, apples are treated
as apples, and oranges as oranges.
Unbiased Estimate of Effect Size.
Focusing on Cohen's (1988) effect-size estimator d, which is calculated by subtracting the
average score of the untreated group from the average score of the treated group and then dividing
the difference by the pooled estimated standard deviation for the two groups, Hedges (1981, 1982)
developed the sampling distribution of d and showed that it is a slightly biased estimate of an
underlying population effect size. He proposed a correction for d that removed its bias, but other
meta-analysts soon reported that use of this correction had at most a trivial effect on the results.
K u l i k and K u l i k (1989) found on one meta-analysis that uncorrected and corrected effect sizes
correlated .999, and in most cases agreed to two decimal places. Many meta-analysts no longer
50
use this correction and K u l i k and Kul ik reported that Hedges (1986) conceded that modifications
are needed before his formulas for effect size and standard errors of effect sizes can be used in
meta-analysis.
Procedure
There are four basic steps in a meta-analysis after the hypotheses of interest are stated.
First, studies with relevant data are identified. Second, eligibility criteria for inclusion and
exclusion of the studies are defined. Third, data are abstracted. Fourth, the abstracted data are
analyzed statistically (Petitti, 1994)
Literature Search
According to Petitti (1994), a critical feature of the proper application of the method of
meta-analysis is development of systematic, explicit procedures for identifying studies with
relevant data. The systematic, explicit nature of the procedures for study identification
distinguishes meta-analysis from qualitative literature review. In being systematic, the procedures
reduce bias. In being explicit, the procedures help to ensure reproducibility and reliability. Petitti
contends that no matter how sophisticated the statistical techniques used to aggregate data from
studies, a review does not qualify as meta-analysis unless the procedures to identify studies are
both systematic and explicit.
Following Cooper (1998) and Petitti (1994), identification of studies w i l l include a search
of personal reference files and a computerized search of databases such as the Educational
Resources Information Centre (ERIC), Psychological Abstracts, Dissertation Abstracts and the
Internet for published and unpublished reports, dissertations, and other fugitive literature. The
title and abstract of studies identified in the computerized search w i l l be scanned to exclude any
that are clearly irrelevant. The full text of the remaining articles w i l l be retrieved, and each paper
w i l l be read to determine whether it contains information about an experimental or observational
51

study of FIE. The reference lists of these articles w i l l be reviewed to identify citations to other
studies of FIE, and works that were not identified in the computerized literature search w i l l be
retrieved and reviewed for presence of relevant information. Reference lists o f review articles w i l l
also be reviewed to check for completeness of the assembled list o f relevant publications.
Research into FIE has been conducted in many countries and whenever possible, pertinent
data published in languages other than English w i l l be identified. Individuals connected to
research into FIE w i l l also be personally contacted. Finally, a decision w i l l be made whether or
not to use Rosenthal's Fail-Safe N or other methods that address the file-drawer problem.
Inclusion-exclusion criteria
The goals of defining eligibility criteria are to ensure reproducibility of the analysis and
to minimize bias in selection of studies for the analysis. Another analyst faced with the same
body of literature applying the same eligibility criteria should choose the same set of studies.
The studies chosen for the meta-analysis should be as unbiased as possible with respect to their
results and their conclusions (Petitti, 1994).
The rationale for choosing the criteria w i l l be stated. In practice it may be necessary to
revise broad inclusion criteria after reviewing all the studies found with the literature search.
Some of the variables on which inclusion criteria can be based are the study design, sample size,
type of experimental and control therapies, whether or not the study is published, and the
outcomes of interest (L'Abbe et al., 1987; Petitti, 1994).
The inclusive dates of publication, presentation, or conduct of studies eligible for the
analysis w i l l be given. The meta-analysis w i l l be as up-to-date as possible, and the cut-off
date for identification of eligible studies w i l l be specified so that material published after the
cut-off date w i l l not be assumed to have been missed in the literature search. In addition, the
eligibility of studies whose results are not available in English w i l l be discussed. The criteria
52

for choosing among results of multiple publications from the same study population w i l l also
be defined. A n y restrictions on eligibility due to sample size w i l l be stated. It may be
necessary to exclude very small or highly unbalanced studies. Follow-up studies can
determine i f the effects of FIE last over time. Eligibil i ty or ineligibility based on the similarity
of treatments or exposure wi l l be considered. In the case of this analysis, the treatment is
always instruction in Instrumental Enrichment. The amount of instruction and the number of
instruments used varies, however, and wi l l have to be considered. The eligibility or
ineligibility of incomplete and unpublished reports w i l l be addressed. These could include an
unpublished report from a meeting, an abstract which may or may not have been published, a
letter or a brief report (Petitti, 1994).
Studies can be judged for quality, selected according to a pre-determined level, or quality
scores can be used to weight the individual study results in the pooling process and they can be
coded accordingly (L'Abbe et al., 1987). Again following Petitti, i f a study is judged to be
ineligible the results w i l l be recorded, and a log of ineligible studies w i l l be maintained. Studies
that are directly pertinent but are not included in the meta-analysis w i l l be cited in the published
report on the meta-analysis, and reasons for rejecting them w i l l be presented.
Data Collection
Following Cooper (1998), K u l i k and Kul ik (1989), Rosenthal (1991), and Stock
(1994), several different types of study features w i l l be recorded. These can include the
features of the experimental treatment (FIE) and the experimental design methodology, for
example, subject assignment (random vs. nonrandom, parallel group design), instructor effects
(the same teacher vs. different teachers for experimental and control groups), temporal effects
(concurrent experimental and control classes vs. classes taught in different semesters or years),
test author bias (standardized vs. teacher-developed tests), test scoring bias (objective test vs.
53

subjective test) and statistical control (statistical techniques to isolate or subtract variance in
the dependent variable attributable to variables that are not the subject of study, for example,
using an Analysis of Covariance). Study settings and publication features w i l l also be
recorded. These include course content (variations in FIE lessons), grade level, ability level of
population, year of report and source of report (unpublished, dissertation, published), author
and country. A s suggested above, the quality of the study can also be recorded.
Data collection wi l l be completed when all studies are in. However, at this time it is
likely that, in addition to data selection from the above, the following variables w i l l be
recorded because they refer to Feuerstein's goals and to the theoretical and empirical
evaluations of the program: ethnicity, gender differences, socioeconomic status, age,
population (for example, deaf, gifted, the educable mentally handicapped, learning disabled,
behaviour disordered, and emotionally handicapped), length of instruction, and the focus of
measurement (for example, verbal and nonverbal ability, Ful l Scale IQ, general knowledge,
spatial perception, academic achievement, behaviour, self-esteem and concept, and motivation
to learn) and the teacher variable (for example, teacher training and skil l level).
Statistical Analysis
Analyzing the data statistically usually includes combining the data to arrive at a summary
estimate of the effect size, a measure of its variance and its 95% confidence interval, and a test for
homogeneity of effect size. It may include examination of the reasons for heterogeneity (Petitti,
1994).
Choosing Estimates of Effect.
Although it is rare for studies to present only one estimate of effect for a meta-analysis,
Petitti (1994), like K u l i k and K u l i k (1989), believes that one and only one estimate of effect from
each eligible study should be used in the calculation of the summary estimate of effect, because
54

using more than one would inappropriately weight studies with many estimates of effect size.
However, several analyses wi l l be performed as, for example, only effects of reading ability w i l l
be extracted, then only effects of mathematics ability, and so on. The analyses w i l l initially be
chosen to address the research questions advanced in Chapter Two. Each variable to be estimated
w i l l be analyzed for homogeneity. If the test for homogeneity is rejected, a decision w i l l be made
to either set the variable aside or to use the random effects model to analyze the data.
Calculations for the Unbiased Estimator of Effect Size for Each Study.
The most familiar measure of effect size, and the one chosen for this meta-analysis; is
the standardized mean difference between outcome scores of experimental and control groups
divided by the standard deviation (Cohen, 1988; K u l i k & Kul ik , 1989; Petitti, 1994; Wolf,
1986). There are other methods that test the significance of combined results, with Fisher's
(1932) procedure being perhaps the one most widely used. However, while Fisher's procedure
produces an over-all p-value, it does not provide an estimate of the magnitude of the effects
being considered, which was a major focus of this study (Hedges & Olkin , 1985).
In this meta-analysis, procedures from Hedges and Olk in (1985, pp. 81-91, 109-113,
122-128) w i l l be used when means, standard deviations and the number of subjects are
reported. The fixed-effects model w i l l first be used because it is appropriate to answer the
question of whether or not the treatment has caused an effect in the studies that have been
done. The alpha level for the test for homogeneity w i l l be set at 0.10.
If the fixed-effects model is not successful, the data w i l l be re-analyzed using the
random-effects model. Procedures from Hedges and Olk in (1985, pp. 191-199) w i l l be used.
If means, standard deviations or sample sizes are not given, effect sizes w i l l be
calculated following Cooper (1998, p. 129) and W o l f (1986, p. 35) when /- and F-statistics are
reported.
55
In most cases, the effect size can be positive or negative. A minus sign with a
significant test indicates that the experimental group had results lower than those of the control
group. However, F-test results w i l l have a positive sign, and Mests can be calculated as
Treatment minus Control or Control minus Treatment. Information from each study w i l l be
used to decide whether a positive or a negative sign wi l l be used for the effect size. The
unbiased estimator of effect size, J(m), w i l l be used to reduce bias due to sample size
differences.
When descriptive statistics are not reported and variances cannot be calculated, it w i l l
not be possible to combine the studies, calculate the test of homogeneity, calculate the z
variable and />-value of d, or create a confidence interval for d.
Interpretation of Effect Sizes.
According to Hedges and Olk in (1985), because the effect size, d, is the standardized score
(z score) of the experimental group mean in the control group distribution, the quantity, d
represents the proportion of control group scores that are less than the average score in the
experimental group. Thus an effect size of d = 0.5 implies that the score of the average individual
in the experimental group exceeds that of 69% of the individuals in the control group. Similarly
an effect size of -0.5 implies that the score of the average individual in the experimental group
exceeds that of only 31% of the individuals in the control group (pp. 76,77).
Similarly, i f the d value is 0.32, and we consult a Normal Distribution (z) Table, we find
that the area under the normal curve is 0.6255. This means that the average person receiving the
treatment would have a score, say on a reading test, greater than 62.55% of the individuals in the
control group. The treatment could be expected to move the typical person from the 50 t h to the
62.55 t h percentile on a measure of reading (Wolf, 1986). Another way of stating this would be to
56

say the 62.55% of the experimental group, would exceed the mean of the control group i f both
were normally distributed (Schmidt, 1992).
Cohen (1988) discussed the dilemma of interpreting effect sizes that cannot be
calculated with means and standard deviations. He considered the effect size d = 0.20 to be
small. In such cases, two normally distributed populations of equal size and variability would
have only 14.7% of their combined area not overlapped. This effect size represents, for
example, the approximate difference in mean height between 15- and 16-year-old girls. Cohen
wrote that in new areas of research, effects sizes would likely be small or zero. This was
because the phenomena being studied were typically not under good experimental or
measurement control, or both.
Cohen considered d = 0.50 to be medium-sized. In these cases, 33.0% of the two
populations would not be overlapped. He wrote that such an effect size would be large enough
to be visible to the naked eye. In this case it represents the approximate difference in height
between 14- and 18-year-old girls.
Cohen considered d = 0.80 to be large with the two populations so separated that
47.4%, or almost half, of their areas are not overlapped. He wrote that the differences are
easily perceptible, as with the mean difference in height between 13- and 18-year-old girls.
Chapter Four w i l l report on the methods that were used for this analysis.
57

Chapter Four
Methodology
Studies were identified by a search of personal reference files and by computerized
searches of the Educational Resources Information Centre (ERIC), Psychological Abstracts,
Dissertation Abstracts and the Internet for published and unpublished reports, dissertations, and
other fugitive literature. Search terms were "Instrumental Enrichment" and "Feuerstein's
Instrumental Enrichment." Search dates were from 1966, the beginning date for the on-line
indexes, until 1999, after which time I began to perform the calculations for the meta-analysis.
The title and abstract of studies identified in the computerized search were scanned to exclude any
that were inappropriate based on criteria outlined in the following section. The full text of the
remaining articles was retrieved, and each paper was read to determine whether it contained
information about an experimental or observational study of FIE. The reference lists of these
articles were reviewed to identify citations to other studies of FIE, and works that were not
identified in the computerized literature search were retrieved and reviewed for presence o f
relevant information. Pertinent data published in languages other than English were identified and
individuals connected to research into FIE were personally contacted via e-mail. In this manner
36 studies were accepted and 20 rejected. O f the accepted studies, all were quasi-experimental, 11
were published, 15 were Doctoral dissertations, three were Master's theses and seven were
unpublished reports. Twenty-two were from the United States, seven from Canada, three from
Israel, two from Britain, one from South Africa and one from France. Publication dates ranged
from 1979 to 1996. Inclusion-exclusion criteria are given below.
Criteria Used to Include or Exclude Specific Studies
Studies were chosen only i f the all three of the following criteria were met:
1) Feuerstein's Instrumental Enrichment (FIE) was the intervention that was used,
58

2) their experimental designs included post-test measures for each subject, and
3) both treatment and control groups were used.
This last condition was necessary because this analysis was designed to compare scores
of treatment and control subjects on post-treatment measures only. In addition, i f a study
included treatments in addition to FIE, and i f there was a control group, post-test scores for
only the FIE group were compared to post-test scores for the control group. In cases where the
same study was reported in multiple publications, only one set of results, the most
comprehensive set, was chosen. Subjects ranged in age from 9 to 20, although one study
contained subjects who were Technical School students training to be masons, and some could
have been older than 20.
The Summary of Studies Used, Measures and Effect Sizes (Appendix A ) contains a
summary o f the 36 studies that were included, details regarding their design, the dependent
measures used and the effect sizes calculated from each study's data. Dependent measures
were included i f they evaluated subjects' performance on standardized measures. This was
because most studies used standardized measures, and many non-standardized measures, such
as interviews and attendance figures, were impossible to rigorously quantify. In addition,
informal, locally developed measures such as teachers' and parents' ratings may not have
contained objective opinions. Standardized measures have been validated on groups of
individuals, and given that there was such a large amount of variance among the studies in this
analysis, the use of standardized tests makes the results more reliable 1. The standardized
measures were of full scale, verbal and nonverbal reasoning ability, visual perception and
visual-motor ability, academic achievement, self-confidence, self-esteem, self-efficacy, and
A caveat regarding the interpretation of results from standardized tests with the FIE population will be presented in Chapter Six.
59

self-concept, and attitudes and behaviour. It was possible to collect enough data from these
measures to calculate 360 effect sizes.
The meta-analysis did not include all dependent measures from included studies, and
detailed reasons for their omission are given in Appendix A . Briefly, within the included
studies, four measures were not included because they did not provide data on how FIE
impacted students' performance on the standardized measures described above. Thirty
measures were not included because they were informal measures that did not report
reliability, validity or standardized scores. Thirty measures were not included because the data
were reported in ways that could not be used in the meta-analysis. Examples of this include
the following:
1. missing data on the number of subjects;
2. basic descriptive information such as means or standard deviations were not reported;
3. pre-post results for the treatment groups were reported, but the post-test results were
not compared to a control group;
4. the outcome measures were administered to only the treatment group, but not to the
control group;
5. a single-subject research design was used (this is a quasi-experimental research design
that involves assessing change in a dependent variable on a single research subjects);
6. non-parametric statistical procedures were used. The Mann-Whitney U non-parametric
statistical procedure was not included because data were reported in terms of ranks and
it was not possible to calculate effect sizes (Hedges & Olkin , 1985).
In addition, in four included studies, the authors reported only the results of significant
differences between the experimental and control groups but omitted any reference to non
significant differences.
60

Many studies reported several results from a variety of different dependent measures.
In these cases, only one effect size per study per domain was used. For example, one study
might generate data used both in the analyses of reading and the analyses of self-esteem.
Where possible, composite, or total, scores rather than individual subtest scores were used.
The Summary of Studies Not Used (Appendix B) contains a summary o f 20 studies
that were excluded from the meta-analyses and the reasons for their exclusion. A summary o f
included and excluded studies is given in Table 1, below. Nine other studies could not be
included because they were Ph.D. dissertations or Master's theses, and the universities where
they were housed either would not lend them or did not respond to the Inter Library Loan
request2.
Table 1
Summary Of Included and Excluded Studies
Included Not Included Published 11 10 Doctoral Dissertations 15 5 Master's Theses 3 1 Unpublished Reports 7 4
Totals: 36 20
Quality of Individual Studies.
Regarding the quality of the individual studies, all were quite similar in that they were
quasi-experimental studies. According to Campbell and Stanley (1963), "There are many
natural social settings in which the research person can introduce something like experimental
design into his scheduling of data collection procedures (e.g., the when and whom o f
measurement), even though he lacks the full control over the scheduling of experimental
stimuli (the when and whom o f exposure and the ability to randomize exposures) which makes
2 The universities were Columbia University Teachers' College, Wayne State University, University of Pretoria (South Africa), Temple University, National-Louis University, Saint Xavier College and Northeastern University.
61

a true experiment possible. Collectively, such situations can be regarded as quasi-
experimental designs" (p. 34). This situation arises whenever research is attempted in school
settings where the researcher often has to take what is available in the way of schools, classes
and subjects. Control over exposure and true randomization are, therefore, not available.
Researchers do whatever they can, however, to control the research situations, and for the most
part the studies in this analysis appeared to be of adequate quality within the restrictions of
quasi-experimental design. Notes on study quality are given for each study in Appendix A .
The following is a compilation of information that most study authors reported .
Students were rank-ordered on IQ tests and alternately assigned to either treatment or control
group. Students were pre-tested to ensure that there were no significant differences between
groups on pretest measures. Students were randomly assigned from their regular classes to
small core classes, or all students in the participating grade level were randomly assigned.
Comparisons were also made between matched pairs, or students were matched on the bases of
sex, age and level of class placement or learning problem and then divided randomly into two
groups. Results were often analyzed by analyses of covariance where, for example, gender
and school factors were covariates. Nested designs were also used where, for example,
treatment was nested under classrooms. Testing personnel were often blind to the specific
hypotheses of the study. Treatment teachers were either experienced FIE teachers or had
received training in FIE instruction. In one large study teachers were randomly assigned to
treatment or control conditions and the treatment teachers were then trained.
However, in spite of the fact that the study authors attempted to compensate for the
lack of randomization, it is possible that the groups that were compared were not balanced
with respect to potential confounding variation. In addition, because the studies in this meta-
3 A minority of authors did not report enough information to enable an evaluation of study quality. This will be discussed in the limitation section of this dissertation.
62
analysis were not themselves randomly selected, we cannot assume with certainty that the
results w i l l generalize to the larger population. The results, discussed in Chapter Six, should
be interpreted with this in mind.
Statistical Methodology
A s described in Chapter Three, the fixed-effects model was the first choice for analysis
because it is appropriate to answer the question of whether or not the treatment had caused a
common effect across the studies that had been done. In order to use as many effect sizes from
individual studies, calculations were divided into first, domain, such as reading, verbal ability,
and so on, and then divided again into groups according to the length of the treatment.
Using this method, it was possible to use only 72 effect sizes from a total of 360 to
create 28 combined analyses. This means that 288 effect sizes were not combined. O f these
288, 228 did not meet the criterion for homogeneity in their particular domains (e.g., reading),
two were from studies where effect sizes only were reported, and 58 were from studies where
F- or ^-statistics only were reported.
It can be seen from the above that more than half the effect sizes did not meet the
criterion for homogeneity and could not be combined using the fixed effects model. Variables
such as gender, ethnicity, socioeconomic status, age, intellectual ability, and physical, learning,
emotional and behavioural disabilities were not adjusted for, likely contributing to
heterogeneity within and across studies. The data were, therefore, analyzed again using the
random effects model. In general length of treatment was not considered. However, i f a
researcher used the same subjects for treatment and testing for 1 year, again after 2 years, and
finally testing without treatment after 3 or 4 years, the different years were not combined
separately into the larger group because the analysis would not have independent groups of
subjects.
63

The File-Drawer Problem
A s discussed in Chapter Three, the "file-drawer problem" is one in which published
research is biased in favour of significant findings because nonsignificant findings are rarely
published. This situation can lead to biased meta-analysis in favour of significant, or positive,
results. Care was taken in this meta-analysis to choose unpublished as well as published
studies, and of the 36 studies included, 11 were published and 25 were not. In addition, a
variation of the Fail-Safe procedure, developed by Orwin (1983), was used to calculate how
many additional studies with null results would be needed to reverse a conclusion that an
observed effect size was significantly different from zero (see Hedges and Olkin , 1985, p.
306). A sample of three significant effect sizes was chosen from the results presented in
Appendix C. Verbal Abi l i ty had a large effect size, 1.4050, and following Orwin, 78
additional studies with null results would have to be added to reduce that effect size to the
negligible size of 0.10. Visual Perception had an effect size of 0.4237, slightly less than
medium. Thirteen additional null results would have to be added to reduce it to 0.10. General
Academic Achievement had a small effect size, 0.2571, and 11 additional null results would be
required to reduce it to 0.10. It is unlikely, even for the small significant effect sizes, that the
required number of studies with null results exists for these examples, and therefore, it is
unlikely that the results of this meta-analysis were influenced by the file-drawer problem.
Nevertheless, as w i l l be discussed in Chapter Six, the choice of the random-effects model to
analyze data can increase the chances of publication bias, and the results should be considered
with this in mind.
The Hawthorne Effect
Results of the meta-analysis were examined to see i f significant positive results were
due to "The Hawthorne Effect." The Hawthorne Effect is one in which treatment groups
64

perform better than control groups simply because they have been given more, or more
stimulating, attention, and they have responded to that. In this meta-analysis 28 studies had
regular instruction for the control groups and 8 had novel activities. A n examination of the
combined studies that produced significant effect sizes revealed no direct connection between
the type o f control group and whether it had an influence on significance. For example, a
breakdown in the Ful l Scale Abi l i ty table in Appendix D reveals that of the eight studies
involved in that case, one provided a novel situation to the control group. That study produced
a significant effect size for the treatment group when the logic of the Hawthorne Effect
suggests that it should not necessarily have done so. O f the remaining seven studies in that
table, none had novel control groups, and three of them produced significant effect sizes while
four did not. There is no clear pattern showing significant results when studies had control
groups that did not receive novel treatment. This same mixed pattern appeared in the other
tables in the summary.
Results of the statistical calculations are presented in Chapter Five and discussed in
Chapter Six.
65

Chapter Five
Results
The research question, (number 5) as stated on pages 32 and 33 in Chapter Two is,
H o w far does Instrumental Enrichment transfer? That is, specifically:
a) Are there significant effect sizes for cognitive tasks such as full scale reasoning ability, and
verbal and nonverbal reasoning ability for students who have participated in Instrumental
Enrichment programs?
b) Are there significant effects for measures of academic achievement and in the affective
domain on measures of self-esteem, self-confidence, self-concept, motivation to learn,
behaviour and attitudes?
c) Are significant effect sizes restricted to tasks similar to those in the FIE curriculum, for
example, visual-spatial tasks, visual-motor tasks and dynamic assessment with the Learning
Potential Assessment Device?
Overall Effect Sizes
In this analysis 360 individual effect sizes from 36 different studies were calculated.
Fifty-eight were calculated from F- or /-tests, and two were from studies where effect sizes
only were reported; these could not be incorporated into the subsequent calculations. Random
Effects Model analyses were performed on the remaining 300 individual effect sizes, and
combined effect sizes were obtained for 22 categories.
Detailed results of the Random Effects analyses are presented in Appendix C . O f the
34 combined 4 analyses presented in that appendix, 12 had significant effect sizes and 22 did
not. Specific Tests used by individual authors within significant combined analyses are given
in Appendix D . Their individual effect sizes are also given in that appendix, along with a
4 These can be a combination of studies or a combination of tests or subjects from a single study.
66
statement as to whether or not that effect size was significant. Nonsignificant combined
results are presented in a similar manner in Appendix E . Effect sizes from F- and Mests are
given in Appendix F.
Near and Far Transfer
Significant results from the combined analyses (see Appendix C) are grouped below
according to near and far transfer. Although there are several significant effect sizes from a
single administration of one test, effect sizes from combined analyses only w i l l be reported, as
results from a single administration may not provide reliable information. When examining
these results it should be remembered that, as discussed in Chapter Three, Cohen (1988)
considered an effect size of 0.20 to be small, that of 0.50 to be of medium size, and that of 0.80
to be large. The results are summarized in Table 2 at the end of this chapter, and implications
of the findings w i l l be discussed in more detail in Chapters Six and Seven.
The first group of significant results consists of those from measures considered to be
similar (or near) to the activities and tasks presented in the FIE curriculum. They are measures
grouped into the categories of Visual and Visual-Motor Abi l i ty which are a major focus of the
FIE curriculum. There were significant results for Visual Perception after five months to two
years of treatment (J=0.42, p<.05), Visual-Motor Abi l i ty after one-half a year of treatment
(J=0.71, p<.01), Visual-Motor Abi l i ty 1 year after a year-long treatment (d=1.68, p<.01).
Significant results on near transfer effects are also drawn from measures from the
cognitive domain, that is, from tests combined into the categories of Ful l Scale Abi l i ty , Verbal
Abi l i ty and Nonverbal Abi l i ty . The results show that there were significant results for Fu l l
Scale Abi l i ty after 1 and 2 years of treatment (J=0.58, p<.01), Verbal Abi l i ty after 4 weeks to
two years of treatment (d=\A\, p<.01), and Non-Verbal Abi l i ty after 3 months to 2 years of
treatment (rf=0.24, p<.01).
67

The results from measures of academic achievement are considered to be in the middle
of the continuum between near and far transfer because, although cognitive skills such as
memory and reasoning are involved, the contents of the achievement tests were not directly
taught within the F IE curriculum. These results showed significant effect sizes for General
Academic Achievement after 4 months to 2 years of treatment (d=0.26, p<.05), and Math
Achievement after 1 and 2 years of treatment (d=0.29, p<.05).
The next results are from Jensen's (n.d.) study and are difficult to interpret because,
with the significant results, he did not report information on individual tests. He reported only
that near and far transfer tasks were selected from the French K i t and frOm "up-coming and
more advanced parts of the IE curriculum" (pp. 14,15). "Near Transfer" was significant after
one and one-half years of treatment (d-\.6l, p<.01) and "Far Transfer" after one and one-half
years (d=l.08, p<.01).
The last group of significant results come from the affective domain, that is, from
measures of personal behaviour, feelings and thoughts. They are far transfer measures because
the contents of the tests were not similar to those in the FIE materials. There was a significant
effect for Locus of Control-Intellectual Achievement after four and one-half months to one
year of treatment (d-0.33, p<.05). There was also a significant negative finding for General
Motivation, Attitudes and Motivation for Learning 1 year after the end of 2 years o f treatment
(d= -0.48, p<.05). Negative findings indicate that the control groups performed better than the
treatment groups.
To summarize positive combined results, effect sizes for near-transfer measures of
visual perception ranged from less than medium to large. They were mixed for near-transfer
measures of cognitive ability, ranging from large for verbal ability, to medium for full-scale
ability, and small for non-verbal ability. There were small to less than medium effect sizes for
68
mid-transfer measures of general achievement and math achievement. The intellectual
achievement locus of control effect size, a measure of far transfer, was less than medium.
Results for the following were not significantly different from zero: Fu l l Scale Abi l i ty -
Perry and Samuels with 2 years of treatment; Negative Visual Perception; Learning Potential
Assessment Device ( L P A D ) ; Reading Academic Achievement; Math Academic Achievement
with 2 years of treatment and 1 year after treatment ended; Self-Esteem and Confidence in
Personal Success; Academic Self-Confidence; Self-Confidence of Physical Competence and
Appearance; Social Acceptance, Skills and Popularity; Self-Concept; General Motivation and
Attitudes and Motivation for Learning - 4 weeks to 2 years and 2 years; Behaviour; and
Negative (or poor) Behaviour. O f the nonsignificant results listed above, the majority are from
the affective domain.
In addition, one effect size for General Motivation, Attitudes and Motivation for
Learning 1 year after the end of treatment was significantly negative.
Both significant and nonsignificant results reveal important information regarding the
performance o f FIE and wi l l be discussed in Chapter Six.
69

i l
C/5
o g ca u
U
3
CN
cd H
s
3 ^ u —
5 I cj C o
7 e 2 ^
O U J <
O N !
U ,
o <N
1 >>
. ^
, afte
i , a
ftei
c S >> O X)
•J3 cS —
D. i_ tu O o " o o c
CN
CN |
2 £ cS a CS CS ° -2 cs cs b
3 3 S - ' c Ul « ra — h U 3 U
b n- > > > >
O a
« E 'a .2f 53
CS c o D a.
o a CD
•o I B c o CJ
CD CJ e <u
•*-» CD a . £ o CJ
"cS
_o
a.
_CS
O a .
T3 c C3
in c T3 l -
T3 C CS (/I CD
T3 3 -*-»
1 C O
>
CN
SB .5 E C3 CD
15 § S a s '5 iS
8"S
i i n cs : = & c o
CJ ^ n-. -—> T j CJ c
t/3 cs
Q. O o c - 3 O CS
c CO
oo O
5 .2 > CS •3 22 O <D 2
b CN 03
5; CN
CJ cb cs
£ > C N |
'S J 2 S S
e o a . <u o CJ a .
3
> CS * J
» CL,
a
£ '3 OX)
c o
CN
CD
<c cs
60 C
I CJ
£3 CS • l i
b o
c CS
3D be
T3 CJ
•a _3 "3 .3 o a
c CJ CS CJ J3
C/5 O
8 j
70

Chapter Six
Discussion
The research question, stated in Chapter Two, is as follows: H o w far does Instrumental
Enrichment transfer? That is, specifically:
a) Are there significant effect sizes for cognitive tasks such as full scale reasoning ability, and
verbal and nonverbal reasoning ability for students who have participated in Instrumental
Enrichment programs?
b) Are there significant effects for measures of academic achievement and in the affective
domain on measures of self-esteem, self-confidence, self-concept, motivation to learn,
behaviour and attitudes?
c) Are significant effect sizes restricted to tasks similar to those in the FIE curriculum, for
example, visual-spatial tasks, visual-motor tasks and dynamic assessment with the Learning
Potential Assessment Device?
The FIE curriculum consists of lessons with many abstract visual stimuli such as dots,
diagrams, drawings and patterns of shapes. The lessons also involve having students analyze
relationships among these stimuli and describe and explain these relationships. Therefore, for
the purposes of this study, the term "near transfer" w i l l refer to assessments or tasks requiring
similar activities, that is, the examination and rational discussion of abstract visual stimuli and
of ideas. "Far transfer" w i l l refer to more dissimilar activities such as behaviour, attitudes,
self-confidence and self-esteem. Academic achievement is in the middle of the continuum.
This discussion wi l l be confined to effect sizes from combined analyses only, and
Jensen's (n.d.) "near-" and "far-transfer" results w i l l not be discussed since, without knowing
what the exact tasks were, it is not possible to know how closely they resembled those in the
FIE curriculum. In general, results of this meta-analysis support the observation that
71

successful performance on the many measuring instruments used by researchers follow a near-
to far-transfer pattern. There are more significant results for near-transfer measures than for
mid- and far-transfer measures, and for the most part, they are larger.
Before discussing the results, it might be argued that subjects in the studies improved,
not because o f FIE, but simply because they were older when the treatment ended and the
apparent gains were due primarily to development. However, the developmental factor was
controlled with the use of same-aged groups.
The following caveats should be considered while reading the discussion of results in
this chapter and the implications of those results in Chapter Seven.
A s was discussed in Chapter Four, because the studies used for this meta-analysis were
quasi-experimental and not themselves randomly selected we cannot confidently assume that
the results w i l l generalize to the larger population.
Regarding the decision to analyze standardized tests, these measures are normed on a
large population, and it is likely that the majority of that population consists of individuals
who are from average-level l iving conditions. Many of the IE groups consist of individuals
from disadvantaged circumstances, and the standardized measures may not be valid and
reliable with this population. For example, regarding the low results in the affective domain,
there may have been positive changes, but the tests measuring that domain may not have been
appropriate and did not correctly measure these changes. Therefore, caution needs to be used
in interpreting the results.
Regarding the choice of the random effects model to analyze the data, it has been
reported that up to 50% of meta-analyses can suffer from publication bias (Sutton, Duval,
Tweedie, Abrams & Jones, 2000). The random effects model, because it puts heavier weight
on the smaller studies, is more susceptible to publication bias than the fixed model. This is
72

because publication bias mainly implies that small sample null studies are not likely to be
published and are, therefore, missing from a random effects meta-analysis. It is, therefore,
possible that my estimates may be somewhat high because some small sample null studies are
not in my analysis.
Discussion of Results
Near Transfer.
The highest overall collection of significant effect sizes is for Visual Perception
(d=0.42)7, Visual-Motor Abi l i ty (d=0.71), and Visual-Motor Abi l i ty 1 year after treatment
ended (d=l .68). These results reflect the emphasis on visual-spatial material in the FIE
curriculum. In the case of the follow-up result, visual material skills appear to have been
maintained. However, this effect size was based on the results of only two tests and it may not
have been as large i f more tests could have been included.
The next group consists of Non-Verbal Abi l i ty (d=0.24), Fu l l Scale Abi l i ty with 1 and
2 years Of treatment (d=0.5S), and Verbal Abi l i ty (d=l .41). Although the FIE curriculum
presents material visually, it also requires verbal analysis and discourse, and the high verbal
ability effect size likely reflects that. Tests included in the non-verbal ability calculations were
not the same as those for the visual perception calculations described above (see Appendix D).
The tests required reasoning in addition to visual skills. Nevertheless, it is somewhat
surprising that the verbal ability effect size is so much larger than that for non-verbal ability.
Near transfer results were not uniformly significantly positive. Calculations for the
following did not produce significant effect sizes at p<=.05: Fu l l Scale Abi l i ty with 2 years of
treatment, Negative Visual Perception (these were error scores), and the Learning Potential
Assessment Device (LP A D ) with 1 year of treatment, and 1 year after treatment. The L P A D
7 See Chapter Five
73

results were close to being significant (d=0.50,p=.06) in the analysis that combined several
studies, but the effect is of only medium size. The result is puzzling given that Feuerstein and
other authors who supported his theories developed the L P A D , and the materials are similar to
those in FIE. The result suggests the need for further study with the L P A D to evaluate FIE.
Mid-Transfer.
Results for measures of academic achievement were mixed. Calculations for the
following produced significant effect sizes: General Academic Achievement (d=0.26) and
Academic Achievement, Math with 1 and 2 years of treatment (d=0.29. Although significant,
they are fairly small. Calculations for the following were nonsignificant: Academic
Achievement, Reading, with 1 and 2 years of treatment, with 2 years of treatment, and 2 year
after treatment ended; Academic Achievement, Math, with 2 years of treatment and 1 year
after treatment ended. The last two results, for Math, had negative effect sizes that were close
to being statistically significant.
These results are consistent with the near- to far-transfer pattern where subjects
perform better on tasks similar to the content of the FIE curriculum and worse as the tasks
become more dissimilar. In Chapter One various theories of critical thinking were considered,
and it was pointed out that there was debate about whether critical thinking is subject specific
or generalizable across subject areas (see pp. 5-6). Feuerstein belongs to a group that believes
there are general principles of critical thinking and that these should be taught separately from
standard subject areas. However, results from this meta-analysis suggest that these teachings
do not generalize well to other subject areas. This situation w i l l be discussed further in
Chapter Seven.
74

Far Transfer.
Calculations produced a significant positive result for Locus of Control - Intellectual
Achievement (d=0.33). This is a fairly small effect size; however, it suggests that the students
felt they were responsible for their intellectual achievement. There was one other significant
effect size, but it was negative, indicating that the control group had higher scores than the
treatment group. It was for General Motivation, Attitudes and Motivation for Learning 1 year
after treatment ended (d= -0.48). The result was from only one study, however, and may be a
reflection of the particular population of students being tested.
Effect sizes were nonsignificant for General Motivation, Attitudes and Motivation for
Learning in the combined group with 4 weeks to 2 years, and with 2 years, of treatment.
Calculations for the following also resulted in nonsignificant results: Self-Esteem, Confidence
in Personal Success, Academic Self-Confidence, Self-Confidence o f Physical Competence and
Appearance, Social Acceptance, Skills and Popularity, Self-Concept, Behaviour with one year
and 2 years o f treatment and 1 year after treatment, and Negative (that is, poor) Behaviour with
1 and 2 years of treatment and 1 year after treatment.
The above results are important in that they are consistent with the anecdotal reviews
of researchers such as Sternberg (1984) and Sternberg and Bhana (1986). A s reported in
Chapter Two, Sternberg and Bhana believe that FIE trains primarily those abilities that IQ tests
tap rather than a broader spectrum of abilities that go beyond intelligence as the tests measure
it-
Similarly, Savell et al., (1986) noted that FIE effects most commonly reported were
those on certain standard nonverbal measures of intelligence that are largely measures of ski l l
in processing figural and spatial information. They commented that effects on other types of
measures, such as self-esteem, impulsivity, classroom behaviour, academic achievement and
75

course content were absent, inconsistent or difficult to interpret. The results in this meta
analysis support the conclusions of these authors.
Regarding the contention of Frisby and Braden (1992) that social intelligence is highly
modifiable (see Chapter Two, p. 28), these results suggest that social intelligence needs to be
taught in a more direct manner in IE so that it becomes a near-transfer variable that might be
modified more than it appears to have been.
Subgoals of Instrumental Enrichment.
Although they vary, the significant positive results in this meta-analysis appear to
support the first two subgoals of FIE as described at the beginning of Chapter Two. The first
subgoal is the correction of deficient cognitive functions that can be in the input phase of
information processing where necessary information is gathered, the elaboration phase where
the gathered information is used, or the output phase where the solution to a problem is
expressed. The second subgoal is the enrichment of cognitive repertoire, including the
vocabulary, cognitive operations, strategies, concepts and relationships necessary to complete
FIE tasks.
The lack of success on measures in the affective domain is interesting in view of the
last four subgoals of the FIE model. They have to do with the affective domain, that is,
production of intrinsic motivation, the production of reflective, insightful thinking processes
and the change in students' self-perception from being passive recipients of information to that
of being creative originators of new information. The poor results, as reflected in this meta
analysis, could be because, as Sternberg and Bhana (1986) state, those attributes are not built
into the instruction contained in the program. If they were, their measures would fall into the
near-transfer category and positive results might increase.
76

Chapter Seven w i l l provide further discussion as well as suggestions for future research
related to the questions and results in this meta-analysis.
77

Chapter Seven
Implications for Practice and Research
This meta-analysis and its results lead to implications for practice and implications for
research. Regarding educational practice, the results suggest educators can be reasonably
confident that the IE curriculum can create positive changes in students that produce, on
standardized measures:
• large effects for visual-motor ability and verbal ability.
• medium effects for visual perception and full-scale ability, and
• small effects for non-verbal ability, general academic achievement, math (perhaps) and
for a feeling of being responsible for their intellectual achievement.
I believe, however, that the most important implications arise, not from the significant
results, but from the nonsignificant ones. These w i l l be discussed in more detail below.
Implications for Practice
Affective Domain Instruction.
The lack of positive effects in the affective domain suggests that there is a need to
include direct affective domain instruction into IE. In their book on experiential learning and
change, Walter and Marks (1981) discuss a rational restructuring process built upon models of
cognitive psychology, not cognitive ability. Describing one aspect of the change process they
say:
The term re-cognition is introduced here and used to categorize approaches and
mechanisms for changing the way an individual thinks. For example, internalized
problem solving sequences, altered mental verbalizations and imagery, altered
constructs for organizing, and even hypothesis formulation are included in this
discussion, (p. 10)
78

This quotation sounds very similar to those of Feuerstein and his colleagues, yet it
refers to the affective, not the cognitive, domain. FIE encourages students to ask questions,
reason inductively and deductively, give clear solutions to problems in an empathetic manner
(that is, putting themselves "into the shoes" of listeners to be sure the answer w i l l be
understood), justify their opinions, restrain impulsivity and examine relationships in cognitive
situations. However, it does not directly teach students how to work with emotions or attitudes
that may arise as a result of the "cognitive" instruction. There are cognitive-behavioural
methods in psychology that can be used. For example, Stein and Book (2000) provide
exercises to assess and improve performance in the Intrapersonal, Interpersonal, Adaptability,
Stress Management and General Mood realms. B y adding a direct instructional component for
the affective domain, FIE would be introducing a way to address the far-transfer problem.
When researchers measure students' performance in that domain, their measurements would
then be of near-, not far-transfer tasks, and they could provide more positive results.
Counselling.
The lack of positive results in the affective domain also suggests that there is a need to
attach a counselling component to IE instruction. In his text on counselling skills, Egan (1998)
cites several obstacles to effective client self-exploration. He states that, "Digging into one's
inadequacies always leads to a certain amount of disequilibrium, disorganization, and crisis.
But growth takes place at crisis points" (p. 139). Although the FIE curriculum does not "dig
into one's personal inadequacies," as stated above, it does encourage questioning, reasoning,
and giving and justifying opinions. It may be that the low affective domain effect sizes are a
result, not of a defect in FIE, but that it is succeeding to a point where it is bringing students to
that personally felt crisis point where long-lasting change can happen - or be avoided. In
79

addition to direct affective-domain instruction, personal counselling should be offered outside
of the classroom during the FIE program and for some while after it ends.
Another argument in favour of offering counselling to students is that low behaviour,
motivation and attitude scores could also come from students questioning authority as a result
of FIE. Because FIE is customarily taught during early and late adolescent years, it coincides
with a time when adolescents are struggling with issues of identity. According to Marcia
(1966,1980) and Marcia, Waterman, Matteson, Archer, and Orlofsky (1993) young people go
through a period of crisis and decision-making, and depending on the decisions, may, or may
not, achieve full autonomous identity. F IE may enhance, hinder or confuse the process.
Academic Instruction and IE.
Attempts should be made to insert IE instruction into specific academic subject areas,
and the IE instruction should relate to those subjects. In Chapter Six results of mid-transfer
calculations were discussed. General Academic Achievement and one instance of Math
achievement had significant, although small, effect sizes. Other measures of Math and
Reading did not have significant effect sizes, indicating that instruction in IE did not
generalize, or transfer, well to academic instruction. A s discussed in Chapter One, although
Feuerstein belongs to a group that believes the general principles of critical thinking should be
taught separately from other subject areas, other researchers disagree. Ennis (1985b) and
Sternberg (1987) recommend the use of a mixed model of providing a separate critical
thinking course along with the insertion of critical thinking approaches into specific subjects to
reinforce all skills taught. This approach could be used where the IE curriculum is taught
separately while at the same time, its methods are used in subjects such as math and reading.
In this situation, math and reading assessments might become more near-transfer tasks and
students could have higher performance scores.
80

Implications for Research
The LP AD
More studies should be carried out using the L P A D to measure success in Instrumental
Enrichment. In this meta-analysis, L P A D results were not statistically significant, and as
discussed in Chapter Six, this is surprising since Feuerstein and his colleagues designed it, and
many subtests have materials that are similar to those in IE. The L P A D is a "dynamic" test
with three steps. A subtest is first administered to measure initial levels of performance (a
baseline). Second, the assessor gives "training in the form of the teaching of principles of
thought and problem solving as well as modification of specific cognitive process that may be
required in the learning itself (mediated learning experience)" (Feuerstein et al., n.d., p. 2.2).
The third step is the administration of a similar form of the first subtest. The expectation is ,
that there w i l l be an improvement in performance. Scores are not compared to those of a
norming group but are considered to be a measure of the subject's potential level of cognitive
functioning.
Researchers such as Tzuriel and Alfassi (1994) have recommended that in further
Instrumental Enrichment research, a differentiation should be made between performance on
static instruments such as IQ tests and on dynamic measures of performance. If such research
includes the use of the L P A D the results should increase our knowledge of not only
Instrumental Enrichment effectiveness but of whether or not it is most effectively measured
with a static or a dynamic measuring instrument.
Six tentative research questions were proposed in Chapter Two. They arose from the
literature review and represent concerns voiced by researchers and reviewers. This meta
analysis explored one: "How far does Instrumental Enrichment transfer?" Future research
should explore the other five questions to fully evaluate the effectiveness o f IE.
81

Teacher Effectiveness and Bridging.
The first two research questions listed in Chapter Two (see p. 32) have to do with
teachers. The first is: "What is the optimal amount of teacher training required in order to best
teach Instrumental Enrichment?" The second is: "How skilled were teachers with a
mediational teaching style and with bridging, and did this make a difference to student
outcomes?" Few studies have been conducted on the effectiveness of IE teachers, and the
following discussion highlights the need for them.
In his comprehensive evaluation of FIE, Blagg (1991) referred to Annett (1989) who
drew a distinction between "transferable" skills and "transfer" skills. They describe
transferable skills in a manner similar to those of other authors in Chapter One when they
discussed low road transfer that usually occurs in near transfer situations (see p. 7). They are
commonly occurring skills and routines required in many different contexts. The selection and
organization processes involved in using these skills are under the control o f transfer skills that
Annett claims refer to higher level, or executive, metacognitive processes. A s discussed in
Chapter One, these are analogous to the high road transfer often occurring in far transfer
situations. Annett believes it is one thing to demonstrate the acquisition of transferable skills
in particular contexts but another to have the transfer skills to know when to select and use
these lower order processes in novel situations.
Blagg (1991) reported that in his study teachers and students complained about too
much repetition with a lack of novelty and stimulus. Once students had become aware of
implicit rules and learned how to approach the earlier tasks in each curriculum instrument, the
later task pages needed little problem analyses or debate. He wrote that in some cases this
created boredom, but more importantly, "what remained was the practice of particular
procedures (such as systematic search, counting, labelling, and eliminating) tied to artificial
82

exercises remote from everyday experience. Thus, the FIE program was often reduced to
training in transferable skills rather than training for transfer" (p. 147). Although the teacher's
manual did include many examples of transfer or bridging applications, insufficient challenge,
too much repetition, and artificiality in the tasks led to pupils and the teacher not always taking
bridging seriously.
Further Analysis of Data in this Meta-Analysis.
Question Three in Chapter Two asks: "What is the optimal length of time that should
be spent teaching Instrumental Enrichment for best results?" Question Four asks: " H o w many
instruments are needed to produce optimal results?" The last question, six, asks: "What types
of populations benefited from IE instruction? Populations that have been studied include those
related to gender, ethnicity, socioeconomic status, age, physical handicaps, intellectual ability,
learning disabilities, and emotional and behavioural handicaps." It was not possible to analyze
these factors in this meta-analysis because of the complicated nature of the data, time
constraints and the choice of methodology. However, Appendix A contains all the information
necessary to analyze length of time, number of instruments and population data. There are
also quantitative procedures other than the one chosen in this meta-analysis for analyzing
results from existing studies, and any of the six research questions could be analyzed using
these procedures.
Brain Research.
Studies into the effectiveness of cognitive instruction, particularly that focusing on
near- and far-transfer effects, may increase the body of knowledge related to the study of
neuroplasticity. Neuroplasticity refers to the process in which the brain changes
physiologically as a result of experience, and several researchers are investigating that process
in relation to education (for example, Brandt, 1999; Wolfe and Brandt, 1998). It may be
83
possible to demonstrate a physical parallel to near- and far-transfer effects on tasks by using
brain-imaging technologies. For example, Bigler, Lajiness-O'Neill , and Howes (1998)
published P E T (positron emission tomography) photographs of the brain being activated in
four separate areas while hearing words, seeing words, reading words and generating verbs. If
studies can discover which parts of the brain are activated during specific cognitive or
academic tasks, then instruction can be directed more efficiently by using near-transfer
teaching techniques to activate particular areas of the brain.
Limitations of this Study
Limitations of, and problems with, this meta-analysis suggest ways in which meta-
analytic procedures could be improved. Effect sizes were not reported in most studies, and it
was difficult to calculate them because of the way results were reported. Specifically,
statistical descriptions often did not report means, standard deviations or sample sizes. In
addition, some authors did not report non-significant statistical results, making it impossible to
calculate effect sizes. Individual studies should always report effect sizes and confidence
intervals around them as well as their /rvalue. The method by which they were calculated and
descriptive statistics should also be reported so their accuracy can be verified. The Fifth
Edition of the Publication Manual of the American Psychological Association (2001)
recommends these procedures, as does the Task Force on Statistical Inference of the American
Psychological Association (Wilkinson and Task Force, 1999)
In some studies information was not reported on pupil or Instrumental Enrichment
selection procedures or on the teachers' level of training. It was difficult, therefore, to judge
the quality of the studies. Study quality issues should always be reported.
Regarding this meta-analysis, I found it difficult to get some studies. For example,
several universities would not lend theses or dissertations and it would have been prohibitively
84

expensive to purchase them. Some universities also did not respond to Inter Library Loan
requests (see Chapter Four, p. 60). Interested researchers could enlarge and re-calculate the
meta-analysis with the addition of information in these missing studies.
Finally, it is likely that the quality and implementation of the programs used in this
meta-analysis varied considerably, coming from different countries and with different
circumstances regarding schools, subjects and teachers. Therefore, it is probable that the
program is not consistently the same from study to study. This is a curriculum implementation
issue and is beyond the scope of this study; it should be addressed in future research.
85

References
American Psychological Association. (2001). Publication manual of the American Psychological Association (5 t h ed.). Washington, D C : Author.
Annett, J. (1989). Training in transferable skills. Sheffield, England: The Training Agency.
Arbitman-Smith, R., Haywood, H . C . , & Bransford, J.D. (1984). Assessing cognitive change. In P. Brooks, R. Sperber, & C. McCauley (Eds.). Learning and cognition in the mentally retarded, (pp. 433-471). Hillsdale, N J : Erlbaum.
Asher, W . (1990). Educational psychology, research methodology, an meta-analysis. Educational Psychologist, 25, 143-158.
Bachor, D . G . (1988). Do mentally handicapped adults transfer cognitive skills from the instrumental enrichment classroom to other situations or settings? Mental Retardation and Learning Disability Bulletin, 16, 14-28.
Bai l in , S. (1994). Critical thinking: Philosophical issues. In T. Husen & T . N . Postlethwaite (Eds). The international encyclopedia of education (2nd ed., Vols . 1-11, pp. 1204-1208). New York: Pergamon
Bigler, E . D . , Lajiness-O'Neill , R., & Howes, N - L . (1998). Technology in the assessment of learning disability. Journal of Learning Disabilities, 31, 67-82.
Blagg, N . (1991). Can we teach intelligence? A comprehensive evaluation of Feuerstein's Instrumental Program. Hillsdale, N J : Erlbaum.
Blatz, C . V . (1992). Contextual limits on reasoning and testing for critical thinking. In S.P. Norris (Ed.), The generalizability of critical thinking: Multiple perspectives on an educational ideal, (pp. 198-205). N e w York: Teachers College Press.
Bradley, T . B . (1983). Remediation of cognitive deficits: A critical appraisal o f the Feuerstein model. Journal of Mental Deficiency Research, 27, 79-92.
Brandt, R. (1999). Educators need to know about the human brain. Phi Delta Kappan, 81, 235-238.
Burden, R. (1987). Feuerstein's Instrumental Enrichment Programme: Important issues in research and evaluation. European Journal of Psychology of Education, 11(1), 3-16.
Campbell, D.T. , & Stanley, J.C. (1963). Experimental and quasi-experimental designs for research. Chicago: Rand McNal ly .
Cohen, J. (1988). Statistical power analysis for the behavioral sciences ( 2 n d ed.). Hillsdale, N J : Erlbaum
86

Cooper, H . (1998). Synthesizing Research: A guide for literature reviews. (3 r ed.). Thousand Oaks, C A : Sage.
Cronbach, L . J . , & Meehl, P .E. (1955). Construct validity in psychological tests. Psychological Bulletin, 52, 281-302
Das, J.P., & Conway, R. (1992). Reflections on remediation and transfer: A Vygotskian perspective. In H . C. Haywood & D . Tzuriel (Eds.), Interactive assessment (pp. 94-115). N e w York: Springer-Verlag.
Dewey, J. (1933). How we think. Boston: D . C . Heath.
Egan, G . (1998). The skilled helper: A problem-management approach to helping. Pacific Grove, C A : Brooks/Cole.
Egozi , M . (1991). Instrumental Enrichment and mediation. In R. Feuerstein, P. Kle in , & A.Tannenbaum (Eds.), Mediated learning experience (MLE): Theoretical, psychosocial and learning implications (pp. 347-364). London: Freund Publishing House.
Emerson. L . W . (1991). M L E and American Indian education. In R. Feuerstein, P. Kle in , & A.Tannenbaum (Eds.), Mediated learning experience (MLE): Theoretical, psychosocial and learning implications (pp. 133-156). London: Freund Publishing House.
Ennis, R . H . (1985a). A logical basis for measuring critical thinking skills. Educational Leadership, 43, 44-48.
Ennis, R . H . (1985b). Critical thinking and the curriculum. National Forum, 65, 28-31.
Ennis, R . H . (1992). A concept of critical thinking. Harvard Educational Review, 32, 81-111.
Eysenck, J .H . (1978). A n exercise in mega-silliness [Letter]. Psychological Bulletin, 85, 517.
Eysenck, H . (1988). The concept of "intelligence": Useful or useless? Intelligence, 12, 1-16.
Feuerstein, R., & Feuerstein, S. (1991). Mediated learning experience: A theoretical review. In R. Feuerstein, P. Kle in , & A.Tannenbaum (Eds.), Mediated learning experience (MLE): Psychosocial and learning implications (pp. 3-51) . London: Freund Publishing House.
Feuerstein, R., Feuerstein, R., & Gross, S. (1997). The learning potential assessment device. In D.P . Flanagan, J .L. Genshaft & P .L . Harrison (Eds.), Contemporary intellectual assessment: Theories, tests, and issues (pp. 297-311). N e w York: Guilford Press.
Feuerstein, R., & Hoffman, M . B . (1982). Intergenerational conflict of rights: Cultural imposition and self-realization. Viewpoints in Teaching and Learning, 58, 44-63.
87

Feuerstein, R., Hoffman, M . B . , Rand, Y . , Jensen, M . R . , Tzuriel, D . , & Hoffman, D . B . (1986). Learning to learn: Mediated learning experiences and instrumental enrichment. Special Services in the Schools, 3, 49-82.
Feuerstein, R., Kle in , P. & Tannenbaum, A . (Eds.). (1991). Mediated learning experience (MLE): Psychosocial and learning implications. London: Freund Publishing House.
Feuerstein, R., Mi l le r , R., Hoffman, M . B . , Rand, Y , Mintzker, Y . , & Jensen, M . R . (1981). Cognitive modifiability in adolescence: Cognitive structure and the effects of intervention. Journal of Special Education, 15, 269-287.
Feuerstein, R., Rand, Y . , Haywood, H . C . , Hoffman, M . B . , & Jensen, M . R . (n.d.). L.P.A.D. Learning potential assessment device, experimental version. Jerusalem: Hadassah-Wizo-Canada-Research Institute.
Feuerstein, R., Rand, Y . , & Hoffman, M . B . (1979). The dynamic assessment of retarded performers: The Learning Potential Assessment Device: Theory, instruments and techniques. Baltimore: University Park Press.
Feuerstein, R., Rand, Y . , Hoffman, Malka, Hoffman, Mendel, & Mil le r , R. (1979). Cognitive modifiability in retarded adolescents: Effects of instrumental enrichment. American Journal of Mental Deficiency, 6, 519-550.
Feuerstein, R., Rand, Y . , Hoffman, M . B . , & Mil le r , R. (1980). Instrumental Enrichment: An intervention program for cognitive modifiability. Baltimore: University Park Press.
Feuerstein, R., Rand, Y . , Jensen, M . R . , Kaniel , S., & Tzuriel, D . (1987). Prerequisites for assessment of learning potential: The L P A D model. In. C S . L idz (Ed.), Dynamic assessment (pp. 35-51). New York: Guilford.
Fisher, R . A . (1932). Statistical methods for research workers (4 t h ed.). London: Oliver and Boyd.
Frisby, C . L . , & Braden, J.P. (1992). Feuerstein's dynamic assessment approach: A semantic, logical, and empirical critique. Journal of Special Education, 3, 281-301.
Gallo, P.S. (1978). Meta-analysis - a mixed meta-phor. American Psychologist, 33, 515-517.
Glass, G . V . (1976). Primary, secondary, and meta-analysis of research. Educational Researcher, 5, 3-8.
Glass, G . V . (1977). Integrating findings: The meta-analysis of research. In L . S . Shulman (Ed.), Review of research in education 5 (pp. 351-379). Itasca, IL : Peacock Publishers.
Glass, G . V . , M c G a w , B . , & Smith, M . L . (1981). Meta-analysis in social research. Beverly Hi l l s , C A : Sage.
88

Greenberg, K . H . , & Woodside, M . R . (1994). Differences in the degree of mediated learning and classroom interaction structure for trained and untrained teachers. Journal of Classroom Interaction, 2(2), 1-9).
Greenhouse, J .B. , & Iyengar, S. (1994). Sensitivity analysis and diagnostics. In H . Cooper & L . V . Hedges (Eds.), The handbook of research synthesis (pp. 393-396). N e w York, N Y : Russell Sage.
Hal l , J .A. , Rosenthal, R., Tickle-Degnen, L . , & Mosteller, F. (1994). Hypotheses and problems in research synthesis. In H . Cooper & L . V . Hedges (Eds.), The handbook of research synthesis (pp. 17-28). New York, N Y : Russell Sage.
Hammil l , D . D . (1993). A brief look at the learning disabilities movement in the United States. Journal of Learning Disabilities, 26, 295-310.
Haywood, H . C . (1977). A cognitive approach to the education of retarded children. Peabody Journal of Education, 54, 110-116.
Haywood, H . C . (1987). A mediational teaching style. The Thinking Teacher, 4(1), 1-6.
Haywood, H . C , Arbitman-Smith, R., Bransford, J.D., Towery, J.R., Hannel, I.L., & Hannel, M . V . (1982). Cognitive education with adolescents: evaluation of Instrumental Enrichment. Paper presented at Symposium of 6th I .A .S .S .M.D. , Toronto.
Haywood, H . C , Brown, A . L . , & Wingenfeld, S. (1990). Dynamic approaches to psycho-educational assessment. School Psychology Review, 19, AM-All.
Haywood, H . C , Towery-Woolsey, J., Arbitman-Smith, R., & Aldridge, A . H . (1988). Cognitive education with deaf adolescents: Effects of instrumental enrichment. Topics in Language Disorders, 8, 23-40.
Haywood, H . C , Tzuriel, D . , & Vaught, S.R. (1992). Psychoeducational assessment from a transactional perspective. In H . C . Haywood & D . Tzuriel (Eds.), Interactive assessment (pp. 38-63). New York: Springer-Verlag.
Hedges, L . V . (1981). Distribution theory for Glass's estimator of effect size and related estimators. Journal of Educational Statistics, 6, 107-128.
Hedges, L . V . (1982). Estimation of effect sizes from a series of independent experiments. Psychological Bulletin, 92, 490-499.
Hedges, L . V . , (1994). Statistical considerations. In H . Cooper & L . V . Hedges (Eds.), The handbook of research synthesis (pp. 29-38). N e w York, N Y : Russell Sage.
Hedges, L . V . (1986). Issues in meta-analysis. In E .Z . Rothkopf (Ed.), Review of research in education, N o . 13 (pp. 353-398). Washington, D C : American Educational Research Association.
89

Hedges, L . V . , & Olkin , I. (1985). Statistical methods for meta-analysis. Toronto: Academic Press.
Hunter, J.E., & Schmidt, F . L . (1990). Methods of meta-analysis: Correcting error and bias in research findings. Newbury Park, C A : Sage.
Jensen, M . R . (n.d.). Cognitive modifiability and Instrumental Enrichment: A controlled evaluation of a classroom-based intervention model. Unpublished manuscript. Delphi Health & Science, and The National Center for Mediated Learning, Atlanta, G A .
Jensen, M . , Feuerstein, R., Rand, Y . , Kaniel, S., & Tzuriel, D . (1988). Cultural difference and cultural deprivation: A theoretical framework for differential intervention. In R . M . Gupta & P. Coxhead (Eds.), Cultural diversity and learning efficiency (pp. 64-88). M a c M i l l a n Press.
Johnson, R . H (1992). The problem of defining critical thinking. In S.P. Norris (Ed.), The generalizability of critical thinking: Multiple perspectives on an educational ideal. (pp. 198-205). N e w York: Teachers College Press.
Kaniel , S., & Feuerstein, R. (1989). Special needs of children with learning difficulties. Oxford Review of Education, 15, 165-179.
Kennedy, M . , Fisher, M . B . , & Ennis, R . H . (1991). Critical thinking: Literature review and needed research. In L . Idol & B . F . Jones (Eds.), Educational values and cognitive instruction: Implications for reform (pp. 11-40). Hillsdale, N J : Lawrence Erlbaum Associates.
Kopp-Greenberg, K . H . (1991). A model for providing intensive mediated learning experience in preschool settings. In R. Feuerstein, P. Kle in , & A.Tannenbaum (Eds.), Mediated learning experience (MLE): Psychosocial and learning implications (pp. 241-258).. London: Freund Publishing House.
Ku l ik , J .A. , & Kul ik , C - L . C . (1989). Meta-analysis in education. International Journal of Educational Research, 13, 221-340.
L 'Abbe, K . A . , Detsky, A . S , and O'Rourke, K . (1987). Meta-analysis in clinical research. Annals of Internal Medicine, 107, 224-233.
L idz , C S . (1991). M L E components and their roots in theory and research. In R. Feuerstein, P. Kle in , & A.Tannenbaum (Eds.), Mediated learning experience (MLE): Psychosocial and learning implications (pp. 271-291). London: Freund Publishing House.
Light, R.J . , & Pillemer, D . B . (1984). Summing up: The science of reviewing research. Cambridge, M A : Harvard University Press.
Link, F.R. (1991). Instrumental Enrichment. In A . L . Costa (Ed.), Developing minds: programs for teaching thinking: (Vol. 2 Rev. Ed. , pp. 9-11). Alexandria, V A : Association for Supervision and Curriculum Development.
90

McPeck, J. (1981). Critical thinking and education. New York: St. Martin's Press.
McPeck, J. (1990). Critical thinking and subject specificity: A reply to Ennis. Educational Researcher, 19(5), 10-12.
McPeck, J. (1992). Thoughts on subject specificity. In S.P. Norris (Ed.), The generalizability of critical thinking: Multiple perspectives on an educational ideal, (pp. 198-205). N e w York: Teachers College Press.
Marcia, J .E. (1966). Development and validation of ego-identity status. Journal of Personality and Social Psychology, 3, 551-558.
Marcia, J .E. (1980). Identity in adolescence. In J. Adelson (Ed.), Handbook of adolescent psychology. New York: Wiley.
Marcia, J.E., Waterman, A . S . , Matteson, D.R. , Archer, S.L., & Orlofsky, J .L. (1993). Ego identiry: A handbook for psychosocial research. New York: Springer-Verlag.
Missiuma, C , & Samuels, M . (1988). Dynamic assessment: Review and critique. Special Services in the Schools, 5(1-2), 1-22.
Neisser, U . , Boodoo, G . , Bouchard, T., Boykin, A . W . , Brody, N . , Ceci , S., Halpern, D . , Loehlin, J., Perloff, R., Sternberg, R., & Urbina, S. (1996). Intelligence: Knowns and unknowns. American Psychologist, 51, 77-101.
Norris, S.P. (1992). Introduction: The generalizability question. In S.P. Norris (Ed.), The generalizability of critical thinking: Multiple perspectives on an educational ideal. (pp. 1-15). N e w York: Teachers College Press.
Orwin, R . G . (1983). A fail-safe ./V for effect size in meta-analysis. Journal of Educational Statistics, 8, 157-159.
Orwin, R . G . (1994). Evaluating coding decisions. In H . Cooper & L . V . Hedges (Eds.), The handbook of research synthesis (pp. 139-162). N e w York, N Y : Russell Sage.
Perkins, D . N . , & Salomon, G . (1987). Transfer and teaching thinking. In D . N . Perkins, J. Lochhead & J. Bishop (Eds.), Thinking: The second international conference. Hillsdale, N J : Erlbaum
Perkins, D . N . , & Salomon, G . (1994). In T. Husen, & T . N . Postlethwaite, (Eds.), The international encyclopedia of education (2nd ed., Vols . 1-11, pp. 2916-2922). N e w York: Pergamon
Perry, J .L. (1986). Field initiated research: A field based study of the effects of an educational program on school adjustment of mildly handicapped secondary school students. Final report. Raleigh, N C : Wake County Public School System. (ERIC Document Reproduction Service N o . E D 312 848)
91

Petitti, D . B . (1994). Meta-analysis, decision analysis, and cost-effectiveness analysis. N e w York: Oxford University Press.
Piaget, J. (1952). The origin of intelligence in children. New York: International Universities Press.
Piaget, J. (1971). The theory of stages in cognitive development. In D.R. Green, M . P . Ford, & G . B . Flamer (Eds.), Measurement of Piaget. M c G r a w - H i l l .
Piaget, J. (1985). The equilibrium of cognitive structures: The central problem of intellectual development (T. Brown & K . Julian Thampy, Trans.). Chicago: University of Chicago Press.
Presby, S. (1978). Overly broad categories observe important differences between therapies. American Psychologist, 33, 514-515.
The Psychological Corporation. (1997). Wechsler Adult Intelligence Scale - Third Edition, Wechsler Memory Scale - Third Edition: Technical manual. Toronto, O N : Harcourt Brace.
Rand, Y . , Tannenbaum, A . , & Feuerstein, R. (1979). Effects of instrumental enrichment on the psychoeducational development of low-functioning adolescents. Journal of Educational Psychology, 77,751-763.
Rey, A . (1934). D'un procede pour evaluer l'educabilite (quelques applications en psychopathologie) [A procedure for assessing educability (some applications to psychopathology)]. Archives de Psychologie, 24, 297-337.
Rey, A . (1962). Etude des insuffisances psychollgiques. II: La sysematisation des observations [The study of psychological deficits. II: The systemization of observations]. Neuchatell: Delachaux et Niestle.
Rosenthal, R. (1979). The "file drawer" problem and tolerance for null results. Psychological Bulletin, 86, 638-641.
Rosenthal, R. (1984). Meta-analytic procedures for social research. Newbury Park: Sage.
Rosenthal, R. (1991). Meta-analytic procedures for social research: Applied Social Research Methods Series. (Vol . 6). Newbury Park: Sage.
Salomon, G . , & Perkins, D . N . (1989). Rocky roads to transfer: Rethinking mechanisms of a neglected phenomenon. Educational Psychology, 81, 113-142.
Samuels M . T., & Conte, R. (1987). Instrumental Enrichment with learning disabled adolescents: Is it effective? Journal of Practical Approaches to Developmental Handicap, 11, 4-6.
92

Samuels, M . , K le in , P., & Haywood, H . C . (1994) Cognitive modifiability. In T. Husen, & T . N . Postlethwaite, (Eds.), The international encyclopedia of education (2nd ed., Vols . 1-11, pp. 857-861). N e w York: Pergamon
Samuels, M . , Kle in , P., & Haywood, H . C . (1995). Cognitive modifiability. Cognitive Education, 6(\), 3-7.
Savell, J . M . , Twohig, P.T., & Rachford, D . L . (1986). Empirical status of Feuerstein's "Instrumental Enrichment" (FIE) technique as a method of teaching thinking skills. Review of Educational Research, 56, 381-409.
Schmidt, F . L . (1992). What do data really mean? Research findings, meta-analysis, and cumulative knowledge in psychology. American Psychologist, 10, 1173-1181.
Secada, W . G . (1991) Student diversity and mathematics education reform. In L . Idol & B . F . Jones (Eds.), Educational values and cognitive instruction: Implications for reform (pp. 297-332). Hillsdale, N J : Lawrence Erlbaum Associates.
Sewell, T., & Price, V . (1991). Mediated learning experience: Implications for achievement motivation and cognitive performance in low socio-economic and minority children. In R. Feuerstein, P. Kle in , & A.Tannenbaum (Eds.), Mediated learning experience (MLE): Psychosocial and learning implications (pp. 295-314). London: Freund Publishing House.
Shayer, M . , & Beasley, F. (1987). Does instrumental enrichment work? British Educational Research Journal, 13, 101-119.
Siegel, H . (1992). The generalizability of critical thinking skills: Dispositions, and epistemology. In S.P. Norris (Ed.), The generalizability of critical thinking: Multiple perspectives on an educational ideal, (pp.97-108). New York: Teachers College Press.
Slavin, R . E . (1986). Best-evidence synthesis: A n alternative to meta-analysis and traditional reviews. Educational Researcher, 15, 5-11.
Stein, S.J., & Book, H . E . (2000). The EQ edge: Emotional intelligence and your success. Toronto: Stoddard Publishing.
Sternberg, R.J . (1984). H o w can we teach intelligence? Educational Leadership, (September) 38-48.
Sternberg, R.J . (1987). Questions and answers about the nature and teaching of thinking skills. In J .B. Baron & R.J . Sternberg (Eds.), Teaching thinking skills: Theory and practice (pp. 251-259). N e w York: Freeman.
Sternberg, R.J . (1994). Commentary: Reforming school reform: Comments on Multiple Intelligences: The theory in practice. Teachers College Record, 95, 561-569.
93

Sternberg, R.J . (1996). Myths, countermyths, and truths about intelligence. Educational Researcher, 25, 11-16.
Sternberg, R.J . , & Bhana, K . (1986). Synthesis of research on the effectiveness of intellectual skills programs: Snake-oil remedies or miracle cures? Educational Leadership, 44, 60-67.
Stock, W . A . (1994). Systematic coding for research synthesis. In H . Cooper & L . V . Hedges (Eds.), The handbook of research synthesis (pp. 125-138). New York, N Y : Russell Sage.
Sutton, A . J . , Duval, S.J., Tweedie, K . R . , Abrams, K . R . , & Jones, D.R. (2000). Empirical assessment of effect of publication bias on meta-analyses. British Medical Journal, 320, 1574-1577.
Swartz, R.J . (1987). Teaching and thinking: A developmental model for the infusion of thinking skills into mainstream instruction. In J .B. Baron & R.J . Sternberg (Eds.), Teaching thinking skills: Theory and practice (pp. 106-126). N e w York: W . H . Freeman.
Tzuriel, D . (1991). Cognitive modifieability, mediated learning experience and affective-motivational processes: A transactional Approach. In R. Feuerstein, P. Kle in , & A.Tannenbaum (Eds.), Mediated learning experience (MLE): Psychosocial and learning implications (pp. 95-120). London: Freund Publishing House.
Tzuriel, D . , & Alfassi, M . (1994). Cognitive and motivational modifiability as a function of the instrumental enrichment (IE) program. Special Services in the Schools, 8, 91-128.
Tzuriel, D . , & Haywood, H . C . (1992). The development of interactive-dynamic approaches to assessment of learning potential. In H . C. Haywood & D . Tzuriel (Eds.), Interactive assessment (pp. 3-37). N e w York: Springer-Verlag. .
Vancouver School District (n.d.). Feuerstein's Instrumental Enrichment Curriculum Training Handbook. Vancouver, B C : Author.
Vygotsky, L . S . (1962). Thought and language. Cambridge, M A : M I T Press.
Vygotsky, L . S . (1978). Mind in society: The development of higher psychological processes. ( M . Cole, V . John-Steiner, S. Scribner, & E . Souberman Eds., and trans.). Cambridge, M A : Harvard University Press.
Walter, G . A . , & Marks, S.E. (1981). Experiental learning and change: Theory design and practice. Toronto: Wiley.
Wechsler, D . (1944). The measurement of adult intelligence (3 r d ed.). Baltimore: Will iams & Wilkins .
94

Wechsler, D . (1975). Intelligence defined and undefined: A relativistic appraisal. American Psychologist, 30, 135-139.
Wilgosh, L . , & Mulcahy, R. (1993). Cognitive educational models of assessment, programming and instruction for native learners. Journal of Native Education, 20, 129-135.
Wilkinson, L . , & Task Force on Statistical Inference. (1999). Statistical methods in psychology journals: Guidelines and Explanations. American Psychologist, 54, 594-604.
Wolf, F . M . (1986). Meta-analysis: Quantitative methods for research synthesis. Beverly Hi l l s : Sage.
Wolfe, P., & Brandt, R. (1998). What do we know from brain research? Educational Leadership, 56, 8-13.
Yates, S. (1987). Instrumental enrichment: A strategy for modifying cognitive ability. Australian Journal of Special Education, 11, 15-27.
95

Appendix A
Summary of Studies Used, Measures and Effect Sizes
Arbitman-Smith, R., & Haywood, H . C . (1980). Cognitive education for learning-disabled adolescents. Journal of Abnormal Child Psychology, 8, 51-64.
Ethnicity: Socio-economic Status: Age: Grade level: Ability/Achievement Level: Population: Gender: Length of Treatment: FIE Instruments Used: Design: Instructor: Control Group:
American, mixed M i x e d 10-11, approximately 5,6 Mixed Learning disabled M i x e d 1 hour a day for 60 hours. Less than 1 year. Four instruments. Unknown which were used Pre-Post, Treatment Control Not classroom teacher Regular curriculum
A l l fifth- and sixth-grade students were rank-ordered on two IQ tests and were alternately assigned to either treatment or control groups. Data were reported only for those measures that showed a significant, positive, effect for the treatment group (IE). Information regarding teacher training was not reported.
Dependent Measures: > Hiskey-Nebraska Test of Learning Aptitude (Hiskey, 1966). Spatial Reasoning
subtest. o Picture Identification subtest. Not used because F-test results were non
significant and data were not reported, o Ten items from the Verbal Analogies Test (Schlesinger and Shalom, Israel). Not
used because it was an informal measure, no differences were found between IE and control groups, and data were not reported,
o Raven's Standard Progressive Matrices. Not used because analysis of the pre- and post intervention scores failed to demonstrate differential gains between the two groups. Data were not reported,
o Test of Social Inference (Edmonson, de Jung, Leland, & Leach, 1974). Ten items were selected. Not used because it was an informal measure and total scores did not reveal a significant difference between the two groups. N o data were reported for the total scores.
Effect Sizes Confidence Confidence
Test E.S.8 2-tailed p Interval - Minus Interval - Plus9
Hiskey-Nebraska, Spatial Reasoning 0.7362
Unable to calculate as only F-statistics were reported.
8 Effect Size (Unbiased d) 9
Confidence intervals are set at 0.95 96
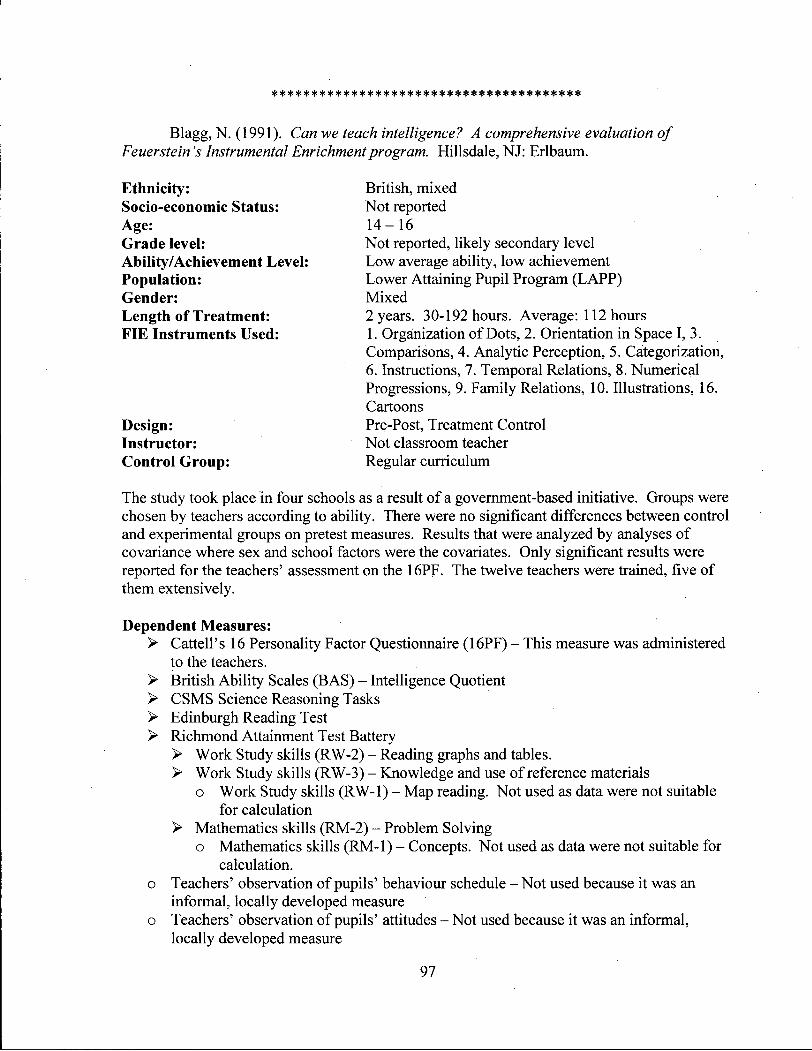
Blagg, N . (1991). Can we teach intelligence? A comprehensive evaluation of Feuerstein's Instrumental Enrichment program. Hillsdale, N J : Erlbaum.
The study took place in four schools as a result of a government-based initiative. Groups were chosen by teachers according to ability. There were no significant differences between control and experimental groups on pretest measures. Results that were analyzed by analyses of covariance where sex and school factors were the covariates. Only significant results were reported for the teachers' assessment on the 16PF. The twelve teachers were trained, five of them extensively.
Dependent Measures: > Cattell's 16 Personality Factor Questionnaire (16PF) - This measure was administered
to the teachers. > British Abi l i ty Scales ( B A S ) - Intelligence Quotient > C S M S Science Reasoning Tasks > Edinburgh Reading Test > Richmond Attainment Test Battery
> Work Study skills (RW-2) - Reading graphs and tables. > Work Study skills (RW-3) - Knowledge and use of reference materials
o Work Study skills (RW-1) - Map reading. Not used as data were not suitable for calculation
> Mathematics skills (RM-2) - Problem Solving o Mathematics skills (RM-1) - Concepts. Not used as data were not suitable for
calculation. o Teachers' observation of pupils' behaviour schedule - Not used because it was an
informal, locally developed measure o Teachers' observation of pupils' attitudes - Not used because it was an informal,
locally developed measure
Ethnicity: Socio-economic Status: Age: Grade level: Ability/Achievement Level: Population: Gender: Length of Treatment: FIE Instruments Used:
British, mixed Not reported 1 4 - 1 6
Design: Instructor: Control Group:
Not reported, likely secondary level L o w average ability, low achievement Lower Attaining Pupil Program ( L A P P ) Mixed 2 years. 30-192 hours. Average: 112 hours 1. Organization of Dots, 2. Orientation in Space I, 3. Comparisons, 4. Analytic Perception, 5. Categorization, 6. Instructions, 7. Temporal Relations, 8. Numerical Progressions, 9. Family Relations, 10. Illustrations, 16. Cartoons Pre-Post, Treatment Control Not classroom teacher Regular curriculum
97

o Coopersmith Self-Esteem Scale (Anglicized) - Not used because Wilcoxon Sign Rank scores were graphed. It was not possible to analyze the results,
o Pupils ' attitudes toward school work - Not used because informal, locally developed rating scales were used,
o Three Semantic-Differential Scales administered to teachers: Myse l f as a Teacher, The Characteristics of Less Academic Pupils, Attitudes Towards Instrumental Enrichment -Not used because it was an informal, locally developed measure.
Effect Sizes Confidence Confidence
Test E.S. 2-tailed p Interval - Minus Interval - Plus BAS IQ Score
0.0438 Unable to calculate as only F-statistics were reported.
Edinburgh Reading Test 0.0435
Unable to calculate as only F-statistics were reported.
Richmond RM2 - Math Problem Solving 0.3520
Unable to calculate as only F-statistics were reported.
CSMS Science Reasoning 0.1602
Unable to calculate as only F-statistics were reported.
Richmond RW2 - Reference Materials 0.2403
Unable to calculate as only F-statistics were reported.
Richmond RW3 - Reference Materials 0.0394
Unable to calculate as only F-statistics were reported.
16PF - Teachers (Low = Humble, High = Assertive) 1.2270
Unable to calculate as only t-statistics were reported.
16PF - Teachers (Low = Tough-Minded, High = Tender-Minded) -1.0661
Unable to calculate as only t-statistics were reported.
16PF - Teachers (Low = Trusting, High = Suspicious) 0.9876
Unable to calculate as only t-statistics were reported.
Brainin, S.S. (1982). The effects of Instrumental Enrichment on the reasoning abilities, reading achievement and task orientation of sixth grade underachievers. Unpublished doctoral dissertation, Columbia University, New York.
Ethnicity: Socio-economic Status: Age: Grade level: Ability/Achievement Level: Population: Gender: Length of Treatment: FIE Instruments Used:
Design: Instructor: Control Group:
American, mixed L o w 11 - 12 Grade 6 L o w Underachievers Mixed 1 year, 59 hours 1. Organization of Dots, 2. Orientation in Space I, 3. Comparisons, and one-third of 4. Analytic Perception Pre-Post, Treatment Control Not classroom teacher Regular curriculum
98

Students were randomly assigned to "small core" classes. Treatment and control teachers were selected without regard to their class composition. Treatment and Control groups were independent. Tests analyzed were good ones. The two experimental teachers received approximately 30 hours of training during the school year. In addition, the investigator, an educational psychologist trained and experienced in IE, paid ten visits to the experimental classrooms during the course of the study observing and assisting.
Dependent Measures: > Thorndike-Hagen Cognitive Abilities Test, Level C , Non-Verbal Battery. > Comprehensive Test of Basic Skills (CTBS) - Total reading score. o Criterion-Referenced Test (CRT) - Not used because it was locally developed and
criterion-referenced. o Devereux Elementary School Behavior Rating Scales ( D E S B R S ) - Not used because
only gain scores were reported.
Effect Sizes
Test E.S. 2-tailed p Confidence Confidence
Interval - Minus Interval - Plus Thorndike-Hagen, Nonverbal 0.3221 0.2670 -0.2444 0.8886 Comprehensive TBS - Reading -0.3877 0.2380 -1.0330 0.2578
Bruce, J. , & Martin, D . (1984). Cognitive improvement of hearing-impaired high school students through instruction in Instrumental Enrichment. Working paper presented at the International Symposium on Cognition, Education, and Deafness, Gallaudet College, Washington, D C . (ERIC Document Reproduction Service No . E D 247 725)
Ethnicity: Socio-economic Status: Age: Grade level: Ability/Achievement Level: Population: Gender: Length of Treatment: FIE Instruments Used:
Design: Instructor: Control Group:
American, mixed Caucasian and Black Not stated Average for IE: 16.4, average for control: 16.7 Secondary M i x e d Hearing Impaired Mainly female 1 year
Four instruments: parts-wholes, comparison (3. Comparisons), projection of virtual relationships, spatial relationships (2. Orientation in Space I) Pre-Post, Treatment Control Not classroom teacher Regular curriculum
Experimental and control groups were matched on the bases of sex, age and level of class placement (remedial, regular or advanced placement). Experimental teachers completed an intensive six-day training session.
99

Dependent Measures: > Raven's Progressive Matrices - abstract reasoning, non-verbal > K i t of Factor Referenced Cognitive Test ( K F R C T ) - Diagramming Relationships and
Letter Sets - abstract reasoning, "verbal" o Written problem solutions - Not used because it was locally developed o Teacher observation checklist - Not used because it was locally developed o Stanford Achievement Test, Hearing Impaired Version (SAT-HI) - Reading
Comprehension, Math Concepts and Math Computation - Not used because data were not reported
Effect Sizes Confidence Confidence
Test E.S. 2-tailed p Interval - Minus Interval - Plus KFRCT - Diagramming Relationships Unable to calculate as only F-statistics were
0.1981 reported. KFRCT - Letter Sets Unable to calculate as only F-statistics were
0.2526 reported. Raven's Progressive Matrices Unable to calculate as only F-statistics were
0.5128 reported
Church, S. (1994). A longitudinal study of the effects of Feuerstein's Instrumental Enrichment on intersensory integration, academic achievement and referral for special education programs. Unpublished doctoral dissertation, University of Oklahoma, Norman.
Ethnicity: Socio-economic Status: Age: Grade level: Ability/Achievement Level: Population: Gender: Length of Treatment: FIE Instruments Used:
Design:
Instructor: Control Group:
American, mixed M i x e d Approximately 9 at the beginning of the study 4 L o w reading and gifted Special Education students Mixed 1 year, 64 hours plus 2, 3 and 4 year follow-up testing 1. Organization of Dots, 2. Orientation in Space I, 3. Comparisons, 4. Analytic Perception Pre-Post, Treatment Control, Longitudinal testing at the end of grades 4, 5, 6, and 7 Not classroom teacher Regular curriculum
A pre-post design with longitudinal measurement. The treatment group had mainly special education students. Control group was compared with N C E scores from the previous year and no significant difference was found between the two groups. Tests were good ones. Instruction was conducted by a trained IE instructor on an itinerant basis.
Dependent Measures: > Bender Gestalt Visual Motor Integration Test. Elizabeth Koppitz (1958) standardized
developmental age scoring system was used.
100

o Scores were not analyzed at the end of the first year because they were for only the experimental group with no control comparison.
> Visual Aural Digit Span ( V A D S ) Test (Koppitz, 1977). > Iowa Test of Basic Skills (ITBS).
Effect Sizes End of Treatment Year
Confidence Confidence Test E.S. 2-tailed p Interval - Minus Interval - Plus
Bender Gestalt Visual Motor Integration 1.0581
Unable to calculate as only F-statistics were reported.
Visual Aural Digit Span (VADS) 0.5440
Unable to calculate as only F-statistics were reported.
Iowa Test of Basic Skills -0.0645 0.8026 -0.5624 0.4335
Follow-up 1 Year After Treatment Bender Gestalt 1.6775 0.00001** 0.9743 2.3808 Visual Aural Digit Span 1.2051 0.0002** 0.5477 1.8626 Iowa Test of Basic Skills 0.3700 0.2340 -0.2400 0.9800
Follow-up 2 Years After Treatment Iowa Test of Basic Skills 0.3584 0.2502 -0.2513 0.9681
Follow-up 3 Years After Treatment Iowa Test of Basic Skills 0.8894 0.0062** 0.2553 1.5235
Eichler, P.J.S. (1994). A study of a cognitive developmental intervention for troubled or troubling adolescents. Unpublished doctoral dissertation, Peabody College of Vanderbilt University, Nashville, T N .
Ethnicity: Socio-economic Status: Age: Grade level: Ability/Achievement Level: Population:
Gender: Length of Treatment: FIE Instruments Used: Design: Instructor: Control Group:
American, mixed L o w to Middle 1 4 - 1 8 Institute of Learning Research (ILR) L o w to Average Seriously Emotionally Disturbed (SED), Behaviour Disordered (BD), Learning Disabled (LD) Mixed 4 - 6 weeks 4. Analytic Perception Pre-Post, Treatment Control Not classroom teacher - Experimenter Regular curriculum
Students were paired by learning disabilities, sex, age, race and IQ, and then randomly divided into two groups. One was designated as control and the other as experimental. Statistical analysis was analyzed using the Wilcoxon Matched-Pairs Signed-Ranks test. However, raw
101

scores were reported for each group and it was possible to calculate means and standard deviations. The experimenter was well trained in the use of the L P A D and IE teaching methods. The researcher taught IE and administered the tests.
Dependent Measures: > Watson-Glaser Critical Thinking Appraisal, Form A ( C T A - A ) (1966, 1977, 1980) -
Assesses cognitive functions. > Learning Potential Assessment Device ( L P A D ) (Feuerstein, 1979) - Set Variations I
and Representational Stencil Design tests (RSTD) > Picture Motivation Scale (PMS) (Kunca & Haywood, 1969) - Intrinsic motivation > The Maze Task (Delclos & Haywood. Reported in Haywood & Switzky, 1986) -
Intrinsic Motivation
Effect Sizes Confidence Confidence
Test E.S. 2-tailed p Interval - Minus Interval - Plus LP AD - Set Variations I 0.5441 0.2340 -0.3485 1.4367 LPAD - RSTD 2.4590 0.00001** 1.2975 3.6204 Watson-Glasser Critical Thinking 0.9668 0.0404* 0.0405 1.8931 Picture Motivation Scale 0.4201 0.3524 -0.4661 1.3063 Haywood's Maze Test 2.2468 0.0000** 1.1274 3.3663s
Feuerstein, R., Rand, Y . , Hoffman, M . , & Mil ler , R. (1980). Instrumental Enrichment: An intervention program for cognitive modifiability. Glenview, IL: Scott, Foresman.
Ethnicity: Socio-economic Status: Age: Grade level: Ability/Achievement Level: Population: Gender: Length of Treatment: FIE Instruments Used:
Design: Instructor: Control Group:
Israeli and African and Asian immigrants L o w 12 - 15 at the beginning of the study Residential and Day Centres - Secondary Levels L o w Mixed Predominantly male 2 years, 5 hours per week 1. Organization of Dots, 2. Orientation in Space I, 3. Comparisons, 4. Analytic Perception, 5. Categorization, 6. Instructions, 7. Temporal Relations, 8. Numerical Progressions, 9. Family Relations, 10. Illustrations, 11. Syllogisms (to some classes as the end), 12. Representational Stencil Design, 13. Orientation in Space II, Pre-Post, Treatment Control Not classroom teacher General Enrichment
The control group received "General Enrichment," that is, enriched and supplementary input of content and curriculum-oriented experiences. Treatment and control students had low school performance and behavioural problems. Treatment and control groups were matched
102

pairs and were independent. The quality of tests is unknown. Over the two years teachers received approximately 27 days of training.. In addition, training was continued in-service by the supervisor at each research site. The supervisor visited each IE class once weekly, intervening upon request, and offering guidance based on the post-lesson critique.
Dependent Measures: (Data used were combined residential centre and day centre results) > Primary Mental Abilities ( P M A ) test, version 4 to 6 (Thurstone, 1965) - Total score > Project Achievement Battery. General knowledge, nature, geography, reading
comprehension. o Antonyms was not used because reading comprehension was considered a
better example of reading ability. Geometry, addition, subtraction, multiplication and division were not used because they were considered to be too specific examples of arithmetic to fit into the analysis. Part-Whole and Bible were also not used because they did not fit into this analysis.
> Classroom Participation Scale (CPS I & II) (Tannenbaum & Levine, 1968). Six factors from factor analyses, the first four required an effect size with a minus sign to indicate positive growth. The other two were self-sufficiency and adaptiveness to work demands.
> Embedded Figures Test (EFT) (Witkin, 1950). Total Correct. The subject must identify a given part within the whole.
o Average Time was not used. > Human Figure Drawing (HFD) (Witkin et al., 1962). The subject draws figures of both
sexes and the drawings are scored for sophistication and detail. > Kuhlmann-Finch Postures Test (Finch, 1953), modified. A test of spatial orientation.
A human figure is presented next to similar but rotated figures. The subject must choose the figure identical to the model.
> Lahy Test (Zazzo, 1964). Proportion Correct. Figures are created by the rotation of a protruding bar from the angles and midpoints of a small square.
o Total number attended and Proportion wrong were not used. > Terman Nonverbal Intelligence Test (Terman, 1942). Concept formation tasks. The
subject must select a geometric design that does not conform to the grouping principles in a group of geometric designs.
> D-48 Test (Gough & Domino, 1963). Involves analogies and progressions in relationships among dominoes.
> Porteus Maze Test (Porteus, 1965). o Levidal Self-Concept Scale (Levine & Katz, 1971). Data were not reported. See Rand,
Tannenbaum & Feuerstein (1979) for that data o Dapar Intelligence Test - Not used because it was not possible to combine residential
centre and day centre results, o Hebrew Language Development - Not used because it was not possible to combine
residential centre and day centre results, o L P A D Set Variations - Not used because results were reported in terms of observed
deficient cognitive functions, and because reported results were the difference between pre- and post-test changes.
103

Effect Sizes Confidence Confidence
Test E.S. 2-tailed p Interval - Minus Interval - Plus Embedded Figures 0.7974 0.0000** 0.4159 1.1788 Human Figure Drawing -0.4417 0.0198* -0.8133 -0.8133 Lahy Test 0.4744 0.0124** 0.1022 0.8467 Terman Concept Formation-Nonverbal 0.4764 0.0120** 0.1041 0.8487 D-48 0.9011 0.0000** 0.5158 1.2864 Porteus Maze 0.1400 0.4532 -0.2276 0.5076 Kuhlman-Finch Postures, modified 0.7014 0.0004** 0.3231 1.0796 CPS I, Adaptiveness to Work Demands 0.8480 0.0000** 0.4646 1.2312 CPS II, Self Sufficiency 0.9388 0.0000** 0.5520 1.3256 PMA - Total Score 0.5307 0.0054** 0.1572 0.9043 PAB - General Knowledge 0.3195 0.0892 -0.0499 0.6890 PAB - Reading 0.0177 0.9282 -0.3494 0.3849 PAB-Nature -0.0374 0.8414 -0.4046 0.3298 PAB - Geography 0.1712 0.3628 -0.1966 0.5391
Lower d scores are best below CPS I - Acting Out -0.1796 0.3370 -0.5475 0.1883 CPS I - Unsocialized Behaviour -0.0710 0.7040 -0.4382 0.2963 CPS I - Immaturity -0.0886 0.6384 -0.4560 0.2787 CPS -1 Interpersonal Conduct -0.3827 0.0434* -0.7532 -0.0122
Funk, P . G . (1987). Modifying the cognitive functioning of the learner: The effects of two years' instruction in Instrumental Enrichment (Feuerstein). Unpublished doctoral dissertation, Temple University, Philadelphia, P A .
Ethnicity: Socio-economic Status: Age: Grade level: Ability/Achievement Level: Population: Gender: Length of Treatment: FIE Instruments Used: Design: Instructor: Control Group:
American, mixed Mixed 12-14 6-8 Average - L o w reading and math Learning Disability resource room Mixed 2 years, 30 minutes every other day. Unknown Pre-Post, Treatment Control Unknown Students in the same remedial program, but in a different school (Regular curriculum).
Control and experimental groups had similar pre-test Reading Comprehension, Total Mathematics and IQ score scores. Tests were good ones. Information on training of IE teachers was unavailable.
104

Dependent Measures: > Stanford Achievement Tests, Advanced Level, Form E - Total Mathematics and
Reading Comprehension > Otis-Lennon School Abi l i ty Test, Intermediate Level , Form R - IQ scores
Effect Sizes
Test E.S. 2-tailed p Confidence Confidence
Interval - Minus Interval - Plus Otis-Lennon 0.9657 0.0004** 0.4218 1.5100 SAT - Total Math 0.9367 0.0010** 0.3945 1.4789 SAT - Reading Comprehension 0.5043 0.0588 -0.0186 1.0271
Genasci, K . (1983). The effects of Instrumental Enrichment on aptitudes and affective measures of adolescent students in selected classroom settings. Unpublished doctoral dissertation, University of Oregon, Eugene, OR.
Ethnicity: Socio-economic Status: Age: Grade level: Ability/Achievement Level: Population: Gender: Length of Treatment: FIE Instruments Used:
Design: Instructor: Control Group:
American, mixed Mixed 1 1 - 1 5 and 1 5 - 1 8 7 - 8 and students in alternative high school classrooms High and Mixed Mixed Not reported - Mixed 1 year 1. Organization of Dots, 2. Orientation in Space I, 3. Comparisons, 4. Analytic Perception Pre-Post, Treatment Control Two were not the classroom teacher and one was. Regular curriculum
Eight school districts were asked to participate in the study. Three were able to do so, and they provided the experimental and control group classrooms. Groups were both selected by the school districts and randomly drawn from classrooms. Groups that were chosen were done so on the basis of their similarity to the randomly selected groups. Teachers had received one academic year of IE training. Results that were used in the meta-analysis were from A N C O V A F-tests with the 7 t h and 8 t h grade students.
Dependent Measures: > Academic Self-Concept Measure (Payne, 1962). Part one: The students' perception of
him/herself as a student. Part two: Students rate how they think teachers have perceived them as students. Data used in the meta-analysis were from the high achieving grade 7 - 8 , age 1 1 - 1 5 groups only.
o Primary Mental Abilities test ( P M A ) (Thurstone, 1965). Not used because the results were calculated with the Mann-Whitney U non-parametric statistical procedure and data were not reported in a fashion that could be used to calculate effect sizes.
105

Effect Sizes Confidence Confidence
Test E.S. 2-tailed p Interval - Minus Interval - Plus Academic Self-Concept - Student's Perceptions of Themselves 0.0253
Unable to calculate as only F-statistics were reported.
Academic Self-Concept - Student's Perceptions of How Teachers Rate Them 0.0270
Unable to calculate as only F-statistics were reported.
Graham, E . E . (1981). Feuerstein's Instrumental Enrichment used to change cognitive and verbal behaviour in a city-core, multi-ethnic Toronto secondary school. Unpublished doctoral dissertation, University of Toronto, Toronto, O N .
Ethnicity: Socio-economic Status: Age: Grade level: Ability/Achievement Level:
Population: Gender: Length of Treatment: FIE Instruments Used:
Design: Instructor: Control Group:
Canadian, multi-ethnic Average-low Approximately 14 Nine L o w English (Six classes divided into treatment and control groups) Common and remedial English classes Mixed 1 year. (7 lA months); three 45-minute periods weekly 1. Organization of Dots, 2. Orientation in Space I, 3. Comparisons, 4. Analytic Perception, 6. Instructions, 10. Illustrations Pre-Post, Treatment Control. Incomplete Nested design Not classroom teacher Regular English curriculum
The study used an incomplete nested design. The composition of all grade nine classes was randomly determined. Good tests. Descriptive statistics were not reported so effect sizes were calculated from A N C O V A F tests. Experimental group teachers had 3 days of training and the researcher wrote manuals for them for each o f the instruments used. In addition, peer coaches with expertise in IE and M L E were used to help other students.
Dependent Measures > Lorge-Thorndike Intelligence Test, Non-Verbal Batteries III and I V , Total score > Standard Diagnostic Reading Test, Brown Level , Reading Comprehension, Test 2,
Total score. > Piers-Harris Self-Concept Scale, Total score. o Primary Mental Abilities Letter Series Test Levels 1 and II. Not used because total
scores were not reported, o A writing test devised by the researcher. Not used because it was an informal measure.
106

Effect Sizes Confidence Confidence
Test E.S. 2-tailed p Interval - Minus Interval - Plus Lorge-Thorndike III - Total
0.2779 Unable to calculate as only F-statistics were reported.
Lorge-Thorndike IV - Total 0.2689
Unable to calculate as only F-statistics were reported.
Stanford Diagnostic Reading-Total Score 0.0217
Unable to calculate as only F-statistics were reported.
Piers-Harris - Total Score 0.0807
Unable to calculate as only F-statistics were reported.
Hal l , J .N . (1981). Evaluation and comparison: Social Learning Curriculum and Instrumental Enrichment. Final Report. Nashville, T N : George Peabody College for Teachers. (ERIC Document Reproduction Service No . E D 244 484.
Ethnicity: Socio-economic Status: Age: Grade level: Ability/Achievement Level: Population:
Gender: Length of Treatment: FIE Instruments Used:
Design:
Instructor: Control Group:
American, mixed Mixed 1 1 - 1 7 5 - 9 , predominantly elementary Mixed L o w and high ability Varying Exceptionalities: Learning Disabled (LD) , Educable Mentally Handicapped ( E M H ) , Behaviour Disordered (BD), Learning Problems (LP) M i x e d - predominantly male 1 year - 4 hours per week 1. Organization of Dots, 2. Orientation in Space I, 3. Comparisons, 4. Analytic Perception Non-Equivalent Control Group, Pre-Post - Treatment Control There were three groups, Social Learning Curriculum (SLC) , IE, and control. S L C data were not used in this analysis. Classroom teacher Traditional special education programs (Regular curriculum)
This was a Non-Equivalent Control Group design with two treatment groups and a control group. Students in both treatment and control groups had learning problems. IE teachers attended training workshops on four occasions during the year-long treatment; however, information on how long the workshops lasted was not reported. Good tests.
Dependent Measures: > Standard Progressive Matrices (SPM) (Raven, 1960) - intellectual functioning, non
verbal > Test of Social Inference (TSI) (Edmonson, Leland, deJung, & Leach, 1974) -
inferential thinking
107

> Matching Familiar Figures Test ( M F F T ) (Kagan, Rosman, Day, Albert, & Phillips, 1964), number correct - nonverbal problem solving - reflectivity-impulsivity, and visual-perceptual acuity
> Peabody Individual Achievement Test (PIAT) (Dunn & Markwardt, 1970) - General Information subtest.
> Piers-Harris Children's Self-Concept Scale (PH) (Piers, 1969) o Test of the Hierarchy of Social Knowledge (THINK) (Smith & Greenberg, n.d.) - Not
used because it was used in a pilot fashion with only some of the subjects.
Effect Sizes Confidence Confidence
Test E.S. 2-tailed p Interval - Minus Interval - Plus Raven's Standard Matrices 0.3542 0.1118 -0.0805 0.7890 Matching Familiar Figures, # correct 0.6477 0.0042** 0.2057 1.0900 PIAT - General Information 0.4759 0.0332* 0.0390 0.9131 Piers Harris Children's Self-Concept -0.0323 0.8808 -0.4639 0.3993 Test of Social Inference 0.1627 0.4592 -0.2700 0.5950
Haywood, H . C . , Towery-Woolsey, J., Arbitman-Smith, R., & Aldridge, A . H . (1988). Cognitive education with deaf adolescents. Effects of Instrumental Enrichment. Topics in Language Disorders, 92, 23-40.
Ethnicity: Socio-economic Status: Age: Grade level: Ability/Achievement Level: Population: Gender: Length of Treatment: FIE Instruments Used:
Design: Instructor: Control Group:
American, mixed Mixed 1 2 - 1 6 7 - 9 Mixed Deaf Mixed 1 Vi academic years/85 - 170 hours A l l students received: 1. Organization of Dots, 2. Orientation in Space I, 4. Analytic Perception. Students with the most hours also received: 3. Comparisons, 7. Temporal Relations, 8. Numerical Progressions, 9. Family Relations, 13. Classifications, 15. Orientation in Space II Pre-Post, Treatment Control Classroom teacher Regular curriculum
Effect sizes were calculated from F-tests as standard deviations were not reported. Tests were good ones. Teachers were trained (the length of training was not reported), and an experienced teacher-trainer made regular consulting visits to the school to monitor progress and provide help.
Dependent Measures: > Raven's Standard Progressive Matrices (RSPM)
108

> Primary Mental Abilities test ( P M A ) - Reasoning subtest, Spatial Relations subtest > KeyMath Diagnostic Test (Connolly, Nachtman, & Pritchett, 1976). The Math
Reasoning subtest was chosen for this analysis. > Peabody Individual Achievement Test (PIAT) (Dunn & Markwardt, 1970). Math,
Reading and Information subtests. > Metropolitan Achievement Test (Durost, Bixler, Hildreth, Lund, & Wrightstone, 1959).
Reading, Math, Language, Science, Social Studies subtests. > Stanford Achievement Tests (Gardner, Rudman, Karlsen, & Merwin, 1984) (SAT) .
Reading Comprehension, Language, Science, and the Math Applications subtest were chosen for this analysis.
o Mastery tests for the IE program - Not used because it was not a standardized measure, and the purpose of this study is to evaluate the effectiveness of FIE in other areas.
Effect Sizes Confidence Confidence
Test E.S. 2-tailed p Interval - Minus Interval - Plus P M A - Reasoning Unable to calculate as only F-statistics were
1.2477 reported. Raven's Standard Progressive Matrices Unable to calculate as only F-statistics were
0.6991 reported. PIAT - Reading Unable to calculate as only F-statistics were
0.1412 reported. Metropolitan Achievement - Reading Unable to calculate as only F-statistics were
0.1799 reported. SAT - Reading Comprehension Unable to calculate as only F-statistics were
0.0360 reported. PIAT - Information Unable to calculate as only F-statistics were
0.5150 reported. Metropolitan - Language
0.24508 Unable to calculate as only F-statistics were reported.
SAT - Language Unable to calculate as only F-statistics were 0.5518 reported.
KeyMath - Math Reasoning Unable to calculate as only F-statistics were 0.5376 reported.
PIAT - Math Unable to calculate as only F-statistics were 0.1832 reported.
Metropolitan - Math Unable to calculate as only F-statistics were 0.0538 reported.
SAT - Math Applications Unable to calculate as only F-statistics were 0.0478 reported.
Metropolitan - Science 0.2557
Unable to calculate as only F-statistics were reported.
SAT - Science Unable to calculate as only F-statistics were 0.1465 reported.
Metropolitan - Social Studies Unable to calculate as only F-statistics were 0.0087 reported.
109
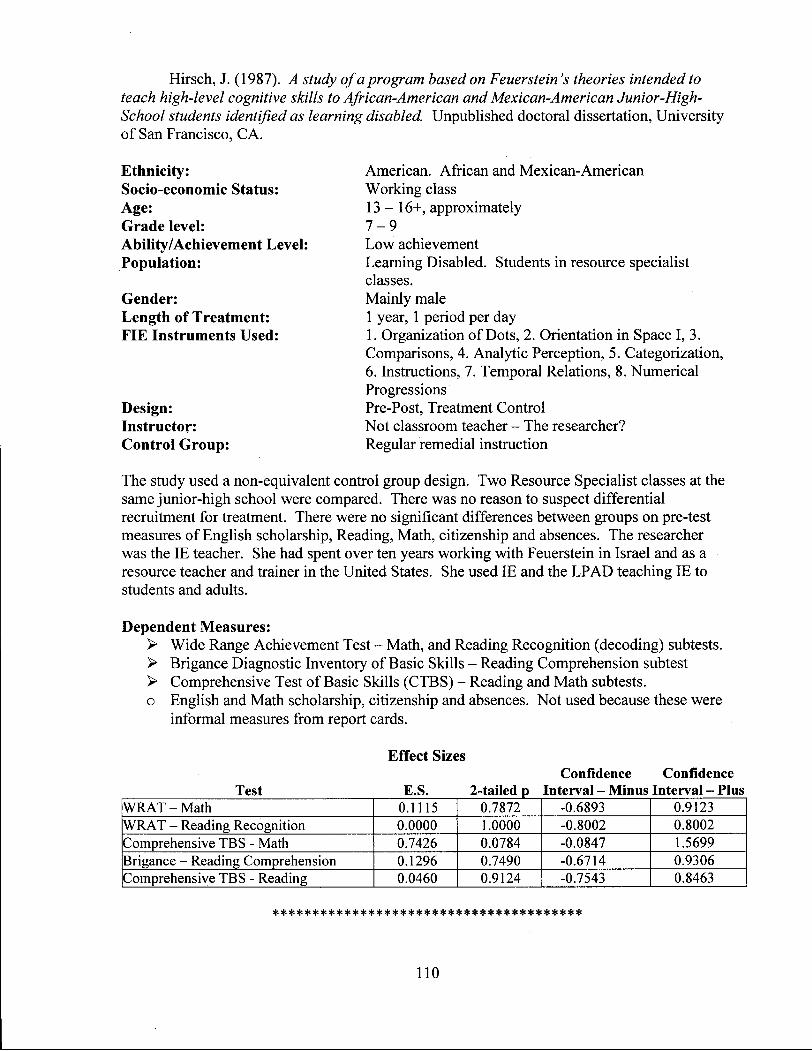
Hirsch, J. (1987). A study of a program based on Feuerstein's theories intended to teach high-level cognitive skills to African-American and Mexican-American Junior-High-School students identified as learning disabled. Unpublished doctoral dissertation, University of San Francisco, C A .
Ethnicity: Socio-economic Status: Age: Grade level: Ability/Achievement Level: Population:
Gender: Length of Treatment: FIE Instruments Used:
Design: Instructor: Control Group:
American. African and Mexican-American Working class 13 -16+ , approximately 7 - 9 L o w achievement Learning Disabled. Students in resource specialist classes. Mainly male 1 year, 1 period per day 1. Organization of Dots, 2. Orientation in Space I, 3. Comparisons, 4. Analytic Perception, 5. Categorization, 6. Instructions, 7. Temporal Relations, 8. Numerical Progressions Pre-Post, Treatment Control Not classroom teacher - The researcher? Regular remedial instruction
The study used a non-equivalent control group design. Two Resource Specialist classes at the same junior-high school were compared. There was no reason to suspect differential recruitment for treatment. There were no significant differences between groups on pre-test measures of English scholarship, Reading, Math, citizenship and absences. The researcher was the IE teacher. She had spent over ten years working with Feuerstein in Israel and as a resource teacher and trainer in the United States. She used IE and the L P A D teaching IE to students and adults.
Dependent Measures: > Wide Range Achievement Test - Math, and Reading Recognition (decoding) subtests. > Brigance Diagnostic Inventory of Basic Skills - Reading Comprehension subtest > Comprehensive Test of Basic Skills (CTBS) - Reading and Math subtests. o English and Math scholarship, citizenship and absences. Not used because these were
informal measures from report cards.
Effect Sizes Confidence Confidence
Test E.S. 2-tailed p Interval - Minus Interval - Plus W R A T - Math 0.1115 0.7872 -0.6893 0.9123 W R A T - Reading Recognition 0.0000 1.0000 -0.8002 0.8002 Comprehensive TBS - Math 0.7426 0.0784 -0.0847 1.5699 Brigance - Reading Comprehension 0.1296 0.7490 -0.6714 0.9306 Comprehensive TBS - Reading 0.0460 0.9124 -0.7543 0.8463
110

Jensen, M . R . (n.d.). Cognitive modifiability and Instrumental Enrichment: A controlled evaluation of a classroom-based intervention model. Unpublished manuscript. Delphi Health & Science, and The National Center for Mediated Learning, Atlanta, G A .
Experimental and control schools did not differ significantly in terms of gender or IQ. Testing personnel were blind to the specific hypotheses of the study. Effect sizes were calculated from t- and F-tests as well as from means, standard deviations and number of subjects. Teachers were trained (the length of time was not reported) and received intermittent coaching assistance from experienced IE teachers. "The variable High IE - L o w IE was created by dividing the sample at the median based on teacher estimates of the amount of IE students received" (p. 19).
Dependent Measures: Data were reported according to an acquisition-retention, near transfer (resistance-
flexibility) and far transfer (transformability-generalizability) model.
> Near transfer and far transfer tasks were selected from the French K i t (Educational Testing Service) or adapted from "up-coming and more advanced parts of the IE curriculum."
> Piers-Harris Children's Self-Concept Scale (Piers, 1984) > The Haywood Mazes. (Haywood has argued that this test may constitute a fairly good
measure of intrinsic motivation.)
Endpoint. Near Transfer: > Primary Mental Abilities Test (Thurstone, 1965) - Spatial Relations, Figure Grouping,
Word Grouping and Perceptual Speed subtests. > Raven's Standard Progressive Matrices (1977) - Series 3 - 5 .
Design: Instructor: Control Group:
Ethnicity: Socio-economic Status: Age: Grade level: Ability/Achievement Level: Population: Gender: Length of Treatment: FIE Instruments Used:
American, mixed L o w 13-14 (Average: 13.10) at the beginning (16-17) 7, 8 at the beginning L o w Special education, inner-city Mixed - mainly male 18 months (midpoint) and 36 months (endpoint) 1. Organization of Dots, 2. Orientation in Space I, 3. Comparisons, 4. Analytic Perception, 5. Categorization, 6. Instructions, 7. Temporal Relations, 8. Numerical Progressions, 9. Family Relations, 10. Illustrations, 11. Transitive Relations and Syllogisms, 12. Representational Stencil Design, 13. Orientation in Space II, 14. Classifications, 15. Organization of Dots II Pre-Post, Treatment Control Not classroom teacher Regular curriculum
Midpoint
111

Far Transfer: > Cognitive Abilities Test (Thorndike & Hagen, 1971) - Number Series (48 items) > Familiar Words Questionnaire (Haywood, 1981) > A mathematics test designed especially for the project. Although this was an informal
measure and should have been deleted from this analysis, it was not possible to isolate it and do so.
> Piers-Harris Children's Self-Concept Scale (Piers, 1984) o Acquisition. Not used because measures were represented by IE materials covered by
the intervention and adapted to a test format. This analysis is calculating the effects IE has on other domains.
o Teacher Likert-type ratings of their own students. Not used because it was an informal measure.
Effect Sizes Midpoint
Confidence Confidence Test E.S. 2-tailed p Interval - Minus Interval - Plus
Far Transfer, Sample A 0.1621 0.5486 -0.3645 0.6890 Far Transfer, Sample B 0.8171 0.0054** 0.2403 1.3939 Far Transfer, Sample C 0.1581 0.5156 -0.3180 0.6342 Near Transfer, Sample A 0.2665 0.3370 -0.2791 0.8120 Near Transfer, Sample B 0.9154 0.0026** 0.3176 1.5132 Near Transfer, Sample C 0.4866 0.0478* 0.0043 0.9690 Haywood Maze Test, Samples A & B
0.4437 Unable to calculate as only F-statistics were reported.
Haywood Maze Test, Sample C 0.5521
Unable to calculate as only F-statistics were reported.
Piers-Harris, Sample A 0.6718
Unable to calculate as only F-statistics were reported.
Piers-Harris, Sample B 1.3263
Unable to calculate as only F-statistics were reported.
Piers-Harris, Sample C 0.1004
Unable to calculate as only F-statistics were reported.
Endpoint
Test Unbiased d 2-tailed p Confidence Confidence
Interval - Minus Interval - Plus Far Transfer, High IE
0.1484 Unable to calculate as only t-statistics were reported.
Far Transfer, Low IE -0.2781
Unable to calculate as only t-statistics were reported.
Near Transfer, High IE 0.3508
Unable to calculate as only t-statistics were reported.
Near Transfer, Low IE -0.4120
Unable to calculate as only t-statistics were reported.
112

Kenney, M . V . (1984). Effects of Feuerstein's Instrumental Enrichment on the reasoning, non-verbal, intelligence, and locus of control of 12 to 15 year old educable mentally handicapped and learning disabled students. Unpublished doctoral dissertation, University of Missouri-Columbia, Columbia, M O .
Ethnicity: Socio-economic Status: Age: Grade level: Ability/Achievement Level: Population: Gender: Length of Treatment: FIE Instruments Used:
Design: Instructor: Control Group:
American, mixed Mixed 1 2 - 1 5 Six - nine L o w E M H and L D Mixed 1 year, 125 hours 1. Organization of Dots, 2. Orientation in Space I, 3. Comparisons, 4. Analytic Perception, 5. Categorization, 8. Numerical Progressions Pre-Post, Treatment Control, Not classroom teacher Regular curriculum
Most students were randomly selected from their classrooms. Treatment and Control groups were independent. Tests were good. Twenty-five volunteer teachers received five, 9-hour days o f training from an experienced IE teacher and trainer. Twelve were randomly selected from this group to teach the IE group.
Dependent Measures: > Woodcock-Johnson Psycho-Educational Battery: Reasoning Cluster (Woodcock &
Johnson, 1977). Four subtests: Analysis-Synthesis, Concept Formation, Analogies and Antonyms-Synonyms.
> Standard Progressive Matrices (Raven, 1977) > Intellectual Achievement Responsibility Questionnaire (Crandall, Katkovsky &
Crandall, 1965)
Effect Sizes Confidence Confidence
Test E.S. 2-tailed p Interval - Minus Interval - Plus Raven's Standard Matrices (EMH) 0.0901 0.7566 -0.4713 0.6514 Raven's Standard Matrices (LD) 0.3150 0.1970 -0.1652 0.7951. Woodcock-Johnson Reasoning (EMH) 0.3800 0.1868 -0.1861 0.9461 Woodcock Johnson Reasoning (LD) 0.7937 0.0010** 0.2982 1.2893 Intellectual Achievement Responsibility Questionnaire, Total I scores (LD) 0.7130 0.0046** 0.2210 1.2051 Intellectual Achievement Responsibility Questionnaire, Total I scores (EMH) 0.1088 0.7040 -0.4527 0.6702
113
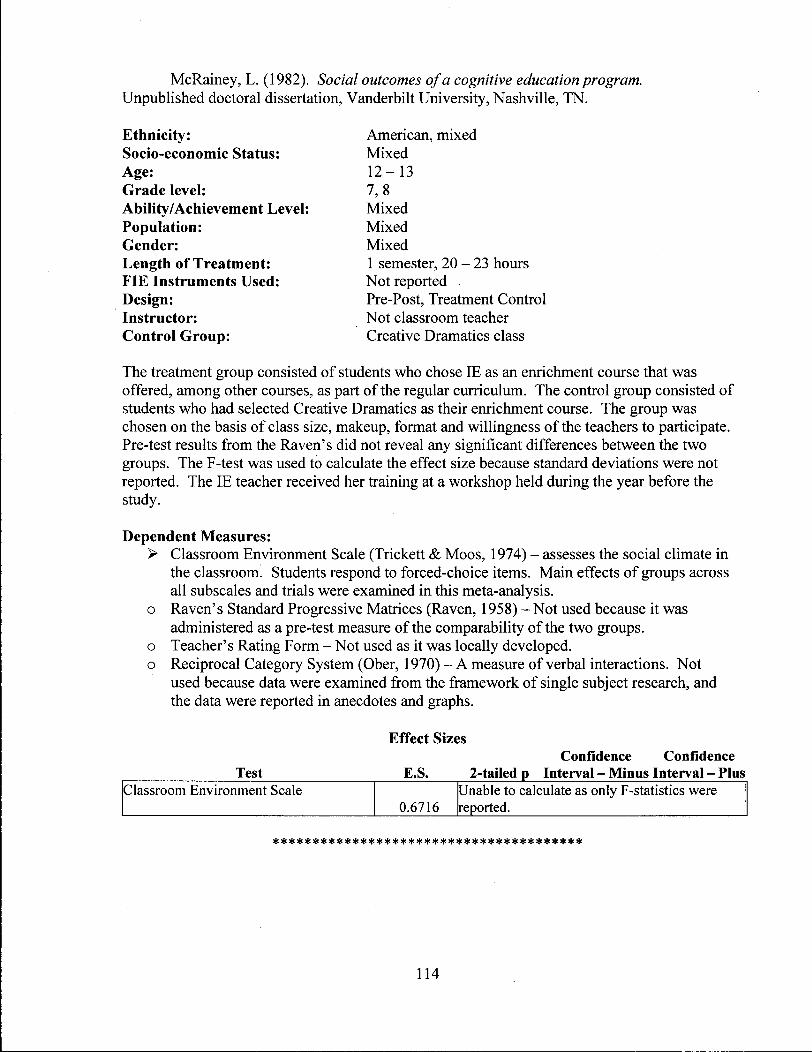
McRainey, L . (1982). Social outcomes of a cognitive education program. Unpublished doctoral dissertation, Vanderbilt University, Nashville, T N .
Ethnicity: Socio-economic Status: Age: Grade level: Ability/Achievement Level: Population: Gender: Length of Treatment: FIE Instruments Used: Design: Instructor: Control Group:
American, mixed Mixed 1 2 - 1 3 7,8 M i x e d M i x e d Mixed 1 semester, 20 - 23 hours Not reported Pre-Post, Treatment Control Not classroom teacher Creative Dramatics class
The treatment group consisted of students who chose IE as an enrichment course that was offered, among other courses, as part of the regular curriculum. The control group consisted of students who had selected Creative Dramatics as their enrichment course. The group was chosen on the basis of class size, makeup, format and willingness of the teachers to participate. Pre-test results from the Raven's did not reveal any significant differences between the two groups. The F-test was used to calculate the effect size because standard deviations were not reported. The IE teacher received her training at a workshop held during the year before the study.
Dependent Measures: > Classroom Environment Scale (Trickett & Moos, 1974) - assesses the social climate in
the classroom. Students respond to forced-choice items. M a i n effects of groups across all subscales and trials were examined in this meta-analysis,
o Raven's Standard Progressive Matrices (Raven, 1958) - Not used because it was administered as a pre-test measure of the comparability of the two groups,
o Teacher's Rating Form - Not used as it was locally developed, o Reciprocal Category System (Ober, 1970) - A measure of verbal interactions. Not
used because data were examined from the framework of single subject research, and the data were reported in anecdotes and graphs.
Effect Sizes Confidence Confidence
Test E.S. 2-tailed p Interval - Minus Interval - Plus Classroom Environment Scale
0.6716 Unable to calculate as only F-statistics were reported.
114
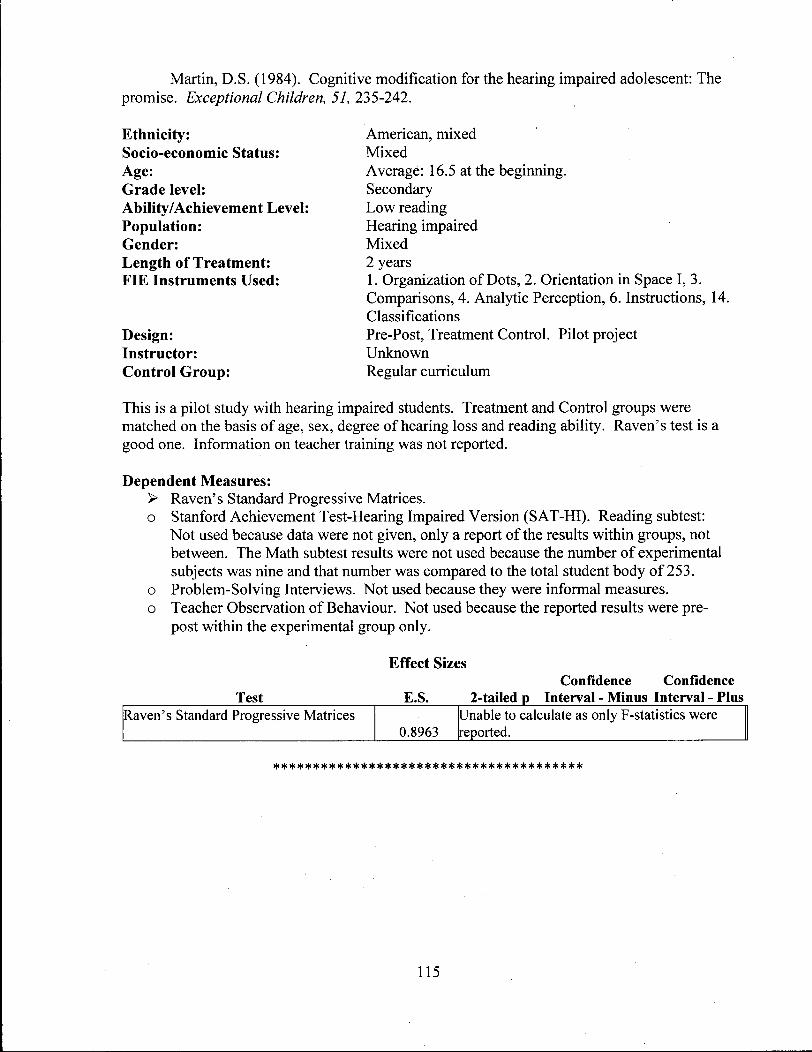
Martin, D.S. (1984). Cognitive modification for the hearing impaired adolescent: The promise. Exceptional Children, 51, 235-242.
Ethnicity: Socio-economic Status: Age: Grade level: Ability/Achievement Level: Population: Gender: Length of Treatment: FIE Instruments Used:
Design: Instructor: Control Group:
American, mixed Mixed Average: 16.5 at the beginning. Secondary L o w reading Hearing impaired Mixed 2 years 1. Organization of Dots, 2. Orientation in Space I, 3. Comparisons, 4. Analytic Perception, 6. Instructions, 14. Classifications Pre-Post, Treatment Control. Pilot project Unknown Regular curriculum
This is a pilot study with hearing impaired students. Treatment and Control groups were matched on the basis of age, sex, degree of hearing loss and reading ability. Raven's test is a good one. Information on teacher training was not reported.
Dependent Measures: > Raven's Standard Progressive Matrices. o Stanford Achievement Test-Hearing Impaired Version (SAT-HI) . Reading subtest:
Not used because data were not given, only a report of the results within groups, not between. The Math subtest results were not used because the number of experimental subjects was nine and that number was compared to the total student body o f 253.
o Problem-Solving Interviews. Not used because they were informal measures. o Teacher Observation of Behaviour. Not used because the reported results were pre-
post within the experimental group only.
Effect Sizes Confidence Confidence
Test E.S. 2-tailed p Interval - Minus Interval - Plus Raven's Standard Progressive Matrices
0.8963 Unable to calculate as only F-statistics were reported.
115

Maxcy, P. (1991) The effects of Feuerstein's Instrumental Enrichment (FIE) on cognitive performance and transfer measures of at-risk adolescents when adequate mediated learning experiences are present. Unpublished master's thesis, Simon Fraser University, Burnaby, British Columbia, Canada.
Ethnicity: Socio-economic Status: Age: Grade level: Ability/Achievement Level: Population: Gender: Length of Treatment: FIE Instruments Used:
Design: Instructor: Control Group:
Canadian, mixed Mixed (low to middle income) 1 2 - 1 4 Eight (Bridge) Mixed - L o w achievement At-risk adolescents with emotional and social difficulties Mixed 8 months 1. Organization of Dots, 2. Orientation in Space I, 3. Comparisons, 4. Analytic Perception, 5. Categorization (parts), 6. Instructions (parts) Pre-Post, Treatment Control Not classroom teacher Regular curriculum
Experimental and control subjects were all students in an at-risk "bridging" program. IE was an elective course for experimental students. The IE teacher (the researcher) was very knowledgeable about FIE theory, FIE curricula and the L P A D . Other experienced IE teachers made periodic, unannounced visits and filled out a rating form. The tests were good ones.
Dependent Measures: > Raven's Standard Progressive Matrices (Raven, Court & Raven, 1983) > Test of Cognitive Skills ( C T B / M c G r a w - H i l l , 1981) - Total score > Intellectual Achievement Responsibility Scale (Crandall, 1983) > Coopersmith Self-Esteem Questionnaire (Coopersmith, 1987) o Canadian Achievement Test ( C T B / M c G r a w - H i l l , 1982) - not used because it was
administered to only the treatment group o Learning Potential Assessment Device, Group Organization of Dots Test, Group
Numerical Progressions, Group Representational Stencil Design Test - not used because it was administered to only the treatment group
Effect Sizes Confidence Confidence
Test E.S. 2-tailed p Interval - Minus Interval - Plus Raven's Standard Matrices 0.3039 0.5418 -0.6675 1.2751 Test of Cognitive Skills 0.4536 0.3734 -0.5465 1.4538 Intellectual Achievement Responsibility 0.9215 0.0750 -0.0929 1.9358 Coopersmith 0.2344 0.6892 -0.9284 1.3972
116

Mulcahy, R. (1993). Cognitive education project (Report N o . ISBN-0-7732-1147-0). Alberta Deptartment of Education, Edmonton, A B . (ERIC Document Reproduction Service N o . E D 367 679)
A Pre-post factorial design was used. A t pre-test approximately 4000 students were screened for possible inclusion in three diagnostic categories (gifted, average and learning disabled). Eighty percent of the teachers who volunteered were randomly assigned to the three conditions (I.E., S .P.E.L.T. , Control). The remaining teachers were assigned to the control group. Students were selected according to results on the C A T , the C C A T and the S R B G C S S . Results were analyzed and at grade 4 no significant differences were observed for the conditions. Grade 7 IE students were rated as being somewhat higher in motivation than control students. In-service training for IE was conducted for 5 full days. Standardized tests were good ones.
This study was conducted over 3 years with 3 time periods for measurement of affect and achievement: pre-test (end of year 1), post-test (end of year 2) and another post-test at the end of 1 year of maintenance (p.96). The authors reported all means and standard deviations, and the number of subjects for only the end of year 1 (pp. 87 and 91). The analysis for the other two measurement points consisted of calculating F-tests for three, not two, groups. Therefore, this meta-analysis calculated effect sizes only for the measures used at the end of the first year. The data were taken from pages 87, 91 and 247-268.
Dependent Measures: > Canadian Achievement Test ( C A T ) (McGraw-Hi l l Ryerson, 1983). Used for selection
as well as evaluation. Reading Vocabulary, Reading Comprehension, Math Calculation and Math Concept Application subtests.
> Harter's Perceived Competence Scale (Harter, 1982) - Children's views of their academic abilities (cognitive), social skills and popularity, physical abilities and general self-esteem.
Ethnicity: Socio-economic Status: Age: Grade level: Ability/Achievement Level: Population: Gender: Length of Treatment: FIE Instruments Used:
Canadian, mixed Mixed Approximately 9 and 12 at the beginning Grades 4 and 7 at the beginning M i x e d Gifted, Average, and Learning Disabled M i x e d 1 year, 2 years, Maintenance year Year 1 : 1. Organization of Dots, 2. Orientation in Space I, 3. Comparisons, 4. Analytic Perception Year 2: 6. Instructions, 7. Temporal Relations, 8. Numerical Progressions, 9. Family Relations, 10. Illustrations, , 13 . Classifications. Pre-Post, Treatment Control Classroom teacher The control group received regular curriculum instruction. There was another comparison group, S.P.E.L.T. , that was not analyzed in this meta-analysis.
Design: Instructor: Control Group:
117
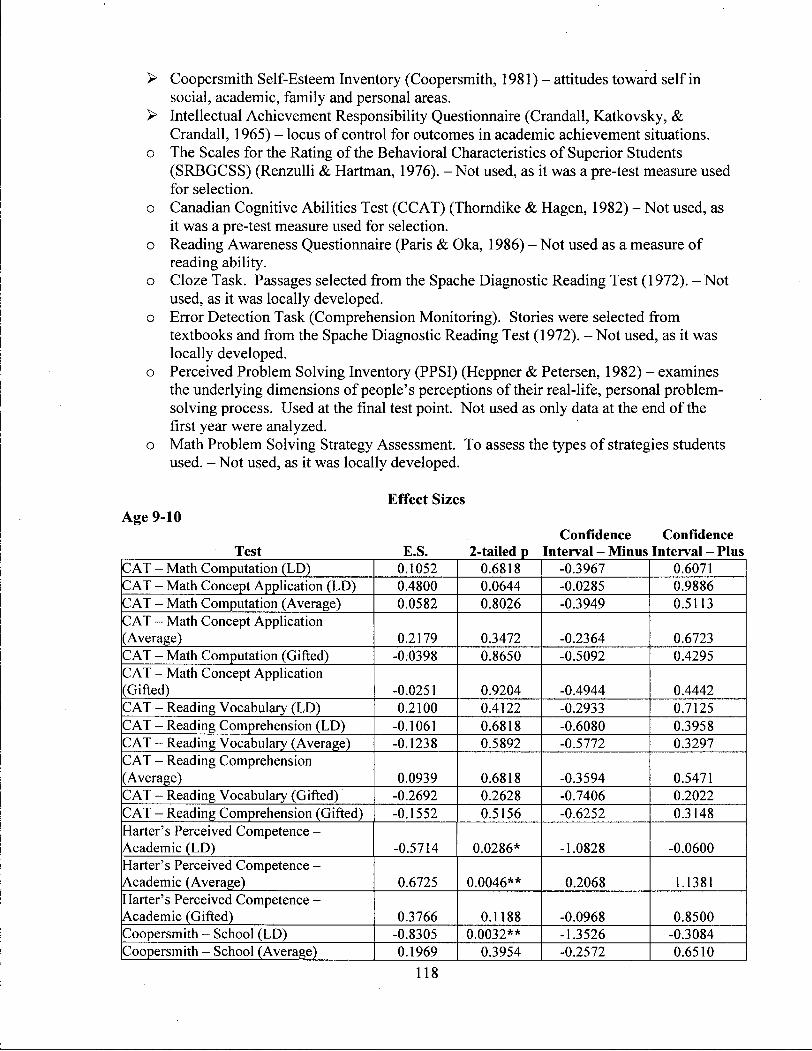
> Coopersmith Self-Esteem Inventory (Coopersmith, 1981) - attitudes toward self in social, academic, family and personal areas.
> Intellectual Achievement Responsibility Questionnaire (Crandall, Katkovsky, & Crandall, 1965) - locus of control for outcomes in academic achievement situations.
o The Scales for the Rating of the Behavioral Characteristics of Superior Students ( S R B G C S S ) (Renzulli & Hartman, 1976). - Not used, as it was a pre-test measure used for selection.
o Canadian Cognitive Abilities Test ( C C A T ) (Thorndike & Hagen, 1982) - Not used, as it was a pre-test measure used for selection,
o Reading Awareness Questionnaire (Paris & Oka, 1986) - Not used as a measure of reading ability.
o Cloze Task. Passages selected from the Spache Diagnostic Reading Test (1972). - Not used, as it was locally developed,
o Error Detection Task (Comprehension Monitoring). Stories were selected from textbooks and from the Spache Diagnostic Reading Test (1972). - Not used, as it was locally developed.
o Perceived Problem Solving Inventory (PPSI) (Heppner & Petersen, 1982) - examines the underlying dimensions of people's perceptions of their real-life, personal problem-solving process. Used at the final test point. Not used as only data at the end of the first year were analyzed.
o Math Problem Solving Strategy Assessment. To assess the types of strategies students used. - Not used, as it was locally developed.
Effect Sizes Age 9-10
Confidence Confidence Test E.S. 2-tailed p Interval - Minus Interval - Plus
CAT - Math Computation (LD) 0.1052 0.6818 -0.3967 0.6071 CAT - Math Concept Application (LD) 0.4800 0.0644 -0.0285 0.9886 CAT - Math Computation (Average) 0.0582 0.8026 -0.3949 0.5113 CAT - Math Concept Application (Average) 0.2179 0.3472 -0.2364 0.6723 CAT - Math Computation (Gifted) -0.0398 0.8650 -0.5092 0.4295 CAT - Math Concept Application (Gifted) -0.0251 0.9204 -0.4944 0.4442 CAT - Reading Vocabulary (LD) 0.2100 0.4122 -0.2933 0.7125 CAT - Reading Comprehension (LD) -0.1061 0.6818 -0.6080 0.3958 CAT - Reading Vocabulary (Average) -0.1238 0.5892 -0.5772 0.3297 CAT - Reading Comprehension (Average) 0.0939 0.6818 -0.3594 0.5471 CAT - Reading Vocabulary (Gifted) -0.2692 0.2628 -0.7406 0.2022 CAT - Reading Comprehension (Gifted) -0.1552 0.5156 -0.6252 0.3148 Harter's Perceived Competence -Academic (LD) -0.5714 0.0286* -1.0828 -0.0600 Harter's Perceived Competence -Academic (Average) 0.6725 0.0046** 0.2068 1.1381 Harter's Perceived Competence -Academic (Gifted) 0.3766 0.1188 -0.0968 0.8500 Coopersmith - School (LD) -0.8305 0.0032** -1.3526 -0.3084 Coopersmith - School (Average) 0.1969 0.3954 -0.2572 0.6510
118
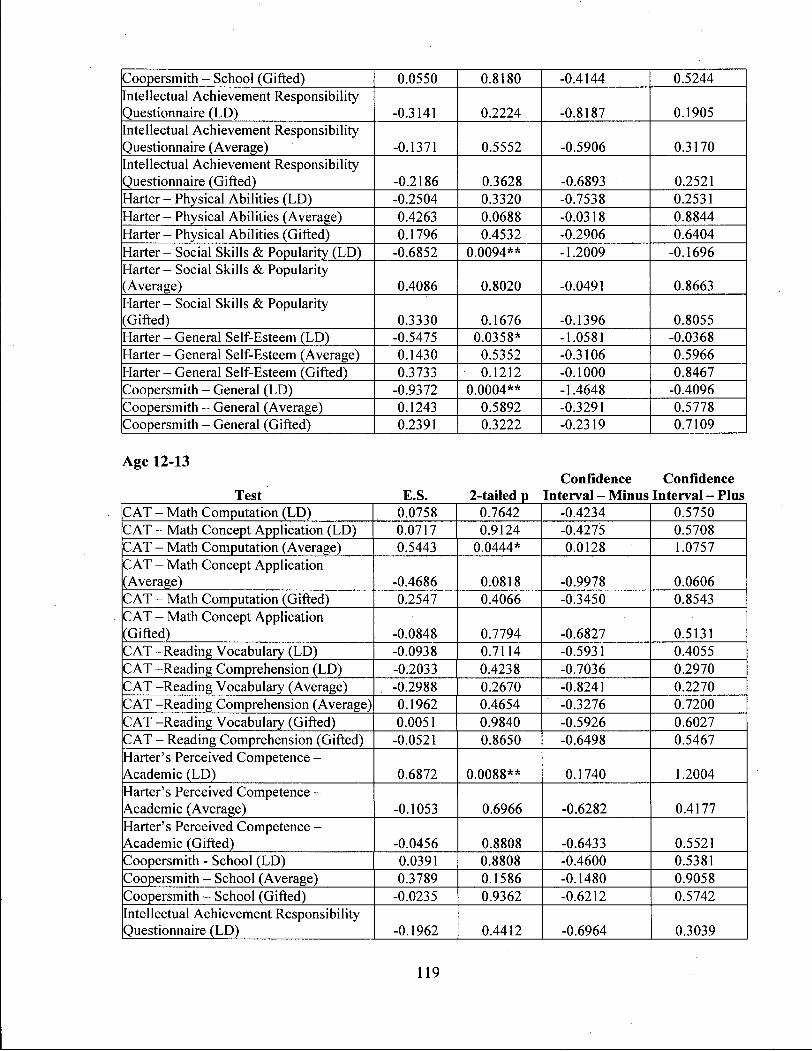
Coopersmith - School (Gifted) 0.0550 0.8180 -0.4144 0.5244 Intellectual Achievement Responsibility Questionnaire (LD) -0.3141 0.2224 -0.8187 0.1905 Intellectual Achievement Responsibility Questionnaire (Average) -0.1371 0.5552 -0.5906 0.3170 Intellectual Achievement Responsibility Questionnaire (Gifted) -0.2186 0.3628 -0.6893 0.2521 Harter - Physical Abilities (LD) -0.2504 0.3320 -0.7538 0.2531 Harter - Physical Abilities (Average) 0.4263 0.0688 -0.0318 0.8844 Harter - Physical Abilities (Gifted) 0.1796 0.4532 -0.2906 0.6404 Harter - Social Skills & Popularity (LD) -0.6852 0.0094** -1.2009 -0.1696 Harter - Social Skills & Popularity (Average) 0.4086 0.8020 -0.0491 0.8663 Harter - Social Skills & Popularity (Gifted) 0.3330 0.1676 -0.1396 0.8055 Harter - General Self-Esteem (LD) -0.5475 0.0358* -1.0581 -0.0368 Harter - General Self-Esteem (Average) 0.1430 0.5352 -0.3106 0.5966 Harter - General Self-Esteem (Gifted) 0.3733 0.1212 -0.1000 0.8467 Coopersmith - General (LD) -0.9372 0.0004** -1.4648 -0.4096 Coopersmith - General (Average) 0.1243 0.5892 -0.3291 0.5778 Coopersmith - General (Gifted) 0.2391 0.3222 -0.2319 0.7109
Age 12-13 Confidence Confidence
Test E.S. 2-tailed p Interval - Minus Interval - Plus CAT - Math Computation (LD) 0.0758 0.7642 -0.4234 0.5750 CAT - Math Concept Application (LD) 0.0717 0.9124 -0.4275 0.5708 CAT - Math Computation (Average) 0.5443 0.0444* 0.0128 1.0757 CAT - Math Concept Application (Average) -0.4686 0.0818 -0.9978 0.0606 CAT - Math Computation (Gifted) 0.2547 0.4066 -0.3450 0.8543 CAT - Math Concept Application (Gifted) -0.0848 0.7794 -0.6827 0.5131 CAT -Reading Vocabulary (LD) -0.0938 0.7114 -0.5931 0.4055 CAT -Reading Comprehension (LD) -0.2033 0.4238 -0.7036 0.2970 CAT -Reading Vocabulary (Average) -0.2988 0.2670 -0.8241 0.2270 CAT -Reading Comprehension (Average) 0.1962 0.4654 -0.3276 0.7200 CAT -Reading Vocabulary (Gifted) 0.0051 0.9840 -0.5926 0.6027 CAT - Reading Comprehension (Gifted) -0.0521 0.8650 -0.6498 0.5467 Harter's Perceived Competence -Academic (LD) 0.6872 0.0088** 0.1740 1.2004 Harter's Perceived Competence -Academic (Average) -0.1053 0.6966 -0.6282 0.4177 Harter's Perceived Competence -Academic (Gifted) -0.0456 0.8808 -0.6433 0.5521 Coopersmith - School (LD) 0.0391 0.8808 -0.4600 0.5381 Coopersmith - School (Average) 0.3789 0.1586 -0.1480 0.9058 Coopersmith - School (Gifted) -0.0235 0.9362 -0.6212 0.5742 Intellectual Achievement Responsibility Questionnaire (LD) -0.1962 0.4412 -0.6964 0.3039
119
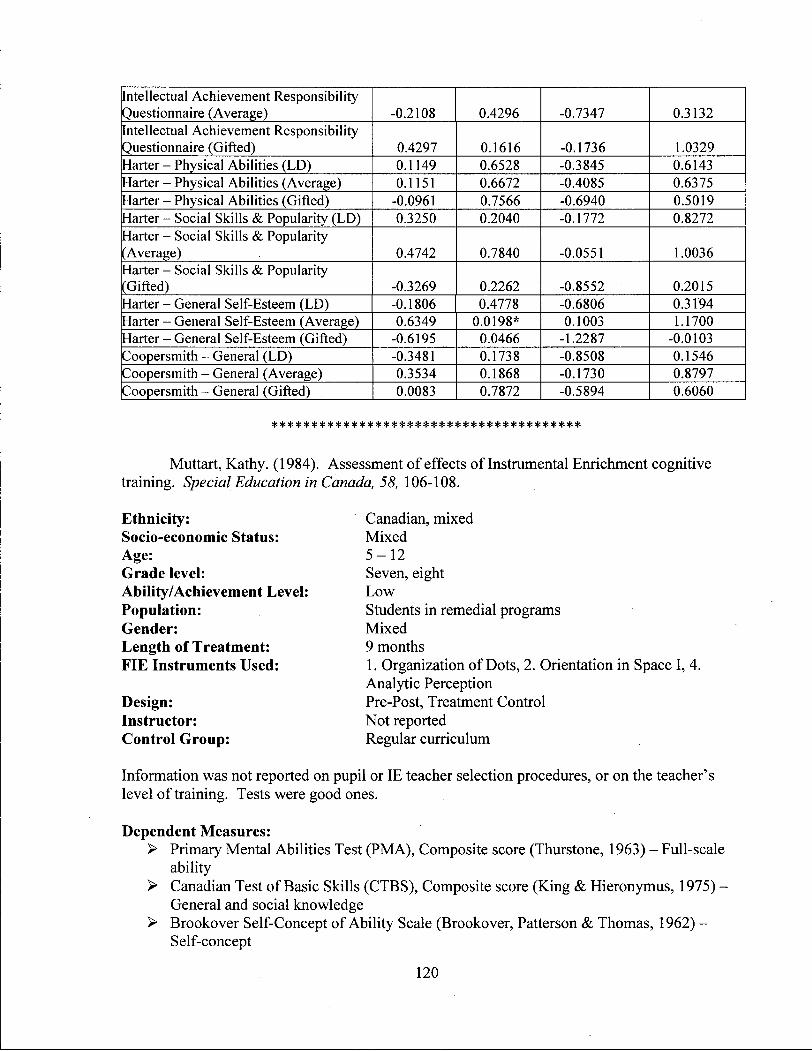
Intellectual Achievement Responsibility Questionnaire (Average) -0.2108 0.4296 -0.7347 0.3132 Intellectual Achievement Responsibility Questionnaire (Gifted) 0.4297 0.1616 -0.1736 1.0329 Harter - Physical Abilities (LD) 0.1149 0.6528 -0.3845 0.6143 Harter - Physical Abilities (Average) 0.1151 0.6672 -0.4085 0.6375 Harter - Physical Abilities (Gifted) -0.0961 0.7566 -0.6940 0.5019 Harter - Social Skills & Popularity (LD) 0.3250 0.2040 -0.1772 0.8272 Harter - Social Skills & Popularity (Average) 0.4742 0.7840 -0.0551 1.0036 Harter - Social Skills & Popularity (Gifted) -0.3269 0.2262 -0.8552 0.2015 Harter - General Self-Esteem (LD) -0.1806 0.4778 -0.6806 0.3194 Harter - General Self-Esteem (Average) 0.6349 0.0198* 0.1003 1.1700 Harter - General Self-Esteem (Gifted) -0.6195 0.0466 -1.2287 -0.0103 Coopersmith - General (LD) -0.3481 0.1738 -0.8508 0.1546 Coopersmith - General (Average) 0.3534 0.1868 -0.1730 0.8797 Coopersmith - General (Gifted) 0.0083 0.7872 -0.5894 0.6060
Muttart, Kathy. (1984). Assessment of effects of Instrumental Enrichment cognitive training. Special Education in Canada, 58, 106-108.
Ethnicity: Socio-economic Status: Age: Grade level: Ability/Achievement Level: Population: Gender: Length of Treatment: FIE Instruments Used:
Design: Instructor: Control Group:
Canadian, mixed Mixed 5 - 1 2 Seven, eight L o w Students in remedial programs Mixed 9 months 1. Organization of Dots, 2. Orientation in Space I, 4. Analytic Perception Pre-Post, Treatment Control Not reported Regular curriculum
Information was not reported on pupil or IE teacher selection procedures, or on the teacher's level of training. Tests were good ones.
Dependent Measures: > Primary Mental Abilities Test ( P M A ) , Composite score (Thurstone, 1963) - Full-scale
ability > Canadian Test of Basic Skills (CTBS) , Composite score (King & Hieronymus, 1975) -
General and social knowledge > Brookover Self-Concept of Abil i ty Scale (Brookover, Patterson & Thomas, 1962) -
Self-concept
120
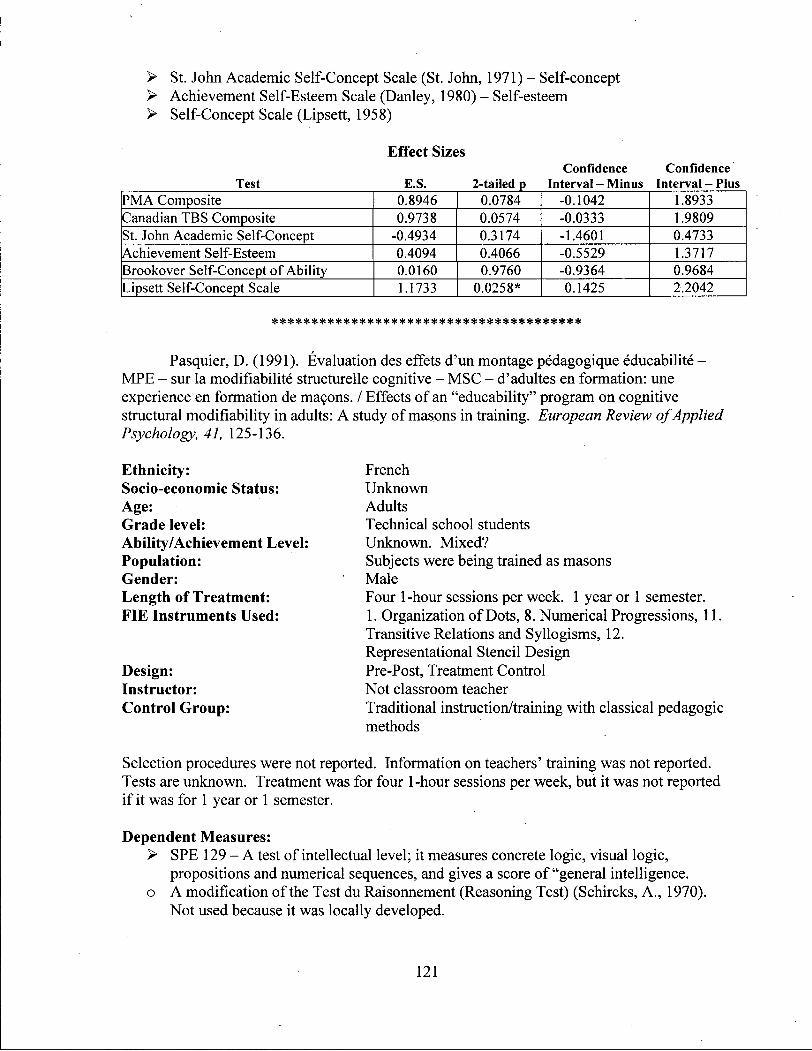
> St. John Academic Self-Concept Scale (St. John, 1971) - Self-concept > Achievement Self-Esteem Scale (Danley, 1980) - Self-esteem > Self-Concept Scale (Lipsett, 1958)
Effect Sizes Confidence Confidence
Test E.S. 2-tailed p Interval - Minus Interval - Plus P M A Composite 0.8946 0.0784 -0.1042 1.8933 Canadian TBS Composite 0.9738 0.0574 -0.0333 1.9809 St. John Academic Self-Concept -0.4934 0.3174 -1.4601 0.4733 Achievement Self-Esteem 0.4094 0.4066 -0.5529 1.3717 Brookover Self-Concept of Ability 0.0160 0.9760 -0.9364 0.9684 Lipsett Self-Concept Scale 1.1733 0.0258* 0.1425 2.2042
Pasquier, D . (1991). Evaluation des effets d'un montage pedagogique educabilite -M P E - sur la modifiabilite structurelle cognitive - M S C - d'adultes en formation: une experience en formation de macons. / Effects of an "educability" program on cognitive structural modifiability in adults: A study of masons in training. European Review of Applied Psychology, 41, 125-136.
Ethnicity: Socio-economic Status: Age: Grade level: Ability/Achievement Level: Population: Gender: Length of Treatment: FIE Instruments Used:
Design: Instructor: Control Group:
French Unknown Adults Technical school students Unknown. Mixed? Subjects were being trained as masons Male Four 1-hour sessions per week. 1 year or 1 semester. 1. Organization of Dots, 8. Numerical Progressions, 11. Transitive Relations and Syllogisms, 12. Representational Stencil Design Pre-Post, Treatment Control Not classroom teacher Traditional instruction/training with classical pedagogic methods
Selection procedures were not reported. Information on teachers' training was not reported. Tests are unknown. Treatment was for four 1 -hour sessions per week, but it was not reported i f it was for 1 year or 1 semester.
Dependent Measures: > S P E 129 - A test of intellectual level; it measures concrete logic, visual logic,
propositions and numerical sequences, and gives a score of "general intelligence. o A modification of the Test du Raisonnement (Reasoning Test) (Schircks, A . , 1970).
Not used because it was locally developed.
121

Effect Sizes Confidence Confidence
Test E.S. 2-tailed p Interval - Minus Interval - Plus SPE 129 1.5121 0.0040** 0.4823 2.5419
Perry, J .L. (1986). Field initiated research: A field based study of the effects of an educational program on school adjustment of mildly handicapped secondary school students. Final report. Raleigh, N C : Wake County Public School System. (ERIC Document Reproduction Service N o . E D 312 848)
Ethnicity: Socio-economic Status: Age: Grade level: Ability/Achievement Level: Population:
Gender: Length of Treatment: FIE Instruments Used: Design:
Instructor: Control Group:
American, Mixed Mixed Approximately 1 2 - 1 5 7 and 8 - secondary M i x e d Varying Exceptionalities: Learning Disabled (LD) , Educable Mentally Handicapped ( E M H ) , Emotionally Handicapped (EH) Predominantly male Grade seven - 2 years, grade eight - 1 year, and retest Not reported Pre-Post, Treatment Control, Random assignment to groups Not reported Regular curriculum
Students in special education classes in selected schools were randomly assigned to treatment or control conditions. This resulted in groups having balanced exceptionalities. Information on teacher training was not reported. Tests were good ones.
Dependent Measures: > Otis-Lennon School Abi l i ty Test - used as a measure of verbal-educational
intelligence. > Peabody Picture Vocabulary - used as a measure of language, i.e., receptive
vocabulary > Burks Behaviour Rating Scale. Subtests: Excessive Self-Blame, Excessive Anxiety,
Excessive Withdrawal, Excessive Dependency, Poor Ego Strength, Poor Physical Strength, Poor Coordination, Poor Intellectuality, Poor Academics, Poor Attendance, Poor Impulse Control, Poor Reality Control, Poor Sense of Identity, Excessive Suffering, Poor Anger Control, Excessive Sense of Persecution, Excessive Aggression, Excessive Resistance, Poor Social Conformity. These subtests required an effect size with a minus sign to indicate positive growth.
o Wechsler Intelligence Scale for Children (WISC) - Not used because it was used as a pre-test only.
o Activi ty Participation Measure, grade nine - Not used as these were not standardized measures
122

o Weighted-grade-point-average ( W G P A ) , school attendance ( A B S ) , special education students meeting the academic course requirement through taking non-special education academic courses ( A C A D ) and the number of course hours taken for the total academic year (HRS). Grades seven, eight and nine. - Not used as these were not standardized measures
Effect Sizes 1 Year
Confidence Confidence Test E.S. 2-tailed p Interval - Minus Interval - Plus
Otis Lennon School Ability 0.0830 0.7530 -0.4007 0.5666 PPVT 0.2524 0.2758 -0.2003 0.7050
Lower d scores are best below Burks - Excessive Aggression -0.0332 0.8886 -0.4842 0.4178 Burks - Excessive Self Blame 0.1841 0.4238 -0.2678 0.6360 Burks - Excessive Anxiety 0.2339 0.3124 -0.2185 0.6863 Burks - Excessive Withdrawal 0.1805 0.4354 -0.2713 0.6324 Burks - Excessive Dependency 0.2250 0.3320 -0.2274 0.6773 Burks - Poor Ego Strength 0.2849 0.2186 -0.1682 0.7380 Burks - Poor Physical Strength 0.0487 0.8336 -0.4024 0.4997 Burks - Poor Coordination 0.4684 0.0444* 0.0117 0.9251 Burks - Poor Intellectuality 0.1898 0.4122 -0.2621 0.6418 Burks - Poor Academics 0.3400 0.1416 -0.1142 0.7938 Burks - Poor Attendance 0.1857 0.4180 -0.2662 0.6376 Burks - Poor Impulse Control -0.0049 0.9840 -0.4559 0.4461 Burks - Poor Reality Control 0.2344 0.3078 -0.2181 0.6868 Burks - Poor Sense of Identity 0.2632 0.2542 -0.1896 0.7160 Burks - Excessive Suffering 0.1343 0.5620 -0.3171 0.5858 Burks - Poor Anger Control -0.0709 0.7566 -0.5220 0.3802 Burks - Excessive Sense of Persecution 0.0786 0.7338 -0.3726 0.5297 Burks - Excessive Resistance 0.0246 0.9124 -0.4264 0.4757 Burks - Poor Social Conformity 0.2015 0.3844 -0.2506 0.6535
2 Years Confidence Confidence
Test E.S. 2-tailed p Interval - Minus Interval - Plus Otis-Lennon -0.0197 0.9204 -0.4211 0.3818 PPVT 0.0495 0.8026 -0.3461 0.4451
Lower d scores are best below Burks - Poor Social Conformity 0.1259 0.5286 -0.2699 0.5218 Burks - Excessive Aggression 0.1912 0.3422 -0.2052 0.5875 Burks - Excessive Self Blame -0.0468 0.8180 -0.4424 0.3489 Burks - Excessive Anxiety 0.0086 0.9680 -0.3869 0.4042 Burks - Excessive Withdrawal 0.1939 0.3370 -0.2024 0.5903 Burks - Excessive Dependency -0.2613 0.1970 -0.6583 0.1358 Burks - Poor Ego Strength 0.0544 0.7872 -0.3413 0.4500 Burks - Poor Physical Strength -0.2393 0.2380 -0.6361 0.1576 Burks - Poor Coordination -0.1008 0.6170 -0.4965 0.2950
123

Burks - Poor Intellectuality -0.2177 0.2802 -0.6143 0.1789 Burks - Poor Academics -0.3009 0.1388 -0.6990 0.0967 Burks - Poor Attendance -0.0760 0.7040 -0.4717 0.3197 Burks - Poor Impulse Control -0.1242 0.5352 -0.5201 0.2716 Burks - Poor Reality Control 0.0895 0.6600 -0.3062 0.4852 Burks - Poor Sense of Identity 0.2857 0.1586 -0.1116 0.6831 Burks - Excessive Suffering 0.0888 0.6600 -0.3069 0.4845 Burks - Poor Anger Control -0.0061 0.9760 -0.4016 0.3895 Burks - Excessive Sense of Persecution -0.2345 0.2460 -0.6313 0.1622 Burks - Excessive Resistance 0.0322 0.8728 -0.3633 0.4278
Rand, Y . , Mintzker, Y . , Mil ler , R., Hoffman, M . B : , & Friedlender, Y . (1981). The Instrumental Enrichment program: Immediate and long-term effects. In P. Mittler (Ed.), Frontiers of knowledge in mental retardation: Vol. 1. Social, educational, and behavioural aspects (pp. 141-152). Baltimore, M D : University Park Press.
Ethnicity: Socio-economic Status: Age: Grade level: Ability/Achievement Level: Population: Gender: Length of Treatment:
FIE Instruments Used: Design: Instructor: Control Group:
Israeli and African and Asian immigrants L o w 1 6 - 1 9 Draftees into the Israeli Defence Forces L o w Mixed Predominantly male Follow-up 2 years after the original Instrumental Enrichment study. See Rand et al. (1979) and Feuerstein etal . (1980) None Pre-Post, Treatment Control Not classroom teacher General Enrichment
This was a follow-up measurement 2 years after the original study by Feuerstein et al. (1980). Comparisons were between 57 matched pairs as well as on a larger population that was pre-and post-tested. The quality of tests is unknown.
Dependent Measures: > Dapar Intelligence Test. A composite score derived from an Otis-type verbal test and a
nonverbal test based on Raven's Progressive Matrices. > Hebrew Language Development Test. A composite score from reading, writing,
comprehension and vocabulary measures. > Zadakh. A composite score is obtained by a structured interview. A general prediction
rating is given regarding future army success. o Kaba - Not used because, in addition to using the educational background of the
subject, it is a composite of the three tests, above.
124

Effect Sizes Confidence Confidence
Test E.S. 2-tailed p Interval - Minus Interval - Plus Dapar Intelligence Test 0.4475 0.0026** 0.1571 .0.7379 Hebrew Language Development -0.0383 0.7872 -0.3138 0.2371 Zadakh - Army Success Prediction -0.2090 0.2460 -0.5637 0.1456
Rand, Y . , Tannenbaum, A . J., & Feuerstein, R. (1979). Effects of Instrumental Enrichment on the psychoeducational development of low-functioning adolescents. Journal of Educational Psychology, 71, 751-763.
This paper presents the results of the study which Feuerstein, Rand, Hoffman & Mi l l e r (1980), above, detail. It gives data on the Levidal Self-Concept Scale that was omitted from the 1980 publication.
Effect Sizes Confidence Confidence
Test E.S. 2-tailed p Interval - Minus Interval - Plus Levidal - Failure at School -0.0868 0.6456 -0.4541 0.2805 Levidal - Motivation for Learning -0.0315 0.8650 -0.3987 0.3356 Levidal - Confidence in Success 0.0673 0.7188 -0.3000 0.4345
Robinson, S.S. (1983). The effectiveness of Instrumental Enrichment in changing the learning and behavior problems of emotionally disturbed children and adolescents. Unpublished doctoral dissertation, Vanderbilt University, Nashville, T N .
Ethnicity: Socio-economic Status: Age: Grade level: Ability/Achievement Level: Population: Gender: Length of Treatment: FIE Instruments Used:
Design: Instructor: Control Group:
American, mixed Mixed 10, 11 - ? Elementary L o w Emotionally disturbed Mixed (six boys, three girls) 12 weeks, 50 hours 1. Organization of Dots, 2. Orientation in Space I, 3. Comparisons, 10. Illustrations (selected pages to four children) Pre-Post, Treatment Control Not classroom teacher Regular curriculum
Control group students were matched to the distribution of the IE students. Treatment and Control groups were independent. The teacher had taught IE to emotionally disturbed children
125

before, but was not a member of the school staff. She was initially unfamiliar with the students.
Dependent Measures: > Raven's Standard Progressive Matrices > Daily Behavior Rating Scale - developed by the U C L A / N P I Parent Training Cl in ic .
There were results for ratings by parents and for ratings by teacher-counsellors. o Mastery Test 1 - Not used because it was a measure of the mastery of IE material only, o Vocabulary Test - Not used because it was a measure of familiarity with vocabulary
taught in the first two instruments of the IE program, o Moos Family Environment Scale - Not used because group data were not reported.
Results were graphed individually, o Semi-Structured Interview - Not used because information was reported in narrative
form for each individual child, o File Data Sheet - Not used because information was presented in narrative form for
each child.
Effect Sizes Confidence Confidence
Test E.S. 2-tailed p Interval - Minus Interval - Plus Raven's Progressive Matrices, Standard -0.2199 0.6384 -1.1467 0.7068 Daily Behaviour Rating Scale - Parent Ratings -0.6428
Unable to calculate as only t-statistics were reported.
Daily Behaviour Rating Scale - Teacher Ratings 0.6142
Unable to calculate as only t-statistics were reported.
Rusling, E . G . (1984). An exploration of the initial effects of the first two instruments of Instrumental Enrichment. Unpublished doctoral dissertation, University o f Rochester, Rochester, N Y .
Ethnicity: Socio-economic Status: Age: Grade level: Ability/Achievement Level:
Population: Gender: Length of Treatment: FIE Instruments Used: Design:
Instructor: Control Group:
American, mixed Middle class 1 2 - 1 4 Junior High school Class A : L o w average, Class B : Handicapped to Borderline L D and E M H Mixed 5 months 1. Organization of Dots, 2. Orientation in Space I Pre-Post, Treatment Control. Nonequivalent control group design. Not classroom teacher Regular curriculum
The study used a Nonequivalent control group design in which intact classrooms are used and were assumed to represent collectives. Treatment was nested under classrooms. The subjects
126

themselves did not select treatment or nontreatment. Treatment and Control groups were independent. Over the period of the study teachers received a total of six days o f training on the two IE instruments used. A support person was also trained and assigned to the classes. Tests were good ones.
Dependent Measures: > Motor-Free Visual Perception Test ( M V P T ) (Colarusso & Hammil , 1972) > Benton Visual Retention Test ( B V R T ) (Benton, 1974) (Visual-motor) > Porteus Mazes Age Score (Porteus, 1955) (Visual-motor) > Trai l-Making Test, Part A (Reitan, 1971) (Visual-motor, numbers) > Trai l-Making Test, Part B (Reitan, 1971) (Visual-motor, numbers and letters) > Raven Coloured Progressive Matrices, Sets A , A B , B (Raven, 1947) > Raven Standard Progressive Matrices, Sets C , D , E
Effect Sizes Confidence Confidence
Test E.S. 2-tailed p Interval - Minus Interval - Plus
Raven's Coloured Matrices, A, AB, B -Class A -0.3200 0.4654 -1.1818 0.5419 Raven's Coloured Matrices, A, AB, B -Class B 0.3934 0.3734 -0.4712 1.2580 Ravens Standard Matrices, C, D, E, -Class A 0.1361 0.7566 -0.7213 0.9935 Ravens Standard Matrices, C, D, E, -Class B 0.4552 0.3030 -0.4122 1.3226 Motor-Free Visual Perception, Class A -0.2095 0.6312 -1.0683 0.6492 Motor-Free Visual Perception, Class B 0.8082 0.0750 -0.0824 1.6988 Porteus Maze, Class A 0.0000 1.0000 -0.8564 0.8564 Porteus Maze, Class B 1.3566 0.0052** 0.4070 2.3061
Lower d scores are best below Benton error score, Class A 0.1250 0.7718 -0.7322 0.9822 Benton error score, Class B -0.5811 0.0124* -1.4553 0.2932 Trail-Making, Part A, Time, Class A 0.8907 0.0524 -0.0071 1.7884 Trail-Making, Part A, Time, Class B 0.1581 0.7188 -0.6996 1.0158 Trail-Making, Part B, Time, Class A 0.3825 0.3344 -0.4817 1.2466 Trail-Making, Part B, Time, Class B -0.1349 0.7566 -0.9922 0.7225
127

Samuels, M . , Roadhouse, A . , Conte, R., & Zirk, H . (1984). Instrumental enrichment with low achieving adolescents. Alberta Department of Education. (ERIC Document Reproduction Service N o . E D 263 244)
Ethnicity: Socio-economic Status: Age: Grade level: Ability/Achievement Level: Population: Gender:
Length of Treatment:
FIE Instruments Used:
Design:
Instructor: Control Group:
Canadian, Mixed Mixed 1 2 - 1 7 Secondary (Vocational School) L o w Mixed Mixed 1 year, 2 years - approximately 270 hours, maintenance year(year 3) Year One: 1. Organization of Dots, 2. Orientation in Space I, 3. Comparisons, 4. Analytic Perception, 5. Categorization, 8. Numerical Progressions, 10. Illustrations, Year 2: 1. Organization of Dots (continued), 6. Instructions, 7. Temporal Relations, 8. Numerical Progressions (continued), 9. Family Relations, 10. Illustrations Pre-Post, Treatment Control with follow-up test in year 3 Not classroom teacher Regular curriculum
Students were selected on the basis of having a Fu l l Scale IQ of at least 90, below average achievement, no history of serious attendance or behaviour problems and no history of language difficulties. Ha l f of this group was randomly assigned to experimental and control groups. Treatment and Control groups were independent within each year, but not among the 3 years. Testing revealed no significant differences between the groups on any variable. The experimental group was taught by an itinerant teacher from the Calgary Learning Centre who had received three, 1 -week long workshops on the theory, goals, and intervention techniques of IE. The teacher was also observed and supervised by one of the authors of the study. Tests were good ones.
Dependent Measures: > Raven's Standard Progressive Matrices (Raven, 1956) > Wechsler Intelligence Scale for Children-Revised (WISC-R) - Used for year 2 > Woodcock-Johnson Tests of Cognitive Abi l i ty (Woodcock, R . W . , & Johnson, M . B . ,
1977) - Reasoning Cluster - Not used for year 2 as the W I S C - R was used. > Learning Potential Assessment Device ( L P A D ) (Feuerstein, Rand & Hoffman, 1979,
1980) > Numerical Progressions - Year 3 > Set Variations II - Years 2 and 3 > Rey's Complex Figure Drawing Test - Year 2
> Canadian Tests of Basic Skills
128

> Reading Vocabulary > Reading Comprehension > Total Math
> Woodcock-Johnson Tests of Achievement (Woodcock, R . W . , & Johnson, M . B . ) > Reading Cluster > Mathematics Cluster
> Holtzman and Brown Survey of Study Habits and Attitudes and Will iams Perception of Thinking Abilities Scale - a combined modified version of these tests was used. Eight subtests: Attitude Towards Education, Attitude Towards Teacher, Study Habits & Test Taking, Motivation, Academic Interest, Need Achievement, Achievement Anxiety ( A n effect size with a minus sign indicates positive growth), Perception of Thinking Abi l i ty
> Stony Brook Classroom Observation Code. Eight subtests, four of which required an effect size with a minus sign to indicate positive growth: Interference, Off-Task Behaviour, Minor Motor Behaviour and Gross Motor Behaviour. The other four were Absence o f Behaviours, Responding to Questions, Solicitation, Request Clarification
o Stanford Diagnostic Mathematics Test - Not used in as it was administered only in the initial test period before treatment,
o Teacher Behaviour Ratings - Not used as these were not standardized measures o Attendance and Attrition Records - Not used as these were not standardized measures
Effect Sizes 1 Year
Confidence Confidence Test E.S. 2-tailed p Interval - Minus Interval - Plus
LP AD Numerical Progressions 0.7917 0.1706 -0.3405 1.9238 H & B Attitude Towards Education -1.1987 0.0478* -2.3825 -0.0149 H & B Attitude Toward Teacher -0.4278 0.4472 -1.5306 0.6750 H & B Study Habits & Test Taking -1.0422 0.0784 -2.2039 0.1195 H & B Motivation -0.8313 0.1528 -1.9675 0.3050 H & B Academic Interest -1.1962 0.0478* -2.3796 -0.0128 H & B Need Achievement 0.5015 0.3734 -0.6059 1.6088 H & B Perception of Thinking Ability -1.0441 0.0784 -2.2061 0.1178 Stony Brook, Absence of Behaviour 0.3363 0.4066 -0.4589 1.1315 Stony Brook, Responds to Questions -0.2331 0.5620 -1.0255 0.5592 Stony Brook, Solicitation -0.2436 0.5486 -1.0362 0.5490 Stony Brook, Request for Clarification 0.6158 0.1362 -0.1922 1.4237 Woodcock-Johnson Reasoning -0.1444 0.7948 -1.2363 0.9475 Woodcock-Johnson Math Cluster -0.7431. 0.1970 -1.8704 0.3841 Canadian TBS - Total Math -0.4568 0.4180 -1.5612 0.6477 Woodcock-Johnson Reading Cluster 0.0668 0.9044 -1.0240 1.1576 Canadian TBS - Reading Vocabulary -0.5716 0.3124 -1.6839 0.5408 Canadian TBS - Reading Comprehension -0.2835 0.6100 -1.3793 0.8124
Lower d scores are best below H & B Achievement Anxiety 0.0683 0.4532 -1.0224 1.1591 Stony Brook - Interference -0.2449 0.5418 -1.0375 0.5478 Stony Brook-Off Task -0.3588 0.3788 -1.1547 0.4372 Stony Brook - Minor Motor Movement -0.5159 0.2076 -1.3184 0.2867 Stony Brook - Gross Motor Standing -0.2972 0.2327 -1.0912 0.4968
129

2 Years Confidence Confidence
Test E.S. 2-tailed p Interval - Minus Interval - Plus LP AD Set Variations II 0.5659 0.3174 -0.5460 1.6778 WISC-R Full Scale Score -0.2342 0.6100 -1.1378 0.6694 WISC-R Performance Scale -0.2797 0.5418 -1.1846 0.6252 WISC-R Verbal Scale -0.1804 0.6966 -1.0828 0.7220 H & B Attitude Towards Education -1.0131 0.0872 -2.1710 0.1448 H & B Attitude Toward Teacher -0.0311 0.9522 -1.1216 1.0594 H & B Study Habits & Test Taking 0.4148 0.4592 -0.6872 1.5169 H & B Motivation -0.3729 0.5092 -1.4727 0.7269 H & B Academic Interest -0.0117 0.9840 -1.1022 1.0788 H & B Need Achievement -0.0128 0.9840 -1.1033 1.0777 H & B Perception of Thinking Ability -0.8148 0.1616 -1.9493 0.3197 Stony Brook, Absence of Behaviour -0.1733 0.7040 -1.0559 0.7093 Stony Brook, Responds to Questions -0.6621 0.1528 -1.5666 0.2425 Stony Brook, Solicitation -0.1813 0.6892 -1.0640 0.7015 Stony Brook, Request for Clarification 0.2616 0.5620 -0.6231 1.1462 WISC-R Full Scale -0.2342 0.6100 -1.1378 0.6694 Woodcock-Johnson Reasoning -0.2868 0.6100 -1.3828 0.8092 Woodcock-Johnson Math Cluster -0.5222 0.3576 -1.6310 0.5865 Canadian TBS - Total Math -1.6784 0.0094** -2.9455 -0.4114 Woodcock-Johnson Reading Cluster 0.1528 0.7872 -0.9392 1.2448 Canadian TBS - Reading Vocabulary -0.0332 0.9522 ' -1.1237 1.0573 Canadian TBS - Reading Comprehension -0.0820 0.8808 -1.1722 1.0089
Lower d scores are best below H & B Achievement Anxiety -0.0546 0.9204 -1.1453 1.0360 Stony Brook - Interference -0.0540 0.0904 -0.9352 0.8271 Stony Brook-Off Task 0.7864 0.0910 -0.1277 1.7004 Stony Brook - Minor Motor Movement -0.5705 0.2150 -1.4690 0.3280 Stony Brook - Gross Motor Standing 0.8172 0.0802 -0.0994 1.7338
3-Year Follow-up Confidence Confidence
Test E.S. 2-tailed p Interval - Minus Interval - Plus LPAD Numerical Progressions 0.2545 0.6456 -0.8403 1.3494 LPAD Set Variations II 0.4291 0.4472 -0.6738 1.5319 Raven's Standard Matrices -0.5193 0.3576 -1.6279 0.5893 H & B Attitude Towards Education -0.5481 0.3320 -1.6587 0.5625 H & B Attitude Toward Teacher -0.0895 0.8728 -1.1805 1.0015 H & B Study Habits & Test Taking -0.5808 0.3078 -1.6939 0.5322 H & B Motivation -0.3339 0.5486 -1.4318 0.7640 H & B Academic Interest -0.2946 0.5962 -1.3909 0.8017 H & B Need Achievement -0.4081 0.4654 -1.5100 0.6936 H & B Perception of Thinking Ability -1.2718 0.0366* -2.4668 -0.0768 Stony Brook, Absence of Behaviour -0.1837 0.7566 -1.3337 0.9663 Stony Brook, Responds to Questions 1.3813 0.0166* 0.1076 2.6551 Stony Brook, Solicitation 1.3571 0.0358* 0.0358 2.6268
130

Woodcock-Johnson Reasoning 0.2465 0.6600 -0.8481 1.3410 Woodcock-Johnson Math Cluster -1.1799 0.0500* -2.3609 0.0011 Canadian TBS - Total Math -0.4780 0.3954 -1.5838 0.6278 Woodcock-Johnson Reading Cluster -0.6405 0.2628 -1.7583 0.4774 Canadian TBS - Reading Vocabulary -0.4569 0.4180 -1.5614 0.6476 Canadian TBS - Reading Comprehension -0.5200 0.3576 -1.6285 0.5886
Lower d scores are best below H & B Achievement Anxiety -0.5993 0.2938 -1.7138 0.5152 Stony Brook - Interference 0.4824 0.4180 -0.6813 1.6462 Stony Brook-Off Task 0.7171 0.2340 -0.4659 1.9000 Stony Brook - Minor Motor Movement 0.0896 0.8808 -1.0586 1.2378
Sarot, G.F. (1985). The effects of Feuerstein's Instrumental Enrichment on the academic achievement of educationally exceptional students. Unpublished doctoral dissertation, Northern Arizona University, A Z .
Ethnicity: Socio-economic Status: Age: Grade level: Ability/Achievement Level: Population: Gender: Length of Treatment: FIE Instruments Used: Design:
Instructor: Control Group:
American - Anglo and Mexican Mixed Ages reported as: Under 16.5 and Over 16.5 9 - 1 2 L o w Special education students (RSP & SDC) Mainly male 1 year Fourteen instruments Pre-Post, Treatment Control, Repeated Measures design. Post-test and follow-up in year 2 Not classroom teacher Journal writing program
The study used a repeated measures design. Standard deviations were not reported so the effect size was calculated from an adjusted F-statistic. Treatment and control groups were assigned through the district's normal scheduling procedures. The control group received a journal-writing program. From the population of special education teachers who volunteered, two were randomly selected for the treatment classes and two for the control classes. Information regarding teacher training was not presented. Dependent Measures:
> Peabody Individual Achievement Test (PIAT) - Reading Comprehension, Reading Recognition and Mathematics
131

Effect Sizes Confidence Confidence
Test E.S. 2-tailed p Interval - Minus Interval - Plus PIAT Reading Comprehension
0.2606 Unable to calculate as only F-statistics were reported.
PIAT Reading Recognition 0.2183
Unable to calculate as only F-statistics were reported.
PIAT Math 0.2489
Unable to calculate as only F-statistics were reported.
Schneider, Sari D . (1996). Instrumental Enrichment and locus of control, self-esteem and academic performance in grade five. Unpublished master's thesis, University of British Columbia, Vancouver, British Columbia, Canada.
Ethnicity: Socio-economic Status: Age: Grade level: Ability/Achievement Level: Population: Gender: Length of Treatment: FIE Instruments Used: Design: Instructor:
Canadian mixed - Asian L o w Ten Five M i x e d M i x e d M i x e d 4.5 months - 15 hours 1. Organization of Dots Pre-Post, Treatment Control Not classroom teacher Regular curriculum Control Group:
Inner-city schools with existing IE programs were invited to participate as the treatment group and matching schools without IE were invited to participate as the control group. Two schools participated, one with IE and one without. The treatment group consisted of fourteen students from two classrooms in the school offering IE, while the control group consisted of 23 students from three classrooms in the school that did not. The groups were similar on demographic characteristics. There were two classroom teachers for the control group and for the treatment group in addition to the IE group. Good tests.
Dependent Measures: > Coopersmith Self-Esteem Questionnaire (Coopersmith, 1975/1991) > Intellectual Achievement Responsibility Scale (Crandall, Katkovsky & Crandall, 1965) o Teacher Student Behaviour Checklist - Not used, as it was locally developed by the
researcher.
Effect Sizes Confidence Confidence
Test E.S. 2-tailed p Interval - Minus Interval - Plus Intellectual Achievement Responsibility 0.3924 0.2502 -0.2780 1.0627 Coopersmith -0.2751 0.4180 -0.9425 0.3922
132

Shayer, M . , & Beasley, F. (1987). Does Instrumental Enrichment work? British Educational Research Journal, 13, 101-119.
Shayer received training in IE and the L P A D from Feuerstein. He then had experience teaching a group of students with severe learning disabilities. On the basis of this experience he provided initial training and regular inservice guidance of the one IE teacher in the study. Pupils in a single class were assigned randomly to either the experimental or to the control group. Treatment and Control groups were independent. The control group received a cognitive training program called "Think Tank." Good tests.
Dependent Measures: > Piagetian battery (Fluid intelligence) > Raven's Matrices (Fluid intelligence) > Thurstone Primary Mental Abilities ( P M A ) test - Spatial Relations, Verbal (words),
Reasoning (words), Perceptual Speed, Numbers (Number Facility). Numbers was calculated as part of the Math achievement analysis rather than as part of the Abi l i ty analysis.
o Verbal (p), Reasoning (p) - Not used because I could not ascertain to what (p) referred.
o Numbers - Not used because I was could not ascertain i f this was a measure of the ability to reason with numbers or of arithmetic ski l l .
> Neale Reading Test - Comprehension, Accuracy, and Rate > N F E R Maths Attainment o Richmond Basic Skills - Map Reading, Graphs and Tables - Not used because means
and standard deviations were not reported, o Learning Potential Assessment Device ( L P A D ) (Feuerstein, Rand & Hoffman, 1979,
1980) Set Variations II - Not used as this measured pre-post changes of observed deficient cognitive functions according to Feuerstein's theory.
Ethnicity: Socio-economic Status: Age: Grade level: Ability/Achievement Level: Population: Gender: Length of Treatment:
FIE Instruments Used: Design: Instructor: Control Group:
British Mixed 12 - 14 at the beginning of the study Secondary L o w M i x e d Mixed 20 months (2 years) - 3 lessons per week - 150 teaching units Not reported Pre-Post, Treatment Control, Random selection Not classroom teacher Cognitive training called "Think Tank"
133

Effect Sizes Confidence Confidence
Test E.S. 2-tailed p Interval - Minus Interval - Plus Raven's Standard Matrices 0.1223 0.8336 -1.0104 1.2550 Piagetian Battery 0.2213 0.7040 -0.9138 1.3564 Thurstone's P M A - Spatial Relations 0.5740 0.3320 -0.5806 1.7287 Thurstone's P M A - Perceptual Speed 0.1343 0.8180 -0.9986 1.2672 Thurstone's P M A - Reasoning (words) 0.2242 0.6966 -0.9110 1.3593 Thurstone's P M A - Verbal (words) -0.1836 0.7490 -1.3176 0.9504 NFER Maths Attainment 0.2428 0.6744 -0.8930 1.3786 P M A - Number Facility -0.1416 0.8104 -1.2746 0.991557 Neale Reading Comprehension -0.3838 0.4902 -1.5258 0.7582 Neale Reading Accuracy -0.1517 0.7948 -1.2849 0.9815 Neale Reading Rate 0.6138 0.2984 -0.5441 1.7718
Skuy, M . , Lomofsky, L . , & Fridjhon, P. (1993). Effectiveness of Instrumental Enrichment for pre-service teachers in a disadvantaged South African community. International Journal of Cognitive Education & Mediated Learning, 3, 92-108
Ethnicity: "Coloured" South African English and Afrikaans speaking Mixed Average age: 18 First year students at a teacher training college. Mixed? Disadvantaged because of segregated education system. Mixed 31 hours over sixteen weeks. 1. Organization of Dots, 2. Orientation in Space I, 3. Comparisons, 4. Analytic Perception, 5. Categorization, 9. Family Relations, 10. Illustrations
Design: Pre-Post, Treatment Control Instructor: Six of 16 lecturers who had volunteered. Control Group: College dramatic program.
The study used a quasi-experimental, two-group repeated measures design. The control group was chosen because the students had been selected for a college dramatic program and would not be available to be in the treatment group. The treatment group consisted of the balance of the first year students. Groups were "broadly the same . . . in terms of age, SES, intellectual and academic ability, gender and home language." IE teachers were six of the 16 college lecturers who had volunteered to undergo an intensive seventeen-day workshop to become accredited IE teachers. Tests were good ones.
Socio-economic Status: Age: Grade level: Ability/Achievement Level: Population: Gender: Length of Treatment: FIE Instruments Used:
134

Dependent Measures: > Similarities: Combined Similarities subtests from the W I S C - R and the W A I S - R . > The Organizer (Feuerstein, Rand, Haywood, Hoffman and Jensen, 1983). It is part o f
the Learning Potential Assessment Device ( L P A D ) . > Raven Standard Progressive Matrices ( R S P M , Raven, 1958). o Reading cloze test - Not used because it was a non-standardized, informal measure, o Teacher Attitude Questionnaire - Not used because it consisted of open-ended
questions.
Effect Sizes
Test E.S. 2-tailed p Confidence Confidence
Interval - Minus Interval - Plus LPAD Organizer 0.3057 0.1416 -0.1032 0.7145 Raven's Standard Matrices 0.1540 0.4592 . -0.2535 0.5615 Similarities 0.6670 0.0012** 0.2515 1.0825
Socket, B . C . (1989). The effects of Instrumental Enrichment on cognitive performance, achievement, self-concept and maladjustment of adolescent females in residential treatment. Unpublished doctoral dissertation, Temple University, Philadelphia, P A .
Ethnicity: Socio-economic Status: Age: Grade level: Ability/Achievement Level: Population: Gender: Length of Treatment:
FIE Instruments Used:
Design: Instructor: Control Group:
American, mixed Mixed 1 4 - 2 0 Secondary (Residential treatment) Mixed ability, low achievement Socially and emotionally disturbed (EH) Female 1 year - 3 times a week for 45 minutes each period -approximately 80 hours 1. Organization of Dots, 2. Orientation in Space I, 3. Comparisons, 4. Analytic Perception Pre-Post, Treatment Control, Random selection of Ss Classroom teacher Structured games and activities
Subjects were randomly selected to be in either the treatment or control group. The control group received structured games and activities. The two teachers from the experimental group were selected by the school principal. Both teachers as well as the researcher received 5 days of training in the rationale and implementation of IE. Good tests.
Dependent Measures: > Piers-Harris Children's Self-Concept Scale (Piers, 1984) - Total score > Raven's Standard Progressive Matrices (1977?). F test was an A N C O V A > California Achievement Test ( C A T ) ( C T B / M c G r a w - H i l l , 1986). F test was an
A N C O V A
135

o Bristol Social Adjustment Guides (1970) - Under-reacting - Not used. Total score not reported
o Bristol Social Adjustment Guides (1970) - Over-reacting - Not used. Total score not reported
Test
Effect Sizes
E.S. Confidence Confidence
Piers Harris Children's Self-Concept Scale 0.2165 0.5686 -0.5264 0.9595 Raven's Standard Progressive Matrices
0.3093 Unable to calculate as only F-statistics were reported.
CAT - Total Reading 0.5235
Unable to calculate as only F-statistics were reported.
CAT - Total Language 0.6372
Unable to calculate as only F-statistics were reported.
CAT - Total Math 0.4066
Unable to calculate as only F-statistics were reported.
Stavros, D . (1989). Evaluation of the Instrumental Enrichment project, 1988-1989. Evaluation and Testing Department, Office of Instructional Improvement, Detroit Public Schools. Detroit, IL. (ERIC Document Reproduction Service No . E D 361 462.
Ethnicity: Socio-economic Status: Age: Grade level: Ability/Achievement Level: Population:
Gender: Length of Treatment: FIE Instruments Used: Design: Instructor: Control Group:
American, mixed Not reported Not reported - approximately 1 2 - 1 4 Thirty classrooms in Middle Schools L o w Educable Mentally Impaired (EMI) , Learning Disabled (LD) Not reported - mixed 1 year, three to five 50 minute periods per week Not reported Pre-Post, Treatment Control Not classroom teacher Regular curriculum
Experimental and control classrooms were matched. Teachers and staff were trained. This is a study that began in 1986 and was to continue in 1990.
Dependent Measures: > Stanford Diagnostic Reading and Mathematics subtests, Form A , Red Level o Cognitive Abilities Test, Forms D and E (1986). Not used because only pretest scores
were reported for this time period, o Absences from school, number of students mainstreamed, positive changes in teacher
attitudes and feelings towards IE instructional practice, teachers' ratings of changes in
136

student behaviour, and parents' report of positive changes in students' behaviour at home. Not used as these were informal, locally developed measures.
Effect Sizes Confidence Confidence
Test E.S. 2-tailed p Interval - Minus Interval - Plus Stanford Diagnostic Reading
0.159223 Unable to calculate as only F-statistics were reported.
Stanford Diagnostic Math 0.603846
Unable to calculate as only F-statistics were reported.
Til lman, M . M . (1986). The effectiveness of Feuerstein's Instrumental Enrichment program in teaching thinking skills to learning disabled adolescents. Unpublished doctoral dissertation, Georgia State University, Atlanta, G A .
Ethnicity: Socio-economic Status: Age: Grade level: Ability/Achievement Level:
Population: Gender: Length of Treatment: FIE Instruments Used:
Design: Instructor: Control Group:
American, mixed Middle to upper-middle class 1 1 - 1 4 6 - 8 . Private middle school Average to above average IQ. Academic achievement low in one or more areas. M i l d to moderate Learning Disabilities Mixed , mainly male 1 year - 52 hours. 45 minutes per week. 1. Organization of Dots, 2. Orientation in Space I, 3. Comparisons, 4. Analytic Perception, 6. Instructions Pre-Post, Treatment Control Not classroom teacher Current Events
The study used a repeated measures pre-post design. Experimental group obtained by randomly selecting one-half of the students from each of three middle school classes. The control group received current event activities. Treatment and Control groups were independent. Teachers were trained in the use of the materials. The experimenter was one of these teachers.
Dependent Measures: > Standard Progressive Matrices (Raven, 1958) > Cognitive Abilities Test (CAT) , Mult i -Level Edition, Form 3. (Thorndike & Hagan,
1983) - Verbal, Quantitative and Nonverbal batteries. (Grade 6: Level D , Grade 7: Level E , Grade 8: Level F).
> Iowa Tests of Basic Skills, Form 5 (Hieronymus & Lindquist, 1971)
137

Effect Sizes Confidence Confidence
Test E.S. 2-tailed p Interval - Minus Interval - Plus Raven's Standard Matrices 0.4166 0.3222 -0.4103 1.2436 Thorndike & Hagen, (CAT) Nonverbal 0.6864 0.1096 -0.1555 1.5282 Thorndike & Hagen, (CAT) Verbal 0.7245 0.0930 -0.1200 1.5690 Thorndike & Hagen, (CAT) Quantitative 0.4993 0.2380 -0.3315 1.3300 ITBS 0.7238 0.0930 -0.1207 1.5682
Tzuriel, D . , & Alfassi, M . (1994). Cognitive and motivational modifiability as a function of the instrumental enrichment (IE) program. Special Services in the Schools, 8, 91-128.
Ethnicity: Socio-economic Status: Age: Grade level: Ability/Achievement Level: Population: Gender: Length of Treatment: FIE Instruments Used:
Design: Instructor: Control Group:
Israeli L o w Average-12 .3 Seven Mixed Mixed M i x e d 2 years. 2 weekly hours; approximately 130 hours 1. Organization of Dots, 2. Orientation in Space I, 3. Comparisons, 4. Analytic Perception, 6. Instructions, 8. Numerical Progressions, 9. Family Relations, 13. Orientation in Space II, 14. Classifications, 15. Organization of Dots II, Cartoons Pre-Post, Treatment Control Not classroom teacher Regular curriculum
The IE program group was in a school which had implemented IE for several years whereas the nonprogram group was in a school which had not introduced the IE program. Treatment and Control groups were independent.
Dependent Measures: > Learning Potential Assessment Device ( L P A D ) (Feuerstein, Rand & Hoffman, 1979,
1980) > Set Variations II - Total score used > The Organizer Test - Gain score used > Representational Stencil Design Test Raven's Progressive Matrices (Raven, 1959) - Not used. Administered as a pre-intervention dynamic assessment only. The Intrinsic versus Extrinsic Orientation Scale (Harter, 1980, 1981) - Not used as means and standard deviations were not reported and the analysis was a M A N O V A . The Perception of Competence Scale (Harter, 1979) - Not used as means and standard deviations were not reported and the analysis was a M A N O V A .
138
o
o

Effect Sizes
Test E.S. 2-tailed p Confidence Confidence
Interval - Minus Interval - Plus L P A D Organizer (Gain score) 0.5547 0.0002** 0.2656 0.8438 L P A D RSTD -0.0949 0.5092 -0.3788 0.1890 L P A D Set Variations II (Total score) 0.0021 0.9920 -0.2816 0.2859
Uditsky, B . (1984). Feuerstein's Instrumental Enrichment program, vocational skills, and adolescents with a mild developmental delay. Unpublished master's thesis, University o f Alberta, Edmonton, Alberta, Canada.
Ethnicity: Socio-economic Status: Age: Grade level: Ability/Achievement Level: Population: Gender: Length of Treatment:
FIE Instruments Used: Design: Instructor: Control Group:
Canadian, M i x e d Mixed 1 1 - 1 3 First year of a secondary school for M M H L o w M i l d l y developmentally delayed ( M M H ) Mixed 1 year - four to five times a week for 1 hour each; approximately 162 hours Organization of Dots, Orientation in Space I Pre-Post, Treatment Control Not classroom teacher Regular curriculum
Students were randomly selected from first year classes and, at the beginning of the school year, the school administration identified experimental and control classes. IE classes were taught by teachers trained in approved FIE summer workshops. One teacher had completed the first level of training and the second had had more experience and had completed the second level of training.
Dependent Measures: > Wide Range Achievement Test (Jastak & Jastak, 1978) - The oral reading score was
not used. Math and Spelling were used. > Schonell Reading Test - Used for the reading score o Vocational Task: Error Detection, Descriptive Discrimination, Circuit Board
Construction, Overt Strategies - not used because they were locally developed o Vocational Evaluation Rating Scale - not used as it was a locally developed,
informal assessment
Effect Sizes
Test E.S. 2-tailed p Confidence Confidence
Interval - Minus Interval - Plus W R A T - Spelling 0.1974 0.6312 -0.6160 1.0109 W R A T - Math 0.3692 0.3844 -0.4621 1.2005 Schonell Reading -0.2605 0.5418 -1.1013 0.5802
139

Wilson, D . L . (1994). The effects of Feuerstein's Instrumental Enrichment on at risk seventh grade students. Unpublished doctoral dissertation, University of Oklahoma, Norman.
The study used a quasi-experimental pre-post control-group design with matched pairs. Students were matched according to discipline referrals, race, gender, special education category, grade point average, ability index scores (SAI) and I T B X scores. Pretest measures indicated that the two groups were comparable. N o information was given regarding teacher training; however, no one can teach IE without training.
Dependent Measures: > Developmental Test of Visual Motor Integration (VMI) (Beery, 1989) > Self-Perception Profile for Children (Harter, 1985) - Six subscales: scholastic
competence, athletic competence, social acceptance, physical appearance, behavioural conduct, global self-worth
> Iowa Test of Basic Skills (ITBS) - Composite score > Woodcock-Johnson Test of Achievement - Dictation subtest
o Absences - Not used as this was an informal measure o Discipline Referrals - Not used as this was an informal measure
Ethnicity: Socio-economic Status: Age: Grade level: Ability/Achievement Level: Population:
Gender: Length of Treatment:
Design: Instructor: Control Group:
FIE Instruments Used:
American mixed (Indian, Afro-American, Caucasian) Mixed Approximately 13 Seven Mixed Mixed - Special Education, Remedial Reading, Gifted. A t risk because of poor behaviour Mixed Four months - 1 semester - five days a week for 55 minutes a day - approximately 73 hours 1. Organization of Dots, 2. Orientation in Space I, 3. Comparisons, 4. Analytic Perception Pre-Post, Treatment Control Not classroom teacher Regular curriculum
140
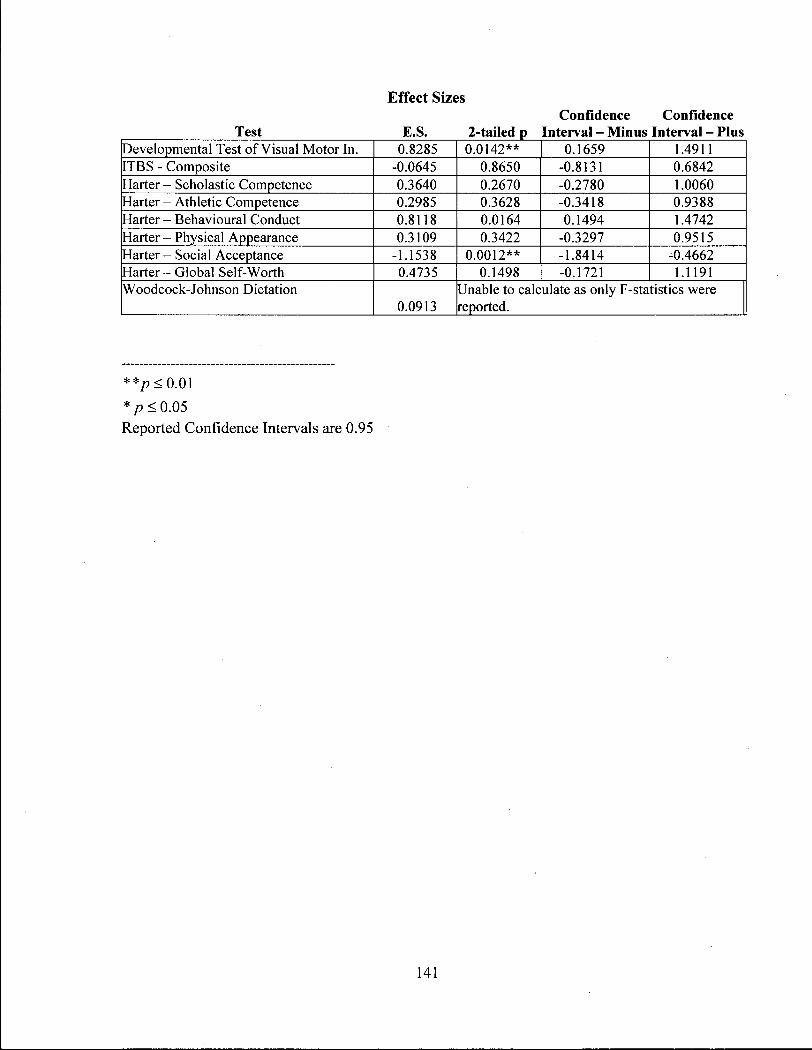
Effect Sizes Confidence Confidence
Test E.S. 2-tailed p Interval - Minus Interval - Plus Developmental Test of Visual Motor In. 0.8285 0.0142** 0.1659 1.4911 ITBS - Composite -0.0645 0.8650 -0.8131 0.6842 Harter - Scholastic Competence 0.3640 0.2670 -0.2780 1.0060 Harter - Athletic Competence 0.2985 0.3628 -0.3418 0.9388 Harter - Behavioural Conduct 0.8118 0.0164 0.1494 1.4742 Harter - Physical Appearance 0.3109 0.3422 -0.3297 0.9515 Harter - Social Acceptance -1.1538 0.0012** -1.8414 -0.4662 Harter - Global Self-Worth 0.4735 0.1498 -0.1721 1.1191 Woodcock-Johnson Dictation Unable to calculate as only F-statistics were
0.0913 reported.
**p<0.01
*p<0.05 Reported Confidence Intervals are 0.95
141

Appendix B
Summary of Studies Not Used
Twenty excluded studies are listed below. Four were excluded because they did not
have a control group; two compared two different types of treatment to see which was better,
but did not have a control group; 11 reported data in a manner that made analyses impossible;
one used informal, non-standardized measures; one study included no data; and one study was
available only on unreadable microfiche.
Chinn, P . A . (1995). The long-term effects of Feuerstein's Instrumental Enrichment on the reasoning, intelligence, high school graduation rate, and post-school adjustment of 12 to 15 year old students with educable mentally handicapping and learning disabled diagnoses. Unpublished doctoral dissertation, University of Kansas, Lawrence, K S
o Subjects for this study were the same as used by Kenney (1984) in his original investigation. The study was not used because the exact number of students re-tested was not reported and statistical information was incomplete. It was not possible, therefore, to calculate effect sizes.
Dufner, H . A . (1988). Effects of training in problem solving on the problem-solving abilities of gifted fourth graders: A comparison of the Future Problem Solving and Instrumental Enrichment programs. Unpublished doctoral dissertation, Texas A & M University, College Station, T X .
o The study compared FIE and the Future Problem Solving programs. There was no control group.
Bachor, D . (1988). Do mentally handicapped adults transfer cognitive skills from the Instrumental Enrichment classroom to other situations or settings? The Mental Retardation & Learning Disability Bulletin, 16, 14-28.
o It was not possible to calculate effect sizes because the author presented data in the form of median ranks, and his analyses were Mann Whitney U and Wilcoxon Ranked Sum W .
Howie, D . , Richards, R., & Pirihi , H . (1993). Teaching thinking skills to Maori adolescents. International Journal of Cognitive Education & Mediated Learning, 3, 70-91.
o Data presented in this study was not suitable for calculation in a meta-analysis. This was a single subject research design. Raw scores were reported and graphed.
142

Kaniel , S., Reichenberg., R. (1992). Instrumental Enrichment - effects of generalization and durability with talented adolescents. Gifted Education International, 8, 128-135.
o The authors analyzed the data with two- and three-way A N C O V A , and although they reported means and standard deviations, they did not report the number o f subjects in each group. It was, therefore, not possible to calculate effect sizes.
Livingstone, K . S . (1988). An investigation of the effectiveness of Feuerstein's Instrumental Enrichment program on field dependent seventh grade science students. Unpublished doctoral dissertation, University of Wyoming, W Y .
o Not used because the fiche was unreadable, and because there were two treatment groups: FIE and Learning Cycle training. There was no control group.
Maxcy, P. (1990). Combining a comprehensive thinking program, Feuerstein's Instrumental Enrichment, with computer thinking programs. International Journal of Cognitive Education & Mediated Learning, 1, 45-61.
o Data presented in this study was not suitable for calculation in a meta-analysis. Results consisted of counts of correct and incorrect student responses.
Nakra, O. (1990). The teacher as mediator: A n evaluation of Feuerstein's Instrumental Enrichment program in the classroom. International Journal of Cognitive Education & Mediated Learning, 3, 221-227.
o In this study videotaped teacher behaviours for IE and non-IE teachers were analyzed. N o data were presented on how these teachers influenced the performance of students on standardized measures of ability, achievement, behaviour or self-concept.
Narrol, PL, Silverman, FL, & Waksman, M . (1982). Developing cognitive potential in vocational high school students. Journal of Educational Research, 76. 107-112.
o The authors reported means, standard deviations and p-values for five classrooms, but not the number of students in each group. It was, therefore, not possible to calculate effect sizes.
Niles, R. (1989). Effects of adult modeling and adult direction on impulsive behavior of learning disabled adolescents. Unpublished doctoral dissertation, Fordham University, N e w York.
o The study compared FIE and the Meichenbaum adult modeling approaches. There was no control group.
Offenberg, R . M . (1992). A study of the effects of Instrumental Enrichment on middle-grade, minority students. Report No. 9225. Philadelphia, P A . Philadelphia School District (ERIC Document Reproduction Service No . E D 361 462.
o There was no control group; instead the amounts of FIE instruction varied. In addition the data were evaluated with regression analyses and results were reported as beta-weights.
143

Pachal, Judith. (1986). The use of Instrumental Enrichment with hearing impaired adolescents. Unpublished master's thesis, University of Alberta, Edmonton, Alberta, Canada,
o This is a qualitative study of problem-solving deficiencies in four hearing-impaired adolescents.
Rothen, W . (1989). Interim evaluation of the Instrumental Enrichment (I.E.) Program. Unpublished report, Vancouver, B C .
o This was a pre-post study with no control group.
Ruiz Bolivar, C . (1983). The effects of the Instrument Enrichment (sic) Program on cognitive and non-cognitive factors on the subjects of different socio-economic levels. Ciudad Guayana, Venezuela: Office of Social and Cultural Development.
o The section presenting data were omitted in the copy I was able to obtain.
Silverman, H . , & Waksman, M . (1988). Feuerstein's Instrumental Enrichment: Elicitation of cognitive interaction in the classroom. Canadian Journal of Special Education, 4, 133-149.
o This is a study of the effect of using IE as a means of improving the questioning style and general teaching style of teachers. Attempts were made to administer standardized measures of reading and mathematics to students to analyze how the quality of teacher questioning effected their achievement. The students objected to the measures, however, and attempts to formally measure academic achievement were abandoned.
Skuy, M . , Mentis, Martene, Durbach, F., Cockcroft, K . , Fridjhon, P., & Mentis, Mandia. Crosscultural comparison of effects of Instrumental Enrichment on children in a South African mining town. School Psychology International, 16, 265-282.
o There was no specific control group in this study. Instead there were comparisons among groups of African, "Coloured," white English-speaking, and white Afrikaans-speaking students.
Skuy, M . , Mentis, Mandia, Arnott, A . , & Nkwe, I. (1990). Combining Instrumental Enrichment and creativity/socioemotional development for disadvantaged gifted adolescents in Soweto: Part 2. International Journal of Cognitive Education & Mediated Learning, 2, 93-102.
o The study was analyzed by means of an A N C O V A with three groups, and although mean scores for the IE and control groups were reported, the number of subjects in those groups was not. It was, therefore, not possible to calculate the effect sizes.
Stavros, D . (1987). Evaluation of the Instrumental Enrichment project, 1986-1987. Evaluation and Testing Department, Office of Instructional Improvement, Detroit Public Schools. Detroit, IL.
o This paper did not give data that could be used in this analysis. Assessments consisted of locally developed measures of absences from school, number of students mainstreamed into regular classes, teachers' positive attitudes towards students and parents' reports of positive changes in the students. There were standardized measures of reading and mathematics; however, only pretest results were reported. Results of the 1988-1989 year are presented above in the Summary of Studies Used.
144

Thickpenny, J.P., & Howie, D.R. (1990). Teaching thinking skills to deaf adolescents: The implementation and evaluation of Instrumental Enrichment. International Journal of Cognitive Education & Mediated Learning, 3, 193-209.
o The study consisted of a single subject research design plus a t-test between pre- and post-measures of both experimental and control groups. The two groups were not directly compared at the post stage.
Yitzhak, V . (1981). The effect of Feuerstein's Instrumental Enrichment program on the cognitive reasoning of retarded performers as measured by Piaget's conservation tasks. Unpublished doctoral dissertation, University of Toronto,
o Not used because the microfiche was unreadable.
145

Appendix C
Results from Random Effects Analyses
In the following table, the two-tailed p-value gives the probability that the effect size is
not zero. In addition, i f zero is within the 95% confidence interval the effect size does not
significantly differ from zero. Note that the two-year and follow-up results from Samuels
(1984) are not included with the larger group. This is because the same subjects that were in
her 1-year measurement were used in the second- and third-year measurements, and the
results, therefore, would not be independent. This rationale also applies to second-year and
follow-up measurements by Church (1994), Perry (1986), and Rand, Mintzker, et al. (1981).
(See Appendix A. )
146
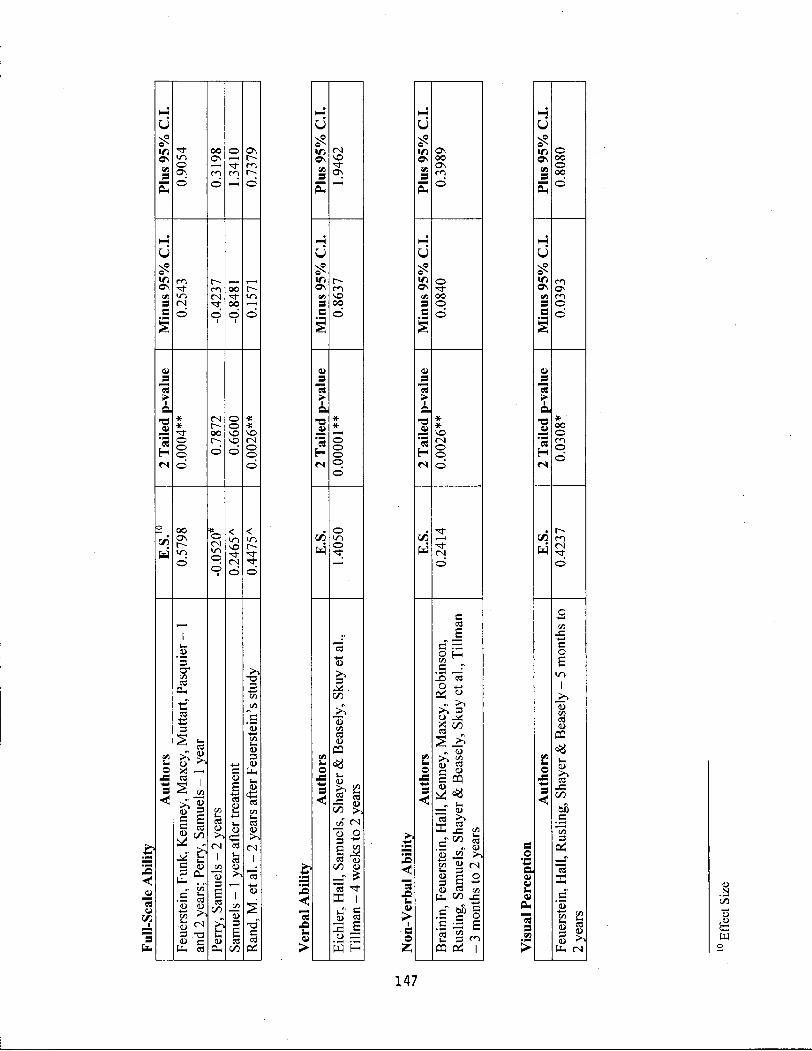
£1 10 ON m o
ON ©
|ON| as 3
eu
>
cn •t i n rs
'3 H N l
* * O o o
CO w
00 ON m
I
c/) ca OH tf
oo ON
©
ON
m rs O
i n
rs o ©
o rs m o
< in r--
©
o X ca
CO
s
4) c c
c
°5
'S t o D 3
ti. s-
OS
ca O >, rs .T3
C ca
ca u ,
Irs I <U 3 e ca CO
<L> <£ ca >- , ca >i'
ca >, rs
T3 C ca
Pi
0 S
>r, ON
«o ON
'3 H rs
CO
>
rs NO ON
cn NO 00
# * o o o o
o i n o
ca -*-»
3 CO
ca PQ
2 ca CO >J
rs u o 3 S t/5 ca u co w = * "ca ffi I ^ 5 o —
-< "J3 -a
I • a o Z
ON 00 ON cn
o oo o
* NO rs o o
rs
s ca
Ja ca o -w
>, 3 q 5̂
S i ?
A> ca e <u c PQ
— <a a £
.5 g> 3
. S 5 E 2 3 m PQ pi I
io ON °
i s 00
ho I ON |
S
e
ON o
ctt >
•a * ' 00 o o
CO
a
a a
P H
s
tree, rs
o
c o s m I
_>> D c/i ca <u PQ
JC CO eS
Vi
IS l i c" '5
+ H
V3 3 b rs
l-c
ca
147

s-o
1 5T
< ©
o I s CO cd
1=1
CH*
J
i n
o
o
o ON
o
S cd
cS
>. CN o
3 N
H
3
00
ft
Z,
I
CD
s o Cfl
!. o u cc
s o
> tu u
a " O « w
«< 75 &. tu c CU
rj
o
o m o o
o
i n CN
o
co
c
CD 3 U
U ,
_C o 3
o
S3
CN
co J5
o
148
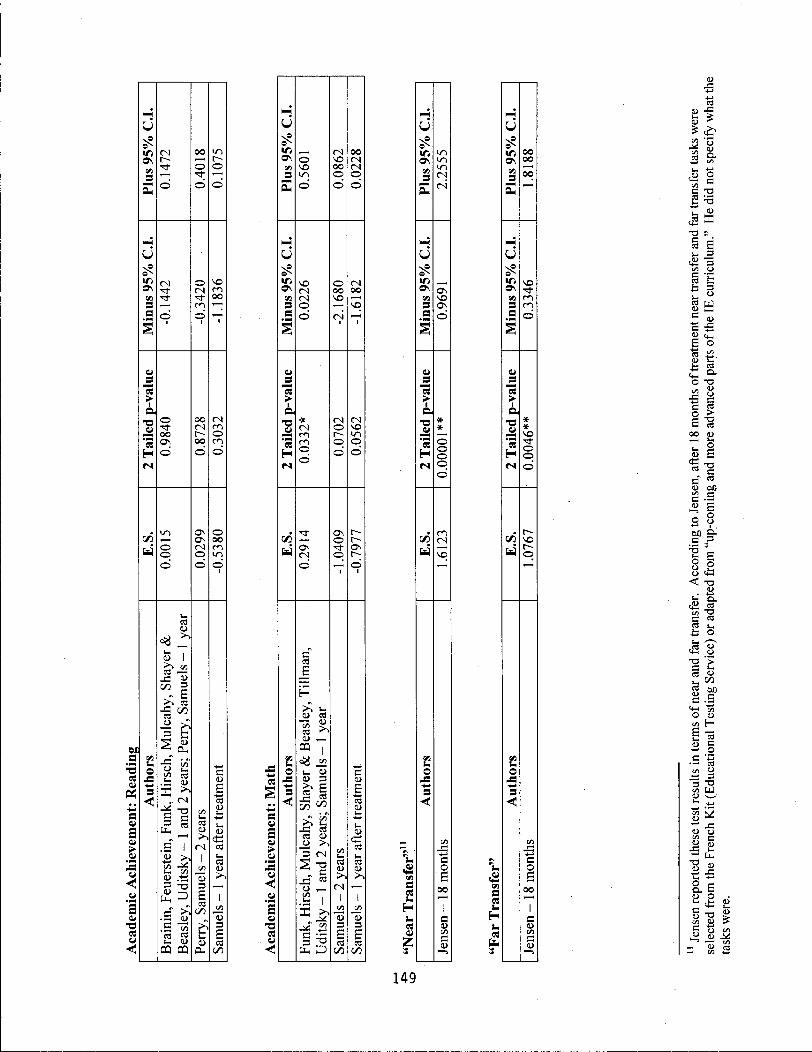
l u
I o\ ce a
H
•3 CS
DS
0)
a 01
Lc u
a O)
cs
CN
CN
O
00 CTN
o o
ea
s I
^ » c/. CC >—•
*i ca
-c in
55 ca 3. OJ
X H ., CN
1^ SH c/i <u <U 1 - = ;
.a u 1
.S ~
CQ CQ
CD
ca
ca u ,
E 0>
ca
o NO uo
NO CN CN O
* CN cn cn o
CN
cj ca
ca ^
CQ ,
1- u
53 ^ ^ cn
- C ea ca p ,
3 CN
cn .a l DC H ^ C/5
NO
S -
cn B cs s-
H
ca 0)
C*M CO a cs
H 1. cs fa
0©
CJ
-g la
cj
ra P -
, C J g cn " C "O ca L3 b ^ IH U
£ K ca E >- 5
c£2 3 cn o
i ' l c3 r r l CJ _ C CJ c -5 J2 C+H E o
cj X-
O "O a 3 •s S c ca
E ^ OO CD CD
a a
CJ 0 0
2 v.
^ e §1 O <C
< T3 cj h el's. =2 « ^ ca JM c o
eg 8 C3 CJ
i n C «
S c° r n SH
O <D cn f—
C "ea CJ C *" o
00 O H 3
3 -a CD w 1— ^
1 3 CJ o c/i rn CJ S
H3 LH fe
l l 0 c Q> O Ui .1—
« CJ 5 S c j cn
_ cj to — CO
149

l u
I ,r' ON
I ON a B
_ej
H
CO
te Ol CJ ej s
CO "« e o GO S. cj
PH
CJ u s CJ
« a ©
CJ
CO
00
o
o o NO
T T
o C N ON
ON o o
-3-
I c o
CD T3
J= o co
-a c cS ^ a JC CS CS u, "3 C N
^ j= £ = cS o
3 +H
on "c '5
3
<t> m i~ <u CS
CJ
e cj
«S & o
CJ CO u S 01
T3 cs ej
NO 00 ro C N
o
in 00 ON o
o oo
©
o o o
C N
o
I
-o c CS ai tf eS 4= 3
CS
o c o U
o
NO m NO ©
© 00
©
© C N C N ©
co
O -4-* JC c o E in
i -
'3 c j= o co >>
•§ o
o 3
§ IS
s2 «i
ON OA
s C N
ro ©
ON SB
s ©
>
"3 H CN
CO
NO OO
C N
©
T f © C N
cj CJ a « « CJ a a < a cs CJ CJ
a CJ
al E o O "3 ^ej J = PH
CJ CJ
a CJ •9 « a o U
CJ
co
C o
-a c cS — cS O
c o
<o ON s
© © NO
I ON S 8
l i
CJ
s "3
C N
hs , '3
H
C N r-T f ©
CO NO ©
ro NO
"a a o
PH •o a cs
3 co
CJ CJ
a cs a CJ CJ CJ
CJ o CO
cS cS D
C o
150

\m\ ON
in NO co o
I D I ON cn S
>
CO CN NO co
•o
H
CN T i ro
eo ro
ca CD
, 1>
o oo
"1
IT) ON
m ION
, '3 H CN
e _o tf ca
£ tf o
•o e cs cn eu •o s
O
S "3 V
e <u
o co
ON ON ro ON
©
O ON T f
©
m NO 0©
ca CD >>
CN o co
J* CD CD-
T f
I ca
+ H
ca E 3 ca
x> c u c
an
cn t-< H ca ca
CD CD >>
an
CN 06 1 1
cn CO
ler.
CD CD ler.
3 3
o E E ca ca oo oo
s-s o
• mm > cs J = eu
pa
HH
m o in 0 0 ON in ^ H CO cn CN S in T f 0 0
PH ©
u in o NO o ON ro CO Cfl ON S CN NO CN
Min
© 1
d I
d •
eu js "3 CL
led T f CN CN
led in o led
ON CN 'cs in T f
H © d d cs
t» o o T f t» NO ON
W NO o W CO 0 0
© d d
!_ o c
cn u ss
S ca ss <<
els
- 2
ye
afte
r tr
ea
3 -̂ca E ca E CD ca oo a 1 oo a 1
'33 1/3
"CD cn "CD 3
uer 3
E uer
E ca CD ca oo H- oo
s o 1 J =
PQ
CU
CU z
u IT) CN m CN ON r- T f ON cn © CN S T f ' 1 r-
© © d
HH
o m ON
© in co m ON CN r- © cn CN CN CO S T f CN T f
Min
© i © • © 1
CU J S
"« >• a
© NO © NO m ©
i - H
'3 ON in NO
H © © d CN
T f m m NO ON
w © in T f w © © © • © • ©
in i—
ors ca
ors ye
c J = CN CD
C s i ES
els
real
*-< 3 •*-»
ea
ry,
Sam
CD
• ry,
Sam
ar
aft
cn CD
uel
Pe
>-,
E c 1
rry,
Sa
uers
tei
mue
ls
CD CD ca PU oo
. o §- 0) 2 S 6X) CD
*- E = -5 o ca
S I S J CD
J S
> JD m ©
cS o c ea
u >-cn CD CD CD
J S J C 00 *= ' 3
CD T3 ca «
J S J 3 Q_ CD 3 J S
o
cn CD
CD C
O co
CD
c o 8 « g
CD tf ^ CD .23 tf J S c
CD J S
ca J S
.SP
CD
l i _9 CD
CD
J S .5 § E
•r o ca <+-c
J S T 3
8 ® Jj
CD J S
© ©
CD J S
ca so CD
c e8
J S J S J S > > H + H >
ca ca
c C3 o
IS
> 3
CD
"5 ̂
oo oo <;
§ sS C CD
| J S
1 51

Appendix D
Significant Results Information
A Table with the following information from combined Random Effects analyses that
had significant results: Authors, tests used, type of control groups, single or grouped effect
sizes with a statement regarding significance, and a statement regarding whether or not the
study had been published.
There were significant results for the following:
Full Scale Ability after 1 or 2 years of treatment (d=Q.519i *,p<.01). Author Tests Used Novel
Control Effect Size & Significant?
Published?
Feuerstein Primary Mental Abilities Test -Total
Yes 0.5307, Yes Yes
Funk Otis-Lennon No 0.9657, Yes No Kenney Woodcock-Johnson Reasoning No 0.6143, Yes No Maxcy Test of Cognitive Skills No 0.3734, No No Muttart Primary Mental Abilities -
Composite No 0.8946, No
(Almost) Yes
Pasquier SPE 129 No 1.5121, Yes Yes Perry Otis-Lennon No 0.0830, No No Samuels Woodcock-Johnson Reasoning No -0.1444, No No
Verbal Ability after 4 weeks to 2 years of treatment (d=1.4050, p<.01). Tests Used Novel
Control? Effect Size & Significant?
Published?
Eichler Watson-Glasser No 0.9668, Yes No Hall Test of Social Inference No 0.1627, No No Samuels WISC-R Verbal No -0.1804, No No Shayer & Beasley
Thurstone's PMA - Reasoning & Verbal (words)
Yes 0.0200, No Yes
Skuy et al. WISC-R & WAIS-R Similarities Yes 0.6670, Yes Yes Tillman Thorndike & Hagen (CAT) -
Verbal Yes 0.7245, No No
152

Non-Verbal A bility after 3 months to 2 years o f treatment (^=0.2414, p<.01). Tests Used Novel
Control? Effect Size & Significant?
Published?
Brainin Thorndike & Hagen (CAT) -Nonverbal
No 0.3221, No No
Feuerstein Embedded Figures, Human Figure Drawing, Lahy, Terman Concept Formation - nonverbal, D-48, Porteus Maze
Yes 0.3913, Yes (Just)
Yes
Hall Ravens P .M. , Standard No 0.3542, No No Kenney Ravens P.M., Standard No 0.2514, Yes No Maxcy Ravens P.M. , Standard No 0.3039, No No Robinson Ravens P.M. , Standard No -0.2199, No No Rusling Ravens P .M. , Coloured and
Standard No -0. 3200, No No
Samuels WISC-R Performance Scale No -0.2797, No No Shayer & B Ravens & Piagetian Battery Yes 0.1716, No Yes Skuy et al. Ravens P.M. , Standard Yes 0.1540, Yes Yes Tillman Ravens P .M. , Standard &
Thorndike & Hagen (CAT) -Nonverbal
Yes 0.5486, No (Almost)
No
Visual Perception after 5 months to 2 years of treatment (cH).4237, p<.05) Tests Used Novel
Control? Effect Size & Significant?
Published?
Feuerstein Kuhlman-Finch Postures, modified
Yes 0.7014, Yes Yes
Hall Matching Familiar Figures No 0.6477, Yes. No Rusling Motor-Free Visual Perception No 0.2808, No No Shayer & Beasley
Thursone's P M A - Spatial Relations & Perceptual Speed
Yes 0.3481, No Yes
Visual-Motor Ability after lA a year of treatment (*/=0.7046, p<.01). Tests Used Novel
Control? Effect Size & Significant?
Published?
Rusling Porteus Maze No 0.6085, No (Almost)
No
Wilson Developmental Test of Visual-Motor Integration
No 0.8285, Yes No
Visual-Motor Ability 1 year after Church's yearlong treatment (d=1.6775, X .01 ) . Tests Used Novel
Control? Effect Size & Significant?
Published?
Church Bender Gestalt & Visual Aural Digit Span
No 1.6775, Yes No
153
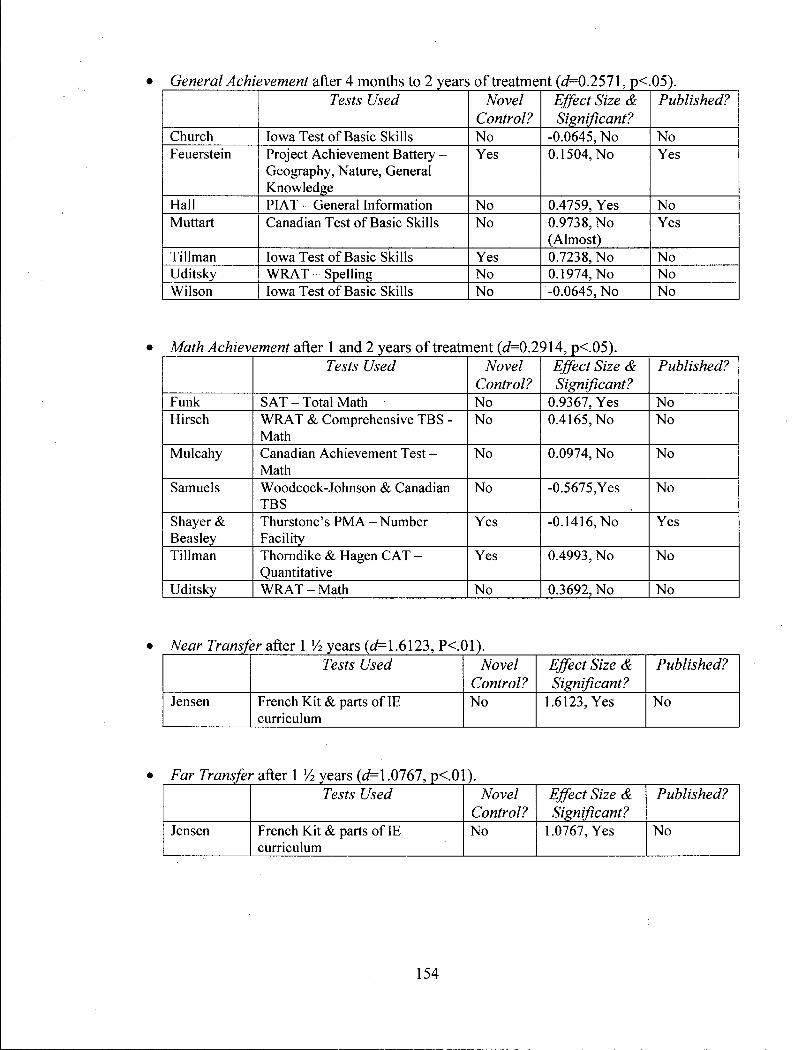
General Achievement after 4 months to 2 years of treatment (g/—0.2571, p<.05). Tests Used Novel
Control? Effect Size & Significant?
Published?
Church Iowa Test of Basic Skills No -0.0645, No No Feuerstein Project Achievement Battery -
Geography, Nature, General Knowledge
Yes 0.1504, No Yes
Hall PIAT - General Information No 0.4759, Yes No Muttart Canadian Test of Basic Skills No 0.9738, No
(Almost) Yes
Tillman Iowa Test of Basic Skills Yes 0.7238, No No Uditsky WRAT - Spelling No 0.1974, No No Wilson Iowa Test of Basic Skills No -0.0645, No No
Math Achievement after 1 and 2 years of treatment (fif=0.2914, p<.05). Tests Used Novel
Control? Effect Size & Significant?
Published?
Funk SAT - Total Math No 0.9367, Yes No Hirsch WRAT & Comprehensive TBS -
Math No 0.4165, No No
Mulcahy Canadian Achievement Test -Math
No 0.0974, No No
Samuels Woodcock-Johnson & Canadian TBS
No -0.5675,Yes No
Shayer & Beasley
Thurstone's PMA - Number Facility
Yes -0.1416, No Yes
Tillman Thorndike & Hagen CAT -Quantitative
Yes 0.4993, No No
Uditsky WRAT - Math No 0.3692, No No
Near Transfer after 1 Vi years (d= 1.6123, P<.01). Tests Used Novel
Control? Effect Size & Significant?
Published?
Jensen French Kit & parts of IE curriculum
No 1.6123, Yes No
Far Transfer after 1 lA years (d=T.0767, p<.0 I). Tests Used Novel
Control? Effect Size & Significant?
Published?
Jensen French Kit & parts of IE curriculum
No 1.0767, Yes No
154

Locus of Control - Intellectual Achievement 4 lA months - 1 year (d=03318, p<.05). Tests Used Novel
Control? Effect Size & Significant?
Published?
Kenney Intellectual Achievement Responsibility Questionnaire
No 0.4505, Yes No
Maxcy Intellectual Achievement Responsibility Questionnaire
No 0.9215, No (Almost)
No
Mulcahy Intellectual Achievement Responsibility Questionnaire
No -0.1375, No No
Schneider Intellectual Achievement Responsibility Questionnaire
No 0.3924, No No
General Motivation, and Attitudes and Motivation for Learning 1 year after 2 years of treatment in Samuels' study (d=-0.4787, p<.05).
Tests Used Novel Control?
Effect Size & Significant?
Published?
Samuels Holtzman & Brown Survey of Study Habits/Williams Perception of Thinking Abilities - seven subtests
No -0.4787, Yes No
155

Appendix E
Nonsignificant Results Information
A Table with the following information from combined Random Effects analyses that
had non-significant results: Authors, tests used, type of control groups, single or grouped
effect sizes with a statement regarding significance, and a statement regarding whether or not
the study had been published.
There were non-significant results for the following:
Full Scale A bility 1 year following 2 years of treatment (d= -0.0520) Author Tests Used Novel
Control? Effect Size & Significant?
Published?
Perry Otis-Lennon School Ability No -0.0197, No No Samuels Woodcock-Johnson Reasoning,
WISC-R Full Scale No -0.2555, No No
Negative Visual Perceptionm 1 year after 5 months of treatment («i=0.1306). Author Tests Used Novel
Control? Effect Size & Significant?
Published?
Rusling Benton Visual Retention-Error scores; Trail Making Test - A & B-Time Scores
No 0.1306, No No
LPAD 4 weeks, 1 year and 2 years of treatment (d= 0.4960) Author Tests Used Novel
Control? Effect Size & Significant?
Published?
Eichler RSDT & Set Variations I No 1.4552, No No Skuy et al. Organizer - post-test scores Yes 0.3057, No Yes Samuels Numerical Progressions No 0.7917, No No Tzuriel Organizer - gain score, RSDT,
Set Variations II - total score No 0.1920, No Yes
LPAD 1 year after treatment (d= 0.3409) Author Tests Used Novel
Control? Effect Size & Significant?
Published?
Samuels Numerical Progressions, Set Variations II
No 0.3409, No No
156

Reading 1 and 2 years of treatment (d= 0.0015) Author Tests Used Novel
Control? Effect Size & Significant?
Published?
Brainin CTBS - total No -0.3877, No No Feuerstein PAB Yes 0.0177, No Yes Funk SAT - Comprehension No 0.5043, No
(Almost) No
Hirsch Brigance, Comprehension TBS, WRAT - word recognition
No 0.0585, No No
Mulcahy Canadian Achievement Test No -0.0694, No No Perry PPVT No 0.2524, No No Samuels Woodcock-Johnson cluster
score, CTBS Comprehension & Vocabulary
No -0.2571 No
Shayer & Beasley
Neale Comprehension, Accuracy & Rate
Yes 0.0171, No Yes
Uditsky Schonell No -0.2605, No No
Reading 2 years of treatment (d= 0.0299) Author Tests Used Novel
Control? Effect Size & Significant?
Published?
Perry PPVT No 0.0495, No No Samuels Woodcock-Johnson cluster
score, CTBS Comprehension & Vocabulary
No -0.1252, No No
Reading 1 year after treatment (d= - 0.5380' Author Tests Used Novel
Control? Effect Size & Significant?
Published?
Samuels Woodcock-Johnson cluster score, CTBS Comprehension & Vocabulary
No -0.5380, No No
Math 2 years of treatment (d= - 1.0409) Author Tests Used Novel
Control? Effect Size & Significant?
Published?
Samuels Woodcock-Johnson cluster score, CTBS total score
No -1.0409, No (Almost)
No
157

Math 1 year after treatment (d= - 0.7977) Author Tests Used Novel
Control? Effect Size & Significant?
Published?
Samuels Woodcock-Johnson cluster score, CTBS total score
No -0.7977, No (Almost)
No
Self-Esteem, Confidence in Personal Success 4 months to 2 years of treatment (d= -0.0079)
Author Tests Used Novel Control?
Effect Size & Significant?
Published?
Maxcy Coopersmith No 0.2344, No No Mulcahy Coopersmith, Harter No -0.0358, No No Rand, T et al.
Levidal Yes 0.0673, No Yes
Schneider Coopersmith No -0.2751, No No • Wilson Harter - Global Self-Worth No 0.4735, No No
Academic Self-Confidence 4 months to 2 years of treatment (d= 0.0700) Author Tests Used Novel
Control? Effect Size & Significant?
Published?
Mulcahy Coopersmith, Harter No 00928, No No Muttart Brookover, St. John Scale,
Achievement Self-Esteem No -0.0205, No Yes
Rand, T et al.
Levidal Yes -0.0868, No Yes
Wilson Harter No 0.3640, No No
Self-Confidence of Physical Competence and Appearance 1 year, and 4 months of t r e a t m e n t ^ 0.1204)
Author Tests Used Novel Control?
Effect Size & Significant?
Published?
Mulcahy Harter No 0.1041, No No Wilson Harter No 0.3048, No No
Social Acceptance, Skills and Popularity 1 year, and 4 months of treatment (d- 0.6306) Author Tests Used Novel
Control? Effect Size & Significant?
Published?
Mulcahy Harter No 0.1109, Yes No Wilson Harter No -1.1538, Yes No
158

Self-Concept 1 year of treatment (d= 0.3371) Author Tests Used Novel
Control? Effect Size & Significant?
Published?
Hall Piers Harris No -0.0323, No No Muttart Lipsett No 1.1733, Yes Yes Socket Piers Harris Yes 0.2165, No No
General Motivation, Attitudes, and Motivation for Learning 4 weeks to 2 years of t reatments 0.1865)
Author Tests Used Novel Control?
Effect Size & Significant?
Published?
Eichler Picture Motivation, Haywood Maze
No 1.29, No No
Rand, T. et al.
Levidal Yes -0.0315, No Yes
Samuels Holtzman & Brown Survey of Study Habits/Williams Perception of Thinking Abilities - seven subtests
No -0.7141, Yes No
General Motivation, and Attitudes and Motivation for Learning after 2 years of treatment in Samuels' study (d= -0.2401).
Tests Used Novel Control?
Effect Size & Significant?
Published?
Samuels Holtzman & Brown Survey of Study Habits/Williams Perception of Thinking Abilities - seven subtests
No -0.2401, No No
Behaviour a ter 1 year of treatment (d- 0.1160). Tests Used Novel
Control? Effect Size & Significant?
Published?
Samuels Stony Brook Observation Code - four subtests
No 0.1160, No No
Behaviour a ter 2 years of treatment (d= 0.3690). Tests Used Novel
Control? Effect Size & Significant?
Published?
Feuerstein Classroom Participation Scale -two subtests
Yes 0.8893, Yes Yes
Samuels Stony Brook Observation Code - four subtests
No -0.1797, No No
159
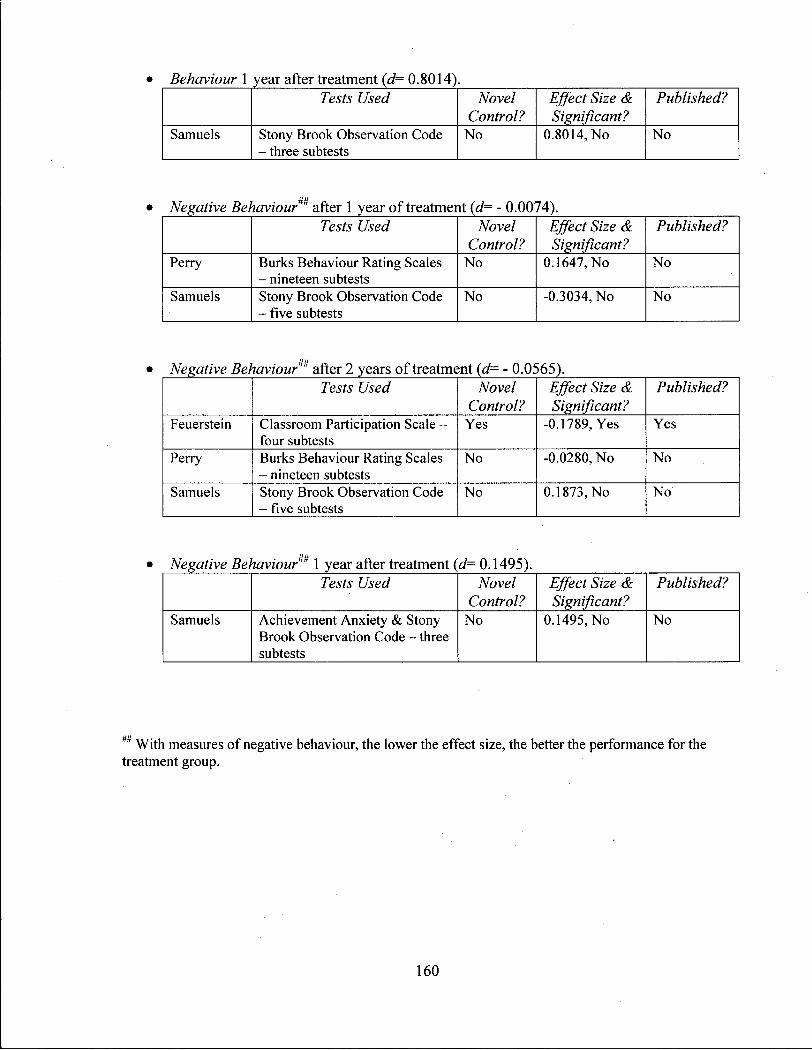
• Behaviour 1 year after treatment (d= 0.8014). Tests Used Novel
Control? Effect Size & Significant?
Published?
Samuels Stony Brook Observation Code - three subtests
No 0.8014, No No
Negative Behaviourm after 1 year of treatment (d= - 0.0074). Tests Used Novel
Control? Effect Size & Significant?
Published?
Perry Burks Behaviour Rating Scales - nineteen subtests
No 0.1647, No No
Samuels Stony Brook Observation Code - f i v e subtests
No -0.3034, No No
j i j j
Negative Behaviour after 2 years of treatment (d= - 0.0565). Tests Used Novel
Control? Effect Size & Significant?
Published?
Feuerstein Classroom Participation Scale -four subtests
Yes -0.1789, Yes Yes
Perry Burks Behaviour Rating Scales - nineteen subtests
No -0.0280, No No
Samuels Stony Brook Observation Code - f i v e subtests
No 0.1873, No No
Negative Behaviourm 1 year after treatment (d- 0.1495). Tests Used Novel
Control? Effect Size & Significant?
Published?
Samuels Achievement Anxiety & Stony Brook Observation Code - three subtests
No 0.1495, No No
With measures of negative behaviour, the lower the effect size, the better the performance for the treatment group.
160

Appendix F
Effect Sizes from F-Tests, t-Tests and Reported Effect Sizes
The following table gives single effect sizes calculated from F- and r-tests, and effect
sizes where they alone were reported. Because the authors did not report descriptive statistics,
it was not possible to combine them with the others in the meta-analysis. The only effect sizes
listed w i l l be those that Cohen (1988) considered to be medium sized (0.50) or above.
Verbal Ability Authors: Haywood, -1.5 years
Test E.S.'2
Primary Mental Abilities - Reasoning 1.2477"
Non-Verbal Ability Authors: Bruce & Martin, Haywood et al., Martin -
Test E.S. Raven's Progressive Matrices 0.5128* Raven's Standard Progressive Matrices 0.6991* Raven's Standard Progressive Matrices 0.8963
Visual Perception Authors: Arbitman-Smith et al., - 60 hours
Test E.S. Hiskey-Nebraska, Spatial Reasoning 0.7362*
Visual-Motor Ability Authors: Church, - 1 year
Test E.S. Bender Gestalt Visual Motor Integration 1.0581** Visual Aural Digit Span 0.5440**
1 2 Effect Size * Significant at the 0.05 level
** Significant at the 0.01 level
161

Academic Achievement: Reading Authors: Socket, -1 year
Test E.S. |CAT - Total Reading 0.5235
General Academic Achievement: Composite Scores, General Information, Language Authors: Haywood et al., Socket - 1 year, 1.5 years
Test E.S. Peabody IAT - Information 0.5150 Stanford Achievement - Language 0.5518 CAT - Total Language 0.6372
Academic Achievement: Math Authors: Haywood et al., Hirsch, 1 year to 1.5 years
Test E.S. KeyMath - Math Reasoning 0.5376 Comprehensive TBS - Math 0.7426
Self-Esteem Authors: Jensen, 18 months
Test E.S. Piers-Harris, Sample A 0.6718* Piers-Harris, Sample B 1.3263**
Attitudes and Motivation Authors: Blagg, Jensen, McRainey -approximately 20 hours, 18 months, 2 years
Test E.S. 16PF - Teachers (Low = Humble, High = Assertive) 1.2270** 16PF - Teachers (Low = Tough-Minded, High = Tender-Minded) -1.0661** 16PF - Teachers (Low = Trusting, High = Suspicious) 0.9876* Haywood Maze Test, Sample C 1 3 0.5521* Classroom Environment Scale14 0.6716*
Note that on the 16PF measures, the teachers scored in such a way as to indicate that they were assertive, tough-minded and suspicious.
1 3 Jensen considered this test to be a measure of intrinsic motivation. 1 4 Students assessed the social climate in the classroom.
162