Pyruvate attenuate lipid metabolic disorders and insulin resistance in obesity induced in rats
Upload
independentCategory
view
2download
0
1
E-00571-2001 R1June 22, 2002
A Mathematical Model of Metabolic Insulin Signaling Pathways
Ahmad R. SedaghatArthur Sherman§
Michael J. Quon*
Cardiology Branch, National Heart, Lung, and Blood Institute and §Mathematical Biology Branch, National Institute of Diabetes and Digestive and KidneyDiseasesNational Institutes of HealthBethesda, MD 20892
Running Title: Modeling of Insulin Signaling
* Address correspondence to:
Michael J. Quon, M.D., Ph.D.Cardiology BranchNational Heart, Lung, and Blood InstituteNational Institutes of HealthBuilding 10, Room 8C-21810 Center Drive MSC 1755Bethesda, MD 20892-1755
Tel: (301) 496-6269Fax: (301) 402-1679Email: [email protected]
Copyright 2002 by the American Physiological Society.
AJP-Endo Articles in PresS. Published on July 2, 2002 as DOI 10.1152/ajpendo.00571.2001

2
ABSTRACT
We develop a mathematical model that explicitly represents many of the known signaling
components mediating translocation of the insulin responsive glucose transporter GLUT4 to gain
insight into the complexities of metabolic insulin signaling pathways. A novel mechanistic model
of post-receptor events including phosphorylation of IRS-1, activation of PI 3-kinase, and
subsequent activation of downstream kinases Akt and PKC-ζ is coupled with previously validated
subsystem models of insulin receptor binding, receptor recycling, and GLUT4 translocation. A
system of differential equations is defined by the structure of the model. Rate constants and model
parameters are constrained by published experimental data. Model simulations of insulin dose-
response experiments agree with published experimental data and also generate expected qualitative
behaviors such as sequential signal amplification and increased sensitivity of downstream
components. We examined the consequences of incorporating feedback pathways as well as
representing pathological conditions such as increased levels of protein tyrosine phosphatases to
illustrate the utility of our model for exploring molecular mechanisms. We conclude that
mathematical modeling of signal transduction pathways is a useful approach for gaining insight into
the complexities of metabolic insulin signaling.
KEYWORDS
Signal Transduction / Metabolism / Insulin Resistance / GLUT4 / Modeling

3
INTRODUCTION
Insulin is an essential peptide hormone discovered in 1921 that regulates metabolism (26).
Interestingly, the ability of insulin to promote glucose uptake into tissues was not demonstrated until
1949 (27). In 1971, specific cell surface insulin receptors were identified (12). The discovery that
insulin-stimulated glucose transport involves translocation of glucose transporters (e.g., GLUT4)
from an intracellular compartment to the cell surface was made in 1980 (8, 53). Since genes
encoding the human insulin receptor and GLUT4 were cloned in 1985 (10, 54) and 1989 (5, 13)
respectively, steady progress has been made in identifying components of insulin signal transduction
pathways leading from the insulin receptor to translocation of GLUT4 (see (32) for review).
Upon binding insulin, the insulin receptor undergoes receptor autophosphorylation and enhanced
tyrosine kinase activity. Subsequently, intracellular substrates (e.g., IRS-1) are phosphorylated on
tyrosine residues that serve as docking sites for downstream SH2 domain containing proteins
including the p85 regulatory subunit of phosphatidylinositide 3-kinase (PI 3-kinase). p85 binding
to phosphorylated IRS-1 results in activation of the p110 catalytic subunit of PI 3-kinase that
catalyzes production of phosphoinositol lipids including PI (3,4,5)P3 that activate the ser/thr kinase
PDK-1. PDK-1 phosphorylates and activates other downstream kinases including Akt and PKC-ζ
that mediate translocation of GLUT4. PTP1B is a protein tyrosine phosphatase (PTPase) that
negatively regulates insulin signaling pathways by dephosphorylating the insulin receptor and IRS-1.
Interestingly, IRS-1 and PTP1B that are upstream from Akt and PKC-ζ have recently been identified
as substrates for these downstream kinases suggesting that feedback mechanisms exist (9, 33, 38,
39). Elements downstream from Akt and PKC-ζ linking insulin signaling pathways with trafficking
machinery for GLUT4 are unknown (34). Thus, a complete understanding of mechanisms
regulating metabolic actions of insulin has remained elusive.
One reason it has been difficult to comprehend metabolic insulin signaling pathways is that

4
determinants of signal specificity are poorly understood. Many signaling molecules are shared in
common among pathways initiated by distinct receptors. Moreover, cross-talk and feedback
between a multitude of receptor-mediated pathways generate signaling networks rather than linear
pathways. Without a theoretical framework it is difficult to understand how complexities evident
from experimental data determine cell behavior. Now that the human genome has been sequenced,
it may be possible to generate a vast experimental database for understanding cellular signaling.
Alfred Gilman has founded The Alliance for Cellular Signaling (http://www.cellularsignaling.org/)
with the goal of integrating relevant experimental data (temporal and spatial relationships of
signaling inputs and outputs in a cell) into interacting theoretical models. This comprehensive
approach may enable a full understanding of the complexities of cell signaling. In this spirit, we
now develop a mathematical model of metabolic insulin signaling pathways that explicitly
represents many known insulin signaling components. Our goal is to define a comprehensive model
that not only accurately represents known experimental data but will serve as a useful tool to
generate and test hypotheses. This modeling approach may lead to novel insights regarding the
molecular mechanisms underlying insulin signal transduction pathways that regulate metabolic
actions of insulin.
MODEL DEVELOPMENT
We use our previously validated models of insulin receptor binding kinetics (57), receptor
recycling (36), and GLUT4 translocation (35, 37) as subsystems in conjunction with a novel
mechanistic representation of post-receptor signaling pathways to generate a complete model with
21 state variables. This complete model is then extended to incorporate feedback pathways and
consequences of feedback are explored. Differential equations derived from the structure of the
complete model were solved using a 4th order Runge-Kutta numerical integration routine (42) using

5
the WinPP version of XPPAUT (available at http://www.math.pitt.edu/~bard/xpp/xpp.html; see
Appendix I for complete list of equations, initial conditions, and model parameters; see
http://mrb.niddk.nih.gov/sherman for WinPP source files used to run simulations). A sufficiently
small step size (0.001 min) was used to ensure accurate numerical integrations for all state variables.
1st order kinetics were assumed except where noted.
Complete Model Without Feedback
Insulin receptor binding subsystem – Our model of insulin receptor binding kinetics (57) (Fig.
1A) was extended here to include additional steps representing insulin receptor autophosphorylation
and dephosphorylation (Fig. 1B). Upon binding the first molecule of insulin, the receptor is rapidly
phosphorylated (1), resulting in receptors that may either bind another molecule of insulin or
dissociate from the first molecule of insulin. Binding of a second molecule of insulin does not affect
the phosphorylation state of the receptor while receptor dephosphorylation occurs when insulin
diffuses off of the receptor leaving a free receptor. In addition, protein tyrosine phosphatases that
dephosphorylate the insulin receptor and whose levels can vary under pathological conditions (15)
are explicitly represented as a multiplicative factor ([PTP]) that modulates receptor
dephosphorylation rate. The differential equations for this subsystem are:
(1) x1 = insulin input
(2) dx2/dt = k-1x3 + k-3[PTP]x5 – k1x1x2
(3) dx3/dt = k1x1x2 – k-1x3 – k3x3
(4) dx4/dt = k2x1x5 – k-2x4
(5) dx5/dt = k3x3 + k-2x4 – k2x1x5 – k-3[PTP]x5
Definitions for state variables and rate constants are given in legends to Figs. 1A and 1B. Note that
we do not explicitly include an intermediate state of free receptors that are still phosphorylated

6
because receptor occupancy and phosphorylation are tightly coupled and we assume that there are
virtually no receptors in the unbound phosphorylated state.
Insulin receptor recycling subsystem – Our previous model of insulin receptor lifecycle
explicitly represents synthesis, degradation, exocytosis, and both basal and ligand-induced
endocytosis of receptors (36) (Fig. 1C). We now extend this subsystem so that ligand-induced
endocytosis is only applied to phosphorylated cell surface receptors (Fig. 1D). Both once and twice
bound phosphorylated receptors are treated identically with respect to internalization. An additional
step representing dephosphorylation of internalized phosphorylated receptors and their incorporation
into the intracellular pool is included. State variables representing free surface insulin receptors (x2)
and phosphorylated surface receptors (x4 and x5) are shared by both binding and recycling
subsystems. Thus, differential equations for these coupled subsystems (depicted in Fig. 1D) are:
(6) x1 = insulin input
(7) dx2/dt = k-1x3 + k-3[PTP]x5 – k1x1x2 + k-4x6 – k4x2
(8) dx3/dt = k1x1x2 - k-1x3 - k3x3
(9) dx4/dt = k2x1x5 – k-2x4 + k-4’x7 – k4’x4
(10) dx5/dt = k3x3 + k-2x4 – k2x1x5 – k-3[PTP]x5 + k-4’x8 – k4’x5
(11) dx6/dt = k5 – k-5x6 + k6[PTP](x7 + x8) + k4x2 – k-4x6
(12) dx7/dt = k4’x4 – k-4’x7 – k6[PTP]x7
(13) dx8/dt = k4’x5 – k-4’x8 – k6[PTP]x8
Definitions for additional state variables and rate constants are given in legends to Figs. 1C and 1D.
Post-receptor signaling subsystem – The post-receptor signaling subsystem developed here (Fig.
2) comprises elements in the metabolic insulin signaling pathway that are well established (32).
It is assumed that this is a closed subsystem so that synthesis and degradation of signaling molecules
are not explicitly represented. The concentration of phosphorylated surface insulin receptors is the

7
input to this subsystem. Activated insulin receptors phosphorylate IRS-1 that then binds and
activates PI 3-kinase. We modeled the dependence of IRS-1 phosphorylation on phosphorylated
surface receptors as a linear function. That is, the rate constant for IRS-1 phosphorylation, k7, is
modulated by the fraction of phosphorylated surface receptors (x4 + x5)/(IRp) where IRp is the
concentration of phosphorylated surface receptors achieved after maximal insulin stimulation. The
association of phosphorylated IRS-1 with PI 3-kinase is assumed to occur with a stoichiometry of
1:1. Differential equations governing phosphorylation of IRS-1 and subsequent formation of
phosphorylated IRS-1/activated PI 3-kinase complex are:
(14) dx9/dt = k-7[PTP]x10 – k7x9(x4 + x5)/(IRp)
(15) dx10/dt = k7x9(x4 + x5)/(IRp) + k-8x12 – (k-7[PTP] + k8x11)x10
(16) dx11/dt = k-8x12 – k8x10x11
(17) dx12/dt = k8x10x11 – k-8x12
Activated PI 3-kinase converts the substrate PI(4,5)P2 to the product PI(3,4,5)P3. This is modeled
as a linear function so that k9, the rate constant for generation of PI(3,4,5)P3, is dependent on x12, the
amount of activated PI 3-kinase (see Appendix II for detailed derivation). 5' lipid phosphatases such
as SHIP2 convert PI(3,4,5)P3 to PI(3,4)P2 (6) while 3' lipid phosphatases such as PTEN convert
PI(3,4,5)P3 to PI(4,5)P2 (45). The differential equations describing interconversion between these
phosphatidylinositides are:
(18) dx13/dt = k9x14 + k10x15 – (k-9[PTEN] + k-10[SHIP])x13
(19) dx14/dt = k-9[PTEN]x13 – k9x14
(20) dx15/dt = k-10[SHIP]x13 – k10x15
As with [PTP], the lipid phosphatase factors [SHIP] and [PTEN] correspond to the relative
phosphatase activity in the cell and are assigned a value of 1 under normal physiological conditions.
Activation of downstream ser/thr kinases Akt and PKC-ζ is dependent on levels of PI(3,4,5)P3

8
(2, 49). In our model, this is governed by rate constants that interact with the level of PI(3,4,5)P3
(see Appendix II for detailed derivation). The differential equations describing this are:
(21) dx16/dt = k-11x17 – k11x16
(22) dx17/dt = k11x16 – k-11x17
(23) dx18/dt = k-12x19 – k12x18
(24) dx19/dt = k12x18 – k-12x19
The output of this subsystem is represented as a metabolic “effect” due to Akt and PKC-ζ activity
with 80% of the metabolic insulin signaling effect attributed to PKC-ζ and 20% of the effect
attributed to Akt (3, 7, 49).
(25) “effect” = (0.2x17 + 0.8x19)/(APequil)
where APequil is the steady-state level of combined activity for Akt and PKC-ζ after maximal insulin
stimulation (normalized to 100%). Definitions for additional state variables and rate constants in
the post-receptor signaling subsystem are given in the legend to Fig. 2.
GLUT4 translocation subsystem – The final subsystem is our previous model of GLUT4
translocation (35, 37) (Fig. 3). Under basal conditions, GLUT4 recycles between an intracellular
compartment and the cell surface. The differential equations for this subsystem are:
(26) dx20/dt = k-13x21 – (k13 + k13’)x20 + k14 – k-14x20
(27) dx21/dt = (k13 + k13’)x20 – k-13x21
Definitions for additional state variables and rate constants in the GLUT4 translocation subsystem
are given in the legend to Fig. 3. Upon insulin stimulation, there may be a separate pool of
intracellular GLUT4 recruited to the cell surface (17, 18, 40). To represent this aspect of GLUT4
trafficking, the insulin-stimulated exocytosis rate (k13’) is increased to its maximum value as a linear
function of the metabolic “effect” produced by phosphorylated Akt and PKC-ζ. Assuming that the
basal equilibrium distribution of 4% cell surface GLUT4 and 96% GLUT4 in the intracellular pool

9
transitions upon maximal insulin stimulation to a new steady-state of 40% cell surface GLUT4 and
60% intracellular GLUT4, the equations governing changes in k13 and k13' are:
(28) k13 = (4/96)k-13
(29) k13’ = [(40/60)-(4/96)]k-13 C (“effect”)
Thus, changes in k13’ are linearly dependent on the output of the signaling subsystem (“effect”).
For our complete model without feedback, the four subsystems described above were coupled
by shared common elements (Fig. 4) (see appendix II for derivation of initial conditions, rate
constants and parameters).
Complete Model With Feedback
Recent evidence suggests that Akt and PKC-ζ may participate in positive and negative feedback
in metabolic insulin signaling pathways (9, 33, 38, 39). To investigate potential functional
consequences of these feedback pathways we incorporated both positive and negative feedback
loops into our complete model (Fig. 5). Phosphorylation of PTP1B by Akt impairs the ability of
PTP1B to dephosphorylate insulin receptors and IRS-1 by 25% (38). Since PTP1B itself negatively
modulates insulin signaling, the downstream negative regulation of an upstream negative signaling
element represents a positive feedback loop for insulin signaling. We implemented this positive
feedback loop by assuming a linear effect of activated Akt (x17) to inhibit PTP1B activity with a 25%
decrease in [PTP] at maximal insulin stimulation. Thus, [PTP] is multiplied by (1 -
0.25x17/(100/11)) (where 100/11 is the percent of activated Akt after maximal insulin stimulation
and for x17 # (400/11), otherwise [PTP] = 0; see appendix II for derivation).
We also incorporated a negative feedback loop where serine phosphorylation of IRS-1 by PKC-ζ
impairs formation of the phosphorylated IRS-1/activated PI 3-kinase complex (39). To represent
this, we assumed that serine phosphorylation of IRS-1 by activated PKC-ζ creates an IRS-1 species

10
unable to associate with and activate PI 3-kinase (represented by the state variable x10a). The
formation of x10a tends to decrease the level of activated PI 3-kinase in response to insulin
stimulation (when compared to a system without negative feedback). Additional differential
equations describing interconversion between unphosphorylated IRS-1 (x9) and serine
phosphorylated IRS-1 (x10a) are:
(30) dx9/dt = k-7[PTP]x10 – k7x9(x4 + x5)/(IRp) + k-7'x10a - k7'[PKC]x9
(31) dx10a/dt = k7'[PKC]x9 - k-7'x10a
where equation 30 is an updated version of equation 14, k7' is the rate constant for serine
phosphorylation of IRS-1 by PKC-ζ, and k-7' is the rate constant for serine dephosphorylation. We
include a multiplicative factor [PKC] that modulates k7' to model the ability of phosphorylated,
activated PKC-ζ (x19) to generate serine phosphorylated IRS-1. [PKC] is defined as a standard Hill
equation that is commonly used to represent enzyme kinetics where [PKC] = Vmax(x19(t - tau)n/(Kdn
+ x19n). This explicitly incorporates a time lag (tau) into the negative feedback loop. The parameters
used in this equation are listed in Appendix I.
RESULTS
Model simulations without feedback – We began evaluation of our complete model without
feedback by generating time courses for all state variables in response to a maximally stimulating
step input of 10-7 M insulin that was turned off after 15 min (Figs. 6-7). 30 s after the initial insulin
stimulation, ~98% of the free insulin receptors became bound to insulin and underwent
autophosphorylation (Fig. 6A-C). Phosphorylated once-bound insulin receptors at the cell surface
made up ~75% of the surface receptor population while phosphorylated twice-bound surface
receptors comprised ~23% of the surface receptor population. When insulin was removed after 15
min of stimulation, the concentration of free insulin receptors returned to basal levels with a half-

11
time of ~3.5 min. A short transient rise in the concentration of phosphorylated surface receptors
bound to one molecule of insulin was observed as phosphorylated twice-bound surface receptors
passed through the once-bound state to return to the unbound free state. As expected, the state
variables x6, x7, and x8 that represent intracellular insulin receptors did not change very much with
an acute insulin stimulation (data not shown). These results are in good agreement with both
published experimental data and previous results from our subsystem models of receptor binding
and recycling (36, 51, 57). In response to the rise in autophosphorylated surface insulin receptors,
unphosphorylated IRS-1 was rapidly converted to tyrosine phosphorylated IRS-1 (Fig. 6D).
Consistent with published experimental data (29), maximal IRS-1 tyrosine phosphorylation was
observed within 1 min of the initiation of insulin stimulation. Upon removal of insulin, IRS-1
underwent dephosphorylation back to basal conditions with a half-time of ~8 min. This was also
consistent with published experimental data (24).
Maximal formation of the phosphorylated IRS-1/activated PI 3-kinase complex in response to
10-7 M insulin occurred within ~1.5 min (Fig. 7A). This is in good agreement with published data
showing that PI 3-kinase and tyrosine phosphorylated IRS-1 molecules associate quickly after
insulin stimulation (2, 14). The time course for disappearance of activated PI 3-kinase after the
removal of insulin followed the time course for dephosphorylation of IRS-1. PI 3-kinase activated
in response to insulin stimulation catalyzed the conversion of PI(4,5)P2 to PI(3,4,5)P3 which in turn
drove the formation of PI(3,4)P2 (Fig. 7B). The level of PI(3,4,5)P3 increased from 0.31% to 3.1%
of the total lipid population while the level of PI(3,4)P2 increased from 0.29% to 2.9% of the total
lipid population as it equilibrated with PI(3,4,5)P3. Upon removal of insulin, the
phosphatidylinositides returned to basal levels (time to half-maximal levels was approximately 11
min). The levels of PI(3,4,5)P3 controlled the formation of phosphorylated, activated PKC-ζ (Fig.
7C). Maximal PKC-ζ activation occurred within 3 min of insulin stimulation. After insulin was

12
removed, the level of activated PKC-ζ declined back to basal levels (time to half-maximal levels
was approximately 11 min). The time course for phosphorylated, activated Akt was identical to that
for PKC-ζ (data not shown). Insulin-stimulated activation of PKC-ζ and Akt mediate increased
exocytosis of GLUT4 so that 40% of total cellular GLUT4 was at the cell surface and 60% was
intracellular after maximal insulin stimulation (Fig. 7D). Our simulations of insulin-stimulated
GLUT4 recruitment occurred with half-time of ~3 min matching published experimental results (18,
20). When insulin was removed, surface and intracellular GLUT4 levels returned to their basal
values (time to half-maximal levels ~16 min). Thus, the overall response of our complete model
without feedback to an acute insulin input are in good agreement with both a variety of published
experimental data and previously validated subsystem models.
Model simulations with feedback – Having developed a plausible mechanistic model of
metabolic insulin signaling pathways related to translocation of GLUT4, we next explored the
effects of including positive and negative feedback loops to gain additional insight into the
complexities of insulin signaling. Phosphorylation of PTP1B by Akt partially inhibits the ability
of PTP1B to dephosphorylate the insulin receptor and IRS-1 (38). In addition, PKC-ζ
phosphorylates serine residues on IRS-1 and inhibits the ability of IRS-1 to bind and activate PI 3-
kinase (39). As described in the Model Development section, we incorporated these positive and
negative feedback interactions into our model. As for the model without feedback, we generated
time courses for all state variables in response to a maximally stimulating step input of 10-7 M
insulin for 15 min (Figs. 8-9). Time courses for the various insulin receptor states in response to
insulin stimulation were qualitatively similar to results obtained from our model without feedback
(cf. Fig. 6). However, after removal of insulin, the return of free surface receptors to basal levels
and the disappearance of total phosphorylated surface receptors occurred a little more slowly than
in the model without feedback. These results are consistent with the presence of a positive feedback

13
loop at the level of the insulin receptor. With incorporation of negative feedback at the level of IRS-
1, the time course for IRS-1 tyrosine phosphorylation in response to insulin stimulation is quite
different from model simulations generated without feedback. In response to insulin, the level of
tyrosine-phosphorylated IRS-1 transiently reached a peak of 0.84 pM within 1.5 min. This was
followed by a rapid 60% decrease before finally equilibrating at ~0.30 pM by 11 min (Fig. 8D).
Thus, the presence of negative feedback at the level of IRS-1 caused transient oscillatory behavior
and a lower steady-state level for tyrosine-phosphorylated IRS-1. Levels of serine-phosphorylated
IRS-1 first began to rise after 1.5 min of insulin stimulation. Similar to tyrosine-phosphorylated
IRS-1, the concentration of serine-phosphorylated IRS-1 equilibrated at 0.76 pM after 5 min of
insulin stimulation. Less than 10% of the total IRS-1 remained in the unactivated state after
maximal insulin stimulation. Removal of insulin resulted in conversion of both serine- and tyrosine-
phosphorylated IRS-1 back to unphosphorylated IRS-1 (time to return to half-maximal levels ~17
min).
The transient oscillatory behavior observed for tyrosine-phosphorylated IRS-1 in response to
insulin stimulation was also observed for activated PI 3-kinase (Fig. 9A). Activated PI 3-kinase
transiently peaked at 5.6 fM within 1.8 min. This was followed by a rapid undershoot and then
equilibration at ~ 1.9 fM by 10 min. Upon removal of insulin, the concentration of activated PI 3-
kinase returned to basal levels (time to half-maximal levels ~17 min). The time courses for
PI(3,4,5)P3, PI(3,4)P2, PKC-ζ, and Akt displayed a qualitatively similar dynamic (Fig. 9B-C). That
is, after 1 min of insulin stimulation, the level of PI(3,4,5)P3 increased from 0.31% of the total lipid
population to a peak of ~6.1% followed by an undershoot before equilibrating at ~2.5%. The level
of PI(3,4)P2 increased from 0.21% to a peak of ~5.6% before equilibrating at a steady-state level of
~2.4%. Upon removing insulin, both PI(3,4,5)P3 and PI(3,4)P2 returned to their basal levels (time
to half-maximal levels ~17 min). In response to insulin, the percentage of activated PKC-ζ

14
transiently peaked at ~17.1% after ~1.5 min followed by an undershoot and equilibration at ~7.4%
by 11 min. After insulin was removed, the level of activated PKC-ζ declined to basal levels with
a time to half-maximal levels of ~17 minutes. Since we modeled the behavior of Akt identically to
PKC-ζ, the time course for phosphorylated, activated Akt mirrored that for PKC-ζ (data not shown).
With respect to translocation of GLUT4, the overall shape of the time courses for cell surface
GLUT4 with and without feedback were similar. However, with inclusion of positive and negative
feedback loops described above, the half-time for translocation of GLUT4 to the cell surface in
response to insulin was slightly shorter than that observed in the model without feedback (~2.5 min)
while the time for return to basal levels after insulin removal was longer (time to half-maximal level
~18 min). Thus, the inclusion of positive and negative feedback loops into our model of metabolic
insulin signaling generates predictions regarding the dynamics of various signaling components that
may be experimentally testable.
Insulin dose-response characteristics - We generated simulations of insulin dose-response
curves to further explore characteristics of our model with and without feedback. Step inputs
ranging from 10-6 to 10-12 M insulin for 15 min were used to construct dose-response curves for
maximum levels of bound insulin receptors at the cell surface, total phosphorylated receptors at the
cell surface, activated PI 3-kinase, and cell surface GLUT4 (Fig. 10). Published experimental data
corresponding to each of these elements were then compared with simulation results. The
experimental data used for comparison were obtained from a series of experiments performed in the
same preparation of rat adipose cells (47). For bound surface insulin receptors (x3 + x4 + x5), the
dose-response curve generated by our model without feedback had an ED50 of 3.5 nM (Fig. 10A).
Our model with feedback generated a curve with an ED50 of 2.9 nM. Both of these simulation
results were similar to the experimentally determined ED50 of 7 nM that was reported by Stagsted
et al. (47). With respect to receptor autophosphorylation, model simulations without feedback

15
generated a dose-response curve for surface phosphorylated receptors (x4 + x5) with an ED50 of 3.5
nM (Fig. 10B). Model simulations with feedback generated a dose-response curve with an ED50 of
2.9 nM. The experimentally determined ED50 for receptor autophosphorylation was reported as 5
nM (47). The close similarity between insulin dose-response curves for receptor binding and
receptor autophosphorylation observed in both our simulations and the experimental data is
consistent with the tight coupling of the dynamics of these processes.
For activated PI 3-kinase, model simulations without feedback generated an insulin dose-
response curve with an ED50 of 0.83 nM. Model simulations with feedback showed a slightly greater
sensitivity with an ED50 of 1.43 nM. These simulation results seem reasonable since downstream
components should have greater insulin sensitivity than proximal events if one assumes that signal
amplification occurs for downstream elements. Interestingly, the experimentally determined ED50
for activated PI 3-kinase reported by Stagsted et al. is 8 nM (47). With respect to insulin-stimulated
translocation of GLUT4, model simulations without feedback generated a dose-response curve with
an ED50 of 0.53 nM, while model simulations with feedback generated a dose-response curve with
a slightly smaller ED50 of 0.19 nM. In rat adipose cells, the ED50 = 0.17 nM for insulin-stimulated
glucose uptake (47). Again, our simulation results are not only consistent with kinetic expectations,
but also closely match experimental results including observations that maximal glucose uptake
occurs with partial insulin receptor occupancy (47). A general result from these model simulations
is that insulin sensitivity increases for components further downstream in the signaling pathway.
In addition, the presence of feedback in our model resulted in slightly increased sensitivity for each
signaling component examined when compared to simulations without feedback.
Biphasic activation of PKC-ζ - Biphasic activation of PKC-ζ in rat adipocytes in response to
insulin stimulation has been previously reported (48, 50). However, the mechanism underlying this
dynamic is unknown. To determine if the presence of feedback in insulin signaling pathways might

16
account for this biphasic response we compared published experimental data on activation of PKC-ζ
with model simulations in the presence or absence of feedback. We used a step input of 10-8 M
insulin for 15 min to mimic the experimental conditions reported in ref. (48). Intriguingly, the time
course for activated PKC-ζ in response to insulin generated from the simulation with feedback
displayed a biphasic dynamic that more closely matched the experimental data while the model
without feedback failed to produce a biphasic response (Fig. 11). Thus, one possible mechanism
to generate a biphasic activation of PKC-ζ in response to insulin is the presence of feedback
pathways. Effects of increased levels of PTPases on insulin-stimulated translocation of GLUT4 -
To demonstrate the ability of our model to represent pathological conditions we ran model
simulations without feedback where we examined the effects of increased PTPase activity on
translocation of GLUT4. Simulations of the time courses for cell surface GLUT4 were generated
for 15 min insulin step inputs of 10-7, 10-9 and 10-10 M and [PTP] = 1. These control curves were
then compared with simulations in which the [PTP] = 1.5 (mimicking diabetes or obesity). As
might be predicted, increasing [PTP] resulted in a decreased amount of cell surface GLUT4 at every
insulin dose and a more rapid return to the basal state when insulin is removed (Fig. 12). Moreover,
the effect of increased PTPase activity to reduce cell surface GLUT4 (in terms of percentage) is
more pronounced at lower insulin doses. Thus, at an insulin dose of 10-7 M, increasing [PTP] by
50% causes a 6.5% decrease in peak insulin-stimulated GLUT4 at the cell surface while at the 10-10
M insulin dose, a 50% increase in [PTP] results in a 27.9% decrease in peak insulin-stimulated cell
surface GLUT4. These results are consistent with the amplification properties of this signal
transduction system and the function of PTPases to negatively regulate insulin signaling at the level
of the insulin receptor and IRS-1. Model simulations with feedback gave qualitatively similar
results (data not shown).

17
DISCUSSION
Since the discovery of insulin over 80 years ago tremendous progress has been made in
elucidating the molecular mechanisms of insulin action. However, recent investigations of insulin
signaling reveal biological complexities that are still not fully understood. For example, the
determinants of specificity for metabolic insulin signaling pathways are largely unknown. Rapid
progress in the field of signal transduction and genomics has inspired the foundation of groups such
as the National Resource for Cell Analysis and Modeling (NRCAM; pioneers in the Virtual Cell
project (41)) and The Alliance for Cellular Signaling. These groups strongly argue that a theoretical
approach with a comprehensive database is absolutely necessary for a full understanding of cellular
signaling behavior.
Model Development - Previous applications of mathematical modeling to insulin action have
focused on limited areas such as receptor binding kinetics and GLUT4 trafficking (17, 35-37, 43,
44, 57). The predictive power of these models has been useful for understanding particular aspects
of insulin action. In the present work, we incorporate some of these models along with a novel
current description of insulin signal transduction elements into a complete model of metabolic
insulin signaling pathways. Since some signaling elements represented in the model have just
recently been discovered, biochemical characterization of the kinetics for these elements remain
incomplete. For example, time courses of activation are often reported with reference to insulin
stimulation without characterization relative to immediate upstream precursors. Moreover,
limitations in experimental approaches preclude the determination of some time courses with
sufficient resolution. Thus, we did not explicitly include an element for PDK-1 between the
generation of PI(3,4,5)P3 and phosphorylation of PKC-ζ and Akt because insufficient kinetic data
is available in the literature. Similarly, elements downstream from PKC-ζ and Akt that link
metabolic insulin signaling pathways with the machinery for GLUT4 trafficking are unknown and

18
therefore not explicitly represented.
One potential pitfall in developing such a complicated model is that the number of arbitrary free
parameter choices may decrease the predictive power of the model. To address this issue, we
incorporated previous models as subsystems in our complete model in order to significantly reduce
the number of arbitrary elements. Rate constants and parameters for these subsystems had
previously been independently obtained and validated. The majority of remaining model
parameters and rate constants characterizing newly modeled steps of the metabolic insulin signaling
pathway were based upon experimental data in the literature. We also used boundary value
conditions to derive fixed relationships among various rate constants and model parameters to
further decrease the degrees of freedom in the structure of the model. Finally, as a simplifying
measure, we represented the numerous kinetic reactions in our model as first-order reactions coupled
by shared common elements. We have attempted to thoroughly validate our complete model by
demonstrating that the behavior of each individual state variable in response to a step insulin input
closely matches experimental data from a variety of independent sources. As further evidence of
the validity of our complete model, our system as a whole generated properties that have been
observed experimentally including the presence of “spare receptors” (e.g., maximal activation of
GLUT4 translocation with sub-maximal insulin receptor occupancy), signal amplification, and
increased insulin sensitivity for downstream components in the signaling pathway. Since three of
the four model subsystems have previously been validated and the behavior of the overall model
agrees closely with published experimental data we conclude that our post-receptor signaling
subsystem is reasonable and robust. Moreover, the rate constants chosen for the signaling subsystem
were based on data in the literature. Although a more complete exploration of the post-receptor
signaling subsystem is of interest, this is beyond the scope of the current study.
In some cases where mechanisms regulating interactions between signaling elements are not

19
fully understood, we modeled these interactions as linear relationships. The rate of IRS-1
phosphorylation in response to activated insulin receptors, the rate of PI(3,4,5)P3 generation in
response to activated PI 3-kinase, the rate of PKC-ζ and Akt phosphorylation in response to
increased levels of PI(3,4,5)P3, and the rate of exocytosis for GLUT4 in response to phosphorylated
PKC-ζ and Akt are all modeled as simple linear functions. In the case of the negative feedback loop
where PKC-ζ phosphorylates IRS-1 on serine residues, we modulated the rate constant for serine
phosphorylation of IRS-1 using a standard Hill equation in order to incorporate a reasonable time
lag. Importantly, we observed a good overall match between experimental data and model
simulations for both insulin dose-response curves and time courses. Thus, our coupling assumptions
seem reasonable. Nevertheless, these points in the model represent areas that could be further
refined in the future when a greater understanding of the molecular mechanisms involved is
achieved. Indeed, by modeling more complicated coupling mechanisms, specific simulation results
may give rise to experimentally testable predictions. This interplay between theoretical predictions
and experimental results may yield important insights into the molecular mechanisms of insulin
action.
Model simulations without feedback - We validated the structure of our complete model by
comparing published experimental data with model simulations in response to an acute insulin
stimulus. In our model without feedback, the dynamics of insulin-stimulated phosphorylation of
IRS-1, activation of PI 3-kinase, production of PI(3,4,5)P3 and PI(3,4)P2, and phosphorylation of Akt
and PKC-ζ all fit well with published experimental data (2, 29, 46, 48, 55). Upon removal of
insulin, the dynamics of the return to basal states in our simulations showed a time to half-maximal
levels of ~8 min for phosphorylated IRS-1 and activated PI 3-kinase, and ~11 min for PI(3,4,5)P3,
phosphorylated Akt, and phosphorylated PKC-ζ. Since minimal kinetic data exists regarding the
return to basal levels after removal of insulin, these simulation results represent predictions of our

20
model. Finally, as expected, time courses for insulin receptor binding and GLUT4 translocation also
matched experimental data when these subsystems were placed into the context of the overall model.
In our simulations we observed a time lag between the insulin input and subsequent steps in
insulin signaling that increased as the signal propagated downstream. This lag was present for
simulations of both insulin stimulation and removal. Since the kinetics governing most state
variables were modeled as first-order events, recovery to basal conditions of each component would
be expected to appear as a concave-up, exponential decay curve. Interestingly, in our simulations
of insulin removal (after 15 min insulin stimulation), we observed the presence of a concave-down
region immediately prior to the concave-up exponential decay that became more pronounced for
distal components and is clearly evident in the simulations of GLUT4 translocation (Fig. 7D). This
qualitative behavior is consistent with the presence of a signaling cascade that controls insulin-
stimulated translocation of GLUT4 and has been observed experimentally in rat adipose cells (20).
To further validate our complete model without feedback we compared published experimental
data with simulations of insulin dose-response curves for key state-variables (Fig. 10). The
usefulness of these comparisons was substantially strengthened by the fact that data on insulin
receptor binding, receptor autophosphorylation, PI 3-kinase activation, and glucose transport were
obtained from a single experimental preparation of rat adipose cells (47). Qualitatively, the
sigmoidal shape of dose-response curves generated by our model simulations (when plotted as a
semi-log graph) is consistent with the hyperbolic response characteristic of most receptor-mediated
biological events. In addition, we observed increased insulin sensitivity for downstream components
of the insulin signaling pathway. That is, ED50 = 3.5 nM for receptor binding, ED50 = 3.5 nM for
receptor autophosphorylation, ED50 = 0.83 nM for PI 3-kinase activation, and ED50 = 0.53 nM for
GLUT4 translocation. This increased sensitivity of downstream components consistent with the
presence of a signal amplification cascade is a well-described characteristic for biological actions

21
of insulin. For example, only a fraction of insulin receptors need to be occupied by insulin for
maximal glucose uptake to occur in adipose cells (20, 47). Stagsted et al. reported an ED50 of 8 nM
for insulin-stimulated PI 3-kinase activation (47). However, close inspection of their data suggests
that the actual value may be closer to 4 nM. Nevertheless, this ED50 is still somewhat larger than
the ED50 of 0.83 nM derived from our simulations. However, the measurement of PI 3-kinase
activity in anti-phosphotyrosine immunoprecipitates derived from whole cell lysates is difficult to
perform in a quantitative manner. Thus, it is possible that the small discrepancy between our
simulation results and experimental data with respect to activation of PI 3-kinase may be explained,
in part, by imprecision introduced by experimental variability. Of note, the shape and ED50 of
insulin-dose response curves for insulin receptor binding, receptor autophosphorylation, and GLUT4
translocation almost exactly match the corresponding experimentally determined dose-response
curves (Fig. 10). Thus, the insulin sensitivity of key components of our model is realistic.
Moreover, given the fact that our model structure, rate constants, and parameters were derived from
a large mixture of many different experimental systems, this remarkable fit to experimental data
from a single system across several key state variables suggests that the overall structure of our
model is quite robust.
Model simulations with feedback - To further explore the complexities of insulin signaling we
simultaneously modeled positive and negative feedback loops based upon mechanisms proposed in
the literature (9, 33, 38, 39). We incorporated a positive feedback loop into our model by having
Akt phosphorylate PTP1B and impair its ability to dephosphorylate the insulin receptor and IRS-1
(38). The slight increase in insulin sensitivity for insulin binding and receptor autosphosphorylation
observed in our model with feedback was an expected result of positive feedback at the level of the
insulin receptor. That is, decreased activity of PTPases against phosphorylated insulin receptors
results in subtle shifts in the equilibrium states for the various receptor state variables. Similarly,

22
we observed slightly decreased sensitivity for the activated PI 3-kinase dose-response curve derived
from our model with feedback. This is the result of positive feedback with Akt phosphorylating
PTP1B and inhibiting tyrosine dephosphorylation of IRS-1. In addition, the lower equilibrium level
of PI 3-kinase after maximal insulin stimulation (which defines the parameter PI3K) also contributes
to a shift in insulin sensitivity at the level of PI 3-kinase. Dose-response curves for translocation
of surface GLUT4 derived from the model with feedback demonstrated greater insulin sensitivity
than simulations without feedback. This was due to the combined effects of increased sensitivity
of proximal signaling elements. Remarkably, the experimental data for insulin-stimulated glucose
uptake reported by Stagsted et al. (47) indicated an ED50 of 1.7 nM that almost exactly matched the
ED50 of 1.9 nM for cell surface GLUT4 that we calculated from our model with feedback. In
addition to slightly increased insulin sensitivity, the half-times for return to basal levels of all
signaling elements were longer in our simulations with feedback. These results are consistent with
experimental observations suggesting that positive feedback at the level of the insulin receptor and
IRS-1 slows the return of activated signaling elements to basal levels (38).
We incorporated a negative feedback loop into our model by modeling the ability of PKC-ζ to
phosphorylate IRS-1 on serine residues and impair its ability to bind and activate PI 3-kinase (39).
Time courses for insulin receptor binding and phosphorylation generated by models with and
without feedback were similar. However, the overall dynamics of post-receptor signaling elements
in our model were quite different with inclusion of feedback. In response to insulin stimulation, we
observed a transient damped oscillatory behavior before equilibrium was reached in all elements of
the post-receptor signaling subsystem. This oscillatory behavior was a direct result of negative
feedback by PKC-ζ. Immediately after insulin stimulation, effects of PKC-ζ on upstream
components are not apparent due to the time lag present for distal signaling components. As levels
of phosphorylated PKC-ζ increase (and the value of parameter [PKC] approaches 1), the rate

23
constant for serine phosphorylation of IRS-1 increases resulting in depletion of the tyrosine-
phosphorylated IRS-1 pool. As biochemical reactions within the post-receptor signaling pathway
shift and react to effects of this negative feedback, time courses of post-receptor elements exhibit
a transient oscillatory behavior before a final equilibrium state is reached. Although this qualitative
behavior has not been reported for insulin-stimulated PI 3-kinase activity, it is possible that time
courses with sufficiently fine resolution to capture this behavior have not been performed.
Intriguingly, a damped oscillatory behavior or biphasic activation of PKC-ζ in response to insulin
stimulation has been previously reported in several studies (48, 50). Only our model with feedback
(but not without feedback) generated simulations for insulin-stimulated PKC-ζ activity that closely
matched the complex dynamic for PKC-ζ present in published experimental data (48). Thus, one
novel result from our model is the suggestion that negative feedback from PKC-ζ to IRS-1 may be
sufficient to explain the complex dynamic behavior of PKC-ζ activity in response to insulin.
Modeling increased levels of PTPases - In addition to giving insight into normal physiology our
model may also be useful for helping to understand pathological conditions. Diabetes is a disease
characterized by insulin resistance that may be related, in part, to elevated levels of protein tyrosine
phosphatases such as PTP1B (15). We simulated a pathological condition where activity of PTPases
was 50% above normal ([PTP] = 1.5). Over a range of insulin doses, this was associated with a
decrease in peak cell surface GLUT4 when compared to simulations where [PTP] = 1. The
percentage decrease in peak GLUT4 was greater for lower insulin doses and the half-times for
recovery to basal conditions were significantly shortened by increasing [PTP]. Similar effects were
observed in the models with and without feedback. Thus, our model can make specific predictions
about the nature of insulin resistance due to increased levels of PTPases such as PTP1B. Similarly,
it may be possible to explore mechanisms of insulin resistance due to altered lipid phosphatase
function by manipulation of the parameters [SHIP] and [PTEN].

24
Conclusions - The mathematical model of metabolic insulin signaling pathways developed here
is based on previous subsystem models as well as new elements characterizing the molecular
mechanisms of insulin signaling. The model structure was extensively validated and sufficient to
explain qualitative behaviors that are experimentally observed in both normal and pathological
states. In addition, our model with feedback suggest a potential mechanistic explanation for the
damped oscillatory behavior of PKC-ζ activity in response to insulin that is observed
experimentally. Moreover, various mechanisms used to couple model subsystems represent
experimentally testable hypotheses. Consequently, we hope that our model will be a useful
predictive tool for generating hypotheses to complement and motivate experimental approaches.
This may lead to a better understanding of the normal physiology of insulin action as well as the
pathophysiology underlying insulin resistance that contributes to major public health problems such
as diabetes and obesity.
ACKNOWLEDGMENTS
The work of A.R.S. was supported in part by the Whitaker/NIH biomedical engineering summer
internship program and an American Diabetes Association Student Mentor Award to M.J.Q.

25
REFERENCES
1. Ablooglu, AJ, and Kohanski RA. Activation of the insulin receptor's kinase domain changes the
rate- determining step of substrate phosphorylation. Biochemistry 40: 504-513, 2001.
2. Backer, JM, Myers MG, Jr., Shoelson SE, Chin DJ, Sun XJ, Miralpeix M, Hu P, Margolis B,
Skolnik EY, Schlessinger J, and et al. Phosphatidylinositol 3'-kinase is activated by association
with IRS-1 during insulin stimulation. EMBO J 11: 3469-3479, 1992.
3. Bandyopadhyay, G, Standaert ML, Sajan MP, Karnitz LM, Cong L, Quon MJ, and Farese RV.
Dependence of insulin-stimulated glucose transporter 4 translocation on 3-phosphoinositide-
dependent protein kinase-1 and its target threonine- 410 in the activation loop of protein kinase
C-zeta. Mol Endocrinol 13: 1766-1772, 1999.
4. Carpenter, CL, Duckworth BC, Auger KR, Cohen B, Schaffhausen BS, and Cantley LC.
Purification and characterization of phosphoinositide 3-kinase from rat liver. J Biol Chem 265:
19704-19711, 1990.
5. Charron, MJ, Brosius FC, 3rd, Alper SL, and Lodish HF. A glucose transport protein expressed
predominately in insulin- responsive tissues. Proc Natl Acad Sci U S A 86: 2535-2539, 1989.
6. Clement, S, Krause U, Desmedt F, Tanti J-F, Behrends J, Pesesse X, Sasaki T, Penninger J,
Doherty M, Malaisse W, Dumont JE, Le Marchand-Brustel Y, Erneux C, Hue L, and Schurmans
S. The lipid phosphatase SHIP2 controls insulin sensitivity. Nature 409: 92-97, 2001.
7. Cong, LN, Chen H, Li Y, Zhou L, McGibbon MA, Taylor SI, and Quon MJ. Physiological role
of Akt in insulin-stimulated translocation of GLUT4 in transfected rat adipose cells. Mol
Endocrinol 11: 1881-1890, 1997.
8. Cushman, SW, and Wardzala LJ. Potential mechanism of insulin action on glucose transport in
the isolated rat adipose cell. Apparent translocation of intracellular transport systems to the
plasma membrane. J Biol Chem 255: 4758-4762, 1980.

26
9. De Fea, K, and Roth RA. Protein kinase C modulation of insulin receptor substrate-1 tyrosine
phosphorylation requires serine 612. Biochemistry 36: 12939-12947, 1997.
10. Ebina, Y, Ellis L, Jarnagin K, Edery M, Graf L, Clauser E, Ou JH, Masiarz F, Kan YW,
Goldfine ID, Roth RA, and Rutter WJ. The human insulin receptor cDNA: the structural basis
for hormone-activated transmembrane signalling. Cell 40: 747-758, 1985.
11. Faure, R, Baquiran G, Bergeron JJ, and Posner BI. The dephosphorylation of insulin and
epidermal growth factor receptors. Role of endosome-associated phosphotyrosine
phosphatase(s). J Biol Chem 267: 11215-11221, 1992.
12. Freychet, P, Roth J, and Neville DM, Jr. Insulin receptors in the liver: specific binding of ( 125
I)insulin to the plasma membrane and its relation to insulin bioactivity. Proc Natl Acad Sci U
S A 68: 1833-1837, 1971.
13. Fukumoto, H, Kayano T, Buse JB, Edwards Y, Pilch PF, Bell GI, and Seino S. Cloning and
characterization of the major insulin-responsive glucose transporter expressed in human skeletal
muscle and other insulin-responsive tissues. J Biol Chem 264: 7776-7779, 1989.
14. Giorgetti, S, Ballotti R, Kowalski-Chauvel A, Cormont M, and Van Obberghen E. Insulin
stimulates phosphatidylinositol-3-kinase activity in rat adipocytes. Eur J Biochem 207: 599-606,
1992.
15. Goldstein, BJ, Li PM, Ding W, Ahmad F, and Zhang WR. Regulation of insulin action by
protein tyrosine phosphatases. Vitam Horm 54: 67-96, 1998.
16. Hayashi, T, Okamoto M, Yoshimasa Y, Inoue G, Yamada K, Kono S, Shigemoto M, Suga J,
Kuzuya H, and Nakao K. Insulin-induced activation of phosphoinositide 3-kinase in Fao cells.
Diabetologia 39: 515-522, 1996.
17. Holman, GD, Lo Leggio L, and Cushman SW. Insulin-stimulated GLUT4 glucose transporter
recycling. A problem in membrane protein subcellular trafficking through multiple pools. J Biol
27
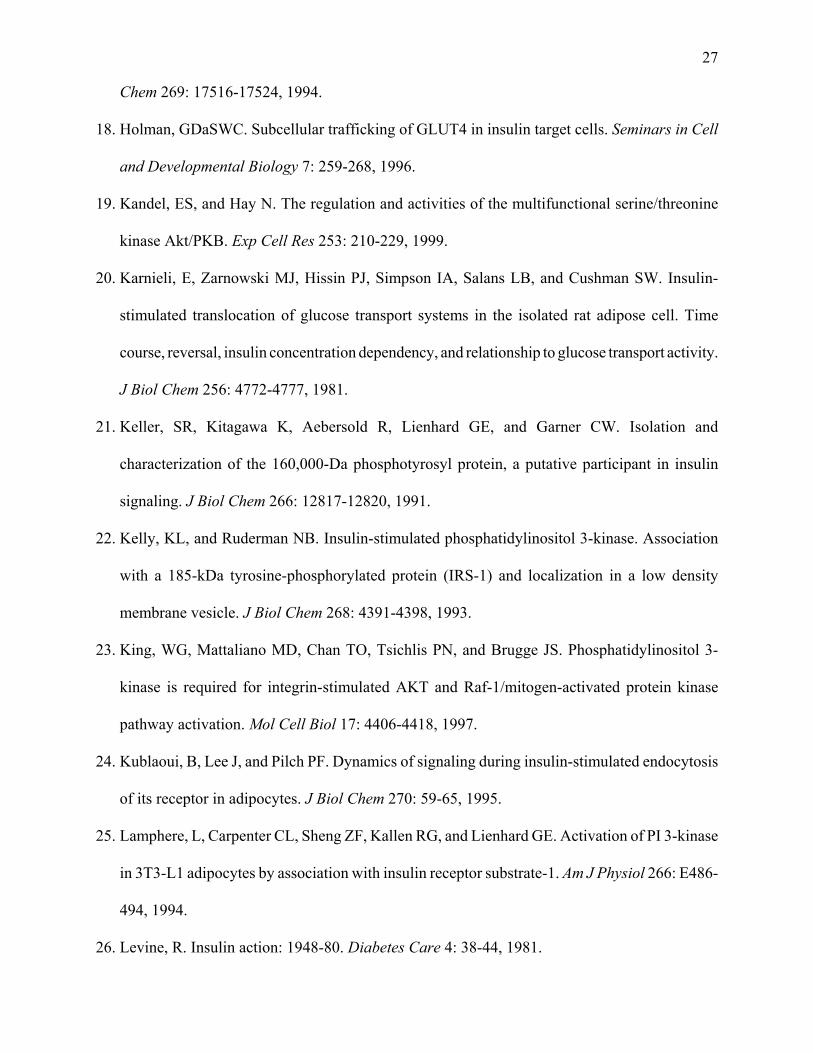
Chem 269: 17516-17524, 1994.
18. Holman, GDaSWC. Subcellular trafficking of GLUT4 in insulin target cells. Seminars in Cell
and Developmental Biology 7: 259-268, 1996.
19. Kandel, ES, and Hay N. The regulation and activities of the multifunctional serine/threonine
kinase Akt/PKB. Exp Cell Res 253: 210-229, 1999.
20. Karnieli, E, Zarnowski MJ, Hissin PJ, Simpson IA, Salans LB, and Cushman SW. Insulin-
stimulated translocation of glucose transport systems in the isolated rat adipose cell. Time
course, reversal, insulin concentration dependency, and relationship to glucose transport activity.
J Biol Chem 256: 4772-4777, 1981.
21. Keller, SR, Kitagawa K, Aebersold R, Lienhard GE, and Garner CW. Isolation and
characterization of the 160,000-Da phosphotyrosyl protein, a putative participant in insulin
signaling. J Biol Chem 266: 12817-12820, 1991.
22. Kelly, KL, and Ruderman NB. Insulin-stimulated phosphatidylinositol 3-kinase. Association
with a 185-kDa tyrosine-phosphorylated protein (IRS-1) and localization in a low density
membrane vesicle. J Biol Chem 268: 4391-4398, 1993.
23. King, WG, Mattaliano MD, Chan TO, Tsichlis PN, and Brugge JS. Phosphatidylinositol 3-
kinase is required for integrin-stimulated AKT and Raf-1/mitogen-activated protein kinase
pathway activation. Mol Cell Biol 17: 4406-4418, 1997.
24. Kublaoui, B, Lee J, and Pilch PF. Dynamics of signaling during insulin-stimulated endocytosis
of its receptor in adipocytes. J Biol Chem 270: 59-65, 1995.
25. Lamphere, L, Carpenter CL, Sheng ZF, Kallen RG, and Lienhard GE. Activation of PI 3-kinase
in 3T3-L1 adipocytes by association with insulin receptor substrate-1. Am J Physiol 266: E486-
494, 1994.
26. Levine, R. Insulin action: 1948-80. Diabetes Care 4: 38-44, 1981.

28
27. Levine, R, Goldstein M, Klein S, and Huddlestun B. The action of insulin on the distribution of
galactose in eviscerated nephrectomized dogs. J Biol Chem 179: 985-990, 1949.
28. Liu, WS, and Heckman CA. The sevenfold way of PKC regulation. Cell Signal 10: 529-542,
1998.
29. Madoff, DH, Martensen TM, and Lane MD. Insulin and insulin-like growth factor 1 stimulate
the phosphorylation on tyrosine of a 160 kDa cytosolic protein in 3T3-L1 adipocytes. Biochem
J 252: 7-15, 1988.
30. Mooney, RA, and Anderson DL. Phosphorylation of the insulin receptor in permeabilized
adipocytes is coupled to a rapid dephosphorylation reaction. J Biol Chem 264: 6850-6857, 1989.
31. Mooney, RA, and Green DA. Insulin receptor dephosphorylation in permeabilized adipocytes
is inhibitable by manganese and independent of receptor kinase activity. Biochem Biophys Res
Commun 162: 1200-1206, 1989.
32. Nystrom, FH, and Quon MJ. Insulin signalling: metabolic pathways and mechanisms for
specificity. Cell Signal 11: 563-574, 1999.
33. Paz, K, Liu YF, Shorer H, Hemi R, LeRoith D, Quon M, Kanety H, Seger R, and Zick Y.
Phosphorylation of insulin receptor substrate-1 (IRS-1) by protein kinase B positively regulates
IRS-1 function. J Biol Chem 274: 28816-28822, 1999.
34. Pessin, JE, Thurmond DC, Elmendorf JS, Coker KJ, and Okada S. Molecular basis of insulin-
stimulated GLUT4 vesicle trafficking. Location! Location! Location! J Biol Chem 274: 2593-
2596, 1999.
35. Quon, MJ. Advances in kinetic analysis of insulin-stimulated GLUT-4 translocation in adipose
cells. Am J Physiol 266: E144-150, 1994.
36. Quon, MJ, and Campfield LA. A mathematical model and computer simulation study of insulin
receptor regulation. J Theor Biol 150: 59-72, 1991.

29
37. Quon, MJ, and Campfield LA. A mathematical model and computer simulation study of insulin
sensitive glucose transporter regulation. J Theor Biol 150: 93-107, 1991.
38. Ravichandran, LV, Chen H, Li Y, and Quon MJ. Phosphorylation of PTP1B at Ser50 by Akt
Impairs its Ability to Dephosphorylate the Insulin Receptor. Mol Endocrinol 15: In press, 2001.
39. Ravichandran, LV, Esposito DL, Chen J, and Quon MJ. Protein kinase C-zeta phosphorylates
insulin receptor substrate-1 and impairs its ability to activate phosphatidylinositol 3-kinase in
response to insulin. J Biol Chem 276: 3543-3549, 2001.
40. Satoh, S, Nishimura H, Clark AE, Kozka IJ, Vannucci SJ, Simpson IA, Quon MJ, Cushman SW,
and Holman GD. Use of bismannose photolabel to elucidate insulin-regulated GLUT4
subcellular trafficking kinetics in rat adipose cells. Evidence that exocytosis is a critical site of
hormone action. J Biol Chem 268: 17820-17829, 1993.
41. Schaff, J, and Loew LM. The virtual cell. Pac Symp Biocomput: 228-239, 1999.
42. Scraton, RE. Basic Numerical Methods: An Introduction to Numerical Mathematics on a
Microcomputer. London: E. Arnold, 1984.
43. Shymko, RM, De Meyts P, and Thomas R. Logical analysis of timing-dependent receptor
signalling specificity: application to the insulin receptor metabolic and mitogenic signalling
pathways. Biochem J 326: 463-469., 1997.
44. Shymko, RM, Dumont E, De Meyts P, and Dumont JE. Timing-dependence of insulin-receptor
mitogenic versus metabolic signalling: a plausible model based on coincidence of hormone and
effector binding. Biochem J 339: 675-683, 1999.
45. Simpson, L, and Parsons R. PTEN: life as a tumor suppressor. Exp Cell Res 264: 29-41, 2001.
46. Sorisky, A, Pardasani D, and Lin Y. The 3-phosphorylated phosphoinositide response of 3T3-L1
preadipose cells exposed to insulin, insulin-like growth factor-1, or platelet- derived growth
factor. Obes Res 4: 9-19, 1996.

30
47. Stagsted, J, Hansen T, Roth RA, Goldstein A, and Olsson L. Correlation between insulin
receptor occupancy and tyrosine kinase activity at low insulin concentrations and effect of major
histocompatibility complex class I-derived peptide. J Pharmacol Exp Ther 267: 997-1001, 1993.
48. Standaert, ML, Bandyopadhyay G, Perez L, Price D, Galloway L, Poklepovic A, Sajan MP,
Cenni V, Sirri A, Moscat J, Toker A, and Farese RV. Insulin activates protein kinases C-zeta and
C-lambda by an autophosphorylation-dependent mechanism and stimulates their translocation
to GLUT4 vesicles and other membrane fractions in rat adipocytes. J Biol Chem 274: 25308-
25316, 1999.
49. Standaert, ML, Bandyopadhyay G, Sajan MP, Cong L, Quon MJ, and Farese RV. Okadaic acid
activates atypical protein kinase C (zeta/lambda) in rat and 3T3/L1 adipocytes. An apparent
requirement for activation of Glut4 translocation and glucose transport. J Biol Chem 274: 14074-
14078, 1999.
50. Standaert, ML, Galloway L, Karnam P, Bandyopadhyay G, Moscat J, and Farese RV. Protein
kinase C-zeta as a downstream effector of phosphatidylinositol 3-kinase during insulin
stimulation in rat adipocytes. Potential role in glucose transport. J Biol Chem 272: 30075-30082,
1997.
51. Standaert, ML, and Pollet RJ. Equilibrium model for insulin-induced receptor down-regulation.
Regulation of insulin receptors in differentiated BC3H-1 myocytes. J Biol Chem 259: 2346-
2354, 1984.
52. Sun, XJ, Miralpeix M, Myers MG, Jr., Glasheen EM, Backer JM, Kahn CR, and White MF.
Expression and function of IRS-1 in insulin signal transmission. J Biol Chem 267: 22662-22672,
1992.
53. Suzuki, K, and Kono T. Evidence that insulin causes translocation of glucose transport activity
to the plasma membrane from an intracellular storage site. Proc Natl Acad Sci U S A 77: 2542-

31
2545, 1980.
54. Ullrich, A, Bell JR, Chen EY, Herrera R, Petruzzelli LM, Dull TJ, Gray A, Coussens L, Liao
YC, Tsubokawa M, Mason A, Seepurg PH, Grunfeld C, Rosen OM, and Ramachandran J.
Human insulin receptor and its relationship to the tyrosine kinase family of oncogenes. Nature
313: 756-761, 1985.
55. van der Kaay, J, Batty IH, Cross DA, Watt PW, and Downes CP. A novel, rapid, and highly
sensitive mass assay for phosphatidylinositol 3,4,5-trisphosphate (PtdIns(3,4,5)P3) and its
application to measure insulin-stimulated PtdIns(3,4,5)P3 production in rat skeletal muscle in
vivo. J Biol Chem 272: 5477-5481, 1997.
56. Vanhaesebroeck, B, and Alessi DR. The PI3K-PDK1 connection: more than just a road to PKB.
Biochem J 346 Pt 3: 561-576, 2000.
57. Wanant, S, and Quon MJ. Insulin receptor binding kinetics: modeling and simulation studies.
J Theor Biol 205: 355-364, 2000.
58. White, MF, Shoelson SE, Keutmann H, and Kahn CR. A cascade of tyrosine
autophosphorylation in the beta-subunit activates the phosphotransferase of the insulin receptor.
J Biol Chem 263: 2969-2980, 1988.
59. Wilden, PA, Kahn CR, Siddle K, and White MF. Insulin receptor kinase domain
autophosphorylation regulates receptor enzymatic function. J Biol Chem 267: 16660-16668,
1992.

32
FIGURE LEGENDS
Figure 1. Schematic of insulin receptor binding and lifecycle subsystems. (A) Previously validated
model of insulin binding kinetics (57). x1 is the free insulin concentration (system input), x2 is the
free receptor concentration, x3 is the concentration of receptors with one molecule of insulin bound,
and x4 is the concentration of receptors with 2 molecules of insulin bound. k1 and k-1 are the
association and dissociation rate constants for the first molecule of insulin to bind the receptor while
k2 and k-2 are the association and dissociation rate constants for the second molecule of insulin to
bind the receptor. (B) Receptor binding subsystem extended to include receptor
autophosphorylation and dephosphorylation. x5 is the concentration of once-bound phosphorylated
receptors and x4 is re-defined as the concentration of twice bound phosphorylated receptors. k3 is
the rate constant for receptor autophosphorylation while k-3 is the rate constant for receptor
dephosphorylation. [PTP] is a multiplicative factor modulating k-3 that represents the relative
activity of PTPases in the cell that dephosphorylate the insulin receptor. (C) Previously validated
model of insulin receptor recycling (36). x6 is the concentrations of intracellular receptors. k4 is the
endocytosis rate constant for free receptors, k-4 is the exocytosis rate constant, k4' is the endocytosis
rate constant for bound receptors, k5 is the zero order rate constant for receptor synthesis, and k-5 is
a constant for receptor degradation. (D) Extension of insulin receptor binding and recycling
subsystems that includes phosphorylated receptors. x7 and x8 are the concentration of twice bound
and once bound intracellular phosphorylated receptors, respectively. k-4' is the exocytosis rate for
twice bound and once bound intracellular phosphorylated receptors. k6 is the dephosphoyrlation rate
constant for intracellular receptors that is modulated by the multiplicative factor [PTP].
Figure 2. Schematic of post-receptor signaling subsystem. x9 is the concentration of
unphosphorylated IRS-1, x10 is the concentration of tyrosine phosphorylated IRS-1, x11 is the

33
concentration of free PI 3-kinase, and x12 is the concentration of the phosphorylated IRS-1/activated
PI 3-kinase complex. x13, x14, and x15 are the percentages of various phosphoinositol lipids in the
cell. x16 and x17 are the percentages of unphosphorylated and phosphorylated Akt in the cell. x18 and
x19 are the percentages of unphosphorylated and phosphorylated PKC-ζ in the cell. The rate
constants k7 through k12 and k-7 through k-12 govern the conversion between state variables as
indicated. [PTP] is a multiplicative factor modulating k-7 that represents the relative activity of
PTPases in the cell that dephosphorylate IRS-1. [PTEN] and [SHIP] are multiplicative factors
modulating k-9 and k-10, respectively, that represent the relative activity of these lipid phosphatases
in the cell. Arrows with solid lines indicate first-order reactions. Arrows with dashed lines indicate
reactions where the value of a state variable influences the value of the rate constant.
Figure 3. Schematic of GLUT4 translocation subsystem (35, 37). x20 is the percentage of
intracellular GLUT4 and x21 is the percentage of GLUT4 at the cell surface. k-13 is the rate
constant for GLUT4 internalization, k13 is the rate constant for translocation of GLUT4 to the cell
surface under basal conditions, and k13’ is the rate constant for translocation of GLUT4. k14 (zero
order) and k-14 are the rate constants for GLUT4 synthesis and degradation, respectively. “metabolic
effect” from post-receptor signaling subsystem increases k13' and decreases k13.
Figure 4. Complete model of metabolic insulin signaling pathways obtained by coupling subsystem
models for insulin receptor binding, receptor recycling, post-receptor signaling and GLUT4
translocation.
Figure 5. Complete model of metabolic insulin signaling pathways with feedback. Identical to
model shown in Fig. 4 except that new elements comprising positive and negative feedback

34
pathways are indicated by dotted lines. PKC-ζ serine-phosphorylates IRS-1 to create a negative
feedback pathway while Akt phosphorylates PTP1B to create a positive feedback pathway.
Figure 6. Model simulations without feedback. Time courses for unbound receptors (A), once and
twice bound phosphorylated surface receptors (B), total phosphorylated surface receptors (C), and
unphosphorylated and tyrosine phosphorylated IRS-1 (D) after a step input of 10-7 M insulin for 15
min.
Figure 7. Model simulations without feedback. Time courses for activated PI 3-kinase (A), levels
of PI(3,4,5)P3 and PI(3,4)P2 (B), activated PKC-ζ (C), and cell surface GLUT4 (D) after a step input
of 10-7 M insulin for 15 min.
Figure 8. Model simulations with feedback. Time courses for unbound receptors (A), once and
twice bound phosphorylated surface receptors (B), total phosphorylated surface receptors (C), and
unphosphorylated, serine-phosphorylated, and tyrosine-phosphorylated IRS-1 (D) after a step input
of 10-7 M insulin for 15 min.
Figure 9. Model simulations with feedback. Time courses for activated PI 3-kinase (A), levels of
PI(3,4,5)P3 and PI(3,4)P2 (B), activated PKC-ζ (C), and cell surface GLUT4 (D) after a step input
of 10-7 M insulin for 15 min.
Figure 10. Experimentally generated insulin-dose response curves adapted from ref. (47) were
compared to dose response curves generated from our model with and without feedback for (A)
bound receptors, (B) phosphorylated receptors at the cell surface, (C) PI 3-kinase activity, and (D)

35
glucose uptake (assumed to be directly proportional to GLUT4 levels at the cell surface).
Figure 11. Biphasic activation of PKC-ζ in response to insulin stimulation. Published data on
insulin-stimulated activation of PKC-ζ (adapted from Fig. 2A in ref. (48) (!)) was compared with
simulation results from our model with (") and without (∆) feedback using a step input of 10-8 M
insulin for 15 min.
Figure 12. Effects of increasing PTP on time-courses for insulin-stimulated translocation of
GLUT4. Simulations for cell surface GLUT4 in response to a 15 min step input of (A) 10-7 M
insulin, (B) 10-9 M insulin, and (C) 10-10 M insulin are shown for [PTP] = 1.0 (open symbols) and
[PTP] = 1.5 (closed symbols) using our model without feedback.

36
Appendix I
Model without Feedback
State variables:x1 = Insulin inputx2 = Concentration of unbound surface insulin receptorsx3 = Concentration of unphosphorylated once bound surface receptorsx4 = Concentration of phosphorylated twice bound surface receptorsx5 = Concentration of phosphorylated once bound surface receptorsx6 = Concentration of unbound unphosphorylated intracellular receptorsx7 = Concentration of phosphorylated twice bound intracellular receptorsx8 = Concentration of phosphorylated once bound intracellular receptorsx9 = Concentration of unphosphorylated IRS-1x10 = Concentration of tyrosine phosphorylated IRS-1x11 = Concentration of unactivated PI 3-kinasex12 = Concentration of tyrosine phosphorylated IRS-1/activated PI 3-kinase complexx13 = Percentage of PI(3,4,5)P3 out of the total lipid populationx14 = Percentage of PI(4,5)P2 out of the total lipid populationx15 = Percentage of PI(3,4)P2 out of the total lipid populationx16 = Percentage of unactivated Akt x17 = Percentage of activated Aktx18 = Percentage of unactivated PKC-ζx19 = Percentage of activated PKC-ζx20 = Percentage of intracellular GLUT4x21 = Percentage of cell surface GLUT4
Equations:x1 = insulin inputdx2/dt = k-1x3 + k-3[PTP]x5 – k1x1x2 + k-4x6 – k4x2dx3/dt = k1x1x2 - k-1x3 - k3x3dx4/dt = k2x1x5 – k-2x4 + k-4’x7 – k4’x4dx5/dt = k3x3 + k-2x4 – k2x1x5 – k-3[PTP]x5 + k-4’x8 – k4’x5dx6/dt = k5 – k-5x6 + k6[PTP](x7 + x8) + k4x2 – k-4x6dx7/dt = k4’x4 – k-4’x7 – k6[PTP]x7dx8/dt = k4’x5 – k-4’x8 – k6[PTP]x8dx9/dt = k-7[PTP]x10 – k7x9(x4 + x5)/(IRp)dx10/dt = k7x9(x4 + x5)/(IRp) + k-8x12 – (k-7[PTP] + k8x11)x10dx11/dt = k-8x12 – k8x10x11dx12/dt = k8x10x11 – k-8x12dx13/dt = k9x14 + k10x15 – (k-9[PTEN] + k-10[SHIP])x13dx14/dt = k-9[PTEN]x13 – k9x14dx15/dt = k-10[SHIP]x13 – k10x15dx16/dt = k-11x17 – k11x16dx17/dt = k11x16 – k-11x17dx18/dt = k-12x19 – k12x18dx19/dt = k12x18 – k-12x19

37
dx20/dt = k-13x21 – (k13 + k13’)x20 + k14 – k-14x20dx21/dt = (k13 + k13’)x20 – k-13x21
Initial Conditions:x1(0) = 0x2(0) = 9 x 10-13 Mx3(0) = 0x4(0) = 0x5(0) = 0x6(0) = 1 x 10-13 Mx7(0) = 0x8(0) = 0x9(0) = 1 x 10-12 Mx10(0) = 0x11(0) = 1 x 10-13 Mx12(0) = 0x13(0) = 0.31%x14(0) = 99.4%x15(0) = 0.29%x16(0) = 100%x17(0) = 0x18(0) = 100%x19(0) = 0x20(0) = 96%x21(0) = 4%
Model Parameters:k1 = 6 x 10⁷ M-1min-1
k-1 = 0.20 min-1
k2 = k1k-2 = 100k-1 k3 = 2500 min-1
k-3 = k-1k4 = k-4/9k-4 = 0.003 min-1
k4' = 2.1 x 10⁻³ min-1
k-4' = 2.1 x 10⁻⁴ min-1
k5 = 10k-5 M min-1 if (x6 + x7 + x8) > 1 x 10-13
= 60k-5 M min-1 if (x6 + x7 + x8) # 1 x 10-13
k-5 = 1.67 x 10⁻¹⁸ min-1
k6 = 0.461 min-1
k7 = 4.16 min-1 k-7 = (2.5/7.45)k7k8 = k-8(5/70.775) x 1012
k-8 = 10 min-1
k9 = (k9(stimulated) – k9(basal))(x12/PI3K) + k9(basal)k9(stimulated) = 1.39 min-1
k-9 = (94/3.1)k9(stimulated)

38
k9(basal) = (0.31/99.4)k-9k10 = (3.1/2.9)k-10k-10 = 2.77 min-1
k11 = (0.1k-11)(x13 – 0.31)/(3.10 – 0.31)k-11 = 10ln(2) min-1
k12 = (0.1k-12)(x13 – 0.31)/(3.10 – 0.31)k-12 = 10ln(2) min-1
k-13 = 0.167 min-1
k13 = (4/96)k-13k13’ = [(40/60)-(4/96)]k-13 C (“effect”)k14 = 96k-14k-14 = 0.001155 min-1
“effect” = (0.2x17 + 0.8x19)/(APequil)IRp=8.97 x 10-13 M[SHIP] = 1.00[PTEN] = 1.00[PTP] = 1.00APequil = 100/11PI3K = 5 x 10-15 M
Model with Feedback
Additional State Variables:x10a = Concentration of serine phosphorylated IRS-1
Additional Equations:dx9/dt = k-7[PTP]x10 – k7x9(x4 + x5)/(IRp) + k-7'x10a - k7'[PKC]x9 (updated)dx10a/dt = k7'[PKC]x9 - k-7'x10a
Additional Initial Conditions:x10a(0) = 0
Additional Parameters:k7' = ln(2)/2 min-1
k-7' = k7' ((2.5/7.45)(3.70 x 10-13))/((6.27 x 10-13) - (2.5/7.45)(3.70 x 10-13))[PTP] = 1.00(1 - 0.25(x17/(100/11)) for x17 # (400/11), otherwise [PTP] = 0 (updated)PI3K = k8(3.70 x 10⁻¹³)(1 x 10-13)/(k8(3.70 x 10-13) + k-8) (updated)[PKC] = Vmax(x19(t - tau)n/(Kd
n + x19n)
Vmax = 20Kd = 12n = 4tau = 1.5
39
Appendix II
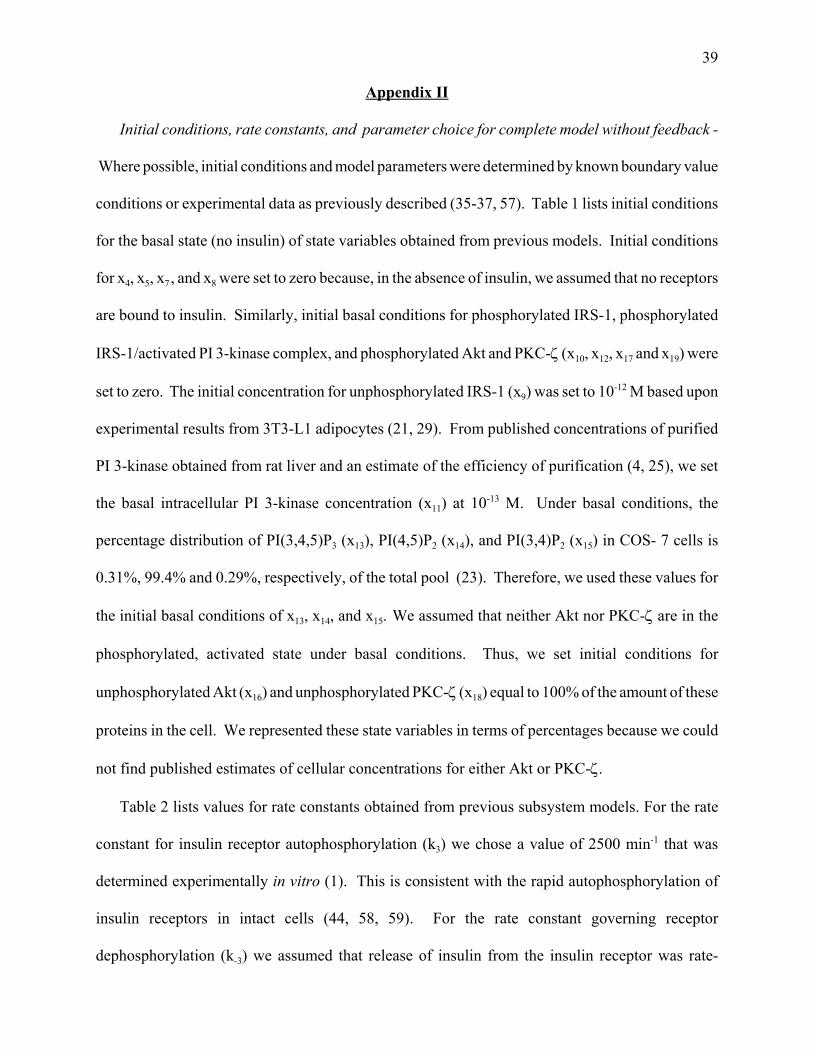
Initial conditions, rate constants, and parameter choice for complete model without feedback -
Where possible, initial conditions and model parameters were determined by known boundary value
conditions or experimental data as previously described (35-37, 57). Table 1 lists initial conditions
for the basal state (no insulin) of state variables obtained from previous models. Initial conditions
for x4, x5, x7 , and x8 were set to zero because, in the absence of insulin, we assumed that no receptors
are bound to insulin. Similarly, initial basal conditions for phosphorylated IRS-1, phosphorylated
IRS-1/activated PI 3-kinase complex, and phosphorylated Akt and PKC-ζ (x10, x12, x17 and x19) were
set to zero. The initial concentration for unphosphorylated IRS-1 (x9) was set to 10-12 M based upon
experimental results from 3T3-L1 adipocytes (21, 29). From published concentrations of purified
PI 3-kinase obtained from rat liver and an estimate of the efficiency of purification (4, 25), we set
the basal intracellular PI 3-kinase concentration (x11) at 10-13 M. Under basal conditions, the
percentage distribution of PI(3,4,5)P3 (x13), PI(4,5)P2 (x14), and PI(3,4)P2 (x15) in COS- 7 cells is
0.31%, 99.4% and 0.29%, respectively, of the total pool (23). Therefore, we used these values for
the initial basal conditions of x13, x14, and x15. We assumed that neither Akt nor PKC-ζ are in the
phosphorylated, activated state under basal conditions. Thus, we set initial conditions for
unphosphorylated Akt (x16) and unphosphorylated PKC-ζ (x18) equal to 100% of the amount of these
proteins in the cell. We represented these state variables in terms of percentages because we could
not find published estimates of cellular concentrations for either Akt or PKC-ζ.
Table 2 lists values for rate constants obtained from previous subsystem models. For the rate
constant for insulin receptor autophosphorylation (k3) we chose a value of 2500 min-1 that was
determined experimentally in vitro (1). This is consistent with the rapid autophosphorylation of
insulin receptors in intact cells (44, 58, 59). For the rate constant governing receptor
dephosphorylation (k-3) we assumed that release of insulin from the insulin receptor was rate-

40
limiting and that receptors were immediately dephosphorylated once they returned to the basal
unoccupied state (11, 30, 31, 44). Therefore, we chose k-3 = k-1. The rate constant for
phosphorylated receptor endocytosis (k4’) was chosen to be 2.1 x 10⁻³ min-1. This is the value used
for the endocytosis rate constant for bound insulin receptors in our previous model (36). Since the
rate of ligand mediated endocytosis exceeds the rate for exocytosis, we chose a ratio of endocytosis
and exocytosis rate constants for phosphorylated receptors of 10:1 so that k-4' = 2.1 x 10⁻⁴ min-1.
When phosphorylated receptors are internalized, insulin dissociates and receptors undergo rapid
dephosphorylation. The half-time for internalized receptor dephosphorylation (after maximal
phosphorylation by insulin stimulation) is ~1.5 min in rat liver endosomes (11). For a first-order
rate constant:
(32) k = (ln 2)/(t1/2)
Therefore, assuming t1/2 = 1.5 min for internalized receptor dephosphorylation, the rate constant for
intracellular receptor dephosphorylation (k6) is 0.461 min-1.
For reactions in the post-receptor signaling subsystem the choice of rate constants was based
upon experimental data where possible. To further limit the number of free parameters, we also used
published data to derive fixed relationships among various rate constants. Upon maximal insulin
stimulation, most IRS-1 is tyrosine phosphorylated (52) with a half-time of approximately 10 s in
3T3-L1 adipocytes (29). Under these conditions, approximately 5% of PI 3-kinase is activated in
Fao cells (16). Using initial conditions described above for the basal state and assuming that 75%
of all IRS-1 becomes tyrosine phosphorylated with maximal insulin stimulation, equilibrium values
for x9 through x12 after maximal insulin stimulation will be: x9 = 2.5 x 10⁻¹³ M, x10 = 7.45 x 10⁻¹³ M,
x11 = 9.5 x 10⁻¹⁴ M, and x12 = 5.0 x 10⁻¹⁵ M. Assuming the half-time for maximal IRS-1
phosphorylation is 10 s, k7 = 4.16 min-1 (using equation 32). Under normal physiological conditions,
where PTP =1, equation 14 can be simplified and rearranged as k-7 = (x9/x10)k7 in the equilibrium

41
state after maximal insulin stimulation. Thus, under conditions of maximal insulin stimulation, k-7
= (2.5/7.45)k7. Reassuringly, these values for k7 and k-7 are consistent with the time course for IRS-1
phosphorylation and dephosphorylation observed in rat adipose cells (24). Similarly, at equilibrium,
equations 16 and 17 can be simplified and rearranged as k8 = x12/(x10x11)k-8. Since we were unable
to find data on rates for association or dissociation of IRS-1 with PI 3-kinase, we chose k-8 = 10 min-
1 to be consistent with the scale of other rate constants in the post-receptor signaling subsystem.
Thus, at maximal insulin stimulation, we constrained k8 = (50/70.775) x 1012 M-1min-1.
Based on data from 3T3-L1 cells, we assumed that levels for PI(3,4,5)P3 and PI(3,4)P2 both rise
10-fold after maximal insulin stimulation (22, 46) resulting in a new equilibrium distribution of
3.1%, 94% and 2.9% for PI(3,4,5)P3, PI(4,5)P2, PI(3,4)P2 respectively. Since insulin-stimulated
conversion of PI(4,5)P2 to PI(3,4,5)P3 is mediated by the phosphorylated IRS-1/activated PI 3-kinase
complex, there is an increase in the rate constant governing this process (k9) with insulin stimulation.
We represented the transition in k9 from the basal value (k9(basal)) to the insulin stimulated value
(k9(stimulated)) as a linear function of activated PI 3-kinase present in the cell:
(33) k9 = (k9(stimulated) – k9(basal))(x12/PI3K) + k9(basal)
where PI3K is the equilibrium concentration of activated PI 3-kinase obtained after maximal insulin
stimulation. Data from 3T3-L1 preadipocytes suggests that conversion of PI(4,5)P2 to PI(3,4,5)P3
in response to insulin stimulation occurs with a half-time of ~30 s (when a time lag from upstream
signaling events is considered) (46). Assuming a 30 s half-time for conversion of PI(4,5)P2 to
PI(3,4,5)P2 and using equation 32, we calculated k9(stimulated) = 1.39 min-1. For both basal and insulin
stimulated equilibrium states, equation 19 can be simplified and rearranged to show that k9 =
(x13/x14)k-9 (under normal physiological conditions where PTEN = 1). Therefore, k-9 and k9(basal) can
be constrained: k-9 = (94/3.1)k9(stimulated) and k9(basal) = (0.31/99.4)k-9. Similarly, data from 3T3-L1
preadipocytes suggests that conversion of PI(3,4,5)P3 to PI(3,4)P2 occurs with a half-time of ~15 s

42
(46). Assuming a 15 s half-time for conversion of PI(3,4,5)P3 to PI(3,4)P2, k-10 = 2.77 min-1. For
both basal and insulin stimulated equilibrium states, equation 20 can be simplified to constrain k10
= (3.1/2.9)k-10 (under normal physiological conditions where SHIP = 1).
To define kinetic rate constants for activation and deactivation of Akt and PKC-ζ, we used data
from rat skeletal muscle cells and rat adipocytes showing that PKC-ζ and Akt are both activated by
insulin at approximately the same rate and that both enzymes reach maximal activation within 5 min
of insulin stimulation (48, 55). There is no published data on the time course of activation in intact
cells for Akt or PKC-ζ by their immediate signaling precursors. However, experimental data
suggests that after taking into account the time lag between insulin binding and generation of
PI(3,4,5)P3, the induced activation of Akt and PKC-ζ probably occurs within 2 min (50, 56). Thus,
we chose rate constants for Akt and PKC-ζ activation, k11 and k12, to be the same and also assumed
that the half-time for maximal Akt and PKC-ζ activation was 1 min. Thus, using equation 32, k11
= k12 = (ln 2) min-1 at equilibrium after maximal insulin stimulation.
Since many other growth factors can activate Akt and PKC-ζ simultaneously (19, 28), we
assumed that with maximal insulin stimulation both Akt and PKC-ζ exist in a 10:1
unactivated:activated distribution at equilibrium. Therefore, from equations 21-24, we can constrain
k-11 = 10k11 = 10ln(2) and k-12 = 10k12 = 10ln(2). Since PI(3,4,5)P3 formation mediates Akt and PKC-
ζ activation (50, 56), we assumed that rate constants for activation of both Akt and PKC-ζ increase
from zero to their maximal values as a linear function of the increase in PI(3,4,5)P3 levels:
(34) k11 = (0.1k-11)(x13 – 0.31)/(3.10 – 0.31)
(35) k12 = (0.1k-12)(x13 – 0.31)/(3.10 – 0.31)
where 0.31 is the basal value of PI(3,4,5)P3, 3.10 is value of PI(3,4,5)P3 in the cell after maximal
insulin stimulation. The values used for k-13 , k14, and k-14 were previously defined for the GLUT4
translocation subsystem (Table 2) and the values for k13 and k13' can be derived from this information

43
using equations 28 and 29.
The parameter [PTP] was defined as the relative activity of protein tyrosine phosphatases in the
cell. Thus, [PTP] = 1 under normal physiological conditions while pathological variations in PTPase
activity can be represented by altering [PTP]. Similarly, model parameters [SHIP] and [PTEN] were
defined as the relative activity of 5' and 3' lipid phosphatases, respectively, in the cell ([SHIP] = 1
and [PTEN] = 1 under normal conditions). The value for IRp (used in equations 14 and 15) was
determined to be 8.97 x 10⁻¹³ M based on calculations using equilibrium conditions obtained during
maximal insulin stimulation for equations 6-13 and assuming that receptor down-regulation is
negligible during acute insulin stimulation. The value for APequil (used in equation 29) was
determined to be 100/11 (based upon a 10:1 unactivated:activated distribution of both Akt and PKC-
ζ). The value for PI3K (used in equation 33) was chosen as 5 x 10-15 M based on experimental data
indicating that approximately 5% of PI 3-kinase is activated upon maximal insulin stimulation (16).
Additional initial conditions, rate constants, and parameter choice for complete model with
feedback - We assume that there is no serine phosphorylation of IRS-1 in the absence of insulin
stimulation. Therefore, we chose the initial value of x10a = 0. In NIH-3T3IR cells, the
phosphotyrosine content of IRS-1 after maximal insulin stimulation decreases by approximately
50% at 60 min (39). Thus, with inclusion of this negative feedback circuit, we chose the insulin-
stimulated equilibrium value of x10 = 3.7 x 10⁻¹³ M to reflect this 50% decrease. Using steady-state
conditions for equation 17 and initial conditions x11 + x12 = 1 x 10-13 M, the insulin stimulated
equilibrium level for x12 was calculated to be k8(3.70 x 10⁻¹³)(1 x 10-13)/(k8(3.70 x 10-13) + k-8) = 2.54
x 10-15 M. Since the total amount of IRS-1 is constant (x9 + x10 +x10a +x12), the insulin-stimulated
equilibrium level of x9 + x10a = 6.27 x 10⁻¹³ M. Values for k7, k-7, k8, and k-8 remained the same as
for the model without feedback. We assumed the half-time for IRS-1 serine phosphorylation was
2 min. From equation 32, we calculated k7' = ln(2)/2 min-1. Using parameter constraints and derived

44
equilibrium concentrations described above as well as equations 30 and 31: k-7' = k7'((2.5/7.45)(3.70
x 10-13))/((6.27 x 10-13) - (2.5/7.45)(3.70 x 10-13)) at equilibrium after maximal insulin stimulation.
Finally, to properly incorporate this negative feedback loop into our model, the factor PI3K from
equation 33 was redefined as 2.54 x 10⁻¹⁵ M, the insulin-stimulated equilibrium value of x12
calculated above. This change was necessary to satisfy all the constraints imposed by the new
equilibrium after maximal insulin stimulation. Consistent with the 50% decrease in phosphotyrosine
content of IRS-1 described above, this new value for PI3K is approximately half of that derived for
the model without feedback. We chose values for Vmax, Kd, n, and tau that seemed moderate and
reasonable for introducing a time delay on the order of a few minutes. By altering these parameters
it is possible to generate behavior that ranges from biphasic changes in activity of PKC-ζ to
sustained oscillations (data not shown). At present, there is no experimental data available to further
refine these parameter choices.
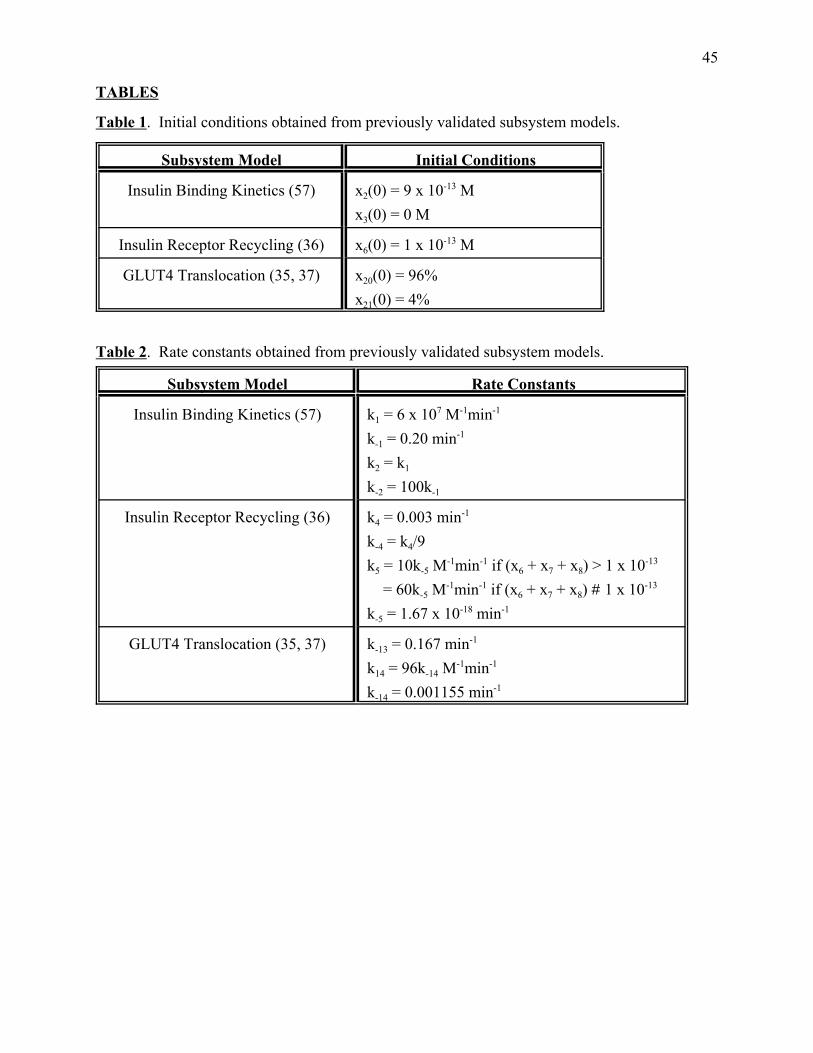
45
TABLES
Table 1. Initial conditions obtained from previously validated subsystem models.
Subsystem Model Initial Conditions
Insulin Binding Kinetics (57) x2(0) = 9 x 10-13 Mx3(0) = 0 M
Insulin Receptor Recycling (36) x6(0) = 1 x 10-13 M
GLUT4 Translocation (35, 37) x20(0) = 96%x21(0) = 4%
Table 2. Rate constants obtained from previously validated subsystem models.
Subsystem Model Rate Constants
Insulin Binding Kinetics (57) k1 = 6 x 10⁷ M-1min-1
k-1 = 0.20 min-1
k2 = k1 k-2 = 100k-1
Insulin Receptor Recycling (36) k4 = 0.003 min-1
k-4 = k4/9 k5 = 10k-5 M-1min-1 if (x6 + x7 + x8) > 1 x 10-13
= 60k-5 M-1min-1 if (x6 + x7 + x8) # 1 x 10-13
k-5 = 1.67 x 10⁻¹⁸ min-1
GLUT4 Translocation (35, 37) k-13 = 0.167 min-1
k14 = 96k-14 M-1min-1
k-14 = 0.001155 min-1

P
P
P
k-4’ k4’
k-4 k4
k5 k-5
k6[PTP]
k4’
Plasma Membrane
k-4 k4
k5 k-5
Plasma Membrane
k1
k-1 k-2
k2
PlasmaMembranePk-3[PTP]
k1
k-1
k3k-2
k2
PlasmaMembranePk-3[PTP]
k1
k-1
k3k-2
k2
P
x1
x2 x4x3
x1
x2 x4x3 x5
x1
x2 x4x3 x5
x6x6
x7x8
x2
x1
x3 x4
PP
P
P
k-4’ k4’k-4’ k4’
k-4 k4k-4 k4
k5 k-5
k6[PTP]
k4’
Plasma Membrane
k-4 k4k-4 k4
k5 k-5
Plasma Membrane
k1
k-1
k1
k-1
k1
k-1 k-2
k2
k-2
k2
k-2
k2
PlasmaMembranePk-3[PTP]
k1
k-1
k1
k-1
k3k-2
k2
PlasmaMembranePk-3[PTP]
k1
k-1
k3k-2
k2
P
x1
x2 x4x3
x1
x2 x4x3 x5
x1
x2 x4x3 x5
x6x6
x7x8
x2
x1
x3 x4
A B
DC
Fig. 1

P
P
PI(3,4,5)P3PI(4,5)P2PI(3,4)P2
k10
k-10[SHIP]
k9
k-9[PTEN]
IRS-1
Plasma Membrane
k-3[PTP]
IRS-1 P
PI3-K
k7
k-7[PTP] k8
k-8
IRS-1
PI3-K
AktP AktPKC-ζ PKC-ζk-11
k11
k12
k-12
Metabolic “Effect”
x2 x4x5
x14x13x15
x9
P P
x12
x11
x18
x10
x17x19x16
Fig. 2

P l a s m a M e m b r a n e
k1 3 ’
k- 1 3
k1 4
k- 1 4
k1 3
M e t a b o l i c
“ E f f e c t ”
( – )( + )
x2 0
x2 1
Fig. 3

k-1
k-7[PTP]
P P
P P
IRS-1
k5 k-5
k-3[PTP]
k7
k6[PTP]
k4’
k2k3k1
k-4’
k-2
PI(3,4,5)P3PI(3,4)P2 PI(4,5)P2
AktPKC-ζ P PPKC-ζ Akt
k-10[SHIP]
k10
k-12 k-11
k12 k11
k-9[PTEN]
k9k4k-4
P
PI3-K
k8
IRS-1
k-8
IRS-1
PI3-KP
k14
k13’
k-13
k-14
k13
Metabolic “Effect”
Fig. 4

P P
P P
IRS-1
k-3[PTP]
k6[PTP]
AktP PPKC-ζ
PP
’
IRS-1pS
k-7’k7’
x10a
k-7[PTP]
Fig. 5

0 10 20 30 40 50 60
Unphosphorylated IRS-1 (x9)Tyrosine phosphorylated IRS-1 (x10)
0 10 20 30 40 50 600.0
0.2
0.4
0.6
0.8
1.0 Surface phosphporylated receptors (x4 + x5)
0.0
0.2
0.4
0.6
0.8
1.0
Free Surface Receptors (x2)
Once bound phosphorylated receptors (x5)Twice bound phosphorylated receptors (x4)
B
D
A
C
Time (min)
Con
cent
ratio
n (p
M)
Fig. 6
Insulin Stimulation
Insulin Removed
Insulin Stimulation
Insulin Removed
Insulin Stimulation
Insulin Removed
Insulin Stimulation
Insulin Removed

Fig. 7
0 10 20 30 40 50 600
10
20
30
40Surface GLUT4 (x21)
0
1
2
3
4PI(3,4,5)P3 (x13)PI(3,4)P2 (x15)
0
1
2
3
4
5Activated PI 3-kinase (x12)
0 10 20 30 40 50 600
2
4
6
8
10Activated PKC-ζ (x19)
A B
DC
Time (min)
Con
cent
ratio
n (fM
)Pe
rcen
tage
PercentagePercentage
Insulin Stimulation
Insulin Removed
Insulin Stimulation
Insulin Removed
Insulin Stimulation
Insulin Removed
Insulin Stimulation
Insulin Removed

0 10 20 30 40 50 60
Unphosphorylated IRS-1 (x9)Tyrosine phosphorylated IRS-1 (x10)Serine phosphorylated IRS-1 (x10a)
0 10 20 30 40 50 600.0
0.2
0.4
0.6
0.8
1.0 Surface phosphporylated receptors (x4 + x5)
0.0
0.2
0.4
0.6
0.8
1.0
Free Surface Receptors (x2)
Once bound phosphorylated receptors (x5)Twice bound phosphorylated receptors (x4)
A B
DC
Time (min)
Con
cent
ratio
n (p
M)
Fig. 8
Insulin Stimulation
Insulin Removed
Insulin Stimulation
Insulin Removed
Insulin Stimulation
Insulin Removed
Insulin Stimulation
Insulin Removed

Fig. 9
0 10 20 30 40 50 600
10
20
30
40
Surface GLUT4 (x21)
0123456
PI(3,4,5)P3 (x13)PI(3,4)P2 (x15)
0123456
Activated PI 3-kinase (x12)
0 10 20 30 40 50 600
6
12
18Activated PKC-ζ (x19)
A B
DC
Time (min)
Con
cent
ratio
n (fM
)Pe
rcen
tage
PercentagePercentage
Insulin Stimulation
Insulin Removed
Insulin Stimulation
Insulin Removed
Insulin Stimulation
Insulin Removed
Insulin Stimulation
Insulin Removed

Fig. 10
A B
DC0
20
40
60
80
100(x3 + x4 + x5) without feedback(x3 + x4 + x5) with feedbackExperimental data
(x4 + x5) without feedback(x4 + x5) with feedbackExperimental data
10-12 10-10 10-8 10-60
20
40
60
80
100(x12) without feedback(x12) with feedbackExperimental data
10-12 10-10 10-8 10-6
(x21) without feedback(x21) with feedbackExperimental data
Insulin (M)
Perc
enta
ge R
espo
nse

0 5 10 15Time (min)
0
25
50
75
100
P
KC-ζ
Act
ivity
(per
cent
of m
axim
al re
spon
se)
(x19) without feedback(x19) with feedbackExperimental data
Fig. 11

0
10
20
30
40 PTP = 1PTP = 1.5Insulin = 10-7 M, 15 min
0
10
20
30
40PTP = 1PTP = 1.5Insulin = 10-9 M, 15 min
0 10 20 30 40 50 600
10
20
30
40PTP = 1PTP = 1.5Insulin = 10-10 M, 15 min
A
B
C
Time (min)
Cel
l Sur
face
GLU
T4
(per
cent
age)
Fig. 12
Copyright © 2022 FDOKUMEN