Increasing Silver Nanowire Network Stability through Small ...
Upload
independentCategory
view
0download
0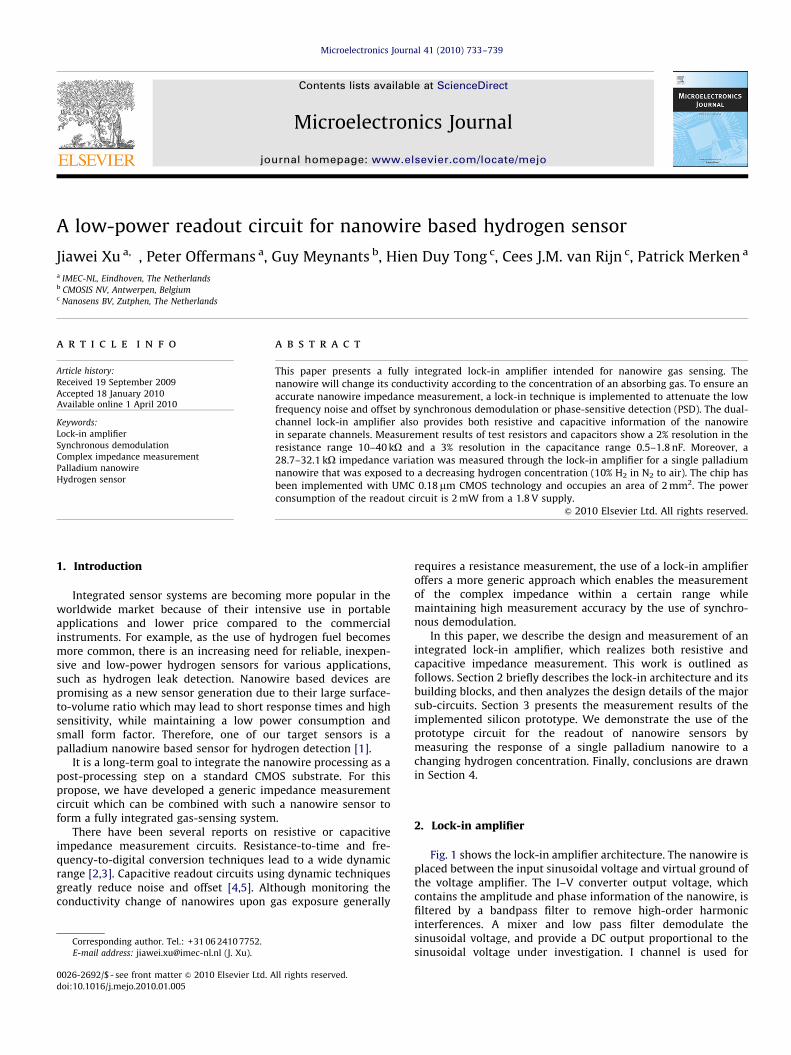
Microelectronics Journal 41 (2010) 733–739
Contents lists available at ScienceDirect
Microelectronics Journal
0026-26
doi:10.1
� Corr
E-m
journal homepage: www.elsevier.com/locate/mejo
A low-power readout circuit for nanowire based hydrogen sensor
Jiawei Xu a,�, Peter Offermans a, Guy Meynants b, Hien Duy Tong c, Cees J.M. van Rijn c, Patrick Merken a
a IMEC-NL, Eindhoven, The Netherlandsb CMOSIS NV, Antwerpen, Belgiumc Nanosens BV, Zutphen, The Netherlands
a r t i c l e i n f o
Article history:
Received 19 September 2009
Accepted 18 January 2010Available online 1 April 2010
Keywords:
Lock-in amplifier
Synchronous demodulation
Complex impedance measurement
Palladium nanowire
Hydrogen sensor
92/$ - see front matter & 2010 Elsevier Ltd. A
016/j.mejo.2010.01.005
esponding author. Tel.: +31 06 2410 7752.
ail address: [email protected] (J. Xu).
a b s t r a c t
This paper presents a fully integrated lock-in amplifier intended for nanowire gas sensing. The
nanowire will change its conductivity according to the concentration of an absorbing gas. To ensure an
accurate nanowire impedance measurement, a lock-in technique is implemented to attenuate the low
frequency noise and offset by synchronous demodulation or phase-sensitive detection (PSD). The dual-
channel lock-in amplifier also provides both resistive and capacitive information of the nanowire
in separate channels. Measurement results of test resistors and capacitors show a 2% resolution in the
resistance range 10–40 kO and a 3% resolution in the capacitance range 0.5–1.8 nF. Moreover, a
28.7–32.1 kO impedance variation was measured through the lock-in amplifier for a single palladium
nanowire that was exposed to a decreasing hydrogen concentration (10% H2 in N2 to air). The chip has
been implemented with UMC 0.18mm CMOS technology and occupies an area of 2 mm2. The power
consumption of the readout circuit is 2 mW from a 1.8 V supply.
& 2010 Elsevier Ltd. All rights reserved.
1. Introduction
Integrated sensor systems are becoming more popular in theworldwide market because of their intensive use in portableapplications and lower price compared to the commercialinstruments. For example, as the use of hydrogen fuel becomesmore common, there is an increasing need for reliable, inexpen-sive and low-power hydrogen sensors for various applications,such as hydrogen leak detection. Nanowire based devices arepromising as a new sensor generation due to their large surface-to-volume ratio which may lead to short response times and highsensitivity, while maintaining a low power consumption andsmall form factor. Therefore, one of our target sensors is apalladium nanowire based sensor for hydrogen detection [1].
It is a long-term goal to integrate the nanowire processing as apost-processing step on a standard CMOS substrate. For thispropose, we have developed a generic impedance measurementcircuit which can be combined with such a nanowire sensor toform a fully integrated gas-sensing system.
There have been several reports on resistive or capacitiveimpedance measurement circuits. Resistance-to-time and fre-quency-to-digital conversion techniques lead to a wide dynamicrange [2,3]. Capacitive readout circuits using dynamic techniquesgreatly reduce noise and offset [4,5]. Although monitoring theconductivity change of nanowires upon gas exposure generally
ll rights reserved.
requires a resistance measurement, the use of a lock-in amplifieroffers a more generic approach which enables the measurementof the complex impedance within a certain range whilemaintaining high measurement accuracy by the use of synchro-nous demodulation.
In this paper, we describe the design and measurement of anintegrated lock-in amplifier, which realizes both resistive andcapacitive impedance measurement. This work is outlined asfollows. Section 2 briefly describes the lock-in architecture and itsbuilding blocks, and then analyzes the design details of the majorsub-circuits. Section 3 presents the measurement results of theimplemented silicon prototype. We demonstrate the use of theprototype circuit for the readout of nanowire sensors bymeasuring the response of a single palladium nanowire to achanging hydrogen concentration. Finally, conclusions are drawnin Section 4.
2. Lock-in amplifier
Fig. 1 shows the lock-in amplifier architecture. The nanowire isplaced between the input sinusoidal voltage and virtual ground ofthe voltage amplifier. The I–V converter output voltage, whichcontains the amplitude and phase information of the nanowire, isfiltered by a bandpass filter to remove high-order harmonicinterferences. A mixer and low pass filter demodulate thesinusoidal voltage, and provide a DC output proportional to thesinusoidal voltage under investigation. I channel is used for

Fig. 1. Block diagram of the lock-in amplifier.
Fig. 2. Folded-cascade two-stage opamp.
J. Xu et al. / Microelectronics Journal 41 (2010) 733–739734
nanowire resistance demodulation; Q channel with 901 phaseshift is used for nanowire capacitance demodulation.
Fig. 1 also compares the spectrum of sinusoidal signal, noiseand offset before and after modulation. Noise and offset errors,which are not synchronized to the reference, are clearly rejectedafter modulation.
2.1. I–V converter
An input sinusoidal reference signal is applied to the nanowire,or the variable resistor/capacitor under test. The current flowingthrough the nanowire also passes through the feedback resistor Rf.The potential at the negative input of the amplifier is maintainedat ‘‘virtual ground’’, i.e. the reference voltage level. Ideally,without any phase shift of the operational amplifier, the voltageacross Rf is proportional to the current flowing through thenanowire. Thus, the phase and amplitude of the output voltageVout contain the information of the nanowire’s complex impe-dance. This voltage is related to the feedback resistor Rf and the
input voltage from the oscillator Vosc
Vout ¼Rf
ZnanowireVosc
Rf is selected based on the impedance range of the nanowire andthe oscillator output. Generally, the palladium nanowire impe-dance is in the range from a few kO to tens of kO, and the tunableoscillator output from a few mV to hundreds of mV. The possiblevalue of the feedback resistor Rf is therefore quite broad. However,considering the input dynamic range limitation of the bandpassfilter (BPF) at the next stage (few hundreds of mV), the chip areafor implementing the resistor (110–350Oper square); and thelow power consumption requirement for opamp (in mW rangewhen active), we selected the feedback resistor Rf¼10 kO.
The operational amplifier should be designed with highenough gain and bandwidth to achieve an accurate closed-loopgain. A two-stage folded-cascade opamp [6,9] has been imple-mented as depicted in Fig. 2. The �3 dB bandwidth is around100 kHz, and the low frequency gain is over 70 dB.

J. Xu et al. / Microelectronics Journal 41 (2010) 733–739 735
2.2. Bandpass filter (BPF)
The bandpass filter removes much of the unwanted signalswhile passing the signal which contains the impedance informa-tion. A tunable bandpass filter is necessary for impedancemeasurement at different frequencies when capacitive measure-ment is performed. For this reason, the central frequency shouldhave a large tuning range, and the Q factor should be high enoughto filter out unwanted signals and noise. A switched-capacitortechnique is selected because of its good tuning ability. However,the accuracy of the frequency response of switched-capacitorfilters depends on the accuracy of the sampling frequency, thecapacitor matching and finite opamp dc gain.
A biquad bandpass filter in Fig. 3 [10] is simulated withresistors to check the frequency response. The circuit transferfunction H(s) shows that the filter has a second-order bandpassresponse with two poles and a zero at the center frequency
HðsÞ ¼Vout
Vin¼
�RiRf Cis�Rf
RiR2f C2
f s2þRiRf CgsþRi
Fig. 3. Biquad bandpass filter schematic.
Fig. 4. Switched-capaci
The center frequency and 3-dB bandwidth are given by
f0 ¼1
2pRf Cf
BW�3 dB ¼Cg
Rf C2f
The central frequency f0 can be tuned by varying Rf and/or Cf. Rf
is implemented with an equivalent switched-capacitor circuit, sothat f0 can be tuned by varying the sampling clock frequency.Simulation results show that, when Rf is swept from 5 to 50 MO,the central frequency f0 varies from 10 to 100 kHz, which fullycovers the measuring frequencies. The gain of the bandpass filteris fixed by the ratio of the feedback capacitors, and it isindependent of central frequency tuning
Gc ¼Ci
Cg
The switched-capacitor implementation of the BPF is shown inFig. 4. An extra feedback path is introduced to reduce opampinput offset [7].
2.3. Mixer
The mixer is a linear multiplier whose output is the product oftwo sinusoidal inputs VRF and VLO. There are two components inthe synchronous mixer output: a double frequency componentand a phase-sensitive DC term. A double-balanced mixer (Gilbertmultiplier) is often used in RF applications due to the good LO-IFfeed-through characteristics. However, the voltage gain of Gilbertcell is input dependent. The mixer in this lock-in amplifier, incontrast, requires more flexibility in the sense that both VRF andVLO are desired to be the gain independent inputs.
Therefore, we propose an alternative mixer circuit topology.The principle is shown in Fig. 5. The mixer is composed of athermometer code generator, followed with control switches andan analog adder. The thermometer code generator digitizes VRF, ina similar way as the input stage of a flash ADC. The resulting
tor bandpass filter.

Fig. 5. Mixer schematic.
Fig. 6. Thermometer code generator unit using capacitor divider network.
Fig. 7. 2nd order low pass filter.
Fig. 8. Switched-capaci
J. Xu et al. / Microelectronics Journal 41 (2010) 733–739736
thermometer code controls the switches and modulates the localoscillator signal. Finally, the summation of all modulated signalsrealizes the frequency multiplication function. This type of mixerhas a fixed gain, which only depends on the capacitor ratio. Thetransfer function of the analog mixer can be written as follows:
VoutðtÞ ¼ intVRFðtÞ�1
VH�VL2N
� �C1
C2VLOðtÞ
where the int[] function indicates that the total number of 1’sgenerated in the thermometer code. From this transfer functionwe can derive the relationship between the resolution N and themaximum voltage dynamic range VH–VL. VH–VL is limited by themaximum input voltage dynamic range. The larger N, the smallerthe least significant bit (LSB) and the higher the resolution of theA/D conversion. This results in a lower harmonic content of thesignal at the mixer output, which also reduce the requirements onLPF in the next stage However, the larger N, the higher the powerconsumption, which is proportional to 2N.
Traditional thermometer code generators, which use a resistorladder to make the reference voltage, are power consuming, andare limited in accuracy by resistor mismatch. A replacementcircuit using a capacitive divider network is more power efficient,and achieves better matching accuracy. As shown in Fig. 6, twophases are used for calibration and capacitive division respecti-vely [7,13]. During the phase 1, the capacitors C1 and C2 areconnected in series and form a close loop, the offset of the opampare stored in both capacitors. During the phase 2, the offset iscancelled, and the input RF signal is compared with a capacitivedivided reference level
Vref ,n ¼C1,nVH�C2,nVL
C1,n�C2,n
Each comparator generates one bit of the thermometer code. Ifwe simply copy the unit shown in Fig. 6 with different C1/C2, ahigh resolution thermometer code generator can be obtained. Forour lock-in amplifier, a 5-bit resolution mixer with 32 units wasimplemented.
2.4. Low pass filter (LPF)
The DC output voltage of the mixer, which contains theamplitude information of the resistive or the capacitive part of thenanowire impedance, is separated from higher-order harmoniccomponents by passing the output through a second-order lowpass filter in Fig. 7
HðsÞ ¼Vout
Vin¼
R2f
R2i R2
f C2f s2þ2RiRf Cf sþR2
i
tor low pass filter.

J. Xu et al. / Microelectronics Journal 41 (2010) 733–739 737
o0 ¼1
Rf Cf
G¼R2
f
R2i
The switched-capacitor implementation of the LPF is shown inFig. 8. Capacitors Ch and the associated switches are introducedfor offset cancellation [8].
3. Measurement results
The proposed readout circuit implemented with UMC 0.18mmtechnology is shown in Fig. 9. It occupies 2 mm2 area and consumes2 mW from a 1.8 V power supply. Each single measurement takes1 ms, which corresponds to a measurement rate of 1 kHz.
Fig. 10 depicts the measurement testbench including main testPCB, DC source, source generator, Xilinx FPGA and a voltageshifter.
The test PCB consists of test probes, signal connectors andjumper switches on board. Two DC sources provide a powersupply of 1.8 V and the opamp reference voltage of 1.0 V. A sourcegenerator generates an external sinusoid voltage signal and thepulse master clock of 1 MHz. This master clock applied to FPGAinput is able to provide all external sampling and calibrationclocks at FPGA I/O ports, and it is easy to switch between differenttest modes by selecting proper SPI codes. The voltage level shifter
Fig. 9. Die photograph of the readout chip for impedance measurement.
Fig. 10. Measurement se
PCB consists of series of variable resistors to convert Xilinx FPGAoutput from 1.5 to 1.8 V.
Measurement results (with resistor and capacitor under test)are shown in Figs. 11 and 12. Ideally, the output DC voltage islinearly proportional to the conductance 1/R and the capacitanceC, as indicated by the dashed curves. Measurement results showthat for a 10 kO feedback reference resistor, the optimum linearresistance measurement range is from 10 to 40 kO with a 6e–7 S/mV sensitivity. The optimum linear capacitance measurementrange is from 0.5 to 1.8 nF with a 13.3 pF/mV sensitivity. Both theresistor and capacitor measurements show a maximum peak-to-peak noise level of 3 mV, which is equivalent to a 2% and a 3%resolution, respectively. Table 1 shows the specificationscompared with other works. Although the input referred noisedensity of this work is higher, the power consumption has beenreduced dramatically.
We used the prototype circuit to demonstrate the feasibility ofintegrated readout of nanowire sensors by measuring theresponse of a single palladium nanowire to a changing hydrogenconcentration.
Palladium nanowires were fabricated on a silicon wafer withan insulation layer of silicon dioxide by using a technique calleddeposition and etching under angles (DEA) [11]. Each fabricatedchip contains an array of Pd nanowires, which are individuallyaddressable by macro scale platinum two-point contacts. Post-processing these nanowires on an integrated circuit may enablecompact, ultra-low-power and inexpensive hydrogen gas sensor
tup block diagram.
Fig. 11. Resistance measurement result: output DC voltage versus conductance
1/R.

J. Xu et al. / Microelectronics Journal 41 (2010) 733–739738
devices. The Pd nanowires used in this work have a typicaldiameter of about 50–80 nm and lengths of ca. 7mm. A SEM imageof a nanowire is shown in Fig. 13.
The chip containing the nanowires is glued and wire bonded toa standard 24 pins DIL package, which is inserted in a stainlesssteel flow chamber with electrical feed-through. A singlenanowire was connected to the readout circuit. Prior to themeasurement, the chamber was filled with 10% hydrogen innitrogen. Hydrogen is absorbed in palladium by dissociation ofmolecular hydrogen at the surface and diffusion into the bulkwhere it forms a solid solution of Pd/H (a-phase) at low hydrogenpressures, and a hydride (b-phase) at high hydrogen pressures[12], leading to an increase in nanowire impedance.
At the start of the measurement, the chamber was opened,allowing the hydrogen to leak from the chamber, causing thenanowire impedance to decrease in response to the drop inhydrogen concentration, until it was stabilized in air.
Fig. 14 shows the result of a measurement performed with apalladium nanowire. The measured DC voltage variation is around17 mV, which indicates a decrease in the nanowire impedancefrom 32.1 to 28.7 kO. This agrees with a decrease of about 10% ofthe nanowire impedance as expected from previous measure-ments [1]. The peak-to-peak noise level is around 3 mV, whichturns into a resolution of 0.6 kO (2% of the nanowire resistance of30 kO).
Fig. 13. SEM image of a palladium nanowire. The nanowire is indicated by the
arrow.
4. Conclusion
An integrated lock-in amplifier for complex impedancemeasurement has been developed and characterized. The circuit
Fig. 12. Capacitance measurement result: output DC voltage versus capacitance.
Table 1Comparison table with other works.
Specification overview This work
Voltage gain (dB) 0–20
Bandwidth (kHz) 10
Preamplifier input referred noise 190 nV/sqrt(Hz) @ 5 kHz
Supply voltage (V) 1.8
Power 2 mW
was implemented in a 0.18mm CMOS technology. It was shownthat the amplifier can measure a 10–40 kO resistor with2% resolution and a 0.5–1.8 nF capacitance with 3% resolution.We demonstrated the use of the lock-in amplifier for thedetection of the impedance variation of 28.7–32.1 kO for apalladium nanowire in response to a varying hydrogen concen-tration of 10–0%.
Azzolini [14] SR830
0–20 >100
800 102.4
15 nV/sqrt(Hz) @ 30 kHz 6 nV/sqrt(Hz) @ 1 kHz
3.3 –
110 mW 40 W
Fig. 14. Output DC voltage versus time (measurement performed with a
palladium nanowire while gradually changing the gas environment from 10% H2
in N2 to air.)

J. Xu et al. / Microelectronics Journal 41 (2010) 733–739 739
Acknowledgments
The authors gratefully acknowledge the support fromJ. Spreutels and E. Deumens for their help on fabrication of thechip, M. Pertijs, J. Santana and M. Sarkar for their valuablediscussions and suggestions on circuits design.
References
[1] P. Offermans, H.D. Tong, C.J.M. van Rijn, P. Merken, S.H. Brongersma, M.Crego-Calama, Ultra low-power hydrogen sensing with single palladiumnanowires, Applied Physics Letters 94 (2009) 223110.
[2] M. Grassi, P. Malcovati, A. Baschirotto, A 141-dB dynamic range CMOS gas-sensor interface circuit without calibration with 16-bit digital output word,IEEE Journal of Solid-State Circuits 42 (7) (2007) 1543–1554 July.
[3] B. Jayaraman, N. Bhat, High precision 16-bit readout gas sensor interface in0.13mm CMOS,, IEEE International Symposium on Circuits and Systems,ISCAS, 27–30 May (2007) 3071–3074.
[4] Jiangfeng Wu, G.K. Fedder, L.R. Carleyy, A low-noise low-offset chopper-stabilized capacitive-readout amplifier for CMOS MEMS accelerometers,Solid-State Conference, ISSCC 2002, Vol. 1, 3-7 February 2002, pp. 428–478.
[5] N. Yazdi, H. Kulah, K. Najafi, Precision readout circuits for capacitivemicroaccelerometers, in: IEEE Sensors 2004, 24–27 October, 2004, pp. 28–31.
[6] J.H. Huijsing, Operational Amplifiers—Theory and Design, Kluwer AcademicPublishers, 2001, pp. 265–270.
[7] S. Signell, K. Mossberg, Offset-compensation of two-phase switched-capacitor filters, IEEE Transactions on Circuits and Systems 36 (1) (1989)31–41.
[8] W.H. Ki, G.C. Temes, Gain- and offset-compensated switched-capacitor filters,IEEE International Sympoisum on Circuits and Systems 11–14 June 1991, Vol.3, pp. 1561–1564.
[9] R. Hogervorst, J.P. Tero, R.G.H. Eschauzier, J.H. Huijsing, A compact power-efficient 3 V CMOS rail-to-rail input/output operational amplifier for VLSI celllibraries, IEEE Journal of Solid-State Circuits 29 (12) (1994) 1505–1513December.
[10] G. Ng, B. Lai, P. Liu, S.P. Voinigescu, 1 GHz opamp-based bandpass filter, in:Topical Meeting on Silicon Monolithic Integrated Circuits in RF Systems,Digest of Papers. 2006, 18–20 January 2006, pp. 4.
[11] H.D. Tong, S. Chen, W.G. van der Wiel, E.T. Carlen, A. van den Berg, Novel top-down wafer-scale fabrication of single crystal silicon nanowires, Nano Letters9 (3) (2009) 1015–1022.
[12] F.A. Lewis, The Palladium Hydrogen System, Academic Press, New York, 1967.[13] K. Haug, G.C. Temes, K. Martin, Improved offset-compensation for switched-
capacitor circuits, IEEE Interational Symposium Circuits and Systems, ISCAS7–10 May 1984, pp. 1054–1057.
[14] C. Azzolini, A. Magnanini, M. Tonelli, G. Chiorboli, C. Morandi, Integrated lock-in amplifier for contactless interface to magnetically stimulated mechanicalresonators, IEEE International Conference on Design & Technology ofIntegrated Systems in Nanoscale Era, 25–27 March (2008).
Copyright © 2022 FDOKUMEN