Type Curve Analysis Type Curve Analysis Type Curve Analysis Type Curve Analysis
Upload
khangminh22Category
view
2download
0
A Low-complexity Psychometric Curve-fitting Approach for the Objective QualityAssessment of Streamed Game Videos
Sam Van Damme, Maria Torres Vega, Joris Heyse, Femke De Backere and Filip De Turck
IDLab, Department of Information Technology, Ghent University - imec
Abstract
The increasing popularity of video gaming competitions, the so called eSports, has contributed to the rise of a newtype of end-user: the passive game video streaming (GVS) user. This user acts as a passive spectator of the gameplayrather than actively interacting with the content. This content, which is streamed over the Internet, can suffer fromdisturbing network and encoding impairments. Therefore, assessing the user’s perceived quality, i.e. the Quality ofExperience (QoE), in real-time becomes fundamental. For the case of natural video content, several approaches alreadyexist that tackle the client-side real-time QoE evaluation. The intrinsically different expectations of the passive GVS user,however, call for new real-time quality models for these streaming services. Therefore, this paper presents a real-timeReduced-Reference (RR) quality assessment framework based on a low-complexity psychometric curve-fitting approach.The proposed solution selects the most relevant, low-complexity objective feature. Afterwards, the relationship betweenthis feature and the ground-truth quality is modelled based on the psychometric perception of the human visual system(HVS). This approach is validated on a publicly available dataset of streamed game videos and is benchmarked againstboth subjective scores and objective models. As a side contribution, a thorough accuracy analysis of existing ObjectiveVideo Quality Metrics (OVQMs) applied to passive GVS is provided. Furthermore, this analysis has led to interestinginsights on the accuracy of low-complexity client-based metrics as well as to the creation of a new Full-Reference (FR)objective metric for GVS, i.e. the Game Video Streaming Quality Metric (GVSQM).
Keywords: Game video streaming (GVS), Quality of Experience (QoE), predictive modelling, objective qualityassessment, curve-fitting, Game Video Streaming Quality Metric (GVSQM)
1. Introduction
The increasing interest in video gaming competitions(the so-called eSports) has risen the growth of the passivegame video streaming (GVS) community, in which the enduser is only watching the gameplay provided by other play-ers instead of interactively participating [1]. This commu-nity has become so large that game-related live-stream webservices have rapidly gained in popularity [2]. The mostwell-known example of such a platform is Twitch, withover 100.000.000 of unique users on a monthly basis [3].These streaming services involve, however, network andvideo encoding related impairments such as delay, packetloss, jerkiness, frame rate or bitrate [4] that could nega-tively influence the user’s perception of the service, i.e.
Email address: {firstname.lastname}@ugent.be (Sam VanDamme, Maria Torres Vega, Joris Heyse, Femke De Backere andFilip De Turck)
Pre-printed version. Please cite as: S. Van Damme, M. Tor-res Vega, J. Heyse, F. De Backere and F. De Turck, ”A Low-complexity Psychometric Curve-fitting Approach for the ObjectiveQuality Assessment of Streamed Game Videos,” Signal Process-ing: Image Communication, vol. 88, no. 115954, 2020, doi:10.1016/j.image.2020.115954
the Quality of Experience (QoE) [5]. In order for internet-based GVS providers to be competitive with each other,it is thus of great interest to assess the perceived qualityof the end-user in real-time. Based on these observations,multiple parameters, such as capacity and latency, couldbe adapted to maximize the end-user quality within theconstraints of the platform, such that customers can bekept as satisfied as possible [6].
Given the humanly essence of perception, QoE hasbeen traditionally measured by means of subjective ex-periments. During these, human observers score the con-tent, leading to the so-called Mean Opinion Scores (MOS)[7]. Although being very accurate, these subjective testsare most often performed in limited laboratory environ-ments and have high costs in terms of time, money andeffort. In addition, MOS cannot straightforwardly be ap-plied for real-time quality evaluation [7], which is essen-tial for the real-time assessment in online streaming en-vironments. Although continuous subjective evaluationmethods exist (i.e. Single Stimulus Continuous QualityEvaluation (SSCQE), Double Stimulus Continuous Qual-ity Evaluation (DSCQE)...)[8], these methods tend to betoo intrusive for the end-user. As a matter of fact, theyrequire the adaptation of a slider (or similar) for the real-
1

time indication of the perceived image quality. Especiallyin the case of interactive gaming, this is a problem as itprohibits the user to interact naturally with the game athand. Even in the passive case, however, continuous evalu-ation methods distract the user from fully focusing on theprovided gameplay. As such, subjective evaluations arenot well suited for real-time quality assessment, which isan important condition in order to maximize the perceivedquality of the end-user.
Alternatively, Objective Video Quality Metrics(OVQMs) are often used to model the quality of naturalvideos. These metrics aim at mathematically describingthe subjective, human perception of visual quality byend-users as closely as possible. This is done based onnumeric, visual characteristics of the received contentas well as objective system factors, e.g. related to thenetwork. According to their requirements, three typesof models can be distinguished: Full-Reference (FR),Reduced-Reference (RR) and No-Reference (NR)-models[5, 9]. FR-models calculate a quality metric by means ofa mathematical comparison between the original and thedistorted video. These approaches are however impracti-cal in client-server based scenarios, as simultaneous accessof both the original and distorted content is required [5].The former is inaccessible at the client-side, however, dueto the inevitable distortions that come with compressionand network transmission. NR-models, on the otherhand, attempt to estimate the quality of the contentonly based on the distorted video, at the cost of lowercorrelation with subjective scores but ruling out theproblem of simultaneous access [5]. RR-metrics hold themiddle between both as the original, undistorted contentis compressed by calculating a number of features (i.e.low-complexity NR measurements) which can be sentover a side-channel to the client (using a limited part ofthe available bandwidth). This allows comparison withthe distorted content to make a quality estimation [5].Their correlation with MOS is usually better than theirNR counterparts, but still significantly lower than FRsolutions.
To provide a solution to the conflicting requirementsof accuracy and computational complexity, either subjec-tive scores or objective FR metrics are typically predictedfrom both encoding and/or network-related NR/RR met-rics in order to make real-time quality estimations [5, 10–12]. Most of these approaches are applied to the case ofnatural videos, i.e. non-synthetic videos with real-life con-tent, real actors etc. [13], often resulting in rather complexand computationally expensive relationships between theinput features, i.e. the Quality of Service (QoS), and QoE[10, 11, 14, 15]. However, the expectations of passive GVSare intrinsically different (e.g., more attention to movingobjects, different perception of synthetic content, highersensibility to fluidity...). As a result, it is important to un-derstand whether the modelling approaches and accuracylevels of objective metrics for natural videos still hold forthe passive GVS case. If this is the case, it is of great
interest to investigate whether the typical characteristicsof game video content can be exploited to obtain morestraightforward, computationally friendly quality assess-ment methods than the often complex models applied fornatural videos. If this is not possible, a need arises foralternative models focusing on the passive GVS end-user.
The goal of this work is therefore to provide an end-to-end solution for the real-time objective quality assessmentof passive GVS. This solution consists of a RR frameworkbased on a psychometric curve-fitting approach runningon low-complexity, client-based objective metrics. As themost relevant metric will heavily depend on the video type[16–18], the presented end-to-end model includes a server-based pre-processing method. In this method, the bestsuited low-complexity metric (in terms of accuracy) is se-lected for each GVS sequence type being offered. In thispaper, the working principles of this approach are pre-sented. To illustrate its performance, the approach is ap-plied to the Gaming VideoSET [19], a large dataset in-cluding subjectively scored sequences of passive GVS. Toprovide the accuracy analysis (the server-based method),19 NR/RR features are selected, both on the pixel and bit-stream level. In addition, 4 objective FR metrics are alsoput to the test with regard to the evaluation of their accu-racy to subjective perception. As an output to the analy-sis, a game classifier is proposed and a customized FR met-ric for GVS, i.e. the Game Video Streaming Quality Met-ric (GVSQM), is created. Finally, the psychometric curvefitting approach is created and evaluated by benchmarkingit (i.e. comparing to a certain subjective or objective FRground truth) against both objective state-of-the-art FRmetrics and subjective MOS. Furthermore, its accuracy iscompared to two Machine Learning (ML) approaches of-ten applied to natural videos: Decision Regression Trees(DRTs) and Artificial Neural Networks (ANNs).
The remainder of this paper is organized as follows. InSection 2, the related work within the field of predictiveQoE modelling for GVS is presented and the shortcom-ings of the existing approaches are addressed. Section 3provides a high-level overview of the theoretical approachfollowed. Next, a description of the used dataset is pro-vided in Section 4. Section 5 highlights the most importantresults of the correlation analysis on a set of objective met-rics often used for natural video quality estimation. Theresulting game classifier as well as a customized, objectiveFR metric (GVSQM) are discussed as well. In Section 6,the proposed psychometric curve-fitting approach is fur-ther explained and evaluated and a comparison with othermodelling approaches often applied in literature is pro-vided. In Section 7, a short discussion is given on the prosand cons of the proposed approach in comparison with ex-isting solutions. Section8, at last, provides a summary ofthe most important findings of this work, together with afew future research directions that could prove to be in-teresting extensions to the obtained results.
2

Table 1: Overview of the related work. The interaction type (Int.) isindicated with I for interactive and P for passive. Type indicates thenature of the metric presented in the study. None indicates that onlya subjective study was performed, without proposing an objectivemetric. In addition, the considered distortions are indicated.
Authors Int. Type DistortionsClincy et al. [20] I None
• Latency• Packet loss
Huang et al. [21] I None• Bitrate• Framerate• Resolution• Delay
Jarschel et al. [22] I None• Delay• Packet loss
Slivar et al.(2015) [16]
I NR• Bitrate• Framerate
Slivar et al.(2016) [17]
I NR• Bitrate• Framerate
Slivar et al.(2018) [18]
I None• Bitrate• Framerate
Wang et al. [23] I NR• Bitrate• Framerate• Resolution• Compression• Bandwidth lim-
itation• Delay• Jitter• Packet loss
Zadtootaghaj etal. [24]
I FR• Bitrate• Framerate
Barman et al.(2018) [25]
P None Compression
Barman et al.(2018) [26]
P NR Compression
Barman et al.(2019) [27]
P NR Compression
Goring et al. [28] P NR Compression
2. Related work
Only a limited number of studies exists up till nowwithin the research field of visual quality modelling forGVS. An overview of these studies is provided in Table 1.As indicated in the previous Section , a distinction can bemade between interactive and passive GVS.
Clincy et al. [20] present a study on the influence ofnetwork distortions on the client-side QoE in interactiveGVS. The graphical part of the QoE is modelled in termsof packet loss while the interaction is measured in termsof the network latency. Their results show that bothhave a significant impact on QoE, but that the impactof packet loss is higher than the impact of latency. More-over, the user tolerance to network distortions is shown tobe lower for high-paced games such as First-Person Shoot-ers (FPSs) in comparison with slower-paced games such asrole-playing games (RPGs).
Huang et al. [21] perform a correlation analysis on theencoding bitrate, framerate and resolution at the encodinglevel combined with the network delay as a measurementfor the interaction quality in an interactive GVS scenario.Their main conclusion is that resolution has a lower im-pact on the end-user QoE in comparison with the othermeasurements.
Jarschel et al. [22] show that the influence of the gametype is less pronounced for network-related distortions ininteractive GVS. Their correlation analysis shows thatboth network delay and packet loss have an importantimpact on the end-user QoE in terms of MOS, whereasthe game genre and the skill of the particular player seemnegligible.
Slivar et al. [16] attempt to model the visual QoE ofinteractive GVS purely on bitrate and framerate. Thesemetrics are related to MOS using a linear regressionmethod. The results show a heavy dependency on thegame genre, with (rather limited) correlations rangingfrom 0.676 to 0.808 from game to game. In a second study[17], they did an attempt to improve their results by in-cluding a spatio-temporal characterization of the game aswell as additional encoding characteristics. These featureswere related to MOS using a polynomial regression ap-proach, resulting in increased correlations ranging from0.782 to 0.986, but still heavily depending on the type ofgame. In a successive, third study [18], research is per-formed towards the most optimal encoding strategy givena particular game genre and some player-related character-istics, e.g. the experience in playing games of the end user.The resulting correlations with MOS show once again aheavy dependency on the type of game.
Wang et al. [23] propose a piece-wise linear metric forinteractive GVS, based on bitrate, framerate, resolution,the video codec characteristics, available bandwidth, delay,jitter and packet loss. This metric is then polynomiallyfitted to subjective MOS, resulting in a 0.92 correlation.These results are based on a rather limited dataset, how-ever, that consists of only three different games (a RPG, a
3

racing game & a sports game), 2 resolutions, 2 frameratesand 2 delay values combined with a larger set of 8 PacketLoss Ratios (PLRs), ranging from 0 to 8 %.
Zadtootaghaj et al. [24] propose a metric for interac-tive GVS by including Peak Signal-to-Noise Ratio (PSNR)alongside bitrate and framerate in the set of input features.They propose a linear combination of polynomial and ex-ponential expressions, resulting in correlations between0.89 and 0.91 to MOS, depending on the game type. Itshould be remarked, however, that the study has only beenperformed on a dataset consisting of two games (GrandTheft Auto V & Project Cars), 2 bitrates and 4 framer-ates, thus only providing a total of 16 testing conditions.In addition, it has to be noted that the inclusion of PSNRin the feature set makes the model FR by construction,making it unusable in live-streaming scenarios.
On the topic of passive GVS, Barman et al. [25], per-form a correlation analysis of multiple FR metrics (PSNR,Structural Similarity Index (SSIM), Visual Information Fi-delity (VIF) and Video Multimethod Assessment Fusion(VMAF)) to MOS, for videos with different degrees ofcompression. Their results show average correlations of0.70, 0.52, 0.67 and 0.88 respectively. In a second study[26], they present a modelling approach in which a Sup-port Vector Regression (SVR) is used to forge a qualitymetric based on a set of NR-metrics. This set includesfeatures such as blockiness and noise combined with aspatio-temporal characterization of the particular game.The model is trained on sequences annotated with VMAF,which is a FR-metric created by Netflix [29], resulting ina 0.98 correlation. Furthermore, a correlation of 0.89 withMOS is obtained. It should be noted, however, that theVMAF to MOS correlation tends to differ from a high0.97 correlation value to a more limited 0.8 correlation,depending on the encoding characteristics. The encodingbitrate is a factor that has not been researched as the mainfocus lays on the resolution. Therefore, one might ques-tion how representative the end-user quality assessment ofthe first study [25] is towards scenarios with heavy com-pression. Furthermore, it highlights the need for a morestable FR-metric tailored to the specific context of GVS.In a third, subsequent study [27], they present two qual-ity predicting models for passive GVS, i.e. No-ReferenceGaming Video Streaming Quality Index (NR-GVSQI) andNo-Reference Gaming Video Streaming Quality Estimator(NR-GVSQE). The NR-GVSQI model is based on an ANNand is used to predict subjective MOS scores. It takes aset of 15 NR features as an input, covering bitrate, resolu-tion, Spatial Information (SI), Temporal Information (TI)and a variety of both spatial and temporal distortion met-rics. Their model is evaluated on two separate datasetsand shows correlations of 0.87 and 0.89 to MOS. The NR-GVSQE model uses a SVR to predict objective FR VMAFscores. A similar set of features is taken as the input. Theresults show correlations up to 0.97 to VMAF and 0.91 to
MOS.
Goring et al. [28], at last, present a NR approachfor passive GVS, based on a set of features includ-ing the Fast Fourier Transform (FFT), SI, TI, blocki-ness, blockmotion, staticness, temporal features based oncuboid slices, Natural Image Quality Evaluator (NIQE)and Blind/Referenceless Image Spatial Quality Evaluator(BRISQUE). These features are fed to a temporal poolingentity based on mean and standard deviation calculations.The resulting values are used as input to a Random Forest(RF) benchmarked with VMAF to build the actual model.Their results show correlation values up to 0.96 to VMAFand 0.91 to subjective MOS as evaluated on the publiclyavailable dataset of Barman et al. [19].
As can be concluded from the above overview, theamount of related work within the topic of GVS quality as-sessment is rather limited. In addition, the majority of thepresented studies tends to research end-user perception ininteractive rather than passive GVS. Visual satisfaction isan important part of the user’s QoE in interactive scenar-ios, along with delay. Therefore, it gives important indica-tions for the visual perception of its passive counterpart.However, due to the fundamental differences between bothscenarios, both perceptions cannot just be equated. Asthe user acts as a spectator rather than a player in passiveGVS, it can be assumed that he/she keeps a more generaloverview of the received content in comparison with theactive user. The latter probably focuses more on certainaspects within the content of the stream, such as his/herpersonal avatar. Therefore, it is useful to investigate howthis perception changes for the passive case of GVS.
A second, important conclusion is that no objective, FR-metric seems to exist that is known to provide satisfyingresults towards the assessment of end-user perception ofGVS. Instead, objective metrics constructed for the natu-ral video case are often applied for game-related, syntheticcontent despite their varying performance for this partic-ular case.
Furthermore, it has to be pointed out that a significantpart of the studies that try to relate the computation-ally less expensive NR/RR-metrics to an objective or sub-jective benchmark, are almost all focusing on bitstream-based methods. In addition, these studies show either lim-ited performance or high performance on limited datasets.Furthermore, the role of the human visual system (HVS)characteristics within the end-user perception is rarely in-vestigated.
At last, it has to be emphasized that most studies claimthat the type of game under scrutiny plays an importantrole in the end-user perception of the content as well as theobjective modelling of these subjective scores. In what waythis game-type should be defined and incorporated withinthe modelling approach is an open research question, how-ever.
Therefore, this work researches the establishment of an
4

Figure 1: Schematic illustration of the presented end-to-end solution.
end-to-end solution for the real-time quality assessment ofstreamed game videos. To this end, a low-complexity psy-chometric curve-fitting approach (incorporating the char-acteristics of the HVS) is proposed that is based on a setof NR and RR features. These features include both pixeland bitstream-based NR and RR metrics. The best suitedmetric for the fit is selected based on a low-complexitygame classifier. Afterwards, the obtained model’s perfor-mance is benchmarked against a customized, FR GVS-metric.
3. A psychometric curve-fitting approach for qual-ity assessment of passive GVS
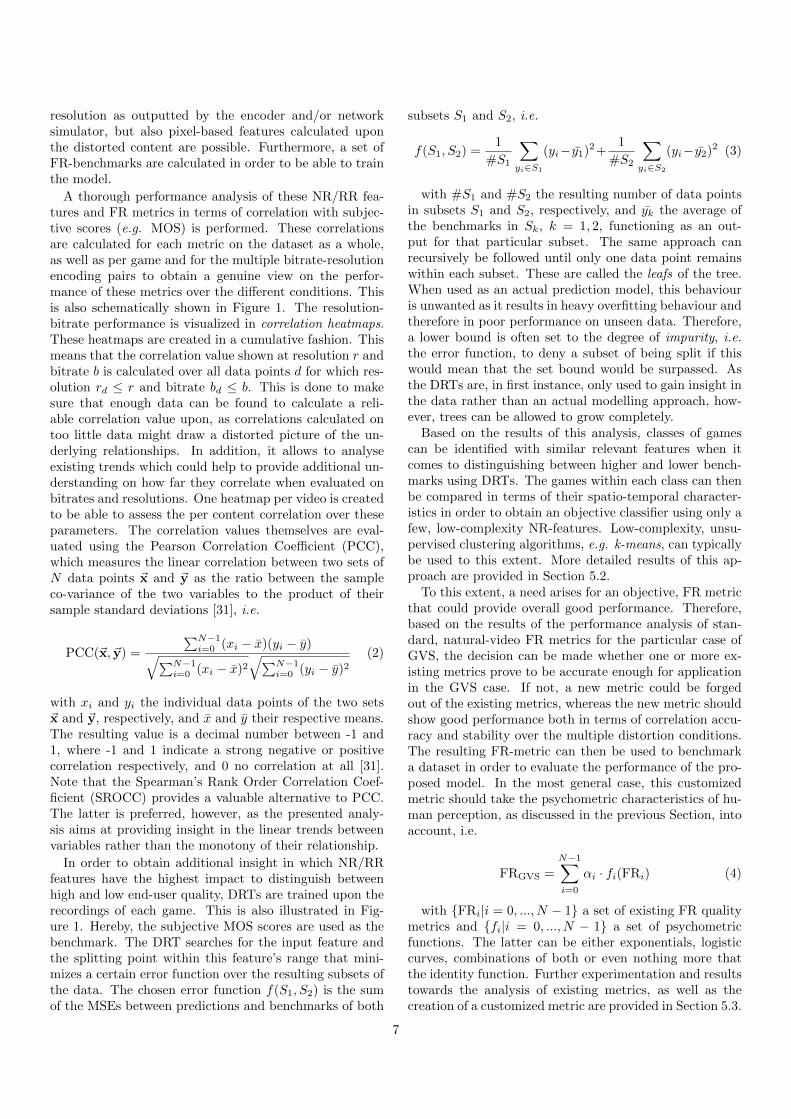
Figure 1 presents an overview of the theoretical end-to-end solution. As can be seen, the live game video se-quences, which are also recorded and stored in a databaseon the server side, are encoded to a game video streamwhich is sent by the Game Video Server over the networkto the Game Video Client. As a result of this transmis-sion, visual impairments occur that could negatively influ-ence the end-user’s perceived quality. In order to modelthis quality degradation, an offline Server-side analysisof the stored game video content is performed to estab-lish an appropriate curve-fitting model. To this end, theimpairments resulting from a multitude of encoding andnetwork circumstances are simulated by means of an En-coder & Network simulator. Upon the resulting, impairedvideo sequences, a multitude of computationally efficientreal-time NR/RR features is calculated alongside a set ofmore complex FR metrics. Both are subjected to a per-formance evaluation, including analysis towards correla-
tion and DRT feature weights. Based on the results ofthis analysis, a game classification method can be derivedusing a limited amount of NR-features. Afterwards, themost suiting NR/RR feature for curve-fitting is selectedbased on the resulting class. A psychometric curve canthan be fitted through this particular feature against aquality benchmark chosen based upon the performance ofthe FR-metrics. The particular feature x along with theresulting, fitted curve Q(x) is then sent to the client-sidewhere it can be used for real-time quality assessment. Thisis done by recalculating x on a regular base upon the re-ceived live-stream after which Q(x) can be evaluated in theresulting value to obtain an estimation of the client-sideperceived quality.
The remainder of this Section provides an in-depth de-scription of the working principles of both the online client-based quality assessment method and the offline server-side pre-processing methodology.
3.1. Real-time model assessment
Figure 2 shows the typical, general relationship betweena certain impairment and the end-user’s perception. Threemajor areas can be distinguished [30]:
• Area 1 (Constant perception): The occurring degreeof impairment is low enough, such that a slight in-crease or decrease of this particular impairment haslittle to no effect on the perceived quality [30].
• Area 2 (Decreasing perception): The degree of im-pairment grows above a certain threshold x1 afterwhich the perceived end-user quality tends to decreaserather fast [30].
5

Figure 2: Typical, general relationship between the degree of impair-ment and the perceived quality in a multimedia service[30].
• Area 3 (Unacceptable quality): : After the degree ofimpairment exceeds a certain threshold x2, the qualityexperienced by the user becomes so low that the userconsiders it as being unacceptable and decides to leavethe system [30].
Due to this typical, psychometric impairment-qualityrelationship, sigmoidal curves are often applied to thesekinds of curve-fitting approaches. This is because of theirasymptotic behaviour in the neighbourhood of either veryhigh or very low values of the variable under scrutiny, andtheir fast decreasing/increasing characteristic for mediumvalues of the selected feature. Alternatives include expo-nential functions, whereas the values are clipped at theminimum and maximum quality value that can be ob-tained, or even a straightforward linear fit in some cases.
Equation 1 shows Equations for the sigmoidal (Qs(x)),exponential (Qe(x)) and linear (Ql(x)) functions.
Qs(x) = 1
(1+αs exp(−βsx))1γs
Qe(x) = αe exp(βex)Ql(x) = αlx+ βl
(1)
Hereby, the linear and exponential curve are clipped at0 and 1. Note that the exponent 1
γsin the denominator
of the sigmoid curve has been added to allow to tune thespeed at which the curve is increasing from 0 to 1. Theweights αi, βi and γi, i = l, e, s, are calculated during thecurve-fitting procedure such that the difference betweenthe curve and the training points, e.g. expressed in MeanSquared Error (MSE), is minimized. It can be observedthat these curves provide output values between 0 and 1by definition, according to the normalized benchmarks. Asa result, no constant terms are included in the Equations,as all other properties of the curves can be tweaked usingthe already provided parameters.
Heuristics are needed, however, to apply a curve-fitting
0.0 0.1 0.2 0.3 0.4 0.5 0.6Jerkiness
0.0
0.2
0.4
0.6
0.8
1.0
GVSQ
M
FittedEstimatedRecording 1Recording 2
Figure 3: Illustration of the curve shift estimation procedure.
approach in practice. The placement of the curve withinthe impairment-perception plane, for instance, is often de-pending on the dataset, the game type or even the partic-ular sequence as human perception tends to be relative toa certain reference, rather than an absolute value. There-fore, in order to effectively assess the quality of a live gamestream on the client-side, a starting point, i.e. an anchorpoint, of the psychometric curve is needed. To this extent,the following approach is proposed, which is illustrated inFigure 3. If one assumes that the game sequence labeledas Sequence 2 is the current, real-time behaviour of thelive-stream, while Sequence 1 is a recording of the samegame (but a different part of the content) saved within theserver’s database, the former’s psychometric curve can beestimated on the latter’s one. By measuring one or twoseconds of the particular feature on the live-stream andcomparing the feature value with a similar sequence of theparticular game in the server’s database, an estimation canbe made of the shift that should be applied to the fittedcurve (through the server data) to obtain the estimatedcurve of the real-time stream.
Another phenomenon that can occur is a dependencyof the curve on the resolution. This can be easily solved,however, by fitting and sending one curve per supportedresolution. On the client-side, the appropriate curve caneasily be selected based on the resolution of the receivedstream. Specific experimentation and results concerningthe curve-fitting procedure are provided in Section 6.
3.2. Server features accuracy and psychometric classifica-tion
Given the presented curve-fitting approach of the previ-ous Section, the question remains how to select a certainfeature for a particular game to fit a curve through. There-fore, a server-side pre-processing step is taken. On theserver-side of the presented architecture, low-complexityfeatures are calculated on a regular basis upon the fre-quently arriving game recordings within the database.These can be bitstream-based methods such as bitrate and
6
resolution as outputted by the encoder and/or networksimulator, but also pixel-based features calculated uponthe distorted content are possible. Furthermore, a set ofFR-benchmarks are calculated in order to be able to trainthe model.
A thorough performance analysis of these NR/RR fea-tures and FR metrics in terms of correlation with subjec-tive scores (e.g. MOS) is performed. These correlationsare calculated for each metric on the dataset as a whole,as well as per game and for the multiple bitrate-resolutionencoding pairs to obtain a genuine view on the perfor-mance of these metrics over the different conditions. Thisis also schematically shown in Figure 1. The resolution-bitrate performance is visualized in correlation heatmaps.These heatmaps are created in a cumulative fashion. Thismeans that the correlation value shown at resolution r andbitrate b is calculated over all data points d for which res-olution rd ≤ r and bitrate bd ≤ b. This is done to makesure that enough data can be found to calculate a reli-able correlation value upon, as correlations calculated ontoo little data might draw a distorted picture of the un-derlying relationships. In addition, it allows to analyseexisting trends which could help to provide additional un-derstanding on how far they correlate when evaluated onbitrates and resolutions. One heatmap per video is createdto be able to assess the per content correlation over theseparameters. The correlation values themselves are eval-uated using the Pearson Correlation Coefficient (PCC),which measures the linear correlation between two sets ofN data points ~x and ~y as the ratio between the sampleco-variance of the two variables to the product of theirsample standard deviations [31], i.e.
PCC(~x, ~y) =
∑N−1i=0 (xi − x)(yi − y)√∑N−1
i=0 (xi − x)2√∑N−1
i=0 (yi − y)2(2)
with xi and yi the individual data points of the two sets~x and ~y, respectively, and x and y their respective means.The resulting value is a decimal number between -1 and1, where -1 and 1 indicate a strong negative or positivecorrelation respectively, and 0 no correlation at all [31].Note that the Spearman’s Rank Order Correlation Coef-ficient (SROCC) provides a valuable alternative to PCC.The latter is preferred, however, as the presented analy-sis aims at providing insight in the linear trends betweenvariables rather than the monotony of their relationship.
In order to obtain additional insight in which NR/RRfeatures have the highest impact to distinguish betweenhigh and low end-user quality, DRTs are trained upon therecordings of each game. This is also illustrated in Fig-ure 1. Hereby, the subjective MOS scores are used as thebenchmark. The DRT searches for the input feature andthe splitting point within this feature’s range that mini-mizes a certain error function over the resulting subsets ofthe data. The chosen error function f(S1, S2) is the sumof the MSEs between predictions and benchmarks of both
subsets S1 and S2, i.e.
f(S1, S2) =1
#S1
∑yi∈S1
(yi− y1)2+1
#S2
∑yi∈S2
(yi− y2)2 (3)
with #S1 and #S2 the resulting number of data pointsin subsets S1 and S2, respectively, and yk the average ofthe benchmarks in Sk, k = 1, 2, functioning as an out-put for that particular subset. The same approach canrecursively be followed until only one data point remainswithin each subset. These are called the leafs of the tree.When used as an actual prediction model, this behaviouris unwanted as it results in heavy overfitting behaviour andtherefore in poor performance on unseen data. Therefore,a lower bound is often set to the degree of impurity, i.e.the error function, to deny a subset of being split if thiswould mean that the set bound would be surpassed. Asthe DRTs are, in first instance, only used to gain insight inthe data rather than an actual modelling approach, how-ever, trees can be allowed to grow completely.
Based on the results of this analysis, classes of gamescan be identified with similar relevant features when itcomes to distinguishing between higher and lower bench-marks using DRTs. The games within each class can thenbe compared in terms of their spatio-temporal character-istics in order to obtain an objective classifier using only afew, low-complexity NR-features. Low-complexity, unsu-pervised clustering algorithms, e.g. k-means, can typicallybe used to this extent. More detailed results of this ap-proach are provided in Section 5.2.
To this extent, a need arises for an objective, FR metricthat could provide overall good performance. Therefore,based on the results of the performance analysis of stan-dard, natural-video FR metrics for the particular case ofGVS, the decision can be made whether one or more ex-isting metrics prove to be accurate enough for applicationin the GVS case. If not, a new metric could be forgedout of the existing metrics, whereas the new metric shouldshow good performance both in terms of correlation accu-racy and stability over the multiple distortion conditions.The resulting FR-metric can then be used to benchmarka dataset in order to evaluate the performance of the pro-posed model. In the most general case, this customizedmetric should take the psychometric characteristics of hu-man perception, as discussed in the previous Section, intoaccount, i.e.
FRGVS =
N−1∑i=0
αi · fi(FRi) (4)
with {FRi|i = 0, ..., N − 1} a set of existing FR qualitymetrics and {fi|i = 0, ..., N − 1} a set of psychometricfunctions. The latter can be either exponentials, logisticcurves, combinations of both or even nothing more thatthe identity function. Further experimentation and resultstowards the analysis of existing metrics, as well as thecreation of a customized metric are provided in Section 5.3.
7

Table 2: Overview of the Gaming VideoSET characteristics. Thegames and bitrates indicated in bold are provided with MOS [19].
Games Counter Strike: Global Offensive (CSGO),Diablo III (Diablo), Defense of the Ancients2 (DotA2), FIFA 17 (FIFA), H1Z1: JustSurvive (H1Z1), Hearthstone (HS), HeroesOf The Storm (HOTS), League of Legends(LoL), Project Cars (PC), PlayerUnknown’sBattleGround (PUBG), StarCraft2 (SC2), Worldof Warcraft (WoW)
Duration 30 sFrame 30 fpsEncoding CBRMetrics SpEED-QA, PSNR, SSIM, VMAFMOS 90 videos, 5-point ACR scale, single-stimulus
Resolution[Pixels]
& Bitrate[kbps]
• 640x480: 300, 400, 600, 900, 1200, 2000,4000
• 1280x720: 500, 600, 750, 900, 1200, 1600,2000, 2500, 4000
• 1920x1080: 600, 750, 1000, 1200, 1500, 2000,3000, 4000
4. Dataset
The dataset used for the research is the GamingVideoSET [19]. It consists of 24 unimpaired recordingsfrom 12 games (2 recordings per game), spanning differentgame genres [19]. These games are the following:
• Counter Strike: Global Offensive (CSGO): Realis-tic FPS from 2012 in which two teams (terrorists &counter-terrorists) with conflicting goals, such as det-onating/disarming a bomb or capturing/protecting aflag, fight each other [19].
• Diablo III (Diablo): A 2012 fantasy RPG in an iso-metric perspective in which players fight monsters indungeons allowing them to upgrade their chosen char-acter over time [19].
• Defense of the Ancients 2 (DotA2): An online mul-tiplayer game from 2013 in an isometric perspective,taking place in a fantasy battle arena and very pop-ular in eSports competitions. Each player controls asingle avatar from a five-a-side team. Two teams fightone against another in order to destroy the opponentsbase as fast as possible [19].
• FIFA 17 (FIFA): One of the famous realistic soccer-simulating games from Electronic Arts, released in2016. Players can play soccer matches against thebuilt-in Artificial Intelligence (AI) but also againstother players, both offline and online [19].
• H1Z1: Just Survive (H1Z1): Survival game from2015, situated in a realistic, post-apocalyptic settingand third-person view. Goal is to take back controlin a world being overtaken by zombies [19].
• Hearthstone (HS): Spin-off tabletop card game fromthe popular fantasy World of Warcraft (WoW) games,
Table 3: Set of calculated NR/RR features.
Type Name AcronymNR-B Encoding bitrate BR
Encoding resolution RESScene Complexity [32] SCLevel of Motion [32] LOM
NR-P Mean amount of blurriness [33] MBLUVariance of blurriness [33] VBLUMean blur ratio [33] MBLRVariance of the blur ratio [33] VBLRMean amount of noise [33] MNOVariance of noise [33] VNOMean noise ratio [33] MNORVariance of the noise ratio [33] VNORMean blockiness [34] MBLKVariance of blockiness [34] VBLKSpatial Information [35] SITemporal Information [35] TIJerkiness [36] JERVariance of the Motion Intensity [36] VMI
RR SpEED-QA [9] SPEEDQA
Table 4: Set of FR metrics being evaluated.
Name AcronymPeak Signal-to-Noise Ratio PSNRStructural Similarity Index SSIM
Video Quality Metric VQMVideo Multimethod Assessment Fusion VMAF
released in 2014. This title features a turn-based cardgame in a fantasy setting [19].
• Heroes Of The Storm (HOTS): Real-time action strat-egy game from 2015 in an isometric perspective, sit-uated in a fantasy battle arena setting. Similar toDotA2, 2 five-a-side teams try to destroy each other’sbases [19].
• League of Legends (LoL): A fantasy battle-arena gamein an isometric perspective, released in 2009, and sim-ilar to both DotA2 and HOTS. It is very popular ineSports and one of the most played games worldwide.Furthermore, it is intensively watched on passive GVSplatforms such as Twitch [19].
• Project Cars (PC): A very realistic, racing simulatorgame from 2015, offering a wide choice in possiblecars, tracks and camera perspectives [19].
• PlayerUnknown’s BattleGround (PUBG): An onlinemultiplayer battle game from 2017. The game is sit-uated in a first-person realistic setting, with the con-cept consisting of a large group of players (max. 100)being dropped randomly on an island. Goal is to findweapons and equipment in order to eliminate otherplayers. The last one standing wins the game [19].
• StarCraft2 (SC2): Fantasy real-time strategy gamein an omnipresent perspective, released in 2010 andpopular in eSports competitions. Players create bases
8

and units and try to destroy the opponent’s equip-ment [19].
• WoW: A well-known fantasy-style Massive Multi-player Online Role-Playing Game (MMORPG) from2004 in an isometric perspective. Each player createshis own avatar that can evolve over time by complet-ing certain tasks in both competitive and co-operativesettings [19].
For each game, both recordings span a 30-second times-pan and were losslessly captured in 1080p resolution and30fps in RGB-format. Afterwards, they were converted toYUV-format. Out of these 24 recordings, 576 impairedMP4-encoded game video streams were created using 24different bitrate-resolution combinations [19], as shown inTable 2. The encoding is performed at Constant Bit Rate(CBR), which is common behaviour for GVS, becausestreamed gaming videos often have fast alternating peri-ods of high action and rather static gameplay. Variable BitRate (VBR) encoding could therefore result in end-userstall of the stream, which is highly unwanted [37]. In addi-tion, each of these impaired sequences was annotated withthe frequently used FR-metrics PSNR, SSIM and VMAFand an additional RR-metric, being Spatial Efficient En-tropic Differencing for Quality Assessment (SpEED-QA).Moreover, a subset of 90 video streams was annotated withsubjective MOS (indicated in bold in Table 2) [19]. A totalof 25 test subjects, with a median age of 29 and coveringdifferent demographic backgrounds, scored the sequencesin a single-stimulus approach on a 5-point Absolute Cate-gory Rating (ACR) scale [19].
5. Experimental accuracy analysis of OVQMs
This Section investigates the accuracy of objective met-rics for GVS, based on the methodology presented in Sec-tion 3.2. To this extent, the small dataset consisting of90 entries annotated with the ground-truth MOS is used.First, an overview is given of the features and FR qualitymetrics being calculated (Section 5.1). Next, the obtainedresults for the NR/RR features are discussed after whicha game classifier is proposed (Section 5.2). Furthermore,a similar accuracy analysis is performed and discussed forthe FR metrics as well (Section 5.3). Based on these re-sults, a custom, objective metric suited to GVS is con-structed. In Section 5.4, at last, a brief summary of themost important conclusions of this analysis is given.
5.1. NR/RR
Features & FR quality metricsNext to the encoding bitrate, resolution and the SpEED-
QA RR-metric already included in the dataset, an addi-tional set of features is calculated to represent each video.This resulting set of features is presented in Table 3. First,the game video streams are analyzed in terms of theirspatio-temporal information. This is done both on the
pixel-based level (NR-P) in terms of Spatial (SI) and Tem-poral Information (TI) and on the bitstream level (NR-B) based on Scene Complexity (SC) and Level of Motion(LoM) [32]. The last two can be directly obtained from theFFmpeg-client [38]. Furthermore, a set of frame-by-framepixel-based NR-metrics (results of which are considered asfeatures) is calculated upon the distorted streams. Thesemetrics include measurements of motion, blurriness, noise,blockiness and jerkiness. Each of these features, as well asthe pre-calculated FR quality metrics, are normalized tothe [0, 1] interval in order not to favour one metric overanother in distance based methods.
In addition to PSNR, SSIM and VMAF, the Video Qual-ity Metric (VQM) [39] is calculated over each video se-quence using the open-source MATLAB implementationprovided by the Institute for Telecommunication Sciences(ITS) [40]. As VQM is intrinsically a measurement of qual-ity degradation between 0 and 1, each of the videos is anno-tated with 1−VQM to obtain a metric of quality, consistentwith the other FR metrics. For the remainder of this work,every reference to VQM, actually means 1 − VQM. Theresulting set of objective FR metrics is shown in Table 4.
5.2. Evaluation of NR/RR features
In Table 5 the most important results of the correla-tion analysis are given per game and overall for the con-sidered NR/RR-features to MOS. First of all, it is worthmentioning that SpEED-QA shows the strongest overallcorrelation with a PCC of -0.761. It is interesting to see,however, that SpEED-QA shows reasonable results for allgames except HS. Only a value of -0.300 is obtained forthis particular game. On the other side, strong correla-tions can be seen for SI, SC and MNO (0.968, 0.942 and-0.959 respectively), while the performance of these fea-tures is far more limited for the other games. Oppositebehaviour is observed for JER. To further analyze this be-haviour, the bitrate-resolution heatmaps are interpretedas well. In Figure 4, a subset of the NR/RR features withstrong correlation to either one or multiple games is shown.Bitrate-resolution pairs for which no correlation value isgiven indicate that the correlation was calculated over ei-ther 1 (undefined) or 2 (1 by definition) data points. Asa result, bitrates 300 and 500 are not included in the Fig-ure (both only have one data point per game). They are in-cluded in the calculation of the correlation values, though.Both JER and SpEED-QA, for example, show strong neg-ative correlations over all conditions for all games exceptHS. For higher resolutions of HS, correlation is almost non-existing. Remarkably enough, HS even shows positive cor-relation for the lowest 640× 480 resolution. On the otherhand, high and low overall correlations can be noticed forthe SC and MNO features, respectively. These correla-tions are rather stable over the different encoding condi-tions, whereas PCC values of these features are heavilychanging over the multiple bitrates and resolutions for theother games. These observations provide a strong indica-tion that the type of game might be an important factor
9
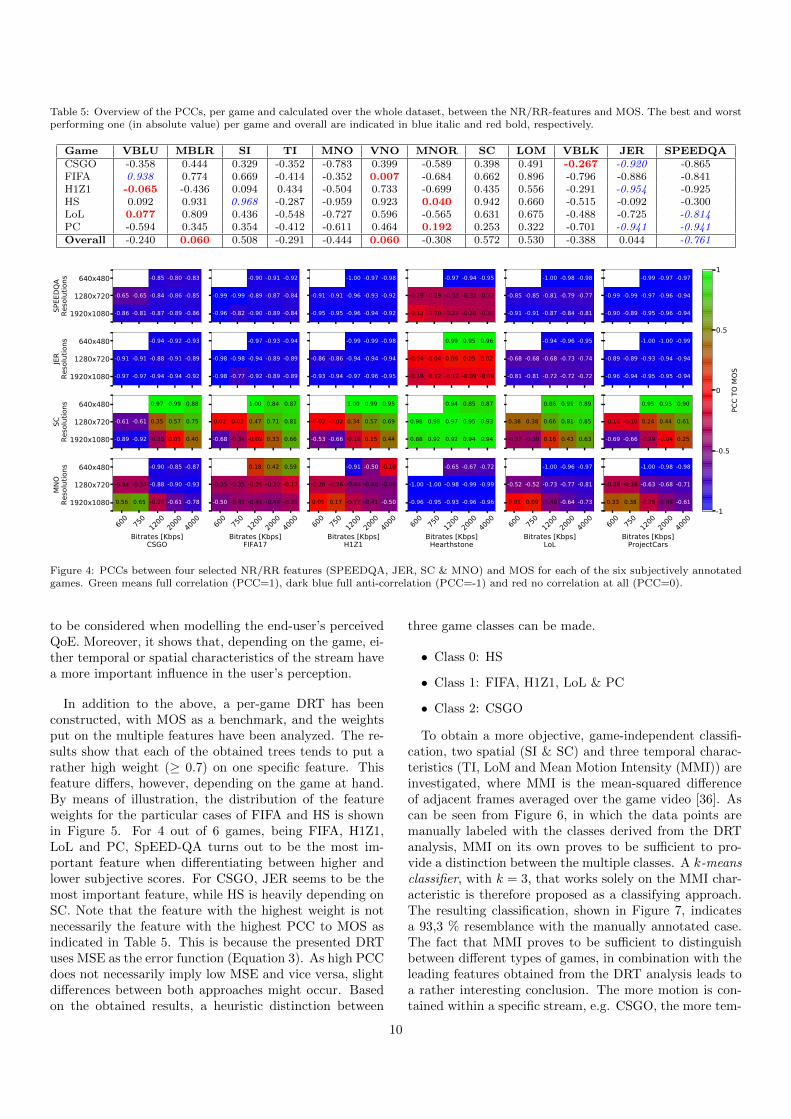
Table 5: Overview of the PCCs, per game and calculated over the whole dataset, between the NR/RR-features and MOS. The best and worstperforming one (in absolute value) per game and overall are indicated in blue italic and red bold, respectively.
Game VBLU MBLR SI TI MNO VNO MNOR SC LOM VBLK JER SPEEDQACSGO -0.358 0.444 0.329 -0.352 -0.783 0.399 -0.589 0.398 0.491 -0.267 -0.920 -0.865FIFA 0.938 0.774 0.669 -0.414 -0.352 0.007 -0.684 0.662 0.896 -0.796 -0.886 -0.841H1Z1 -0.065 -0.436 0.094 0.434 -0.504 0.733 -0.699 0.435 0.556 -0.291 -0.954 -0.925HS 0.092 0.931 0.968 -0.287 -0.959 0.923 0.040 0.942 0.660 -0.515 -0.092 -0.300LoL 0.077 0.809 0.436 -0.548 -0.727 0.596 -0.565 0.631 0.675 -0.488 -0.725 -0.814PC -0.594 0.345 0.354 -0.412 -0.611 0.464 0.192 0.253 0.322 -0.701 -0.941 -0.941Overall -0.240 0.060 0.508 -0.291 -0.444 0.060 -0.308 0.572 0.530 -0.388 0.044 -0.761
640x480
1280x720
1920x1080SPEE
DQA
Reso
lutio
ns -0.85 -0.80 -0.83
-0.65 -0.65 -0.84 -0.86 -0.85
-0.86 -0.81 -0.87 -0.89 -0.86
640x480
1280x720
1920x1080
JER
Reso
lutio
ns -0.94 -0.92 -0.93
-0.91 -0.91 -0.88 -0.91 -0.89
-0.97 -0.97 -0.94 -0.94 -0.92
640x480
1280x720
1920x1080
SCRe
solu
tions 0.97 0.99 0.88
-0.61 -0.61 0.35 0.57 0.75
-0.89 -0.92 -0.35 0.01 0.40
600
750
1200
2000
4000
Bitrates [Kbps]CSGO
640x480
1280x720
1920x1080
MNO
Reso
lutio
ns -0.90 -0.85 -0.87
-0.34 -0.34 -0.88 -0.90 -0.93
0.56 0.65 -0.28 -0.61 -0.78
-0.90 -0.91 -0.92
-0.99 -0.99 -0.89 -0.87 -0.84
-0.96 -0.82 -0.90 -0.89 -0.84
-0.97 -0.93 -0.94
-0.98 -0.98 -0.94 -0.89 -0.89
-0.98 -0.77 -0.92 -0.89 -0.89
1.00 0.84 0.87
0.02 0.02 0.47 0.71 0.81
-0.68 -0.34 -0.02 0.33 0.66
600
750
1200
2000
4000
Bitrates [Kbps]FIFA17
0.18 0.42 0.59
-0.35 -0.35 -0.26 -0.30 -0.17
-0.50 -0.41 -0.41 -0.44 -0.35
-1.00 -0.97 -0.98
-0.91 -0.91 -0.96 -0.93 -0.92
-0.95 -0.95 -0.96 -0.94 -0.92
-0.99 -0.99 -0.98
-0.86 -0.86 -0.94 -0.94 -0.94
-0.93 -0.94 -0.97 -0.96 -0.95
1.00 0.99 0.95
-0.02 -0.02 0.34 0.57 0.69
-0.53 -0.66 -0.18 0.15 0.44
600
750
1200
2000
4000
Bitrates [Kbps]H1Z1
-0.91 -0.50 -0.10
-0.26 -0.26 -0.44 -0.48 -0.49
0.05 0.17 -0.27 -0.41 -0.50
-0.97 -0.94 -0.95
-0.29 -0.29 -0.33 -0.32 -0.32
-0.12 -0.20 -0.27 -0.28 -0.30
0.99 0.95 0.96
-0.04 -0.04 0.06 0.05 0.02
-0.19 -0.12 -0.12 -0.09 -0.09
0.94 0.85 0.87
0.98 0.98 0.97 0.95 0.93
0.88 0.92 0.92 0.94 0.94
600
750
1200
2000
4000
Bitrates [Kbps]Hearthstone
-0.65 -0.67 -0.72
-1.00 -1.00 -0.98 -0.99 -0.99
-0.96 -0.95 -0.93 -0.96 -0.96
-1.00 -0.98 -0.98
-0.85 -0.85 -0.81 -0.79 -0.77
-0.91 -0.91 -0.87 -0.84 -0.81
-0.94 -0.96 -0.95
-0.68 -0.68 -0.68 -0.73 -0.74
-0.81 -0.81 -0.72 -0.72 -0.72
0.86 0.91 0.89
0.38 0.38 0.66 0.81 0.85
-0.37 -0.39 0.16 0.43 0.63
600
750
1200
2000
4000
Bitrates [Kbps]LoL
-1.00 -0.96 -0.97
-0.52 -0.52 -0.73 -0.77 -0.81
0.01 0.09 -0.49 -0.64 -0.73
-0.99 -0.97 -0.97
-0.99 -0.99 -0.97 -0.96 -0.94
-0.90 -0.89 -0.95 -0.96 -0.94
-1.00 -1.00 -0.99
-0.89 -0.89 -0.93 -0.94 -0.94
-0.96 -0.94 -0.95 -0.95 -0.94
0.95 0.95 0.90
-0.10 -0.10 0.24 0.44 0.61
-0.69 -0.66 -0.29 -0.04 0.25
600
750
1200
2000
4000
Bitrates [Kbps]ProjectCars
-1.00 -0.98 -0.98
-0.28 -0.28 -0.63 -0.68 -0.71
0.33 0.38 -0.25 -0.48 -0.61-1
-0.5
0
0.5
1
PCC
TO M
OS
Figure 4: PCCs between four selected NR/RR features (SPEEDQA, JER, SC & MNO) and MOS for each of the six subjectively annotatedgames. Green means full correlation (PCC=1), dark blue full anti-correlation (PCC=-1) and red no correlation at all (PCC=0).
to be considered when modelling the end-user’s perceivedQoE. Moreover, it shows that, depending on the game, ei-ther temporal or spatial characteristics of the stream havea more important influence in the user’s perception.
In addition to the above, a per-game DRT has beenconstructed, with MOS as a benchmark, and the weightsput on the multiple features have been analyzed. The re-sults show that each of the obtained trees tends to put arather high weight (≥ 0.7) on one specific feature. Thisfeature differs, however, depending on the game at hand.By means of illustration, the distribution of the featureweights for the particular cases of FIFA and HS is shownin Figure 5. For 4 out of 6 games, being FIFA, H1Z1,LoL and PC, SpEED-QA turns out to be the most im-portant feature when differentiating between higher andlower subjective scores. For CSGO, JER seems to be themost important feature, while HS is heavily depending onSC. Note that the feature with the highest weight is notnecessarily the feature with the highest PCC to MOS asindicated in Table 5. This is because the presented DRTuses MSE as the error function (Equation 3). As high PCCdoes not necessarily imply low MSE and vice versa, slightdifferences between both approaches might occur. Basedon the obtained results, a heuristic distinction between
three game classes can be made.
• Class 0: HS
• Class 1: FIFA, H1Z1, LoL & PC
• Class 2: CSGO
To obtain a more objective, game-independent classifi-cation, two spatial (SI & SC) and three temporal charac-teristics (TI, LoM and Mean Motion Intensity (MMI)) areinvestigated, where MMI is the mean-squared differenceof adjacent frames averaged over the game video [36]. Ascan be seen from Figure 6, in which the data points aremanually labeled with the classes derived from the DRTanalysis, MMI on its own proves to be sufficient to pro-vide a distinction between the multiple classes. A k-meansclassifier, with k = 3, that works solely on the MMI char-acteristic is therefore proposed as a classifying approach.The resulting classification, shown in Figure 7, indicatesa 93,3 % resemblance with the manually annotated case.The fact that MMI proves to be sufficient to distinguishbetween different types of games, in combination with theleading features obtained from the DRT analysis leads toa rather interesting conclusion. The more motion is con-tained within a specific stream, e.g. CSGO, the more tem-
10

(a) FIFA (Class 1)
SI TI JER
MBL
UVB
LUM
BLR
VBLR
MNO VN
OM
NOR
VNOR
MBL
KVB
LKLO
M SC RES
SPEE
DQA BR
Feature
0.000.050.100.150.200.250.300.350.400.450.500.550.600.650.700.750.800.850.900.951.00
Wei
ght
(b) HS (Class 0)
Figure 5: Illustration of the distribution of the DRT feature weightsfor the particular cases of FIFA and HS
poral artifacts such as jerkiness play a role in the end-user’sQoE. Moreover, the (limited) difference between the man-ual annotation and the k-means classifier indicates thatthe encoding conditions itself also play their role in this.Spatial detail, on the other side, takes the upper hand ingames with little motion, as is the case for HS. SpEED-QAholds the middle between both as it includes both spatialand temporal characteristics, making it the ideal metric forvideo sequences with medium MMI. This is an interestingobservation, as similar approaches for natural videos showfar more complex relationships between NR/RR featuresand end-user QoE, often resulting in black-box, ML-basedmodeling approaches.
Note that the application of k-means throws two addi-tional questions when scaled to real-life applications. Thefirst question to be answered is at which frequency the clus-tering mechanism should be re-trained in order to adaptthe classifier to newly added and/or deleted game video se-
Figure 6: Two-dimensional distribution of the game videos withinthe bitrate-Mean Motion Intensity (MMI) plane. The data pointsare manually labeled with the classes derived from the DRT analysis.Blue is class 0, yellow class 1 and green class 2.
Figure 7: Two-dimensional distribution of the annotated classes ofthe game videos within the bitrate-MMI plane after k-means (k = 3)clustering. The resulting classification shows a 93,3 % resemblancewith the manually annotated case.
quences. This is of course highly dependent on the rate atwhich gaming videos are added/removed from the serverdatabase. As long as the number of videos used as train-ing set for the classifier is high enough relative to the totalamount of videos in the database, no re-iteration of the al-gorithm is needed (as the influence on the cluster centersis assumed to be limited) and the classifier can be used assuch. Once this ratio exceeds a certain threshold, retrain-ing is required. Further experimentation on larger datasetsis needed, however, to derive an exact value for this par-ticular threshold. Next, it should be noted that the useof k-means introduces a dynamic threshold in the classifi-cation procedure. In some cases (e.g. when no low MMIgames such as HS are present) this could lead to misclassi-fication. Given the application of the proposed framework(i.e. streaming of gaming videos rather than actual cloudgaming), however, it is not too far fetched to assume thatthe server database will cover a rather large and varied setof gaming video genres and thus, MMI values.
5.3. Evaluation of FR metrics
A similar analysis is performed for each of the fourFR-metrics, as shown in Table 6. It can be seen thateach of them provides a reasonable overall correlation with
11

640x480
1280x720
1920x1080
PSNR
Reso
lutio
ns 0.93 0.92 0.92
0.28 0.28 0.88 0.91 0.95
0.63 0.58 0.75 0.80 0.88
640x480
1280x720
1920x1080
SSIM
Reso
lutio
ns 0.90 0.88 0.90
0.66 0.66 0.92 0.94 0.95
0.91 0.89 0.90 0.91 0.93
640x480
1280x720
1920x1080
VQM
Reso
lutio
ns 0.95 0.95 0.93
0.80 0.80 0.92 0.95 0.92
0.82 0.82 0.92 0.96 0.94
600
750
1200
2000
4000
Bitrates [Kbps]CSGO
640x480
1280x720
1920x1080
VMAF
Reso
lutio
ns 0.96 0.96 0.93
0.02 0.02 0.84 0.93 0.95
-0.36 -0.53 0.43 0.70 0.85
0.96 0.94 0.95
0.68 0.68 0.85 0.91 0.94
0.59 0.58 0.75 0.87 0.93
0.95 0.94 0.95
0.90 0.90 0.94 0.96 0.97
0.96 0.83 0.89 0.94 0.95
0.98 0.93 0.94
0.99 0.99 0.95 0.90 0.90
0.94 0.79 0.94 0.90 0.89
600
750
1200
2000
4000
Bitrates [Kbps]FIFA17
0.98 0.94 0.95
0.78 0.78 0.93 0.95 0.97
0.32 0.40 0.76 0.88 0.93
1.00 1.00 0.99
0.09 0.09 0.46 0.62 0.70
-0.08 -0.22 0.25 0.43 0.59
1.00 0.99 0.99
0.83 0.83 0.94 0.96 0.97
0.91 0.93 0.93 0.94 0.96
0.98 0.99 0.96
0.90 0.90 0.96 0.97 0.96
0.94 0.95 0.97 0.98 0.96
600
750
1200
2000
4000
Bitrates [Kbps]H1Z1
0.99 0.99 0.98
0.34 0.34 0.71 0.84 0.89
-0.11 -0.30 0.31 0.56 0.72
0.99 0.94 0.95
1.00 1.00 0.99 0.99 0.99
0.99 0.99 0.98 0.94 0.93
0.99 0.94 0.95
0.98 0.98 0.99 0.98 0.98
0.99 0.99 0.99 0.99 0.99
1.00 0.90 0.91
0.22 0.22 0.31 0.37 0.41
0.03 0.11 0.23 0.29 0.37
600
750
1200
2000
4000
Bitrates [Kbps]Hearthstone
0.99 0.93 0.94
0.95 0.95 0.93 0.93 0.93
0.96 0.98 0.97 0.96 0.97
0.96 0.98 0.97
0.60 0.60 0.84 0.89 0.91
0.03 -0.08 0.59 0.73 0.78
0.97 0.98 0.98
0.78 0.78 0.92 0.95 0.96
0.38 0.24 0.76 0.85 0.90
0.92 0.95 0.93
0.94 0.94 0.84 0.86 0.84
0.94 0.94 0.86 0.86 0.84
600
750
1200
2000
4000
Bitrates [Kbps]LoL
0.94 0.96 0.95
0.88 0.88 0.95 0.97 0.96
0.28 0.14 0.76 0.88 0.92
1.00 1.00 0.99
0.50 0.50 0.80 0.83 0.85
0.28 0.18 0.61 0.71 0.78
1.00 0.99 0.99
0.81 0.81 0.94 0.95 0.97
0.86 0.83 0.90 0.93 0.95
0.99 0.99 0.98
0.99 0.99 0.98 0.99 0.98
0.84 0.84 0.94 0.96 0.96
600
750
1200
2000
4000
Bitrates [Kbps]ProjectCars
0.99 1.00 0.99
0.51 0.51 0.83 0.90 0.93
-0.11 -0.20 0.46 0.67 0.79-1
-0.5
0
0.5
1
PCC
TO M
OS
Figure 8: PCCs between the four considered FR metrics (PSNR, SSIM, VQM & VMAF) and MOS for each of the six subjectively annotatedgames. Green means full correlation (PCC=1), dark blue full anti-correlation (PCC=-1) and red no correlation at all (PCC=0).
Table 6: Overview of the PCCs, per game and calculated over thewhole dataset, between the four FR-metrics and MOS. The best andworst performing metric per game and overall are indicated in blueitalic and red bold, respectively.
Game PSNR SSIM VQM VMAFCSGO 0.88 0.934 0.94 0.847FIFA 0.926 0.95 0.89 0.934H1Z1 0.594 0.961 0.965 0.765HS 0.925 0.987 0.368 0.968LoL 0.781 0.901 0.845 0.919PC 0.775 0.953 0.96 0.79Overall 0.741 0.79 0.825 0.864
MOS, with PCCs varying from 0.741 (PSNR) to 0.864(VMAF). Furthermore, it is worth noting that for 3 outof 6 games, VQM tends to provide the best performance,hereby clearly outperforming VMAF for the game at hand.Deviant behaviour can again be observed for the HS game,with only a 0.368 correlation of VQM to MOS while itsVMAF counterpart obtains a high 0.968 PCC. Somewhatsurprisingly, SSIM also shows rather high, per game cor-relations. Sometimes, it is even performing better thanboth VQM and VMAF, as is the case for FIFA and H1Z1.This might be an indication of the fact that the structuralinformation in a video sequence plays a far more impor-tant role towards end-user QoE for synthetic game contentthan is the case for natural videos.
Figure 8 shows the bitrate-resolution correlation resultsfor each of the games. An interesting conclusion is thatVMAF, the metric with the best overall performance, onlytends to show this performance for high bitrates and lowresolutions, while performance is dropping heavily for theopposite case. Again, HS shows to be the exception with
0.0
0.2
0.4
0.6
0.8
1.0
MOS
PSNR SSIM
0.0 0.2 0.4 0.6 0.8 1.00.0
0.2
0.4
0.6
0.8
1.0
MOS
VQM0.0 0.2 0.4 0.6 0.8 1.0
VMAF
CSGOFIFA17H1Z1HearthstoneLoLProjectCars
Figure 9: Scatterplots, showing the relationship between the fourobjective FR metrics and subjective MOS.
rather stable behaviour of the VMAF-metric. VQM, onthe other hand, shows high and stable correlation valuesfor all games except HS. For the latter, VQM shows aheavy drop in performance for higher resolutions. As couldalready be seen from Table 6, SSIM shows somewhat sur-prisingly to be the most stable metric over the encodingconditions, only showing a performance drop worth men-tioning for the lowest bitrates and highest resolution ofLoL.
PCC gives an objective indication on the linear rela-tionship between two variables, but does not provide anindication on over- and underprediction, whatsoever. So,this behaviour is worth analyzing as well. Figure 9 showsscatterplots for each of the four considered FR metrics
12
PSNR SSIM VQM VMAFFR-metric
0.000.010.020.030.040.050.060.070.080.090.10
MSE
(a) Class 0
PSNR SSIM VQM VMAFFR-metric
0.000.010.020.030.040.050.060.070.080.090.10
MSE
(b) Class 1
PSNR SSIM VQM VMAFFR-metric
0.000.010.020.030.040.050.060.070.080.090.10
MSE
(c) Class 2
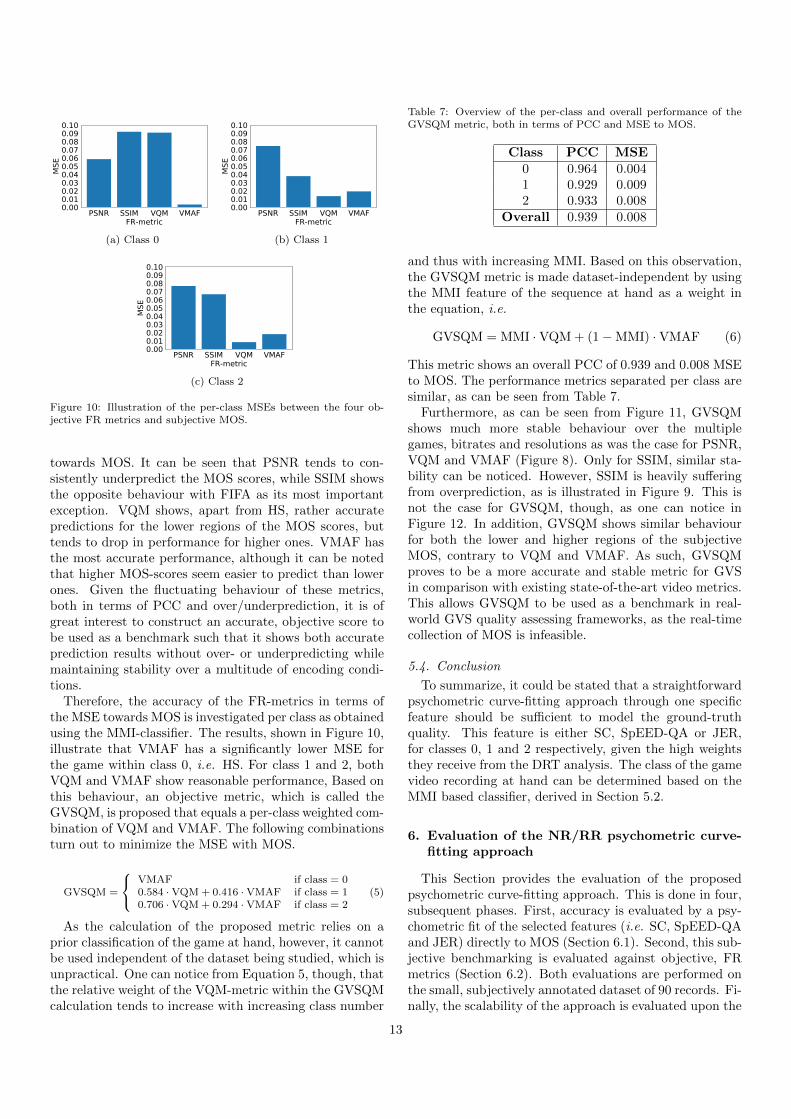
Figure 10: Illustration of the per-class MSEs between the four ob-jective FR metrics and subjective MOS.
towards MOS. It can be seen that PSNR tends to con-sistently underpredict the MOS scores, while SSIM showsthe opposite behaviour with FIFA as its most importantexception. VQM shows, apart from HS, rather accuratepredictions for the lower regions of the MOS scores, buttends to drop in performance for higher ones. VMAF hasthe most accurate performance, although it can be notedthat higher MOS-scores seem easier to predict than lowerones. Given the fluctuating behaviour of these metrics,both in terms of PCC and over/underprediction, it is ofgreat interest to construct an accurate, objective score tobe used as a benchmark such that it shows both accurateprediction results without over- or underpredicting whilemaintaining stability over a multitude of encoding condi-tions.
Therefore, the accuracy of the FR-metrics in terms ofthe MSE towards MOS is investigated per class as obtainedusing the MMI-classifier. The results, shown in Figure 10,illustrate that VMAF has a significantly lower MSE forthe game within class 0, i.e. HS. For class 1 and 2, bothVQM and VMAF show reasonable performance, Based onthis behaviour, an objective metric, which is called theGVSQM, is proposed that equals a per-class weighted com-bination of VQM and VMAF. The following combinationsturn out to minimize the MSE with MOS.
GVSQM =
VMAF if class = 00.584 · VQM + 0.416 · VMAF if class = 10.706 · VQM + 0.294 · VMAF if class = 2
(5)
As the calculation of the proposed metric relies on aprior classification of the game at hand, however, it cannotbe used independent of the dataset being studied, which isunpractical. One can notice from Equation 5, though, thatthe relative weight of the VQM-metric within the GVSQMcalculation tends to increase with increasing class number
Table 7: Overview of the per-class and overall performance of theGVSQM metric, both in terms of PCC and MSE to MOS.
Class PCC MSE0 0.964 0.0041 0.929 0.0092 0.933 0.008
Overall 0.939 0.008
and thus with increasing MMI. Based on this observation,the GVSQM metric is made dataset-independent by usingthe MMI feature of the sequence at hand as a weight inthe equation, i.e.
GVSQM = MMI ·VQM + (1−MMI) ·VMAF (6)
This metric shows an overall PCC of 0.939 and 0.008 MSEto MOS. The performance metrics separated per class aresimilar, as can be seen from Table 7.
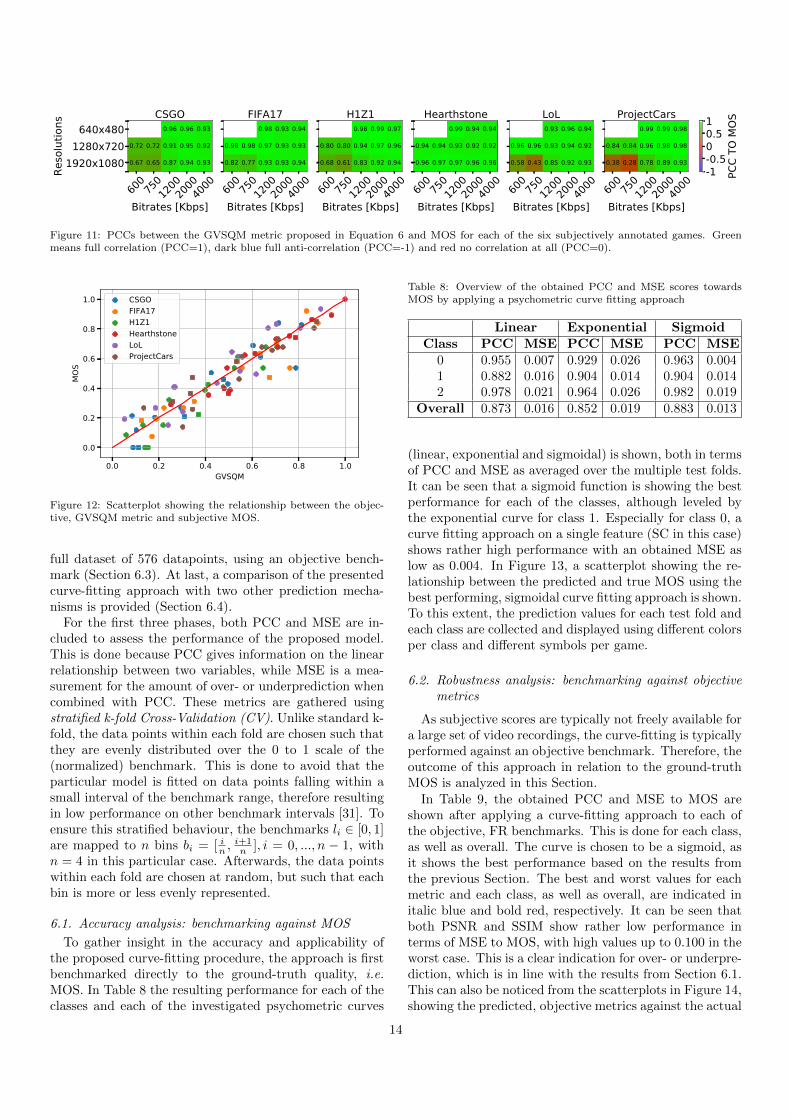
Furthermore, as can be seen from Figure 11, GVSQMshows much more stable behaviour over the multiplegames, bitrates and resolutions as was the case for PSNR,VQM and VMAF (Figure 8). Only for SSIM, similar sta-bility can be noticed. However, SSIM is heavily sufferingfrom overprediction, as is illustrated in Figure 9. This isnot the case for GVSQM, though, as one can notice inFigure 12. In addition, GVSQM shows similar behaviourfor both the lower and higher regions of the subjectiveMOS, contrary to VQM and VMAF. As such, GVSQMproves to be a more accurate and stable metric for GVSin comparison with existing state-of-the-art video metrics.This allows GVSQM to be used as a benchmark in real-world GVS quality assessing frameworks, as the real-timecollection of MOS is infeasible.
5.4. Conclusion
To summarize, it could be stated that a straightforwardpsychometric curve-fitting approach through one specificfeature should be sufficient to model the ground-truthquality. This feature is either SC, SpEED-QA or JER,for classes 0, 1 and 2 respectively, given the high weightsthey receive from the DRT analysis. The class of the gamevideo recording at hand can be determined based on theMMI based classifier, derived in Section 5.2.
6. Evaluation of the NR/RR psychometric curve-fitting approach
This Section provides the evaluation of the proposedpsychometric curve-fitting approach. This is done in four,subsequent phases. First, accuracy is evaluated by a psy-chometric fit of the selected features (i.e. SC, SpEED-QAand JER) directly to MOS (Section 6.1). Second, this sub-jective benchmarking is evaluated against objective, FRmetrics (Section 6.2). Both evaluations are performed onthe small, subjectively annotated dataset of 90 records. Fi-nally, the scalability of the approach is evaluated upon the
13
600
75012
0020
0040
00
Bitrates [Kbps]
640x4801280x720
1920x1080
Reso
lutio
ns 0.96 0.96 0.93
0.72 0.72 0.91 0.95 0.92
0.67 0.65 0.87 0.94 0.93
CSGO
600
75012
0020
0040
00
Bitrates [Kbps]
0.98 0.93 0.94
0.98 0.98 0.97 0.93 0.93
0.82 0.77 0.93 0.93 0.94
FIFA17
600
75012
0020
0040
00
Bitrates [Kbps]
0.98 0.99 0.97
0.80 0.80 0.94 0.97 0.96
0.68 0.61 0.83 0.92 0.94
H1Z1
600
75012
0020
0040
00
Bitrates [Kbps]
0.99 0.94 0.94
0.94 0.94 0.93 0.92 0.92
0.96 0.97 0.97 0.96 0.96
Hearthstone
600
75012
0020
0040
00
Bitrates [Kbps]
0.93 0.96 0.94
0.96 0.96 0.93 0.94 0.92
0.58 0.43 0.85 0.92 0.93
LoL
600
75012
0020
0040
00
Bitrates [Kbps]
0.99 0.99 0.98
0.84 0.84 0.96 0.98 0.98
0.38 0.28 0.78 0.89 0.93
ProjectCars
-1-0.500.51
PCC
TO M
OS
Figure 11: PCCs between the GVSQM metric proposed in Equation 6 and MOS for each of the six subjectively annotated games. Greenmeans full correlation (PCC=1), dark blue full anti-correlation (PCC=-1) and red no correlation at all (PCC=0).
0.0 0.2 0.4 0.6 0.8 1.0GVSQM
0.0
0.2
0.4
0.6
0.8
1.0
MOS
CSGOFIFA17H1Z1HearthstoneLoLProjectCars
Figure 12: Scatterplot showing the relationship between the objec-tive, GVSQM metric and subjective MOS.
full dataset of 576 datapoints, using an objective bench-mark (Section 6.3). At last, a comparison of the presentedcurve-fitting approach with two other prediction mecha-nisms is provided (Section 6.4).
For the first three phases, both PCC and MSE are in-cluded to assess the performance of the proposed model.This is done because PCC gives information on the linearrelationship between two variables, while MSE is a mea-surement for the amount of over- or underprediction whencombined with PCC. These metrics are gathered usingstratified k-fold Cross-Validation (CV). Unlike standard k-fold, the data points within each fold are chosen such thatthey are evenly distributed over the 0 to 1 scale of the(normalized) benchmark. This is done to avoid that theparticular model is fitted on data points falling within asmall interval of the benchmark range, therefore resultingin low performance on other benchmark intervals [31]. Toensure this stratified behaviour, the benchmarks li ∈ [0, 1]are mapped to n bins bi = [ in ,
i+1n ], i = 0, ..., n − 1, with
n = 4 in this particular case. Afterwards, the data pointswithin each fold are chosen at random, but such that eachbin is more or less evenly represented.
6.1. Accuracy analysis: benchmarking against MOS
To gather insight in the accuracy and applicability ofthe proposed curve-fitting procedure, the approach is firstbenchmarked directly to the ground-truth quality, i.e.MOS. In Table 8 the resulting performance for each of theclasses and each of the investigated psychometric curves
Table 8: Overview of the obtained PCC and MSE scores towardsMOS by applying a psychometric curve fitting approach
Linear Exponential SigmoidClass PCC MSE PCC MSE PCC MSE
0 0.955 0.007 0.929 0.026 0.963 0.0041 0.882 0.016 0.904 0.014 0.904 0.0142 0.978 0.021 0.964 0.026 0.982 0.019
Overall 0.873 0.016 0.852 0.019 0.883 0.013
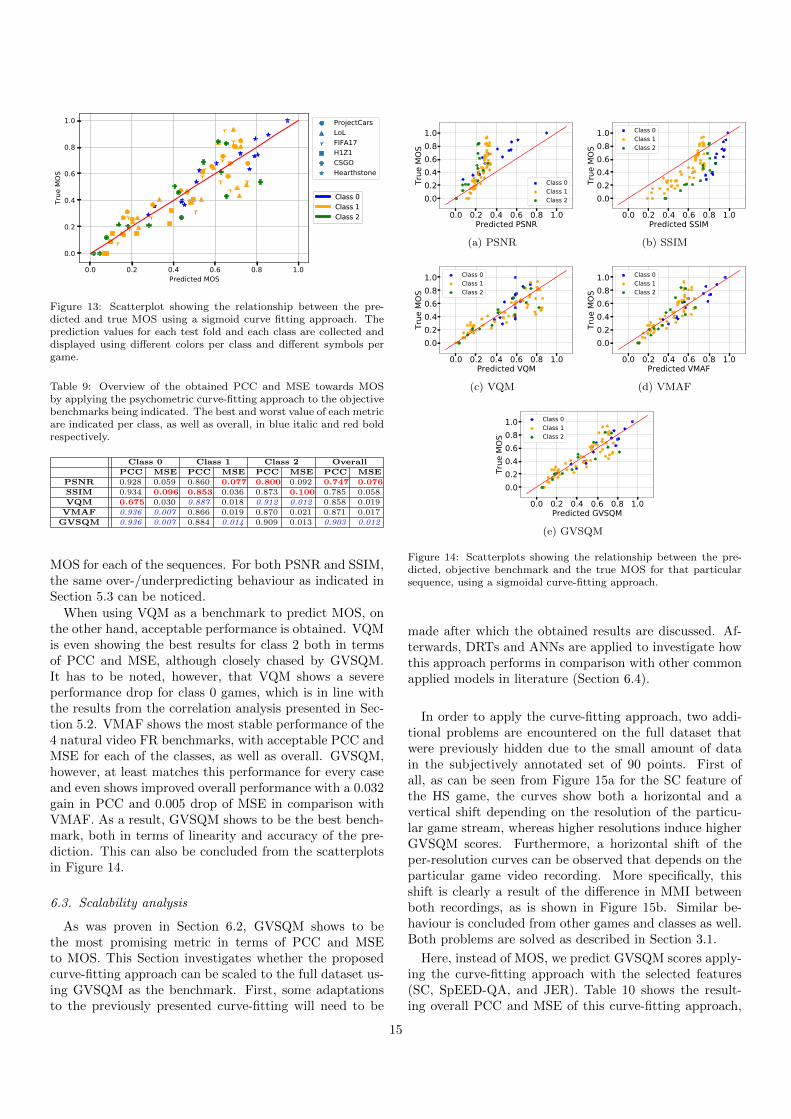
(linear, exponential and sigmoidal) is shown, both in termsof PCC and MSE as averaged over the multiple test folds.It can be seen that a sigmoid function is showing the bestperformance for each of the classes, although leveled bythe exponential curve for class 1. Especially for class 0, acurve fitting approach on a single feature (SC in this case)shows rather high performance with an obtained MSE aslow as 0.004. In Figure 13, a scatterplot showing the re-lationship between the predicted and true MOS using thebest performing, sigmoidal curve fitting approach is shown.To this extent, the prediction values for each test fold andeach class are collected and displayed using different colorsper class and different symbols per game.
6.2. Robustness analysis: benchmarking against objectivemetrics
As subjective scores are typically not freely available fora large set of video recordings, the curve-fitting is typicallyperformed against an objective benchmark. Therefore, theoutcome of this approach in relation to the ground-truthMOS is analyzed in this Section.
In Table 9, the obtained PCC and MSE to MOS areshown after applying a curve-fitting approach to each ofthe objective, FR benchmarks. This is done for each class,as well as overall. The curve is chosen to be a sigmoid, asit shows the best performance based on the results fromthe previous Section. The best and worst values for eachmetric and each class, as well as overall, are indicated initalic blue and bold red, respectively. It can be seen thatboth PSNR and SSIM show rather low performance interms of MSE to MOS, with high values up to 0.100 in theworst case. This is a clear indication for over- or underpre-diction, which is in line with the results from Section 6.1.This can also be noticed from the scatterplots in Figure 14,showing the predicted, objective metrics against the actual
14
0.0 0.2 0.4 0.6 0.8 1.0Predicted MOS
0.0
0.2
0.4
0.6
0.8
1.0
True
MOS
ProjectCarsLoLFIFA17H1Z1CSGOHearthstone
Class 0Class 1Class 2
Class 0Class 1Class 2
Figure 13: Scatterplot showing the relationship between the pre-dicted and true MOS using a sigmoid curve fitting approach. Theprediction values for each test fold and each class are collected anddisplayed using different colors per class and different symbols pergame.
Table 9: Overview of the obtained PCC and MSE towards MOSby applying the psychometric curve-fitting approach to the objectivebenchmarks being indicated. The best and worst value of each metricare indicated per class, as well as overall, in blue italic and red boldrespectively.
Class 0 Class 1 Class 2 Overall
PCC MSE PCC MSE PCC MSE PCC MSE
PSNR 0.928 0.059 0.860 0.077 0.800 0.092 0.747 0.076
SSIM 0.934 0.096 0.853 0.036 0.873 0.100 0.785 0.058
VQM 0.675 0.030 0.887 0.018 0.912 0.012 0.858 0.019
VMAF 0.936 0.007 0.866 0.019 0.870 0.021 0.871 0.017
GVSQM 0.936 0.007 0.884 0.014 0.909 0.013 0.903 0.012
MOS for each of the sequences. For both PSNR and SSIM,the same over-/underpredicting behaviour as indicated inSection 5.3 can be noticed.
When using VQM as a benchmark to predict MOS, onthe other hand, acceptable performance is obtained. VQMis even showing the best results for class 2 both in termsof PCC and MSE, although closely chased by GVSQM.It has to be noted, however, that VQM shows a severeperformance drop for class 0 games, which is in line withthe results from the correlation analysis presented in Sec-tion 5.2. VMAF shows the most stable performance of the4 natural video FR benchmarks, with acceptable PCC andMSE for each of the classes, as well as overall. GVSQM,however, at least matches this performance for every caseand even shows improved overall performance with a 0.032gain in PCC and 0.005 drop of MSE in comparison withVMAF. As a result, GVSQM shows to be the best bench-mark, both in terms of linearity and accuracy of the pre-diction. This can also be concluded from the scatterplotsin Figure 14.
6.3. Scalability analysis
As was proven in Section 6.2, GVSQM shows to bethe most promising metric in terms of PCC and MSEto MOS. This Section investigates whether the proposedcurve-fitting approach can be scaled to the full dataset us-ing GVSQM as the benchmark. First, some adaptationsto the previously presented curve-fitting will need to be
0.0 0.2 0.4 0.6 0.8 1.0Predicted PSNR
0.00.20.40.60.81.0
True
MOS
Class 0Class 1Class 2
(a) PSNR
0.0 0.2 0.4 0.6 0.8 1.0Predicted SSIM
0.00.20.40.60.81.0
True
MOS
Class 0Class 1Class 2
(b) SSIM
0.0 0.2 0.4 0.6 0.8 1.0Predicted VQM
0.00.20.40.60.81.0
True
MOS
Class 0Class 1Class 2
(c) VQM
0.0 0.2 0.4 0.6 0.8 1.0Predicted VMAF
0.00.20.40.60.81.0
True
MOS
Class 0Class 1Class 2
(d) VMAF
0.0 0.2 0.4 0.6 0.8 1.0Predicted GVSQM
0.00.20.40.60.81.0
True
MOS
Class 0Class 1Class 2
(e) GVSQM
Figure 14: Scatterplots showing the relationship between the pre-dicted, objective benchmark and the true MOS for that particularsequence, using a sigmoidal curve-fitting approach.
made after which the obtained results are discussed. Af-terwards, DRTs and ANNs are applied to investigate howthis approach performs in comparison with other commonapplied models in literature (Section 6.4).
In order to apply the curve-fitting approach, two addi-tional problems are encountered on the full dataset thatwere previously hidden due to the small amount of datain the subjectively annotated set of 90 points. First ofall, as can be seen from Figure 15a for the SC feature ofthe HS game, the curves show both a horizontal and avertical shift depending on the resolution of the particu-lar game stream, whereas higher resolutions induce higherGVSQM scores. Furthermore, a horizontal shift of theper-resolution curves can be observed that depends on theparticular game video recording. More specifically, thisshift is clearly a result of the difference in MMI betweenboth recordings, as is shown in Figure 15b. Similar be-haviour is concluded from other games and classes as well.Both problems are solved as described in Section 3.1.
Here, instead of MOS, we predict GVSQM scores apply-ing the curve-fitting approach with the selected features(SC, SpEED-QA, and JER). Table 10 shows the result-ing overall PCC and MSE of this curve-fitting approach,
15

0.0 0.1 0.2 0.3 0.4 0.5 0.6 0.7 0.8 0.9 1.0SC
0.00.10.20.30.40.50.60.70.80.91.0
GVSQ
M
Recording 1Recording 2
640x4801280x7201920x1080
640x4801280x7201920x1080
(a)
0.0 0.1 0.2 0.3 0.4 0.5 0.6 0.7 0.8 0.9 1.0SC
0.00.10.20.30.40.50.60.70.80.91.0
GVSQ
M
Recording 1Recording 2Recording 1Recording 2
0.0
0.02
0.04
0.06
0.08
0.1
0.12
MM
I
(b)
Figure 15: Visualization of the shifted curves, depending on boththe resolution (a) and the MMI of the particular game recording (b),here shown for the specific case of the HS game. The red-coloreddatapoints in Figure 15b (with lowest MMI) are the recordings usedfor the analysis in Section 5.
Table 10: Overview of the per-class and overall performance of thecurve fitting approach.
Class PCC MSE0 0.973 0.0021 0.941 0.0202 0.916 0.007
Overall 0.914 0.008
as well as the subdivision per class. Hereby, it should benoted that game recordings of which the data points spanmultiple classes are classified fully to the class that includesthe most points after applying the k-means classifier. Thisis done to provide the model with enough data points tofit a reliable curve. As such, more reliable results will beobtained relative to a real-life case, than when a curve isfitted to only two or three data points, which would showan unrealistic decrease in performance. This is only neededwithin the limitations of the dataset under scrutiny, how-ever, as real-life GVS databases can be assumed to coverenough video recordings per class such that class changesare not needed.
In Figure 16, scatter plots are provided showing the re-lationship between the predicted and the true GVSQMvalues for each of the three classes. It can be seen thatclass 1 shows a rather high MSE of 0.02 in comparisonwith its neighbouring classes, despite its 0.941 PCC. Asshown in Figure 16, this is a result of a consistent under-prediction of the model, which is not the case for the otherclasses. Possible explanations for this behaviour might bethat the SpEED-QA curves show a more complex transfor-mation than a straightforward shift or that the proposedshift estimation is insufficient for this particular class.
6.4. Alternatives to curve-fitting
To obtain more insight in the accuracy and scalabil-ity of the proposed framework, a comparison is providedwith two alternative prediction mechanisms. A first, al-ternative approach makes use of a white-box DRT to cap-ture the relationship between NR/RR-features and theGVSQM benchmark. Note that this is not exactly thesame procedure as described in Section 3.2, as additional
0.0 0.2 0.4 0.6 0.8 1.0Predicted GVSQM
0.0
0.2
0.4
0.6
0.8
1.0
True
GVS
QM
DiabloDotA2HSHOTSLoLSC2
(a) Class 0
0.0 0.2 0.4 0.6 0.8 1.0Predicted GVSQM
0.0
0.2
0.4
0.6
0.8
1.0
True
GVS
QM
FIFAPCWoW
(b) Class 1
0.0 0.2 0.4 0.6 0.8 1.0Predicted GVSQM
0.0
0.2
0.4
0.6
0.8
1.0
True
GVS
QM
CSGOH1Z1PU
(c) Class 2
Figure 16: Scatterplot showing the relationship between the pre-dicted and true values of the GVSQM metric using the curve fittingapproach. The scatter plots are subdivided by class.
measures are taken to avoid overfitting. To this extent, acertain amount of impurity, i.e. MSE, is allowed within thetrained tree. This value is optimized using 5-fold stratifiedCV on the dataset. Both the approach with one DRT forall data as the approach with one DRT per class are inves-tigated. In addition, the influence of the presence/absenceof SpEED-QA as a feature is researched. Table 11 showsthe obtained PCC and MSE for both the ”one-tree-for-all”and the ”one-tree-per-class” approaches with and withoutthe inclusion of SpEED-QA in the feature set. In Fig-ure 17, scatter plots are provided showing the relationshipbetween the predicted and true values of the GVSQM met-ric using a ”one-tree-for-all” approach. Both the cases withand without the inclusion of SpEED-QA (thus creating aRR and NR approach respectively) are shown. It can beseen that a one-tree-per-class approach is showing betterperformance than the one-tree-for-all approach, althoughthe gain is limited with 0.925 against 0.913 PCC for theRR case and 0.918 against 0.910 PCC for the NR case.The overall MSEs for all cases are similar. Furthermore,as one could expect, the RR approach is performing bet-ter than its NR counterpart. Again, the gain is limited,however. Somewhat surprisingly, it can be noticed thatthe class 2 performance is suffering the most from the ex-clusion of SpEED-QA from the feature set, with a 0.027drop in PCC for the one-tree-for-all approach and a 0.018drop in the one-tree-per-class case.
In a second alternative modelling attempt, an ANN isproposed. The activation function(s), learning rate, num-ber of hidden neurons and number of hidden layers are cho-sen or optimized using a grid-search, by cross-validating onthe data with 5 folds. MSE is once again chosen as theerror function to be minimized. For the NR case (withoutSpEED-QA), a network with 2 hidden layers, 47 nodes
16
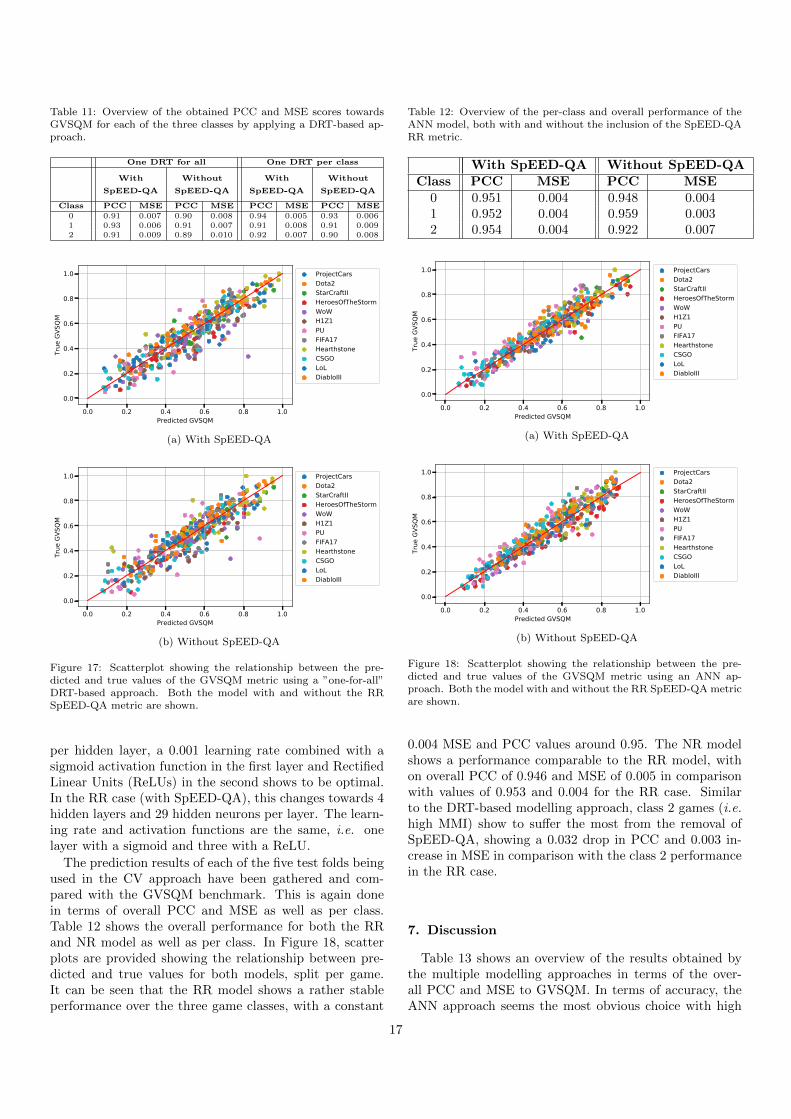
Table 11: Overview of the obtained PCC and MSE scores towardsGVSQM for each of the three classes by applying a DRT-based ap-proach.
One DRT for all One DRT per class
With
SpEED-QA
Without
SpEED-QA
With
SpEED-QA
Without
SpEED-QA
Class PCC MSE PCC MSE PCC MSE PCC MSE
0 0.91 0.007 0.90 0.008 0.94 0.005 0.93 0.0061 0.93 0.006 0.91 0.007 0.91 0.008 0.91 0.0092 0.91 0.009 0.89 0.010 0.92 0.007 0.90 0.008
0.0 0.2 0.4 0.6 0.8 1.0Predicted GVSQM
0.0
0.2
0.4
0.6
0.8
1.0
True
GVS
QM
ProjectCarsDota2StarCraftIIHeroesOfTheStormWoWH1Z1PUFIFA17HearthstoneCSGOLoLDiabloIII
(a) With SpEED-QA
0.0 0.2 0.4 0.6 0.8 1.0Predicted GVSQM
0.0
0.2
0.4
0.6
0.8
1.0
True
GVS
QM
ProjectCarsDota2StarCraftIIHeroesOfTheStormWoWH1Z1PUFIFA17HearthstoneCSGOLoLDiabloIII
(b) Without SpEED-QA
Figure 17: Scatterplot showing the relationship between the pre-dicted and true values of the GVSQM metric using a ”one-for-all”DRT-based approach. Both the model with and without the RRSpEED-QA metric are shown.
per hidden layer, a 0.001 learning rate combined with asigmoid activation function in the first layer and RectifiedLinear Units (ReLUs) in the second shows to be optimal.In the RR case (with SpEED-QA), this changes towards 4hidden layers and 29 hidden neurons per layer. The learn-ing rate and activation functions are the same, i.e. onelayer with a sigmoid and three with a ReLU.
The prediction results of each of the five test folds beingused in the CV approach have been gathered and com-pared with the GVSQM benchmark. This is again donein terms of overall PCC and MSE as well as per class.Table 12 shows the overall performance for both the RRand NR model as well as per class. In Figure 18, scatterplots are provided showing the relationship between pre-dicted and true values for both models, split per game.It can be seen that the RR model shows a rather stableperformance over the three game classes, with a constant
Table 12: Overview of the per-class and overall performance of theANN model, both with and without the inclusion of the SpEED-QARR metric.
With SpEED-QA Without SpEED-QAClass PCC MSE PCC MSE
0 0.951 0.004 0.948 0.0041 0.952 0.004 0.959 0.0032 0.954 0.004 0.922 0.007
0.0 0.2 0.4 0.6 0.8 1.0Predicted GVSQM
0.0
0.2
0.4
0.6
0.8
1.0
True
GVS
QM
ProjectCarsDota2StarCraftIIHeroesOfTheStormWoWH1Z1PUFIFA17HearthstoneCSGOLoLDiabloIII
(a) With SpEED-QA
0.0 0.2 0.4 0.6 0.8 1.0Predicted GVSQM
0.0
0.2
0.4
0.6
0.8
1.0
True
GVS
QM
ProjectCarsDota2StarCraftIIHeroesOfTheStormWoWH1Z1PUFIFA17HearthstoneCSGOLoLDiabloIII
(b) Without SpEED-QA
Figure 18: Scatterplot showing the relationship between the pre-dicted and true values of the GVSQM metric using an ANN ap-proach. Both the model with and without the RR SpEED-QA metricare shown.
0.004 MSE and PCC values around 0.95. The NR modelshows a performance comparable to the RR model, withon overall PCC of 0.946 and MSE of 0.005 in comparisonwith values of 0.953 and 0.004 for the RR case. Similarto the DRT-based modelling approach, class 2 games (i.e.high MMI) show to suffer the most from the removal ofSpEED-QA, showing a 0.032 drop in PCC and 0.003 in-crease in MSE in comparison with the class 2 performancein the RR case.
7. Discussion
Table 13 shows an overview of the results obtained bythe multiple modelling approaches in terms of the over-all PCC and MSE to GVSQM. In terms of accuracy, theANN approach seems the most obvious choice with high
17
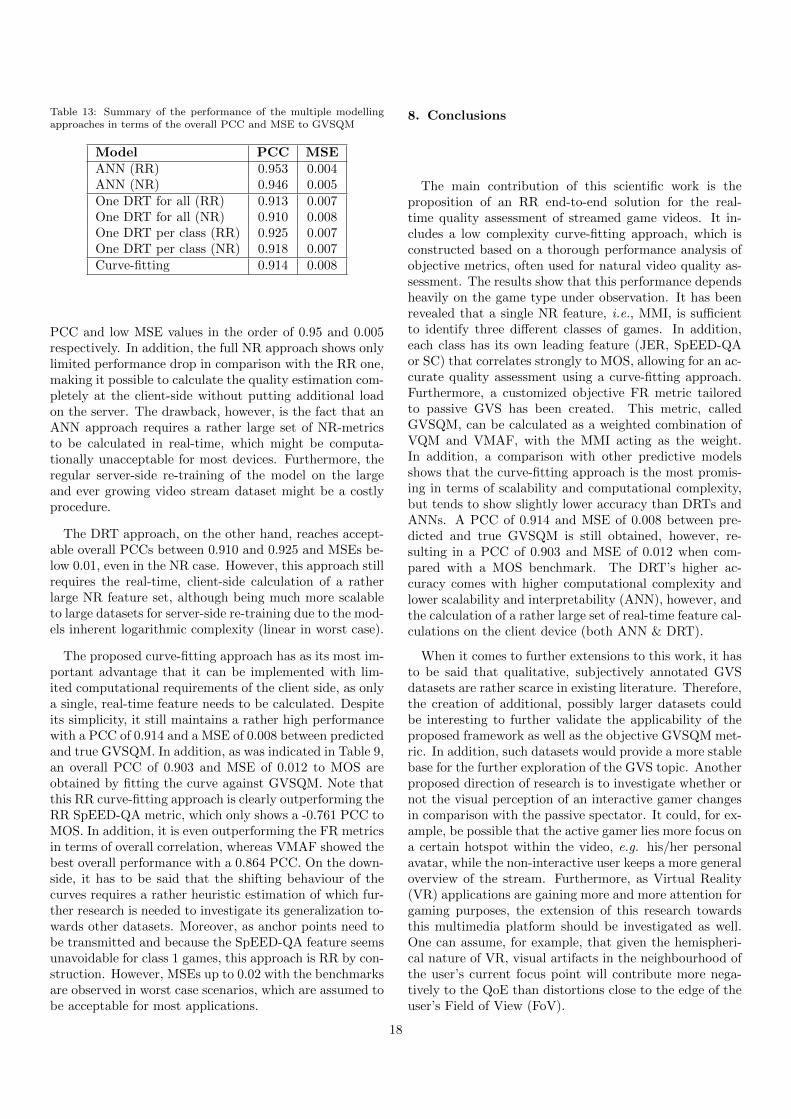
Table 13: Summary of the performance of the multiple modellingapproaches in terms of the overall PCC and MSE to GVSQM
Model PCC MSEANN (RR) 0.953 0.004ANN (NR) 0.946 0.005One DRT for all (RR) 0.913 0.007One DRT for all (NR) 0.910 0.008One DRT per class (RR) 0.925 0.007One DRT per class (NR) 0.918 0.007Curve-fitting 0.914 0.008
PCC and low MSE values in the order of 0.95 and 0.005respectively. In addition, the full NR approach shows onlylimited performance drop in comparison with the RR one,making it possible to calculate the quality estimation com-pletely at the client-side without putting additional loadon the server. The drawback, however, is the fact that anANN approach requires a rather large set of NR-metricsto be calculated in real-time, which might be computa-tionally unacceptable for most devices. Furthermore, theregular server-side re-training of the model on the largeand ever growing video stream dataset might be a costlyprocedure.
The DRT approach, on the other hand, reaches accept-able overall PCCs between 0.910 and 0.925 and MSEs be-low 0.01, even in the NR case. However, this approach stillrequires the real-time, client-side calculation of a ratherlarge NR feature set, although being much more scalableto large datasets for server-side re-training due to the mod-els inherent logarithmic complexity (linear in worst case).
The proposed curve-fitting approach has as its most im-portant advantage that it can be implemented with lim-ited computational requirements of the client side, as onlya single, real-time feature needs to be calculated. Despiteits simplicity, it still maintains a rather high performancewith a PCC of 0.914 and a MSE of 0.008 between predictedand true GVSQM. In addition, as was indicated in Table 9,an overall PCC of 0.903 and MSE of 0.012 to MOS areobtained by fitting the curve against GVSQM. Note thatthis RR curve-fitting approach is clearly outperforming theRR SpEED-QA metric, which only shows a -0.761 PCC toMOS. In addition, it is even outperforming the FR metricsin terms of overall correlation, whereas VMAF showed thebest overall performance with a 0.864 PCC. On the down-side, it has to be said that the shifting behaviour of thecurves requires a rather heuristic estimation of which fur-ther research is needed to investigate its generalization to-wards other datasets. Moreover, as anchor points need tobe transmitted and because the SpEED-QA feature seemsunavoidable for class 1 games, this approach is RR by con-struction. However, MSEs up to 0.02 with the benchmarksare observed in worst case scenarios, which are assumed tobe acceptable for most applications.
8. Conclusions
The main contribution of this scientific work is theproposition of an RR end-to-end solution for the real-time quality assessment of streamed game videos. It in-cludes a low complexity curve-fitting approach, which isconstructed based on a thorough performance analysis ofobjective metrics, often used for natural video quality as-sessment. The results show that this performance dependsheavily on the game type under observation. It has beenrevealed that a single NR feature, i.e., MMI, is sufficientto identify three different classes of games. In addition,each class has its own leading feature (JER, SpEED-QAor SC) that correlates strongly to MOS, allowing for an ac-curate quality assessment using a curve-fitting approach.Furthermore, a customized objective FR metric tailoredto passive GVS has been created. This metric, calledGVSQM, can be calculated as a weighted combination ofVQM and VMAF, with the MMI acting as the weight.In addition, a comparison with other predictive modelsshows that the curve-fitting approach is the most promis-ing in terms of scalability and computational complexity,but tends to show slightly lower accuracy than DRTs andANNs. A PCC of 0.914 and MSE of 0.008 between pre-dicted and true GVSQM is still obtained, however, re-sulting in a PCC of 0.903 and MSE of 0.012 when com-pared with a MOS benchmark. The DRT’s higher ac-curacy comes with higher computational complexity andlower scalability and interpretability (ANN), however, andthe calculation of a rather large set of real-time feature cal-culations on the client device (both ANN & DRT).
When it comes to further extensions to this work, it hasto be said that qualitative, subjectively annotated GVSdatasets are rather scarce in existing literature. Therefore,the creation of additional, possibly larger datasets couldbe interesting to further validate the applicability of theproposed framework as well as the objective GVSQM met-ric. In addition, such datasets would provide a more stablebase for the further exploration of the GVS topic. Anotherproposed direction of research is to investigate whether ornot the visual perception of an interactive gamer changesin comparison with the passive spectator. It could, for ex-ample, be possible that the active gamer lies more focus ona certain hotspot within the video, e.g. his/her personalavatar, while the non-interactive user keeps a more generaloverview of the stream. Furthermore, as Virtual Reality(VR) applications are gaining more and more attention forgaming purposes, the extension of this research towardsthis multimedia platform should be investigated as well.One can assume, for example, that given the hemispheri-cal nature of VR, visual artifacts in the neighbourhood ofthe user’s current focus point will contribute more nega-tively to the QoE than distortions close to the edge of theuser’s Field of View (FoV).
18

Acknowledgements
This research is part of a collaborative project betweenHuawei and Ghent University, funded by Huawei Tech-nologies, China.Maria Torres Vega is funded by the Research FoundationFlanders (FWO), grant number 12W4819N.
References
[1] K. L. Chan, Improving and Expanding Gaming Experiencesbased on Cloud Gaming, Ph.D. thesis, Nara Institute of Scienceand Technology (2018).
[2] T. Smith, M. Obrist, P. Wright, Live-Streaming Changes the(Video) Game, in: Proceedings of the 11th European Confer-ence on Interactive TV and Video, EuroITV ’13, Association forComputing Machinery, New York, NY, USA, 2013, p. 131–138.doi:10.1145/2465958.2465971.URL https://doi.org/10.1145/2465958.2465971
[3] M. Sjoblom, J. Hamari, Why do people watch others playvideo games? An empirical study on the motivations of Twitchusers, Computers in Human Behavior 75 (2017) 985 – 996.doi:https://doi.org/10.1016/j.chb.2016.10.019.URL http://www.sciencedirect.com/science/article/pii/
S0747563216307208
[4] M. Suznjevic, L. Skorin-Kapov, M. Matijasevic, The Impact ofUser, System, and Context Factors on Gaming QoE: A CaseStudy Involving MMORPGs, in: Proceedings of Annual Work-shop on Network and Systems Support for Games, NetGames’13, IEEE Press, 2013, p. 1–6.
[5] M. Torres Vega, C. Perra, F. De Turck, A. Liotta, A Review ofPredictive Quality of Experience Management in Video Stream-ing Services, IEEE Transactions on Broadcasting 64 (2) (2018)432–445. doi:10.1109/TBC.2018.2822869.
[6] M. Jarschel, D. Schlosser, S. Scheuring, T. Hoßfeld, Gamingin the clouds: QoE and the users’ perspective, Mathematicaland Computer Modelling 57 (11) (2013) 2883 – 2894, informa-tion System Security and Performance Modeling and Simulationfor Future Mobile Networks. doi:https://doi.org/10.1016/j.mcm.2011.12.014.URL http://www.sciencedirect.com/science/article/pii/
S0895717711007771
[7] I. T. Union, ITU-T RECOMMENDATION P.910 (09/99): Sub-jective video quality assessment methods for multimedia ap-plications, Tech. rep., International Telecommunication Union(1999).
[8] I. T. Union, ITU-R RECOMMENDATION BT.500-14(10/2019): Methodologies for the subjective assessment of thequality of television images, Tech. rep., International Telecom-munication Union (2019).
[9] C. G. Bampis, Z. Li, A. K. Moorthy, I. Katsavounidis, A. Aaron,A. C. Bovik, Study of temporal effects on subjective videoQuality of Experience, IEEE Transactions on Image Process-ing 26 (11) (2017) 5217–5231. doi:10.1109/TIP.2017.2729891.
[10] Y. Kang, H. Chen, L. Xie, An artificial-neural-network-basedQoE estimation model for Video streaming over wireless net-works, in: 2013 IEEE/CIC International Conference on Com-munications in China (ICCC), 2013, pp. 264–269. doi:10.1109/ICCChina.2013.6671126.
[11] M. Torres Vega, D. C. Mocanu, S. Stavrou, A. Liotta, Predic-tive no-reference assessment of video quality, Signal Process-ing: Image Communication 52 (2017) 20 – 32. doi:https:
//doi.org/10.1016/j.image.2016.12.001.URL http://www.sciencedirect.com/science/article/pii/
S092359651630176X
[12] M. Shahid, J. Panasiuk, G. Van Wallendael, M. Barkowsky,B. Lovstrom, Predicting full-reference video quality measuresusing HEVC bitstream-based no-reference features, in: 2015
Seventh International Workshop on Quality of Multimedia Ex-perience (QoMEX), 2015, pp. 1–2. doi:10.1109/QoMEX.2015.
7148118.[13] N. Staelens, J. De Meulenaere, M. Claeys, G. Wallendael,
W. Van den Broeck, J. De Cock, R. Van de Walle, P. Demeester,F. De Turck, Subjective quality assessment of longer durationvideo sequences delivered over http adaptive streaming to tabletdevices, IEEE Transactions on Broadcasting 60 (2014) 707–714.doi:10.1109/TBC.2014.2359255.
[14] M. Torres Vega, D. C. Mocanu, A. Liotta, Unsupervised deeplearning for real-time assessment of video streaming services,Multimedia Tools and Applications 76 (21) (2017) 22303–22327.
[15] M. Alreshoodi, J. Woods, Survey on QoEQoS Correlation Models For Multimedia Services (2013).arXiv:1306.0221.
[16] I. Slivar, M. Suznjevic, L. Skorin-Kapov, The impact of videoencoding parameters and game type on QoE for cloud gam-ing: A case study using the steam platform, in: 2015 SeventhInternational Workshop on Quality of Multimedia Experience(QoMEX), 2015, pp. 1–6. doi:10.1109/QoMEX.2015.7148144.
[17] I. Slivar, L. Skorin-Kapov, M. Suznjevic, Cloud Gaming QoEModels for Deriving Video Encoding Adaptation Strategies, in:Proceedings of the 7th International Conference on Multime-dia Systems, MMSys ’16, Association for Computing Machin-ery, New York, NY, USA, 2016, p. 18. doi:10.1145/2910017.
2910602.URL https://doi.org/10.1145/2910017.2910602
[18] I. Slivar, M. Suznjevic, L. Skorin-Kapov, Game Categorizationfor Deriving QoE-Driven Video Encoding Configuration Strate-gies for Cloud Gaming, ACM Trans. Multimedia Comput. Com-mun. Appl. 14 (3s) (Jun. 2018). doi:10.1145/3132041.URL https://doi.org/10.1145/3132041
[19] N. Barman, S. Zadtootaghaj, S. Schmidt, M. G. Martini,S. Moller, GamingVideoSET: A Dataset for Gaming VideoStreaming Applications, in: 2018 16th Annual Workshop onNetwork and Systems Support for Games (NetGames), 2018,pp. 1–6. doi:10.1109/NetGames.2018.8463362.
[20] V. Clincy, B. Wilgor, Subjective Evaluation of Latency andPacket Loss in a Cloud-Based Game, in: 2013 10th InternationalConference on Information Technology: New Generations, 2013,pp. 473–476. doi:10.1109/ITNG.2013.79.
[21] C.-Y. Huang, C.-H. Hsu, D.-Y. Chen, K.-T. Chen, QuantifyingUser Satisfaction in Mobile Cloud Games, in: Proceedings ofWorkshop on Mobile Video Delivery, MoViD’14, Associationfor Computing Machinery, New York, NY, USA, 2014, p. 1–6.doi:10.1145/2579465.2579468.URL https://doi.org/10.1145/2579465.2579468
[22] M. Jarschel, D. Schlosser, S. Scheuring, T. Hoßfeld, An Evalu-ation of QoE in Cloud Gaming Based on Subjective Tests, in:2011 Fifth International Conference on Innovative Mobile andInternet Services in Ubiquitous Computing, 2011, pp. 330–335.doi:10.1109/IMIS.2011.92.
[23] S. Wang, S. Dey, Modeling and Characterizing User Experi-ence in a Cloud Server Based Mobile Gaming Approach, in:GLOBECOM 2009 - 2009 IEEE Global TelecommunicationsConference, 2009, pp. 1–7. doi:10.1109/GLOCOM.2009.5425784.
[24] S. Zadtootaghaj, S. Schmidt, S. Moller, Modeling GamingQoE: Towards the Impact of Frame Rate and Bit Rate onCloud Gaming, in: 2018 Tenth International Conference onQuality of Multimedia Experience (QoMEX), 2018, pp. 1–6.doi:10.1109/QoMEX.2018.8463416.
[25] N. Barman, M. G. Martini, S. Zadtootaghaj, S. Moller, S. Lee, AComparative Quality Assessment Study for Gaming and Non-Gaming Videos, in: 2018 Tenth International Conference onQuality of Multimedia Experience (QoMEX), 2018, pp. 1–6.doi:10.1109/QoMEX.2018.8463403.
[26] S. Zadtootaghaj, N. Barman, S. Schmidt, M. G. Martini,S. Moller, NR-GVQM: A No Reference Gaming Video QualityMetric, in: 2018 IEEE International Symposium on Multimedia(ISM), 2018, pp. 131–134. doi:10.1109/ISM.2018.00031.
[27] N. Barman, E. Jammeh, S. A. Ghorashi, M. G. Martini,
19

No-Reference Video Quality Estimation Based on MachineLearning for Passive Gaming Video Streaming Applications,IEEE Access 7 (2019) 74511–74527. doi:10.1109/ACCESS.2019.2920477.
[28] S. Goring, R. R. R. Rao, A. Raake, nofu — A LightweightNo-Reference Pixel Based Video Quality Model for GamingContent, in: 2019 Eleventh International Conference on Qual-ity of Multimedia Experience (QoMEX), 2019, pp. 1–6. doi:
10.1109/QoMEX.2019.8743262.[29] A. Aaron, Z. Li, M. Manohara, J. Y. Lin, E. C. Wu, C. . J. Kuo,
Challenges in cloud based ingest and encoding for high qualitystreaming media, in: 2015 IEEE International Conference onImage Processing (ICIP), 2015, pp. 1732–1736. doi:10.1109/
ICIP.2015.7351097.[30] M. Fiedler, T. Hossfeld, P. Tran-Gia, A generic quantitative
relationship between Quality of Experience and Quality of Ser-vice, IEEE Network 24 (2) (2010) 36–41. doi:10.1109/MNET.
2010.5430142.[31] E. Alpaydin, Introduction to Machine Learning, 3rd Edition,
MIT Press, Cambridge, Massachusetts, USA / London, Eng-land, 2014.
[32] A. Liotta, D. C. Mocanu, V. Menkovski, L. Cagnetta,G. Exarchakos, Instantaneous Video Quality Assessment forLightweight Devices, in: Proceedings of International Confer-ence on Advances in Mobile Computing & Multimedia, MoMM’13, Association for Computing Machinery, New York, NY,USA, 2013, p. 525–531. doi:10.1145/2536853.2536903.URL https://doi.org/10.1145/2536853.2536903
[33] M. G. Choi, J. H. Jung, J. W. Jeon, No-reference image qual-ity assessment using blur and noise, International Journal ofComputer Science and Engineering 3 (2) (2009) 76–80.
[34] C. Perra, A low computational complexity blockiness estimationbased on spatial analysis, in: 2014 22nd TelecommunicationsForum Telfor (TELFOR), 2014, pp. 1130–1133. doi:10.1109/
TELFOR.2014.7034606.[35] P. Paudyal, F. Battisti, M. Carli, Impact of video content and
transmission impairments on Quality of Experience, MultimediaTools and Applications 75 (23) (2016) 16461–16485. doi:10.
1007/s11042-015-3214-0.URL https://doi.org/10.1007/s11042-015-3214-0
[36] S. Borer, A model of jerkiness for temporal impairments in videotransmission, in: 2010 Second International Workshop on Qual-ity of Multimedia Experience (QoMEX), 2010, pp. 218–223.doi:10.1109/QOMEX.2010.5516155.
[37] S. Zadtootaghaj, S. Schmidt, N. Barman, S. Moller, M. G.Martini, A Classification of Video Games based on GameCharacteristics linked to Video Coding Complexity, in: 201816th Annual Workshop on Network and Systems Support forGames (NetGames), 2018, pp. 1–6. doi:10.1109/NetGames.
2018.8463434.[38] FFmpeg, www.ffmpeg.org (2019).[39] M. H. Pinson, S. Wolf, A new standardized method for objec-
tively measuring video quality, IEEE Transactions on Broad-casting 50 (3) (2004) 312–322. doi:10.1109/TBC.2004.834028.
[40] Video Quality Metric (VQM) Software, Institute forTelecommunication Sciences, https://www.its.bldrdoc.
gov/resources/video-quality-research/software.aspx
(2019).
20
Copyright © 2022 FDOKUMEN