A Locus for Autosomal Recessive Hypodontia with Associated Dental Anomalies Maps to Chromosome...
13
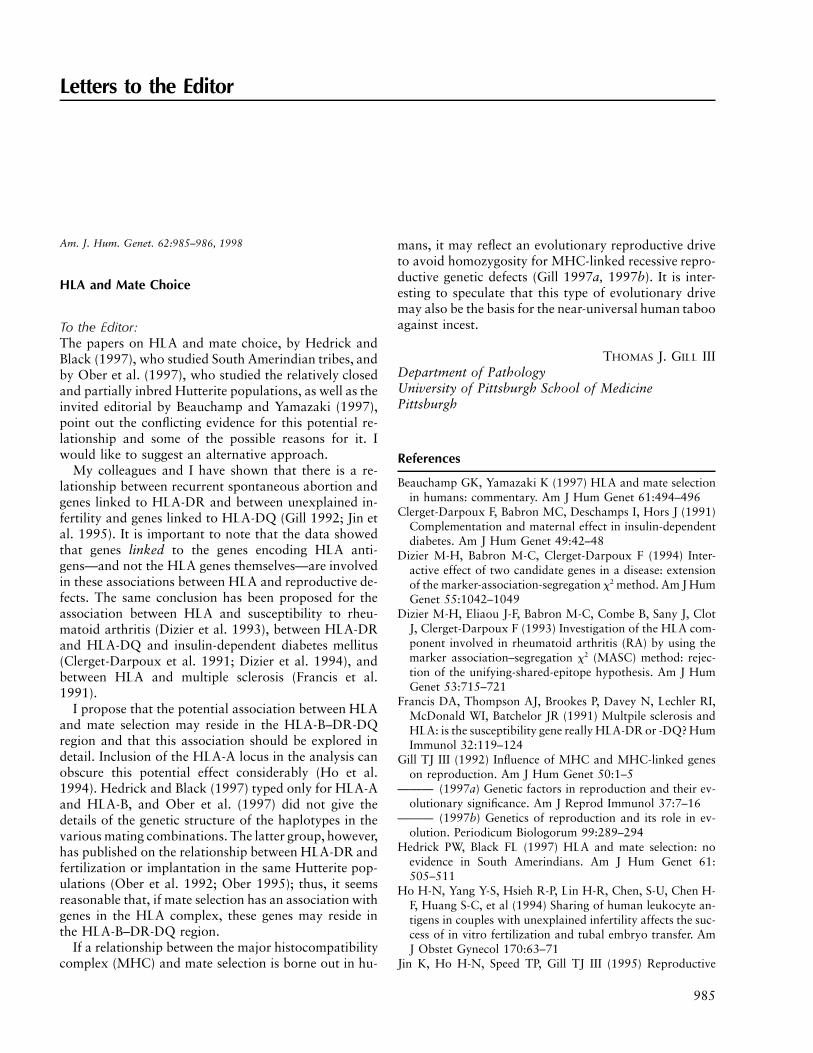
985 Letters to the Editor Am. J. Hum. Genet. 62:985–986, 1998 HLA and Mate Choice To the Editor: The papers on HLA and mate choice, by Hedrick and Black (1997), who studied South Amerindian tribes, and by Ober et al. (1997), who studied the relatively closed and partially inbred Hutterite populations, as well as the invited editorial by Beauchamp and Yamazaki (1997), point out the conflicting evidence for this potential re- lationship and some of the possible reasons for it. I would like to suggest an alternative approach. My colleagues and I have shown that there is a re- lationship between recurrent spontaneous abortion and genes linked to HLA-DR and between unexplained in- fertility and genes linked to HLA-DQ (Gill 1992; Jin et al. 1995). It is important to note that the data showed that genes linked to the genes encoding HLA anti- gens—and not the HLA genes themselves—are involved in these associations between HLA and reproductive de- fects. The same conclusion has been proposed for the association between HLA and susceptibility to rheu- matoid arthritis (Dizier et al. 1993), between HLA-DR and HLA-DQ and insulin-dependent diabetes mellitus (Clerget-Darpoux et al. 1991; Dizier et al. 1994), and between HLA and multiple sclerosis (Francis et al. 1991). I propose that the potential association between HLA and mate selection may reside in the HLA-B–DR-DQ region and that this association should be explored in detail. Inclusion of the HLA-A locus in the analysis can obscure this potential effect considerably (Ho et al. 1994). Hedrick and Black (1997) typed only for HLA-A and HLA-B, and Ober et al. (1997) did not give the details of the genetic structure of the haplotypes in the various mating combinations. The latter group, however, has published on the relationship between HLA-DR and fertilization or implantation in the same Hutterite pop- ulations (Ober et al. 1992; Ober 1995); thus, it seems reasonable that, if mate selection has an association with genes in the HLA complex, these genes may reside in the HLA-B–DR-DQ region. If a relationship between the major histocompatibility complex (MHC) and mate selection is borne out in hu- mans, it may reflect an evolutionary reproductive drive to avoid homozygosity for MHC-linked recessive repro- ductive genetic defects (Gill 1997a, 1997b). It is inter- esting to speculate that this type of evolutionary drive may also be the basis for the near-universal human taboo against incest. THOMAS J. GILL III Department of Pathology University of Pittsburgh School of Medicine Pittsburgh References Beauchamp GK, Yamazaki K (1997) HLA and mate selection in humans: commentary. Am J Hum Genet 61:494–496 Clerget-Darpoux F, Babron MC, Deschamps I, Hors J (1991) Complementation and maternal effect in insulin-dependent diabetes. Am J Hum Genet 49:42–48 Dizier M-H, Babron M-C, Clerget-Darpoux F (1994) Inter- active effect of two candidate genes in a disease: extension of the marker-association-segregation x 2 method. Am J Hum Genet 55:1042–1049 Dizier M-H, Eliaou J-F, Babron M-C, Combe B, Sany J, Clot J, Clerget-Darpoux F (1993) Investigation of the HLA com- ponent involved in rheumatoid arthritis (RA) by using the marker association–segregation x 2 (MASC) method: rejec- tion of the unifying-shared-epitope hypothesis. Am J Hum Genet 53:715–721 Francis DA, Thompson AJ, Brookes P, Davey N, Lechler RI, McDonald WI, Batchelor JR (1991) Multpile sclerosis and HLA: is the susceptibility gene really HLA-DR or -DQ? Hum Immunol 32:119–124 Gill TJ III (1992) Influence of MHC and MHC-linked genes on reproduction. Am J Hum Genet 50:1–5 ——— (1997a) Genetic factors in reproduction and their ev- olutionary significance. Am J Reprod Immunol 37:7–16 ——— (1997b) Genetics of reproduction and its role in ev- olution. Periodicum Biologorum 99:289–294 Hedrick PW, Black FL (1997) HLA and mate selection: no evidence in South Amerindians. Am J Hum Genet 61: 505–511 Ho H-N, Yang Y-S, Hsieh R-P, Lin H-R, Chen, S-U, ChenH- F, Huang S-C, et al (1994) Sharing of human leukocyte an- tigens in couples with unexplained infertility affects the suc- cess of in vitro fertilization and tubal embryo transfer. Am J Obstet Gynecol 170:63–71 Jin K, Ho H-N, Speed TP, Gill TJ III (1995) Reproductive
-
Upload
independent -
Category
Documents
-
view
0 -
download
0
Transcript of A Locus for Autosomal Recessive Hypodontia with Associated Dental Anomalies Maps to Chromosome...
985
Letters to the Editor
Am. J. Hum. Genet. 62:985–986, 1998
HLA and Mate Choice
To the Editor:The papers on HLA and mate choice, by Hedrick andBlack (1997), who studied South Amerindian tribes, andby Ober et al. (1997), who studied the relatively closedand partially inbred Hutterite populations, as well as theinvited editorial by Beauchamp and Yamazaki (1997),point out the conflicting evidence for this potential re-lationship and some of the possible reasons for it. Iwould like to suggest an alternative approach.
My colleagues and I have shown that there is a re-lationship between recurrent spontaneous abortion andgenes linked to HLA-DR and between unexplained in-fertility and genes linked to HLA-DQ (Gill 1992; Jin etal. 1995). It is important to note that the data showedthat genes linked to the genes encoding HLA anti-gens—and not the HLA genes themselves—are involvedin these associations between HLA and reproductive de-fects. The same conclusion has been proposed for theassociation between HLA and susceptibility to rheu-matoid arthritis (Dizier et al. 1993), between HLA-DRand HLA-DQ and insulin-dependent diabetes mellitus(Clerget-Darpoux et al. 1991; Dizier et al. 1994), andbetween HLA and multiple sclerosis (Francis et al.1991).
I propose that the potential association between HLAand mate selection may reside in the HLA-B–DR-DQregion and that this association should be explored indetail. Inclusion of the HLA-A locus in the analysis canobscure this potential effect considerably (Ho et al.1994). Hedrick and Black (1997) typed only for HLA-Aand HLA-B, and Ober et al. (1997) did not give thedetails of the genetic structure of the haplotypes in thevarious mating combinations. The latter group, however,has published on the relationship between HLA-DR andfertilization or implantation in the same Hutterite pop-ulations (Ober et al. 1992; Ober 1995); thus, it seemsreasonable that, if mate selection has an association withgenes in the HLA complex, these genes may reside inthe HLA-B–DR-DQ region.
If a relationship between the major histocompatibilitycomplex (MHC) and mate selection is borne out in hu-
mans, it may reflect an evolutionary reproductive driveto avoid homozygosity for MHC-linked recessive repro-ductive genetic defects (Gill 1997a, 1997b). It is inter-esting to speculate that this type of evolutionary drivemay also be the basis for the near-universal human tabooagainst incest.
THOMAS J. GILL IIIDepartment of PathologyUniversity of Pittsburgh School of MedicinePittsburgh
References
Beauchamp GK, Yamazaki K (1997) HLA and mate selectionin humans: commentary. Am J Hum Genet 61:494–496
Clerget-Darpoux F, Babron MC, Deschamps I, Hors J (1991)Complementation and maternal effect in insulin-dependentdiabetes. Am J Hum Genet 49:42–48
Dizier M-H, Babron M-C, Clerget-Darpoux F (1994) Inter-active effect of two candidate genes in a disease: extensionof the marker-association-segregation x2 method. Am J HumGenet 55:1042–1049
Dizier M-H, Eliaou J-F, Babron M-C, Combe B, Sany J, ClotJ, Clerget-Darpoux F (1993) Investigation of the HLA com-ponent involved in rheumatoid arthritis (RA) by using themarker association–segregation x2 (MASC) method: rejec-tion of the unifying-shared-epitope hypothesis. Am J HumGenet 53:715–721
Francis DA, Thompson AJ, Brookes P, Davey N, Lechler RI,McDonald WI, Batchelor JR (1991) Multpile sclerosis andHLA: is the susceptibility gene really HLA-DR or -DQ? HumImmunol 32:119–124
Gill TJ III (1992) Influence of MHC and MHC-linked geneson reproduction. Am J Hum Genet 50:1–5
——— (1997a) Genetic factors in reproduction and their ev-olutionary significance. Am J Reprod Immunol 37:7–16
——— (1997b) Genetics of reproduction and its role in ev-olution. Periodicum Biologorum 99:289–294
Hedrick PW, Black FL (1997) HLA and mate selection: noevidence in South Amerindians. Am J Hum Genet 61:505–511
Ho H-N, Yang Y-S, Hsieh R-P, Lin H-R, Chen, S-U, Chen H-F, Huang S-C, et al (1994) Sharing of human leukocyte an-tigens in couples with unexplained infertility affects the suc-cess of in vitro fertilization and tubal embryo transfer. AmJ Obstet Gynecol 170:63–71
Jin K, Ho H-N, Speed TP, Gill TJ III (1995) Reproductive
986 Letters to the Editor
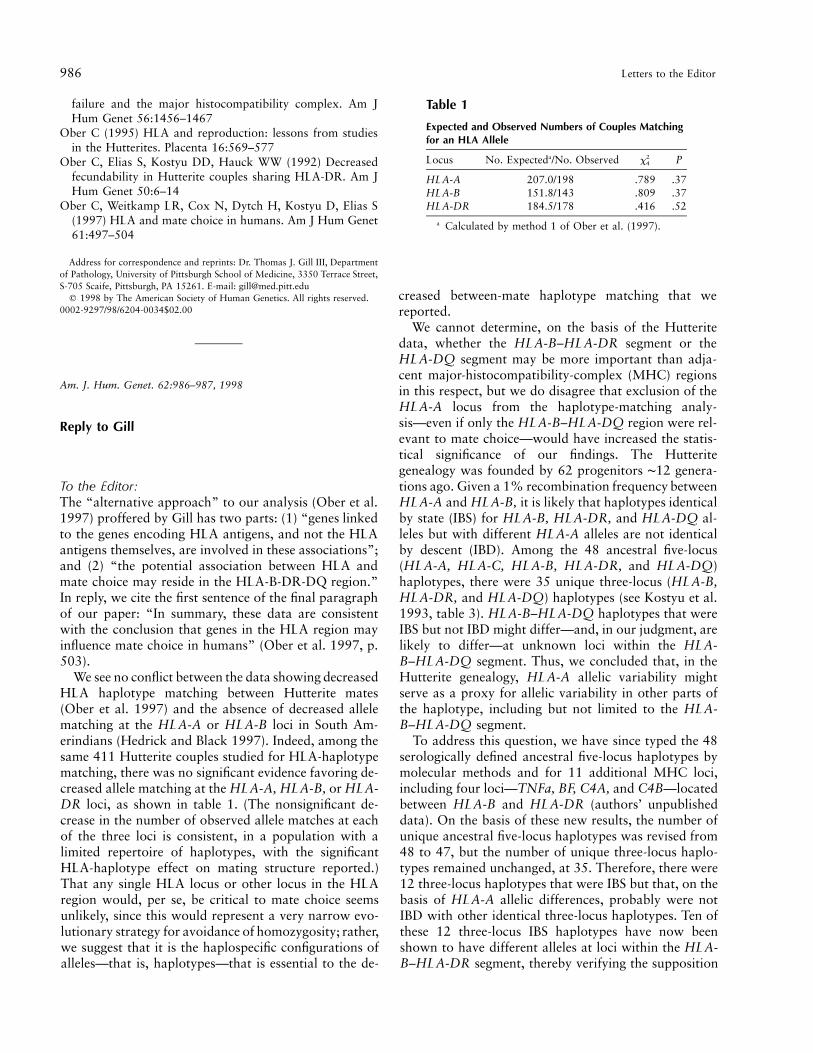
Table 1
Expected and Observed Numbers of Couples Matchingfor an HLA Allele
Locus No. Expecteda/No. Observed 2x4 P
HLA-A 207.0/198 .789 .37HLA-B 151.8/143 .809 .37HLA-DR 184.5/178 .416 .52
a Calculated by method 1 of Ober et al. (1997).
failure and the major histocompatibility complex. Am JHum Genet 56:1456–1467
Ober C (1995) HLA and reproduction: lessons from studiesin the Hutterites. Placenta 16:569–577
Ober C, Elias S, Kostyu DD, Hauck WW (1992) Decreasedfecundability in Hutterite couples sharing HLA-DR. Am JHum Genet 50:6–14
Ober C, Weitkamp LR, Cox N, Dytch H, Kostyu D, Elias S(1997) HLA and mate choice in humans. Am J Hum Genet61:497–504
Address for correspondence and reprints: Dr. Thomas J. Gill III, Departmentof Pathology, University of Pittsburgh School of Medicine, 3350 Terrace Street,S-705 Scaife, Pittsburgh, PA 15261. E-mail: [email protected]
q 1998 by The American Society of Human Genetics. All rights reserved.0002-9297/98/6204-0034$02.00
Am. J. Hum. Genet. 62:986–987, 1998
Reply to Gill
To the Editor:The “alternative approach” to our analysis (Ober et al.1997) proffered by Gill has two parts: (1) “genes linkedto the genes encoding HLA antigens, and not the HLAantigens themselves, are involved in these associations”;and (2) “the potential association between HLA andmate choice may reside in the HLA-B-DR-DQ region.”In reply, we cite the first sentence of the final paragraphof our paper: “In summary, these data are consistentwith the conclusion that genes in the HLA region mayinfluence mate choice in humans” (Ober et al. 1997, p.503).
We see no conflict between the data showing decreasedHLA haplotype matching between Hutterite mates(Ober et al. 1997) and the absence of decreased allelematching at the HLA-A or HLA-B loci in South Am-erindians (Hedrick and Black 1997). Indeed, among thesame 411 Hutterite couples studied for HLA-haplotypematching, there was no significant evidence favoring de-creased allele matching at the HLA-A, HLA-B, or HLA-DR loci, as shown in table 1. (The nonsignificant de-crease in the number of observed allele matches at eachof the three loci is consistent, in a population with alimited repertoire of haplotypes, with the significantHLA-haplotype effect on mating structure reported.)That any single HLA locus or other locus in the HLAregion would, per se, be critical to mate choice seemsunlikely, since this would represent a very narrow evo-lutionary strategy for avoidance of homozygosity; rather,we suggest that it is the haplospecific configurations ofalleles—that is, haplotypes—that is essential to the de-
creased between-mate haplotype matching that wereported.
We cannot determine, on the basis of the Hutteritedata, whether the HLA-B–HLA-DR segment or theHLA-DQ segment may be more important than adja-cent major-histocompatibility-complex (MHC) regionsin this respect, but we do disagree that exclusion of theHLA-A locus from the haplotype-matching analy-sis—even if only the HLA-B–HLA-DQ region were rel-evant to mate choice—would have increased the statis-tical significance of our findings. The Hutteritegenealogy was founded by 62 progenitors ∼12 genera-tions ago. Given a 1% recombination frequency betweenHLA-A and HLA-B, it is likely that haplotypes identicalby state (IBS) for HLA-B, HLA-DR, and HLA-DQ al-leles but with different HLA-A alleles are not identicalby descent (IBD). Among the 48 ancestral five-locus(HLA-A, HLA-C, HLA-B, HLA-DR, and HLA-DQ)haplotypes, there were 35 unique three-locus (HLA-B,HLA-DR, and HLA-DQ) haplotypes (see Kostyu et al.1993, table 3). HLA-B–HLA-DQ haplotypes that wereIBS but not IBD might differ—and, in our judgment, arelikely to differ—at unknown loci within the HLA-B–HLA-DQ segment. Thus, we concluded that, in theHutterite genealogy, HLA-A allelic variability mightserve as a proxy for allelic variability in other parts ofthe haplotype, including but not limited to the HLA-B–HLA-DQ segment.
To address this question, we have since typed the 48serologically defined ancestral five-locus haplotypes bymolecular methods and for 11 additional MHC loci,including four loci—TNFa, BF, C4A, and C4B—locatedbetween HLA-B and HLA-DR (authors’ unpublisheddata). On the basis of these new results, the number ofunique ancestral five-locus haplotypes was revised from48 to 47, but the number of unique three-locus haplo-types remained unchanged, at 35. Therefore, there were12 three-locus haplotypes that were IBS but that, on thebasis of HLA-A allelic differences, probably were notIBD with other identical three-locus haplotypes. Ten ofthese 12 three-locus IBS haplotypes have now beenshown to have different alleles at loci within the HLA-B–HLA-DR segment, thereby verifying the supposition
Letters to the Editor 987
that the HLA-A locus was indeed a good proxy for var-iability within the HLA-B–HLA-DQ segment. In ad-dition, 3 of the 47 five-locus IBS haplotypes were shownto be distinguishable by typing for loci within the HLA-B–HLA-DQ segment. Another 2 of the 47 IBS haplo-types were split by typing for HLA-G (telomeric toHLA-A) and for LMP7, TAP1, LMP2, and HLA-DPB1(centromeric to HLA-DQ). The newly refined haplotypedata continue to show decreased HLA haplotype match-ing between spouses, providing, in the context of nosignificant decrease in allele matching at HLA-A, HLA-B, or HLA-DR, support for the argument that it is thehaplospecific configuration of alleles at all (or at leastmany) of the loci in the MHC region, not allelic differ-ences at individual HLA loci, that is important.
LOWELL R. WEITKAMP1 AND CAROLE OBER2
1Department of Psychiatry and Division of Genetics,University of Rochester Medical Center, Rochester,NY; and 2Center for Medical Genetics, Department ofObstetrics and Gynecology, The University ofChicago, Chicago
References
Hedrick PW, Black FL (1997) HLA and mate selection: noevidence in South Amerindians. Am J Hum Genet 61:505–511
Kostyu DD, Dawson DV, Elias S, Ober C (1993) Deficit ofHLA homozygotes in a Caucasian isolate. Hum Immunol37:135–142
Ober C, Weitkamp LR, Cox N, Dytch H, Kostyu D, Elias S(1997) HLA and mate choice in humans. Am J Hum Genet61:497–504
Address for correspondence and reprints: Dr. Lowell R. Weitkamp, Divisionof Genetics, Box 641, University of Rochester Medical Center, 601 ElmwoodAvenue, Rochester, NY 14642. E-mail: [email protected]
q 1998 by The American Society of Human Genetics. All rights reserved.0002-9297/98/6204-0035$02.00
Am. J. Hum. Genet. 62:987–991, 1998
A Locus for Autosomal Recessive Hypodontia withAssociated Dental Anomalies Maps to Chromosome16q12.1
To the Editor:Hypodontia is characterized by the congenital absenceof one or more teeth and may include deciduous and/or permanent dentition. The permanent teeth most fre-quently missing are second premolars, maxillary lateralincisors, and third premolars (Schulze 1970). Congeni-tally missing deciduous teeth are uncommon, but, when
occurring, usually involve the maxillary lateral incisors,mandibular lateral incisors, and mandibular cuspids(Grahnen and Granath 1961). Segregation analyses inmany family studies have suggested that hypodontia isa single-gene defect, often transmitted as an autosomaldominant trait with incomplete penetrance and variableexpressivity (Burzynski and Escobar 1983; Svinhufud etal. 1988). In this study, we report a consanguineous kin-dred from Pakistan, with hypodontia associated withvarious dental anomalies, transmitted as an autosomalrecessive trait. Clinical investigation of the affected fam-ily members demonstrated hypodontia associated withdental anomalies such as malformation, enamel hypo-plasia, and failure of eruption of teeth, leading prema-turely to the edentulous state. To localize the gene re-sponsible for the disease, we performed genomewidescreening with a panel of 386 markers spaced at 10-cMintervals. We demonstrated linkage to a 10-cM regionon chromosome 16q12.1, with a maximum two-pointLOD score of 5.76 for marker D16S3140.
Tooth development begins as an epithelial bud, whichundergoes complex morphogenesis and is regulated byinteractions between the epithelial and mesenchymal tis-sue layers. The first step in tooth development is themigration of mesenchymal cells from the neural crestinto the tooth-forming zone of the vertebrate jaw, knownas the “maxillary and mandibular arches.” When themesenchymal cells arrive, they induce the overlying den-tal epithelium to thicken, forming the dental lamina. Theepithelium subsequently invaginates into the mesen-chyme to form the dental organ, around which the mes-enchyme then proliferates and condenses into the dentalpapilla. Together, the dental organ and the dental papillaform the tooth germ (also known as the “tooth organ”;Thesleff 1996; Lewin 1997). Secreted signaling mole-cules that transmit the sequential and reciprocal induc-tive interactions between the epithelium and mesen-chyme have been identified, and transcription factorsthat are needed for the signaling cascades (Thesleff1996), such as the homeobox genes (MSX) 1 and 2, theepidermal growth factor (EGF) and its receptor (EGFR),and transforming growth factor (TGF) B1 (Vainio et al.1993), are now known. Recent studies (Vaahtokari etal. 1996a, 1996b) have demonstrated that the enamelknot, the transient cluster of epithelial cells in the centerof the developing tooth germ, may represent a majorsignaling center regulating tooth-shape development byexpressing growth factors such as bone morphogeneticproteins (BMP) 2, 4, and 7, sonic hedgehog, and fibro-blast growth factor 4. Yet, despite a large body of sci-entific investigation, only one mutation in a single gene,MSX1, has been identified, in one family with an au-tosomal dominant form of hypodontia (Vastardis et al.1996).
To search for the gene defect in hypodontia, we stud-
988 Letters to the Editor
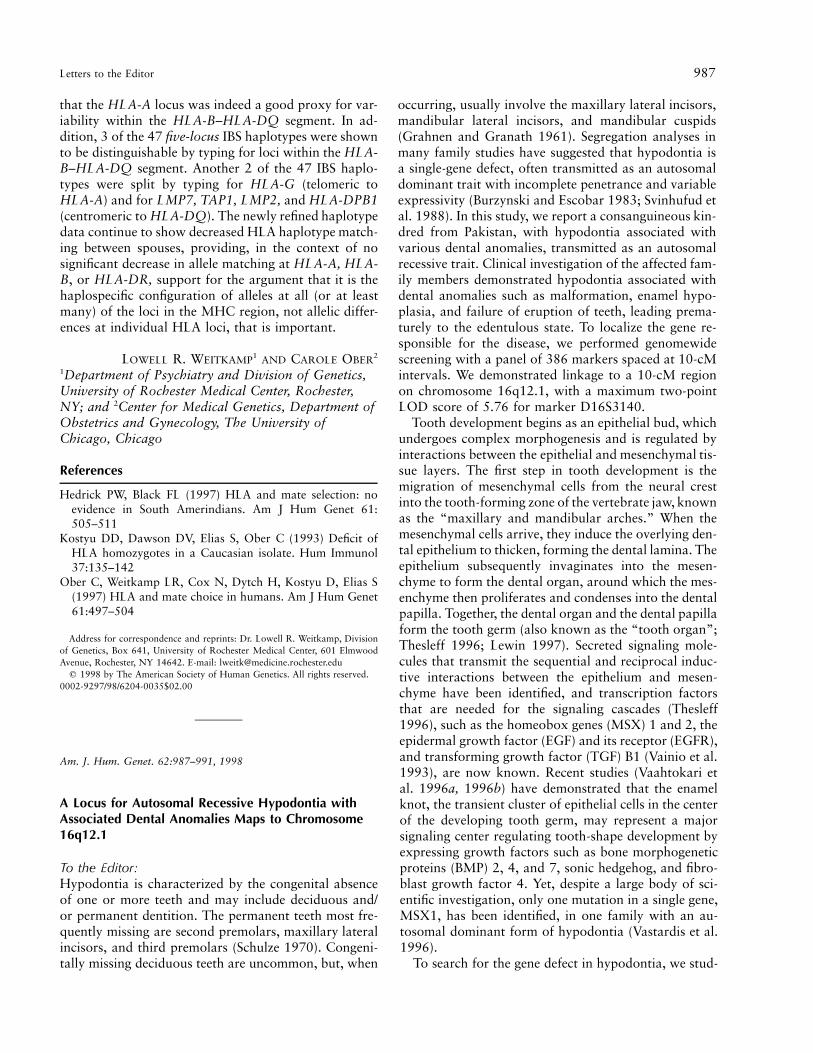
Figure 1 Pedigree showing disease-associated haplotypes. Blackened circles and squares represent affected females and males, respectively,and symbols with a central black dot represent obligate heterozygotes. The disease-associated haplotype is highlighted by a grey-shaded boxbeneath each symbol. Recombination events are indicated by an arrow adjacent to the haplotype, for individuals IV-18 and IV-19. The markerorder is indicated in the inset (bottom right).
ied a single highly consanguineous family with an au-tosomal recessive form of hypodontia and other dentalanomalies (fig. 1). The family described in this reportresides in Sind, Pakistan. The family members rarelymarry outside the family, and consequently consanguin-eous unions are common. The pedigree was drawn byinterviewing the elders of the family. Information waschecked and rechecked by interviewing different per-sons. Living affected and unaffected subjects were clin-ically examined at Abbassi Shaheed Hospital, Karachi,Pakistan, and blood samples were collected, with in-formed consent, at the local hospital. Clinical status wasbased on dental history, intraoral examination, and pan-oramic radiographs. Dental examinations of the affectedsubjects in our family demonstrated a range of dentalanomalies involving several maxillary and mandibularteeth. The main clinical problems encountered were de-lays in the formation and eruption of the teeth (fig. 2).
The skin, hair, nails, and sweat glands were normal, andno evidence for an ectodermal dysplasia was observed.The pedigree (fig. 1) provided convincing evidence foran autosomal recessive mode of inheritance, and con-sanguineous loops accounted for all the affected personsbeing homozygous for the mutant allele. To elucidatethe gene defect in the family, we initially searchedfor linkage by using polymorphic markers withinseveral candidate genes—including MSX1 (4p16),MSX2 (5q34–35), EGF (4q25–27), and EGFR(7p12–14)—previously reported to be involved in earlytooth morphogenesis (Partanen et al. 1985; Kronmilleret al. 1991; Mackenzie et al. 1991, 1992). When linkageto these candidate genes was excluded, we undertook agenomewide search.
An initial genomewide screen with microsatellitemarkers evenly spaced at 10-cM intervals was conductedby use of the DNA from three of the affected individuals
Letters to the Editor 989
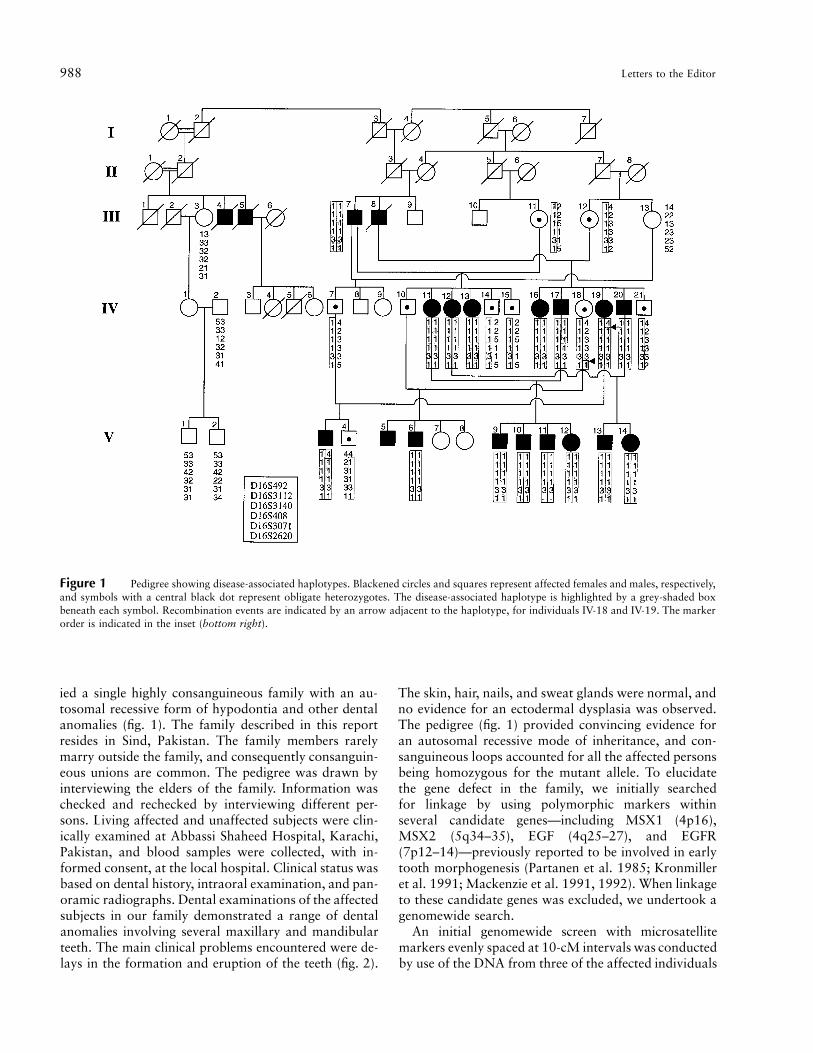
Figure 2 A, Subject V-9, a 15-year-old male, showing mixed dentition, with the first permanent molars, maxillary central incisors, andmandibular right cuspid erupted. In addition, the maxillary right lateral incisor and canine and the mandibular incisors and left canine fromprimary dentition were present. Maxillary central incisors had erupted only halfway and were widely spaced. The mucosa and other oralstructures appeared normal in color and texture. B, Panoramic radiograph showing a number of unerupted teeth, including the maxillary lateralincisors, cuspids, bicuspids, and second molars and the mandibular left cuspid and bicuspids, right bicuspids, and second molars. All teeth,representing various stages of development, were malpositioned and malformed, showing only crown formation. Maxillary and mandibularlast molars and left second molars were completely missing. Of the teeth that had erupted, the maxillary central incisors had open apices withwide pulp chambers and a loss of distinction between the chamber and the canal. The erupted maxillary and mandibular permanent molarshad tapering cone-shaped fused roots curved toward the apices, and their pulp chambers and canals were wide, merging together, with loss ofdetail. C, Subject V-10, a 14-year-old male, showing the presence of maxillary central incisors and first molars and of mandibular incisors andfirst molars. The only deciduous tooth present was the maxillary right canine. D, Panoramic radiograph showing the presence of a number ofunerupted teeth, including the maxillary lateral incisors, cuspids, bicuspids, and second molars and the mandibular cuspids, bicuspids, andsecond molars. The widely spaced maxillary central incisors had wide pulp chambers and canals with open apices. The pulp canals of themandibular incisors were distorted, with complete loss of detail. All permanent first molars had fused roots and open apices and showed littledistinction between the pulp chamber and the canal. E, Upper jaw of subject IV-17, a 38-year-old male, containing only six teeth, includingthe central incisors, canines, right second bicuspid, and right first molar with roots visible above the mucosal level. The lower jaw showed onlynine erupted teeth, including the central incisors, right lateral incisor, right cuspid, both second bicuspids, and first molars. F, Panoramicradiograph showing a few malformed unerupted teeth, which might have corresponded to the maxillary left bicuspids, mandibular right andleft canines, and left first bicuspid.
990 Letters to the Editor
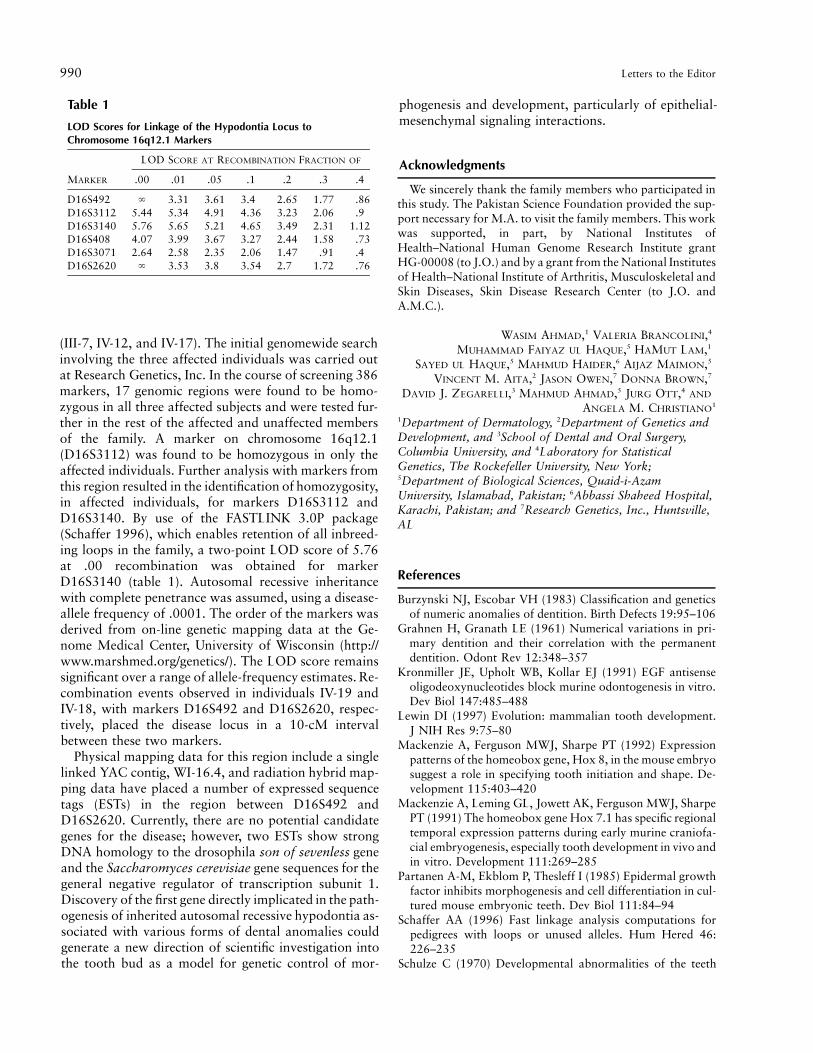
Table 1
LOD Scores for Linkage of the Hypodontia Locus toChromosome 16q12.1 Markers
MARKER
LOD SCORE AT RECOMBINATION FRACTION OF
.00 .01 .05 .1 .2 .3 .4
D16S492 ` 3.31 3.61 3.4 2.65 1.77 .86D16S3112 5.44 5.34 4.91 4.36 3.23 2.06 .9D16S3140 5.76 5.65 5.21 4.65 3.49 2.31 1.12D16S408 4.07 3.99 3.67 3.27 2.44 1.58 .73D16S3071 2.64 2.58 2.35 2.06 1.47 .91 .4D16S2620 ` 3.53 3.8 3.54 2.7 1.72 .76
(III-7, IV-12, and IV-17). The initial genomewide searchinvolving the three affected individuals was carried outat Research Genetics, Inc. In the course of screening 386markers, 17 genomic regions were found to be homo-zygous in all three affected subjects and were tested fur-ther in the rest of the affected and unaffected membersof the family. A marker on chromosome 16q12.1(D16S3112) was found to be homozygous in only theaffected individuals. Further analysis with markers fromthis region resulted in the identification of homozygosity,in affected individuals, for markers D16S3112 andD16S3140. By use of the FASTLINK 3.0P package(Schaffer 1996), which enables retention of all inbreed-ing loops in the family, a two-point LOD score of 5.76at .00 recombination was obtained for markerD16S3140 (table 1). Autosomal recessive inheritancewith complete penetrance was assumed, using a disease-allele frequency of .0001. The order of the markers wasderived from on-line genetic mapping data at the Ge-nome Medical Center, University of Wisconsin (http://www.marshmed.org/genetics/). The LOD score remainssignificant over a range of allele-frequency estimates. Re-combination events observed in individuals IV-19 andIV-18, with markers D16S492 and D16S2620, respec-tively, placed the disease locus in a 10-cM intervalbetween these two markers.
Physical mapping data for this region include a singlelinked YAC contig, WI-16.4, and radiation hybrid map-ping data have placed a number of expressed sequencetags (ESTs) in the region between D16S492 andD16S2620. Currently, there are no potential candidategenes for the disease; however, two ESTs show strongDNA homology to the drosophila son of sevenless geneand the Saccharomyces cerevisiae gene sequences for thegeneral negative regulator of transcription subunit 1.Discovery of the first gene directly implicated in the path-ogenesis of inherited autosomal recessive hypodontia as-sociated with various forms of dental anomalies couldgenerate a new direction of scientific investigation intothe tooth bud as a model for genetic control of mor-
phogenesis and development, particularly of epithelial-mesenchymal signaling interactions.
Acknowledgments
We sincerely thank the family members who participated inthis study. The Pakistan Science Foundation provided the sup-port necessary for M.A. to visit the family members. This workwas supported, in part, by National Institutes ofHealth–National Human Genome Research Institute grantHG-00008 (to J.O.) and by a grant from the National Institutesof Health–National Institute of Arthritis, Musculoskeletal andSkin Diseases, Skin Disease Research Center (to J.O. andA.M.C.).
WASIM AHMAD,1 VALERIA BRANCOLINI,4
MUHAMMAD FAIYAZ UL HAQUE,5 HAMUT LAM,1
SAYED UL HAQUE,5 MAHMUD HAIDER,6 AIJAZ MAIMON,5
VINCENT M. AITA,2 JASON OWEN,7 DONNA BROWN,7
DAVID J. ZEGARELLI,3 MAHMUD AHMAD,5 JURG OTT,4 AND
ANGELA M. CHRISTIANO1
1Department of Dermatology, 2Department of Genetics andDevelopment, and 3School of Dental and Oral Surgery,Columbia University, and 4Laboratory for StatisticalGenetics, The Rockefeller University, New York;5Department of Biological Sciences, Quaid-i-AzamUniversity, Islamabad, Pakistan; 6Abbassi Shaheed Hospital,Karachi, Pakistan; and 7Research Genetics, Inc., Huntsville,AL
References
Burzynski NJ, Escobar VH (1983) Classification and geneticsof numeric anomalies of dentition. Birth Defects 19:95–106
Grahnen H, Granath LE (1961) Numerical variations in pri-mary dentition and their correlation with the permanentdentition. Odont Rev 12:348–357
Kronmiller JE, Upholt WB, Kollar EJ (1991) EGF antisenseoligodeoxynucleotides block murine odontogenesis in vitro.Dev Biol 147:485–488
Lewin DI (1997) Evolution: mammalian tooth development.J NIH Res 9:75–80
Mackenzie A, Ferguson MWJ, Sharpe PT (1992) Expressionpatterns of the homeobox gene, Hox 8, in the mouse embryosuggest a role in specifying tooth initiation and shape. De-velopment 115:403–420
Mackenzie A, Leming GL, Jowett AK, Ferguson MWJ, SharpePT (1991) The homeobox gene Hox 7.1 has specific regionaltemporal expression patterns during early murine craniofa-cial embryogenesis, especially tooth development in vivo andin vitro. Development 111:269–285
Partanen A-M, Ekblom P, Thesleff I (1985) Epidermal growthfactor inhibits morphogenesis and cell differentiation in cul-tured mouse embryonic teeth. Dev Biol 111:84–94
Schaffer AA (1996) Fast linkage analysis computations forpedigrees with loops or unused alleles. Hum Hered 46:226–235
Schulze C (1970) Developmental abnormalities of the teeth
Letters to the Editor 991
and jaws. In: Gorlin RJ, Goldman HM (eds) Thoma’s oralpathology. CV Mosby, St Louis, pp 96–183
Svinhufvud E, Myllarniemi S, Norio R (1988) Dominant in-heritance of tooth malpositions and their association to hy-podontia. Clin Genet 34:373–381
Thesleff I (1996) Two genes for missing teeth. Nat Genet 13:379–380
Vaahtokari A, Aberg T, Jernvall J, Keranen S, Thesleff I(1996a) The enamel knot as a signaling center in the de-veloping mouse tooth. Mech Dev 54:39–43
Vaahtokari A, Aberg T, Thesleff I (1996b) Apoptosis in thedeveloping tooth: association with an embryonic signalingcenter and suppression by EGF and FGF-4. Development122:121–129
Vainio S, Karavanova I, Jowett A, Thesleff I (1993) Identifi-cation of BMP-4 as a signal mediating secondary inductionbetween epithelial and mesenchymal tissues during earlytooth development. Cell 75:45–58
Vastardis H, Karimbux N, Guthua SW, Seidman JG, SeidmanCE (1996) A human MSX1 homeodomain missense muta-tion causes selective tooth agenesis. Nat Genet 13:417–421
Address for correspondence and reprints: Dr. Angela M. Christiano, Depart-ment of Dermatology, Columbia University, College of Physicians and Surgeons,630 West 168th Street VC15-1526, New York, NY, 10032. E-mail:[email protected]
q 1998 by The American Society of Human Genetics. All rights reserved.0002-9297/98/6204-0036$02.00
Am. J. Hum. Genet. 62:991–994, 1998
The African Origin of the Common Mutation inAfrican American Patients with Glycogen-StorageDisease Type II
To the Editor:Conventional historiographical research provides abun-dant evidence of the African roots of African Americanpopulations, but, because of the absence of completedocumentary records—for example, the point of em-barkation of a particular slave vessel does not necessarilyindicate who was actually on that vessel, and slave car-goes tended to be composed of mixed populations—itremains a frustrating task to identify exactly who wastransported to the Americas (Curtin 1969; Parish 1989;Thornton 1992). The presence of a genetic marker inan African American population, however, might furnisha verifiable link, for the individuals who carry the trait,to a specific tribe or even to a point of origin.
In the autosomal recessive disorder glycogen-storagedisease type II (GSD II [MIM 232300]), a deficiency ofacid maltase (GAA; acid a-glucosidase) leads to the path-ological accumulation of glycogen in lysosomes. In itsmost severe form, progressive cardiomyopathy causes
cardiorespiratory failure and death within the 1st yearof life (Pompe syndrome). Among the mutations iden-tified (see Lin and Shieh 1995; Raben et al. 1995; Tsun-oda et al. 1996; Adams et al. 1997; reviewed by Reuseret al. 1995; Hirschhorn and Huie 1997), three that leadto the total loss of enzyme activity occur frequently inparticular ethnic groups: deletion of exon 18 in Cau-casians (Boerkoel et al. 1992; Huie et al. 1994a; Vander Kraan et al. 1994; Kroos et al. 1995), deletion ofT525 in northern Europeans (Hermans et al. 1994;Kroos et al. 1995), and D645E in Chinese patients fromTaiwan (Shieh et al. 1994; Lin and Shieh 1996). Thechance to study several affected infants of African par-ents has permitted us to identify a common African mu-tation, to confirm our previous suggestion that the mu-tation is also common in African Americans (Adams etal. 1997), and, thereby, to explore the molecular rootsof GSD II in African Americans.
We initially studied a 3-mo-old infant (patient 1), fromthe Ivory Coast, of healthy, nonconsanguineous parents;the mother is Mandingo, and the father is Guere (table1). The patient is a compound heterozygote harboringa previously described C2560T transition in exon 18(Hermans et al. 1993a; Adams et al. 1997) and a novelT2846A transversion in exon 20. An unusual feature ofthe novel exon 20 mutation (V949D) is its localizationat the carboxy terminus of the 952 amino acid precursor,the tail that is removed during processing into matureforms (Wisselaar et al. 1993). Expression studies showedthat the mutation results in complete inactivation of theenzyme: catalytic activity of the mutant protein in trans-fected COS cells did not exceed the background lev-els—778, 30, and 26 nmol 4-4-methylumbelliferone/h/mg cell protein for the wild-type, mutant, and mock-transfected cells, respectively. The mature protein wasnot detected by western analysis, thereby adequately ex-plaining the absence of enzyme activity in this allele (datanot shown). Apparently, the mutation results in a deg-radation of the precursor molecules prior to processingand maturation.
The paternally inherited nonsense mutation in exon18 (R854X), which resides on a silent allele, had beenpreviously described in a compound-heterozygous adultAfrican American patient (cell line GM 01935) (Her-mans et al. 1993a) and in a half–African American (Af-rican American father and Caucasian mother) child (pa-tient 6) with the juvenile form of the disease (table 1).The data thus strongly pointed to an African origin ofthe R854X mutation in the African Americans andprompted us to look for more patients of a similar back-ground. Two other infants born of western African par-ents were available for study. The R854X mutation waspresent on one allele of a 2-mo-old infant (patient 2) ofhealthy, nonconsanguineous parents who were of Hausaorigin. One parent was from the province of Katsina,
992 Letters to the Editor
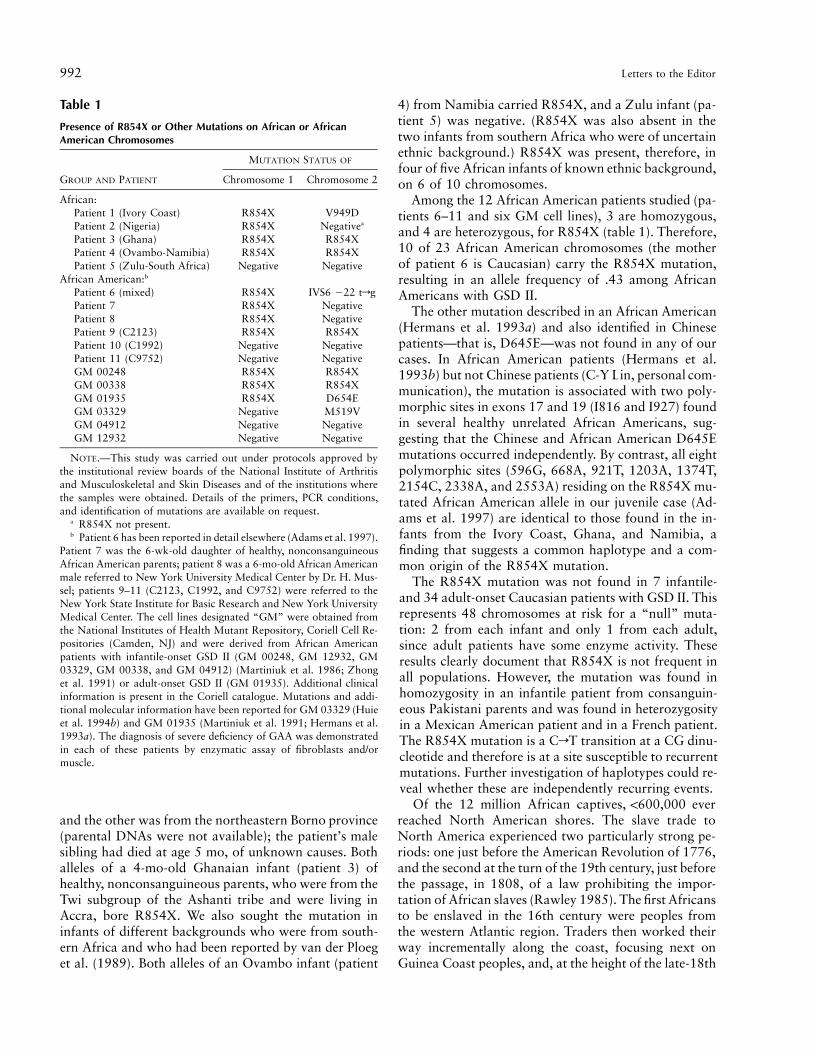
Table 1
Presence of R854X or Other Mutations on African or AfricanAmerican Chromosomes
GROUP AND PATIENT
MUTATION STATUS OF
Chromosome 1 Chromosome 2
African:Patient 1 (Ivory Coast) R854X V949DPatient 2 (Nigeria) R854X Negativea
Patient 3 (Ghana) R854X R854XPatient 4 (Ovambo-Namibia) R854X R854XPatient 5 (Zulu-South Africa) Negative Negative
African American:b
Patient 6 (mixed) R854X IVS6 222 trgPatient 7 R854X NegativePatient 8 R854X NegativePatient 9 (C2123) R854X R854XPatient 10 (C1992) Negative NegativePatient 11 (C9752) Negative NegativeGM 00248 R854X R854XGM 00338 R854X R854XGM 01935 R854X D654EGM 03329 Negative M519VGM 04912 Negative NegativeGM 12932 Negative Negative
NOTE.—This study was carried out under protocols approved bythe institutional review boards of the National Institute of Arthritisand Musculoskeletal and Skin Diseases and of the institutions wherethe samples were obtained. Details of the primers, PCR conditions,and identification of mutations are available on request.
a R854X not present.b Patient 6 has been reported in detail elsewhere (Adams et al. 1997).
Patient 7 was the 6-wk-old daughter of healthy, nonconsanguineousAfrican American parents; patient 8 was a 6-mo-old African Americanmale referred to New York University Medical Center by Dr. H. Mus-sel; patients 9–11 (C2123, C1992, and C9752) were referred to theNew York State Institute for Basic Research and New York UniversityMedical Center. The cell lines designated “GM” were obtained fromthe National Institutes of Health Mutant Repository, Coriell Cell Re-positories (Camden, NJ) and were derived from African Americanpatients with infantile-onset GSD II (GM 00248, GM 12932, GM03329, GM 00338, and GM 04912) (Martiniuk et al. 1986; Zhonget al. 1991) or adult-onset GSD II (GM 01935). Additional clinicalinformation is present in the Coriell catalogue. Mutations and addi-tional molecular information have been reported for GM 03329 (Huieet al. 1994b) and GM 01935 (Martiniuk et al. 1991; Hermans et al.1993a). The diagnosis of severe deficiency of GAA was demonstratedin each of these patients by enzymatic assay of fibroblasts and/ormuscle.
and the other was from the northeastern Borno province(parental DNAs were not available); the patient’s malesibling had died at age 5 mo, of unknown causes. Bothalleles of a 4-mo-old Ghanaian infant (patient 3) ofhealthy, nonconsanguineous parents, who were from theTwi subgroup of the Ashanti tribe and were living inAccra, bore R854X. We also sought the mutation ininfants of different backgrounds who were from south-ern Africa and who had been reported by van der Ploeget al. (1989). Both alleles of an Ovambo infant (patient
4) from Namibia carried R854X, and a Zulu infant (pa-tient 5) was negative. (R854X was also absent in thetwo infants from southern Africa who were of uncertainethnic background.) R854X was present, therefore, infour of five African infants of known ethnic background,on 6 of 10 chromosomes.
Among the 12 African American patients studied (pa-tients 6–11 and six GM cell lines), 3 are homozygous,and 4 are heterozygous, for R854X (table 1). Therefore,10 of 23 African American chromosomes (the motherof patient 6 is Caucasian) carry the R854X mutation,resulting in an allele frequency of .43 among AfricanAmericans with GSD II.
The other mutation described in an African American(Hermans et al. 1993a) and also identified in Chinesepatients—that is, D645E—was not found in any of ourcases. In African American patients (Hermans et al.1993b) but not Chinese patients (C-Y Lin, personal com-munication), the mutation is associated with two poly-morphic sites in exons 17 and 19 (I816 and I927) foundin several healthy unrelated African Americans, sug-gesting that the Chinese and African American D645Emutations occurred independently. By contrast, all eightpolymorphic sites (596G, 668A, 921T, 1203A, 1374T,2154C, 2338A, and 2553A) residing on the R854X mu-tated African American allele in our juvenile case (Ad-ams et al. 1997) are identical to those found in the in-fants from the Ivory Coast, Ghana, and Namibia, afinding that suggests a common haplotype and a com-mon origin of the R854X mutation.
The R854X mutation was not found in 7 infantile-and 34 adult-onset Caucasian patients with GSD II. Thisrepresents 48 chromosomes at risk for a “null” muta-tion: 2 from each infant and only 1 from each adult,since adult patients have some enzyme activity. Theseresults clearly document that R854X is not frequent inall populations. However, the mutation was found inhomozygosity in an infantile patient from consanguin-eous Pakistani parents and was found in heterozygosityin a Mexican American patient and in a French patient.The R854X mutation is a CrT transition at a CG dinu-cleotide and therefore is at a site susceptible to recurrentmutations. Further investigation of haplotypes could re-veal whether these are independently recurring events.
Of the 12 million African captives, !600,000 everreached North American shores. The slave trade toNorth America experienced two particularly strong pe-riods: one just before the American Revolution of 1776,and the second at the turn of the 19th century, just beforethe passage, in 1808, of a law prohibiting the impor-tation of African slaves (Rawley 1985). The first Africansto be enslaved in the 16th century were peoples fromthe western Atlantic region. Traders then worked theirway incrementally along the coast, focusing next onGuinea Coast peoples, and, at the height of the late-18th
Letters to the Editor 993
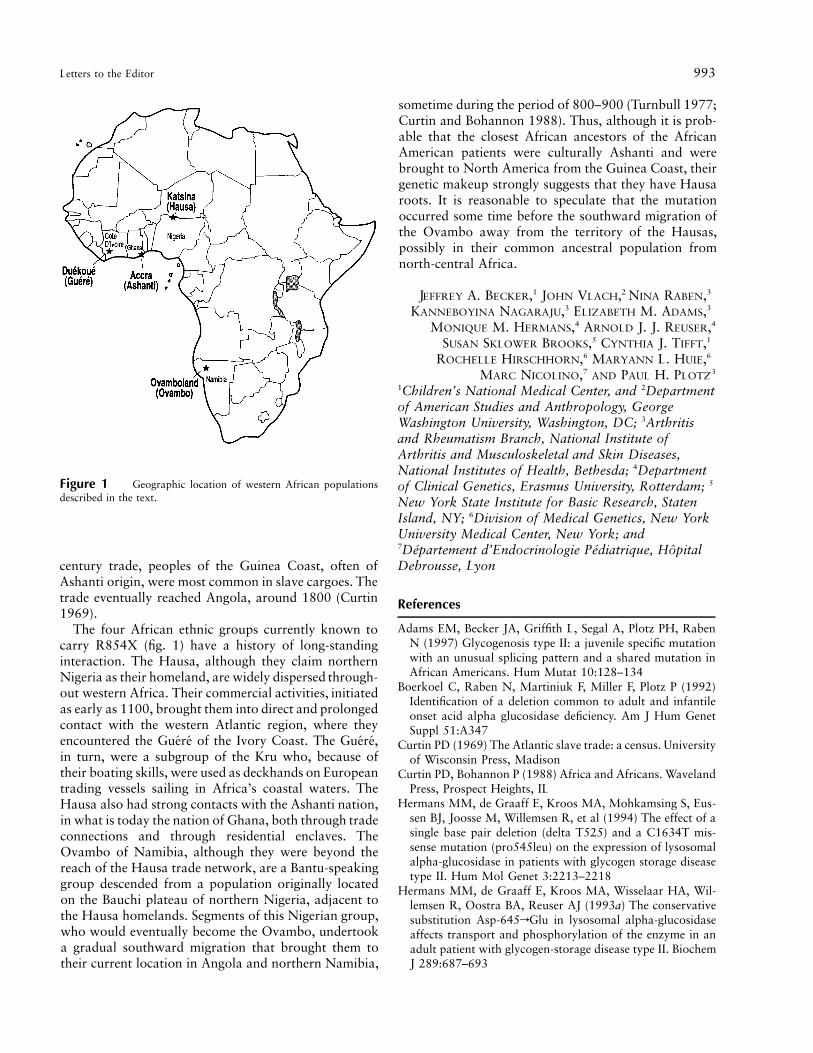
Figure 1 Geographic location of western African populationsdescribed in the text.
century trade, peoples of the Guinea Coast, often ofAshanti origin, were most common in slave cargoes. Thetrade eventually reached Angola, around 1800 (Curtin1969).
The four African ethnic groups currently known tocarry R854X (fig. 1) have a history of long-standinginteraction. The Hausa, although they claim northernNigeria as their homeland, are widely dispersed through-out western Africa. Their commercial activities, initiatedas early as 1100, brought them into direct and prolongedcontact with the western Atlantic region, where theyencountered the Guere of the Ivory Coast. The Guere,in turn, were a subgroup of the Kru who, because oftheir boating skills, were used as deckhands on Europeantrading vessels sailing in Africa’s coastal waters. TheHausa also had strong contacts with the Ashanti nation,in what is today the nation of Ghana, both through tradeconnections and through residential enclaves. TheOvambo of Namibia, although they were beyond thereach of the Hausa trade network, are a Bantu-speakinggroup descended from a population originally locatedon the Bauchi plateau of northern Nigeria, adjacent tothe Hausa homelands. Segments of this Nigerian group,who would eventually become the Ovambo, undertooka gradual southward migration that brought them totheir current location in Angola and northern Namibia,
sometime during the period of 800–900 (Turnbull 1977;Curtin and Bohannon 1988). Thus, although it is prob-able that the closest African ancestors of the AfricanAmerican patients were culturally Ashanti and werebrought to North America from the Guinea Coast, theirgenetic makeup strongly suggests that they have Hausaroots. It is reasonable to speculate that the mutationoccurred some time before the southward migration ofthe Ovambo away from the territory of the Hausas,possibly in their common ancestral population fromnorth-central Africa.
JEFFREY A. BECKER,1 JOHN VLACH,2 NINA RABEN,3
KANNEBOYINA NAGARAJU,3 ELIZABETH M. ADAMS,3
MONIQUE M. HERMANS,4 ARNOLD J. J. REUSER,4
SUSAN SKLOWER BROOKS,5 CYNTHIA J. TIFFT,1
ROCHELLE HIRSCHHORN,6 MARYANN L. HUIE,6
MARC NICOLINO,7 AND PAUL H. PLOTZ3
1Children’s National Medical Center, and 2Departmentof American Studies and Anthropology, GeorgeWashington University, Washington, DC; 3Arthritisand Rheumatism Branch, National Institute ofArthritis and Musculoskeletal and Skin Diseases,National Institutes of Health, Bethesda; 4Departmentof Clinical Genetics, Erasmus University, Rotterdam; 5
New York State Institute for Basic Research, StatenIsland, NY; 6Division of Medical Genetics, New YorkUniversity Medical Center, New York; and7Departement d’Endocrinologie Pediatrique, HopitalDebrousse, Lyon
References
Adams EM, Becker JA, Griffith L, Segal A, Plotz PH, RabenN (1997) Glycogenosis type II: a juvenile specific mutationwith an unusual splicing pattern and a shared mutation inAfrican Americans. Hum Mutat 10:128–134
Boerkoel C, Raben N, Martiniuk F, Miller F, Plotz P (1992)Identification of a deletion common to adult and infantileonset acid alpha glucosidase deficiency. Am J Hum GenetSuppl 51:A347
Curtin PD (1969) The Atlantic slave trade: a census. Universityof Wisconsin Press, Madison
Curtin PD, Bohannon P (1988) Africa and Africans. WavelandPress, Prospect Heights, IL
Hermans MM, de Graaff E, Kroos MA, Mohkamsing S, Eus-sen BJ, Joosse M, Willemsen R, et al (1994) The effect of asingle base pair deletion (delta T525) and a C1634T mis-sense mutation (pro545leu) on the expression of lysosomalalpha-glucosidase in patients with glycogen storage diseasetype II. Hum Mol Genet 3:2213–2218
Hermans MM, de Graaff E, Kroos MA, Wisselaar HA, Wil-lemsen R, Oostra BA, Reuser AJ (1993a) The conservativesubstitution Asp-645rGlu in lysosomal alpha-glucosidaseaffects transport and phosphorylation of the enzyme in anadult patient with glycogen-storage disease type II. BiochemJ 289:687–693

994 Letters to the Editor
Hermans MM, Svetkey LP, Oostra BA, Chen YT, ReuserAJ (1993b) The loss of a polymorphic glycosylation sitecaused by Thr-927rIle is linked to a second polymorphicVal-816rIle substitution in lysosomal alpha-glucosidase ofAmerican blacks. Genomics 16:300–301
Hirschhorn R, Huie ML (1997) Glycogen storage disease typeII: acid a-glucosidase (acid maltase deficiency). In: ScriverCR (ed) The metabolic and molecular basis of inherited dis-ease. McGraw-Hill, New York (CD-ROM)
Huie ML, Chen AS, Sklower Brooks S, Grix A, Hirschhorn R(1994a) A de novo 13 nt deletion, a newly identified C647Wmissense mutation and a deletion of exon 18 in infantileonset glycogen storage disease type II (GSDII). Hum MolGenet 3:1081–1087
Huie ML, Hirschhorn R, Chen AS, Martiniuk F, Zhong N(1994b) Mutation at the catalytic site (M519V) in glycogenstorage disease type II (Pompe disease). Hum Mutat 4:291–293
Kroos MA, Van der Kraan M, van Diggelen OP, Kleijer WJ,Reuser AJ, Van den Boogaard MJ, Ausems MG, et al (1995)Glycogen storage disease type II: frequency of three commonmutant alleles and their associated clinical phenotypes stud-ied in 121 patients. J Med Genet 32:836–837
Lin CY, Shieh JJ (1995) Identification of a de novo point mu-tation resulting in infantile form of Pompe’s disease.Biochem Biophys Res Commun 208:886–893
——— (1996) Molecular study on the infantile form of Pompedisease in Chinese in Taiwan. Acta Paediatr Sinica 37:115–121
Martiniuk F, Mehler M, Bodkin M, Tzall S, Hirschhorn K,Zhong N, Hirschhorn R (1991) Identification of a missensemutation in an adult-onset patient with glycogenosis typeII expressing only one allele. DNA Cell Biol 10:681–687
Martiniuk F, Mehler M, Pellicer A, Tzall S, La Badie G, HobartC, Ellenbogen A, et al (1986) Isolation of a cDNA for humanacid alpha-glucosidase and detection of genetic heteroge-neity for mRNA in three alpha-glucosidase-deficient pa-tients. Proc Natl Acad Sci USA 83:9641–9644
Parish PJ (1989) Slavery: history and historians. Harper andRow, New York
Raben N, Nichols RC, Boerkoel C, Plotz P (1995) Geneticdefects in patients with glycogenosis type II (acid maltasedeficiency). Muscle Nerve Suppl 3:S70–S74
Rawley JA (1985) The transatlantic slave trade: a history. WWNorton, New York
Reuser AJ, Kroos MA, Hermans MM, Bijvoet AG, VerbeetMP, van Diggelen OP, Kleijer WJ, et al (1995) Glycogenosistype II (acid maltase deficiency). Muscle Nerve Suppl 3:S61–S69
Shieh JJ, Wang LY, Lin CY (1994) Point mutation in Pompedisease in Chinese. J Inherit Metab Dis 17:145–148
Thornton J (1992) Africa and Africans in the making of theAtlantic world. Cambridge University Press, New York
Tsunoda H, Ohshima T, Tohyama J, Sasaki M, SakuragawaN, Martiniuk F (1996) Acid alpha-glucosidase deficiency:identification and expression of a missense mutation(S529V) in a Japanese adult phenotype. Hum Genet 97:496–499
Turnbull CM (1977) Man in Africa. Anchor Doubleday, Gar-den City, NY
Van der Kraan M, Kroos MA, Joosse M, Bijvoet AG, VerbeetMP, Kleijer WJ, Reuser AJ (1994) Deletion of exon 18 is afrequent mutation in glycogen storage disease type II.Biochem Biophys Res Commun 203:1535–1541
Van der Ploeg AT, Hoefsloot LH, Hoogeveen-Westerveld M,Petersen EM, Reuser AJ (1989) Glycogenosis type II: proteinand DNA analysis in five South African families from var-ious ethnic origins. Am J Hum Genet 44:787–793
Wisselaar HA, Kroos M, Hermans MM, van Beeumen J, Reu-ser AJ (1993) Structural and functional changes of lysosomalacid alpha-glucosidase during intracellular transport andmaturation. J Biol Chem 268:2223–2231
Zhong N, Martiniuk F, Tzall S, Hirschhorn R (1991) Identi-fication of a missense mutation in one allele of a patientwith Pompe disease, and use of endonuclease digestion ofPCR-amplified RNA to demonstrate lack of mRNA expres-sion from the second allele. Am J Hum Genet 49:635–645
Address for correspondence and reprints: Dr. Paul H. Plotz, Arthritis andRheumatism Branch, National Institute of Arthritis and Musculoskeletal andSkin Diseases, National Institutes of Health, Bethesda, MD 20892-1820. E-mail:[email protected]
q 1998 by The American Society of Human Genetics. All rights reserved.0002-9297/98/6204-0037$02.00
Am. J. Hum. Genet. 62:994–996, 1998
Linkage Thresholds for Two-stage Genome Scans
To the Editor:Two-stage genome scans are a common design in linkagestudies. In the first stage, genotypes are generated for astandard set of ∼300 microsatellite markers, and linkageanalysis is carried out. In the second stage, any inter-esting “regions” (or “hits”) that were found during thefirst stage are followed with a much denser map of mark-ers to extract all available linkage information.
How should the statistical significance of the final re-sults be determined? We have argued elsewhere thatthresholds computed for a dense map of markers cov-ering the entire genome should be applied (Lander andKruglyak 1995). The logic behind this recommendationis simple. False-positive peaks that would have been de-tected with a dense whole-genome map almost alwayscome up as hits in the initial stage of a two-stage scan.The reason for this is that the marker density for theinitial stage is specifically chosen to detect peaks of mod-erate size (whether real or false positive). Since these hitsare then followed up with a dense map, the final resultsare virtually the same as if a dense whole-genome maphad been used at the outset.
Recently, Sawcer et al. (1997) challenged this rec-ommendation. They carried out simulations to deter-mine the significance of results obtained in a genome
Letters to the Editor 995
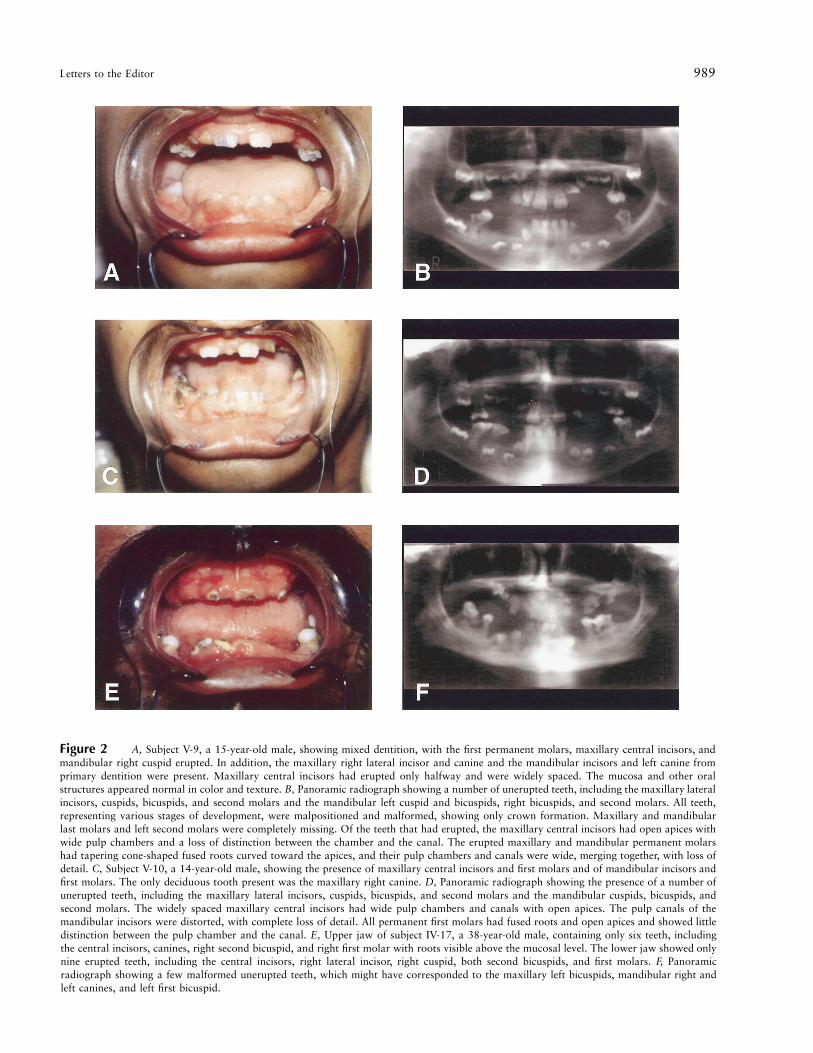
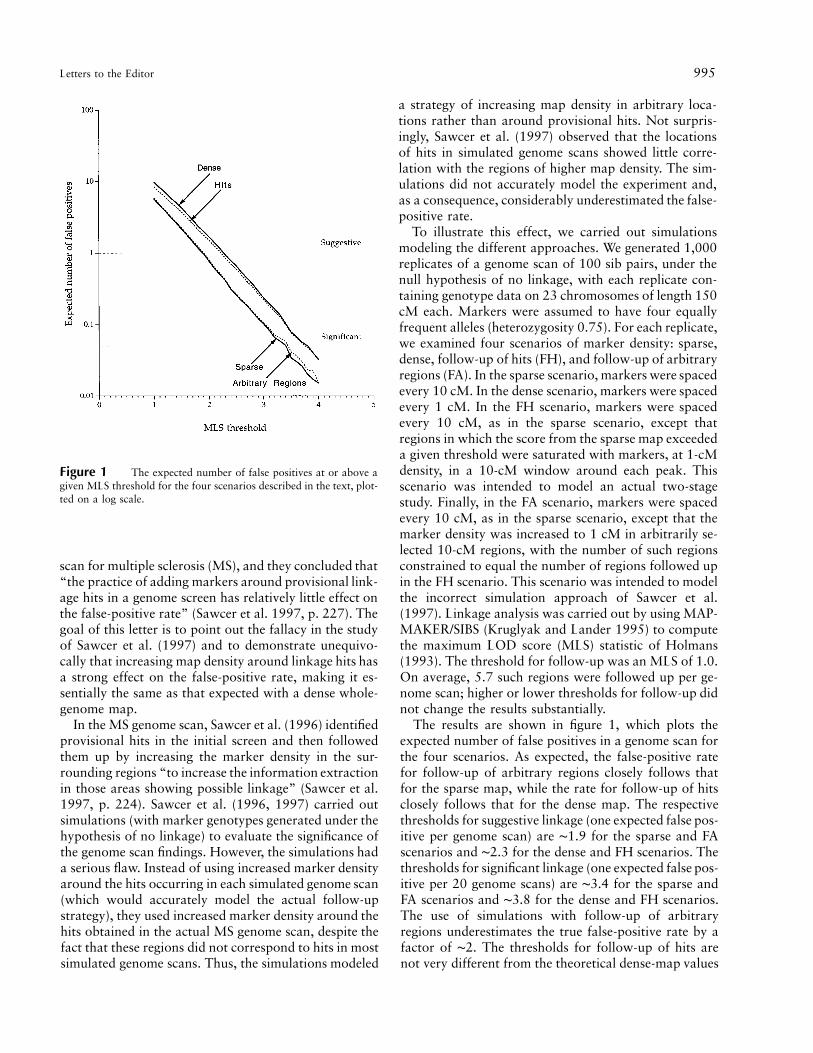
Figure 1 The expected number of false positives at or above agiven MLS threshold for the four scenarios described in the text, plot-ted on a log scale.
scan for multiple sclerosis (MS), and they concluded that“the practice of adding markers around provisional link-age hits in a genome screen has relatively little effect onthe false-positive rate” (Sawcer et al. 1997, p. 227). Thegoal of this letter is to point out the fallacy in the studyof Sawcer et al. (1997) and to demonstrate unequivo-cally that increasing map density around linkage hits hasa strong effect on the false-positive rate, making it es-sentially the same as that expected with a dense whole-genome map.
In the MS genome scan, Sawcer et al. (1996) identifiedprovisional hits in the initial screen and then followedthem up by increasing the marker density in the sur-rounding regions “to increase the information extractionin those areas showing possible linkage” (Sawcer et al.1997, p. 224). Sawcer et al. (1996, 1997) carried outsimulations (with marker genotypes generated under thehypothesis of no linkage) to evaluate the significance ofthe genome scan findings. However, the simulations hada serious flaw. Instead of using increased marker densityaround the hits occurring in each simulated genome scan(which would accurately model the actual follow-upstrategy), they used increased marker density around thehits obtained in the actual MS genome scan, despite thefact that these regions did not correspond to hits in mostsimulated genome scans. Thus, the simulations modeled
a strategy of increasing map density in arbitrary loca-tions rather than around provisional hits. Not surpris-ingly, Sawcer et al. (1997) observed that the locationsof hits in simulated genome scans showed little corre-lation with the regions of higher map density. The sim-ulations did not accurately model the experiment and,as a consequence, considerably underestimated the false-positive rate.
To illustrate this effect, we carried out simulationsmodeling the different approaches. We generated 1,000replicates of a genome scan of 100 sib pairs, under thenull hypothesis of no linkage, with each replicate con-taining genotype data on 23 chromosomes of length 150cM each. Markers were assumed to have four equallyfrequent alleles (heterozygosity 0.75). For each replicate,we examined four scenarios of marker density: sparse,dense, follow-up of hits (FH), and follow-up of arbitraryregions (FA). In the sparse scenario, markers were spacedevery 10 cM. In the dense scenario, markers were spacedevery 1 cM. In the FH scenario, markers were spacedevery 10 cM, as in the sparse scenario, except thatregions in which the score from the sparse map exceededa given threshold were saturated with markers, at 1-cMdensity, in a 10-cM window around each peak. Thisscenario was intended to model an actual two-stagestudy. Finally, in the FA scenario, markers were spacedevery 10 cM, as in the sparse scenario, except that themarker density was increased to 1 cM in arbitrarily se-lected 10-cM regions, with the number of such regionsconstrained to equal the number of regions followed upin the FH scenario. This scenario was intended to modelthe incorrect simulation approach of Sawcer et al.(1997). Linkage analysis was carried out by using MAP-MAKER/SIBS (Kruglyak and Lander 1995) to computethe maximum LOD score (MLS) statistic of Holmans(1993). The threshold for follow-up was an MLS of 1.0.On average, 5.7 such regions were followed up per ge-nome scan; higher or lower thresholds for follow-up didnot change the results substantially.
The results are shown in figure 1, which plots theexpected number of false positives in a genome scan forthe four scenarios. As expected, the false-positive ratefor follow-up of arbitrary regions closely follows thatfor the sparse map, while the rate for follow-up of hitsclosely follows that for the dense map. The respectivethresholds for suggestive linkage (one expected false pos-itive per genome scan) are ∼1.9 for the sparse and FAscenarios and ∼2.3 for the dense and FH scenarios. Thethresholds for significant linkage (one expected false pos-itive per 20 genome scans) are ∼3.4 for the sparse andFA scenarios and ∼3.8 for the dense and FH scenarios.The use of simulations with follow-up of arbitraryregions underestimates the true false-positive rate by afactor of ∼2. The thresholds for follow-up of hits arenot very different from the theoretical dense-map values
996 Letters to the Editor
of 2.6 for suggestive and 4.0 for significant linkage(Lander and Kruglyak 1995).
We therefore conclude that the original recommen-dation to use dense-map thresholds to assess the signif-icance of results from two-stage genome scans is appro-priate. Of course, it may still be desirable to carry outsimulations, to take into account specific features of aparticular study and to avoid relying on asymptotic as-sumptions. In this case, such simulations must accuratelymodel the methodology of the study, including follow-up of interesting regions. Otherwise, the false-positiverate can be underestimated considerably.
LEONID KRUGLYAK AND MARK J. DALY
Whitehead Institute for Biomedical ResearchCambridge, Massachusetts
References
Holmans P (1993) Asymptotic properties of affected-sib-pairlinkage analysis. Am J Hum Genet 52:362–374
Kruglyak L, Lander ES (1995) Complete multipoint sib pairanalysis of qualitative and quantitative traits. Am J HumGenet 57:439–454
Lander E, Kruglyak L (1995) Genetic dissection of complextraits: guidelines for interpreting and reporting linkage re-sults. Nat Genet 11:241–247
Sawcer S, Jones HB, Feakes R, Gray J, Smaldon N, ChatawayJ, Robertson N et al. (1996) A genome screen in multiplesclerosis reveals susceptibility loci on chromosomes 6p21and 17q22. Nat Genet 13:464–468
Sawcer S, Jones HB, Judge D, Visser F, Compston A, Good-fellow PN, Clayton D (1997) Empirical genomewide sig-nificance levels established by whole genome simulations.Genet Epidemiol 14:223–229
Address for correspondence and reprints: Dr. Leonid Kruglyak, WhiteheadInstitute for Biomedical Research, 1 Kendall Square, Building 300, Cambridge,MA 02139. E-mail: [email protected]
q 1998 by The American Society of Human Genetics. All rights reserved.0002-9297/98/6204-0038$02.00
Am. J. Hum. Genet. 62:996–997, 1998
Response to Kruglyak
To the Editor:We accept that our simulations (Sawcer et al. 1997) didnot accurately model our experiment in the importantrespect that extra markers were added after an interimanalysis. However, this was not the only respect in whichour genome screen differed from the situation that gen-erated the theoretical results discussed in the original
paper of Lander and Kruglyak (1995). Kruglyak’s recentsimulations still differ from our genome screen in im-portant respects: his simulations used uniform markersspaced on a uniform map and involved a genome withchromosomes of a uniform length and families with auniform pedigree structure. Our simulation study wasas much aimed at assessing the importance of these fea-tures of real studies. To do this required massive com-putational effort, and it was simply not feasible for usto include the two-stage aspects at the same time. Weshould also point out that, in common with most “two-stage” studies, our second-stage study did not simplyadd extra markers—it added extra families as well. Insuch circumstances, it is not clear whether the simula-tions of Kruglyak are quite as relevant, since it will surelyno longer be inevitable that the effect of increasing themarker density will almost always be to increase themaximum LOD score (MLS). It would be interesting tosee the results of a simulation exercise that also consid-ered the introduction of further families at the secondstage. Intuitively, we might expect them to be interme-diate between our results and those of Kruglyak.
This aspect of our genome study was one factor thatled us to neglect the addition of extra markers. A secondwas that our general experience has not confirmed theassertion that the effect of adding extra markers is al-most always to increase the MLS. We often find thereverse—the initial peaks disappear when additionalmarkers are added! However, we also find Kruglyak’sresults persuasive. It is well recognized that genotypingand mapping errors tend to reduce the observed MLS(Ott 1991), and it is possible that these account for thediscrepancy between our perceptions and the simulationresults, since neither set of simulations considered these.
To summarize, we accept that our simulation studyoversimplified the conditions of our genome screen inone important respect. But the real study had a numberof further difficult aspects, and Kruglyak’s simulationsalso neglect these aspects. We must concede, however,that perhaps we overstated the generality of some of ourconclusions. Finally, we would make a plea that thisdebate should not be concerned solely with the “signif-icance” of a single high MLS. In many cases, it may wellbe of considerable interest that substantially raised MLSswere found in a number of regions, even though noneof them is singly convincing. This is another aspect ofthe interpretation of genome screens that may be valu-ably addressed by simulation.
STEPHEN SAWCER, HYWEL B. JONES, AND
DAVID CLAYTON
University of CambridgeCambridge, United Kingdom

Letters to the Editor 997
References
Lander E, Kruglyak L (1995) Genetic dissection of complextraits: guidelines for interpreting and reporting linkage re-sults. Nat Genet 11:241–247
Ott J (1991) Analysis of human genetic linkage. Johns HopkinsUniversity Press, Baltimore
Sawcer SJ, Jones HB, Judge D, Visser F, Compston DAS, Good-fellow PN, Clayton D (1997) Empirical genomewide sig-
nificance levels established by whole genome simulations.Genet Epidemiol 14:223–229
Address for correspondence and reprints: Dr. Stephen Sawcer, University ofCambridge, Neurology Unit and MRC Biostatistics Unit, Addenbrookes Hos-pital, Hills Road, Cambridge, UK. E-mail: [email protected]
q 1998 by The American Society of Human Genetics. All rights reserved.0002-9297/98/6204-0039$02.00