A large scale multivariate parallel ICA method reveals novel imaging–genetic relationships for...
29
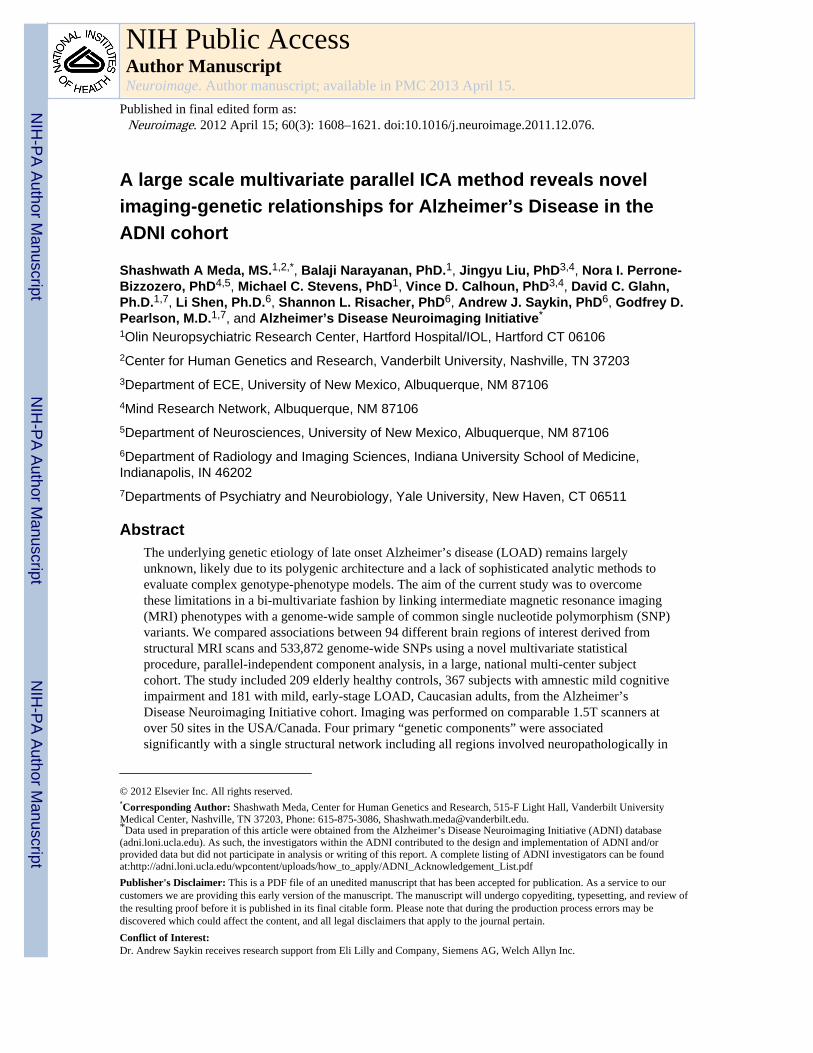
A large scale multivariate parallel ICA method reveals novel imaging-genetic relationships for Alzheimer’s Disease in the ADNI cohort Shashwath A Meda, MS. 1,2,* , Balaji Narayanan, PhD. 1 , Jingyu Liu, PhD 3,4 , Nora I. Perrone- Bizzozero, PhD 4,5 , Michael C. Stevens, PhD 1 , Vince D. Calhoun, PhD 3,4 , David C. Glahn, Ph.D. 1,7 , Li Shen, Ph.D. 6 , Shannon L. Risacher, PhD 6 , Andrew J. Saykin, PhD 6 , Godfrey D. Pearlson, M.D. 1,7 , and Alzheimer’s Disease Neuroimaging Initiative * 1 Olin Neuropsychiatric Research Center, Hartford Hospital/IOL, Hartford CT 06106 2 Center for Human Genetics and Research, Vanderbilt University, Nashville, TN 37203 3 Department of ECE, University of New Mexico, Albuquerque, NM 87106 4 Mind Research Network, Albuquerque, NM 87106 5 Department of Neurosciences, University of New Mexico, Albuquerque, NM 87106 6 Department of Radiology and Imaging Sciences, Indiana University School of Medicine, Indianapolis, IN 46202 7 Departments of Psychiatry and Neurobiology, Yale University, New Haven, CT 06511 Abstract The underlying genetic etiology of late onset Alzheimer’s disease (LOAD) remains largely unknown, likely due to its polygenic architecture and a lack of sophisticated analytic methods to evaluate complex genotype-phenotype models. The aim of the current study was to overcome these limitations in a bi-multivariate fashion by linking intermediate magnetic resonance imaging (MRI) phenotypes with a genome-wide sample of common single nucleotide polymorphism (SNP) variants. We compared associations between 94 different brain regions of interest derived from structural MRI scans and 533,872 genome-wide SNPs using a novel multivariate statistical procedure, parallel-independent component analysis, in a large, national multi-center subject cohort. The study included 209 elderly healthy controls, 367 subjects with amnestic mild cognitive impairment and 181 with mild, early-stage LOAD, Caucasian adults, from the Alzheimer’s Disease Neuroimaging Initiative cohort. Imaging was performed on comparable 1.5T scanners at over 50 sites in the USA/Canada. Four primary “genetic components” were associated significantly with a single structural network including all regions involved neuropathologically in © 2012 Elsevier Inc. All rights reserved. * Corresponding Author: Shashwath Meda, Center for Human Genetics and Research, 515-F Light Hall, Vanderbilt University Medical Center, Nashville, TN 37203, Phone: 615-875-3086, [email protected]. * Data used in preparation of this article were obtained from the Alzheimer’s Disease Neuroimaging Initiative (ADNI) database (adni.loni.ucla.edu). As such, the investigators within the ADNI contributed to the design and implementation of ADNI and/or provided data but did not participate in analysis or writing of this report. A complete listing of ADNI investigators can be found at:http://adni.loni.ucla.edu/wpcontent/uploads/how_to_apply/ADNI_Acknowledgement_List.pdf Publisher's Disclaimer: This is a PDF file of an unedited manuscript that has been accepted for publication. As a service to our customers we are providing this early version of the manuscript. The manuscript will undergo copyediting, typesetting, and review of the resulting proof before it is published in its final citable form. Please note that during the production process errors may be discovered which could affect the content, and all legal disclaimers that apply to the journal pertain. Conflict of Interest: Dr. Andrew Saykin receives research support from Eli Lilly and Company, Siemens AG, Welch Allyn Inc. NIH Public Access Author Manuscript Neuroimage. Author manuscript; available in PMC 2013 April 15. Published in final edited form as: Neuroimage. 2012 April 15; 60(3): 1608–1621. doi:10.1016/j.neuroimage.2011.12.076. NIH-PA Author Manuscript NIH-PA Author Manuscript NIH-PA Author Manuscript
Transcript of A large scale multivariate parallel ICA method reveals novel imaging–genetic relationships for...
A large scale multivariate parallel ICA method reveals novelimaging-genetic relationships for Alzheimer’s Disease in theADNI cohort
Shashwath A Meda, MS.1,2,*, Balaji Narayanan, PhD.1, Jingyu Liu, PhD3,4, Nora I. Perrone-Bizzozero, PhD4,5, Michael C. Stevens, PhD1, Vince D. Calhoun, PhD3,4, David C. Glahn,Ph.D.1,7, Li Shen, Ph.D.6, Shannon L. Risacher, PhD6, Andrew J. Saykin, PhD6, Godfrey D.Pearlson, M.D.1,7, and Alzheimer’s Disease Neuroimaging Initiative*
1Olin Neuropsychiatric Research Center, Hartford Hospital/IOL, Hartford CT 061062Center for Human Genetics and Research, Vanderbilt University, Nashville, TN 372033Department of ECE, University of New Mexico, Albuquerque, NM 871064Mind Research Network, Albuquerque, NM 871065Department of Neurosciences, University of New Mexico, Albuquerque, NM 871066Department of Radiology and Imaging Sciences, Indiana University School of Medicine,Indianapolis, IN 462027Departments of Psychiatry and Neurobiology, Yale University, New Haven, CT 06511
AbstractThe underlying genetic etiology of late onset Alzheimer’s disease (LOAD) remains largelyunknown, likely due to its polygenic architecture and a lack of sophisticated analytic methods toevaluate complex genotype-phenotype models. The aim of the current study was to overcomethese limitations in a bi-multivariate fashion by linking intermediate magnetic resonance imaging(MRI) phenotypes with a genome-wide sample of common single nucleotide polymorphism (SNP)variants. We compared associations between 94 different brain regions of interest derived fromstructural MRI scans and 533,872 genome-wide SNPs using a novel multivariate statisticalprocedure, parallel-independent component analysis, in a large, national multi-center subjectcohort. The study included 209 elderly healthy controls, 367 subjects with amnestic mild cognitiveimpairment and 181 with mild, early-stage LOAD, Caucasian adults, from the Alzheimer’sDisease Neuroimaging Initiative cohort. Imaging was performed on comparable 1.5T scanners atover 50 sites in the USA/Canada. Four primary “genetic components” were associatedsignificantly with a single structural network including all regions involved neuropathologically in
© 2012 Elsevier Inc. All rights reserved.*Corresponding Author: Shashwath Meda, Center for Human Genetics and Research, 515-F Light Hall, Vanderbilt UniversityMedical Center, Nashville, TN 37203, Phone: 615-875-3086, [email protected].*Data used in preparation of this article were obtained from the Alzheimer’s Disease Neuroimaging Initiative (ADNI) database(adni.loni.ucla.edu). As such, the investigators within the ADNI contributed to the design and implementation of ADNI and/orprovided data but did not participate in analysis or writing of this report. A complete listing of ADNI investigators can be foundat:http://adni.loni.ucla.edu/wpcontent/uploads/how_to_apply/ADNI_Acknowledgement_List.pdfPublisher's Disclaimer: This is a PDF file of an unedited manuscript that has been accepted for publication. As a service to ourcustomers we are providing this early version of the manuscript. The manuscript will undergo copyediting, typesetting, and review ofthe resulting proof before it is published in its final citable form. Please note that during the production process errors may bediscovered which could affect the content, and all legal disclaimers that apply to the journal pertain.Conflict of Interest:Dr. Andrew Saykin receives research support from Eli Lilly and Company, Siemens AG, Welch Allyn Inc.
NIH Public AccessAuthor ManuscriptNeuroimage. Author manuscript; available in PMC 2013 April 15.
Published in final edited form as:Neuroimage. 2012 April 15; 60(3): 1608–1621. doi:10.1016/j.neuroimage.2011.12.076.
NIH
-PA Author Manuscript
NIH
-PA Author Manuscript
NIH
-PA Author Manuscript
LOAD. Pathway analysis suggested that each component included several genes already known tocontribute to LOAD risk (e.g. APOE4) or involved in pathologic processes contributing to thedisorder, including inflammation, diabetes, obesity and cardiovascular disease. In additionsignificant novel genes identified included ZNF673, VPS13, SLC9A7, ATP5G2 and SHROOM2.Unlike conventional analyses, this multivariate approach identified distinct groups of genes thatare plausibly linked in physiologic pathways, perhaps epistatically. Further, the study exemplifiesthe value of this novel approach to explore large-scale data sets involving high-dimensional geneand endophenotype data.
Keywordsepistasis; multivariate; ICA; genotype-phenotype; pathway; enrichment
IntroductionLate onset Alzheimer’s disease (LOAD), the commonest cause of late-life dementia (Bekriset al., 2010) has high heritability (Gatz et al., 2006a; Gatz et al., 2006b). However, itsetiopathology, pathogenesis and major risk genes are only partly known, mainly due to itsgenetic complexity and heterogeneity. The “amyloid hypothesis” seems insufficient to fullyexplain LOAD etiology and alternative hypotheses continue to be advanced (Pimplikar etal., 2010).
To date only one gene of major effect, apolipoprotein E ε4 (APOE4), replicates assignificantly influencing LOAD risk (Strittmatter et al., 1993), but does not account for allgenetic variability, suggesting the interplay of multiple, mostly unidentified susceptibilityloci of smaller effect size acting multiplicatively under a common disease variant model(Eccles and Tapper, 2010) and/or with environmental factors (Traynor and Singleton, 2010).Recent high-throughput genome wide association studies (GWAS) (van Es and van denBerg, 2009)(Grupe et al., 2007; Harold et al., 2009; Seshadri et al., 2010) have identifiedand replicated in addition to APOE4, other genes such as BIN1, CLU, ABCA7, CR1,PICALM, MS4A6A, CD33, MSA4E and CD2AP, all of which (apart from APOE) havemodest effect sizes and cumulatively account for only 35% of the population attributablerisk (Ku et al., 2011; Naj et al., 2011). However, if LOAD risk is mediated in part bycommon polymorphisms individually conferring low disease risk, acting in concert, typicalunivariate GWAS might not have enough power to consistently detect these effects unlessthey utilize very large sample sizes. This might be an inherent issue as obtaining such largesample sizes are usually quite difficult. Also more importantly univariate studies do not takeinto account the effect of multiple genes at once. This is important because major LOADrisk factors include obesity, cerebrovascular disease and diabetes, all disorders withsignificant genetic underpinnings (Profenno et al., 2010), suggesting causative genes mightbelong to common biological pathways shared by these conditions. To circumvent some ofthese issues, multivariate analyses have been suggested as an approach to identify importantgenetic factors in LOAD (Gandhi and Wood, 2010).
MRI captures robust phenotypic neuroanatomical LOAD biomarkers, most consistentlyimplicating posterior cingulate and entorhinal cortices, hippocampus and other medialtemporal structures (Jack et al., 2010a; Jack et al., 2010b; Smith, 2010; Villain et al., 2010)corresponding to sites of early, severe LOAD-related neuropathology. Imaging geneticsattempts to bridge genetic variations with phenotypic trait markers, relating genotypicvariations to underlying biological disease etiologies and increasing statistical power,thereby requiring smaller sample sizes (Potkin et al., 2009). However, such strategiesrequire tools to simultaneously accommodate thousands of data points per feature set (e.g.
Meda et al. Page 2
Neuroimage. Author manuscript; available in PMC 2013 April 15.
NIH
-PA Author Manuscript
NIH
-PA Author Manuscript
NIH
-PA Author Manuscript

~105 voxels from imaging data and up to 106 SNPs from genetic data), posing a majorstatistical challenge. Often, large scale studies are performed in a univariate fashion thatsignificantly limits either one or both feature sets. However, these techniques can curtail theusefulness of multidimensional data to identify potentially informative relationships.Conventional voxel-wise analyses are computationally time consuming on a genome-widescale and ineffectively capture cumulative effects spread over multiple genes. Prior analyses(Biffi et al., 2010; Potkin et al., 2009; Shen et al., 2010) on the multi-site MRI/genetic ADNIdataset used massively univariate approaches: GWAS, that confirmed the risk status ofAPOE4 and identified TOMM40 (Shen et al., 2010) and hypothesis-driven analyses usingpre-selected known affected brain regions plus GWAS, that reinforced the status ofpromising individual genes of interest (Biffi et al., 2010). However, no analyses haveevaluated the premise that genetic determinants are not randomly distributed among relevantbiological pathways but instead grouped together among specific biological processes, norhave they detected predicted groups of common, interactive risk polymorphisms.
Parallel independent component analysis (Para-ICA) a novel multivariate data-driven,hypothesis-free statistical technique, extends ICA to analyze multiple modalitiessimultaneously (Calhoun et al., 2009). Para-ICA identifies simultaneously clusters ofassociated, likely interacting genes related to either: (a) functional brain networks, (b)related structural brain regions, or (c) physiologic processes e.g. EEG patterns or otherpotential endophenotypes and shows their relationships (Calhoun et al., 2009). Beginningwith two modalities (here, SNP’s and MRI-derived regional brain volume/thickness), wesought to discover underlying factors from both modalities and their connections. Similar toconventional ICA analyses, extracted structural MRI components are maximallyindependent within modality and loading coefficients represent variation among individuals.Networks or components extracted from genetic data are groups of interacting SNP loci,contributing with varying degrees to a genetic process affecting a downstream biologicalfunction, i.e. linear SNP combinations highly associated with related phenotypes. To date,this technique has been used mainly in schizophrenia and healthy controls to find genesresponsible for brain structure and function using MRI and EEG patterns (Jagannathan et al.,2010; Liu et al., 2008; Meda et al., 2010). However, subject and SNP numbers in thosestudies were typically small.
Genetic and structural MRI data from the ADNI sample provide an ideal test bed to exploreLOAD and to validate application of Para-ICA to larger datasets. The subject number(>800) and large genotypic dataset (>600,000 SNPs) allow for examination of feasibility ofscaling up this technique where some valid results are published in this dataset fromconventional, hypothesis-driven analyses (Biffi et al., 2010). Because many LOAD riskgenes remain to be discovered, the technique can simultaneously be used to identify novelrisk genes, as it identifies clusters of related, interacting SNPs.
We had the following goals: 1) to evaluate whether Para-ICA could be scaled up to dealwith larger populations and many more SNPs than previously analyzed; 2) to identify newrisk genes for LOAD and their corresponding endophenotypes and 3) to explore the differentLOAD-mediating biological interactive pathways in which the identified risk genes mightparticipate. We hypothesized that the method might identify previously unknown LOADrisk genes, as well as known candidate genes. We hypothesized that identified genes wouldgroup into LOAD-associated physiologic pathways and processes.
Materials and MethodsWe evaluated associations between two data modalities, structural MRI (sMRI), (regionalbrain volumes and cortical thicknesses), and genome-wide genotypic data (SNPs), to reveal
Meda et al. Page 3
Neuroimage. Author manuscript; available in PMC 2013 April 15.
NIH
-PA Author Manuscript
NIH
-PA Author Manuscript
NIH
-PA Author Manuscript
multivariate relationships between structural brain regions and SNP’s that differed betweenhealthy controls, MCI and AD subjects.
Alzheimer’s Disease Neuroimaging Initiative (ADNI) StudyData used in the preparation of this article were obtained from the ADNI database(adni.loni.ucla.edu). ADNI results from efforts of many co-investigators from a broad rangeof academic institutions and private corporations, with subjects recruited from over 50 sitesacross the U.S. and Canada. For up-to-date information, see www.adni-info.org. ThePrincipal Investigator of this initiative is Michael W. Weiner, MD, VA Medical Center andUniversity of California – San Francisco.
Study Participants—Data derived from the ADNI database on 818 subjects includedbaseline 1.5 T MRI scans, Illumina SNP genotyping data, APOE genotype status anddemographic information. We limited analyses to European-American ADNI subjects(classified initially into respective ethnic groups based on self-report and validatedsubsequently using genetic markers) to prevent confluence of population stratificationeffects on data, yielding a total of 209 HC (Mean/SD Age = 76.05/4.94; 113 Males) with nopast history of neurological or psychiatric disorder, 367 subjects with MCI (Mean/SD Age =74.95/7.37; 239 Males) and 181 subjects with clinically-assessed AD (Mean/SD Age =75.57/7.48; 100 Males) for analysis.
Single Nucleotide Polymorphisms (SNP’s) - Genotype—Sample collection andSingle nucleotide polymorphism (SNP) genotyping for more than 620,000 target SNPsacross the whole genome was completed on all ADNI participants as described in (Saykin etal., 2010; Shen et al., 2010).
Quality Control/Pre-processing: Prior to Para-ICA, genotyped SNP’s underwent two pre-processing stages. First, quality control parameters were employed to discard data unsuitablefor further analysis. Samples (both subjects and SNP’s) were checked for missing data andthose with missing call rates >5% were excluded. Remaining samples were imputed formissing values (<1%) by replacing data with the corresponding major genotype. Followingthis, all uninformative SNP’s (constant variance) were excluded. SNP’s were then checkedfor minor allele frequency (MAF); rare SNP variants with MAFs <0.01 were excluded.Highly correlated SNP’s (r>0.95) (in block sizes of 100kb) were removed. Finally, SNPs (incontrols only) were checked for Hardy-Weinberg equilibrium set at a threshold of p<1E-7.QC SNP’s (N=533,872) were then carried over to the next processing stage. The aboveanalyses were performed using custom scripts in Matlab 7.0 (www.mathworks.com).
The above pre-processed SNP’s were subjected to a univariate GWAS type case-controlassociation analysis to identify those differing significantly across the three diagnosticgroups. This 1) effectively restricted the core analysis to disease-related genetic data in thecurrent sample, 2) reduced potential noise from interacting genes with little or norelationship to the disease model, providing hypothesis-free data-driven “enrichment,” and3) improved accuracy and the linking coefficient of the Para-ICA algorithm (determinedbased on previous simulation results (Liu et al., 2008)). All SNP’s (using an additive model)were entered into a mass univariate ANOVA design with diagnostic group as theindependent factor, using Matlab 7.0. SNP’s surviving a liberal p<0.05 uncorrectedthreshold were then advanced to the Para-ICA multivariate association analyses. As noted,at this stage, no multiple comparison correction was performed. All significant SNP’s with ap<0.05 uncorrected threshold (N=27,150) were carried forward to Para-ICA to determinegenetic associations (including weak effects spread across multiple SNPs) with brainstructures.
Meda et al. Page 4
Neuroimage. Author manuscript; available in PMC 2013 April 15.
NIH
-PA Author Manuscript
NIH
-PA Author Manuscript
NIH
-PA Author Manuscript
MRI Structural Imaging - Phenotype—All subjects underwent a high-resolution 3Dstructural MRI scan (MPRAGE) as detailed in http://www.adni-info.org. We utilizedrecently published ADNI imaging data, analyzed in Freesurfer V4.1.0(http://surfer.nmr.mgh.harvard.edu/fswiki) (Shen et al., 2010), thus, brain structurepreparation and analysis methods are described only briefly. An automated FreesurferBayesian segmentation and parcellation routine extracted and labeled cortical andsubcortical tissue classes (Shen et al., 2010), yielding target region volumes, corticalthicknesses and total intracranial volumes for pre-defined brain structure regions-of-interest(ROIs). Freesurfer values for two independently collected MPRAGE scans per subject wereaveraged to yield a single volume/cortical thickness value. Table 1 lists all imagingphenotypes (N=94; bilateral volumes of interest and cortical thickness values). All valueswere normalized by Z-score transformation before entry into Para-ICA.
Genotype-Phenotype Associations (Para-ICA)Para-ICA was implemented using the Fusion ICA Toolbox v2.0a;http://icatb.sourceforge.net in Matlab 7.0 to compute independent genetic/imaging networksand simultaneously identify and quantify association between the two modalities/features.This variant of ICA was designed for multimodality processing that extracts componentsusing an entropy term based on information theory to maximize independence and enhancesthe interconnection by maximizing the linkage function in a joint estimation process(Calhoun et al., 2009; Liu et al., 2008). In addition, Para-ICA estimated loading parametersexpressing the weight of the overall component for each subject. Overall correlation valuesbetween loading coefficients of the two sets of imaging and genetic component(s) werecalculated component-wise for the aggregate sample to identify significantly associatedfeature sets. Comprehensive mathematical details of the algorithm and methodology areprovided in (Liu et al., 2008). Data values from all three diagnostic groups were organizedas a matrix of subjects by SNP’s/imaging-ROI values. These genotype and phenotype datamatrices were input to the Para-ICA algorithm (see diagram in Figure 1). The number ofindependent estimated components for both SNP (12 components) and imaging data (8components) was separately estimated using Akaike information criteria (AIC) (Calhoun etal., 2001). Resulting correlation values between the Para-ICA feature sets wereappropriately corrected for multiple comparisons at this stage and a Bonferroni correctionwas applied based on 12×8=96 comparisons yielding a corrected p value threshold of0.05/96 = 0.0005. Once significant feature set associations were identified, all contributingSNPs/imaging ROIs across each significant feature/network/component were thresholded ata supra level |Z|>2.0 to specifically identify dominant loadings for each individual network.SNP’s or regions surpassing this threshold were deemed to be contributing significantly tothe overall signal of the corresponding component/network. Subsequently, loadingcoefficients of significantly associated components were tested in a case-control fashion totest if they differed significantly among diagnostic groups.
Significant SNP’s from each component were then batch queried against the dbSNPdatabase http://www.ncbi.nlm.nih.gov/projects/SNP/ to extract corresponding known geneinformation; genes from this query (derived for each component) were entered into thefunctional annotation tool, DAVID (http://david.abcc.ncifcrf.gov/) to identify enrichedbiological themes and visualize these genes on functional pathways e.g. KEGG and/orBioCarta. The Ingenuity pathway analysis tool (IPA;http://www.ingenuity.com/products/pathways_analysis.html) modeled and analyzed thecomplex biology and genetic interactions as canonical pathway models within the identifiedsignificant genetic network(s). SNPs associated with known genes were mapped to theIngenuity Pathways Knowledgebase to delineate biological networks. Genes were also inputto Funcassociate v2.0 (http://llama.mshri.on.ca/funcassociate/) to reveal significantly
Meda et al. Page 5
Neuroimage. Author manuscript; available in PMC 2013 April 15.
NIH
-PA Author Manuscript
NIH
-PA Author Manuscript
NIH
-PA Author Manuscript
enriched functional attributes in each component compared against a gene ontologydatabase. Finally, we performed standard chi-square association analyses on the top 10 Z-score-ranked genes from each Para-ICA-derived genetic network, to determine their relativeassociation with the disease model.
ResultsInitial data pre-processing with a univariate “GWAS like” analysis (p<0.05 uncorrected)revealed N=27,150 SNPs that differed significantly across groups. It confirmed SNPs fromAPOE (ε4; p=6.6E-16; ε3; p=3.6E-09) and TOMM40 (p=7.25E-08) as the top threecandidate genes, whose genotypes differed significantly across diagnostic groups, asidentified in prior GWAS of the same parent dataset (Potkin et al., 2009).
Genotype-Phenotype associations using Para-ICAFrom the 12 SNP and 8 anatomic principal component networks identified by AIC, Para-ICA identified four different independent genetic networks significantly associated with asingle structural network (following Bonferroni correction). These four networks werecomponent/networks 1 (G1; consisting of 169 significant genes/332 SNPs), 2 (G2; 182genes/377 SNPs), 3 (G3; 267 genes/482 SNPs) and 4 (G4; 169 genes/332 SNPs). G1 and G3had significant loadings (Z>2) from APOE (ε4). All four networks were significantlyassociated with only one structural brain network (S1) that encompassed 40 differentunilateral regions (a combination of both volumes and cortical thickness surpassing a Z=2threshold). Key structural regions loading heavily in this component were entorhinal cortexand middle temporal cortex thicknesses and amygdala and hippocampus volumes. Acomplete list of significant regions is highlighted with double asterisks in Table 1 andillustrated in Figure 2. Significant genotype-phenotype correlations (between loadingparameters of each modality or feature) were as follows: 1) G1-S1 (r=−0.53; p<0.0001) 2)G2-S1 (r=0.32; p<0.0001) 3) G4-S1 (r=0.24; p<0.0001) and G3-S1 (r=−0.14; p=0.0001).Figure 2 summarizes these data with the top 10 representative genes from each geneticnetwork along with their corresponding biological functions. Supplementary figure 1 (FigS1) shows correlation (scatter) plots for these associations. Testing loading coefficients ofthe above networks for between-group differences revealed that in addition to havingsignificant associations they also significantly discriminated groups by baseline diagnosis(AD, MCI, or healthy control). Mean loading coefficients across each genetic/structuralnetwork are shown in supplementary Figure 2 (Fig S2).
Pathway analysis of genetic networks (components)Ingenuity Pathway Analysis (IPA) software (http://www.ingenuity.com/) was used to detect,visualize, and explore relevant biological networks associated with each genetic component.Top networks for G1 were cellular assembly/organization, cell morphology anddevelopment. G2 was enriched with genes related to cardiovascular disease, neurologicdisease and cardiac arteriopathy. Primary networks for G4 were cell cycle, cell death andinflammatory response. G3 had an over-representation of genes related to neurological andpsychological disorders. All the above networks contained known Alzheimer’s-relatedproteins in their pathway interactions. Top dynamic networks from each genetic componentare illustrated in Figure 3. Based on known gene functions, the top five IPA canonicalpathways for each gene network (sorted in terms of genotype-phenotype linkagesignificance) were as follows:
G1: cAMP mediated signaling, sulfur metabolism, calcium signaling, vascular NO signalingand regulation of IL-2 expression in T lymphocytes. G2: Neuro-protective role of THOP1 inAlzheimer’s, NOS endothelial effects, Type 2 diabetes signaling, tyrosine metabolism,
Meda et al. Page 6
Neuroimage. Author manuscript; available in PMC 2013 April 15.
NIH
-PA Author Manuscript
NIH
-PA Author Manuscript
NIH
-PA Author Manuscript

CYP450. G4: cAMP-mediated signaling, cardiac beta-adrenergic signaling, synaptic long-term potentiation, molecular cancer mechanisms, NOS endothelial effects. Significantlyassociated non-Neurologic disorders were type 2 diabetes (N=80), coronary artery disease(N=71), Crohn’s/inflammatory bowel disease (N=65). G3: Protein kinase A signaling,cardiac beta-adrenergic signaling, cAMP-mediated signaling, amino sugars metabolism,glycosaminoglycan degradation. Significantly associated non-neurologic disorders wereType 2 Diabetes (N=70), Crohn’s disease/IBD (N=57), coronary artery disease (N=57).
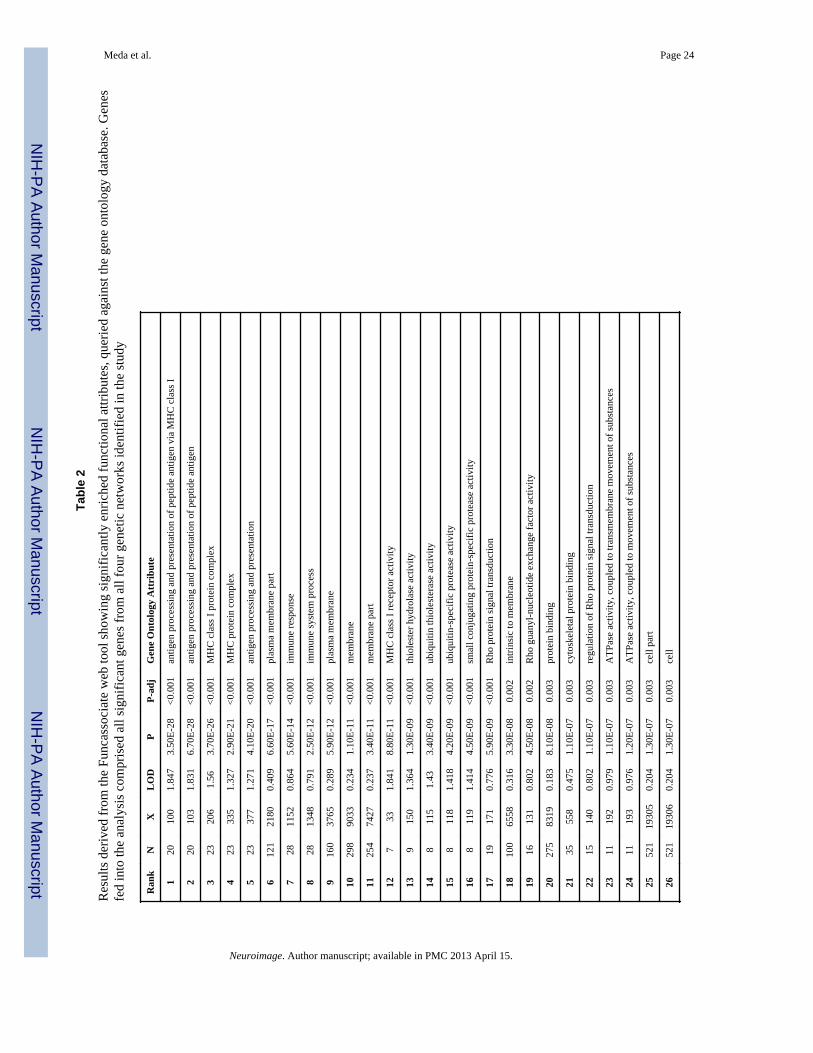
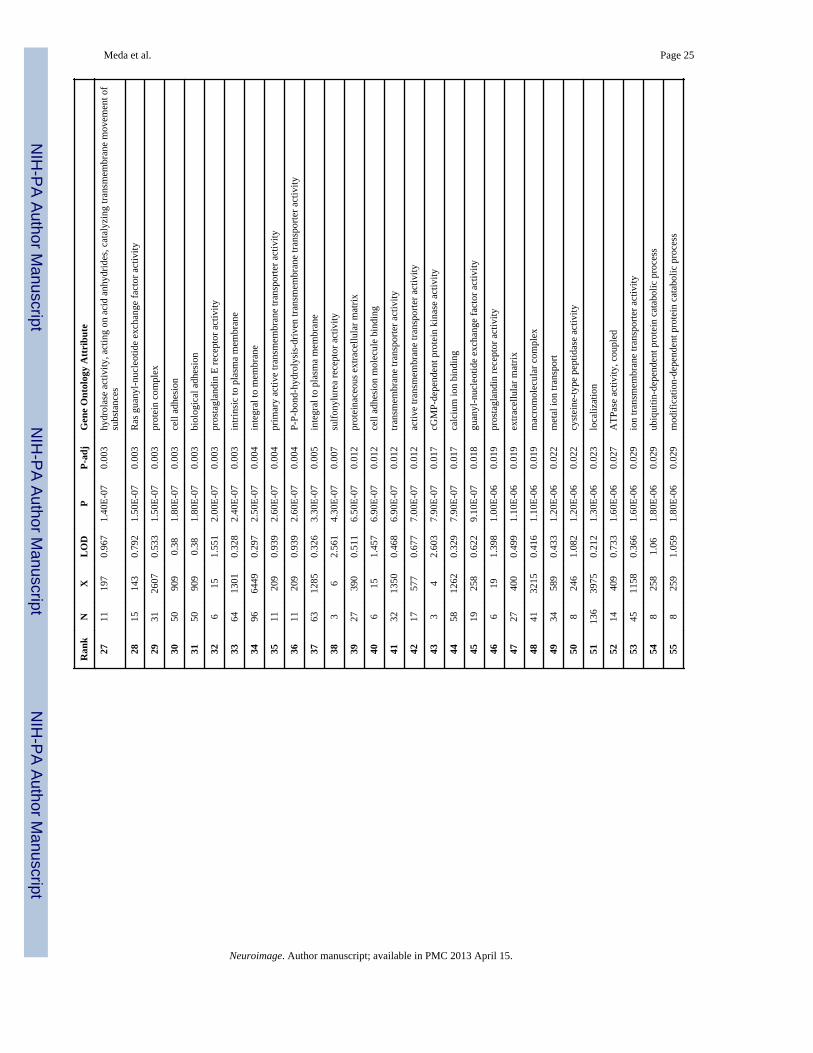
The DAVID functional annotation tool revealed that the significant genes from all fourgenetic networks are involved in multiple biological pathways including Alzheimer’sdisease, adherens junction, arrhythmogenic right ventricular and dilated cardiomyopathy,axon guidance, calcium signaling, cell adhesion, ECM receptor interaction, focal adhesionand tight junction and smooth muscle contraction. Figure 4 illustrates (marked with redstars) the significant genes in our study directly related to Alzheimer’s disease on a KEGGpathway map derived from the above tool. Genes analyzed using the Funcassociate v2.0toolkit revealed several (N=60) significantly over-represented attributes compared againstthe gene ontology database. The results presented in Table 2 are rank ordered based onadjusted p value along with the number of genes in the query, number of genes in the overallattribute and their odds ratios.
Supplementary Association analysis of top genes from Para-ICAAssociation analysis (to illustrate their relative disease association) of allelic frequencies forthe top ten genes (based on ranked Z-scores) from the four genetic components revealed thatthe genes SLC9A7, SHROOM2, ZNF673, APOE (ε3, ε4), VPS13C and ATP5G2 showedstronger effects of disease associations compared to other genes within the component.Table 3 details the allelic frequency and the associated statistical value for each of the top 10genes from all four genetic networks; due to partial overlap (1 gene could appear in morethan 1 component) totaling 32 unique genes. A weighting score was derived by normalizingthe chi-square value of each gene to the chi-square of the gene most associated with clinicaldisease status within each component.
DiscussionAs hypothesized, we validated a scaled-up Para-ICA approach to reveal novel interactivegenes and pathways for LOAD, thus highlighting one of the primary advantages of Para-ICA which is the use of modest sample sizes compared to conventional GWAS analyses toeffectively capture genotype-phenotype relationships. Dominant loading coefficients werecontained in all major regions affected by LOAD pathology in the single structuralcomponent significantly associated with four different SNP/genetic networks. Seven otherstructural components were unassociated with other gene components. The geneticcomponents identified included SNPs from APOE4 plus multiple other risk genes (andputatively protective SNPs, e.g. APOE2) either previously identified in LOAD risk (e.g.ATF7 in G3 (Lin et al., 2006)) or involved in one or more biological processes thought tocontribute to LOAD pathology. Figure 5 summarizes the involvement of these four geneticrisk networks on a LOAD physiologic pathway diagram.
The most significant association was between G1-S1. This genetic network had significantloading contributions from a total of 169 different genes (332 SNPs) and correlatednegatively with brain network S1, implying increased genetic load is related to decreasedbrain volume/thickness within the network. This association was notable as the S1 had highloadings from APOE4 (in the top 10 gene loadings) and S1 included regions known to beaffected early and severely in LOAD, including entorhinal, middle temporal and prefrontalcortices and hippocampus. More importantly, this genetic network had high loadings from
Meda et al. Page 7
Neuroimage. Author manuscript; available in PMC 2013 April 15.
NIH
-PA Author Manuscript
NIH
-PA Author Manuscript
NIH
-PA Author Manuscript

several other genes (SLC9A7/NHE7, ZNF673, SHROOM2) previously unidentified inLOAD pathology. Given that they were part of the same independent genetic component asAPOE, this finding both confirms APOE’s established role as an important LOAD risk geneand suggests that these additional SNPs may interact with APOE to influence disease risk,supporting APOE’s role as a LOAD risk factor rather than a direct cause (Guerreiro et al.,2010). The protein encoded by SLC9A7 mediates Na+/H+ exchange across cell surfaceplasma membranes (Kagami et al., 2008) cycling between the cell surface and intracellulartrans-Golgi network and recycling endosomes, which are vital to APP processing (Marksand Berg, 2010). SLC9A7 co-localizes with actin, implicated in tau formation (Gallo, 2007).LOAD lymphoblasts show abnormalities modulated by sodium/hydrogen exchangerblockers (Urcelay et al., 2001). Overall, this genetic network was enriched with genesdominant in cell signaling pathways. Other strongly contributing genes are involved in lipidtransport and tau formation (via actin/myosin binding). ZNF673 is associated with X-linkedmental retardation, (Lugtenberg et al., 2006; Ramaswamy et al., 2010) and is close (~0.2MB) to SCL9A7 on Xp11.3.
The second most significant association in genotype/phenotype correlation was G2-S1. Thiscorrelation was positive. G2 comprised 182 unique genes (377 SNPs). Some top-rankedgenes from this component overlapped with those from G1, including ZNF673 andSLC9A7. These genes had a significant differential distribution among diagnostic groups,suggesting a role of actin localization and transcriptional regulation in LOAD. Other topgenes from this network involved in important AD-related processes included thecomplement system, involved in amyloid-beta formation and inflammatory damage (van Esand van den Berg, 2009).
Network G4 correlated positively with S1. G4 contained several genes associated with riskfor non-neurologic disorders, including diabetes and cardiovascular disease, both LOADrisk factors (Profenno et al., 2010). Top genes from this network, previously unidentified inthe context of LOAD, belonged to the complement factor/inhibition pathway related toamyloid-beta clearance (35) or are associated with major histocompatibility class III.Additionally, AKAP9, a top 10 gene in this network, maintains neuronal Golgi integrity andis involved in LOAD pathogenesis (Stieber et al., 1996). Regarding association analysis, notop 10 gene from this network was significantly differentially distributed in the diseasegroups, suggesting that G4 comprises multiple SNPs of low effect acting together throughdiverse biological risk pathways, especially inflammation, (see Eikelenboom et al. 2006) tosignificantly affect LOAD-related neuropathology.
The final genotype-phenotype association was a negative correlation between G3 and S1.G3 included ATP5G2, a subunit of mitochondrial ATP-synthase, which was over-represented in the disease group. Mitochondrial ATP-synthase in entorhinal cortex is a targetof oxidative stress in LOAD (Terni et al., 2010) and part of LOAD apoptosis pathways.Several other G3 genes included dominant signaling from CNTN5, recently associated withmultiple AD MRI characteristics (Biffi et al., 2010), CEP57, a microtubular/centrosomallocalizer (Meunier et al., 2009), MTMR2, an endosomal regulator (Lee et al., 2010), andATF7, associated with LOAD in Lin et al. (Lin et al., 2006). The loading of previouslyidentified LOAD genes and associated pathobiological pathways further supports therelevance of this genetic network.
Analyzing significant genes from all four components using DAVID and visualizing relatedprocesses on KEGG pathways revealed that genes grouped in multiple LOAD-relevantbiological processes (see Figure 4). Additional prominent processes not shown in figureincluded cellular communication, cardiovascular diseases, signal transduction, calciumsignaling, cell adhesion and neuronal developmental processes (e.g. axon guidance). Many
Meda et al. Page 8
Neuroimage. Author manuscript; available in PMC 2013 April 15.
NIH
-PA Author Manuscript
NIH
-PA Author Manuscript
NIH
-PA Author Manuscript
such processes are implicated in LOAD pathology (e.g. neuronal calcium signaling (Kostiuket al., 2010; LaFerla, 2002; Mattson and Chan, 2003)). Semaphorin 3A, an axon-guidingmembrane protein, accumulates in hippocampus in AD (Koncina et al., 2007).
Major themes deriving from the top 32 Z score-defined genes in the 4 SNP componentssuggest several major pathophysiological LOAD pathways, especially when such genes co-occurred within a component. From G1, APOE may relate to LOAD risk through pathwaysnot directly linked to amyloid-beta, including actin-related mechanisms. Actin cytoskeletalchanges as a path to tau formation (Gallo, 2007) are implicated across all components bySCLC987/NHE7 (Kagami et al., 2008; Ohgaki et al., 2008), SHROOM2 and COBL(Dominguez, 2009) and microtubule-related genes including MTMR2, CEP57 andCTNND2 (Bamburg and Bloom, 2009; Meunier et al., 2009). Three such genes were presentin component 1. Immune function, especially the complement system, related to amyloid-beta clearance (Guerreiro et al., 2010; Kolev et al., 2009) and expressed in cerebrovascularsmooth muscle (Walker et al., 2008), is suggested by ATF7, CFB, C2, SKIV2L, C6orf10and C6orf15 (Li et al., 2006; Veerhuis, 2010). These genes support the known role of thecomplement system in LOAD pathogenesis (van Es and van den Berg, 2009), while addingnew gene candidates, e.g. C2. Complement is present in dystrophic LOAD neurites,involved in immune response and linked to synaptic pruning (Hollingworth et al., 2010).Five immune related/complement genes are present in G4.
CTNND2/Delta Catenin/NPRAP is associated with GSK3-beta, hence BAP and tau (Bareisset al., 2010). CNTN5 encodes contactin5; other contactins participate in LOAD risk, (Biffiet al., 2010; Osterfield et al., 2008). The prominence of SCLC987/NHE7(and MTMR2)suggests the importance of the trans-Golgi network and recycling endosome (Lee et al.,2010). Endosomal processing of APP involving SorLA is of importance in LOAD (Lin etal., 2005; Marks and Berg, 2010; Ohgaki et al., 2008). VPS proteins are related to thisprocess (He et al., 2005; Marks and Berg, 2010), although VPS13C has yet to be implicated.VPS13C is associated with maintenance of plasma glucose levels (Saxena et al., 2010); therelated VPS26 is linked with BACE/memapsin2 (He et al., 2005). CL44A4 is involved incholine uptake (Jurgensen and Ferreira, 2010). MTMR2 has relevance to excitatory synapses(Lee et al., 2010). ZKSCAN3/ZNF263 is associated with vascular endothelial growth factor(Yang et al., 2008).
The above data suggest involvement of multiple genes influencing varied, complexpathways that might interact mutually to contribute to LOAD. Output from Para-ICA lendsitself readily to functional pathway analysis and ultimately systems biology. We alsoidentified novel putative LOAD risk genes, confirmed via testing allelic frequencydistributions among disgnostic groups in standard case-control association analyses. It isnotable that while none of these genes survived a standard GWAS study, they have highimpact when their effect is evaluated in the context of other SNPs. In addition, the SNPcomponents detected several genes previously unknown in the context of LOAD risk,having high Z scores, exceeding those for APOE. Several of these (e.g. SLC9A7, ZNF673,VPS13) were: (a) identified by multiple (up to 17) SNPs, (b) mediate processes plausiblyassociated with LOAD risk from pathway analyses and prior publications, (c) had SNPsdifferentially distributed among diagnostic groups and (d) are prominently expressed inbrain. These results suggest validity of these novel loci as candidate LOAD risk genes.
Examining loading coefficients of the gene and structural networks revealed a steppedresponse pattern (see Fig S2), with MCI values falling between those of healthy control andAD, except for in G3, where they were elevated in MCI compared to AD, suggesting thatthis gene component may act to either protect against or hasten regional brain deteriorationin MCI to influence progression rate to AD.
Meda et al. Page 9
Neuroimage. Author manuscript; available in PMC 2013 April 15.
NIH
-PA Author Manuscript
NIH
-PA Author Manuscript
NIH
-PA Author Manuscript
Our study has limitations. Although the Para-ICA method is data driven, we restricted thegenetic dataset to a disease-related subset. This focused analysis might fail to uncover genesaffecting LOAD pathology via other interactive pathways that may not straightforwardlyshow group differences. However, since we employed a liberal statistical threshold to limitthe genetic dataset to disease-related genes, we were able to include numerous SNPsdiscarded by conventional univariate studies. Our AD/MCI-focused gene set analysis maynot have detected other genetic associations to brain structure. The analysis was carried outonly in European-Americans, by far the most numerous ethnicity in the dataset. Futurestudies could include larger mixed populations. Also, since para-ICA identified multivariaterelationships at the gene network level (comprised of linear combinations of SNPs), thedirectionality and effect magnitude of individual SNPs is not immediately transparent. Oursupplementary association analysis to derive the top SNPs might be slightly biased, as theywere already pre-selected at a liberal cut-off to be included in the multivariate analysis.Given these limitations and the novelty of our study, our results require further validationand replication in more diverse and larger independent datasets.
In conclusion, we met our major study goals by 1) confirming the feasibility of a hypothesis-blind, multivariate approach to corroborate LOAD genes associated with known pathologicmechanisms and to discover new putative disease-relevant genes that interact but failindividually to reach genome-wide significance. These data thus extend existing GWAS andhypothesis-driven analyses on the same ADNI data set (Biffi et al., 2010; Saykin et al.,2010; Shen et al., 2010). 2) The Para-ICA approach identifies genes in relatively modestsized samples that are plausibly linked collectively in known physiologic pathways, perhapsepistatically and suggests itself as a novel method for exploring other large-scale data setsinvolving gene and endophenotype information such as BSNIP or COGS (Calkins et al.,2007; Thaker, 2008), in psychotic disorders where the neuropathology and genetic basis areless well-defined than LOAD. Finally, 3) we identified plausible new biological pathwaysassociated with AD neuropathology. Possible therapies resulting from our findings mightinclude agents targeted to the complement and/or immune systems.
Supplementary MaterialRefer to Web version on PubMed Central for supplementary material.
AcknowledgmentsThe study was supported by the following grants and research support to Dr. Andrew Saykin from Eli Lilly andCompany, Siemens AG, Welch Allyn Inc., the NIH (R01 CA101318 [PI], R01 AG19771 [PI], RC2 AG036535[Core Leader], P30 AG10133-18S1 [Core Leader], and U01 AG032984 [Site PI and Chair, Genetics WorkingGroup]), the Indiana Economic Development Corporation (IEDC #87884), and the Foundation for the NIH, Dr.Vince Calhoun NIH ROIEB005846. We would also like to thank Mrs. Joanna Mounce for assistance with thebiological pathways and network analyses used in these studies.
Data collection and sharing for this project was funded by the Alzheimer’s Disease Neuroimaging Initiative(ADNI) (National Institutes of Health Grant U01 AG024904). ADNI is funded by the National Institute on Aging,the National Institute of Biomedical Imaging and Bioengineering, and through generous contributions from thefollowing: Abbott; Alzheimer’s Association; Alzheimer’s Drug Discovery Foundation; Amorfix Life Sciences Ltd.;AstraZeneca; Bayer HealthCare; BioClinica, Inc.; Biogen Idec Inc.; Bristol-Myers Squibb Company; Eisai Inc.;Elan Pharmaceuticals Inc.; Eli Lilly and Company; F. Hoffmann-La Roche Ltd and its affiliated companyGenentech, Inc.; GE Healthcare; Innogenetics, N.V.;Janssen Alzheimer Immunotherapy Research & Development,LLC.; Johnson & Johnson Pharmaceutical Research & Development LLC.; Medpace, Inc.; Merck & Co., Inc.;Meso Scale Diagnostics, LLC.; Novartis Pharmaceuticals Corporation; Pfizer Inc.; Servier; Synarc Inc.; and TakedaPharmaceutical Company. The Canadian Institutes of Health Research is providing funds to support ADNI clinicalsites in Canada. Private sector contributions are facilitated by the Foundation for the National Institutes of Health(www.fnih.org). The grantee organization is the Northern California Institute for Research and Education, and thestudy is coordinated by the Alzheimer’s Disease Cooperative Study at the University of California,San Diego.
Meda et al. Page 10
Neuroimage. Author manuscript; available in PMC 2013 April 15.
NIH
-PA Author Manuscript
NIH
-PA Author Manuscript
NIH
-PA Author Manuscript
ADNI data are disseminated by the Laboratory for Neuro Imaging at the University of California, Los Angeles.This research was also supported by NIH grants P30 AG010129, K01 AG030514, and the Dana Foundation.
ReferencesBamburg JR, Bloom GS. Cytoskeletal pathologies of Alzheimer disease. Cell Motil Cytoskeleton.
2009; 66:635–649. [PubMed: 19479823]Bareiss S, Kim K, Lu Q. Delta-catenin/NPRAP: A new member of the glycogen synthase kinase-3beta
signaling complex that promotes beta-catenin turnover in neurons. J Neurosci Res. 2010; 88:2350–2363. [PubMed: 20623542]
Bekris LM, Yu CE, Bird TD, Tsuang DW. Genetics of Alzheimer disease. J Geriatr Psychiatry Neurol.2010; 23:213–227. [PubMed: 21045163]
Biffi A, Anderson CD, Desikan RS, Sabuncu M, Cortellini L, Schmansky N, Salat D, Rosand J.Genetic variation and neuroimaging measures in Alzheimer disease. Arch Neurol. 2010; 67:677–685. [PubMed: 20558387]
Calhoun VD, Adali T, Pearlson GD, Pekar JJ. A method for making group inferences from functionalMRI data using independent component analysis. Hum Brain Mapp. 2001; 14:140–151. [PubMed:11559959]
Calhoun VD, Liu J, Adali T. A review of group ICA for fMRI data and ICA for joint inference ofimaging, genetic, and ERP data. Neuroimage. 2009; 45:S163–172. [PubMed: 19059344]
Dominguez R. Actin filament nucleation and elongation factors--structure-function relationships. CritRev Biochem Mol Biol. 2009; 44:351–366. [PubMed: 19874150]
Eccles D, Tapper W. The influence of common polymorphisms on breast cancer. Cancer Treat Res.2010; 155:15–32. [PubMed: 20517686]
Gallo G. Tau is actin up in Alzheimer’s disease. Nat Cell Biol. 2007; 9:133–134. [PubMed: 17268475]Gandhi S, Wood NW. Genome-wide association studies: the key to unlocking neurodegeneration? Nat
Neurosci. 2010; 13:789–794. [PubMed: 20581814]Gatz M, Mortimer JA, Fratiglioni L, Johansson B, Berg S, Reynolds CA, Pedersen NL. Potentially
modifiable risk factors for dementia in identical twins. Alzheimers Dement. 2006a; 2:110–117.[PubMed: 19595867]
Gatz M, Reynolds CA, Fratiglioni L, Johansson B, Mortimer JA, Berg S, Fiske A, Pedersen NL. Roleof genes and environments for explaining Alzheimer disease. Arch Gen Psychiatry. 2006b;63:168–174. [PubMed: 16461860]
Grupe A, Abraham R, Li Y, Rowland C, Hollingworth P, Morgan A, Jehu L, Segurado R, Stone D,Schadt E, Karnoub M, Nowotny P, Tacey K, Catanese J, Sninsky J, Brayne C, Rubinsztein D, GillM, Lawlor B, Lovestone S, Holmans P, O’Donovan M, Morris JC, Thal L, Goate A, Owen MJ,Williams J. Evidence for novel susceptibility genes for late-onset Alzheimer’s disease from agenome-wide association study of putative functional variants. Hum Mol Genet. 2007; 16:865–873. [PubMed: 17317784]
Guerreiro RJ, Gustafson DR, Hardy J. The genetic architecture of Alzheimer’s disease: beyond APP,PSENs and APOE. Neurobiol Aging. 2010
Harold D, Abraham R, Hollingworth P, Sims R, Gerrish A, Hamshere ML, Pahwa JS, Moskvina V,Dowzell K, Williams A, Jones N, Thomas C, Stretton A, Morgan AR, Lovestone S, Powell J,Proitsi P, Lupton MK, Brayne C, Rubinsztein DC, Gill M, Lawlor B, Lynch A, Morgan K, BrownKS, Passmore PA, Craig D, McGuinness B, Todd S, Holmes C, Mann D, Smith AD, Love S,Kehoe PG, Hardy J, Mead S, Fox N, Rossor M, Collinge J, Maier W, Jessen F, Schurmann B, vanden Bussche H, Heuser I, Kornhuber J, Wiltfang J, Dichgans M, Frolich L, Hampel H, Hull M,Rujescu D, Goate AM, Kauwe JS, Cruchaga C, Nowotny P, Morris JC, Mayo K, Sleegers K,Bettens K, Engelborghs S, De Deyn PP, Van Broeckhoven C, Livingston G, Bass NJ, Gurling H,McQuillin A, Gwilliam R, Deloukas P, Al-Chalabi A, Shaw CE, Tsolaki M, Singleton AB,Guerreiro R, Muhleisen TW, Nothen MM, Moebus S, Jockel KH, Klopp N, Wichmann HE,Carrasquillo MM, Pankratz VS, Younkin SG, Holmans PA, O’Donovan M, Owen MJ, Williams J.Genome-wide association study identifies variants at CLU and PICALM associated withAlzheimer’s disease. Nat Genet. 2009; 41:1088–1093. [PubMed: 19734902]
Meda et al. Page 11
Neuroimage. Author manuscript; available in PMC 2013 April 15.
NIH
-PA Author Manuscript
NIH
-PA Author Manuscript
NIH
-PA Author Manuscript
He X, Li F, Chang WP, Tang J. GGA proteins mediate the recycling pathway of memapsin 2 (BACE).J Biol Chem. 2005; 280:11696–11703. [PubMed: 15615712]
Hollingworth P, Harold D, Jones L, Owen MJ, Williams J. Alzheimer’s disease genetics: currentknowledge and future challenges. Int J Geriatr Psychiatry. 2010
Jack CR Jr. Bernstein MA, Borowski BJ, Gunter JL, Fox NC, Thompson PM, Schuff N, Krueger G,Killiany RJ, Decarli CS, Dale AM, Carmichael OW, Tosun D, Weiner MW. Update on themagnetic resonance imaging core of the Alzheimer’s disease neuroimaging initiative. AlzheimersDement. 2010a; 6:212–220. [PubMed: 20451869]
Jack CR Jr. Wiste HJ, Vemuri P, Weigand SD, Senjem ML, Zeng G, Bernstein MA, Gunter JL,Pankratz VS, Aisen PS, Weiner MW, Petersen RC, Shaw LM, Trojanowski JQ, Knopman DS.Brain beta-amyloid measures and magnetic resonance imaging atrophy both predict time-to-progression from mild cognitive impairment to Alzheimer’s disease. Brain. 2010b; 133:3336–3348. [PubMed: 20935035]
Jagannathan K, Calhoun VD, Gelernter J, Stevens MC, Liu J, Bolognani F, Windemuth A, Ruano G,Assaf M, Pearlson GD. Genetic associations of brain structural networks in schizophrenia: apreliminary study. Biol Psychiatry. 2010; 68:657–666. [PubMed: 20691427]
Jurgensen S, Ferreira ST. Nicotinic receptors, amyloid-beta, and synaptic failure in Alzheimer’sdisease. J Mol Neurosci. 2010; 40:221–229. [PubMed: 19690986]
Kagami T, Chen S, Memar P, Choi M, Foster LJ, Numata M. Identification and biochemicalcharacterization of the SLC9A7 interactome. Mol Membr Biol. 2008; 25:436–447. [PubMed:18654930]
Kolev MV, Ruseva MM, Harris CL, Morgan BP, Donev RM. Implication of complement system andits regulators in Alzheimer’s disease. Curr Neuropharmacol. 2009; 7:1–8. [PubMed: 19721814]
Koncina E, Roth L, Gonthier B, Bagnard D. Role of semaphorins during axon growth and guidance.Adv Exp Med Biol. 2007; 621:50–64. [PubMed: 18269210]
Kostiuk OP, Korol T, Korol SV, Romanenko SV, Pinchenko VO, Kostiuk PH. [Alteration of calciumsignaling as one of the mechanisms of Alzheimer’s disease and diabetic polyneuropathy]. FiziolZh. 2010; 56:130–138. [PubMed: 20968046]
Ku CS, Loy EY, Pawitan Y, Chia KS. The pursuit of genome-wide association studies: where are wenow? J Hum Genet. 2011; 55:195–206. [PubMed: 20300123]
LaFerla FM. Calcium dyshomeostasis and intracellular signalling in Alzheimer’s disease. Nat RevNeurosci. 2002; 3:862–872. [PubMed: 12415294]
Lee HW, Kim Y, Han K, Kim H, Kim E. The phosphoinositide 3-phosphatase MTMR2 interacts withPSD-95 and maintains excitatory synapses by modulating endosomal traffic. J Neurosci. 2010;30:5508–5518. [PubMed: 20410104]
Li D, Parks SB, Kushner JD, Nauman D, Burgess D, Ludwigsen S, Partain J, Nixon RR, Allen CN,Irwin RP, Jakobs PM, Litt M, Hershberger RE. Mutations of presenilin genes in dilatedcardiomyopathy and heart failure. Am J Hum Genet. 2006; 79:1030–1039. [PubMed: 17186461]
Lin PI, Martin ER, Browning-Large CA, Schmechel DE, Welsh-Bohmer KA, Doraiswamy PM,Gilbert JR, Haines JL, Pericak-Vance MA. Parsing the genetic heterogeneity of chromosome 12qsusceptibility genes for Alzheimer disease by family-based association analysis. Neurogenetics.2006; 7:157–165. [PubMed: 16770605]
Lin PJ, Williams WP, Luu Y, Molday RS, Orlowski J, Numata M. Secretory carrier membraneproteins interact and regulate trafficking of the organellar (Na+,K+)/H+ exchanger NHE7. J CellSci. 2005; 118:1885–1897. [PubMed: 15840657]
Liu J, Demirci O, Calhoun VD. A Parallel Independent Component Analysis Approach to InvestigateGenomic Influence on Brain Function. IEEE Signal Process Lett. 2008; 15:413–416. [PubMed:19834575]
Lugtenberg D, Yntema HG, Banning MJ, Oudakker AR, Firth HV, Willatt L, Raynaud M, Kleefstra T,Fryns JP, Ropers HH, Chelly J, Moraine C, Gecz J, van Reeuwijk J, Nabuurs SB, de Vries BB,Hamel BC, de Brouwer AP, van Bokhoven H. ZNF674: a new kruppel-associated box-containingzinc-finger gene involved in nonsyndromic X-linked mental retardation. Am J Hum Genet. 2006;78:265–278. [PubMed: 16385466]
Meda et al. Page 12
Neuroimage. Author manuscript; available in PMC 2013 April 15.
NIH
-PA Author Manuscript
NIH
-PA Author Manuscript
NIH
-PA Author Manuscript

Marks N, Berg MJ. BACE and gamma-secretase characterization and their sorting as therapeutictargets to reduce amyloidogenesis. Neurochem Res. 2010; 35:181–210. [PubMed: 19760173]
Mattson MP, Chan SL. Neuronal and glial calcium signaling in Alzheimer’s disease. Cell Calcium.2003; 34:385–397. [PubMed: 12909083]
Meda SA, Jagannathan K, Gelernter J, Calhoun VD, Liu J, Stevens MC, Pearlson GD. A pilotmultivariate parallel ICA study to investigate differential linkage between neural networks andgenetic profiles in schizophrenia. Neuroimage. 2010; 53:1007–1015. [PubMed: 19944766]
Meunier S, Navarro MG, Bossard C, Laurell H, Touriol C, Lacazette E, Prats H. Pivotal role oftranslokin/CEP57 in the unconventional secretion versus nuclear translocation of FGF2. Traffic.2009; 10:1765–1772. [PubMed: 19804566]
Naj AC, Jun G, Beecham GW, Wang LS, Vardarajan BN, Buros J, Gallins PJ, Buxbaum JD, JarvikGP, Crane PK, Larson EB, Bird TD, Boeve BF, Graff-Radford NR, De Jager PL, Evans D,Schneider JA, Carrasquillo MM, Ertekin-Taner N, Younkin SG, Cruchaga C, Kauwe JS, NowotnyP, Kramer P, Hardy J, Huentelman MJ, Myers AJ, Barmada MM, Demirci FY, Baldwin CT,Green RC, Rogaeva E, St George-Hyslop P, Arnold SE, Barber R, Beach T, Bigio EH, Bowen JD,Boxer A, Burke JR, Cairns NJ, Carlson CS, Carney RM, Carroll SL, Chui HC, Clark DG,Corneveaux J, Cotman CW, Cummings JL, DeCarli C, DeKosky ST, Diaz-Arrastia R, Dick M,Dickson DW, Ellis WG, Faber KM, Fallon KB, Farlow MR, Ferris S, Frosch MP, Galasko DR,Ganguli M, Gearing M, Geschwind DH, Ghetti B, Gilbert JR, Gilman S, Giordani B, Glass JD,Growdon JH, Hamilton RL, Harrell LE, Head E, Honig LS, Hulette CM, Hyman BT, Jicha GA,Jin LW, Johnson N, Karlawish J, Karydas A, Kaye JA, Kim R, Koo EH, Kowall NW, Lah JJ,Levey AI, Lieberman AP, Lopez OL, Mack WJ, Marson DC, Martiniuk F, Mash DC, Masliah E,McCormick WC, McCurry SM, McDavid AN, McKee AC, Mesulam M, Miller BL, Miller CA,Miller JW, Parisi JE, Perl DP, Peskind E, Petersen RC, Poon WW, Quinn JF, Rajbhandary RA,Raskind M, Reisberg B, Ringman JM, Roberson ED, Rosenberg RN, Sano M, Schneider LS,Seeley W, Shelanski ML, Slifer MA, Smith CD, Sonnen JA, Spina S, Stern RA, Tanzi RE,Trojanowski JQ, Troncoso JC, Van Deerlin VM, Vinters HV, Vonsattel JP, Weintraub S, Welsh-Bohmer KA, Williamson J, Woltjer RL, Cantwell LB, Dombroski BA, Beekly D, Lunetta KL,Martin ER, Kamboh MI, Saykin AJ, Reiman EM, Bennett DA, Morris JC, Montine TJ, Goate AM,Blacker D, Tsuang DW, Hakonarson H, Kukull WA, Foroud TM, Haines JL, Mayeux R, Pericak-Vance MA, Farrer LA, Schellenberg GD. Common variants at MS4A4/MS4A6E, CD2AP, CD33and EPHA1 are associated with late-onset Alzheimer’s disease. Nat Genet. 2011; 43:436–441.[PubMed: 21460841]
Ohgaki R, Fukura N, Matsushita M, Mitsui K, Kanazawa H. Cell surface levels of organellar Na+/H+exchanger isoform 6 are regulated by interaction with RACK1. J Biol Chem. 2008; 283:4417–4429. [PubMed: 18057008]
Osterfield M, Egelund R, Young LM, Flanagan JG. Interaction of amyloid precursor protein withcontactins and NgCAM in the retinotectal system. Development. 2008; 135:1189–1199. [PubMed:18272596]
Pimplikar SW, Nixon RA, Robakis NK, Shen J, Tsai LH. Amyloid-independent mechanisms inAlzheimer’s disease pathogenesis. J Neurosci. 2010; 30:14946–14954. [PubMed: 21068297]
Potkin SG, Guffanti G, Lakatos A, Turner JA, Kruggel F, Fallon JH, Saykin AJ, Orro A, Lupoli S,Salvi E, Weiner M, Macciardi F. Hippocampal atrophy as a quantitative trait in a genome-wideassociation study identifying novel susceptibility genes for Alzheimer’s disease. PLoS One. 2009;4:e6501. [PubMed: 19668339]
Profenno LA, Porsteinsson AP, Faraone SV. Meta-analysis of Alzheimer’s disease risk with obesity,diabetes, and related disorders. Biol Psychiatry. 2010; 67:505–512. [PubMed: 19358976]
Ramaswamy V, Castillo M, Bolduc FV. Developmental disability: duplication of zinc fingertranscription factors 673 and 674. Pediatr Neurol. 2010; 43:209–212. [PubMed: 20691945]
Saxena R, Hivert MF, Langenberg C, Tanaka T, Pankow JS, Vollenweider P, Lyssenko V, Bouatia-Naji N, Dupuis J, Jackson AU, Kao WH, Li M, Glazer NL, Manning AK, Luan J, Stringham HM,Prokopenko I, Johnson T, Grarup N, Boesgaard TW, Lecoeur C, Shrader P, O’Connell J,Ingelsson E, Couper DJ, Rice K, Song K, Andreasen CH, Dina C, Kottgen A, Le Bacquer O,Pattou F, Taneera J, Steinthorsdottir V, Rybin D, Ardlie K, Sampson M, Qi L, van Hoek M,Weedon MN, Aulchenko YS, Voight BF, Grallert H, Balkau B, Bergman RN, Bielinski SJ,
Meda et al. Page 13
Neuroimage. Author manuscript; available in PMC 2013 April 15.
NIH
-PA Author Manuscript
NIH
-PA Author Manuscript
NIH
-PA Author Manuscript

Bonnefond A, Bonnycastle LL, Borch-Johnsen K, Bottcher Y, Brunner E, Buchanan TA,Bumpstead SJ, Cavalcanti-Proenca C, Charpentier G, Chen YD, Chines PS, Collins FS, CornelisM, G JC, Delplanque J, Doney A, Egan JM, Erdos MR, Firmann M, Forouhi NG, Fox CS,Goodarzi MO, Graessler J, Hingorani A, Isomaa B, Jorgensen T, Kivimaki M, Kovacs P, KrohnK, Kumari M, Lauritzen T, Levy-Marchal C, Mayor V, McAteer JB, Meyre D, Mitchell BD,Mohlke KL, Morken MA, Narisu N, Palmer CN, Pakyz R, Pascoe L, Payne F, Pearson D,Rathmann W, Sandbaek A, Sayer AA, Scott LJ, Sharp SJ, Sijbrands E, Singleton A, Siscovick DS,Smith NL, Sparso T, Swift AJ, Syddall H, Thorleifsson G, Tonjes A, Tuomi T, Tuomilehto J,Valle TT, Waeber G, Walley A, Waterworth DM, Zeggini E, Zhao JH, Illig T, Wichmann HE,Wilson JF, van Duijn C, Hu FB, Morris AD, Frayling TM, Hattersley AT, Thorsteinsdottir U,Stefansson K, Nilsson P, Syvanen AC, Shuldiner AR, Walker M, Bornstein SR, Schwarz P,Williams GH, Nathan DM, Kuusisto J, Laakso M, Cooper C, Marmot M, Ferrucci L, Mooser V,Stumvoll M, Loos RJ, Altshuler D, Psaty BM, Rotter JI, Boerwinkle E, Hansen T, Pedersen O,Florez JC, McCarthy MI, Boehnke M, Barroso I, Sladek R, Froguel P, Meigs JB, Groop L,Wareham NJ, Watanabe RM. Genetic variation in GIPR influences the glucose and insulinresponses to an oral glucose challenge. Nat Genet. 2010; 42:142–148. [PubMed: 20081857]
Saykin AJ, Shen L, Foroud TM, Potkin SG, Swaminathan S, Kim S, Risacher SL, Nho K, HuentelmanMJ, Craig DW, Thompson PM, Stein JL, Moore JH, Farrer LA, Green RC, Bertram L, Jack CR Jr.Weiner MW. Alzheimer’s Disease Neuroimaging Initiative biomarkers as quantitative phenotypes:Genetics core aims, progress, and plans. Alzheimers Dement. 2010; 6:265–273. [PubMed:20451875]
Seshadri S, Fitzpatrick AL, Ikram MA, DeStefano AL, Gudnason V, Boada M, Bis JC, Smith AV,Carassquillo MM, Lambert JC, Harold D, Schrijvers EM, Ramirez-Lorca R, Debette S, LongstrethWT Jr. Janssens AC, Pankratz VS, Dartigues JF, Hollingworth P, Aspelund T, Hernandez I, BeiserA, Kuller LH, Koudstaal PJ, Dickson DW, Tzourio C, Abraham R, Antunez C, Du Y, Rotter JI,Aulchenko YS, Harris TB, Petersen RC, Berr C, Owen MJ, Lopez-Arrieta J, Varadarajan BN,Becker JT, Rivadeneira F, Nalls MA, Graff-Radford NR, Campion D, Auerbach S, Rice K,Hofman A, Jonsson PV, Schmidt H, Lathrop M, Mosley TH, Au R, Psaty BM, Uitterlinden AG,Farrer LA, Lumley T, Ruiz A, Williams J, Amouyel P, Younkin SG, Wolf PA, Launer LJ, LopezOL, van Duijn CM, Breteler MM. Genome-wide analysis of genetic loci associated withAlzheimer disease. JAMA. 2010; 303:1832–1840. [PubMed: 20460622]
Shen L, Kim S, Risacher SL, Nho K, Swaminathan S, West JD, Foroud T, Pankratz N, Moore JH,Sloan CD, Huentelman MJ, Craig DW, Dechairo BM, Potkin SG, Jack CR Jr. Weiner MW,Saykin AJ. Whole genome association study of brain-wide imaging phenotypes for identifyingquantitative trait loci in MCI and AD: A study of the ADNI cohort. Neuroimage. 2010; 53:1051–1063. [PubMed: 20100581]
Smith CD. Neuroimaging through the course of Alzheimer’s disease. J Alzheimers Dis. 2010; 19:273–290. [PubMed: 20061644]
Stieber A, Mourelatos Z, Gonatas NK. In Alzheimer’s disease the Golgi apparatus of a population ofneurons without neurofibrillary tangles is fragmented and atrophic. Am J Pathol. 1996; 148:415–426. [PubMed: 8579105]
Strittmatter WJ, Saunders AM, Schmechel D, Pericak-Vance M, Enghild J, Salvesen GS, Roses AD.Apolipoprotein E: high-avidity binding to beta-amyloid and increased frequency of type 4 allele inlate-onset familial Alzheimer disease. Proc Natl Acad Sci U S A. 1993; 90:1977–1981. [PubMed:8446617]
Terni B, Boada J, Portero-Otin M, Pamplona R, Ferrer I. Mitochondrial ATP-synthase in theentorhinal cortex is a target of oxidative stress at stages I/II of Alzheimer’s disease pathology.Brain Pathol. 2010; 20:222–233. [PubMed: 19298596]
Traynor BJ, Singleton AB. Nature versus nurture: death of a dogma, and the road ahead. Neuron.2010; 68:196–200. [PubMed: 20955927]
Urcelay E, Ibarreta D, Parrilla R, Ayuso MS, Martin-Requero A. Enhanced proliferation oflymphoblasts from patients with Alzheimer dementia associated with calmodulin-dependentactivation of the na+/H+ exchanger. Neurobiol Dis. 2001; 8:289–298. [PubMed: 11300724]
van Es MA, van den Berg LH. Alzheimer’s disease beyond APOE. Nat Genet. 2009; 41:1047–1048.[PubMed: 19786950]
Meda et al. Page 14
Neuroimage. Author manuscript; available in PMC 2013 April 15.
NIH
-PA Author Manuscript
NIH
-PA Author Manuscript
NIH
-PA Author Manuscript
Veerhuis R. Histological and Direct Evidence for the Role of Complement in the Neuroinflammationof AD. Curr Alzheimer Res. 2010
Villain N, Chetelat G, Desgranges B, Eustache F. [Neuroimaging in Alzheimer’s disease: a synthesisand a contribution to the understanding of physiopathological mechanisms]. Biol Aujourdhui.2010; 204:145–158. [PubMed: 20950559]
Walker DG, Dalsing-Hernandez JE, Lue LF. Human postmortem brain-derived cerebrovascularsmooth muscle cells express all genes of the classical complement pathway: a potentialmechanism for vascular damage in cerebral amyloid angiopathy and Alzheimer’s disease.Microvasc Res. 2008; 75:411–419. [PubMed: 18048067]
Yang L, Zhang L, Wu Q, Boyd DD. Unbiased screening for transcriptional targets of ZKSCAN3identifies integrin beta 4 and vascular endothelial growth factor as downstream targets. J BiolChem. 2008; 283:35295–35304. [PubMed: 18940803]
Meda et al. Page 15
Neuroimage. Author manuscript; available in PMC 2013 April 15.
NIH
-PA Author Manuscript
NIH
-PA Author Manuscript
NIH
-PA Author Manuscript

Figure 1.Flow diagram illustrating the Para-ICA technique employed in this study.
Meda et al. Page 16
Neuroimage. Author manuscript; available in PMC 2013 April 15.
NIH
-PA Author Manuscript
NIH
-PA Author Manuscript
NIH
-PA Author Manuscript
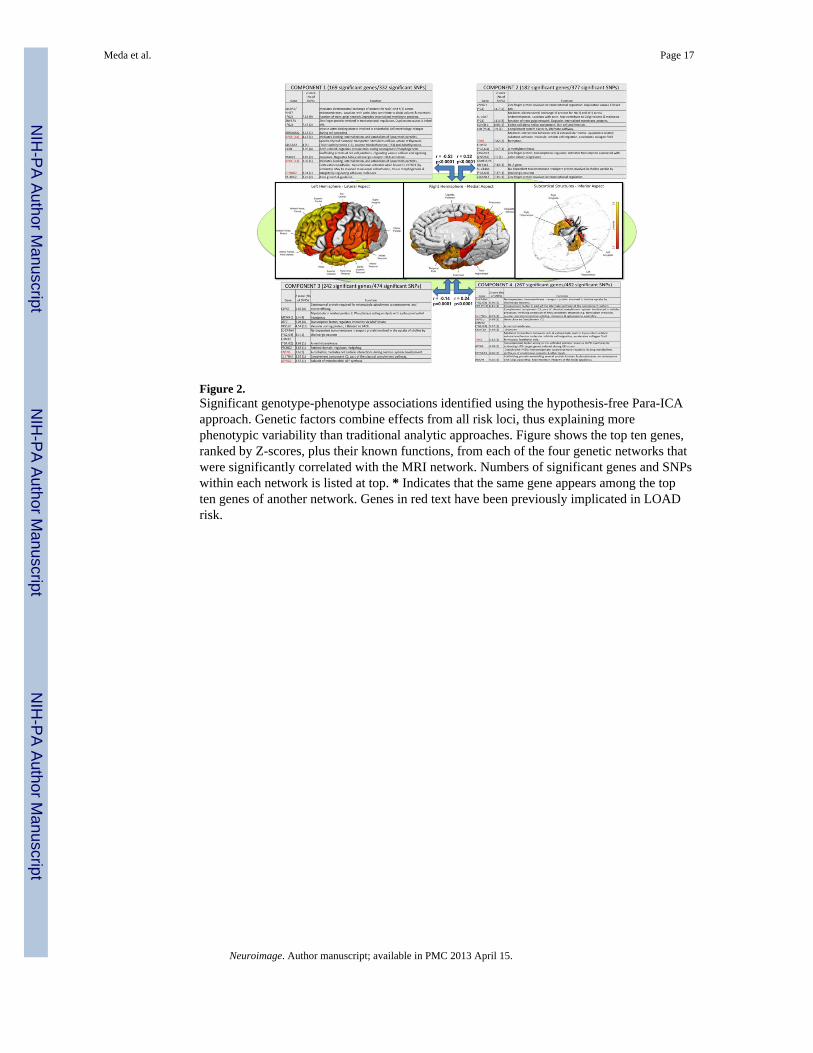
Figure 2.Significant genotype-phenotype associations identified using the hypothesis-free Para-ICAapproach. Genetic factors combine effects from all risk loci, thus explaining morephenotypic variability than traditional analytic approaches. Figure shows the top ten genes,ranked by Z-scores, plus their known functions, from each of the four genetic networks thatwere significantly correlated with the MRI network. Numbers of significant genes and SNPswithin each network is listed at top. * Indicates that the same gene appears among the topten genes of another network. Genes in red text have been previously implicated in LOADrisk.
Meda et al. Page 17
Neuroimage. Author manuscript; available in PMC 2013 April 15.
NIH
-PA Author Manuscript
NIH
-PA Author Manuscript
NIH
-PA Author Manuscript
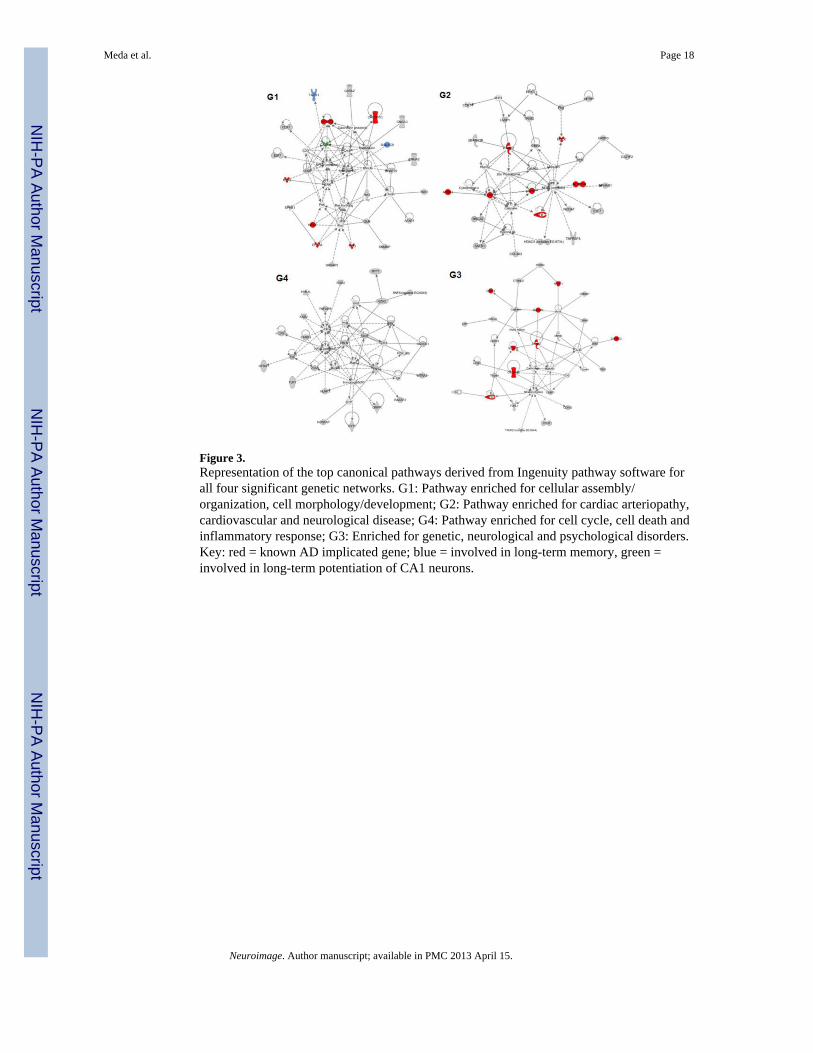
Figure 3.Representation of the top canonical pathways derived from Ingenuity pathway software forall four significant genetic networks. G1: Pathway enriched for cellular assembly/organization, cell morphology/development; G2: Pathway enriched for cardiac arteriopathy,cardiovascular and neurological disease; G4: Pathway enriched for cell cycle, cell death andinflammatory response; G3: Enriched for genetic, neurological and psychological disorders.Key: red = known AD implicated gene; blue = involved in long-term memory, green =involved in long-term potentiation of CA1 neurons.
Meda et al. Page 18
Neuroimage. Author manuscript; available in PMC 2013 April 15.
NIH
-PA Author Manuscript
NIH
-PA Author Manuscript
NIH
-PA Author Manuscript

Figure 4.Genes identified as part of the significant Para-ICA networks highlighted on a KEGGAlzheimer’s pathway diagram derived from the DAVID functional association tool. Genesidentified using red stars occurred in 1 or more of our 4 gene networks. Genes indicated inred text are the primary genes identified to date responsible for the early form of AD (PSEN,APP) or account for a major proportion of LOAD risk (APOE).
Meda et al. Page 19
Neuroimage. Author manuscript; available in PMC 2013 April 15.
NIH
-PA Author Manuscript
NIH
-PA Author Manuscript
NIH
-PA Author Manuscript
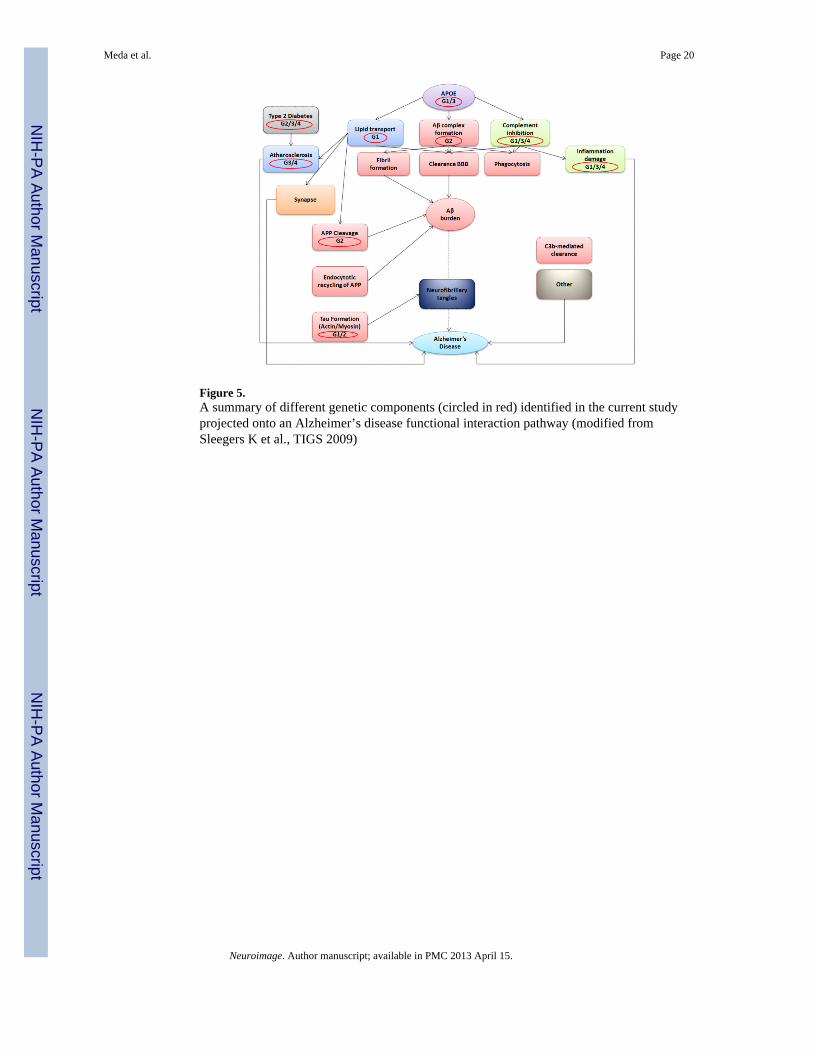
Figure 5.A summary of different genetic components (circled in red) identified in the current studyprojected onto an Alzheimer’s disease functional interaction pathway (modified fromSleegers K et al., TIGS 2009)
Meda et al. Page 20
Neuroimage. Author manuscript; available in PMC 2013 April 15.
NIH
-PA Author Manuscript
NIH
-PA Author Manuscript
NIH
-PA Author Manuscript

NIH
-PA Author Manuscript
NIH
-PA Author Manuscript
NIH
-PA Author Manuscript
Meda et al. Page 21
Table 1
Details all Freesurfer-derived regions of interest used as the imaging phenotype
Rank order Region Abs Z-Score forNetwork S1
1 Left Superior Frontal ** 2.82
2 Right Superior Frontal ** 2.80
3 Left Entorhinal Cortex ** 2.74
4 Left Middle Temporal ** 2.72
5 Left Rostral Mid Frontal ** 2.65
6 Left Caudal Mid Frontal ** 2.64
7 Left Inferior Temporal ** 2.58
8 Right Middle Temporal ** 2.58
9 Right Hippocampus Volume ** 2.57
10 Right Entorhinal Cortex ** 2.56
11 Right Rostral Mid Frontal ** 2.54
12 Left Hippocampus Volume ** 2.52
13 Left Isthmus Cingulate ** 2.51
14 Right Caudal Mid Frontal ** 2.47
15 Right Isthmus Cingulate ** 2.43
16 Right Temporal Pole ** 2.39
17 Left Temporal Pole ** 2.37
18 Right Inferior Parietal ** 2.31
19 Right Inferior Temporal ** 2.29
20 Left Fusiform ** 2.29
21 Left Superior Temporal ** 2.28
22 Inferior Lateral Ventricle ** 2.27
23 Left Superior marginal ** 2.24
24 Right Superior marginal ** 2.21
25 Left Inferior Parietal ** 2.21
26 Right Post Cingulate ** 2.17
27 Right Precuneus ** 2.16
28 Right Superior Temporal ** 2.15
29 Right Amygdala Volume ** 2.13
30 Right Pars Operculum ** 2.11
31 Left Precentral ** 2.11
Neuroimage. Author manuscript; available in PMC 2013 April 15.

NIH
-PA Author Manuscript
NIH
-PA Author Manuscript
NIH
-PA Author Manuscript
Meda et al. Page 22
Rank order Region Abs Z-Score forNetwork S1
32 Left Pars Trianglaris ** 2.10
33 Left Amygdala Volume ** 2.10
34 Left BanksSTS ** 2.08
35 Right Pars Trianglaris ** 2.08
36 Left Post Cingulate ** 2.07
37 Left Lateral OrbFrontal ** 2.07
38 Left Precuneus ** 2.06
39 Right Parahippocampus ** 2.01
40 Right Fusiform ** 2.00
41 Right Lateral OrbFrontal 1.97
42 Left Pars Orb 1.97
43 Right Precentral 1.97
44 Left Pars Operculum 1.96
45 Left Parahippocampus 1.95
46 Right BanksSTS 1.90
47 Left Medial Orbito Frontal 1.84
48 Right Superior Parietal 1.82
49 Right Medial Orbito Frontal 1.82
50 Frontal Pole 1.79
51 Right Ventricle DC 1.79
52 Left Ventricle DC 1.78
53 Right Paracentral 1.75
54 3rd Ventricle 1.71
55 Left Paracentral 1.68
56 Left Superior Parietal 1.68
57 Left Frontal Pole 1.61
58 Right Pars Orb 1.56
59 Right Frontal Pole 1.52
60 Right Pallidum Volume 1.47
61 Left Post central 1.44
62 Left Rostral Ant Cingulate 1.41
63 Right Post central 1.38
64 CC_Mid Anterior 1.37
65 Left Pallidum Volume 1.32
66 CC_Central 1.32
67 Right Putamen Volume 1.24
68 Left Accumbens Volume 1.20
Neuroimage. Author manuscript; available in PMC 2013 April 15.

NIH
-PA Author Manuscript
NIH
-PA Author Manuscript
NIH
-PA Author Manuscript
Meda et al. Page 23
Rank order Region Abs Z-Score forNetwork S1
69 CC_Mid Posterior 1.18
70 Right Thalamus Volume 1.18
71 CC_Posterior 1.17
72 Left Putamen Volume 1.15
73 Left Left ingual 1.13
74 Left Lateral Occipital 1.11
75 Right Lateral Occipital 1.10
76 Right Accumbens Volume 1.06
77 CC_Anterior 1.05
78 Right Caud Ant Cingulate 1.03
79 Right Left ingual 0.95
80 Left TransverseTemporal 0.84
81 Right Rostral Ant Cingulate 0.75
82 Left Caud Ant Cingulate 0.69
83 Left Thalamus Volume 0.68
84 Right Corpus Collosum 0.66
85 Left Corpus Collosum 0.56
86 Right Cuneus 0.55
87 Right TransverseTemporal 0.51
88 Left Pericalc 0.46
89 Left Caudate Volume 0.31
90 Right Caudate Volume 0.31
91 Left Cuneus 0.30
92 Right Cerebellar Cortex 0.18
93 Right Pericalc 0.08
94 Left Cerebellar Cortex 0.05
**Denotes regions with significant loadings on imaging network S1, ranked in order of Z-score loads. S1 was the only imaging network that was
significantly associated with any (in this case all four) genetic networks.
Neuroimage. Author manuscript; available in PMC 2013 April 15.
NIH
-PA Author Manuscript
NIH
-PA Author Manuscript
NIH
-PA Author Manuscript
Meda et al. Page 24
Tabl
e 2
Res
ults
der
ived
from
the
Func
asso
ciat
e w
eb to
ol sh
owin
g si
gnifi
cant
ly e
nric
hed
func
tiona
l attr
ibut
es, q
uerie
d ag
ains
t the
gen
e on
tolo
gy d
atab
ase.
Gen
esfe
d in
to th
e an
alys
is c
ompr
ised
all
sign
ifica
nt g
enes
from
all
four
gen
etic
net
wor
ks id
entif
ied
in th
e st
udy
Ran
kN
XL
OD
PP-
adj
Gen
e O
ntol
ogy
Attr
ibut
e
120
100
1.84
73.
50E-
28<0
.001
antig
en p
roce
ssin
g an
d pr
esen
tatio
n of
pep
tide
antig
en v
ia M
HC
cla
ss I
220
103
1.83
16.
70E-
28<0
.001
antig
en p
roce
ssin
g an
d pr
esen
tatio
n of
pep
tide
antig
en
323
206
1.56
3.70
E-26
<0.0
01M
HC
cla
ss I
prot
ein
com
plex
423
335
1.32
72.
90E-
21<0
.001
MH
C p
rote
in c
ompl
ex
523
377
1.27
14.
10E-
20<0
.001
antig
en p
roce
ssin
g an
d pr
esen
tatio
n
612
121
800.
409
6.60
E-17
<0.0
01pl
asm
a m
embr
ane
part
728
1152
0.86
45.
60E-
14<0
.001
imm
une
resp
onse
828
1348
0.79
12.
50E-
12<0
.001
imm
une
syst
em p
roce
ss
916
037
650.
289
5.90
E-12
<0.0
01pl
asm
a m
embr
ane
1029
890
330.
234
1.10
E-11
<0.0
01m
embr
ane
1125
474
270.
237
3.40
E-11
<0.0
01m
embr
ane
part
127
331.
841
8.80
E-11
<0.0
01M
HC
cla
ss I
rece
ptor
act
ivity
139
150
1.36
41.
30E-
09<0
.001
thio
lest
er h
ydro
lase
act
ivity
148
115
1.43
3.40
E-09
<0.0
01ub
iqui
tin th
iole
ster
ase
activ
ity
158
118
1.41
84.
20E-
09<0
.001
ubiq
uitin
-spe
cific
pro
teas
e ac
tivity
168
119
1.41
44.
50E-
09<0
.001
smal
l con
juga
ting
prot
ein-
spec
ific
prot
ease
act
ivity
1719
171
0.77
65.
90E-
09<0
.001
Rho
pro
tein
sign
al tr
ansd
uctio
n
1810
065
580.
316
3.30
E-08
0.00
2in
trins
ic to
mem
bran
e
1916
131
0.80
24.
50E-
080.
002
Rho
gua
nyl-n
ucle
otid
e ex
chan
ge fa
ctor
act
ivity
2027
583
190.
183
8.10
E-08
0.00
3pr
otei
n bi
ndin
g
2135
558
0.47
51.
10E-
070.
003
cyto
skel
etal
pro
tein
bin
ding
2215
140
0.80
21.
10E-
070.
003
regu
latio
n of
Rho
pro
tein
sign
al tr
ansd
uctio
n
2311
192
0.97
91.
10E-
070.
003
ATP
ase
activ
ity, c
oupl
ed to
tran
smem
bran
e m
ovem
ent o
f sub
stan
ces
2411
193
0.97
61.
20E-
070.
003
ATP
ase
activ
ity, c
oupl
ed to
mov
emen
t of s
ubst
ance
s
2552
119
305
0.20
41.
30E-
070.
003
cell
part
2652
119
306
0.20
41.
30E-
070.
003
cell
Neuroimage. Author manuscript; available in PMC 2013 April 15.
NIH
-PA Author Manuscript
NIH
-PA Author Manuscript
NIH
-PA Author Manuscript
Meda et al. Page 25
Ran
kN
XL
OD
PP-
adj
Gen
e O
ntol
ogy
Attr
ibut
e
2711
197
0.96
71.
40E-
070.
003
hydr
olas
e ac
tivity
, act
ing
on a
cid
anhy
drid
es, c
atal
yzin
g tra
nsm
embr
ane
mov
emen
t of
subs
tanc
es
2815
143
0.79
21.
50E-
070.
003
Ras
gua
nyl-n
ucle
otid
e ex
chan
ge fa
ctor
act
ivity
2931
2607
0.53
31.
50E-
070.
003
prot
ein
com
plex
3050
909
0.38
1.80
E-07
0.00
3ce
ll ad
hesi
on
3150
909
0.38
1.80
E-07
0.00
3bi
olog
ical
adh
esio
n
326
151.
551
2.00
E-07
0.00
3pr
osta
glan
din
E re
cept
or a
ctiv
ity
3364
1301
0.32
82.
40E-
070.
003
intri
nsic
to p
lasm
a m
embr
ane
3496
6449
0.29
72.
50E-
070.
004
inte
gral
to m
embr
ane
3511
209
0.93
92.
60E-
070.
004
prim
ary
activ
e tra
nsm
embr
ane
trans
porte
r act
ivity
3611
209
0.93
92.
60E-
070.
004
P-P-
bond
-hyd
roly
sis-
driv
en tr
ansm
embr
ane
trans
porte
r act
ivity
3763
1285
0.32
63.
30E-
070.
005
inte
gral
to p
lasm
a m
embr
ane
383
62.
561
4.30
E-07
0.00
7su
lfony
lure
a re
cept
or a
ctiv
ity
3927
390
0.51
16.
50E-
070.
012
prot
eina
ceou
s ext
race
llula
r mat
rix
406
151.
457
6.90
E-07
0.01
2ce
ll ad
hesi
on m
olec
ule
bind
ing
4132
1350
0.46
86.
90E-
070.
012
trans
mem
bran
e tra
nspo
rter a
ctiv
ity
4217
577
0.67
77.
00E-
070.
012
activ
e tra
nsm
embr
ane
trans
porte
r act
ivity
433
42.
603
7.90
E-07
0.01
7cG
MP-
depe
nden
t pro
tein
kin
ase
activ
ity
4458
1262
0.32
97.
90E-
070.
017
calc
ium
ion
bind
ing
4519
258
0.62
29.
10E-
070.
018
guan
yl-n
ucle
otid
e ex
chan
ge fa
ctor
act
ivity
466
191.
398
1.00
E-06
0.01
9pr
osta
glan
din
rece
ptor
act
ivity
4727
400
0.49
91.
10E-
060.
019
extra
cellu
lar m
atrix
4841
3215
0.41
61.
10E-
060.
019
mac
rom
olec
ular
com
plex
4934
589
0.43
31.
20E-
060.
022
met
al io
n tra
nspo
rt
508
246
1.08
21.
20E-
060.
022
cyst
eine
-type
pep
tidas
e ac
tivity
5113
639
750.
212
1.30
E-06
0.02
3lo
caliz
atio
n
5214
409
0.73
31.
60E-
060.
027
ATP
ase
activ
ity, c
oupl
ed
5345
1158
0.36
61.
60E-
060.
029
ion
trans
mem
bran
e tra
nspo
rter a
ctiv
ity
548
258
1.06
1.80
E-06
0.02
9ub
iqui
tin-d
epen
dent
pro
tein
cat
abol
ic p
roce
ss
558
259
1.05
91.
80E-
060.
029
mod
ifica
tion-
depe
nden
t pro
tein
cat
abol
ic p
roce
ss
Neuroimage. Author manuscript; available in PMC 2013 April 15.

NIH
-PA Author Manuscript
NIH
-PA Author Manuscript
NIH
-PA Author Manuscript
Meda et al. Page 26
Ran
kN
XL
OD
PP-
adj
Gen
e O
ntol
ogy
Attr
ibut
e
568
259
1.05
91.
80E-
060.
029
mod
ifica
tion-
depe
nden
t mac
rom
olec
ule
cata
bolic
pro
cess
578
260
1.05
71.
90E-
060.
029
prot
eoly
sis i
nvol
ved
in c
ellu
lar p
rote
in c
atab
olic
pro
cess
588
262
1.05
32.
00E-
060.
032
cellu
lar p
rote
in c
atab
olic
pro
cess
5915
152
0.68
82.
50E-
060.
046
calc
ium
ion
trans
port
608
421.
057
2.60
E-06
0.04
7vo
ltage
-gat
ed c
alci
um c
hann
el a
ctiv
ity
Key
: Ran
k: P
ositi
on in
the
attri
bute
list
rank
ed b
y si
gnifi
cant
of a
ssoc
iatio
n w
ith th
e qu
ery,
N: N
umbe
r of g
enes
that
wen
t int
o th
e qu
ery
with
this
attr
ibut
e, X
: Num
ber o
f gen
es o
vera
ll in
the
onto
logy
data
base
with
this
attr
ibut
e, L
OD
: log
arith
m (b
ase
10) o
f the
odd
s rat
io, p
-val
: Sin
gle
hypo
thes
is p
-val
ue o
f the
ass
ocia
tion
betw
een
attri
bute
and
que
ry (b
ased
on
Fish
er’s
exa
ct te
st),
p-ad
j: A
djus
ted
p-va
lue;
frac
tion
of 1
000
null-
hypo
thes
is si
mul
atio
ns h
avin
g at
tribu
tes w
ith th
is si
ngle
hyp
othe
sis p
-val
ue o
r sm
alle
r
Neuroimage. Author manuscript; available in PMC 2013 April 15.

NIH
-PA Author Manuscript
NIH
-PA Author Manuscript
NIH
-PA Author Manuscript
Meda et al. Page 27
Tabl
e 3
Res
ults
of a
ssoc
iatio
n an
alys
is p
erfo
rmed
on
the
top
ten
gene
s fro
m e
ach
gene
tic n
etw
ork
sorte
d in
des
cend
ing
orde
r of t
heir
wei
ghtin
g sc
ores
. Wei
ghtin
gsc
ores
repr
esen
t the
rela
tive
effe
ct o
f eac
h SN
Ps a
ssoc
iatio
n w
ith d
isea
se st
atus
with
in a
par
ticul
ar c
ompo
nent
, ran
ging
from
0-1
. A &
B re
fer t
o th
edi
ffer
ent a
llelic
freq
uenc
ies
Gen
eL
ocat
ion
Func
tion
rs #
AD (#
Alle
les)
MC
I (#A
llele
s)
HC (#
Alle
les)
- Nsq
uare
p-va
lue
Wei
ghti
ng S
core
G1
AB
AB
AB
APO
E319
q13.
2N
/AE3
162
20 026
946 5
3927 9
881.
00E-
161.
000
APO
E419
q13.
2N
/AE4
209
15 352
127 3
358
6080
1.00
E-15
0.90
9
SHRO
OM
2Xp
22.3
intro
nrs
2405
940
209
15 350
323 1
294
12 416
.58
0.00
03**
0.18
8
ZNF6
73Xp
11.3
intro
nrs
7876
304
103
25 925
048 4
172
24 614
.04
0.00
09**
0.16
0
SLC9
A7Xp
11.2
3in
tron
rs18
8325
599
26 324
149 3
165
25 313
0.00
15**
0.14
8
SLC1
6A2
Xq13
.2in
tron
rs47
9640
8927 3
252
48 213
828 0
11.1
50.
0038
0.12
7
MAG
I31p
13.2
intro
nrs
7552
954
154
20 837
336 1
226
19 210
.97
0.00
410.
125
COBL
7p12
.2in
tron
rs14
3749
019
516 7
374
36 025
516 3
10.9
0.00
430.
124
PLXD
C210
p12.
31
intro
nrs
2358
839
102
26 026
546 9
150
26 87.
540.
0229
0.08
6
CTN
ND
25p
15.2
intro
nrs
7574
5921
514 7
388
34 621
020 8
6.93
0.03
110.
079
G2
ZNF6
73Xp
11.3
intro
nrs
7876
304
103
25 925
048 4
172
24 614
.04
0.00
09**
1.00
0
SLC9
A7Xp
11.3
intro
nrs
1883
255
9926 3
241
49 316
525 3
130.
0015
**0.
926
TNXB
6p21
.3in
ron
rs22
3968
913
322 9
213
52 111
430 4
9.47
0.00
880.
675
ZSCA
N1
26p
22.1
Mis-
sens
ers
1361
385
260
10 249
723 7
258
16 09.
240.
0098
0.65
8
Neuroimage. Author manuscript; available in PMC 2013 April 15.

NIH
-PA Author Manuscript
NIH
-PA Author Manuscript
NIH
-PA Author Manuscript
Meda et al. Page 28
Gen
eL
ocat
ion
Func
tion
rs #
AD (#
Alle
les)
MC
I (#A
llele
s)
HC (#
Alle
les)
- Nsq
uare
p-va
lue
Wei
ghti
ng S
core
G1
AB
AB
AB
EHM
T26p
21.3
intro
nrs
2844
457
146
21 623
649 8
131
28 78.
90.
0116
0.63
4
ZKSC
AN3
6p22
.1in
tron
rs21
3228
258
10 449
124 3
258
16 08.
030.
018
0.57
2
SLC4
4A4
6p21
.3in
tron
rs27
3642
813
922 3
227
50 712
729 1
7.41
0.02
460.
528
CFB
6p21
.3in
tron
rs41
5165
722
313 9
509
22 528
613 2
6.96
0.03
070.
496
C6or
f15
6p21
.3in
tron
rs31
3097
725
910 3
504
23 026
415 4
6.7
0.03
490.
477
CCH
CR1
6p21
.3in
tron
rs74
6647
256
10 649
024 4
261
15 76
0.04
960.
427
G 3
ATP5
G2
12q1
3.1
3in
tron
rs18
0063
411
125 1
166
56 813
428 4
14.9
70.
0006
**1.
000
VPS1
3C15
q22.
2in
tron
rs19
8191
619
017 2
449
28 521
620 2
12.8
40.
0016
**0.
858
ATF7
12q1
3.1
3in
tron
rs78
4568
189
17 333
739 7
230
18 89.
820.
0073
0.65
6
CEP5
711
q21
intro
nrs
3017
756
154
20 831
641 8
215
20 38.
950.
0113
0.59
8
EHM
T26p
21.3
intro
nrs
2844
457
146
21 623
649 8
131
28 78.
90.
0116
0.59
5
MTM
R211
q21
intro
nrS
1933
6422
513 7
437
29 721
919 9
8.66
0.01
320.
578
PTCH
D2
1p36
.2 2
intro
nrs
2379
135
160
20 225
947 5
165
25 38.
320.
0156
0.55
6
CNTN
511
q22.
1in
tron
rs10
8929
0113
422 8
314
42 014
627 2
7.86
0.01
960.
525
SLC4
4A4
6p21
.3 2
intro
nrs
2736
428
139
22 322
750 7
127
29 17.
410.
0246
0.49
5
C26p
21.3
intro
nrs
2734
335
204
15 835
537 9
211
20 76.
220.
0445
0.41
5
G4
Neuroimage. Author manuscript; available in PMC 2013 April 15.

NIH
-PA Author Manuscript
NIH
-PA Author Manuscript
NIH
-PA Author Manuscript
Meda et al. Page 29
Gen
eL
ocat
ion
Func
tion
rs #
AD (#
Alle
les)
MC
I (#A
llele
s)
HC (#
Alle
les)
- Nsq
uare
p-va
lue
Wei
ghti
ng S
core
G1
AB
AB
AB
SKIV
2L6p
21.3
intro
nrs
5922
2922
713 5
388
34 623
917 9
9.69
0.00
780.
999
TNXB
6P21
.3in
tron
rs22
3968
913
322 9
213
52 111
430 4
9.47
0.00
880.
976
EHM
T26p
21.3
intro
nrS
1594
4526
894
486
24 827
714 1
7.71
0.02
110.
795
AKAP
97q
21.2
intro
nrs
7566
4723
412 8
461
27 323
418 4
7.39
0.02
480.
762
SLC4
4A4
6p21
.3in
tron
rs22
4266
522
713 5
397
33 723
818 0
7.34
0.02
540.
757
CFB
6p21
.3in
tron
rs41
5165
722
313 9
509
22 528
613 2
6.96
0.03
070.
718
ATF6
B6p
12.3
intro
nrs
2228
628
242
12 052
620 8
315
10 36.
90.
0316
0.71
1
C6or
f10
6p21
.3in
tron
rs48
5774
203
15 945
527 9
272
14 66.
810.
0331
0.70
2
CYP5
1A1
7q21
.2in
tron
rs23
0155
923
312 9
454
28 023
418 4
6.34
0.04
190.
654
C26p
21.3
intro
nrs
2734
335
204
15 835
537 9
211
20 76.
220.
0445
0.64
1
**G
enes
that
sign
ifica
ntly
dis
crim
inat
e gr
oups
afte
r cor
rect
ion
for m
ultip
le c
ompa
rison
s (B
onfe
rron
i-cor
rect
ed a
cros
s 40
chi-s
quar
e te
sts)
.
Neuroimage. Author manuscript; available in PMC 2013 April 15.