A hybrid multi-region method (HMR) for assessing the environmental impact of private consumption
33
A hybrid multi-region method (HMR) for assessing the environmental impact of private consumption 1 Kees Vringer a , René Benders b , Harry Wilting a , Corjan Brink a , Eric Drissen a , Durk Nijdam a , and Nico Hoogervorst a a Netherlands Environmental Assessment Agency (PBL), PO Box 303, 3720 AH Bilthoven, The Netherlands. b Center for Energy and Environmental Studies (IVEM), University of Groningen, Nijenborgh 4, 9747 AG The Netherlands. Corresponding author: Kees Vringer, PBL, telephone: +31 30 274 3816, e-mail: [email protected]. Key words: consumption patterns, environmental load, hybrid analysis, multi-region input– output analysis, physical process data. Abstract The environmental load from consumption can be reduced by changing consumption patterns. For an effective consumer policy to reduce the environmental load from society, we need insight into the environmental load from consumption patterns. This requires detailed accurate quantitative environmental information about many consumer products. Current methods for establishing this information about many consumer products do not combine process data with multiregional data. This paper aims to give more insight into the added value of using multiregional data and process data. It also proposes to combine both kinds of data into one application. The use of multiregional input–output data appears to be important to establish the total environmental load from consumption. Using multiregional data and process data both result in substantial changes in the estimated environmental load of consumption products on a more detailed level. The results indicate that using both multiregional and process data will improve the estimates of the environmental impacts of consumption patterns. Therefore we propose a hybrid multi-region (HMR) method, which is successfully applied for the Netherlands. 1 A slightly adapted version is published in Ecological Economics 69 (2010) p.p.2510-2516
-
Upload
independent -
Category
Documents
-
view
3 -
download
0
Transcript of A hybrid multi-region method (HMR) for assessing the environmental impact of private consumption

A hybrid multi-region method (HMR) for assessing the
environmental impact of private consumption1
Kees Vringera, René Bendersb, Harry Wiltinga, Corjan Brinka, Eric Drissena, Durk Nijdama,
and Nico Hoogervorsta
a Netherlands Environmental Assessment Agency (PBL), PO Box 303, 3720 AH Bilthoven, The Netherlands. b Center for Energy and Environmental Studies (IVEM), University of Groningen, Nijenborgh 4, 9747 AG The
Netherlands.
Corresponding author: Kees Vringer, PBL, telephone: +31 30 274 3816, e-mail: [email protected].
Key words: consumption patterns, environmental load, hybrid analysis, multi-region input–
output analysis, physical process data.
Abstract
The environmental load from consumption can be reduced by changing consumption patterns.
For an effective consumer policy to reduce the environmental load from society, we need
insight into the environmental load from consumption patterns. This requires detailed accurate
quantitative environmental information about many consumer products. Current methods for
establishing this information about many consumer products do not combine process data
with multiregional data. This paper aims to give more insight into the added value of using
multiregional data and process data. It also proposes to combine both kinds of data into one
application. The use of multiregional input–output data appears to be important to establish
the total environmental load from consumption. Using multiregional data and process data
both result in substantial changes in the estimated environmental load of consumption
products on a more detailed level. The results indicate that using both multiregional and
process data will improve the estimates of the environmental impacts of consumption
patterns. Therefore we propose a hybrid multi-region (HMR) method, which is successfully
applied for the Netherlands.
1 A slightly adapted version is published in Ecological Economics 69 (2010) p.p.2510-2516

Introduction
Concern about the environment has led to policies aiming to reduce the environmental load
from society. Up to now, environmental policies have predominantly focused on
technological improvements to increase eco-efficiency of domestic production, allowing
consumption to develop freely. In the end, all goods produced are meant for consumption.
This makes consumption an important driving force for the worldwide environmental load
(Aalbers et al., 2007). Besides technology and the level of consumption, its composition
(consumption patterns) is also important for the resulting environmental load. The
environmental load caused by consumption can be reduced by changing consumption
patterns. That is why environmental policy-making might benefit from quantitative
information on the environmental load from consumption patterns. To distinguish differences
in environmental load between consumption patterns, an accurate method is required for
detecting possible differences between specific products (e.g. ‘bread’) or between groups of
similar products (e.g. ‘flowers and pot plants’).
The objective of this paper is to explore and improve existing methods for calculating the
environmental load of consumer goods. First we provide more insight into the added value of
using multiregional and process data, compared with single-region input–output data. Next
we combine the outcomes of this comparison in a ‘hybrid multi-region’ (HMR) method to get
more reliable results of the environmental load from consumer goods on a detailed level.
Background
Consumer goods cause environmental load during their whole life cycle, from extraction of
natural resources, production processes, actual use, to the time they are reduced to waste.
Assessment of the environmental load from consumption only makes sense if this whole life
cycle is considered. In the literature, this is generally referred to as Life Cycle Assessment.
Basically, two methods are available for making such an assessment: process analysis
and input–output (IO) analysis. Both methods have their advantages and disadvantages.
Environmentally extended input–output analysis is a well-established approach that assigns
resource flows and environmental impacts to categories of final consumption (Suh, 2009). It
makes use of generally available data, allows for a quick analysis, and gives a good overall
picture of the environmental impact of consumption. One of the main disadvantages of the IO
approach is that data are available only at a high level of aggregation. Although for most
countries the IO tables distinguish 60 to 400 sectors or product groups, the limited availability
of environmental data requires a further aggregation to about 30 to 60 sectors or product
groups. This implies that various goods have to be attributed to the same sector. As a
consequence, it is not possible to make a distinction between the (possibly widely

divergent) environmental impacts of these different products. This limits the practicability of
the IO method for assessment of environmental impact of consumption patterns, because such
an assessment would require detection of differences between specific products.
Process analysis (see e.g. Boustead and Hancock, 1979) is a more appropriate method for
determining the environmental impact of specific products. That is why generally process
analysis is used for Life Cycle Analysis (LCA). To calculate the environmental impact of a
specific product, an LCA includes all relevant physical processes required for the complete
life cycle. Although, in principle, process analysis uses more detailed information than the IO
approach, in practice it is often difficult to take all relevant processes into account, because
there are so many, or because the required data are not available. Ignoring some of these
processes can lead to serious underestimations (Suh et al., 2004). Moreover, process analysis
is rather time consuming, which makes the method expensive.
Bullard et al. (1978) were the first to propose a hybrid energy analysis, combining
process level data and IO data. In a tiered hybrid analysis (Suh et al., 2004), the life cycle is
split into two parts - the ‘major’ processes that are most likely to make an important
contribution to the environmental load caused by the product, and the ‘remaining’ processes.
For the major processes process analysis is used, while IO is used for all the remaining
processes. In this way, a hybrid analysis combines the rapidity of the input–output analysis
with the accuracy of the process analysis. The system boundary is extended significantly,
while preserving the specific character of the process in favour of the accuracy. Since the late
1990s, different forms of hybrid approaches have been proposed (e.g. Engelenburg et al.,
1994; Joshi, 2000; Mayer, 2007), but they are still not widely used (Suh et al., 2004). Haas et
al. (2005) mentioned an important shortcoming of existing hybrid methods - imported goods
are treated as if they are produced domestically. This results in a relatively high uncertainty of
estimates for countries that rely heavily on imports (Suh et al., 2004). To deal with differences
in the environmental impact of production between countries, recent IO-based studies (e.g.
Nijdam et al., 2005, Weber and Matthews, 2008, Peters and Hertwich, 2008) have used
multiregional input–output (MRIO) data, taking into account the location of production
processes. However, as indicated above, the aggregation level of IO data limits the
practicability of this approach for assessing the environmental load from specific products.
This means that existing hybrid methods can be more accurate in determining the
environmental impact of specific products. But as far as they use input–output data, they do
not take into account regional differences in environmental impact of production processes2.
On the other hand: current IO-based approaches do take multiregional data into account, but
2 Please note that as far as process analysis is used for the major processes, regional differences are taken into account.

lack a higher level of detail. That is why Wiedmann et al. (2009) recommend the use of a
multi-region input–output method, improved by using process data to get reliable results on a
more detailed level.
To explore the additional value of taking into account multiregional data and process data
with respect to a single-region IO approach, we first apply two methods for estimating the
environmental load from Dutch consumption: a multi-region input–output based application
and a hybrid application. Next, we compare the results with a conventional single-region
input-output approach to explore the additional value of taking into account multiregional
data and process data, respectively. We combine these additional values to get more reliable
results on the environmental load from consumer goods, on a detailed level. Finally we
present the results from this ‘hybrid multi-region’ (HMR) method, followed by a discussion
and conclusions.
Applications to estimate the environmental load from Dutch consumption patterns
In the Netherlands, recently, two methods have been applied for assessing the environmental
load from household consumption - a multi-region IO application, as applied by Nijdam et al.
(2005) (see Appendix A), and a hybrid application according to Benders et al. (2010). Both
applications are designed to estimate the environmental load from Dutch consumption, at the
level of about 350 consumption categories, as recorded in the Dutch Household Expenditure
Survey for 2000 (CBS, 2002)3. The environmental intensities for these consumption
categories4 as calculated by both applications can easily be compared. The next paragraphs
give a short description of both applications. To make the differences between the
applications clear, we first shortly describe the common basis of both applications, which is
single-region input-output analysis.
Single-region input-output analysis is based on an environmentally extended single-region
input–output (EESRIO) model. This model uses sectoral monetary transaction matrixes
describing the complex interdependencies of industries within one economy, to allocate
environmental load to final consumption. These loads depict the environmental loads along
the whole upstream supply chain. In this way imported goods are assumed to be produced by
domestic sectors, taking into account only the domestic efficiencies.
3 Each consumption category contains one type of product (e.g. bread) or group of similar products. (e.g. flowers and pot
plants). 4 Environmental intensity of a consumer product (goods or service) is defined as the environmental load caused during
production, transport and trade of the product divided by its consumer price in monetary units. Environmental intensity can be
expressed, for instance, in MJ/euro, m2/euro and kg CO2/euro.

Multi-region input–output analysis (MRIO) (see Nijdam et al., 2005) is based on an
environmentally extended multi-region input–output (EEMRIO) model. Like the single-
region input-output approach, this model uses sectoral monetary transaction matrixes to
allocate environmental loads, but here the interdependencies of industries and trade within
and between economies are taken into account. So, the calculated environmental loads depict
the environmental load allocated to final consumption. Here, for imported goods the domestic
efficiencies are taken into account.
The MRIO application first estimates the environmental intensities (i.e. the
environmental loads per euro in turnover) of production for 105 sectors in the Netherlands
and about 30 sectors in three import regions (OECD Europe, the Rest of the OECD and the
Rest of the World), using an EEMRIO model. Now the environmental loads for the final
deliveries of the 105 Dutch sectors can be calculated. The estimated environmental loads for
the 105 final deliveries, are redistributed over 350 consumption categories from the Dutch
Household Expenditure Survey (CBS, 2002), taking into account the proportional deliveries
from the supplying sectors. An extended description of the MRIO can be found in Nijdam et
al. (2005). Whereas Nijdam et al used figures of 1995, here we use an updated version, which
is based on more recent data (see Appendix A).
If the environmental intensities for all four regions are set equal to the Dutch intensities, this
MRIO application turns into a single-region input–output analysis, which in this paper is
indicated as MRIOSRIO.
The hybrid environmental analysis (Hybrid) combines process data and input-output data and
is based on a practical application for energy analysis as described by Van Engelenburg et al.
(1994) and Benders et al. (2001). As described above, this so-called tiered hybrid analysis
(Suh et al., 2004) splits the life cycle of a product into two parts: major processes, for which
process analysis is used, and remaining processes, for which single-region IO analysis is used.
Application of the hybrid method for energy analysis was found suitable for rapidly and
accurately calculating the direct and indirect energy requirements from large numbers of
consumption categories (Vringer and Blok, 1995). The method detects differences between
consumption categories, even if they are produced by the same economic sector (Vringer and
Blok, 1995). For the comparison here, we use the most recent application of this method as
described by Benders et al. (2010). Besides energy requirements, this application also
includes environmental loads such as emissions of greenhouse gases and air pollutants and
land use. This application uses IO tables for the Netherlands for the year 2000.
If all available process data are neglected, this Hybrid application turns into a single-region
input–output analysis, which in this paper is indicated as HybridSRIO.

In the next section we explore the additional value of taking into account multiregional data
and process data with respect to a single-region IO approach using calculations for
greenhouse gas (GHG) emissions and land use5. The total amount of GHG emissions and land
use that can be attributed to Dutch consumer expenditures for 350 consumption categories
was determined by multiplying the environmental intensities for the various consumption
categories with the related expenditures, as recorded in the Dutch Household Expenditure
Survey (CBS, 2002).
Additional value of using multiregional data
Economic globalisation means an increasing share of imported goods. Treating imported
goods as if they were produced domestically, results in a relatively high uncertainty in the
data for countries which rely heavily on imports (Suh et al., 2004). To quantify the effects of
adding multiregional data for the Netherlands, which is a small country relying heavily on
imports, we compare the results from the MRIO, as described in the previous section, with a
calculation using a similar method except that the multiregional data is neglected (MRIOSRIO).
More specifically, we compare the environmental load due to consumption by an average
Dutch household in the year 2000 (CBS, 2002) calculated in two different ways:
• MRIO – a calculation including region-specific environmental intensities for the
Netherlands and all three import regions (multi-region input–output); and
• MRIOSRIO – a calculation assuming environmental intensities for all four regions to
be equal to the Dutch intensities (single-region input–output).
The difference between MRIOSRIO and MRIO can be illustrated by the following
example. In the Netherlands, the textile industry is small and does not produce the present
domestic textile consumption. Moreover, the agricultural production of raw materials used in
the textile industry takes place abroad. The MRIOSRIO estimates the environmental load from a
typical coat, by using intensities from the Dutch textile industry and agricultural sector,
however, this deviates from what is actually required. The MRIO provides more realistic
estimates by taking into account region-specific intensities and sectoral structures, consistent
with the national accounts.
5 For calculating land use, we used the following factors to include the impact of land use: forest plantations: 0.8, build-up
land:1.3, and crop land and farmland:1.0. See also Benders et al. (2010).

Table 1 A comparison for land use and GHG emissions of single-region input-output
(MRIOSRIO) and multi-region input-output (MRIO) analyses for an average Dutch household
in 2000*.
Expenditures Land use (m2) GHG (kg CO2 eq.)
euros (2000) MRIO MRIOSRIO MRIO MRIOSRIO
Food 4921 9382 2741 8145 4766
Housing 5674 1073 972 4998 6597
Furnishings 2029 1309 222 2100 929
Clothing 1898 960 107 2003 979
Personal care 1054 200 55 1583 1663
Leisure indoors 2427 1081 257 2200 1173
Leisure outdoors 1880 387 128 2522 1994
Holidays 1435 804 137 1207 753
Labour 1773 319 78 2421 2019
Total 23091 15515 4698 27180 20874 * Here the total consumption is clustered into functional domains: Food contains: food, refrigerating, cooking, washing up and catering; Housing: rent, mortgage, local housing taxes, housing insurance, maintenance, heating and lighting; Furnishings: furniture, upholstery, decoration and gardening; Clothing: clothes, shoes, finery, washing drying and ironing; Personal care: nursery, self medication, cosmetics, toilet articles, hair dresser, shower and baths; Leisure indoors: reading matter, pets, audio and video; Leisure outdoors: day trips, family visits, sports; Holidays: holidays, domestic and abroad; Labour: college fees, books, commuting. For a more extensive description see Nijdam et al., 2005.
Table 1 confirms the statement by Suh et al. (2004) that treating imported goods as if they
were produced domestically results in a relatively high uncertainty of estimates for countries
that rely heavily on imports. For the Netherlands treating imported goods as if they were
produced domestically results in underestimating the amounts of land use and GHG emissions
assigned to consumption. The total amount of land use assigned in MRIO is three times the
amount assigned in MRIOSRIO. In relative terms, the difference is the largest for clothing, of
which the majority is imported into the Netherlands. For GHG emissions the differences are
smaller; the emissions assigned in MRIO are 30% higher than in MRIOSRIO. This is not a
surprising result, as production processes in the Netherlands are relatively efficient in the use
of land and energy. By using only domestic IO data, the estimated total environmental load
would be considerably underestimated.
Adding multiregional data not only affects the estimated total environmental load, but
also results in substantial changes on the level of separate consumption categories. Adding
multiregional data, on average6, increases land use intensity by a factor of 7.2, with a standard
6 Please note that this average was not weighted according to the average household expenditure on goods in the different product
categories, so all intensities were treated as equally important.

deviation of 8.2. On average, GHG intensities increase by a factor of 2.3, with a standard
deviation of 0.8.
Additional value of using process data
Suh et al. (2004), among others, stated that for specific products, physically-based process
analysis would be more accurate than monetary-based IO analysis. They also argued that
combining process analysis with IO analysis would give a better estimation of the
environmental load from individual consumer products. In 2006, Kok et al. already made a
comparison of an IO method and a hybrid method on an aggregated level. However, these two
methods differed on several aspects, so the singular effect of using process data could not be
established. To quantify the effect of using process data we compare the results from the
Hybrid as described in the previous section with a calculation neglecting process data
(HybridSRIO). More specifically, we compare the environmental load due to consumption by
an average Dutch household in the year 2000 (CBS, 2002) calculated in two different ways:
• Hybrid – a calculation taking into account process data in addition to (single-region)
Dutch IO data; and
• HybridSRIO – a calculation based on (single-region) Dutch IO data only, neglecting
available process data7.
The difference between HybridSRIO and Hybrid also can be illustrated by the earlier example
of the textile industry. Estimating the environmental load from several types of clothing using
HybridSRIO, it is not possible to distinguish differences between products produced within the
same sector, for instance a cotton and a woollen coat. Adding process data to the analysis
results in different intensities for those products. This is not only because figures for the
specific production processes of cotton and wool are added to the analysis, but also because
differences between the environmental load from the cotton produced abroad and domestic
production processes are taken into account. Note that there is no automatic consistency with
the total amount of environmental load according to the national accounts.
7 We call this calculation HybridSRIO because neglecting the available process data a single-region input-output analysis is left.
We used the name HybrSRIO because this single-region input-output analysis differs slightly from the MRIOSRIO used for the
MRIO, see next section.

Table 2 A comparison for Land use and GHG emissions of single Input-Output (HybridSRIO) and Hybrid (Hybrid) analyses for an average Dutch household in 2000.
Expenditures Land use (m2) GHG (kg CO2 eq.)
euros (2000) Hybrid HybridSRIO Hybrid HybridSRIO
Food 4921 5777 2223 6414 4.911
Housing 5674 801 429 5931 5632
Furnishings 2029 707 203 1118 970
Clothing 1898 448 99 1035 1008
Personal care 1054 233 43 1537 1524
Leisure indoors 2427 467 317 1294 1304
Leisure outdoors 1880 94 102 1622 1575
Holidays 1435 52 47 1979 1948
Labour 1773 69 55 1596 1574
Total 23091 8648 3517 22525 20446
Table 2 shows that using process data doubles the amount of land use assigned. This
seems to be due to the fact that less efficient processes from abroad are taken into account.
However, the total assigned amount is still about half that of the MRIO (Table 1). The Hybrid
seems to assign only a part of the land use abroad, probably because the analysis is partly
based on single-region input-output data. In absolute terms, the difference between land use
assigned in Hybrid and in HybridSRIO was the largest for food and furnishings. For the total
amount of GHG emissions assigned, using process data has only a minor effect (+9%) and is
the largest for housing.
Adding process data not only affects the total environmental load estimated, but also
results in substantial changes on the level of separate consumption categories. Adding process
data, on average, increased land use intensities by a factor of 4.0, with a standard deviation of
11.9. On average, GHG intensities increased by a factor of 1.3, with a standard deviation of
0.98.
Combining multiregional data with process data
In the previous section, we showed that, compared to single-region IO, using either
multiregional IO data or process data has large effects on the estimated intensities for specific
consumption categories, as well as on the total assigned GHG emissions and land use for
8 Please note that these averages were not weighted according to the average household expenditure on goods in the different
product categories, so all intensities were treated as equally important.

consumption. For a more accurate estimation of the environmental load, these results indicate
the need for taking both factors into account, to obtain a more accurate assignment for
environmental load due to consumption. Extending multi-region IO data with process data to
improve the environmental information in IO tables is in line with the recommendation from
Wiedmann et al. (2009).
As both regional and process data may add similar information, such as that of
differences between domestic land use efficiencies and those abroad, both types of data
cannot just be added up. This seems to be confirmed by the fact that using multiregional and
process data both lead to higher average environmental loads (Tables 1 and 2). To check
whether the effects on the separate environmental intensities of adding regional and process
data are correlated, we plotted the effect of using physical process data (∆ Ph = Hybrid -
HybridSRIO) against the effect of using multiregional IO data (∆ M = MRIO – MRIOSRIO) for
GHG emissions and land use at the level of 350 consumption categories (Figure 1).
-1,0
-0,5
0,0
0,5
1,0
1,5
2,0
-1,0 0,0 1,0 2,0
∆Ph
∆ M
kg CO2 eq./€
kg CO2 eq./€
-1
0
1
2
3
4
5
-1 0 1 2 3 4 5
∆Ph
∆ M
m2/€
m2/€
Figure 1 Change in GHG and land use intensities from the use of process data (∆ Ph), versus
the change in GHG and land use intensities from the use of multiregional data (∆ M), for all
350 consumption categories.

Figure 1 shows a very weak or no correlation between the effects of adding process data
and multiregional data on GHG and land use intensities (GHG: R2=0.00; land use: R2 = 0.22).
Apparently, multiregional data and process data add different kinds of information, which
implies that combining additional information from process data and multiregional data will
result in better estimates of intensities of specific consumption categories.
Although both multiregional data and process data contribute to distinguish differences in
environmental intensities between specific consumption categories, the total environmental
load from consumption is best represented by the MRIO. Whereas the Hybrid is the sum of
more or less independent analyses, the MRIO divides the total environmental load in the
different regions over consumption categories and is consistent with the national accounts
(see Wiedmann et al., 2009). By adding the effect of both multiregional data and physical
process data, the totals exceeded the MRIO totals (see also Tables 1 and 2). To keep the total
amount of GHG emissions and land use within the limits of the MRIO totals, a correction was
made. We use one correction factor for all consumption categories.
New intensities can now be calculated by adding the effect of using multiregional and
process data to the intensities that are based on single-region IO, while taking into account the
totals according to the MRIO analysis. In the comparisons presented above, two different
variations of single-region IO analysis were used: MRIOSRIO and HybridSRIO. Although the
MRIOSRIO and HybridSRIO are based on the same principle, the outcomes slightly differ. This
is mainly due to different sources for the trade margins. Moreover, in the HybridSRIO, products
are linked to just one sector, while the MRIOSRIO assumes a mix of relevant sectors for each
product. Therefore, we use the MRIOSRIO to add the effect of multiregional data and physical
process data, but this choice is more or less arbitrary.
Now the benefits of process data and multiregional data can be combined in a hybrid
multi-region model (HMR) by adding the effect on the environmental load due to using
physical process data, according to the hybrid method to the environmental load according to
the multiple-region input–output method (Formula 1). To keep the total amount of GHG
emissions and land use within the limits of the MRIO totals, a correction term is included.

))Ph (MRIO
)(MRIO
(*)IPh (IMRIO IHMR
jj
350
1
j
350
1jjj
∆+∆+=
∑
∑
=
=
j
j (1)
In which:
− IHMR,j = Intensity for category j, according to the hybrid multi-region method
− IMRIO,j = Intensity for category j, according to the multiple-region input–output
method
− ∆ IPh,j = IHybrid,j – IHybridSRIO,j = Effect on intensity for category j, from the use of
physical process data, according to the hybrid method
− MRIOj = Environmental load for category j, according to the multiple-region input–
output method
− ∆ Phj = Effect on environmental load for category j, due to using physical process data,
according to the hybrid method
Results for the hybrid multi-region model (HMR)
Table 3 shows the estimated environmental load for main consumption categories per average
Dutch household of 2.3 persons, according to the MRIO, the hybrid, and the combination of
those two methods - the so-called hybrid multi-region method (HMR) 9. To limit land use and
GHG emission levels to the MRIO totals, correction factors were applied of -25% and -7%,
respectively. Details for all 350 consumption categories can be found in Appendix B.
Table 3 shows that using HMR or MRIO gives about the same result on the level of main
consumption categories. However, process data showed to be of importance at the level of
environmental load intensities for specific consumption categories. As an illustration, Table 4
presents calculated intensities for 10 detailed consumption categories concerning meat.
Table 4 shows that the HMR takes into account the differences between the
categories according to both the Hybrid and the MRIO. To explain the calculated figures we
discuss the results for fresh beef as an example.
For fresh beef the MRIOSRIO results in a land use intensity (LU-int) of 0.5 m2/euro,
taking only into account the environmental loads for the whole supply chain, assuming that
production abroad is comparable with the Dutch sectors. Taking into account region-specific
9 The composition of the main consumption categories is equal to the composition of the consumption domains according to
Nijdam et al. (2005).

Table 3 A comparison for Land use and GHG emissions of Hybrid (Hybrid), multi-region
Input-output (MRIO) and hybrid multi-region (HMR) analyses for an average Dutch
household in 2000.
Main Land use GHG Consumption Expenditures m2 kg CO2-eq. Category euros (2000) HMR MRIO Hybrid HMR MRIO Hybrid Food 4921 9721 9382 5777 8962 8145 6414 Housing 5674 1086 1073 801 4918 4998 5931 Furnishings 2029 1363 1309 707 2091 2100 1118 Clothing 1898 984 960 448 1885 2003 1035 Personal care 1054 293 200 233 1482 1583 1537
Leisure indoors 2427 925 1081 467 2033 2200 1294 Leisure outdoors 1880 285 387 94 2387 2522 1622 Holidays 1435 608 804 52 1150 1207 1979 Labour 1773 250 319 69 2270 2421 1596
Total 23091
15515
15515 8648
27180
27180 22525
Table 4 Land use and GHG emission intensities for 10 expenditure categories concerning
different kinds of meat according to the Hybrid (Hybrid), multi-region Input-output (MRIO)
and hybrid multi-region (HMR) applications.
Description expenditures Land use intensity GWP intensity m2 per euro2000 in Kg CO2 eq. / euro2000
MRIO
Hybrid HMR MRIO
Hybrid HMR
Beef, fresh 2.5
4.7
5.0
2.1
2.4
3.4
Veal, fresh 2.5
0.2
1.6
2.1
0.8
1.9
Minced meat, fresh 2.5
5.0
5.2
2.1
2.6
3.5
Meat and meat products, frozen 2.0
4.6
4.6
1.7
2.3
3.0
Horse meat 2.0
2.4
3.0
1.7
1.4
2.1
Fresh meat, unspecified 2.0
3.6
3.8
1.7
2.0
2.7
Smoked meat 2.0
2.4
2.9
1.7
1.5
2.3
Ham 2.1
0.8
1.9
2.0
0.9
1.9
Bacon 2.1
1.0
2.0
2.0
0.9
1.9
Sausages and meat products 2.1
2.5
3.1
2.0
1.5
2.4

information adds 2.0 m2/euro, which brings the total LU-int according to the MRIO for fresh
beef to 2.5 m2/euro. This is not surprising as a lot of fodder for Dutch cattle comes from
agricultural production abroad, which is in general less efficient than the domestic agricultural
sector.
An analysis for beef with the Hybrid results in a LU-int of 4.7 m2/euro, taking into
account process data of the production of beef, packaging and transport. If the process data is
neglected, a single-region input-output analysis remains comparable with the MRIOSRIO. So,
using process data adds 4.2 m2/euro to the LU-int of fresh beef.
To calculate the LU-int for fresh beef according to HMR, Formula (1) must be used
in which IMRIO=2.5, the effect of using physical process data (∆ IPh) = 4.2 and the
correction for land use is (-25%). So the LU-int for fresh beef according to the HMR becomes
5.0 m2/euro.
Discussion
The results presented here indicate that combining multiregional and process data will
improve estimates of the environmental impacts of specific consumer products. This makes
the results from the presented HMR application likely to be better estimates than those of the
two original applications. However, using the HMR application as presented in this paper has
a disadvantage. By combining the Hybrid and MRIO applications into the proposed HMR
application, insight into the composition of the environmental load from separate
consumption categories is lost. That is why we recommend to improve the here presented
application of HMR by a new build method, containing both process data and multi-regional
IO data.
We also want to discuss three other issues related to the HMR application proposed here:
a) the correction on total GHG emissions and, in particular, total land use; b) the
consequences of the more or less arbitrary choice for one of the two applications of the single-
region IO analysis; and c) the use of different base years (Hybrid: 2000; MRIO: 2002) for the
HRM application presented in this paper.
ad. a We found that multiregional data and process data mostly not correlate on the level
of the environmental load intensities for specific consumption categories. The use of
both multiregional data and process data leads to more differentiation between the
environmental intensities from consumption categories. However, for land use, we
found a small correlation between the Hybrid and MRIO (R2 of 0.22), which means
that combining the effects of these in the HMR, to some extent, causes a double-
counting. To correct for this, the HMR land use intensities have been scaled by 25%

so that the land use totals match the totals in the MRIO application. This correction
resulted in an overestimation of the land use assigned to imported consumer products
and analysed with much process data, and an underestimation for consumer products
produced locally and analysed without any process data. On the level of individual
consumption categories, this underestimation and overestimation due to the
correction is at most 25% in the individual case that a correction is not applicable.
This is acceptable, because the effect of using multiregional or process data exceeded
this percentage for most consumption categories.
ad. b The choice for the MRIOSRIO application as a basis for the HMR was a practical, but
arbitrary one. To examine the consequences of this choice, we compared two
calculations. The first is using MRIOSRIO (HMR = MRIOSRIO + ∆M + ∆Ph *
correction) and the second is using HybridSRIO (HMR = HybridSRIO + ∆M + ∆Ph *
correction). The resulting environmental loads from the 350 consumption categories
correlated quite strongly; R2=0.97 for land use and R2=0.86 for GHG emissions.
Despite this strong correlation, about 10% (GHG) to 20% (land use) of the categories
deviated by more than 10%, depending on the approach chosen. These deviations
indicated the uncertainties in the results, caused by several choices (such as of source
trade-margins, and of using one sector or a mix of relevant sectors) made by Nijdam
et al. (2005) for the MRIO application and by Benders et al. (2010) for the Hybrid
application.
ad. c The combined HMR application as presented in this paper, was based on data from
2002 (from MRIO) and from 2000 (process). Although Benders et al. (2010) used the
most recent sources for the process data, most of the data was dated before 2000,
because processes only change slowly. The use of different base years introduces
errors, due to efficiency changes. However, the error made by using a different base
year for ∆Ph is minor compared to the errors due to the generic correction factor and
the choice for the single-region basis.
Conclusions
The use of multiregional input–output data is important to establish the total environmental
load from consumption. Using multiregional data or process data both result in substantial
changes in the estimated environmental load of consumption products on a more detailed
level. There are good reasons to assume that the use of both multiregional and process data
will improve the estimates of the environmental impacts of consumption patterns.
We propose a hybrid multi-region (HMR) method, which is successfully applied for
the Netherlands by making a more accurate estimation of the environmental load from 350

specific consumption categories. This level of detail would be required to distinguish
differences in environmental load between individual consumption patterns, which could be
relevant to policymakers. With the HMR method, a relatively fast analysis could be made of
the environmental load from Dutch consumption, because for the Netherlands both a hybrid
and a multi-region input–output application were available, designed for the same
consumption categories. We recommend to improve the here presented application of HMR
by a newly built method, containing both process data and multiregional IO data.
References
Aalbers, Th.G., C. Brink, E. Drissen, A. Faber, D. Nijdam, T. Rood, K. Vringer, H.C. Wilting (2007)
Sustainable production and consumption, an assessment for the Netherlands. Reportnumber
771404006/2007. Netherlands Environmental Assessment Agency, Bilthoven.
Aardenne, J.A. van, F.D. Dentener, J.G.J. Olivier, J.A.H.W. Peters and L.N. Ganzeveld (2005) The
EDGAR 3.2 Fast Track 2000 dataset (32FT2000), downloaded from
http://www.mnp.nl/edgar/model/v32ft2000edgar.
Benders, R.M.J., Wilting, H.C., Kramer, K.J., Moll, H.C. (2001), Description and application of the
EAP computer program for calculating life-cycle energy use and greenhouse gas emissions of
household consumption items, Int. J. of Environment and Pollution, 15, pp. 171-182.
Benders, René M.J., Henri C. Moll, Durk S. Nijdam (2010) From Energy to Environmental Analysis:
improving the resolution of environmental impacts of Dutch private consumption with hybrid
analysis. Draft, to be submitted to Journal of Industrial Ecology
Boustead, I. and G.F. Hancock (1979) Handbook of Industrial Energy Analysis, Ellis Horwood,
Chichester, UK.
Bullard, C.W., P.S. Penner and D.A. Pilati (1978) Net Energy Analysis, Handbook for Combining
Process and Input-Output Analysis, Resources and Energy 1(3), 267-313.
CBS (2002), Household Expenditure Survey 2000, computer file, Statistics Netherlands,
Voorburg/Heerlen.
CBS (2005), Nationale Rekeningen, Input-output tabellen 2002, Statistics Netherlands,
Voorburg/Heerlen.
CBS (2007) Land Use statistics (website). Statistics Netherlands, Voorburg/Heerlen.
www.statline.cbs.nl
Dimaranan, B.V., ed. (2006) Global Trade, Assistance, and Production: The GTAP 6 Data Base. West
Lafayette, Center for Global Trade Analysis.
Engelenburg, B.W.C. van., Rossum, T.M.F. van Rossum, K. Vringer and K. Blok (1994) Calculating
the energy requirements of household purchases --- a practical step by step method. Energy Policy
22(8), 648-656.

FAO (2006) FAOSTAT database collections, Food and Agriculture Organization of the United Nations,
Rome (www.apps.fao.org).
Haas, Willi, Edgar Hertwich, Klaus Hubacek, Katarina Korytarove, Michael Ornetzeder, Helga Weisz
(2005). The environmental impacts of consumption, research methods and driving forces. NTNU,
Industrial Ecology Programme (IndEcol), working paper no.3/2005, Trondheim, Norway.
Joshi, S. (2000) Product environmental life cycle assessment using input–output techniques. Journal of
Industrial Ecology 3, 95– 120.
Kok, Rixt; Benders, René M.J.; Moll, Henri C. (2006) Measuring the environmental load of household
consumption using some methods based on input–output energy analysis: A comparison of methods
and a discussion of results. Energy Policy 34 (2006) pp.2744-2761.
Mayer, Helmut (2007) Calculation and analysis of a hybrid energy input-output table for Germany
within the Environmental-Economic Accounting (EEA). Paper presented at the 16-th International
Input-Output Conference 2 – 6 July 2007 Istanbul/Turkey.
Nijdam, Durk S., Harry C. Wilting, Mark J. Goedkoop, and Jacob Madsen (2005) Environmental Load
from Dutch Private Consumption. How Much Damage Takes Place Abroad? Journal of Industrial
Ecology, Vol.9, no.1-2, pp.147-168.
PRTR (2007) Emission data for the Netherlands . Pollutant Release and Transfer Register. PBL-CBS-
RWS-WUR. www.emissieregistratie.nl .
Peters, Glen P. and Edgar G. Hertwich, (2008), CO2 Embodied in International Trade with implications
for Global Climate Policy, Environmental Science & Technology, 42 (5), pp. 1401-1407.
Rose, S.K., Lee, H.-L. (2008) Non-CO2 Greenhouse Gas Emissions Data for Climate Change
Economic Analysis, in: T. Hertel, S. Rose & R. Tol (eds.) Economic Analysis of Land Use in Global
Climate Change Policy (Routledge).
Suh, Sangwon (ed.) (2009) Handbook of Input-Output Economics in Industrial Ecology. Series: Eco-
Efficiency in Industry and Science , Vol. 23, 2009
Suh, Sangwon, Manfred Lentzen, Graham J. Treloar, Hiroko Hondo, Arpad Horvath, Gjalt Huppes,
Olivier Jolliet, Uwe Klann, Wolfram Krewitt, Yuichi Moriguchi, Jesper Munksgaard and Gregory
Norris (2004) System boundery selection in life-cycle lnventories using hybrid approaches.
Environmental Science & Technology 38(3), 657-664.
Vringer, K., and K. Blok (1995), The direct and indirect energy requirement of households in the
Netherlands, Energy Policy 23(10), p.p. 893-910.
Weber, Christopher L. and H. Scott Matthews (2008) Quantifying the global and distributional aspects
of American household carbon footprint. Ecological Economics, 2008, vol. 66, issue 2-3, pages 379-
391.
Wiedmann, Thomas, Harry Wilting, Stephan Lutter, Viveka Palm, Stefan Giljum, Anders Wadeskog
and Durk Nijdam (2009) Development of a methodology for the assessment of global environmental
impacts of traded goods and services. Final Report, 7th August 2009, ERA-NET SKEP Project
EIPOT.

Appendix A. An update of the multi-region input–output approach (MRIO) as was
described by Nijdam et al. (2005)
Nijdam et al. (2005) described a multi-region input–output application (MRIO) for the
Netherlands for Dutch household consumption in the year 2000, based on sectoral
environmental intensities from 1995. To make an update we used the following data:
- We used the Dutch input–output table for 2002, which consists of 105 economic
sectors (CBS, 2005)
- The foreign input–output tables, which distinguish 30 economic sectors, are
obtained from the GTAP database version 6 (Dimaranan, 2006). We derived the
imports from each sector from the trade data in this database.
- The used environmental data sources are:
o GHG emissions in the Netherlands were obtained from the Dutch Pollutant
Release and Transfer Register (PRTR, 2007)
o GHG emissions abroad were taken from Van Aardenne et al. (2005) and Rose
and Lee (2008)
o Land use data were mainly obtained from FAO databases (FAO, 2006).
- All monetary data were indexed to the euro level from 2000.
- The direct GHG emissions from private consumption, for example, related to
heating and driving, were derived from the Dutch PRTR (2007). The direct land
use was obtained from Statistics Netherlands (CBS, 2007)
Also we improved the mapping from sectoral intensities to 350 expenditure intensities. This
mapping is carried out with a so-called conversion matrix that splits the consumer price of
consumption items into contributions from production sectors, trade and transport margins,
and value-added taxes. The conversion matrix used for the update is an improved version of
the original one used by Nijdam et al. (2005). Three improvements were made:
o To link the products in the Budget Survey to products in the supply table of
the National Accounts, detailed information from Statistics Netherlands was
used.
o A more detailed analysis of the price structure. The Budget Survey uses
consumer prices to value goods, whereas National Accounts use producer
prices (in basic prices). For the decomposition of the consumer price into
basic price, product taxes and subsidies, and trade and transport margins,
information of Statistics Netherlands was used. Thus, the consumer price
could be peeled down to the basic price more accurately for the new

conversion matrix. Furthermore, for every product category in the National
Accounts, it is known which part is produced abroad. The imports of every
product, therefore, could be calculated separately with the conversion matrix.
o Finally, the new conversion matrix was updated by using data from 2000,
except the supply table which is from 2002.

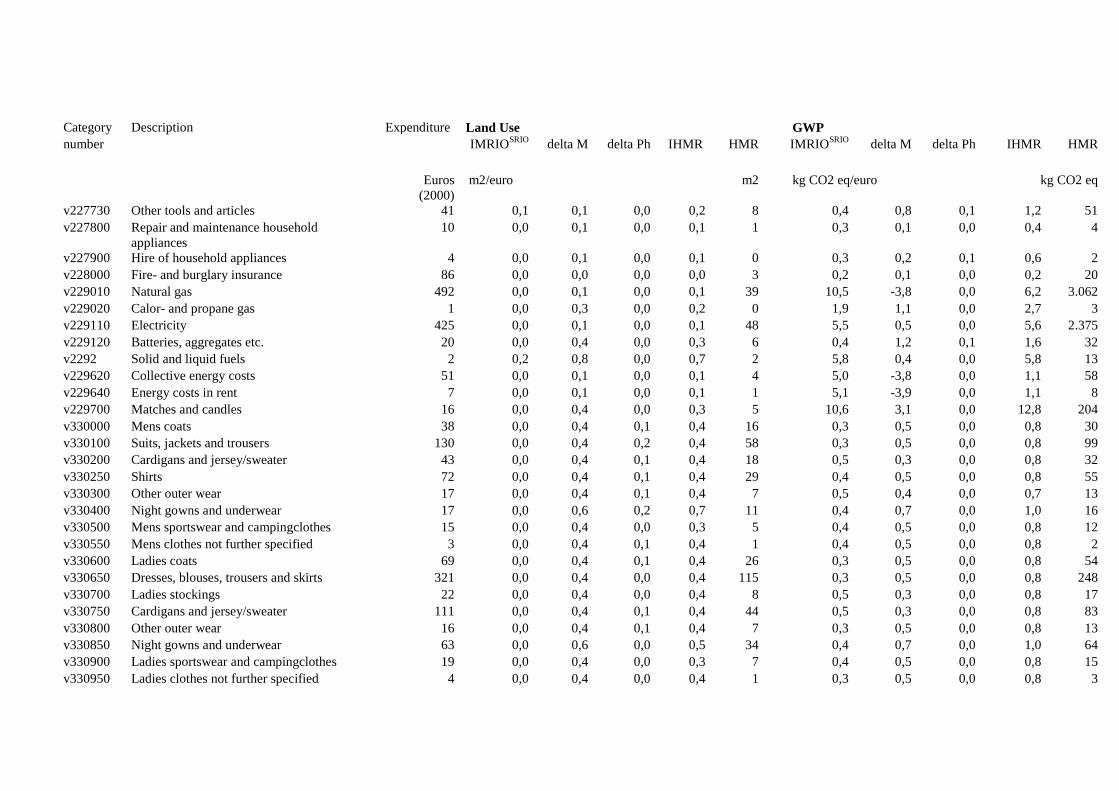
Appendix B. Land use and GHG emission intensities and the effect of using physical process data and multiregional data.
Table B1 shows the intensities and the effect of using physical process data (∆ Ph) and multiregional data (∆ M) for all consumption categories on the
most detailed level, both for land use and GHG emissions. To restrict the amount of land use and GWP emissions to the MRIO totals, all land use
intensities were reduced by 25% and all GWP intensities were reduced by 7%. Some remarks have to be made:
1. The expenditure figures are taken from CBS (2002) The deviation of the mean for the average Dutch household can be large, especially for
less frequent expenditures.
2. The total expenditure given here - € 23,092 per household - is not equal to the total expenditure according to CBS (2002) - € 24,743 euros per
household. In our calculations we excluded expenditures on medical healthcare (€ 337), fines, local taxes and motor vehicle taxes
(€ 791), donations (€ 247), other insurances (€ 199) and other expenditures not specified (€ 77). These expenditures are excluded because
the expenditures on healthcare can be influenced limitedly by Dutch consumers and taxes/donations are non-consumption expenditures.
For other insurances and other expenditures not specified the environmental load could not be established because the MRIO figures were
not available.
3. We stress that table B1 does not answer questions like "What's the 'best buy' (i.e. the 'product' with the lowest environmental load) because
such a question can only be answered after a functional analysis of the expenditure has been performed.

Table B1 Land use and GWP emissions for the average Dutch household, according to the hybrid multi-region (HMR) method. The expenditures are
taken from the budget survey 2000 (CBS, 2002). Mind that for the smaller categories, the statistical error in the expenditures may be large.
Category Description Expenditure Land Use GWP number IMRIOSRIO delta M delta Ph IHMR HMR IMRIOSRIO delta M delta Ph IHMR HMR
Euros
(2000) m2/euro m2 kg CO2 eq/euro kg CO2 eq
Total 23.092 0,7 15.515 1,18 27.181 v110000 Whole meal bread 101 1,1 1,9 1,6 3,5 355 0,9 0,9 0,1 1,8 182 v110100 White bread 72 1,2 1,8 1,0 3,0 216 0,9 0,9 0,2 1,8 131 v110200 Rusk and other sorts of bread 19 1,3 1,9 0,6 2,9 53 1,0 0,9 0,2 1,9 36 v110300 Bread with raisins 24 1,2 2,0 0,1 2,5 58 0,9 1,0 -0,1 1,7 39 v1105 Cake, biscuits and pastry 254 1,1 2,1 1,4 3,5 889 0,9 1,0 0,2 2,0 500 v110710 Wheat meal 8 1,0 2,3 3,4 5,1 39 1,0 0,9 0,2 2,1 16 v110720 Rice 12 1,0 2,3 1,6 3,7 44 0,9 1,1 3,5 5,1 61 v110730 Pastry 12 1,0 2,3 2,4 4,4 52 1,0 0,9 0,1 2,0 23 v110740 Potato-flour, starch 2 1,0 2,4 0,0 2,6 6 1,0 1,0 0,3 2,1 5 v110750 Other flours 25 1,0 2,3 -0,3 2,3 59 0,9 1,1 0,0 1,8 46 v1108 Other bread 2 1,2 1,8 1,3 3,2 8 1,0 0,8 0,2 1,9 5 v1110 Potatoes 53 0,5 3,3 0,8 3,5 184 0,7 1,3 0,7 2,4 129 v111110 Endive and lettuce 24 0,5 1,8 0,2 1,8 44 0,7 0,9 0,6 2,0 47 v111120 Spinach 2 0,6 1,7 0,5 2,1 4 0,6 1,0 0,7 2,1 4 v111130 Other (leafy) vegetables 14 0,7 1,6 0,3 1,9 26 0,5 1,0 0,2 1,7 23 v111210 Cauliflower 17 0,6 1,6 0,3 1,9 32 0,5 1,0 0,3 1,7 29 v111220 Sprouts 3 0,7 1,6 0,4 2,0 6 0,5 1,0 0,3 1,8 5 v111230 Other cabbages 7 0,6 1,6 0,9 2,4 16 0,6 1,0 0,9 2,3 16 v111310 Green beans 15 0,5 1,8 0,1 1,8 27 0,7 0,9 0,4 1,8 27 v111320 Other fresh pulses/leguminous plants 2 2,5 -0,3 0,4 2,0 3 1,8 -0,2 0,3 1,7 3 v111410 Carrots 7 0,7 1,6 0,8 2,3 17 0,5 1,0 0,6 2,0 15 v111420 Onions 8 0,7 1,6 1,1 2,5 21 0,5 1,0 0,8 2,2 18

Category Description Expenditure Land Use GWP number IMRIOSRIO delta M delta Ph IHMR HMR IMRIOSRIO delta M delta Ph IHMR HMR
Euros
(2000) m2/euro m2 kg CO2 eq/euro kg CO2 eq
v111430 Other carrot- and tuberous plants 4 0,4 1,9 0,2 1,8 7 0,8 0,8 0,8 2,2 8 v111510 Tomatoes 18 0,3 2,0 0,2 1,8 33 0,8 0,7 1,1 2,4 44 v111520 Other fresh vegetables 69 0,3 2,0 0,1 1,8 121 0,9 0,7 0,6 2,0 138 v111600 Dried vegetables 9 0,7 2,1 0,0 2,1 19 0,7 0,8 0,9 2,3 21 v111710 Vegetables, canned or bottled 37 0,6 2,1 -0,1 2,0 74 0,7 0,8 0,4 1,8 67 v111740 Sauerkraut 2 0,5 2,2 -0,2 1,9 4 0,7 0,9 0,3 1,7 3 v111750 Frozen vegetables 9 0,5 2,2 0,1 2,1 19 0,7 0,9 0,8 2,2 20 v112010 Apples 34 0,5 2,9 0,9 3,3 109 0,5 1,2 0,7 2,3 76 v112020 Pears 7 0,5 2,9 0,4 2,9 21 0,5 1,2 0,5 2,0 14 v112110 Strawberries 10 0,5 2,9 0,0 2,6 26 0,5 1,2 0,2 1,8 18 v112120 Cherries 3 0,5 2,9 0,1 2,7 8 0,5 1,2 0,3 1,9 5 v112130 Berries and raspberries 1 0,5 2,9 0,3 2,8 3 0,5 1,2 0,2 1,8 2 v112140 Prunes 2 0,5 2,9 0,4 2,9 6 0,5 1,2 0,3 1,9 4 v112150 Peaches 5 0,5 2,9 0,6 3,0 15 0,5 1,2 0,4 1,9 10 v112160 Melons 5 0,5 3,0 0,7 3,1 14 0,5 1,2 0,4 2,0 9 v112170 Grapes 8 0,5 2,9 0,5 3,0 23 0,5 1,2 0,3 1,9 15 v112210 Oranges 28 0,5 2,9 0,7 3,1 88 0,5 1,2 0,5 2,0 56 v112220 Mandarins 16 0,5 2,9 0,5 3,0 48 0,5 1,2 0,3 1,9 30 v112230 Other citrus fruit 5 0,5 2,9 0,5 3,0 14 0,5 1,2 0,3 1,9 9 v112300 Bananas 26 0,5 2,9 0,6 3,1 79 0,5 1,2 0,4 1,9 50 v112400 Other fresh fruit 12 0,5 2,9 0,6 3,0 35 0,5 1,2 0,5 2,0 23 v112500 Jams and marmalades 11 0,7 2,1 0,3 2,3 26 0,7 0,8 0,3 1,8 20 v112600 Fruit, dried/candied 6 0,5 2,2 1,2 3,0 19 0,7 0,9 0,6 2,0 13 v112700 Fruit in juice 8 0,5 2,2 0,1 2,2 17 0,7 0,9 0,3 1,7 13 v112720 Fruit, compote/sauce 9 0,5 2,2 0,5 2,4 21 0,7 0,9 0,4 1,8 16 v112810 Nuts and peanuts 30 0,5 8,0 3,7 9,2 274 0,7 2,5 0,4 3,3 96 v112820 Peanut spread 6 0,5 1,6 4,3 4,9 31 0,7 0,7 0,6 1,8 11 v1129 Potatoes, vegetables and fruit not specified 3 0,7 2,1 0,6 2,6 7 0,5 1,0 0,5 1,9 5

Category Description Expenditure Land Use GWP number IMRIOSRIO delta M delta Ph IHMR HMR IMRIOSRIO delta M delta Ph IHMR HMR
Euros
(2000) m2/euro m2 kg CO2 eq/euro kg CO2 eq
v113000 Sugar 16 1,1 2,8 0,6 3,4 53 0,9 1,3 -0,1 1,9 30 v113120 Honey 4 1,3 3,9 0,2 4,0 14 1,8 -0,1 -0,1 1,5 5 v113130 Sugar products on bread 1 1,1 1,9 0,0 2,2 3 0,9 0,9 0,2 1,8 3 v113200 Confectionary 58 1,1 1,9 0,0 2,2 128 0,9 0,9 0,2 1,8 105 v113300 Chocolate paste/butter on bread 15 1,1 3,5 7,9 9,4 140 0,9 1,6 -0,1 2,2 33 v113400 Other confectionary 57 1,1 3,5 3,0 5,7 328 0,9 1,6 0,1 2,4 136 v113500 Coffee 77 1,7 3,8 1,0 4,9 374 1,0 1,0 -0,4 1,5 112 v113600 Tea 17 1,7 3,8 2,6 6,1 102 1,0 1,0 -0,4 1,5 25 v113700 Cacao 1 0,8 3,8 5,7 7,7 9 0,7 1,8 -0,2 2,1 2 v114010 Mineral and soda water 11 0,5 0,5 0,0 0,7 7 0,6 0,3 0,2 1,1 12 v114020 Fruit and vegetable juices 63 0,5 4,7 1,0 4,7 298 0,6 2,1 0,5 3,0 190 v114030 Other non-alcoholic beverages 102 0,5 0,4 0,5 1,1 109 0,6 0,3 0,8 1,6 164 v114050 Non-alcoholic beer and wine 2 0,2 0,7 0,3 1,0 2 0,4 0,5 0,2 1,0 2 v114110 Beer 102 0,2 0,5 0,3 0,8 78 0,4 0,3 0,2 0,8 78 v114120 Wine 149 0,2 0,2 0,3 0,4 66 0,4 0,3 0,0 0,6 91 v114200 Spirits and liquors 78 0,1 0,1 0,0 0,2 14 0,2 0,0 0,0 0,3 23 v11430 Beverages not specified 2 0,5 0,5 0,0 0,7 1 0,6 0,3 0,0 0,9 1 v115000 Margarine 28 1,0 2,2 2,5 4,3 120 0,8 1,1 0,3 2,1 59 v115100 Other oils and fats 25 1,0 2,2 6,3 7,2 179 0,8 1,1 1,2 2,9 72 v115110 Fats for frying and deep frying 15 1,0 2,2 6,3 7,2 111 0,8 1,1 1,2 2,9 44 v115120 Salad oil 9 1,0 3,7 12,1 12,7 120 0,8 1,7 3,1 5,3 50 v116010 Beef, fresh 63 0,5 2,0 4,2 5,0 318 0,9 1,2 1,5 3,4 213 v116020 Veal, fresh 5 0,5 2,0 -0,3 1,6 9 0,9 1,2 -0,1 1,9 10 v116110 Pork, (fat), fresh 15 0,5 1,6 0,9 2,3 35 0,9 1,1 0,1 1,9 30 v116120 Other pork, fresh 78 0,5 1,6 0,6 2,0 155 0,9 1,1 0,1 1,9 148 v116200 Minced meat, fresh 88 0,5 2,0 4,5 5,2 458 0,8 1,2 1,7 3,5 310 v116300 Offal 25 0,5 1,5 4,2 4,6 115 0,8 0,9 1,6 3,1 76 v116400 Meat and meat products, frozen 27 0,4 1,6 4,1 4,6 123 0,8 0,9 1,5 3,0 81

Category Description Expenditure Land Use GWP number IMRIOSRIO delta M delta Ph IHMR HMR IMRIOSRIO delta M delta Ph IHMR HMR
Euros
(2000) m2/euro m2 kg CO2 eq/euro kg CO2 eq
v116510 Horse meat 1 0,4 1,6 1,9 3,0 4 0,8 0,9 0,6 2,1 3 v116520 Other meat products 13 0,5 1,5 3,9 4,5 57 0,8 0,9 2,2 3,7 47 v116550 Fresh meat, unspecified 6 0,4 1,6 3,1 3,8 23 0,8 0,9 1,2 2,7 16 v116600 Smoked meat 10 0,4 1,6 1,9 2,9 29 0,8 0,9 0,7 2,3 23 v116710 Ham 52 0,4 1,7 0,4 1,9 96 0,8 1,2 0,1 1,9 98 v116720 Bacon 12 0,4 1,7 0,5 2,0 24 0,8 1,2 0,1 1,9 23 v116800 Sausages and meat products 106 0,4 1,7 2,0 3,1 329 0,8 1,2 0,7 2,4 259 v116910 Fried minced meat 4 0,4 1,6 3,2 3,9 15 0,8 0,9 1,1 2,6 10 v116920 Ready-to-use meat dishes 6 0,6 1,4 1,7 2,8 16 0,9 0,9 0,6 2,1 12 v116930 Canned of bottled meat 11 0,4 1,6 2,1 3,1 35 0,8 0,9 0,6 2,2 25 v116940 Other meat and meat products not specified 1 0,4 1,6 2,5 3,4 2 0,8 0,9 0,9 2,5 2 v117010 Deer 1 0,4 1,6 -0,3 1,3 2 0,8 0,9 -0,4 1,3 2 v117020 Poultry 76 0,5 2,0 0,8 2,5 192 0,9 1,2 -0,1 1,9 145 v117100 Fish, fresh 25 0,0 0,2 0,0 0,2 4 1,6 1,6 0,4 3,3 82 v117130 Fish, frozen 8 0,0 2,2 0,0 1,7 14 1,1 2,8 -0,9 2,8 23 v117210 Herring 7 0,0 2,3 0,0 1,7 12 1,6 2,3 -0,6 3,1 22 v117220 Herring, pickled 2 0,0 2,2 0,0 1,7 3 1,1 2,8 -1,5 2,2 4 v117310 Fried fish 5 0,0 2,2 0,0 1,7 9 1,1 2,8 -1,3 2,4 13 v117320 Dried and smoked fish 14 0,0 2,2 0,0 1,7 24 1,1 2,8 -1,5 2,2 30 v117340 Preserved fish 5 0,0 2,2 -0,1 1,7 9 1,1 2,8 -0,6 3,1 16 v117500 Other fish 2 0,0 2,3 0,0 1,7 4 1,6 2,3 -0,6 3,1 7 v118000 Milk 120 1,1 0,9 0,1 1,6 187 1,5 0,5 0,6 2,4 288 v118100 Yogurt 5 1,3 0,9 -0,3 1,5 8 1,8 0,4 0,1 2,1 11 v118200 Custard and porridge 73 1,3 0,9 -0,4 1,4 103 1,8 0,4 -0,2 1,9 136 v118310 Coffee milk 16 1,3 0,9 -0,5 1,3 21 1,8 0,4 -0,2 1,8 29 v118320 Cream 5 1,3 0,9 -0,3 1,5 8 1,8 0,4 1,5 3,4 17 v118400 Ice cream 20 1,2 0,6 -0,5 1,0 20 1,7 0,2 0,0 1,7 34
v118600 Butter 17 1,2 2,3 -0,5 2,2 38 1,7 1,0 3,2 5,5 92

Category Description Expenditure Land Use GWP number IMRIOSRIO delta M delta Ph IHMR HMR IMRIOSRIO delta M delta Ph IHMR HMR
Euros
(2000) m2/euro m2 kg CO2 eq/euro kg CO2 eq
v118700 Cheese 192 1,2 1,1 0,3 2,0 375 1,7 0,5 1,0 3,0 576 v118800 Eggs 24 0,5 2,1 3,0 4,2 100 0,9 1,5 1,7 3,8 91 v1189 Other dairy products not specified 1 1,3 0,9 0,2 1,8 1 1,8 0,4 0,7 2,7 2 v119010 Salt, spices and condiments 36 1,0 1,9 -0,1 2,1 76 1,0 0,9 0,1 1,8 67 v119040 Dressings, mayonnaise etc. 37 1,0 1,9 0,2 2,3 85 1,0 0,9 0,2 1,9 72 v119100 Soup and meat stock 29 1,0 1,9 1,1 3,0 86 1,0 0,9 0,6 2,3 67 v119250 Main course dishes, frozen/canned etc. 64 1,0 1,9 -0,2 2,0 127 1,0 0,9 0,1 1,9 121 v119310 Coffee and tea, in restaurant, etc. 43 0,2 0,6 0,0 0,5 23 0,4 0,3 0,0 0,7 30 v119320 Beverages, in restaurant, etc. 116 0,2 0,6 0,0 0,5 62 0,4 0,3 0,0 0,7 80 v119410 French fries, rolls, snacks, etc. in restaurant 118 0,2 0,6 0,0 0,6 73 0,5 0,2 0,0 0,7 86 v119420 Other meals, in restaurant, etc. 355 0,2 0,6 0,0 0,6 220 0,5 0,2 0,0 0,7 258 v119430 Meals, delivered and take-away 101 0,5 0,4 0,0 0,6 63 0,7 0,1 0,0 0,7 74 v119440 Meals, place of consumption unknown 12 0,2 0,7 0,0 0,6 8 0,5 0,3 0,0 0,7 9 v119500 Candy, not at home 9 1,1 -0,2 0,0 0,6 6 0,9 -0,1 0,0 0,7 7 v119600 Ice cream, not at home 22 1,2 -0,3 0,0 0,6 14 1,7 -1,0 0,0 0,7 16 v119700 Outdoor consumption not specified 313 0,2 0,7 0,0 0,6 194 0,4 0,3 0,0 0,7 227 v1198 Other food products and beverages 7 1,0 1,9 0,8 2,7 20 1,0 0,9 0,3 2,1 15 v220010 Rent 1.809 0,2 0,0 0,1 0,2 386 0,2 0,0 0,1 0,3 481 v220020 Rental value 2.883 0,2 0,0 0,1 0,2 590 0,2 0,0 0,1 0,3 761
v220040 Additional costs 119 0,0 0,0 0,1 0,1 15 0,2 0,0 0,1 0,3 32 v220200 Wall paper and painting costs 91 0,1 0,2 0,3 0,4 38 0,5 0,6 0,0 0,9 84 v220300 Other maintenance costs 86 0,1 0,2 1,7 1,5 128 0,5 0,3 0,1 0,8 71 v221010 Construction of central heating 1 0,1 0,1 0,0 0,1 0 0,5 0,3 0,3 1,0 0 v221020 Boilers and geysers 3 0,0 0,1 0,0 0,1 0 0,4 0,6 0,0 0,9 3 v221030 Construction of other fixed equipment 7 0,0 0,1 0,0 0,1 1 0,4 0,4 0,1 0,8 5 v221110 Materials/maintenance central heating 4 0,1 0,1 0,0 0,1 1 0,5 0,5 0,3 1,2 5 v221120 Materials/maintenance other fixed
equipment 55 0,3 -0,1 0,3 0,4 22 0,5 0,5 0,3 1,2 65

Category Description Expenditure Land Use GWP number IMRIOSRIO delta M delta Ph IHMR HMR IMRIOSRIO delta M delta Ph IHMR HMR
Euros
(2000) m2/euro m2 kg CO2 eq/euro kg CO2 eq
v221140 Service for maintenance central heating 58 0,1 0,1 0,0 0,1 6 0,3 0,5 0,1 0,8 46 v221150 Service other fixed equipment 39 0,1 0,0 0,0 0,1 4 0,4 0,4 0,1 0,8 30 v221400 Rent fixed equipment 11 0,0 0,1 0,0 0,1 1 0,3 0,4 0,1 0,8 9 v222000 Rent and maintenance garden 84 0,1 1,4 0,0 1,1 92 0,2 1,2 0,0 1,3 113 v222100 Other costs garden 156 0,1 1,4 0,5 1,5 227 0,6 0,8 0,1 1,4 225 v222200 Indoor plants and flowers 138 0,1 1,5 0,0 1,2 172 0,7 0,9 0,3 1,8 248 v224010 Furniture (set), cabinet 100 0,1 0,4 0,3 0,6 64 0,4 0,6 0,1 1,0 101 v224020 Other dining room and living room furniture 205 0,2 0,4 0,3 0,7 136 0,4 0,6 0,1 1,0 214 v224110 Bedroom and nursery furniture 29 0,1 0,2 0,3 0,5 15 0,4 0,4 0,1 0,8 22 v224120 Other bedroom and nursery furniture 75 0,1 0,2 0,3 0,5 38 0,4 0,3 0,1 0,8 57 v224140 Prams, buggies 8 0,0 0,4 0,0 0,3 3 0,3 0,7 0,0 0,9 7 v224210 Furniture garden, kitchen and study (set) 25 0,2 0,4 0,3 0,6 15 0,4 0,6 0,2 1,1 27 v224220 Other furniture garden, kitchen and camping 17 0,2 0,4 0,3 0,6 10 0,4 0,6 0,2 1,1 19 v224240 Other furniture 26 0,5 0,0 0,3 0,6 16 0,4 0,6 0,1 1,0 26 v224310 Net curtains 8 0,0 0,6 0,2 0,6 5 0,6 0,7 0,0 1,1 9 v224320 Curtains and material for curtains 51 0,0 0,6 0,2 0,7 34 0,6 0,6 0,0 1,1 53 v224330 Blinds and wire blinds 47 0,1 0,4 0,0 0,4 17 0,6 0,4 0,3 1,2 56 v224410 Lino 12 0,1 0,3 0,0 0,3 3 0,6 0,9 0,0 1,4 16 v224420 Parquet 33 0,9 1,3 0,8 2,3 75 0,3 0,5 0,1 0,9 28 v224500 Carpets, etc. 81 0,0 0,6 0,0 0,5 42 0,6 0,6 0,0 1,1 89 v224600 Other furniture textiles 37 0,1 0,5 0,2 0,7 25 0,4 0,8 0,0 1,1 39 v224700 Wall decoration 39 0,1 0,6 0,0 0,5 22 0,4 0,4 0,1 0,8 33 v224800 Statues, vases and knick-knacks 49 0,0 0,3 0,0 0,2 12 0,5 0,9 0,1 1,3 65 v224900 Mattresses 25 0,1 0,2 0,2 0,4 11 0,4 0,4 0,1 0,8 19 v225000 Blankets 2 0,0 0,6 0,1 0,6 1 0,6 0,6 0,0 1,1 2 v225210 Sheets and pillow-cases 33 0,0 0,6 1,2 1,4 45 0,6 0,7 -0,2 1,0 32 v225220 Quilts, eiderdowns 21 0,0 0,6 0,1 0,6 12 0,6 0,7 0,0 1,1 23 v225230 Other bedding 2 0,0 0,6 1,2 1,4 3 0,6 0,7 -0,2 1,0 2

Category Description Expenditure Land Use GWP number IMRIOSRIO delta M delta Ph IHMR HMR IMRIOSRIO delta M delta Ph IHMR HMR
Euros
(2000) m2/euro m2 kg CO2 eq/euro kg CO2 eq
v225300 Household linen 19 0,1 0,5 0,9 1,2 22 0,6 0,7 -0,1 1,0 19 v2255 Domestic decoration not specified 5 0,0 0,4 0,3 0,5 2 0,0 1,5 0,1 1,4 7 v226010 Electric food processors/utensils 28 0,0 0,2 0,0 0,2 5 0,4 0,5 0,1 0,9 25 v226050 Other food processors/utensils 2 0,0 0,2 0,0 0,2 0 0,4 0,4 0,1 1,0 2 v226100 Refrigerators and freezers 26 0,0 0,2 0,0 0,2 5 0,4 0,5 0,2 1,0 25 v226300 Pottery and glassware 25 0,0 0,3 0,0 0,2 6 0,5 0,8 0,1 1,3 32 v226330 Other cutlery and kitchen utensils 77 0,1 0,2 0,5 0,5 42 0,5 0,7 0,3 1,4 109 v226500 Stoves 5 0,0 0,2 0,0 0,2 1 0,4 0,8 0,1 1,2 6 v226600 Other cooking apparatus 20 0,0 0,2 0,0 0,2 4 0,4 0,8 0,1 1,2 25 v226720 Gas heaters 3 0,0 0,2 0,0 0,2 1 0,4 0,8 0,1 1,2 4 v226730 Other heaters and stoves 2 0,0 0,2 0,0 0,2 0 0,4 0,8 0,1 1,2 3 v226800 Lamps and armatures 51 0,0 0,2 0,0 0,2 10 0,4 0,6 0,1 1,0 49 v226910 Bulbs and fluorescent lamps 11 0,0 0,2 0,0 0,2 2 0,4 0,6 -0,1 0,8 9 v226920 Cords, plugs and switches 7 0,0 0,2 0,0 0,2 1 0,4 0,6 0,1 1,0 7 v227010 Vacuum cleaners 12 0,0 0,2 0,0 0,2 2 0,4 0,5 0,1 0,9 11 V227100 Washingmachines and tumble diers
(electric) 56 0,0 0,2 0,0 0,2 11 0,4 0,5 0,1 0,9 52
V227210 Electric irons 3 0,0 0,2 0,0 0,2 1 0,4 0,5 0,0 0,8 2 v227215 Cleaning appliances not electric 19 0,0 0,2 0,0 0,2 3 0,5 0,7 0,2 1,3 24 v227220 Washing and ironing requisites 5 0,0 0,2 0,0 0,2 1 0,5 0,7 0,2 1,3 6 v227310 Brushes, brooms, sponges etc. 10 0,0 2,2 0,0 1,7 17 0,5 0,4 0,1 0,9 9 v227340 Accessories cleansing apparatus 4 0,0 0,2 0,0 0,2 1 0,3 0,9 0,1 1,2 5 v227510 Alarm clocks 2 0,0 0,2 0,0 0,2 0 0,3 0,6 0,1 0,9 1 v227520 Clocks 5 0,0 0,2 0,0 0,2 1 0,3 0,6 0,1 0,9 5 v227610 Electric sewing machines 5 0,0 0,2 0,0 0,2 1 0,4 0,5 0,0 0,8 4 v227620 Needlework tools 1 0,1 0,2 0,0 0,2 0 0,5 0,7 0,2 1,3 2 v227630 Other textile apparatus and accessories 1 0,0 0,2 0,0 0,2 0 0,4 0,8 0,0 1,1 1 v227710 Other electric apparatus 26 0,0 0,2 0,0 0,2 5 0,3 0,6 0,0 0,8 21
Category Description Expenditure Land Use GWP number IMRIOSRIO delta M delta Ph IHMR HMR IMRIOSRIO delta M delta Ph IHMR HMR
Euros
(2000) m2/euro m2 kg CO2 eq/euro kg CO2 eq
v227730 Other tools and articles 41 0,1 0,1 0,0 0,2 8 0,4 0,8 0,1 1,2 51 v227800 Repair and maintenance household
appliances 10 0,0 0,1 0,0 0,1 1 0,3 0,1 0,0 0,4 4
v227900 Hire of household appliances 4 0,0 0,1 0,0 0,1 0 0,3 0,2 0,1 0,6 2 v228000 Fire- and burglary insurance 86 0,0 0,0 0,0 0,0 3 0,2 0,1 0,0 0,2 20 v229010 Natural gas 492 0,0 0,1 0,0 0,1 39 10,5 -3,8 0,0 6,2 3.062 v229020 Calor- and propane gas 1 0,0 0,3 0,0 0,2 0 1,9 1,1 0,0 2,7 3 v229110 Electricity 425 0,0 0,1 0,0 0,1 48 5,5 0,5 0,0 5,6 2.375 v229120 Batteries, aggregates etc. 20 0,0 0,4 0,0 0,3 6 0,4 1,2 0,1 1,6 32 v2292 Solid and liquid fuels 2 0,2 0,8 0,0 0,7 2 5,8 0,4 0,0 5,8 13 v229620 Collective energy costs 51 0,0 0,1 0,0 0,1 4 5,0 -3,8 0,0 1,1 58 v229640 Energy costs in rent 7 0,0 0,1 0,0 0,1 1 5,1 -3,9 0,0 1,1 8 v229700 Matches and candles 16 0,0 0,4 0,0 0,3 5 10,6 3,1 0,0 12,8 204 v330000 Mens coats 38 0,0 0,4 0,1 0,4 16 0,3 0,5 0,0 0,8 30 v330100 Suits, jackets and trousers 130 0,0 0,4 0,2 0,4 58 0,3 0,5 0,0 0,8 99 v330200 Cardigans and jersey/sweater 43 0,0 0,4 0,1 0,4 18 0,5 0,3 0,0 0,8 32 v330250 Shirts 72 0,0 0,4 0,1 0,4 29 0,4 0,5 0,0 0,8 55 v330300 Other outer wear 17 0,0 0,4 0,1 0,4 7 0,5 0,4 0,0 0,7 13 v330400 Night gowns and underwear 17 0,0 0,6 0,2 0,7 11 0,4 0,7 0,0 1,0 16 v330500 Mens sportswear and campingclothes 15 0,0 0,4 0,0 0,3 5 0,4 0,5 0,0 0,8 12 v330550 Mens clothes not further specified 3 0,0 0,4 0,1 0,4 1 0,4 0,5 0,0 0,8 2 v330600 Ladies coats 69 0,0 0,4 0,1 0,4 26 0,3 0,5 0,0 0,8 54 v330650 Dresses, blouses, trousers and skirts 321 0,0 0,4 0,0 0,4 115 0,3 0,5 0,0 0,8 248 v330700 Ladies stockings 22 0,0 0,4 0,0 0,4 8 0,5 0,3 0,0 0,8 17 v330750 Cardigans and jersey/sweater 111 0,0 0,4 0,1 0,4 44 0,5 0,3 0,0 0,8 83 v330800 Other outer wear 16 0,0 0,4 0,1 0,4 7 0,3 0,5 0,0 0,8 13 v330850 Night gowns and underwear 63 0,0 0,6 0,0 0,5 34 0,4 0,7 0,0 1,0 64 v330900 Ladies sportswear and campingclothes 19 0,0 0,4 0,0 0,3 7 0,4 0,5 0,0 0,8 15 v330950 Ladies clothes not further specified 4 0,0 0,4 0,0 0,4 1 0,3 0,5 0,0 0,8 3

Category Description Expenditure Land Use GWP number IMRIOSRIO delta M delta Ph IHMR HMR IMRIOSRIO delta M delta Ph IHMR HMR
Euros
(2000) m2/euro m2 kg CO2 eq/euro kg CO2 eq
v331000 Boys coats 11 0,0 0,4 0,2 0,5 5 0,3 0,5 0,0 0,8 9 v331050 Suits, jackets and trousers 21 0,0 0,4 0,4 0,6 14 0,3 0,5 0,0 0,8 16 v331100 Cardigans and jersey/sweater 16 0,0 0,4 0,1 0,4 7 0,5 0,4 0,0 0,8 12 v331150 Shirts 10 0,0 0,4 0,1 0,4 4 0,4 0,5 0,0 0,8 8 v331200 Other outer wear 5 0,0 0,4 0,1 0,4 2 0,4 0,4 0,0 0,8 4 v331300 Night gowns and underwear 7 0,1 0,7 0,5 0,9 6 0,4 0,7 -0,1 1,0 7 v331400 Boys sports-wear and campingclothes 6 0,0 0,4 0,0 0,4 2 0,4 0,5 0,0 0,8 5 v331550 Boys clothes not further specified 0 0,0 0,4 0,1 0,4 0 0,3 0,5 0,0 0,8 0 v331800 Girls coats 10 0,0 0,4 0,1 0,4 4 0,3 0,5 0,0 0,8 8 v331900 Dresses, blouses, trousers and skirts 51 0,0 0,4 0,1 0,4 20 0,3 0,5 0,0 0,8 39 v332000 Cardigans and jersey/sweater 18 0,0 0,4 0,1 0,4 7 0,5 0,3 0,0 0,8 14 v332050 Other outer wear 9 0,0 0,4 0,0 0,4 3 0,5 0,4 0,0 0,8 7 v332100 Night gowns and underwear 10 0,1 0,7 0,1 0,6 6 0,4 0,8 0,0 1,1 11 v332150 Girls sports-wear and campingclothes 5 0,0 0,4 0,0 0,3 2 0,4 0,5 0,0 0,8 4 v332200 Girls clothes not further specified 1 0,0 0,4 0,0 0,4 0 0,3 0,5 0,0 0,8 1 v33250 Baby clothes 29 0,1 0,4 0,1 0,4 11 0,4 0,5 0,0 0,8 22 v3327 Clothes unspecified (age, sex, unknown) 21 0,0 0,4 0,1 0,4 8 0,3 0,5 0,0 0,8 16 v3328 Clothing accessories 32 0,0 0,7 0,1 0,6 20 0,4 0,8 0,0 1,1 34 v333100 Material for clothes 15 0,0 0,6 0,2 0,7 11 0,5 0,6 0,0 1,1 16 v333150 Knitting wool 2 0,0 0,6 0,4 0,8 1 0,6 0,6 0,0 1,1 2 v333160 Requisites, haberdashery 11 0,1 0,6 0,1 0,5 5 0,5 0,7 0,0 1,1 11 v333200 Hire and charge for making clothes 5 0,0 0,1 0,0 0,1 0 0,3 0,0 0,0 0,3 2 v3340 Other clothing and requisites 3 0,0 0,6 0,1 0,5 1 0,4 0,7 0,0 1,1 3 v335000 Mens shoes 56 0,1 0,7 0,9 1,3 70 0,5 0,7 0,2 1,2 69 v335100 Other mens footwear 7 0,1 0,7 1,4 1,6 11 0,5 0,7 0,4 1,5 10 v335200 Mens sports shoes 13 0,1 0,7 0,1 0,6 9 0,5 0,7 0,0 1,1 15 v336000 Ladies shoes 108 0,1 0,7 0,3 0,9 93 0,5 0,7 0,0 1,1 117 v336100 Other ladies footwear 9 0,1 0,7 0,7 1,1 10 0,5 0,7 0,1 1,2 11

Category Description Expenditure Land Use GWP number IMRIOSRIO delta M delta Ph IHMR HMR IMRIOSRIO delta M delta Ph IHMR HMR
Euros
(2000) m2/euro m2 kg CO2 eq/euro kg CO2 eq
v336200 Ladies sports shoes 10 0,1 0,7 0,1 0,7 7 0,5 0,7 0,0 1,1 11 v33700 Boys shoes 29 0,1 0,7 0,8 1,2 35 0,5 0,7 0,2 1,3 37 v33710 Girls shoes 31 0,1 0,7 0,9 1,3 39 0,5 0,7 0,2 1,3 39 V33720 Infant and baby footwear 1 0,1 0,7 0,6 1,0 1 0,5 0,7 0,1 1,2 2 v3375 Footwear unspecified (age. sex unknown) 2 0,1 0,7 0,6 1,0 2 0,5 0,7 0,1 1,2 3 v3376 Hire of footwear 3 0,0 0,1 0,0 0,1 0 0,3 0,0 0,0 0,3 1 v338000 Shoe repairs 8 0,0 0,2 0,0 0,1 1 0,3 0,1 0,0 0,4 3 v338100 Repairing materials 3 0,1 0,3 0,0 0,3 1 0,5 1,1 0,0 1,4 4 v338200 Leather goods etc. 46 0,1 1,3 1,6 2,3 104 0,5 1,1 0,2 1,6 75 v338300 Jewellery and watches 85 0,0 0,4 0,0 0,3 27 0,3 0,7 0,0 0,8 72 v338400 Other finery 11 0,0 0,4 0,0 0,3 4 0,3 0,6 0,0 0,9 10 v338500 Repairs to finery 9 0,0 0,1 0,0 0,1 1 0,3 0,1 0,0 0,3 3 v339 Clothing, footwear and accessories not
specified 1 0,0 0,6 0,2 0,6 0 0,4 0,8 0,0 1,1 1
v440000 Wages for domestic staff/servants 160 0,0 0,0 0,0 0,0 1 0,1 0,0 0,0 0,1 9 v440100 Laundry, dry cleaning, dye works 17 0,0 0,1 0,0 0,1 1 0,2 0,1 0,0 0,3 5 v440230 Window-cleaning service etc. 34 0,0 0,1 0,0 0,1 4 0,1 0,2 0,0 0,3 12 v440240 Babysitting, nursery etc. 184 0,1 0,1 0,0 0,1 23 0,2 0,1 0,0 0,3 54 v441000 Water 153 0,0 0,1 0,0 0,1 10 0,4 0,5 0,0 0,9 139 v441110 Household soap 0 0,1 0,2 0,0 0,2 0 0,4 0,6 0,1 1,1 0 v441200 Washing powders etc. 55 0,1 0,2 0,2 0,3 19 0,4 0,6 0,3 1,3 70 v441210 Detergents 16 0,1 0,2 0,0 0,2 3 0,4 0,6 0,1 1,1 17 v441300 Other cleaning articles and insecticides 38 0,1 0,2 0,0 0,2 7 0,4 0,6 0,1 1,1 42 v442000 Toilet-articles 134 0,1 0,2 0,9 0,8 113 0,5 0,4 0,1 0,9 114 v442100 Toilet paper 32 0,1 0,6 2,1 2,1 68 0,5 0,3 0,6 1,3 41 v442200 Sanitary towels 16 0,1 0,6 0,7 1,1 17 0,7 0,1 0,0 0,8 12 v442300 Visits to (public) baths/toilet/sauna 11 0,1 0,1 0,0 0,1 1 0,3 0,1 0,0 0,3 3 v443000 Hairdresser 153 0,0 0,1 0,0 0,1 13 0,2 0,1 0,0 0,3 41 v443110 Electrical articles for hair care 5 0,0 0,2 0,0 0,2 1 0,4 0,5 -0,1 0,7 4

Category Description Expenditure Land Use GWP number IMRIOSRIO delta M delta Ph IHMR HMR IMRIOSRIO delta M delta Ph IHMR HMR
Euros
(2000) m2/euro m2 kg CO2 eq/euro kg CO2 eq
v443120 Other articles for hair care 68 0,1 0,2 0,0 0,2 11 0,4 0,4 0,0 0,8 54 v444000 Chiropodist, manicurist, beauty salon 34 0,0 0,1 0,0 0,1 4 0,2 0,1 0,0 0,3 10 v444100 Cosmetics and perfumery 101 0,1 0,2 0,0 0,2 17 0,4 0,4 -0,1 0,7 69 v550000 School fees, course and professional training 75 0,1 0,1 0,0 0,1 6 0,2 0,1 0,0 0,3 20 v550100 Music-, dancing- and sports lessons 81 0,1 0,0 0,0 0,1 6 0,3 0,0 0,0 0,3 26 v550150 Course fees 167 0,0 0,1 0,0 0,1 9 0,2 0,1 0,0 0,3 52 v550200 Study books and educational appliances 103 0,1 0,7 0,2 0,7 71 0,4 0,4 -0,1 0,7 69 v550300 Other educational costs 26 0,0 0,0 0,0 0,1 2 0,3 -0,1 0,0 0,2 5 v550400 Typewriter, counting machine/calculator 1 0,0 0,4 0,0 0,3 0 0,3 0,8 0,0 1,0 1 v550450 Computer and assesories 219 0,0 0,4 0,0 0,3 74 0,3 0,8 0,0 1,0 228 v550460 Other stationary 53 0,1 0,4 0,0 0,4 19 0,3 0,6 0,0 0,9 46 v550500 Newspaper and weekly papers 190 0,1 0,7 0,5 1,0 192 0,4 0,5 0,2 1,0 187 v550610 Books 90 0,1 0,7 0,2 0,7 61 0,4 0,4 -0,1 0,7 60 v550620 Journals, periodicals and magazines 39 0,1 0,7 0,1 0,7 27 0,4 0,5 -0,1 0,7 29 v551100 Hire sports accommodations 59 0,2 -0,1 0,0 0,1 5 0,3 -0,1 0,0 0,3 18 v551210 Sailing boats and motorboats 16 0,0 0,2 0,0 0,2 3 0,4 0,5 0,1 0,9 15 v551250 Sports goods 36 0,1 0,4 0,0 0,4 13 0,3 0,8 0,0 1,0 35 v551300 Games 10 0,1 0,4 0,1 0,4 5 0,3 0,8 0,0 1,0 10 v551400 Contribution sports clubs 124 0,1 0,3 0,0 0,3 40 0,3 0,5 0,0 0,8 97 v551610 Caravans etc. 89 0,0 0,2 0,0 0,2 21 0,4 0,6 0,3 1,3 117 v551620 Other camping equipment 21 0,1 0,4 0,2 0,5 10 0,5 0,4 0,0 0,9 19 v551640 Hire and maintenance camping equipment 19 0,0 0,1 0,0 0,1 1 0,4 0,0 0,0 0,3 6 v55170 Holyday insurance 42 0,0 0,0 0,0 0,0 1 0,2 0,1 0,0 0,2 10 v55180 Other costs weekend-spendings 98 0,2 0,7 0,0 0,6 63 0,7 0,0 0,0 0,7 67 v551900 All-inclusive holidaytrips, domestic 63 0,0 0,2 0,0 0,2 12 0,2 0,8 0,0 0,9 58 v551950 Other holiday costs, domestic 92 0,1 0,8 0,0 0,6 60 0,2 0,5 0,0 0,7 63 v552100 All-inclusive holidaytrips, abroad 482 0,1 0,2 0,0 0,2 89 0,9 0,1 0,0 0,9 449 v552200 Other holiday costs, abroad 506 0,1 0,8 0,0 0,7 336 0,2 0,5 0,0 0,7 345

Category Description Expenditure Land Use GWP number IMRIOSRIO delta M delta Ph IHMR HMR IMRIOSRIO delta M delta Ph IHMR HMR
Euros
(2000) m2/euro m2 kg CO2 eq/euro kg CO2 eq
v55250 Holiday costs not specified 24 0,1 0,8 0,0 0,6 15 0,2 0,5 0,0 0,7 16 v553100 Entrance fees concert, theatre, etc. 71 0,2 0,2 0,0 0,3 21 0,4 0,3 0,0 0,7 47 v553200 Musical instruments 11 0,1 0,4 0,0 0,4 4 0,3 0,8 0,0 1,0 11 v553300 Hire and repairs of musical instruments 14 0,2 0,0 0,0 0,1 2 0,3 0,0 0,0 0,3 5 v553510 Radios 2 0,0 0,4 0,0 0,3 1 0,3 0,7 0,0 1,0 2 v553520 Audio amplifier 14 0,0 0,4 0,0 0,4 5 0,3 0,7 0,1 1,0 14 v553530 Car radios inclusive accessories. 9 0,0 0,4 0,0 0,3 3 0,3 0,7 -0,1 0,8 8 v553600 Television sets 59 0,0 0,4 0,1 0,4 24 0,3 0,7 0,1 1,0 60 v553710 Gramophones 1 0,0 0,4 0,0 0,3 0 0,3 0,7 0,1 1,0 1 v553720 Cassette and tape recorders 12 0,0 0,4 0,0 0,3 4 0,3 0,7 0,0 0,9 11 v553730 Videos 51 0,1 0,4 0,0 0,3 17 0,5 0,5 0,0 1,0 49 v553800 Soundequipment (combined) 46 0,0 0,4 0,0 0,3 16 0,3 0,7 0,1 1,0 46 v553900 Hire/repairs audio/video equipment 26 0,0 0,1 0,0 0,1 2 0,3 0,0 0,1 0,4 10 v554000 Records, cassettes and compact disks 78 0,0 0,4 0,0 0,3 25 0,3 0,6 -0,1 0,8 64 v554110 Radio and television license fee 30 0,2 0,2 0,0 0,3 8 0,4 0,3 0,0 0,6 19 v554120 Radio/TV programme magazine 22 0,1 0,3 0,6 0,8 17 0,4 0,4 0,0 0,7 16 v554130 Fee subscription television 10 0,0 0,3 0,0 0,3 3 0,2 0,5 0,0 0,6 6 v554300 Film and projection equipment 0 0,0 0,2 0,0 0,2 0 0,3 0,6 -0,1 0,8 0 v554350 Photo cameras 19 0,0 0,2 0,0 0,2 3 0,3 0,5 -0,1 0,7 13 v554450 Film and photo accessories 76 0,1 0,2 0,6 0,6 45 0,3 0,5 0,0 0,8 57 v554455 Optical instruments and accessories 1 0,0 0,3 0,0 0,2 0 0,3 0,8 0,1 1,2 2 v554610 Purchase of pets 14 1,2 4,1 0,0 4,0 56 1,8 1,2 -0,2 2,6 37 v554620 Costs tending pets 167 0,4 -0,3 0,2 0,3 44 0,5 -0,1 0,0 0,4 66 v554650 Services provided by clubs 3 0,1 0,1 0,0 0,1 0 0,2 0,1 0,0 0,3 1 v554700 Cultural clubs 79 0,1 0,4 0,0 0,3 26 0,3 0,5 0,0 0,7 57 v554750 Lincenses and taxes relaxation 6 0,0 0,1 0,0 0,1 0 0,0 0,3 0,0 0,3 2 v554800 Other entrance fees 62 0,3 0,2 0,0 0,3 18 0,3 0,3 0,0 0,7 41 v554900 Other hobbies 16 0,1 0,3 0,0 0,3 4 0,3 0,4 -0,2 0,5 8

Category Description Expenditure Land Use GWP number IMRIOSRIO delta M delta Ph IHMR HMR IMRIOSRIO delta M delta Ph IHMR HMR
Euros
(2000) m2/euro m2 kg CO2 eq/euro kg CO2 eq
v555000 Party articles 30 0,1 0,1 0,0 0,2 6 0,5 1,0 0,0 1,4 43 v5551 Toys 93 0,1 0,3 0,0 0,3 30 0,3 1,2 0,0 1,4 130 v556000 Cigars 11 0,3 1,4 -0,4 1,0 11 0,2 0,6 -0,3 0,5 6 v556100 Cigarettes 145 0,3 1,0 -0,3 0,7 106 0,2 0,4 -0,2 0,4 61 v556200 Other tobacco articles 79 0,3 1,0 -0,3 0,8 62 0,3 0,4 -0,1 0,5 40 v556300 Smokers accessories 2 0,0 0,3 0,0 0,3 1 0,3 1,2 0,0 1,4 3 v557000 Train 167 0,1 0,1 0,0 0,2 29 0,7 0,1 0,0 0,7 119 v557110 Taxi 23 0,1 0,1 0,0 0,2 4 0,7 0,1 0,0 0,7 16 v557120 Other public transport 82 0,2 0,0 0,0 0,2 14 2,6 -1,8 0,0 0,7 58 v557200 Purchase bicycles 82 0,0 0,3 0,0 0,2 18 0,4 0,7 0,0 1,0 80 v557300 Bicycle accessories and repairs 48 0,0 0,2 0,0 0,2 9 0,3 0,9 0,0 1,1 54 v557400 Mopeds, motor cycles and scooters 37 0,0 0,2 0,0 0,2 6 0,3 0,4 -0,1 0,6 22 v557500 Repair mopeds, motor cycles and scooters 16 0,0 0,1 0,0 0,1 1 0,3 0,0 0,0 0,3 5 v5576 Cars 1.454 0,0 0,2 0,0 0,1 205 0,2 0,5 0,0 0,8 1.122 v557910 Car/motor cycle storage 35 0,0 0,1 0,0 0,1 3 0,3 -0,1 0,0 0,2 9 v557920 Bicycle/moped storage 2 0,0 0,1 0,0 0,1 0 0,3 -0,1 0,0 0,2 1 v558010 Insurance car 303 0,0 0,0 0,0 0,0 11 0,2 0,1 0,0 0,2 72 v558020 Insurance motor cycle, scooter 8 0,0 0,0 0,0 0,0 0 0,2 0,1 0,0 0,2 2 v558030 Insurance moped and bicycle 9 0,0 0,0 0,0 0,0 0 0,2 0,1 0,0 0,2 2 v558040 Other insurance vehicles/vessels etc. 8 0,0 0,0 0,0 0,0 0 0,2 0,1 0,0 0,2 2 v558110 Petrol, oil for cars and motor cycles 875 0,0 0,1 0,0 0,1 62 4,0 0,0 0,0 3,7 3.253 v558120 Other petrol and oil 1 0,0 0,1 0,0 0,1 0 0,6 0,4 0,0 0,9 1 v558200 Telephone 614 0,0 0,0 0,0 0,0 27 0,2 0,2 0,0 0,4 217 v558300 Postal expenses 27 0,0 0,0 0,0 0,0 1 0,2 0,0 0,0 0,2 6 v558420 Driving lessons 48 0,0 0,1 0,0 0,1 4 0,2 0,1 0,0 0,3 14 v558430 Cargo services 16 0,1 0,1 0,0 0,1 2 0,7 0,4 0,1 1,2 18