
A Human-Computer Integrated Approach Towards Content ...
144
Wright State University Wright State University CORE Scholar CORE Scholar Browse all Theses and Dissertations Theses and Dissertations 2010 A Human-Computer Integrated Approach Towards Content Based A Human-Computer Integrated Approach Towards Content Based Image Retrieval Image Retrieval Phani Nandan Kidambi Wright State University Follow this and additional works at: https://corescholar.libraries.wright.edu/etd_all Part of the Engineering Commons Repository Citation Repository Citation Kidambi, Phani Nandan, "A Human-Computer Integrated Approach Towards Content Based Image Retrieval" (2010). Browse all Theses and Dissertations. 1027. https://corescholar.libraries.wright.edu/etd_all/1027 This Dissertation is brought to you for free and open access by the Theses and Dissertations at CORE Scholar. It has been accepted for inclusion in Browse all Theses and Dissertations by an authorized administrator of CORE Scholar. For more information, please contact [email protected].
-
Upload
khangminh22 -
Category
Documents
-
view
0 -
download
0
Transcript of A Human-Computer Integrated Approach Towards Content ...

Wright State University Wright State University
CORE Scholar CORE Scholar
Browse all Theses and Dissertations Theses and Dissertations
2010
A Human-Computer Integrated Approach Towards Content Based A Human-Computer Integrated Approach Towards Content Based
Image Retrieval Image Retrieval
Phani Nandan Kidambi Wright State University
Follow this and additional works at: https://corescholar.libraries.wright.edu/etd_all
Part of the Engineering Commons
Repository Citation Repository Citation Kidambi, Phani Nandan, "A Human-Computer Integrated Approach Towards Content Based Image Retrieval" (2010). Browse all Theses and Dissertations. 1027. https://corescholar.libraries.wright.edu/etd_all/1027
This Dissertation is brought to you for free and open access by the Theses and Dissertations at CORE Scholar. It has been accepted for inclusion in Browse all Theses and Dissertations by an authorized administrator of CORE Scholar. For more information, please contact [email protected].

A HUMAN-COMPUTER INTEGRATED APPROACH TOWARDS CONTENT BASED
IMAGE RETRIEVAL
A dissertation submitted in partial fulfillment of the
requirements for the degree of
Doctor of Philosophy
By
PHANI KIDAMBI
B. Tech., Jawaharlal Nehru Technological University, 2004
M.S., Wright State University, 2006
2010
Wright State University

Copyright by
Phani Kidambi
2010

WRIGHT STATE UNIVERSITY
SCHOOL OF GRADUATE STUDIES
November 18, 2010
I HEREBY RECOMMEND THAT THE DISSERTATION PREPARED UNDER MY SUPERVISION BY Phani Kidambi ENTITLED A Human-Computer Integrated Approach towards Content Based Image Retrieval BE ACCEPTED IN PARTIAL FULFILLMENT OF THE REQUIREMENTS FOR THE DEGREE OF Doctor of Philosophy.
______________________________ S. Narayanan, Ph.D., P.E.
Dissertation Director
______________________________ Ramana Grandhi, Ph.D.
Director, Ph.D. in Engineering Program
______________________________ Andrew Hsu, Ph.D.
Dean, School of Graduate Studies Committee on Final Examination ______________________________ S. Narayanan, Ph.D., P.E. ______________________________ Jennie Gallimore, Ph.D. ______________________________ Fred Garber, Ph.D. ______________________________ Yan Liu, Ph.D. ______________________________ Richard Koubek, Ph.D.

iv
Abstract
Kidambi, Phani. Ph.D., Engineering Ph.D. Program, Wright State University, 2010. A Human-Computer Integrated Approach Towards Content Based Image Retrieval.
Digital photography technologies permit quick and easy uploading of any image to the
web. Millions of images being are uploaded on the World Wide Web every day by a wide range
of users. Most of the uploaded images are not readily accessible as they are not organized so as
to allow efficient searching, retrieval, and ultimately browsing. Currently major commercial
search engines utilize a process known as Annotation Based Image Retrieval (ABIR) to execute
search requests focused on retrieving an image. Even though the information sought is an image,
the ABIR technique primarily relies on textual information associated with an image to complete
the search and retrieval process.
For the first phase of the study, using the game of cricket as the domain, this research
compared the performance of three commonly used search engines for image retrieval: Google,
Yahoo and MSN Live. Factors used for the evaluation of these search engines include query
types, number of images retrieved, and the type of search engine. Results of the empirical
evaluation show that while the Google search engine performed better than Yahoo and MSN
Live in situations where there is no refiner, the performance of all three search engines dropped
drastically when a refiner was added. The other methodology to search for images is Content
Based Image Retrieval (CBIR) which searches for the images based on the image features such
as color, texture, and shape is still at a nascent stage and has not been incorporated in the
commercial search engines. The image features are at a low level compared to the high level

v
textual features. The gap between the low level image features and the high level textual features
is termed as Semantic Gap. Semantic gap has been the factor that limits the Content Based
algorithms to perform effectively.
This research addresses the issue of the image retrieval problem by systematically
coupling the ABIR and the CBIR algorithms and uses the human input wherever needed to
reduce the semantic gap. The key research question addressed by this study is whether a human
integrated approach helps in better image retrieval. In this research, a systematic study to identify
the role of human annotation in the search and retrieval of images was performed. Results
showed that as long as a subject matter expert is annotating the image, there was no variability in
the performance of search engines, in measures of precision and recall.
Moreover, empirical results suggested that the human integrated approach results in a
better performance when compared to the pure Annotation Based Image Retrieval or the Content
Based Image Retrieval. Further research can be developed to slowly replace some aspects of the
human input with machine learning algorithms.
One of the primary contributions of the framework was to demonstrate a novel
framework which systematically reduces the semantic gap by using the human input, the ABIR
and the CBIR algorithms. Some of the other contributions include a methodology for
systematically evaluating the effectiveness of the image search engines, and a methodology for
using both generic and domain specific templates for the ABIR and the CBIR algorithms.

vi
Table of Contents
Chapter 1 ......................................................................................................................................... 1
Introduction ..................................................................................................................................... 1
1.1 The Problem .......................................................................................................................... 2
Chapter 2 ......................................................................................................................................... 5
Background ..................................................................................................................................... 5
2.1 Annotation Based Image Retrieval ....................................................................................... 6
2.2 Content Based Image Retrieval .......................................................................................... 10
2.2.1 Noise Removal from images ........................................................................................ 11
2.2.2 Color ............................................................................................................................ 12
2.2.3 Texture ......................................................................................................................... 13
2.2.3.1 Statistical Methods: ............................................................................................... 13
2.2.3.2 Transformation Based Method ............................................................................. 15
2.2.4 Shape Analysis ............................................................................................................. 17
2.3 Semantic Gap ...................................................................................................................... 18
2.4 Relevance Feedback – Human Reasoning in Image Retrieval ........................................... 19
2.4.1 Boolean Model ............................................................................................................. 19
2.4.2 Vector Space Model ..................................................................................................... 20
2.4.3 Probabilistic Model ...................................................................................................... 20
2.5 Indexing .............................................................................................................................. 21
2.6 Summary ............................................................................................................................. 22
Chapter 3 ....................................................................................................................................... 24
Proposed Research Framework..................................................................................................... 24
Chapter 4 ....................................................................................................................................... 27
Phase 1 – Baseline Performance Metrics in Image Retrieval ....................................................... 27
4.1 Evaluating the major search engines on various query types ............................................. 28
4.1.1 Query types: ................................................................................................................. 28
4.1.2 Methodology: ............................................................................................................... 29
4.1.3 Statistical Analysis of the model.................................................................................. 33
4.1.4 Analysis of the Experiment .......................................................................................... 37
4.2 Understanding the user goals in the web image search ...................................................... 48
Chapter 5 ....................................................................................................................................... 57
Phase 2 – Role of Human Annotation in Search & Retrieval of Images ...................................... 57

vii
5.1 Design of Experiment ......................................................................................................... 58
5.2 Analysis of Results ............................................................................................................. 63
Chapter 6 ....................................................................................................................................... 65
Phase 3 –Human Computer Integrated Architecture .................................................................... 65
6.1 CBIR Architecture .............................................................................................................. 65
6.1.1 Web Crawling .............................................................................................................. 67
6.1.2 Eliminate Duplicate Images ......................................................................................... 68
6.1.3 Database ....................................................................................................................... 70
6.1.4 Content Based Feature Extraction ............................................................................... 71
6.2 Human Integrated Technique .............................................................................................. 74
6.3. Indexing and Searching...................................................................................................... 84
Chapter 7 ....................................................................................................................................... 85
Phase 4- Performance metrics for Human Computer Integrated System ..................................... 85
7.1 Independent Variables ........................................................................................................ 85
7.2 Dependent Variables ........................................................................................................... 86
7.3 Procedure ............................................................................................................................ 86
7.3 Data Analysis and Results .................................................................................................. 88
7.4 Hypothesis ...................................................................................................................... 91
7.5 Statistical Analysis .............................................................................................................. 91
7.6 Analysis of the Results ........................................................................................................ 91
Chapter 8 ..................................................................................................................................... 103
Summary of Research Contributions, Potential Applications, and Future Research ................. 103
8.1 Research Contributions ..................................................................................................... 103
8.2 Practical Applications ....................................................................................................... 104
8.3 Future Research ................................................................................................................ 106
8.3.1 Expanding the data sets beyond the game of cricket ................................................. 107
8.3.2 Improving CBIR algorithms for enhancing semantic knowledge ............................. 107
8.3.3 Improve the visual-cue template using eye-tracking ................................................. 108
8.3.4 Mixed-Initiative Interaction ....................................................................................... 108
Appendix A ................................................................................................................................. 109
IRB Proposal Summary .............................................................................................................. 109
Appendix B ................................................................................................................................. 114
Pre Annotation Test .................................................................................................................... 114
Appendix C ................................................................................................................................. 118

viii
Images Requiring Annotation ..................................................................................................... 118
References ................................................................................................................................... 123
Curriculum Vitae ........................................................................................................................ 128

ix
List of Figures
Figure 1: Overall Research Methodology ....................................................................................... 4 Figure 2: Background Research ...................................................................................................... 6 Figure 3: Overview of ABIR .......................................................................................................... 7 Figure 4: Establishing baseline performance metrics of current image retrieval systems ............ 27 Figure 5: Ishikawa Figure of independent factors ........................................................................ 28 Figure 6: Unique Images - Average Precision .............................................................................. 39 Figure 7: Unique Images with Refiners - Average Precision ....................................................... 39 Figure 8: Non-Unique Images - Average Precision ...................................................................... 40 Figure 9: Non-Unique Images with Refiners - Average Precision ............................................... 40 Figure 10: Average Precision of retrieved images for Unique Images ......................................... 43 Figure 11: Average Precision of retrieved images for Unique Images with Refiners .................. 44 Figure 12: Average Precision of retrieved images for Non-Unique Images ................................ 45 Figure 13: Average Precision of retrieved images for Non-Unique Images with Refiners .......... 46 Figure 14: Image 1 shown to domain experts .............................................................................. 54 Figure 15: Image 2 shown to domain experts .............................................................................. 55 Figure 16: Design and Implementation of Human Computer Integrated System ....................... 65 Figure 17: Content Based Image Retrieval System Architecture ................................................. 66 Figure 18: Functional Illustration of the Web Crawler ................................................................. 68 Figure 19: Example of an Image found at multiple locations ....................................................... 69 Figure 20: Example of an image stored at different resolutions ................................................... 70 Figure 21: Functional flow of automatic structured template generation from content ............... 71 Figure 22: Visual Cue Template ................................................................................................... 73 Figure 23: Human Computer Integrated System Architecture .................................................... 75 Figure 24: Functional flow of automatic structured template generation from keywords ........... 76 Figure 25: Bridging of the Semantic Gap ..................................................................................... 81 Figure 26: Various Templates ....................................................................................................... 82 Figure 27: Modular Framework .................................................................................................... 83 Figure 28: Performance metrics of a Human Computer Integrated System ................................ 85 Figure 29: Unique Images - Average Precision ............................................................................ 93 Figure 30: Unique Images with Refiners - Average Precision ..................................................... 93 Figure 31: Non-Unique Images - Average Precision .................................................................... 94 Figure 32: Non-Unique Images with Refiners - Average Precision ............................................. 94 Figure 33: Average Precision of retrieved images for Unique Images ......................................... 97 Figure 34: Average Precision of retrieved images for Unique Images with Refiners .................. 98 Figure 35: Average Precision of retrieved images for Non-Unique Images ................................ 99 Figure 36: Average Precision of retrieved images for Non-Unique Images with Refiners ........ 100 Figure 37: Car Image in the Database ......................................................................................... 105 Figure 38: Example of a Surveillance Scenario .......................................................................... 105 Figure 39: Emotional Classification of a person’s face .............................................................. 107 Figure 40: Mixed-Initiative Interaction ...................................................................................... 108
x
List of Tables
Table 1: Query Formulations for various Query types ................................................................. 31 Table 2: Precision results at various retrieval levels for different search engines and query types....................................................................................................................................................... 32 Table 3: Independent Factors affecting quality of image retrieval and their levels ...................... 33 Table 4: Data table to calculate ANOVA ..................................................................................... 35 Table 5: Data table to calculate ANOVA ..................................................................................... 36 Table 6: Analysis of Variance for various factors ........................................................................ 37 Table 7: Summary of the Experiment Results for Benchmarking Search Engines ...................... 38 Table 8: Tukey’s Honest Significant Different for Query Types ................................................. 41 Table 9: Tukey’s Honest Significant Different for Search Engines ............................................. 41 Table 10: Tukey’s Honest Significant Different for Retrieval Levels .......................................... 42 Table 11: Average Precision of retrieved images for Unique Images .......................................... 43 Table 12: Average Precision of retrieved images for Unique Images with Refiners ................... 44 Table 13: Average Precision of retrieved images for Non-Unique Images ................................ 45 Table 14: Average Precision of retrieved images for Non-Unique Images with Refiners ......... 46 Table 15: Percentage increase in the performance of Yahoo and Google over MSN .................. 47 Table 16: Segregation of image-1 features based on Budford Model ........................................ 54 Table 17: Segregation of image-1 features based on Shatford Model .......................................... 54 Table 18: Segregation of image-2 features based on Budford Model .......................................... 55 Table 19: Segregation of image-2 features based on Shatford Model .......................................... 55 Table 20: Visual Cue Template .................................................................................................... 56 Table 21: Metadata Template ....................................................................................................... 56 Table 22: Queries ......................................................................................................................... 58 Table 23: Independent Variables ................................................................................................. 59 Table 24: Precision ....................................................................................................................... 61 Table 25: Recall ............................................................................................................................ 62 Table 26: ANOVA for Precision of Search Databases ................................................................. 63 Table 27: ANOVA for Recall of Search Databases ...................................................................... 63 Table 28: Relevant information on a webpage in www.cricinfo.com .......................................... 67 Table 29: Example of Metadata Template Generation ................................................................. 79 Table 30: Independent Variables .................................................................................................. 86 Table 31: Precision values at various retrieval levels for different search engines and query types....................................................................................................................................................... 87 Table 32: Data Table to calculate ANOVA .................................................................................. 89 Table 33: Data Table to calculate ANOVA .................................................................................. 90 Table 34: Analysis of Variance for various factors ...................................................................... 91 Table 35: Summary of the Experiment Results for Search Engine Evaluation ............................ 92 Table 36: Tukey’s Honest Significant Different for Query Types ............................................... 95 Table 37: Tukey’s Honest Significant Different for Search Engines ........................................... 95 Table 38: Tukey’s Honest Significant Different for Retrieval Levels .......................................... 96 Table 39: Average Precision of retrieved images for Unique Images .......................................... 97 Table 40: Average Precision of retrieved images for Unique Images with Refiners ................... 98 Table 41: Average Precision of retrieved images for Non-Unique Images ................................ 99

xi
Table 42: Average Precision of retrieved images for Non-Unique Images with Refiners ....... 100 Table 43: Percentage increase in the performance of CBIR and HI over ABIR ....................... 101

xii
ACKNOWLEDGEMENTS
I feel highly privileged and deeply humbled for pursuing my Doctoral degree under the guidance of Dean
S. Narayanan. The impact of his help is highly significant on my future endeavors serving as a foundation
pillar and adding values to the rest of my professional outlook. I truly cannot thank him enough and I
sincerely express my gratefulness to him for believing in me. I would like to thank my committee
members Dr. Jennie Gallimore, Dr. Fred Garber, Dean Richard Koubek and Dr. Yan Liu for taking the
time to serve on my committee and for offering constructive criticism. I would also like to thank Dr.
Govindraj and Dr. Ray Hill for their input during the initial stages of my dissertation.
I also take this opportunity to thank the faculty and staff of Biomedical, Industrial and Human Factors
Engineering, Wright State Research Institute, the Ph.D. in Engineering program and the Dean’s office.
These people had tremendous patience to deal with me with me so much as I passed in and out of their
work places with hundreds of random requests. They strongly stood by my side and on many occasions
bent forward above and beyond to sap any hindrances in the path of my graduation.
Thanks to all my friends for their amazing support and encouragement which made my path towards
graduation so much fun. The countless number of hours I spent in playing cricket or ping-pong with them
will always be treasured.
Without my family’s support, I wouldn’t have been here today. My deep heartfelt thanks for all their love,
care and support and for putting up with me throughout my academic career and constantly reassuring me
whenever I doubted myself.

1
Chapter 1
Introduction
An enormous cluster of assorted images are available on the internet. These images are of
diverse nature spanning various fields that includes information about government, sports,
entertainment, hospitals, academia, etc. Image retrieval is defined as searching (browsing) for an
image or a particular set of images from the database of images. While there is a significant body
of research on text based information retrieval, there have been only limited efforts on image
retrieval on the Internet.
Current image retrieval systems can be classified into three groups namely those based on
keyword (text) features, visual features or their combinations (Jing, Li, Zhang, Zhang, 2005).
Image retrieval using keywords is called Annotation Based Image Retrieval (ABIR) or Query by
Keyword (QBK) systems. ABIR, a technique used in the early days and also very prevalent
today, is based on textual annotation of images. The other category Content Based Image
Retrieval (CBIR) involves using the concept of computer vision to search images based on their
visual contents of the image. Contents in an image may refer to color, shape, texture or any other
information that can be derived from the image itself.

2
1.1 The Problem
As the number of images on the Internet increase, the problem of image overload increases.
Image overload can be defined as the condition where the available images far out strip the
user’s ability to assimilate or a condition where the user is inundated with a deluge of images –
some of which may be relevant to the user. Solutions continue to be developed to overcome the
overload (image retrieval) problem; however users continue to struggle in finding the right image
during their information seeking process.
Effective image retrieval systems are required to locate relevant images based on the queries of
the user. In Annotation Based Image Retrieval (ABIR), the images are manually annotated by the
keywords. The accuracy and completeness of the annotation influences the retrieval results. As
the size of the database increases, manual annotation becomes tedious and expensive (Jing, Li,
Zhang, Zhang, 2005). In addition, there are potential inaccuracies in manual annotation due to
the subjectivity of human perception (Liu, Zhang, Lu, Ma, 2007). Some of the images cannot be
annotated because of the difficulty to describe their content by words (Inoue, 2004). To
overcome these difficulties in the text based systems, Content Based Image Retrieval (CBIR)
was introduced in the early 1980’s. CBIR systems retrieve images based on the image features
itself, including properties such as color, texture, shape etc. The performance of CBIR systems is
constrained by low level image features and these systems do not give satisfactory results in
many cases. In general, each of the low level image features captures only one aspect of the
image and even a combination of these low level image features do not capture the semantic
meaning (high level textual features) of the image. The gap between the low level image features
and the high level textual features (manually annotated using human perception) is called the

3
semantic gap (Liu, Zhang, Lu, Ma, 2007). It has been reported that increased performance in
image retrieval was achieved when using both visual and textual features than using either
visual-only or text-only features (Sclaroff, Cascia, Sethi, 1999).
Humans and computers have their own strengths and limitations in information processing.
While the human cognitive skills limit themselves when voluminous data has to be interpreted
and analyzed, computer algorithms can fail when the need for semantic knowledge is required
from the image. Research in other areas has supported the claim that a hybrid computer aided
and operator guided solution can potentially improve the performance of the system (Ganapathy
S, 2006). Very little research has been done on the area of human computer interaction with
respect to image retrieval based on annotations and image content.
The goal of the research was to design and implement a novel approach that integrates human
reasoning with computerized algorithms for image retrieval. By systematically coupling human
reasoning and computerized process, we attempt to minimize the barrier between the human’s
cognitive model of what they are trying to search and the computers understanding of the user’s
task. Specifically this approach was instantiated through an implemented system that aims to
reduce the semantic gap between the ABIR and the CBIR techniques. The overall research
methodology is depicted in Figure 1. The research was conducted in four phases. During phase 1,
baseline performance metrics of the current commercial image retrieval systems were
established, in phase 2 the role of humans annotation in the search and retrieval of images was
analyzed, in phase 3 the design and implementation of the human computer integrated system
was achieved and in phase 4 the performance metrics of the human computer integrated system

4
were calculated and statistically compared with the baseline performance metrics established
during phase 1.
Test Data ABIR Approach
Baseline Performance
Metrics
Identify Domain Experts
Create Search Engine for each Domain Expert
Analyze Inter-Human
Variability
Design and Implement CBIR Architecture & Human Computer Integrated Architecture
Evaluation DataABIR SystemCBIR System
Hybrid System
Performance Metrics
Phase 1
Phase 2
Phase 3
Phase 4
Figure 1: Overall Research Methodology
The remainder of the dissertation presents an overview of the problem area and of the topics
relevant to the proposed research that include outline of the research framework, architecture,
goals, hypotheses and methods and concludes with discussing the potential contributions of this
research.

5
Chapter 2
Background
This research investigated several factors which can impact, both separately and collectively, the
quality of the retrieved images of any search engine. These factors (illustrated in Figure 2)
include annotation based retrieval, content based retrieval and its features (noise removal, color,
texture, shape), the problem of semantic gap, human reasoning in image retrieval and indexing.
This chapter summarizes the traditional practices that are currently used in the image retrieval
domain and presents an overview of these topics.

6
Figure 2: Background Research
2.1 Annotation Based Image Retrieval
Annotation based image retrieval is based on the theory of text retrieval systems. The text based
image retrieval system can be traced back to the late 1970’s. Figure 3 presents an overview of the
background in this area.

7
Figure 3: Overview of ABIR
Chen and Wang (2004), defined two methods of providing text to images: categorization &
annotation. Categorization is the association of a predefined category of text to an image while
annotation provides the image with detailed text descriptors. Bimbo (1999) in his book stated
that three different types of information can be associated with an image that include
• content-independent metadata – the metadata is related to the image but cannot be
extracted with computer vision algorithms (example: date when the image was taken)
8
• content-dependent metadata – the metadata can be extracted using content based image
retrieval algorithms (example: based on color, texture & shape)
• content-descriptive metadata – the semantics in the image which cannot be extracted
using computer vision algorithms and need the expertise of a domain expert to annotate
the image.
Annotation based on content-dependent metadata for an image can be generated using computer
vision algorithms while for content-descriptive metadata, human annotation is required. The
computer vision algorithms captures only one aspect of the image (color, texture, shape) and
even a combination of these low level image features do not capture the semantic meaning (high
level textual features) of the image. The computer vision algorithms are still at a budding stage
and hence most of the commercial search engines stick to retrieving the images based on the text
descriptors rather than the content of the image. The human can associate some text descriptor
for an image by i) free flowing text ii) keywords from restricted vocabularies iii) ontology
classification (Hyvo etal, 2002). Though manual annotation of images is labor intensive and time
consuming, it still is the preferred way of annotating images (Hanbury, 2008). To reduce the
effort of a human, an interesting way known as the ESP game was developed to collect the text
descriptors by Ahn & Dabbish (2004). In this Extra Sensory Perception (ESP) game, two players
are paired randomly, and are asked to generated keywords for a particular image in a given time
interval. Whenever the keywords suggested by the two players match, the image is annotated
with that keyword.

9
Once the annotations for all the images in the database are completed, a number of standard steps
are generally employed by the popular text retrieval systems which are as follows (Yates & Neto,
1999)–
• The annotations are first broken down into words (word parsing).
• In the next step, the words are represented by their origins (stems). For example ‘stand’,
‘standing’ and ‘stands’ are represented by their word origin which in this case is ‘stand’.
• In the third step, to reject very common words such as ‘a’, ‘the’, ‘and’, ‘an’, ‘so’ etc.
which occur in most of the documents, a stop list is used. This is because the common
words are not discriminating for any particular annotation.
• After the first three steps are performed, the remaining words are assigned a unique
identifier. Some of the very rare words are generally given an additional weighting factor
while assigning the unique identifier.
• Finally each image annotation is represented by a vector which is calculated based on the
number of unique words and their frequency of occurrence.
Before any search engine is ready for use, all the above steps are carried out and the set of
vectors representing the image annotations in the search engine database are organized as an
inverted file to facilitate efficient retrieval (Witten, Moffat & Bell, 1999). Inverted file is defined
as a book index, which has an entry for each word in the database followed by the list of all
image annotations and the position of the word in that annotation. An image is retrieved by
evaluating the vector of word frequencies in their annotations and returning the images with the
closest vectors. In addition the match on the ordering and separation of the words may be used to
rank the returned images. The current image retrieval systems are designed in this way. Even

10
though the user is searching for images, in the current image retrieval systems (Google, Yahoo
etc) images are retrieved by the text which is either manually assigned as keywords to each
image or by using the text associated with the images (captions, web pages).
The problem with manual annotation is that it is expensive, cumbersome, time consuming and
may be unreliable depending on human variability. Often, the text following the image may not
be related to the image itself (or there may be no text at all) and thus image retrieval using this
method has low precision and recall rates. To overcome these difficulties Content Based Image
Retrieval was proposed in the early 1990’s.
2.2 Content Based Image Retrieval
Content Based Image Retrieval (CBIR) is the technique that uses visual features of the image
such as color, texture and shape to search and retrieve digital images. A multi-dimensional
feature vector is extracted from the image and stored in the database. To retrieve the images, the
user provides the retrieval system with an example image. The retrieval system then computes
the feature vectors of the input image and retrieves matched images by calculating the distance
between the input image and the images in the database. Many CBIR systems have been
developed in the last ten years (Veltkamp & Tanase, 2002). Some of them include NETRA
which uses color, shape, texture & spatial location, RETIN which uses color and texture,
Photobook which uses color, texture, shape & face recognition, ImageMiner which uses color,
texture & contours, QBIC which uses color, texture & position, VisualSeek which uses color for
content based image retrieval. Before CBIR can be applied, the images have to go through a pre-
processing stage- noise removal. The remainder of this section discusses the noise removal from

11
the digital images and concentrates on those general visual features (color, texture and shape) of
an image that can be used in most applications.
2.2.1 Noise Removal from images
Digital images are noise prone. Noise can be introduced in a digital image, depending on the way
the image is created. For example, if the image is acquired directly in a digital format, the
mechanism for gathering the data (such as a CCD detector) can introduce noise. Similarly,
electronic transmission of image data can introduce noise. If the image is scanned from a
photograph made on film, the film grain is a source of noise. Noise can also be the result of
damage to the film, or can be introduced by the scanner itself. This noise can be removed using
filters. Some of filters include: i) Linear Filters – Linear filtering is used to remove grain noise.
The noise can either be removed by an averaging filter where in each pixels value is replaced by
the average of its neighborhood pixels or by convolving the image with a Gaussian filter. One of
the problems of using a linear filter is that it blurs the edges (Russ, 2002). ii) Median Filters –
Median filtering is used to remove outliers. The noise can also be removed by an averaging filter
but instead of replacing the pixels by its mean of the neighboring pixels, it is replaced by the
median of the neighborhood (Russ, 2002). iii) Adaptive Filters - Adaptive filtering is used to
remove white noise. Wiener filter is used to remove this noise where in, it adapts to the local
image variance in an image (Russ, 2002).
12
2.2.2 Color
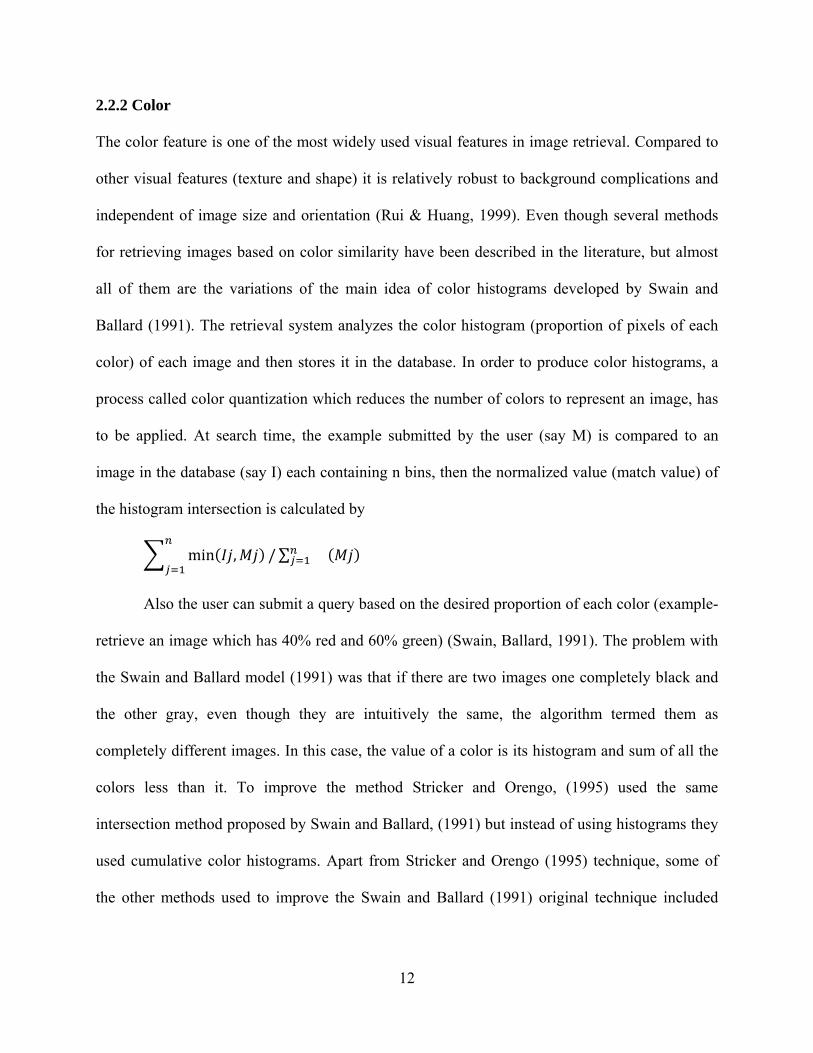
The color feature is one of the most widely used visual features in image retrieval. Compared to
other visual features (texture and shape) it is relatively robust to background complications and
independent of image size and orientation (Rui & Huang, 1999). Even though several methods
for retrieving images based on color similarity have been described in the literature, but almost
all of them are the variations of the main idea of color histograms developed by Swain and
Ballard (1991). The retrieval system analyzes the color histogram (proportion of pixels of each
color) of each image and then stores it in the database. In order to produce color histograms, a
process called color quantization which reduces the number of colors to represent an image, has
to be applied. At search time, the example submitted by the user (say M) is compared to an
image in the database (say I) each containing n bins, then the normalized value (match value) of
the histogram intersection is calculated by
min , / ∑
Also the user can submit a query based on the desired proportion of each color (example-
retrieve an image which has 40% red and 60% green) (Swain, Ballard, 1991). The problem with
the Swain and Ballard model (1991) was that if there are two images one completely black and
the other gray, even though they are intuitively the same, the algorithm termed them as
completely different images. In this case, the value of a color is its histogram and sum of all the
colors less than it. To improve the method Stricker and Orengo, (1995) used the same
intersection method proposed by Swain and Ballard, (1991) but instead of using histograms they
used cumulative color histograms. Apart from Stricker and Orengo (1995) technique, some of
the other methods used to improve the Swain and Ballard (1991) original technique included

13
combining histogram intersection with elements of spatial matching (Stricker & Dimai, 1996)
and the use of region based color queries (Carson et al, 1997).
2.2.3 Texture
Texture is defined as a structure of interwoven fibers or other elements such as repetitive
patterns, the appearance or feel of a surface or distinctive identifying quality (Osadebey, 2006).
Since Computer Vision is at its early stages, and due to the limitations of the variety of textures
and illumination conditions that can be modeled by an algorithm, it is difficult to reproduce the
Human’s ability to distinguish perceptually different textures by the computer. Texture patterns
are visual patterns that are homogenous but are not a resultant of single color or intensity. In this
project, image textures will be used for recognition of image regions using texture properties
which helps in image retrieval using texture segmentation. The commonly used methods for
texture feature description are statistical methods and transformation based methods which are
discussed in the following sub sections.
2.2.3.1 Statistical Methods:
Statistical methods analyze the spatial distribution of gray values by computing local features at
each point in the image, and deriving a set of statistics from the distribution of the local features.
Some of the statistical methods include measurements proposed by Tamura (Tamura etal, 1978)
Coarseness – It is the measure of granularity in an image. When two patterns in an image
differ only in scale, the magnified is coarser while the other is finer. An image will

14
contain textures at several scales; coarseness aims to identify the largest size at which a
texture exists, even where a smaller micro texture exists. Here we first take averages at
every point over neighborhoods, the linear size of which are powers of 2. The average
over the neighborhood of size 2k * 2k at the point (x,y) is
Ak x, yf i, j2
where f(i,j) is the intensity of the image at point (i,j)
Then at each point one takes differences between pairs of averages corresponding to non-
overlapping neighborhoods on opposite sides of the point in both horizontal vertical
orientations. In the horizontal case this is
, , | 2 , 2 , |
At each point, one then picks the best size which gives the highest output value, where k
maximizes E in either direction. The Coarseness measure is then the average of Sopt (x,y)
= 2kopt over the picture.
Contrast – Contrast is a measure of local variations present in an image. If there is a
large amount of variation in the image, contrast will be high. Below is the mathematical
formula to calculate contrast. P is the co-occurrence matrix.
Contrast =
∑∑ −i j
d jiPji ],[)(

15
Directionality – Detects the edges in an image. At each pixel the angle and magnitude
are calculated. A histogram of edge probabilities is then built up by counting all points
with magnitudes greater than a threshold and quantizing by the edge angle. The
histogram will reflect the degree of directionality.
2.2.3.2 Transformation Based Method
To determine the texture features in an image, transformation based methods use the frequency
content of the image.
Gabor Filters:
Each image contains several textures embedded in it. Each texture has a narrow range of
frequency and orientation components and can be located by filtering the image with
multiple band pass filters. The image thus passes through a set of filters and the output of
each filter can be studied to determine the regions occupied by the textures.
Gabor filters are band pass filters and can be used as channel filters. The Fourier
Transform of the Gabor filter is a Gaussian shifted in frequency. These filters can be
tuned for different center frequencies, orientations and bandwidths. The magnitude of
these filter outputs should be large when the texture exhibits the frequency and
orientation characteristics of that particular tuned Gabor filter and the output should be
negligible when the texture is not dominated by the same characteristics as the Gabor
filters. The magnitude of various Gabor filter outputs shows the regions covered by
different textures.

16
For strongly oriented textures the largest peak in the appropriate orientation should be
chosen. For periodic textures the lower fundamental frequency should be chosen. For non
oriented texture the choice should be based on frequency and orientations at which the
energy is maximal.
Manjunath & Ma (1996) measured the distance of two image patterns using Gabor filters
and the distance is measured by
d i, j d i, j
where
d i, jμ μ
μ
μ are the standard deviations of the respective features over the entire
database and are used to normalize the individual feature components.
But the ability to match on texture similarity can often be useful in distinguishing
between areas of images with similar color (such as sky and sea, or leaves and grass).

17
2.2.4 Shape Analysis
Shape representations can be broadly classified into two types: region based and boundary based.
Region-based representation is based on the pixels contained in that region where as boundary
based representation is based on the pixels along the object boundary. The problem with region
based representations are that the entire shape is required to compute the pixels in that area and
therefore cannot handle images containing partially visible & overlapping structures. In image
retrieval, some of the applications require the shape representation to be invariant to translation,
rotation and scaling. (Mehrotra & Gary, 1995) have proposed an algorithm where in a feature
(boundary segment) is a collection of on an ordered sequence of boundary points (interest points)
and the shape is an ordered set of boundary segments. Also each boundary feature is encoded for
scale, rotation and translation invariance. In a feature F that has n interest points, a pair is chosen
to form the base unit vector along the x axis. The other points are transformed to this system
resulting in the feature F = {(x1,y1),(x2,y2),……(xn,yn)}, and the translation parameter P = {S,
T, θ} where S is the scaling parameter of the base vector, T is the translation parameter and θ is
the initial angle formed by the base vector with the X axis. An object is a collection of these
points.
The advantage of this technique is that it can describe an image at varying levels of detail (useful
in natural scenes where the objects of interest may appear in a variety of guises), and avoid the
need to segment the image into regions of interest before shape descriptors can be computed.

18
2.3 Semantic Gap
Human reasoning is an integral part of annotation based image retrieval and this is the
fundamental difference between content based image retrieval (CBIR) and the annotation based
image retrieval (ABIR). Whereas CBIR automatically extracts low level features like color,
texture and shape, ABIR uses high level features such as keywords, text descriptors and the
semantics involved with these. In general there is no direct link between the low level visual
features and the high level text features. This gap between the low level image features and the
high level semantic concepts of the image is termed the semantic gap. Semantic gap can also be
defined as the lack of coincidence between the information once can extract from the visual data
and the interpretation that the same data have for a user in a given situation.
The three levels of queries (Eakins, 1996) for Content Based Image Retrieval are
Level 1: Retrieval by primitive low level features such as color, texture & shape. Typical query
is a query by example, “find a picture similar to the input picture”
Level 2: Retrieval of objects of a given type identified by derived features, with some degree of
logical interference. Typical query is “find a picture of a flower”
Level 3: Retrieval by abstract attributes, involving a significant amount of high level reasoning
about the purpose of the objects or scenes depicted. This includes retrieval of named events, of
pictures with emotional or religious significance. Typical query is “find a picture of joyful
crowd”
Level 2 and Level 3 are together referred to as semantic image retrieval and the gap between
Level 1 and Level 2 is referred to as semantic gap. (Liu, Zhang, Lu, Ma, 2007). The current

19
CBIR techniques which retrieve images based on the low level features like color, texture and
shape fall in the Level 1 category.
2.4 Relevance Feedback – Human Reasoning in Image Retrieval
Humans and computers have their own strengths and limitations. While the human cognitive
skills limit themselves when voluminous data has to be interpreted and analyzed, computer
algorithms can fail when the need for semantic knowledge is required from the image. Research
in other areas has shown that a hybrid computer-aided and operator guided solution can
potentially improve the performance of the system. (Ganapathy S, 2006)
Historically, human reasoning has been used to provide relevant feedback during the process of
search and retrieval of images. The goal of relevance feedback is to retrieve and rank highly
those data that are similar to the data the user found to be relevant. Some of the information
retrieval models (text / image) where relevance feedback was used included Boolean model,
Vector Space model, and Probabilistic model.
2.4.1 Boolean Model
Boolean operations imply using OR, AND, NOT. Keywords are the queries of this model and the
usage of the Boolean operations by the user results in a better retrieval of results (example:
GOOGLE). These are exact match systems and the control is explicitly in the hands of the user.
To use relevance feedback, the system has to present the user with a list of new keywords (query

20
terms). The user than selects a list of keywords and the retrieved results are more relevant to the
user (Ruthven & Lalmas, 2003).
2.4.2 Vector Space Model
Vector space model has been previously defined as an indexing technique. Ruthven & Lalmas
(2003) define the optimal query as the one that maximizes the difference between the average
vector of the relevant documents and the average vector of the non relevant documents. General
users cannot submit an optimal query to the search engine, instead they make their query optimal
by bringing the query vector close to the mean of the relevant documents and away from the
mean of the non relevant documents.
1 ∑ ∑
Where Q1 is the new query vector, Qo is the initial query vector, n1 is the number of relevant
documents, n2 is the number of non relevant documents, Ri is the vector for ith relevant
document, Si is the vector for ith non relevant document, α, β, γ values specify the degree of
effect of each component on Relevance Feedback (Ruthven & Lalmas, 2003).
2.4.3 Probabilistic Model
Probabilistic model is based on given a particular query, estimating the probability that the
document will be relevant to a user. (Ruthven & Lalmas, 2003) propose a relevance feedback
based on the probabilistic model and includes term weighting (term frequency – inverse
document frequency). Term frequency is the ratio of the number of times a word appears in a
document to the total number of words in the document. Inverse document frequency is the

21
natural logarithm of ratio of the total number of documents to the number of documents
containing the query term. (Ruthven & Lalmas, 2003)
2.5 Indexing
The need for efficient storage and retrieval of images has been recognized by researchers using
large image collections such as picture libraries for many years (Eakins, 1996). Many image
search engines and picture libraries use keywords as the main form of retrieval thus falling back
on the indexing techniques that include Vector Space Model and Latent Semantic Indexing that
have been used historically for retrieving documents or images based on keywords.
In the Vector Space Model, a collection of N documents with T distinct terms are represented by
a matrix where the documents represent the rows of a matrix. The query submitted by the user is
converted into a vector and the similarity between the query Q and the document vector D is
measured using the Cosine rule = (dot product (Q, D)) / (magnitude (Q) * magnitude (D)). If the
measure is equal to 1, then the document and the query are identical and the document is
retrieved.
Latent Semantic Indexing reduces the dimensionality of the vector-space model to bring the
similar terms and documents closer to each other using Singular Value Decomposition. It divides
the vector space A as
A = U ∑VT where U is the term vector and V is the document vector.
22
2.6 Summary
From the literature review we summarize that the current image search engines are largely
dependent on the text descriptors (i.e., Annotation Based Image Retrieval). There has been
practically little or no evidence on the effectiveness of the search engines using text annotations
for image retrieval. Hence, the first phase of this research measures the effectiveness of the
existing commercial search engines and creates a standardized benchmark. Though studies in
the literature have defined various ways of ascribing text to images by humans and computers,
none of these studies have investigated the human role in the annotation of images for search &
retrieval engines. In phase 2 of our research, we investigate the inter-human variability in
annotation and its effect on the performance of search engines.
Content Based Image Retrieval (CBIR) operates on primitive features characterizing image
content that includes color, texture and shape but they are inherently limited by the fact that they
cannot operate when an additional semantic content is needed to be extracted from the images.
Semantic features such as the type of object present in the image, name of the person in the
image are harder to extract, though this remains an active research topic. This research responds
to this limitation by proposing to integrate the primitive image features with text keywords that
can overcome a part of the semantic gap (proposed CBIR system discussed in Section 3.2.1) and
bridging the other half of the semantic gap i.e. the distance between the object annotations and
the high level reasoning by Human Integration (proposed Human Integrated system is discussed
in Section 3.2.2) with the proposed CBIR system. The CBIR system and the Human Integrated
system is described in phase 3 of the research. Some of the CBIR algorithms discussed in the
literature review are implemented in phase 3.

23
Despite its current limitations, CBIR is a fast-developing technology with considerable potential,
and this technology should be exploited where appropriate.
24
Chapter 3
Proposed Research Framework
The goal of this research was to design and implement a novel approach that integrated human
reasoning with computerized algorithms for image retrieval. By systematically coupling Humans
and Computers, we attempt to minimize the barrier between the human’s cognitive model of
what they are trying to search and the computers understanding of the user’s task. Specifically
this approach was assessed through an implemented system that aims to reduce the semantic gap
between the ABIR and the CBIR techniques. The hypothesis of this study was that the
integration of human reasoning with algorithms from Content Based Image Retrieval would
improve the effectiveness (retrieval performance) and increase the end user satisfaction
compared with either the pure ABIR or the pure CBIR systems.
The approach of this research was evaluated using game of Cricket database (www.cricinfo.com
and related web sites). The game of cricket has thousands of images on the web. These images
include images of batsmen, bowlers, fielders, cups, stadiums etc. Even though it is a confined
database, the images in this domain are diverse in nature.

25
This research study focused on the design of two retrieval systems and evaluation of three
systems including the following.
• Annotation based image retrieval system (ABIR) – Google images is a good example of
ABIR. Google has a specific feature in which the user can control the retrieved images based on
annotations from a particular web site. In our case Google will retrieve images from
www.cricinfo.com.
• Content-based image retrieval system (CBIR) – This system was built as a part of this
research considering image features like color, texture, shape etc and it supports relevance
feedback from the end user.
• Human Integrated Technique – A unified framework of ABIR and CBIR with relevance
feedback. In this system the images are retrieved using both keywords and image features.
The CBIR system and the Human Integrated Technique system was designed and developed as
part of this research.
The research consists of four phases
Phase 1: Establish baseline performance metrics in image retrieval
Phase 2: Investigate the role of human annotation in the search and retrieval of images
Phase 3: Design and implement a human computer integrated approach

26
Phase 4: Generate performance metrics for integrated system and compare it with baseline
performance metrics developed in Phase 1.
Each of these phases are discussed in the following chapters.

27
Chapter 4
Phase 1 – Baseline Performance Metrics in
Image Retrieval
The first phase consists of two stages as illustrated in Figure 3:
Stage 1 - Evaluating the major search engines on various query types
Stage 2 - Understanding the user needs and goals in the web image search
Pick 3 Search Engines
GoogleYahooMSN
Phase 1
Stage 1
Select 4 query typesUniqueUnique w/ identifierNon-UniqueNon-Unique w/ identifier
Select Different Precision LevelsPrecision @ 10Precision @ 20Precision @ 30Precision @ 40
Precision of retrieved results
Interview with Domain Experts
Understanding user needs & goals
Stage 2
Figure 4: Establishing baseline performance metrics of current image retrieval systems

28
4.1 Evaluating the major search engines on various query types
Research studies have shown that the quality of the images retrieved are a function of query
formulation, type of search engine and the retrieval level. These independent factors and their
levels are illustrated in the Ishikawa diagram (Figure 5).
Figure 5: Ishikawa Figure of independent factors
4.1.1 Query types:
Broder (2002) proposed a trichotomy of web searching types for text retrieval: navigational,
informational and transactional. Navigational searches are those where the user intends to find a
specific website. Informational searches are intended to find some information assumed to be
present on one or more web pages. Transactional searches are intended to perform some web
mediated activity i.e. the purpose is to reach a site whether further interactions will happen.
These query types cannot be extended to image retrieval solutions since the end goal of the user
in these two scenarios varies a lot. Ensor and McGregor (1992) summarized that the user search
requests for images fall into four different categories:
29
i. Search for unique images - The property of uniqueness is a request for the visual
representation of an entity where the desired entity (image) can be differentiated
from every other occurrence of the same entity type. An example is - “find the
image of Barack Obama”.
ii. Search for unique images with refiners – Using refiners, the user can narrow
down the results of the retrieved images from unique images to a certain degree of
specificity. An example is - “find the image of Barack Obama in 2004”.
iii. Search for non-unique images – The property of non-uniqueness is a request for
the visual representation of an entity where the desired entity (image) cannot be
differentiated from every other occurrence of the same entity type. An example is
– “find images of Indians”
iv. Search for non-unique images with identifiers – Using refiners, the user can
narrow down the results of the retrieved images from unique images to a certain
degree of specificity. An example is – “find images of Indians waving the Indian
flag”
4.1.2 Methodology:
To carry out the evaluation, a domain expert was given twenty different problem situations based
on the four different query types. The user noted the number of relevant retrieved images at
different levels. Using this information we calculated the average precision at different levels.

30
Traditionally evaluation for information retrieval has been based on the effectiveness ratios of
precision (proportion of retrieved documents that are relevant) and recall (proportion of relevant
documents that are retrieved) (Smith, 1998). Since the World Wide Web is growing constantly,
obtaining an exact measure of recall requires knowledge of all relevant documents in the
collection which is not practical. So, recall and any measures related to recall cannot be used for
evaluation. Therefore we evaluated the existing search engines based on the precision at a
retrieval length R.
The major search engines selected were Google, Yahoo and MSN Live. Five queries for each
query type were chosen. The queries consisted of multi-word queries as shown in Table 1. Each
query was run on the three search engines and the first forty images retrieved in each search run
were evaluated as relevant or non relevant. Same images from different web url’s were evaluated
as different images while in the case of same images from the same web url, the first image was
evaluated and the other images were considered non-relevant. Additionally, if the image
retrieved was not accessible due to technical difficulties in the site domain, the image was
considered to be non relevant. In order to obtain a stable performance measurement of image
search engines, all the searches were performed within a short period of time (within one hour)
and the relevance of the images retrieved was decided by the consensus of domain experts.
After the queries are run, precision at R is calculated at R=10, 20, 30 and 40. Precision was
defined as the number of relevant images retrieved to the total number of images retrieved.
The queries that were run on the three search engines are shown below in Table 1.

31
Table 1: Query Formulations for various Query types
The results of the runs were checked for relevance at different cut off points (R =10, 20, 30 &
40). The results are tabulated in Table 2.
Query Types Queries
MS DhoniVijay Bharadwaj
Unique Images Ricky PointingGary SobersAbey Kuruvilla
Kapil Dev lifting World CupSreesanth + beamer + Pietersen
Unique Images with refiners Andy Flower + protest + black bandAllan Donald + run out+ WC semifinal '99
Inzamam Ul Haq hitting a spectator + Canada
Indian Cricket PlayersSurrey Cricket Team
Non‐Unique Images Ashes (Eng vs Aus) Cricket Players HuddleRajastan Royals + IPL
Victorious Indian Team + 20‐20 WCSA chasing 438
Non‐Unique Images with refiners Aus players with World Cup 2007SL protesting against Aus + walking out of the ground
Eng vs SA + WC stalled by rain + 1992

32
Table 2: Precision results at various retrieval levels for different search engines and query types
Query Type Query Search Engine R @ 10 R @ 20 R @ 30 R @ 40Unique Images MS Dhoni Google 10 20 27 32Unique Images MS Dhoni Yahoo 7 14 22 28Unique Images MS Dhoni Live 8 16 23 29Unique Images Vijay Bharadwaj Google 6 9 9 9Unique Images Vijay Bharadwaj Yahoo 5 7 7 7Unique Images Vijay Bharadwaj Live 5 5 6 6Unique Images Ricky Pointing Google 10 18 27 35Unique Images Ricky Pointing Yahoo 10 19 27 34Unique Images Ricky Pointing Live 9 19 26 33Unique Images Gary Sobers Google 9 19 25 33Unique Images Gary Sobers Yahoo 10 17 26 34Unique Images Gary Sobers Live 8 15 21 19Unique Images Abey Kuruvilla Google 3 3 3 4Unique Images Abey Kuruvilla Yahoo 2 2 2 2Unique Images Abey Kuruvilla Live 1 1 1 1Query Type Query Search Engine R @ 10 R @ 20 R @ 30 R @ 40
Unique Images with refiners Kapil Dev lifting World Cup Google 4 7 7 8Unique Images with refiners Kapil Dev lifting World Cup Yahoo 1 1 1 1Unique Images with refiners Kapil Dev lifting World Cup Live 2 2 2 2Unique Images with refiners Sreesanth + beamer + Pietersen Google 8 10 11 13Unique Images with refiners Sreesanth + beamer + Pietersen Yahoo 0 0 0 0Unique Images with refiners Sreesanth + beamer + Pietersen Live 6 9 9 9Unique Images with refiners Andy Flower + protest + black band Google 0 0 0 0Unique Images with refiners Andy Flower + protest + black band Yahoo 0 0 0 0Unique Images with refiners Andy Flower + protest + black band Live 1 1 1 1Unique Images with refiners Allan Donald + run out+ WC semifinal '99 Google 6 9 13 15Unique Images with refiners Allan Donald + run out+ WC semifinal '99 Yahoo 3 4 4 4Unique Images with refiners Allan Donald + run out+ WC semifinal '99 Live 1 2 2 2Unique Images with refiners Inzamam Ul Haq hitting a spectator + Canada Google 1 1 1 1Unique Images with refiners Inzamam Ul Haq hitting a spectator + Canada Yahoo 0 0 0 0Unique Images with refiners Inzamam Ul Haq hitting a spectator + Canada Live 0 0 0 0
Query Type Query Search Engine R @ 10 R @ 20 R @ 30 R @ 40Non‐Unique Images Indian Cricket Players Google 10 18 25 33Non‐Unique Images Indian Cricket Players Yahoo 7 12 16 18Non‐Unique Images Indian Cricket Players Live 6 15 22 26Non‐Unique Images Surrey Cricket Team Google 6 9 12 12Non‐Unique Images Surrey Cricket Team Yahoo 6 11 15 17Non‐Unique Images Surrey Cricket Team Live 8 13 15 15Non‐Unique Images Ashes (Eng vs Aus) Google 8 17 27 33Non‐Unique Images Ashes (Eng vs Aus) Yahoo 5 5 5 5Non‐Unique Images Ashes (Eng vs Aus) Live 7 12 14 14Non‐Unique Images Cricket Players Huddle Google 10 18 25 29Non‐Unique Images Cricket Players Huddle Yahoo 7 7 7 7Non‐Unique Images Cricket Players Huddle Live 5 9 15 21Non‐Unique Images Rajastan Royals + IPL Google 9 16 22 31Non‐Unique Images Rajastan Royals + IPL Yahoo 8 15 19 22Non‐Unique Images Rajastan Royals + IPL Live 10 17 24 29
Query Type Query Search Engine R @ 10 R @ 20 R @ 30 R @ 40Non‐Unique Images with refiners Victorious Indian Team + 20‐20 WC Google 8 15 23 28Non‐Unique Images with refiners Victorious Indian Team + 20‐20 WC Yahoo 3 3 3 3Non‐Unique Images with refiners Victorious Indian Team + 20‐20 WC Live 3 4 6 6Non‐Unique Images with refiners SA chasing 438 Google 2 5 6 6Non‐Unique Images with refiners SA chasing 438 Yahoo 1 1 1 1Non‐Unique Images with refiners SA chasing 438 Live 4 5 5 5Non‐Unique Images with refiners Aus players with World Cup 2007 Google 8 16 23 29Non‐Unique Images with refiners Aus players with World Cup 2007 Yahoo 7 12 12 12Non‐Unique Images with refiners Aus players with World Cup 2007 Live 4 5 9 13Non‐Unique Images with refiners SL protesting against Aus + walking out of the ground Google 0 0 1 2Non‐Unique Images with refiners SL protesting against Aus + walking out of the ground Yahoo 0 0 0 0Non‐Unique Images with refiners SL protesting against Aus + walking out of the ground Live 0 0 0 0Non‐Unique Images with refiners Eng vs SA + WC stalled by rain + 1992 Google 3 5 6 6Non‐Unique Images with refiners Eng vs SA + WC stalled by rain + 1992 Yahoo 1 1 1 1Non‐Unique Images with refiners Eng vs SA + WC stalled by rain + 1992 Live 2 3 3 3

33
4.1.3 Statistical Analysis of the model
To check the adequacy of the factors that potentially affect the model, a factorial analysis was
conducted and the results were analyzed using ANOVA. As previously discussed, the factors
that we believed would create a significant effect on the average precision of the retrieved results
are Query Type, Search Engine and Retrieval Level.
Independent Variables
The independent variables for the factorial analysis and their levels are shown in Table 3
Table 3: Independent Factors affecting quality of image retrieval and their levels
Factor Description Level 1 Level 2 Level 3 Level 4
A Query Type Unique Images
Unique Images with
Refiners
Non Unique Images
Non Unique Images with
Refiners
B Search Engine Google Yahoo MSN Live
C Retrieval Level R 10 20 30 40
Response Variables
The response variable is the average precision at retrieval length R which is defined as the ratio
of the relevant retrievals to the overall retrievals.
Hypothesis
Hypothesis (Alternate): There is significant effect of Query Type, Search Engine or Retrieval
level R on the precision of the retrieved results.

34
Data Analysis & Results
Data were collected for the 48 experimental trials of the 4 x 3 x 4 full factorial design with give
repeated measures. The analysis was performed using ANOVA (Analysis of Variance). The data
collected are tabulated in Table 4 and the description of the calculations to calculate the effect of
the main effects and their interactions is tabulated in Table 5.

35
Table 4: Data table to calculate ANOVA
A B C Replicate 1 Replicate 2 Replicate 3 Replicate 4 Replicate 5 Total Average R1 1 1 100 60 100 90 30 380 761 1 2 100 45 90 95 15 345 691 1 3 90 30 90 83.3 10 303.3 60.661 1 4 80 22.5 87.5 82.5 10 282.5 56.51 2 1 70 50 100 100 20 340 681 2 2 70 35 95 85 10 295 591 2 3 73.3 23.3 90 86.66 6.66 279.92 55.9841 2 4 70 17.5 85 85 5 262.5 52.51 3 1 80 50 90 80 10 310 621 3 2 80 25 95 75 5 280 561 3 3 76.66 20 86.66 70 3.33 256.65 51.331 3 4 72.5 15 82.5 52.5 2.5 225 452 1 1 40 80 0 60 10 190 382 1 2 35 50 0 45 5 135 272 1 3 23.33 36.66 0 43.33 3.33 106.65 21.332 1 4 20 32.5 0 37.5 2.5 92.5 18.52 2 1 10 0 0 30 0 40 82 2 2 5 0 0 20 0 25 52 2 3 3.33 0 0 13.33 0 16.66 3.3322 2 4 2.5 0 0 10 0 12.5 2.52 3 1 20 60 10 10 0 100 202 3 2 10 45 5 10 0 70 142 3 3 6.66 30 3.33 6.66 0 46.65 9.332 3 4 5 22.5 2.5 5 0 35 73 1 1 100 60 80 100 90 430 863 1 2 90 45 85 90 80 390 783 1 3 83.33 40 90 83.33 73.33 369.99 73.9983 1 4 82.5 30 82.5 72.5 77.5 345 693 2 1 70 60 50 70 80 330 663 2 2 60 55 25 35 75 250 503 2 3 53.33 50 16.66 23.33 63.33 206.65 41.333 2 4 45 42.5 12.5 17.5 55 172.5 34.53 3 1 60 80 70 50 100 360 723 3 2 75 65 60 45 85 330 663 3 3 73.33 50 46.66 50 80 299.99 59.9983 3 4 65 37.5 35 52.5 72.5 262.5 52.54 1 1 80 20 80 0 30 210 424 1 2 75 25 80 0 25 205 414 1 3 76.66 20 76.66 3.33 20 196.65 39.334 1 4 70 15 72.5 5 15 177.5 35.54 2 1 30 10 70 0 10 120 244 2 2 15 5 60 0 5 85 174 2 3 10 3.33 40 0 3.33 56.66 11.3324 2 4 7.5 2.5 30 0 2.5 42.5 8.54 3 1 30 40 40 0 20 130 264 3 2 20 25 25 0 15 85 174 3 3 20 16.66 30 0 10 76.66 15.3324 3 4 15 12.5 32.5 0 7.5 67.5 13.5

36
Table 5: Data table to calculate ANOVA
A B C Replicate 1 Replicate 2 Replicate 3 Replicate 4 Replicate 5 Total AB AC BC ABC1 1 1 100 60 100 90 30 380 1 1 1 11 1 2 100 45 90 95 15 345 1 2 2 21 1 3 90 30 90 83.3 10 303.3 1 3 3 31 1 4 80 22.5 87.5 82.5 10 282.5 1 4 4 41 2 1 70 50 100 100 20 340 2 1 5 51 2 2 70 35 95 85 10 295 2 2 6 61 2 3 73.3 23.3 90 86.66 6.66 279.92 2 3 7 71 2 4 70 17.5 85 85 5 262.5 2 4 8 81 3 1 80 50 90 80 10 310 3 1 9 91 3 2 80 25 95 75 5 280 3 2 10 101 3 3 76.66 20 86.66 70 3.33 256.65 3 3 11 111 3 4 72.5 15 82.5 52.5 2.5 225 3 4 12 122 1 1 40 80 0 60 10 190 4 5 1 132 1 2 35 50 0 45 5 135 4 6 2 142 1 3 23.33 36.66 0 43.33 3.33 106.65 4 7 3 152 1 4 20 32.5 0 37.5 2.5 92.5 4 8 4 162 2 1 10 0 0 30 0 40 5 5 5 172 2 2 5 0 0 20 0 25 5 6 6 182 2 3 3.33 0 0 13.33 0 16.66 5 7 7 192 2 4 2.5 0 0 10 0 12.5 5 8 8 202 3 1 20 60 10 10 0 100 6 5 9 212 3 2 10 45 5 10 0 70 6 6 10 222 3 3 6.66 30 3.33 6.66 0 46.65 6 7 11 232 3 4 5 22.5 2.5 5 0 35 6 8 12 243 1 1 100 60 80 100 90 430 7 9 1 253 1 2 90 45 85 90 80 390 7 10 2 263 1 3 83.33 40 90 83.33 73.33 369.99 7 11 3 273 1 4 82.5 30 82.5 72.5 77.5 345 7 12 4 283 2 1 70 60 50 70 80 330 8 9 5 293 2 2 60 55 25 35 75 250 8 10 6 303 2 3 53.33 50 16.66 23.33 63.33 206.65 8 11 7 313 2 4 45 42.5 12.5 17.5 55 172.5 8 12 8 323 3 1 60 80 70 50 100 360 9 9 9 333 3 2 75 65 60 45 85 330 9 10 10 343 3 3 73.33 50 46.66 50 80 299.99 9 11 11 353 3 4 65 37.5 35 52.5 72.5 262.5 9 12 12 364 1 1 80 20 80 0 30 210 10 13 1 374 1 2 75 25 80 0 25 205 10 14 2 384 1 3 76.66 20 76.66 3.33 20 196.65 10 15 3 394 1 4 70 15 72.5 5 15 177.5 10 16 4 404 2 1 30 10 70 0 10 120 11 13 5 414 2 2 15 5 60 0 5 85 11 14 6 424 2 3 10 3.33 40 0 3.33 56.66 11 15 7 434 2 4 7.5 2.5 30 0 2.5 42.5 11 16 8 444 3 1 30 40 40 0 20 130 12 13 9 454 3 2 20 25 25 0 15 85 12 14 10 464 3 3 20 16.66 30 0 10 76.66 12 15 11 474 3 4 15 12.5 32.5 0 7.5 67.5 12 16 12 48

37
Table 6 shows the ANOVA results obtained for the full factorial design experiment conducted to
check the adequacy of the model. Considering 99% significance level, the ANOVA results
showed that there is a significant main effects of, (A) Query Type, (B) Search Engine and (C)
Retrieval Level R and there are no interaction effects.
Table 6: Analysis of Variance for various factors
A – Query, B – Search Engine, C – Retrieval Level
The results showed that all the main effects were significant; hence we then analyzed the
response variable.
4.1.4 Analysis of the Experiment
The performance of the search engines for various queries and retrieval levels is discussed in this
section.
The summary of the experiment results are documented in Table 7.
ss df ms f p
A 106622.284 3 35540.76 55.70395 5.97836E‐26B 17902.46826 2 8951.234 14.0295 2.05665E‐06C 8543.665978 3 2847.889 4.463569 0.004684785AB 3609.18176 6 601.5303 0.942794 0.465557359AC 636.8045037 9 70.75606 0.110898 0.999405639BC 41.88312333 6 6.980521 0.010941 0.999994074ABC 925.57028 18 51.42057 0.080593 0.999999891
Error 122501.6533 192 638.0294
Total 647101.3985 240
model 138281.8579 47 2942.167 4.611334 2.40093E‐14

38
Table 7: Summary of the Experiment Results for Benchmarking Search Engines Average Precision
Query Type Search Engine R @ 10 R @ 20 R @ 30 R @ 40
Unique
Images
Google 0.76 0.69 0.61 0.57
Yahoo 0.68 0.59 0.56 0.52
MSN 0.62 0.56 0.51 0.44
Unique
Images with
Refiners
Google 0.38 0.27 0.21 0.18
Yahoo 0.08 0.05 0.03 0.025
MSN 0.2 0.14 0.09 0.07
Non-Unique
Images
Google 0.86 0.78 0.74 0.69
Yahoo 0.66 0.5 0.413 0.345
MSN 0.72 0.66 0.6 0.525
Non-Unique
Images with
Refiners
Google 0.42 0.41 0.39 0.355
Yahoo 0.24 0.17 0.113 0.085
MSN 0.26 0.17 0.153 0.135
Figure 6 illustrates a column graph indicating the average precision of each of the search engines
for unique images, figure 7 illustrates a column graph indicating the average precision of each of
the search engines for unique images with refiners, figure 8 illustrates a column graph indicating
the average precision of each of the search engines for non-unique images and figure 9 illustrates
a column graph indicating the average precision of each of the search engines for non-unique
images with refiners.

39
Figure 6: Unique Images - Average Precision
Figure 7: Unique Images with Refiners - Average Precision
0
0.1
0.2
0.3
0.4
0.5
0.6
0.7
0.8
R @ 10 R @ 20 R @ 30 R @ 40
Unique Images MSN
Unique Images Yahoo
Unique Images Google
0
0.05
0.1
0.15
0.2
0.25
0.3
0.35
0.4
R @ 10 R @ 20 R @ 30 R @ 40
Unique Images with Refiners MSN
Unique Images with Refiners Yahoo
Unique Images with Refiners Google
Average Precision
Ret
riev
al L
evel
R
etri
eval
Lev
el
Average Precision

40
Figure 8: Non-Unique Images - Average Precision
Figure 9: Non-Unique Images with Refiners - Average Precision
Each of the main effects were analyzed individually for differences in their levels.
0
0.1
0.2
0.3
0.4
0.5
0.6
0.7
0.8
0.9
1
R @ 10 R @ 20 R @ 30 R @ 40
Non-Unique Images MSN
Non-Unique Images Yahoo
Non-Unique Images Google
0
0.05
0.1
0.15
0.2
0.25
0.3
0.35
0.4
0.45
R @ 10 R @ 20 R @ 30 R @ 40
Non-Unique Images with Refiners MSN
Non-Unique Images with Refiners Yahoo
Non-Unique Images with Refiners Google
Ret
riev
al L
evel
R
etri
eval
Lev
el
Average Precision
Average Precision

41
Query Types
Tukey’s Honest Significant Difference was performed to compare query types. The results are
tabulated in table 8.
Table 8: Tukey’s Honest Significant Different for Query Types
From Table 8, for query types we can see that Level 1 (Unique Images) & Level 3 (Non-Unique
Images) are significantly different and better compared to Level 2 (Unique Images with
Refiners) & Level 4 (Non-Unique Images with Refiners).
Search Engines
Tukey’s Honest Significant Difference was performed to compare Search Engines. The results
are tabulated in table 9.
Table 9: Tukey’s Honest Significant Different for Search Engines

42
From Table 9, for Search Engines we can see that Level 1 (Google Images) is significantly
different and better compared to Level 2 (Yahoo) & Level 3 (MSN Live).
Retrieval Level R
Tukey’s Honest Significant Difference was performed to compare Retrieval Levels. The results
are tabulated in table 10.
Table 10: Tukey’s Honest Significant Different for Retrieval Levels
From Table 10, for Retrieval Levels we can see that Level 1 (R@10) is significantly different
from Level 3 (R@30) & Level 4 (R@40) while Level 2 (R@20) is not significantly different
from either Level 1 or Levels 3 & 4.
Further analysis was conducted to calculate the precision for various query types and search
engines at different retrieval levels.
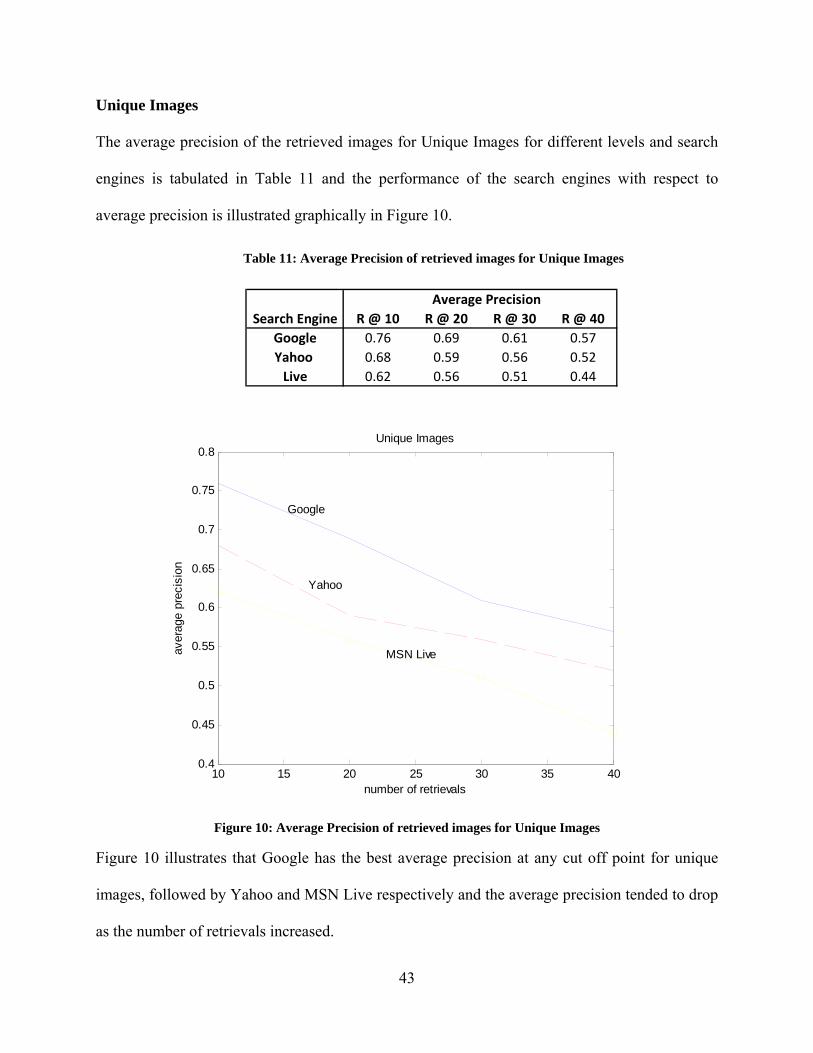
43
Unique Images
The average precision of the retrieved images for Unique Images for different levels and search
engines is tabulated in Table 11 and the performance of the search engines with respect to
average precision is illustrated graphically in Figure 10.
Table 11: Average Precision of retrieved images for Unique Images
Figure 10: Average Precision of retrieved images for Unique Images
Figure 10 illustrates that Google has the best average precision at any cut off point for unique
images, followed by Yahoo and MSN Live respectively and the average precision tended to drop
as the number of retrievals increased.
Average PrecisionSearch Engine R @ 10 R @ 20 R @ 30 R @ 40
Google 0.76 0.69 0.61 0.57Yahoo 0.68 0.59 0.56 0.52Live 0.62 0.56 0.51 0.44
10 15 20 25 30 35 400.4
0.45
0.5
0.55
0.6
0.65
0.7
0.75
0.8Unique Images
number of retrievals
aver
age
prec
isio
n
Yahoo
MSN Live

44
Unique Images with refiners
The average precision of the retrieved images for Unique Images with refiners for different
levels and search engines is tabulated in Table 12 and the performance of the search engines with
respect to average precision is illustrated graphically in Figure 11.
Table 12: Average Precision of retrieved images for Unique Images with Refiners
Figure 11: Average Precision of retrieved images for Unique Images with Refiners
For unique images with refiners, Google has the best average precision at any cutoff point,
followed by MSN Live and Yahoo respectively. We do observe that the best average precision is
a maximal of 0.38 for Google at cutoff point 10.
Average PrecisionSearch Engine R @ 10 R @ 20 R @ 30 R @ 40
Google 0.38 0.27 0.21 0.18Yahoo 0.08 0.05 0.03 0.025Live 0.2 0.14 0.09 0.07
10 15 20 25 30 35 400
0.05
0.1
0.15
0.2
0.25
0.3
0.35
0.4Unique Images with refiners
number of retrievals
aver
age
prec
isio
n
Yahoo
MSN Live

45
Non-Unique Images
The average precision of the retrieved images for Non-Unique Images with refiners for different
levels and search engines is tabulated in Table 13 and the performance of the search engines with
respect to average precision is illustrated graphically in Figure 12.
Table 13: Average Precision of retrieved images for Non-Unique Images
Figure 12: Average Precision of retrieved images for Non-Unique Images
Figure 12 illustrates that Google has the best average precision at any cut off point for non-
unique images, followed by MSN Live and Yahoo respectively and the average precision tended
to drop as the number of retrievals increased.
Average PrecisionSearch Engine R @ 10 R @ 20 R @ 30 R @ 40
Google 0.86 0.78 0.74 0.69Yahoo 0.66 0.5 0.413 0.345Live 0.72 0.66 0.6 0.525
10 15 20 25 30 35 40
0.4
0.5
0.6
0.7
0.8
0.9
1Non-Unique Images
number of retrievals
aver
age
prec
isio
n
Yahoo
MSN Live

46
Non-Unique Images with refiners
The average precision of the retrieved images for Non-Unique Images with refiners for different
levels and search engines is tabulated in Table 14 and the performance of the search engines with
respect to average precision is illustrated graphically in 13.
Table 14: Average Precision of retrieved images for Non-Unique Images with Refiners
Figure 13: Average Precision of retrieved images for Non-Unique Images with Refiners
Figure 13 illustrates that Google has the best average precision at any cut off point for non-
unique images with refiners.
Average PrecisionSearch Engine R @ 10 R @ 20 R @ 30 R @ 40
Google 0.42 0.41 0.39 0.355Yahoo 0.24 0.17 0.113 0.085Live 0.26 0.17 0.153 0.135
10 15 20 25 30 35 400.05
0.1
0.15
0.2
0.25
0.3
0.35
0.4
0.45Non-Unique Images with refiners
number of retrievals
aver
age
prec
isio
n
Yahoo
MSN Live

47
Table 15 documents the percentage increase in the performance of Google and Yahoo search
engines over MSN for various query types at various retrieval levels. It can be clearly seen that
Google performs better than MSN and MSN performs better than Yahoo when a refiner is added.
Table 15: Percentage increase in the performance of Yahoo and Google over MSN
Some points of observation from the results were that
• The performance of the search engines tended to drop with the increase in the number of
retrievals irrespective of the search engines and the query types.
• The performance of the search engines dropped drastically when the queries had refiners
(unique or non-unique).
Query TypeSearch Engine
Percentage Increase R@10
Percentage Increase R@20
Percentage Increase R@30
Percentage Increase R@40
MSN 0 0 0 0
Yahoo 9.677419355 5.357142857 9.803921569 18.18181818
Google 22.58064516 23.21428571 19.60784314 29.54545455
MSN 0 0 0 0
Yahoo -60 -64.2857143 -66.6666667 -64.2857143
Google 90 92.85714286 133.3333333 157.1428571
MSN 0 0 0 0
Yahoo -8.33333333 -24.2424242 -31.1666667 -34.2857143
Google 19.44444444 18.18181818 23.33333333 31.42857143
MSN 0 0 0 0
Yahoo -7.69230769 0 -26.1437908 -37.037037
Google 61.53846154 141.1764706 154.9019608 162.962963
Unique Images
Unique Images with Refiners
Non-Unique Images
Non-Unique Images with Refiners
48
We conclude that Google search engine performs significantly better (Table 15) than Yahoo or
MSN Live for any query type. All the commercial search engines have potential to improve for
image search, particularly in situations involving search queries with refiners.
4.2 Understanding the user goals in the web image search
The previous section demonstrated that the performance of the current commercial annotation
based image retrieval systems performances could potentially be improved for image search. The
performances of the search engines can be possibly improved by adding some additional features
which leads us to the content (i.e., pixels data) of the image. To gather the requirements of the
system with respect to the image features, domain experts for the game of cricket who also are
experts in searching for images in this field were interviewed. To aid the domain experts to
generate the “Image Attributes” to enhance the search experience and the retrieval effectiveness,
the image attributes (the content of the images) were classified into different categories based on
the Budford’s model (2003).
The framework for classification of content for image retrieval by Budford et al, (2003), is a
targeted approach to understand the needs of the users who are searching for images in specific
domains. The framework established by (Budford et al, 2003) is motivated by this recognized
necessity for considering classification of images from user-centered rather than the system-
centered point of view. Apart from deriving taxonomy for categorization of images, the aim of
this taxonomy is to allow researchers to design the user interface for image databases based on
the content of images. The structure set forth by researchers is loose enough to allow the

49
individual researcher to tailor it to their own need, but focused enough to allow the researchers to
be focused on the problems.
Budford et al, (2003) describe nine categories of information that may be associated with an
image: Perceptual primitives, Geometric Primitives, Visual Extension, Semantic Units,
Contextual Abstraction, Cultural Abstraction, Technical Abstraction, Emotional Abstraction and
Metadata. The next few pages outline the framework as described by Budford et al (2003), and
we discuss specific ways in which the framework can be applied and extended to fit our research
problem.
Perceptual Primitives
Perceptual Primitives include the lowest levels of visual content, such as edges, texture elements
including measure of image sharpness and color. These features are extracted at a retinal or an
early cortical level (Budford et al, 2003). For the game of cricket, perceptual primitives
especially color and texture are extremely important as they define country colors and
differentiate the grass with the pitch and also differentiate players of various countries.
Geometric Primitives
The process of reducing the image into geometric shapes is geometric primitives. Dyson and Box
(1997) distinguished between the main shape, other shape and the border in the reduced image.
The main shape is the dominant shape in the reduced image and the border is the shape that has
all components of the image. The remaining are other shapes. Based on these shapes, they tried

50
to describe and classify an image. According to the theory of recognition by components, any
object can be described by geons (generalized cones) with respect to their sizes and relationships
between them (Budford et al, 2003). For the game of cricket the shape of the wickets, bat,
ground and pitch are required for image retrieval.
Visual Extension
These are the features that contain the perceptual pattern and no semantic content. Features at
this level contain depth, orientation and motion. That is, visual extension looks at the third
dimension in an image (Budford et al, 2003). Visual extension in the game of cricket refers to
shadows and presence of depth cues.
Semantic Units
Semantic Content is the content that is not derived from the features of the image itself. These
are names of objects or classes of objects present in a scene. These may be general (example
sand, grass) or specific (example Monalisa, Eiffel Tower) (Budford et al, 2003). After shape
extraction of bat, wickets, pitch, ground and using facial recognition algorithms, the names of the
objects and the specific names of the players can be found using Semantic units.
Abstraction refers to the content that is not directly present in an image but needs to be inferred
from background knowledge and experience. There are four levels of abstraction.
Contextual Abstraction
Contextual Abstraction refers to non visual information that has been derived from knowledge of
environment. Examples include whether the image represents day/night, inside or outside scene,
51
different weather conditions etc. Contextual and Cultural abstractions overlap especially in
images containing environment (Budford et al, 2003). In the game of cricket contextual
abstraction can be applied such as whether the game is a day game or a day/night game, whether
played in an indoor stadium or an outdoor stadium. It also tells whether a game has been delayed
or abandoned due to extreme weather conditions.
Cultural Abstraction
This refers to the aspects of an image that can be inferred only with the help of special cultural
knowledge. Generally cultural abstractions refer to political or sporting events. Cultural
immersion (depth of knowledge), sub cultural expertise and identification of cultural weights are
needed to identify all the details of the image (Budford et al, 2003). Identifying the image as a
cricket game requires cultural abstraction. Indentifying the details in the image requires sub
cultural abstraction. Sub-cultural abstraction helps us to identify teams, dates etc. If we need to
identify the players in an image it requires us to identify the cultural weight.
Professional Abstraction (Technical Abstraction)
Information that requires technical expertise to extract minute details in an image is called
professional abstraction. Generally used in the fields of art and medical images. Understanding
these images requires a trained eye i.e. the person looking at the image will have to be a domain
expert (Budford et al, 2003). In the game of cricket professional abstraction cannot be applied to
most of the images as they are generally used in the field of medical images to read brain tumors

52
and Alzheimer's, but can come in handy when images contain content regarding Leg Before
Wicket, a manner in which the batsman can get out.
Emotional Abstraction
Emotional associations or a response that the people may have towards an image refers to
emotional abstraction. While these responses may by universal, they are typically idiosyncratic,
varying from viewer to viewer (Budford et al, 2003). In the game of cricket, one team typically
wins and the other loses. Some of the pictures in cricket consist of award ceremonies, and if the
viewer of the image is from the winning team he feels happy or if the viewer is from the losing
team he feels sad. Also if an image contains a player lying on the ground being hit by the ball, it
may create an unhappy feeling.
Metadata
Budford et al, (2003) refer to metadata as details that include date and time a photo was taken,
copyright information, file size, compression ratio etc. As this research also examines the topic
of correlation of images, meta data will be an important factor to consider.
Apart from Budford’s taxonomy we also considered Shatford’s model (Shatford, 1994). To
understand the features of the image that the domain experts think are important, we showed
them two diverse images (Figure 14 & Figure 15) in the game of Cricket and asked them to
specify the features. Once they specify the features, we segregated them into both the Budford’s
model (Budford et al, 2003) and the Shatford’s model (Shatford, 1994) and tabulated them in
Table 16 through Table 19.

53
Table 16 describes the cricket features and the algorithms needed to retrieve the features for
Image 1 for Budford model while Table 17 describes the features for Image 1 for Shatford
Model. Table 18 describes the cricket features and the algorithms needed to retrieve the features
for Image 2 for Budford model while Table 19 describes the features for Image 2 for Shatford
Model.

54
Example 1
Figure 14: Image 1 shown to domain experts
Budford Model Table 16: Segregation of image-1 features based on Budford Model
Category Cricket Feature Mathematical Algorithm Perceptual Primitives Blue, red, green (color), texture Color histograms, Texture algorithm Geometric Primitives Rectangles (wickets, bat) Shape retrieval algorithms Visual Extension Texture Gradient Texture algorithms Semantic Units Pitch, grass, men Color and texture retrieval Contextual Abstraction night Color & spatial location Cultural Abstraction Cricket, bowler, batsman Shape retrieval
Technical Abstraction Srilanka, England, Out Face recognition and color Emotional Abstraction Happy, sad Face recognition Metadata
Shatford model
Table 17: Segregation of image-1 features based on Shatford Model
Category Sub‐Category Cricket Feature
Mathematical Algorithm
Generic Object Hierarchy Man, grass Facial recognition
The Object Facet Generic Object Class Hierarchy
Cricket Player Color processing
Specific Named Object Class
Sri Lankan, British Color processing
Specific Named Object Instance
Fernando Facial recognition
Generic Location Outside Texture and color
The spatial effect Specific Location -----------------------
Generic Time Night Color
The temporal Effect Specific Time -----------------------
Generic Activity Batting, bowling,
fielding, keeping Object Recognition, face recognition
Generic Event Cricket game database
The Activity Facet Specific Named event class Eng Vs SL Color
Specific Event Instance -----------------------

55
Example 2
Figure 15: Image 2 shown to domain experts
Budford Model Table 18: Segregation of image-2 features based on Budford Model
Category Cricket Feature Mathematical Algorithm Perceptual Primitives Texture, color Color Histogram, Texture algorithms Geometric Primitives Oval, circle, rectangle Shape retrieval algorithms Visual Extension Shadow, texture gradient Texture algorithm Semantic Units Grass, pitch, lights Color and texture retrieval Contextual Abstraction Day Color & spatial location Cultural Abstraction game Shape retrieval Technical Abstraction MCG cricket stadium Object recognition and color Emotional Abstraction --------------------------- Metadata
Shatford model Table 19: Segregation of image-2 features based on Shatford Model
Category Sub‐Category Cricket Feature
Mathematical Algorithm
Generic Object Hierarchy Grass Color histograms & texture
algorithm
The Object Facet Generic Object Class Hierarchy
ground Color processing & shape retrieval
Specific Named Object Class
Cricket ground Color processing
Specific Named Object Instance
MCG Color processing & shape retrieval
Generic Location Outside Texture and color
The spatial effect Specific Location Australia Shape retrieval
Generic Time day Color
The temporal Effect Specific Time -------------
Generic Activity Cricket game
Generic Event
The Activity Facet Specific Named event class
Specific Event Instance

56
After carefully examining the features from these models and taking the domain experts inputs
on the image features, a visual cue template (Table 20) was created and a metadata template
(Table 21) for each image in the database. These templates are specific to the game of cricket but
can be extended to other domains.
Table 20: Visual Cue Template
Category Identification
Perceptual Primitives Generated by the features extracted by the color and texture algorithms.
Nationality of the players will be identified at this stage.
Geometric Primitives Generated by the features extracted by shape extraction algorithms. The
cricket gear (bats, wickets, balls, pads) will be identified at this stage.
Contextual Abstraction Generated by the features extracted by the color algorithms. Whether
the game is played in the day or night will be identified at this stage.
Technical Abstraction Generated by the Face Recognition Algorithms. The player will be
identified at this stage.
Table 21: Metadata Template Category Identification
Specific Named Object Class Nationality of the players
Specific Named Object Instance Name of the players.
Specific Location Location of the game.
Specific Time Time of the game.
Generic Activity Activity of the player (example: batting, bowling)
Specific Activity Game Format

57
Chapter 5
Phase 2 – Role of Human Annotation in
Search & Retrieval of Images
As documented in the literature review, though various studies in the literature have defined
different ways of ascribing text to images by humans and computers, none of these studies
appear to have investigated the human role in the annotation of images for search and retrieval
engines. In this chapter we present details of an empirical study aimed at quantifying the
effectiveness of search engines due to the inter-human variability of the annotations. The
Institutional Review Board details for this study are shown in Appendix A.
In this experiment, to determine the level of expertise in the game of cricket, a pre-annotation
test (Appendix B) was prepared and twelve people were administered the pre-test. Eight people
were selected, if they scored more than 90% in the pre-annotation test, these eight people were
defined as domain experts. Forty images were randomly selected from the game of cricket, and
the eight participants were asked to annotate these images individually (Appendix C). The
participants were told that the annotations should be a descriptor of the image from a domain

58
expert point of view and should be comprehensive enough. They were also instructed that
annotations should be similar to the keywords that they use when they upload an image online or
a video on YouTube. Finally they were told that the annotations will be used for information
retrieval (image retrieval). After the annotation was completed, eight different search databases
were built to test the queries.
5.1 Design of Experiment
Experimental Design
Data were collected for the 32 experimental trials for an 8x4 full factorial design with two
repeated measures. The queries used for this experiment are listed in Table 22.
Table 22: Queries
Query Type Queries
Unique Images Henry Olonga
Kevin Pietersen
Unique Images with Identifiers Sachin Tendulkar + Marriage
Kapil Dev + World Cup
Non Unique Images Pakistan Cricket Team
Indian Cricket Team
Non Unique Images with Identifiers England Team + Ashes
Austrailan Team + World Cup

59
Independent Variables
The independent variables for this experiment were the eight search databases (named
DE1…..DE8), and the four different types of queries: unique, unique with identifier, non-unique,
non-unique with identifier. The independent variable and their levels are show in table 23.
Table 23: Independent Variables
Factor Description Level 1 Level 2 Level 3 Level 4 Level 5 Level 6 Level 7 Level 8
A Search
Database DE 1 DE 2 DE 3 DE 4 DE 5 DE 6 DE 7 DE 8
B Query Type Unique
Unique
with
Identifier
Non
Unique
Non
Unique
with
Identifier
Dependent Variables
Traditionally evaluation for information retrieval has been based on the effectiveness ratios of
precision (proportion of retrieved documents that are relevant) and recall (proportion of relevant
documents that are retrieved) (Smith, 1998). In this scenario, precision and an exact measure of
recall could be calculated as the knowledge of all relevant documents in the collection was
available.
Hypothesis (Alternate) 1: There is significant effect of the Search Database and Query Type on
the Precision of the retrievals.

60
Hypothesis (Alternate) 2: There is significant effect of the Search Database and Query Type on
the Recall of the retrievals.
The analysis was performed using ANOVA (Analysis of Variance). The data collected on
precision are tabulated in Table 24 and the data collected on recall are tabulated in Table 25.

61
Table 24: Precision
Search Engine (A)
Query Type (B)
Precision Replicate
1
Precision Replicate
2PrecisionTotal
1 1 0 100 1001 2 100 100 2001 3 100 100 2001 4 100 100 2002 1 0 100 1002 2 100 100 2002 3 100 100 2002 4 100 100 2003 1 0 100 1003 2 100 100 2003 3 100 100 2003 4 100 100 2004 1 0 100 1004 2 100 100 2004 3 100 100 2004 4 100 100 2005 1 0 100 1005 2 100 100 2005 3 100 100 2005 4 100 100 2006 1 0 100 1006 2 100 100 2006 3 100 100 2006 4 100 100 2007 1 100 100 2007 2 100 100 2007 3 100 100 2007 4 100 100 2008 1 100 100 2008 2 100 100 2008 3 100 100 2008 4 100 100 200
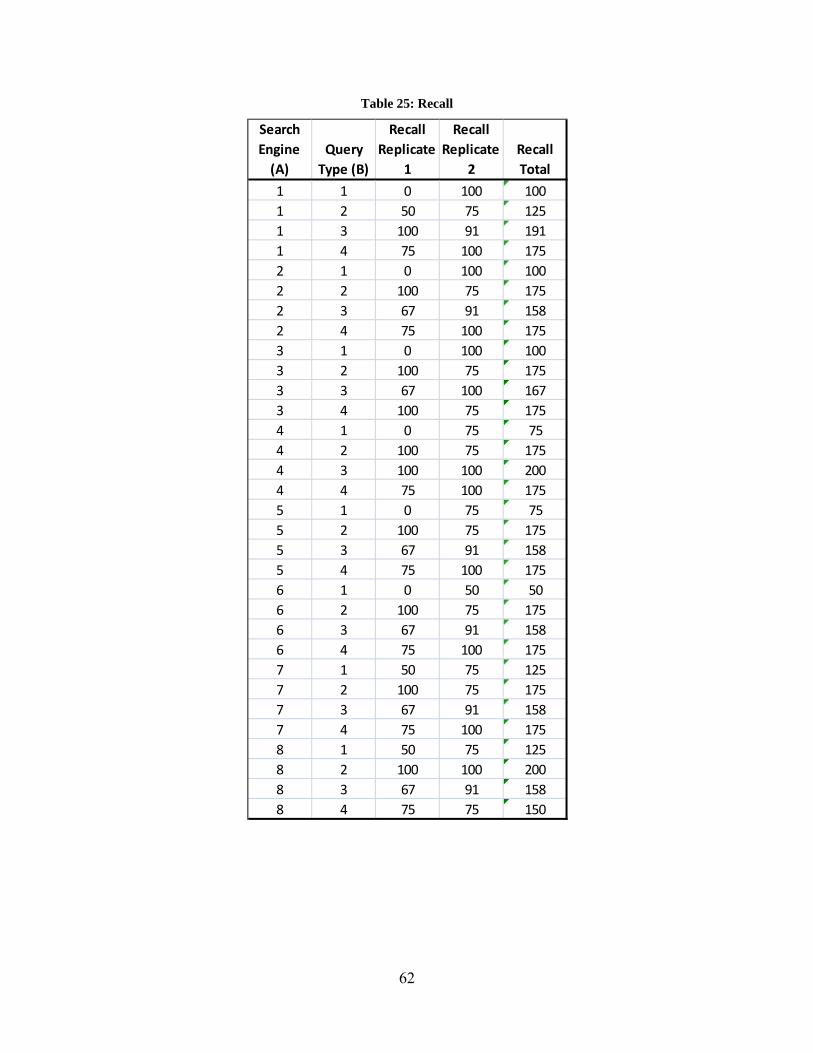
62
Table 25: Recall
Search Engine (A)
Query Type (B)
Recall Replicate
1
Recall Replicate
2Recall Total
1 1 0 100 1001 2 50 75 1251 3 100 91 1911 4 75 100 1752 1 0 100 1002 2 100 75 1752 3 67 91 1582 4 75 100 1753 1 0 100 1003 2 100 75 1753 3 67 100 1673 4 100 75 1754 1 0 75 754 2 100 75 1754 3 100 100 2004 4 75 100 1755 1 0 75 755 2 100 75 1755 3 67 91 1585 4 75 100 1756 1 0 50 506 2 100 75 1756 3 67 91 1586 4 75 100 1757 1 50 75 1257 2 100 75 1757 3 67 91 1587 4 75 100 1758 1 50 75 1258 2 100 100 2008 3 67 91 1588 4 75 75 150

63
5.2 Analysis of Results
Table 26 and Table 27 show the ANOVA results obtained for the full factorial experiment
conducted for precision and recall. Considering 99% significance level, the ANOVA results
show that there is a significant main effect of, Query Type (B) but the other main effect Search
Database (A) or the interaction effect is not significant at 99% significance, for either precision
or recall.
Table 26: ANOVA for Precision of Search Databases
Table 27: ANOVA for Recall of Search Databases
These results reject our Null Hypothesis and validate that as long as the person annotating the
images in a database is a domain expert, the performance of the search database did not change
significantly. This result indicates that the performance of the current commercial search
databases cannot be improved by domain experts annotating the images. Clearly, the human’s
cognitive abilities have to be better tuned for the person to annotate the images in a more
ss df ms f pa 1875 7 267.8571429 0.304761905 0.946525776b 16875 3 5625 6.4 0.0016052ab 7500 21 357.1428571 0.406349206 0.982990105
error 28125 32 878.90625total 580000 64model 54375 63 7128.90625 8.111111111 4.56539E‐09
ss df ms f pa 625.25 7 89.32142857 0.10108969 0.997891781b 17817.375 3 5939.125 6.721615576 0.00120641ab 5166.625 21 246.0297619 0.278444633 0.998387751
error 28274.75 32 883.5859375total 419120 64model 51884 63 7158.062128 8.101149899 4.64108E‐09

64
systematic way which may improve the performance of the search databases. Our next chapter
discusses the Human Computer Integrated technique which aids the human to annotate the
images with the help of automatically generated templates.

65
Chapter 6
Phase 3 –Human Computer Integrated
Architecture
Phase 3 of this research work explains the design and implementation of the content based image
retrieval system and the hybrid system as illustrated in Figure 16. Each of these blocks are
explained in detail in the following sections.
Figure 16: Design and Implementation of Human Computer Integrated System
6.1 CBIR Architecture
Figure 17 represents the information system of our Content Based Image Retrieval Architecture.

66
Figure 17: Content Based Image Retrieval System Architecture
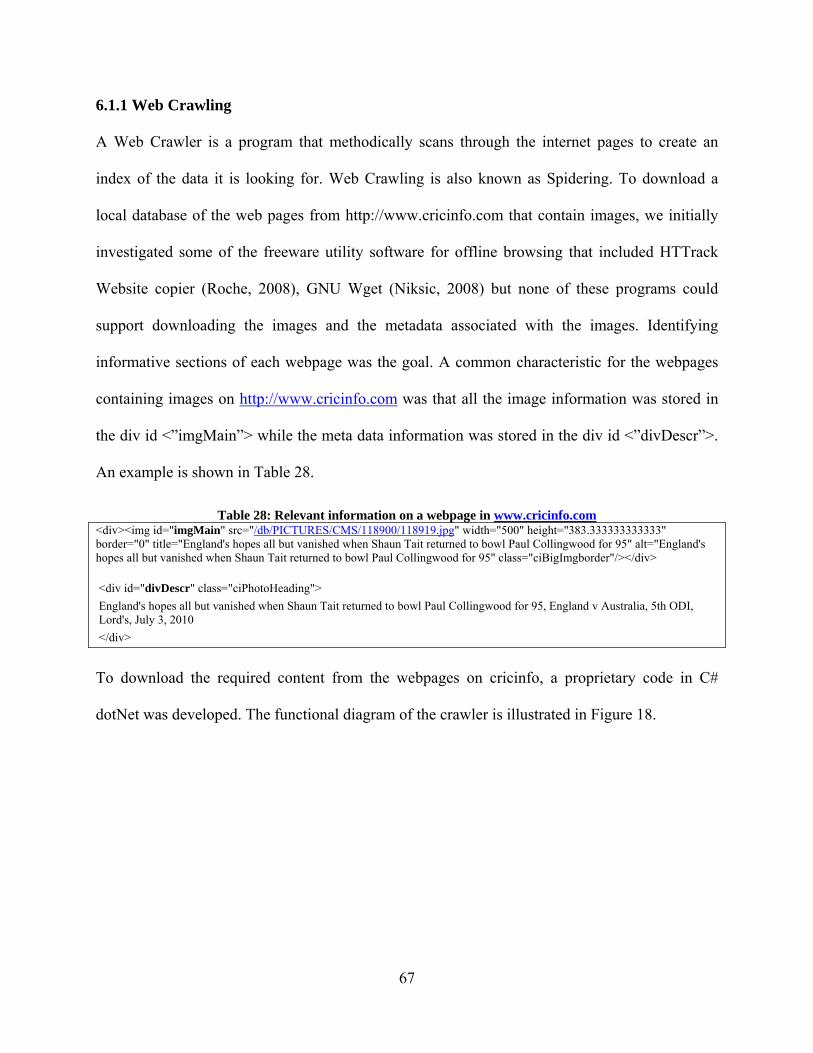
67
6.1.1 Web Crawling
A Web Crawler is a program that methodically scans through the internet pages to create an
index of the data it is looking for. Web Crawling is also known as Spidering. To download a
local database of the web pages from http://www.cricinfo.com that contain images, we initially
investigated some of the freeware utility software for offline browsing that included HTTrack
Website copier (Roche, 2008), GNU Wget (Niksic, 2008) but none of these programs could
support downloading the images and the metadata associated with the images. Identifying
informative sections of each webpage was the goal. A common characteristic for the webpages
containing images on http://www.cricinfo.com was that all the image information was stored in
the div id <”imgMain”> while the meta data information was stored in the div id <”divDescr”>.
An example is shown in Table 28.
Table 28: Relevant information on a webpage in www.cricinfo.com <div><img id="imgMain" src="/db/PICTURES/CMS/118900/118919.jpg" width="500" height="383.333333333333" border="0" title="England's hopes all but vanished when Shaun Tait returned to bowl Paul Collingwood for 95" alt="England's hopes all but vanished when Shaun Tait returned to bowl Paul Collingwood for 95" class="ciBigImgborder"/></div> <div id="divDescr" class="ciPhotoHeading"> England's hopes all but vanished when Shaun Tait returned to bowl Paul Collingwood for 95, England v Australia, 5th ODI, Lord's, July 3, 2010 </div>
To download the required content from the webpages on cricinfo, a proprietary code in C#
dotNet was developed. The functional diagram of the crawler is illustrated in Figure 18.

68
Figure 18: Functional Illustration of the Web Crawler
The user initially inputs the website to be crawled and the information that he/she is looking for.
The crawler then finds the documents on that specific website (www.cricinfo.com in our case)
and constructs the index. Based on the relevance criteria, the content captured is either stored in
the database if relevant or discarded. This process repeats until all the links have been crawled
and checked for relevance.
6.1.2 Eliminate Duplicate Images
The crawler was used to identify the informative sections and download the images and their
metadata if any. One of the issues encountered while downloading the images was that a unique
image (with the same dimensions and the same format) was stored in multiple places on the
cricinfo website. For example for the image illustrated in Figure 19, was located in three
different places on the same website.

69
Figure 19: Example of an Image found at multiple locations
To eliminate multiple downloads of the same image with a similar size and format, Principal
Component Analysis was utilized (Jolliffe, 2002). Images which are similar in their content and
size have the same Eigen values. Therefore the first instance of an image which had a unique
Eigen vector was stored while the others were discarded.
Another difficulty was similar images with different resolutions were stored on the cricinfo
website. An example is shown in Figure 20. To resolve this issue, all the images were downward
interpolated to a size of 50 pixels * 50 pixels. Principal components were calculated and images

70
with EigenVectors which have a Eucledian distance of less than 0.0001 with respect to each
other were not downloaded into our database.
Figure 20: Example of an image stored at different resolutions
One of the major discoveries was that the cricinfo website was storing similar images with
different/same sizes over multiple locations. This definitely decreases the precision of the image
search engine that they use as the indexer of the search engine contains multiple links having the
same information.
6.1.3 Database
The images were stored as jpeg images and their associated metadata were stored as text files in
the database.

71
6.1.4 Content Based Feature Extraction
As discussed in Phase 1 of the research, we have constructed a visual cue template which
extracts content of the image and assigns a keyword to the template based on the features of the
image. The visual cue template was constructed from a user point of view rather than the
traditional system point of view, i.e., keywords are assigned to the image based on the users
perspective of the image (example: a yellow colored team uniform is given the keyword of
Australia rather than stating that 30% of the image contains yellow color). Figure 21 illustrates
the template features and their corresponding content features.
Figure 21: Functional flow of automatic structured template generation from content

72
Perceptual Primitives: Color and texture features of the image were used to generate the
keywords for perceptual primitives. Each image was analyzed and a color signature was
allocated based on the Hue values of the Hue Saturation Value color space. RGB values were not
used as they are affected by the changes in the illumination of the image. Specific number of
color bins were identified based on the colors generally found on the cricket field (example:
color of uniforms, color of pitch etc.). Each pixel was analyzed and allocated to one of the color
bins. If the frequency of the color bin was greater than a threshold, a keyword was allocated to
the perceptual primitives field. After the images are segmented based on the color, the texture of
each segment was calculated for entropy and a keyword was generated based on the entropy
value.
Geometric Primitives: Shape features of the image were used to generate the keywords for
geometric primitives. A database of known objects in the domain of cricket (example: bats, pads,
etc.) serve as the reference images. Various zoom levels and orientations of the known images
are stored in our database. When a new image is analyzed, the database of images is compared
with the regions of interest in the new image and if the distance measure is less than the
predefined threshold, the object keyword is generated in the geometric primitives field.
Contextual Abstraction: Color of the image was used to generate the keywords for contextual
abstraction. Each image’s Value component in the Hue Saturation Value color space was
calculated and contextual abstraction was allocated after comparing the value with a
predetermined threshold.

73
Technical Abstraction: Face detection and recognition was used to generate the keywords for
technical abstraction. The first step is the face detection process. This step identifies and locates
human faces in an image. We find the faces embedded in the picture automatically by using an
adaptation of the Viola-Jones algorithm (Viola, Jones, 2001). The second step is the face
recognition process. This step identifies or verifies a person from an image by comparing it with
a known list of faces. For our research, we have downloaded the player’s full frontal pictures
from the cricinfo website. Whenever an image is analyzed and a face is found, the face is
compared with the reference faces in our database and if there is a match, the name of the player
is allocated in the technical abstraction field. We have used an adaptation of the Fisher Face
method (Jing, Wong, Zhang, 2006) for face recognition.
An example of the visual cue template is illustrated in Figure 22.
Given Annotation: Sachin ducks to a bouncer from Lee
Visual Cue Template
Perceptual Primitives: India, Australia
Geometric Primitives: Bat, White Ball, Pads, Shoes
Contextual Abstraction: Night Game
Technical Abstraction: NA
Figure 22: Visual Cue Template

74
The Content Based Image Algorithms which include the Face Recognition algorithms are
reliable and repeatable as long as the faces and the objects in the image are complete (fully
frontal for face images) unlike the humans who are often forgetful. The computer algorithms can
also process the images faster than the humans and can work without stopping. Hence generating
a visual cue temple from Content Based Image Algorithms is necessary for our research.
6.2 Human Integrated Technique
Figure 23 represents the information system of our Human Integrated Technique for image
retrieval. This system is very similar to the CBIR architecture discussed in the previous section,
but with an addition of a few blocks.

75
Figure 23: Human Computer Integrated System Architecture

76
The functional illustration of the automatic structured template generation from keywords is
illustrated in Figure 24.
Figure 24: Functional flow of automatic structured template generation from keywords
To generate the automatic structured template generation from keywords, domain knowledge
was utilized to construct the template features. From the metadata available for the image, stop-
words like is, the, and etc. were removed. The remaining words were compared with the arrays
of each template feature, and if matched with a particular array, were placed in that template
field. The template features and their arrays are discussed in the following paragraphs.

77
Specific Object Named Class: The specific object named class is related to the nationality of the
players for the domain of cricket. An array was constructed with each element of the array
containing a country name. The country information was downloaded from
http://www.cricinfo.com/ci/content/page/417881.html. If a word from the metadata of the
template matches with the specific object named class array, the word is placed in the specific
object named class field.
Specific Object Named Instance: The specific object named class is related to the name of the
players for the domain of cricket. If the first character of the words in the metadata was an upper
case letter and the word did not fit in the Specific Object Named Class, Specific Location,
Specific Time or Specific Activity, it was automatically placed in the Specific Object Named
Instance field.
Specific Location: The specific location class is related to the location of the playground for the
domain of cricket. An array was constructed with each element of the array containing a
playground name. The playground information was downloaded from
http://www.cricinfo.com/ci/content/current/ground/index.html. If a word from the metadata of
the template matches with the specific location array, the word is placed in the specific location
field.
Specific Time: The specific time class is related to the time of the game for the domain of
cricket. An array was constructed with each element of the array containing a time which

78
includes months, years, and days. If a word from the metadata of the template matches with the
specific time array, the word is placed in the specific time field.
Generic Activity: The generic activity time class is related to the activity of the players for the
domain of cricket. An array was constructed with each element of the array containing activities
of the players that include “batting”, “bowling”, etc. If a word from the metadata of the template
matches with the generic activity array, the word is placed in the generic activity field.
Specific Format (Activity): The specific format (activity) class is related to format of the game
for the domain of cricket. An array was constructed with each element of the array containing
formats of the games that include “Test”, “One-Day”, “World Cup” etc. If a word from the
metadata of the template matches with the specific format (activity) array, the word is placed in
the specific format (activity) field.
Any other information that does not fill in any of the metadata fields are filled in the Other
Information field. If any metadata template feature field is empty, “N/A” is filled into the field.
An example of the metadata template generation is showcased in Table 29.

79
Table 29: Example of Metadata Template Generation
Image Metadata: “Kapil Dev and Mohinder Amarnath are all smiles after winning the World Cup. India beat West Indies in the final. June 25, 1983”
Remaining Metadata after Remove Stop-Words:
Kapil Dev Mohinder Amarnath smiles winning World Cup India West Indies final June 25 1983
Specific Object Named Class field:
Remaining Metadata:
India West Indies
Kapil Dev Mohinder Amarnath smiles winning World Cup final June 25 1983
Specific Location:
Remaining Metadata:
“N/A”
Kapil Dev Mohinder Amarnath smiles winning World Cup final June 25 1983
Specific Time:
Remaining Metadata:
June 25 1983
Kapil Dev Mohinder Amarnath smiles winning World Cup final
Generic Activity:
Remaining Metadata:
smiles winning
Kapil Dev Mohinder Amarnath World Cup final
Specific Format (Activity):
Remaining Metadata:
World Cup final
Kapil Dev Mohinder Amarnath
Specific Object Named Instance:
Remaining Metadata:
Kapil Dev Mohinder Amarnath
-------------------------

80
Once the database is created a template based on the metadata of the image, another template
based on the visual features of the image, is created. They are then combined to form a
comprehensive template for the annotation and the visual features of the image. This
comprehensive template is sent to the subject matter expert who accepts or rejects the
annotations provided in the comprehensive template, adds any other information that is pertinent
and finally saves it. An exhaustive annotation html file is generated as the last step to be stored in
the human integrated database.
This approach of using the domain expert (who has a better decision making abilities compared
to a computer) helps the overall system to bridge the semantic gap between the object
annotations and the high level reasoning and this, in turn, potentially leads to a better retrieval
performance.
The use of the templates definitely helps to reduce the semantic gap partially. Even when using
templates, image features can be interpreted as generic objects to which labels might be applied
(by means of automatic annotations using visual cue template generation) which is the gap
between level 1 and level 2 (Gap 1) as illustrated in Figure 25, it still doesn’t fill the other half of
the gap (Gap 2) i.e. the distance between the object annotations and the high level reasoning (the
gap between the level 2 and level 3 of image retrieval). To bridge the gap between level 2 and
level 3, human reasoning has been utilized. The use of templates aids the human to fill in the
information needed for this domain, thereby creating relevant annotation needed for the image.

81
Sem
antic
Gap Se
man
tic G
ap
Gap
1G
ap 2
Figure 25: Bridging of the Semantic Gap

82
An example of the various templates generated during this step is showcased in Figure 26.
Figure 26: Various Templates
The entire framework is modular as depicted in Figure 27. Computer vision is still at a nascent
stage, with new techniques being continuously developed. New algorithms can replace the older
ones in a block without the need to change the entire framework. Providing this feature will ease
the process of extending the same framework to other domains (example: art, surveillance etc.).
The modular structure also eases the way to use the distributed computing architecture for faster
processing of the images.

83
Figure 27: Modular Framework

84
6.3. Indexing and Searching
Indexer recognizes and creates an index of all the documents on a particular website. When a
user searches a particular query, the search engine looks at the index and retrieves the results of
the query in a relevant order with the closest match on the top. Soergel (1994), in his article
discussed the characteristics of indexing and showcased that indexing effects the search engine
retrieval performance. Since we are developing and comparing three different databases,
maintaining consistency over the three databases by using the same indexing structure was
necessary. Also since the three databases were hosted on the desktop, a desktop search engine
was needed. Since Google search engine performed better than the Yahoo and MSN search
engines in phase 1 of our research, the logical way was to use the Google Desktop Search
Engine. Our approach was also reiterated by Lu et al. (2007), who in their study compared five
Desktop Search Engines (Yahoo, Windows Desktop Search, Google, Copernic, and Archivarius)
on different measures that included recall-precision average, document-level precision, R-
Precision, Document-level recall, mean average precision, exact precision and recall, fallout-
recall average, R-based precision and summarized that Google Desktop Search Engine
performed much better than the rest.
For our study, we used the Google Desktop Search Engine for our databases. The other indexing
and search engine we considered was the Lucene Java API (Gospodnetic & Hatcher, 2005).

85
Chapter 7
Phase 4- Performance metrics for Human
Computer Integrated System
Figure 28 illustrates our approach towards comparing the Human Integrated System with the
Annotation Based Image Retrieval System and the Content Based Image Retrieval System.
Figure 28: Performance metrics of a Human Computer Integrated System
7.1 Independent Variables
As described in Phase 1 of this research effort, the independent variables are Query Types,
Precision Levels and Types of Search Engine. The independent variables are shown in Table 30,
and the queries are shown in Table 31.

86
Table 30: Independent Variables Factor Description Level 1 Level 2 Level 3 Level 4
A Query Type Unique Images
Unique Images with
Refiners
Non Unique Images
Non Unique Images with
Refiners B Search
Technique Human
Integrated System
Annotation Based System
(Google)
Content Based System
C Retrieval Level
10 20 30 40
7.2 Dependent Variables
The dependent variable was objective measurements of Average Precision.
7.3 Procedure
To carry out evaluation, a domain expert was given twenty different problem situations based on
the four different query types. The user noted the number of relevant retrieved images at
different levels. Using this information we calculated the average precision at different levels.

87
Table 31: Precision values at various retrieval levels for different search engines and query types
Query Type Query Search Engine R @ 10 R @ 20 R @ 30 R @ 40Unique Images Sunil Gavaskar ABIR 8 17 25 31Unique Images Sunil Gavaskar CBIR 9 19 28 35Unique Images Sunil Gavaskar HI 10 20 29 37Unique Images Imran Khan ABIR 9 19 27 30Unique Images Imran Khan CBIR 9 17 26 32Unique Images Imran Khan HI 10 20 30 35Unique Images Kapil Dev ABIR 10 18 26 35Unique Images Kapil Dev CBIR 10 16 24 32Unique Images Kapil Dev HI 10 20 30 35Unique Images Viv Richards ABIR 7 15 18 19Unique Images Viv Richards CBIR 5 14 21 24Unique Images Viv Richards HI 9 19 28 28Unique Images Gary Sobers ABIR 9 19 25 33Unique Images Gary Sobers CBIR 9 19 26 34Unique Images Gary Sobers HI 10 19 29 35Query Type Query Search Engine R @ 10 R @ 20 R @ 30 R @ 40
Unique Images with Refiners Kapil Dev lifting World Cup ABIR 4 7 7 8Unique Images with Refiners Kapil Dev lifting World Cup CBIR 6 9 10 12Unique Images with Refiners Kapil Dev lifting World Cup HI 10 18 18 18Unique Images with Refiners Jonty Rhodes Inzimam Ul Haq runout ABIR 3 5 5 5Unique Images with Refiners Jonty Rhodes Inzimam Ul Haq runout CBIR 5 7 7 7Unique Images with Refiners Jonty Rhodes Inzimam Ul Haq runout HI 8 8 8 8Unique Images with Refiners Sachin Tendulkar Debut Test Innings ABIR 4 7 8 8Unique Images with Refiners Sachin Tendulkar Debut Test Innings CBIR 4 7 8 8Unique Images with Refiners Sachin Tendulkar Debut Test Innings HI 9 9 9 9Unique Images with Refiners Sunil Gavaskar batting ABIR 9 14 16 17Unique Images with Refiners Sunil Gavaskar batting CBIR 9 16 18 18Unique Images with Refiners Sunil Gavaskar batting HI 10 17 22 22Unique Images with Refiners Trevor Chappel underarm incident ABIR 2 3 3 3Unique Images with Refiners Trevor Chappel underarm incident CBIR 3 3 3 3Unique Images with Refiners Trevor Chappel underarm incident HI 7 7 7 7
Query Type Query Search Engine R @ 10 R @ 20 R @ 30 R @ 40Non Unique Images Indian Cricket Players ABIR 10 18 25 33Non Unique Images Indian Cricket Players CBIR 9 18 27 34Non Unique Images Indian Cricket Players HI 10 20 28 37Non Unique Images Ashes (Eng vs Aus) ABIR 8 17 27 33Non Unique Images Ashes (Eng vs Aus) CBIR 8 16 25 31Non Unique Images Ashes (Eng vs Aus) HI 9 18 28 36Non Unique Images Players in Pavillion ABIR 4 5 6 6Non Unique Images Players in Pavillion CBIR 5 7 7 7Non Unique Images Players in Pavillion HI 8 14 19 22Non Unique Images Pakistan Cricket Team ABIR 8 14 21 25Non Unique Images Pakistan Cricket Team CBIR 9 17 25 31Non Unique Images Pakistan Cricket Team HI 10 19 28 35Non Unique Images South Africa Cricket Players ABIR 10 19 25 26Non Unique Images South Africa Cricket Players CBIR 9 18 24 27Non Unique Images South Africa Cricket Players HI 10 20 29 35
Query Type Query Search Engine R @ 10 R @ 20 R @ 30 R @ 40Non Unique Images with Refiners Victorious Indian Team + 1983 World Cup ABIR 6 9 9 9Non Unique Images with Refiners Victorious Indian Team + 1983 World Cup CBIR 7 9 10 10Non Unique Images with Refiners Victorious Indian Team + 1983 World Cup HI 10 19 26 27Non Unique Images with Refiners South Africa first ODI after ban ABIR 2 3 3 5Non Unique Images with Refiners South Africa first ODI after ban CBIR 2 3 3 5Non Unique Images with Refiners South Africa first ODI after ban HI 8 15 18 19Non Unique Images with Refiners Pakistan Players with 1992 World Cup ABIR 8 15 21 24Non Unique Images with Refiners Pakistan Players with 1992 World Cup CBIR 9 18 25 25Non Unique Images with Refiners Pakistan Players with 1992 World Cup HI 10 20 28 29Non Unique Images with Refiners 1987 World Cup ABIR 9 19 25 32Non Unique Images with Refiners 1988 World Cup CBIR 8 18 27 34Non Unique Images with Refiners 1989 World Cup HI 10 20 29 36Non Unique Images with Refiners Eng vs SA + WC stalled by rain + 1992 ABIR 3 5 6 6Non Unique Images with Refiners Eng vs SA + WC stalled by rain + 1992 CBIR 3 4 5 6Non Unique Images with Refiners Eng vs SA + WC stalled by rain + 1992 HI 8 8 8 8

88
7.3 Data Analysis and Results
Data were collected for 48 experimental trials of the 4 x 4 x 3 full factorial design with five
repeated measures. The analysis was performed using ANOVA (Analysis of Variance). The data
collected is tabulated in Table 32. Table 33 lists data used in ANOVA.
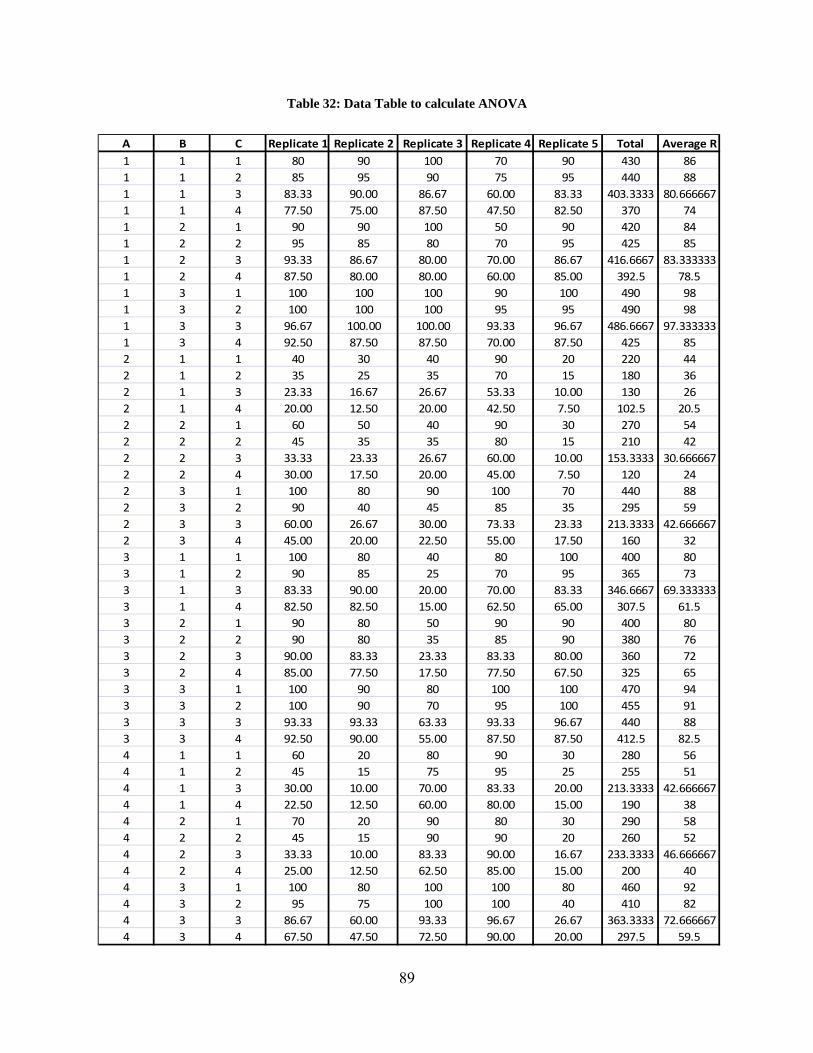
89
Table 32: Data Table to calculate ANOVA
A B C Replicate 1 Replicate 2 Replicate 3 Replicate 4 Replicate 5 Total Average R1 1 1 80 90 100 70 90 430 861 1 2 85 95 90 75 95 440 881 1 3 83.33 90.00 86.67 60.00 83.33 403.3333 80.6666671 1 4 77.50 75.00 87.50 47.50 82.50 370 741 2 1 90 90 100 50 90 420 841 2 2 95 85 80 70 95 425 851 2 3 93.33 86.67 80.00 70.00 86.67 416.6667 83.3333331 2 4 87.50 80.00 80.00 60.00 85.00 392.5 78.51 3 1 100 100 100 90 100 490 981 3 2 100 100 100 95 95 490 981 3 3 96.67 100.00 100.00 93.33 96.67 486.6667 97.3333331 3 4 92.50 87.50 87.50 70.00 87.50 425 852 1 1 40 30 40 90 20 220 442 1 2 35 25 35 70 15 180 362 1 3 23.33 16.67 26.67 53.33 10.00 130 262 1 4 20.00 12.50 20.00 42.50 7.50 102.5 20.52 2 1 60 50 40 90 30 270 542 2 2 45 35 35 80 15 210 422 2 3 33.33 23.33 26.67 60.00 10.00 153.3333 30.6666672 2 4 30.00 17.50 20.00 45.00 7.50 120 242 3 1 100 80 90 100 70 440 882 3 2 90 40 45 85 35 295 592 3 3 60.00 26.67 30.00 73.33 23.33 213.3333 42.6666672 3 4 45.00 20.00 22.50 55.00 17.50 160 323 1 1 100 80 40 80 100 400 803 1 2 90 85 25 70 95 365 733 1 3 83.33 90.00 20.00 70.00 83.33 346.6667 69.3333333 1 4 82.50 82.50 15.00 62.50 65.00 307.5 61.53 2 1 90 80 50 90 90 400 803 2 2 90 80 35 85 90 380 763 2 3 90.00 83.33 23.33 83.33 80.00 360 723 2 4 85.00 77.50 17.50 77.50 67.50 325 653 3 1 100 90 80 100 100 470 943 3 2 100 90 70 95 100 455 913 3 3 93.33 93.33 63.33 93.33 96.67 440 883 3 4 92.50 90.00 55.00 87.50 87.50 412.5 82.54 1 1 60 20 80 90 30 280 564 1 2 45 15 75 95 25 255 514 1 3 30.00 10.00 70.00 83.33 20.00 213.3333 42.6666674 1 4 22.50 12.50 60.00 80.00 15.00 190 384 2 1 70 20 90 80 30 290 584 2 2 45 15 90 90 20 260 524 2 3 33.33 10.00 83.33 90.00 16.67 233.3333 46.6666674 2 4 25.00 12.50 62.50 85.00 15.00 200 404 3 1 100 80 100 100 80 460 924 3 2 95 75 100 100 40 410 824 3 3 86.67 60.00 93.33 96.67 26.67 363.3333 72.6666674 3 4 67.50 47.50 72.50 90.00 20.00 297.5 59.5
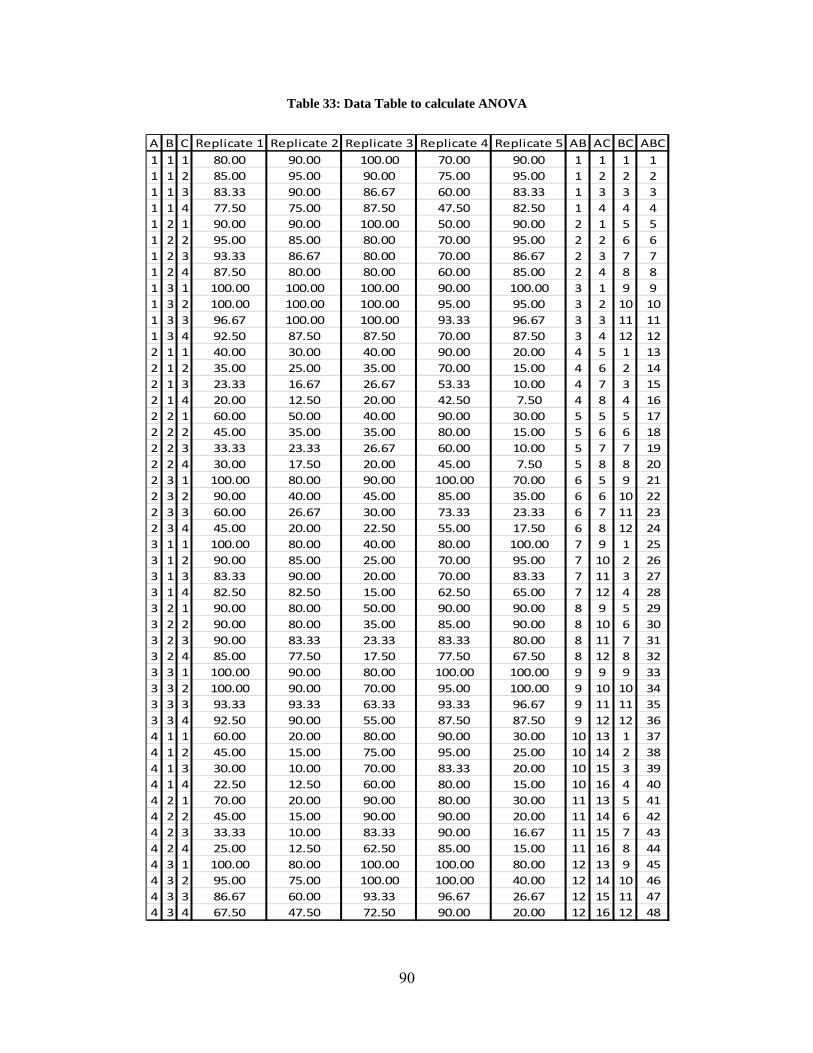
90
Table 33: Data Table to calculate ANOVA
A B C Replicate 1 Replicate 2 Replicate 3 Replicate 4 Replicate 5 AB AC BC ABC1 1 1 80.00 90.00 100.00 70.00 90.00 1 1 1 11 1 2 85.00 95.00 90.00 75.00 95.00 1 2 2 21 1 3 83.33 90.00 86.67 60.00 83.33 1 3 3 31 1 4 77.50 75.00 87.50 47.50 82.50 1 4 4 41 2 1 90.00 90.00 100.00 50.00 90.00 2 1 5 51 2 2 95.00 85.00 80.00 70.00 95.00 2 2 6 61 2 3 93.33 86.67 80.00 70.00 86.67 2 3 7 71 2 4 87.50 80.00 80.00 60.00 85.00 2 4 8 81 3 1 100.00 100.00 100.00 90.00 100.00 3 1 9 91 3 2 100.00 100.00 100.00 95.00 95.00 3 2 10 101 3 3 96.67 100.00 100.00 93.33 96.67 3 3 11 111 3 4 92.50 87.50 87.50 70.00 87.50 3 4 12 122 1 1 40.00 30.00 40.00 90.00 20.00 4 5 1 132 1 2 35.00 25.00 35.00 70.00 15.00 4 6 2 142 1 3 23.33 16.67 26.67 53.33 10.00 4 7 3 152 1 4 20.00 12.50 20.00 42.50 7.50 4 8 4 162 2 1 60.00 50.00 40.00 90.00 30.00 5 5 5 172 2 2 45.00 35.00 35.00 80.00 15.00 5 6 6 182 2 3 33.33 23.33 26.67 60.00 10.00 5 7 7 192 2 4 30.00 17.50 20.00 45.00 7.50 5 8 8 202 3 1 100.00 80.00 90.00 100.00 70.00 6 5 9 212 3 2 90.00 40.00 45.00 85.00 35.00 6 6 10 222 3 3 60.00 26.67 30.00 73.33 23.33 6 7 11 232 3 4 45.00 20.00 22.50 55.00 17.50 6 8 12 243 1 1 100.00 80.00 40.00 80.00 100.00 7 9 1 253 1 2 90.00 85.00 25.00 70.00 95.00 7 10 2 263 1 3 83.33 90.00 20.00 70.00 83.33 7 11 3 273 1 4 82.50 82.50 15.00 62.50 65.00 7 12 4 283 2 1 90.00 80.00 50.00 90.00 90.00 8 9 5 293 2 2 90.00 80.00 35.00 85.00 90.00 8 10 6 303 2 3 90.00 83.33 23.33 83.33 80.00 8 11 7 313 2 4 85.00 77.50 17.50 77.50 67.50 8 12 8 323 3 1 100.00 90.00 80.00 100.00 100.00 9 9 9 333 3 2 100.00 90.00 70.00 95.00 100.00 9 10 10 343 3 3 93.33 93.33 63.33 93.33 96.67 9 11 11 353 3 4 92.50 90.00 55.00 87.50 87.50 9 12 12 364 1 1 60.00 20.00 80.00 90.00 30.00 10 13 1 374 1 2 45.00 15.00 75.00 95.00 25.00 10 14 2 384 1 3 30.00 10.00 70.00 83.33 20.00 10 15 3 394 1 4 22.50 12.50 60.00 80.00 15.00 10 16 4 404 2 1 70.00 20.00 90.00 80.00 30.00 11 13 5 414 2 2 45.00 15.00 90.00 90.00 20.00 11 14 6 424 2 3 33.33 10.00 83.33 90.00 16.67 11 15 7 434 2 4 25.00 12.50 62.50 85.00 15.00 11 16 8 444 3 1 100.00 80.00 100.00 100.00 80.00 12 13 9 454 3 2 95.00 75.00 100.00 100.00 40.00 12 14 10 464 3 3 86.67 60.00 93.33 96.67 26.67 12 15 11 474 3 4 67.50 47.50 72.50 90.00 20.00 12 16 12 48

91
7.4 Hypothesis
Hypothesis (Alternate): There is significant effect of Query Type, Search Engine or Retrieval
level R on the precision of the retrieved results.
7.5 Statistical Analysis
Table 34 shows the ANOVA results. Considering a 99% significance level, the ANOVA results
show that there are significant main effects of, (A) Query Type, (B) Search Engine and (C)
Retrieval Level R and there are no effects due to interactions.
Table 34: Analysis of Variance for various factors
7.6 Analysis of the Results
The performance of the search engines for various queries and retrieval levels is discussed in this
section.
ss df ms f pA 73482.65 3 24494.22 38.39042 1.75522E‐19B 20687.03 2 10343.52 16.21166 3.12171E‐07C 14766.33 3 4922.109 7.714549 6.81746E‐05AB 2083.524 6 347.2541 0.54426 0.774057847AC 4001.415 9 444.6017 0.696836 0.711300468BC 793.5938 6 132.2656 0.207303 0.974203208ABC 1539.184 18 51.42057 0.080593 0.999999891
Error 93642.78 192 638.0294
Total 1250834 240
model 117353.7 47 2942.167 4.611334 2.40093E‐14
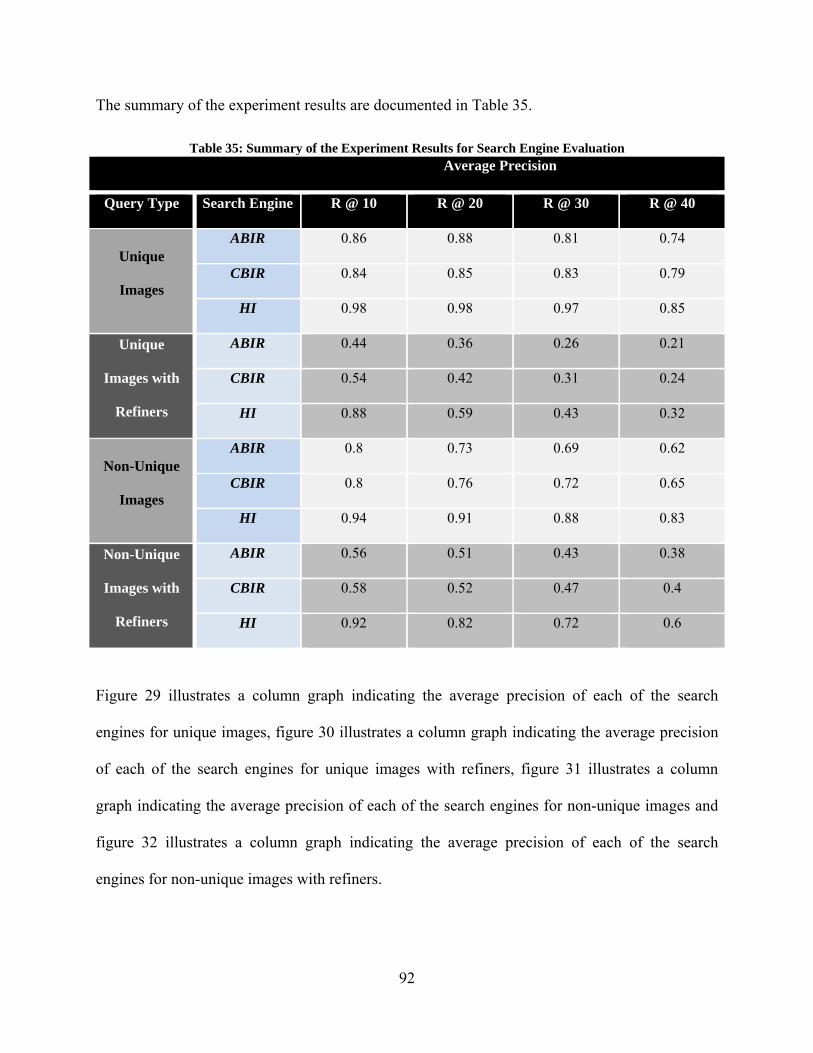
92
The summary of the experiment results are documented in Table 35.
Table 35: Summary of the Experiment Results for Search Engine Evaluation Average Precision
Query Type Search Engine R @ 10 R @ 20 R @ 30 R @ 40
Unique
Images
ABIR 0.86 0.88 0.81 0.74
CBIR 0.84 0.85 0.83 0.79
HI 0.98 0.98 0.97 0.85
Unique
Images with
Refiners
ABIR 0.44 0.36 0.26 0.21
CBIR 0.54 0.42 0.31 0.24
HI 0.88 0.59 0.43 0.32
Non-Unique
Images
ABIR 0.8 0.73 0.69 0.62
CBIR 0.8 0.76 0.72 0.65
HI 0.94 0.91 0.88 0.83
Non-Unique
Images with
Refiners
ABIR 0.56 0.51 0.43 0.38
CBIR 0.58 0.52 0.47 0.4
HI 0.92 0.82 0.72 0.6
Figure 29 illustrates a column graph indicating the average precision of each of the search
engines for unique images, figure 30 illustrates a column graph indicating the average precision
of each of the search engines for unique images with refiners, figure 31 illustrates a column
graph indicating the average precision of each of the search engines for non-unique images and
figure 32 illustrates a column graph indicating the average precision of each of the search
engines for non-unique images with refiners.
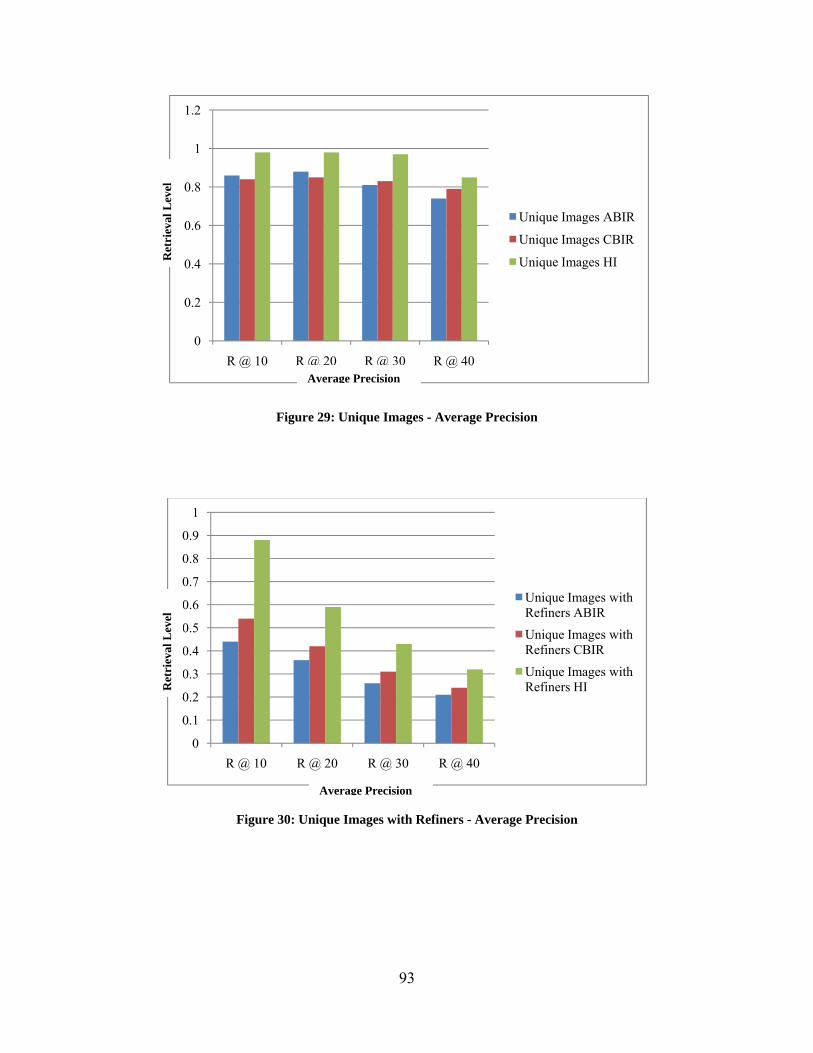
93
Figure 29: Unique Images - Average Precision
Figure 30: Unique Images with Refiners - Average Precision
0
0.2
0.4
0.6
0.8
1
1.2
R @ 10 R @ 20 R @ 30 R @ 40
Unique Images ABIR
Unique Images CBIR
Unique Images HI
0
0.1
0.2
0.3
0.4
0.5
0.6
0.7
0.8
0.9
1
R @ 10 R @ 20 R @ 30 R @ 40
Unique Images with Refiners ABIR
Unique Images with Refiners CBIR
Unique Images with Refiners HI
Average Precision
Ret
riev
al L
evel
R
etri
eval
Lev
el
Average Precision

94
Figure 31: Non-Unique Images - Average Precision
Figure 32: Non-Unique Images with Refiners - Average Precision
Each of the main effects were analyzed individually for differences in their levels.
0
0.1
0.2
0.3
0.4
0.5
0.6
0.7
0.8
0.9
1
R @ 10 R @ 20 R @ 30 R @ 40
Non-Unique Images ABIR
Non-Unique Images CBIR
Non-Unique Images HI
0
0.1
0.2
0.3
0.4
0.5
0.6
0.7
0.8
0.9
1
R @ 10 R @ 20 R @ 30 R @ 40
Non-Unique Images with Refiners ABIR
Non-Unique Images with Refiners CBIR
Non-Unique Images with Refiners HI
Ret
riev
al L
evel
R
etri
eval
Lev
el
Average Precision
Average Precision

95
Query Types
Tukey’s Honest Significant Difference was performed to compare query types. The results are
tabulated in table 36.
Table 36: Tukey’s Honest Significant Different for Query Types
From Table 36, for query types we can see that Level 1 (Unique Images) & Level 3 (Non-Unique
Images) are significantly different and better compared to Level 4 (Non-Unique Images with
Refiners) and Level 2 (Unique Images with Refiners), while Level 4 (Non-Unique Images with
Refiners) is significantly different and better than from Level 2 (Unique Images with Refiners).
Search Engines
Tukey’s Honest Significant Difference was performed to compare Search Engines. The results
are tabulated in table 37.
Table 37: Tukey’s Honest Significant Different for Search Engines

96
From Table 37, for Search Engines we can see that Level 3 (HI) is significantly different and
better compared to Level 1 (ABIR) & Level 2 (CBIR).
Retrieval Level R
Tukey’s Honest Significant Difference was performed to compare Retrieval Levels. The results
are tabulated in table 38.
Table 38: Tukey’s Honest Significant Different for Retrieval Levels
From Table 38, for Retrieval Levels we can see that Level 1 (R@10) is significantly different
and better than Level 3 (R@30) and Level 4 (R@40) and Level 2 (R@20) is significantly
different and better than Level 4 (R@40). Level 1 (R@10) and Level 2 (R@20) are not
significantly different and Level 2 (R@20) and Level 3 (R@30) are not significantly different.
Further analysis was conducted to calculate the precision for various query types and search
engines at different retrieval levels.
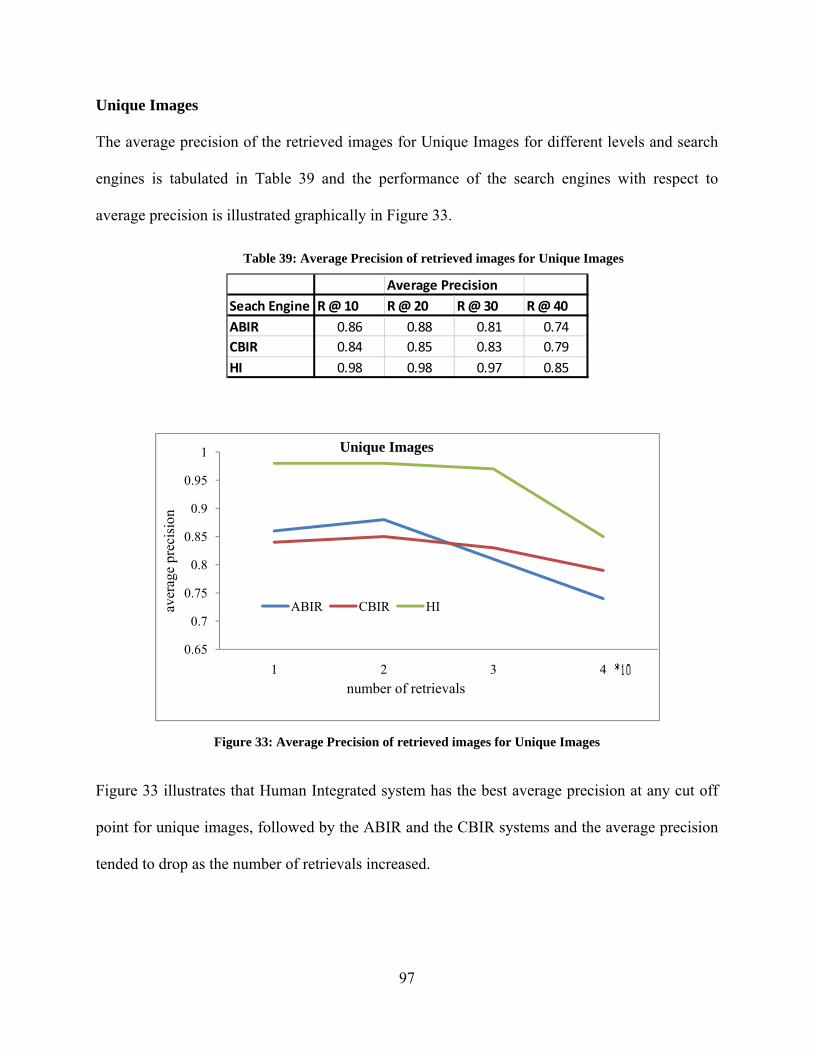
97
Unique Images
The average precision of the retrieved images for Unique Images for different levels and search
engines is tabulated in Table 39 and the performance of the search engines with respect to
average precision is illustrated graphically in Figure 33.
Table 39: Average Precision of retrieved images for Unique Images
Figure 33: Average Precision of retrieved images for Unique Images
Figure 33 illustrates that Human Integrated system has the best average precision at any cut off
point for unique images, followed by the ABIR and the CBIR systems and the average precision
tended to drop as the number of retrievals increased.
Average PrecisionSeach Engine R @ 10 R @ 20 R @ 30 R @ 40ABIR 0.86 0.88 0.81 0.74CBIR 0.84 0.85 0.83 0.79HI 0.98 0.98 0.97 0.85
0.65
0.7
0.75
0.8
0.85
0.9
0.95
1
1 2 3 4
ABIR CBIR HI
number of retrievals
aver
age
prec
isio
n
Unique Images

98
Unique Images with refiners
The average precision of the retrieved images for Unique Images with refiners for different
levels and search engines is tabulated in Table 40 and the performance of the search engines with
respect to average precision is illustrated graphically in Figure 34.
Table 40: Average Precision of retrieved images for Unique Images with Refiners
Figure 34: Average Precision of retrieved images for Unique Images with Refiners
For unique images with refiners, Human Integrated system has the best average precision at any
cutoff point, followed by CBIR system and the ABIR system respectively.
Average PrecisionSeach Engine R @ 10 R @ 20 R @ 30 R @ 40ABIR 0.44 0.36 0.26 0.21CBIR 0.54 0.42 0.31 0.24HI 0.88 0.59 0.43 0.32
*10

99
Non-Unique Images
The average precision of the retrieved images for Non-Unique Images with refiners for different
levels and search engines is tabulated in Table 41 and the performance of the search engines with
respect to average precision is illustrated graphically in Figure 35.
Table 41: Average Precision of retrieved images for Non-Unique Images
Figure 35: Average Precision of retrieved images for Non-Unique Images
Figure 35 illustrates that Human Integrated system has the best average precision at any cut off
point for non-unique images, followed by CBIR system and the ABIR system respectively and
the average precision tended to drop as the number of retrievals increased.
Average PrecisionSeach Engine R @ 10 R @ 20 R @ 30 R @ 40ABIR 0.8 0.73 0.69 0.62CBIR 0.8 0.76 0.72 0.65HI 0.94 0.91 0.88 0.83
*10

100
Non-Unique Images with refiners
The average precision of the retrieved images for Non-Unique Images with refiners for different
levels and search engines is tabulated in Table 42 and the performance of the search engines with
respect to average precision is illustrated graphically in Figure 36.
Table 42: Average Precision of retrieved images for Non-Unique Images with Refiners
Figure 36: Average Precision of retrieved images for Non-Unique Images with Refiners
Figure 36 illustrates that Huma Integrated system has the best average precision at any cut off
point for non-unique images with refiners followed by the CBIR system and the ABIR system
respectively.
Average PrecisionSeach Engine R @ 10 R @ 20 R @ 30 R @ 40ABIR 0.56 0.51 0.43 0.38CBIR 0.58 0.52 0.47 0.4HI 0.92 0.82 0.72 0.6
*10
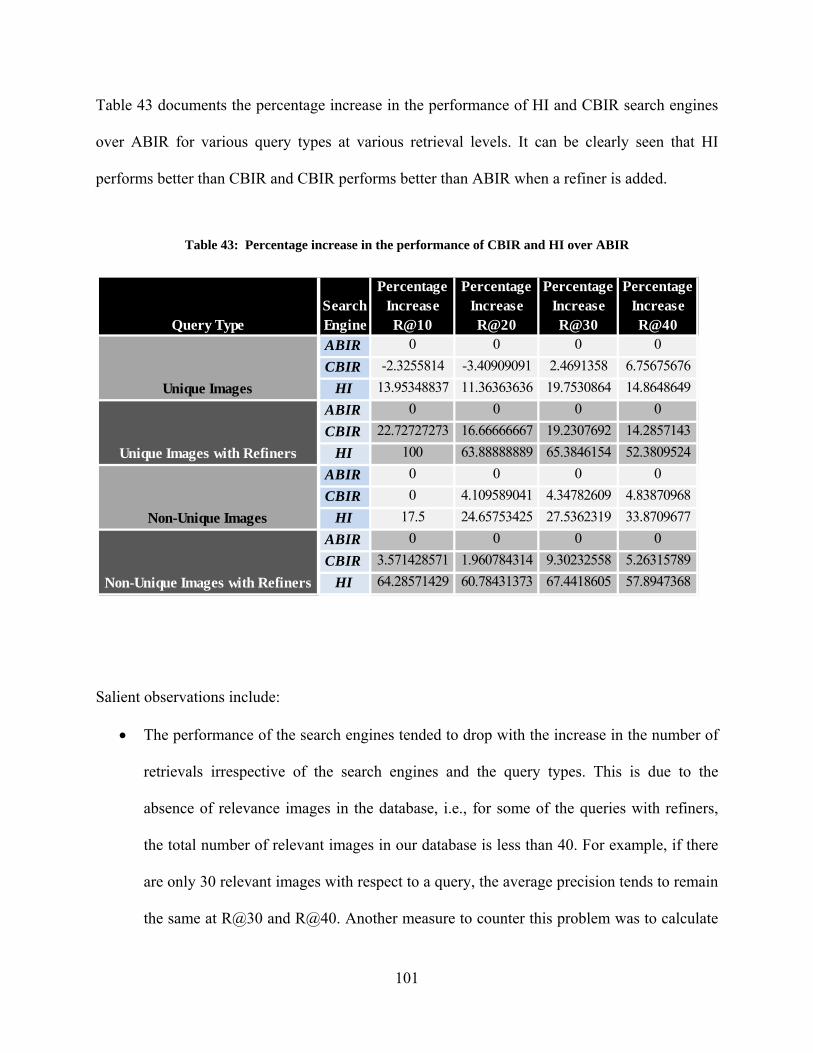
101
Table 43 documents the percentage increase in the performance of HI and CBIR search engines
over ABIR for various query types at various retrieval levels. It can be clearly seen that HI
performs better than CBIR and CBIR performs better than ABIR when a refiner is added.
Table 43: Percentage increase in the performance of CBIR and HI over ABIR
Salient observations include:
• The performance of the search engines tended to drop with the increase in the number of
retrievals irrespective of the search engines and the query types. This is due to the
absence of relevance images in the database, i.e., for some of the queries with refiners,
the total number of relevant images in our database is less than 40. For example, if there
are only 30 relevant images with respect to a query, the average precision tends to remain
the same at R@30 and R@40. Another measure to counter this problem was to calculate
Query TypeSearch Engine
Percentage Increase R@10
Percentage Increase R@20
Percentage Increase R@30
Percentage Increase R@40
ABIR 0 0 0 0CBIR -2.3255814 -3.40909091 2.4691358 6.75675676
HI 13.95348837 11.36363636 19.7530864 14.8648649ABIR 0 0 0 0CBIR 22.72727273 16.66666667 19.2307692 14.2857143
HI 100 63.88888889 65.3846154 52.3809524ABIR 0 0 0 0CBIR 0 4.109589041 4.34782609 4.83870968
HI 17.5 24.65753425 27.5362319 33.8709677ABIR 0 0 0 0CBIR 3.571428571 1.960784314 9.30232558 5.26315789
HI 64.28571429 60.78431373 67.4418605 57.8947368
Unique Images
Unique Images with Refiners
Non-Unique Images
Non-Unique Images with Refiners

102
recall, but due to the sheer volume of images in the database, the calculation of recall is
impractical.
• The performance of the ABIR & CBIR search engines dropped drastically when the
queries had refiners (unique or non-unique) but the HI search engine remained consistent
throughout.
We conclude that Human Integrated (HI) search engine performs significantly better than ABIR
or CBIR for any query type. Though the ABIR and HI system use human annotation, the
performance of the HI system is better than the ABIR system since the human annotator is
encouraged to use the supporting templates (visual cue and metadata). The human annotators job
is much more focused on what needs to be filled in the annotation fields rather than coming up
with the annotations from scratch.

103
Chapter 8
Summary of Research Contributions,
Potential Applications, and Future Research
8.1 Research Contributions
This research demonstrated that the human integrated approach led to the improved retrieval
performance of the image retrieval system versus the pure ABIR or pure CBIR systems at
various retrieval levels. The performance enhancement was achieved by systematically coupling
annotations generated by the content of the image with the annotations geared from a human
perspective. The performance of the system also varied with respect to various levels of query
formulation and retrieval levels. Our architecture aids the human by generating templates which
helps the human to annotate in a much more efficient manner.
The first phase of the research benchmarked the performance of the current commercial search
engines and explored the possibility of improving the performance by developing a human
centered framework which couples the computerized algorithms input and the human input in a
systematic manner.

104
The contributions of this research include:
• Designed and developed a novel Human Computer Integrated framework to demonstrate
the rationale for better performance of search engines.
• Designed and developed a Content Based Image Retrieval system with proprietary face
detection and face recognition algorithms.
• Gained a comprehensive understanding of the role of manual annotations, image
processing algorithms and human computer interaction in image retrieval.
• Filled the gap in the existing literature by developing a framework that systematically
reduces the semantic gap between the high level textual features and low level image
features.
• Developed and generated an automatic visual cue template and the metadata template for
an image. These templates aid the human domain expert to annotate images in a more
systematic way which in-turn increased the performance of the search engine.
• Designed a modular architecture that can be extended to other domains such as
surveillance, medical diagnostics, crime prevention etc. in a hassle free manner.
8.2 Practical Applications
Several applications of the techniques developed in this research are discussed below.
• Crime Prevention: Law enforcement agencies typically maintain large archives of visual
evidence (facial photographs, fingerprints, tire treads, registration plates of cars etc).
Whenever new visual evidence is procured, they can compare the new evidence for its
similarity matching to the records in the archives.

105
• Surveillance: Recognition of enemy aircrafts from radar screens and identification of
targets from satellite photographs by comparing the photographs with the existing
archives are some of the applications. An example is illustrated in Figure 38. In this
picture, it can be clearly seen that our content based image retrieval algorithms have
recognized a white car (bounded by a red box) illustrated in figure 37 that exists in the
data base of known objects with a 90% certainty.
Figure 37: Car Image in the Database
Figure 38: Example of a Surveillance Scenario

106
• Trademark Image Registration: New candidate marks can be compared with the existing
marks in the database to ensure that there is no risk of confusion thus providing copyright
protection.
• Medical Diagnosis: Hospitals have archives of millions of scans (FMRI, MRI, CT, X
ray, and Ultrasound) which are never used by the doctors. With the proposed system, the
current scans can be compared with the archived scans to assist the medical staff in
diagnosing the problem like tumors, thus providing the correct prognosis and decreasing
the insurance costs and saving the patients lives due to misdiagnosis.
• Image Collectors Tool: The proposed system can be used as an image collector’s tool by
identifying duplicate images in the database and avoiding incorrect annotation of the
images.
8.3 Future Research
The algorithm development in Computer Vision is a growing field. Some of the algorithms used
in this research for the Content Based Image Retrieval search engine can be updated with newer
algorithms in the future. Section 8.3.1 suggests ways of expanding the CBIR algorithms into
other domains. Sections 8.3.2 and 8.3.3 suggest ways of furthering the research in improving the
CBIR algorithms and targeting information needed for the visual-cue template and Section 8.3.4
suggests ways of reducing the load of the human-in-the-loop by using machine learning
algorithms.

107
8.3.1 Expanding the data sets beyond the game of cricket
The architecture developed in this research is modular and hence readily supports algorithm
enhancement. The first initiative is to expand the data sets particularly in the area of medical
images and surveillance images. The Content Based Image Retrieval algorithms will be
developed and replaced with the current ones in the framework to support the two areas.
8.3.2 Improving CBIR algorithms for enhancing semantic knowledge
Semantic meaning of facial images can be incorporated in the CBIR algorithms in near future.
Dr. Paul Ekman’s literature documents various facial and micro-facial expressions that lead to an
emotion (Ekman, Friesen, Hager, 2002). A potential future research area is to extract the facial
and micro-facial expressions automatically from the face of a person as illustrated in Figure 39
and extract the emotion.
Figure 39: Emotional Classification of a person’s face
This methodology may aid in reducing the semantic gap (Gap 2 illustrated in Figure 25) and
potentially improve the retrieval performance of the Content Based Image Retrieval Algorithms.

108
8.3.3 Improve the visual-cue template using eye-tracking
Eye tracking can be used to identify the specific content of the image the domain expert is
observing. This gaze data could help refine the visual-cue template in the framework to
concentrate on specific sections of the image rather than the image in total which reduces the
computational complexity and increases the speed, while improving the performance of the
search engines.
8.3.4 Mixed-Initiative Interaction
Mixed-Initiative interaction is a research area which focuses on developing methods to enable
computers to support an efficient naturalistic interleaving of contributions by people and
computers to converge on a solution to a problem. A typical framework of a mixed-initiative
interaction is illustrated in Figure 40.
Figure 40: Mixed-Initiative Interaction
In this study, the subject matter expert will teach the learning agent on how he incorporates his
expertise to annotate images. This process integrates the complementary knowledge and
reasoning styles of the subject matter expert and the agent. Over time, the agent mimics the
human reasoning and annotates the images thereby reducing the mental load on the human
domain expert.

109
Appendix A
IRB Proposal Summary
Title: Role of Human Annotation in the Search and Retrieval of Images
Investigators: Phani Kidambi, S. Narayanan, Ph.D., P.E.,
Purpose of Research:
This research study aims to empirically evaluate the role of humans in the annotation of web
images. The web images will be based on the game of cricket.
Background:
The objective of this research is to evaluate the role of humans in the annotation of images. Any
user’s quest for images falls into one of the four different categories:
Search for unique images - The property of uniqueness is a request for the visual representation
of an entity where the desired entity (image) can be differentiated from every other occurrence of
the same entity type. An example is - “find the image of Barack Obama”.
110
Search for unique images with refiners – Using refiners, the user can narrow down the results of
the retrieved images from unique images to a certain degree of specificity. An example is - “find
the image of Barack Obama in 2004”.
Search for non-unique images – The property of non-uniqueness is a request for the visual
representation of an entity where the desired entity (image) cannot be differentiated from every
other occurrence of the same entity type. An example is – “find images of Indians”
Search for non-unique images with identifiers – Using refiners, the user can narrow down the
results of the retrieved images from unique images to a certain degree of specificity. An example
is – “find images of Indians waving the Indian flag”
Current major commercial search engines annotate images based on Annotation Based Image
Retrieval. Even though the user is searching for images, in the current image retrieval systems
(Google, Yahoo etc) images are retrieved by the text which is either manually assigned as
keywords to each image or by using the text associated with the images (captions, web pages).
We hypothesize that there is no significant change in retrieval effectiveness (precision and recall)
of the search engines, when the images are annotated by multiple human domain experts.
Experimental Scenario: In the experiment eight subject domain experts will be asked to
annotate various images based on the game of cricket.

111
Procedure or Methods:
The participants are shown multiple images on a computer screen one image at a time. Each
participant then analyzes the image and fills in a web-form based on his analysis. If the user
cannot find any information about a particular field, he fills in “Not Applicable (NA)”.
Source of Funds-Cost:
The subjects are voluntary and will not be compensated for their effort.
Selection of Subjects:
Subjects will include approximately 16 undergraduate and graduate students attending Wright
State University who are domain experts in the game of cricket. All will be solicited through
advertisement and will not be compensated.
Location – Duration:
Research will be conducted at Wright State University, in the Russ Engineering Center, Room
248. The total time required to complete the study is about 1-2 hours on an average at the testing
site.
Possible Risks:
There is a minimal risk of computer fatigue. However the participant will be requested to take
the following precautions to mitigate the risks of computer fatigue.

112
Make sure your eyes look down slightly when you work.
Look away from your screen every half hour, and focus on something 20 feet away.
Leave your desk completely once every hour to give your eyes a break from the screen.
Special Precautions:
No special precautions are required for this study. The subjects will be informed that they may
stop the experiment at any time. Due to the low risk of the protocol, on-site medical monitoring
will not be performed.
Confidentiality:
All data collected, including the questionnaires will be kept confidential in a locked file cabinet
in an office located at Russ Engineering Building at Wright State University. Participants will
only be addressed by subject identification number. No correlation will be made between subject
identification number and subject name in the research notes or materials.
Computer Data:
The Computer data results will be stored on a secure drive with limited access.
Other Information:
All tests will be run by the principal investigator.

113
Consent:
Attached is the sample of participant’s consent form. This form will be presented to the subject
prior to any experimental trial run. The subject will be asked to read and sign the consent form.
After the subject has signed the consent form, the principal investigator will sign and date as a
witness.

114
Appendix B
Pre Annotation Test
Question 1: Who is the leading wicket taker in the history of Test cricket?
A. Shane Warne
B. Brian Lara
C. Courtney Walsh
D. Muttiah Muralitharan
Question 2: Which country won the World Cup in 1999?
A. Australia
B. South Africa
C. Pakistan
D. England

115
Question 3: In cricket, what is meant by the phrase “bowling a maiden over”?
A. Bowling six successive balls without the batsman scoring any runs
B. Colliding with another fielder when trying to catch the ball
C. Toasting victory by quickly drinking three glasses of beer
D. Taking five wickets and scoring 100 runs in the same match
Question 4: In cricket, what is the “Duckworth-Lewis method”?
A. A tactic in which nearly all the fielders are placed on one side
B. A training regimen in which the batsmen practice blindfolded
C. Pairing an aggressive batsman with a defensively-minded partner
D. The system for awarding victory in games interrupted by weather
Question 5: The pinnacle of international cricket competition is the “test match”. How long does
a test match last?
A. Six hours
B. Two days
C. Five days
D. Until the game is over, no matter how long it takes

116
Question 6: Who hit six sixes in an over for the first time in the 2007 World Cup?
A. Jaques Kallis
B. Hershel Gibbs
C. Mark Boucher
D. Craig Macmillan
Question 7: What is a Golden Duck?
A. Out first ball
B. An award
C. A blow on the head
D. None of the above
Question 8: Which of these is not a recognized fielding position?
A. Silly point
B. Short third man
C. Short extra cover
D. Long twelfth man

117
Question 9: Who won the inaugural T20 World Cup?
A. Australia
B. Pakistan
C. India
D. England
Question 10: The cricket teams play for The Ashes?
A. Australia And South Africa
B. Australia And England
C. England And South Africa
D. New Zealand And Australia

118
Appendix C
Images Requiring Annotation
Kindly create some annotations (labels) for the image shown on this page. The annotations
should be a descriptor of the image from a domain expert point of view and should be
comprehensive enough. These annotations should be similar to the keywords that you use when
you upload an image online or a video on YouTube. Your annotations will be used for
information retrieval (image retrieval). The annotations can be filled in the text area box below.
If no annotations can be filled, please fill "N/A" in the text area box
The forty images are downward interpolated and shown as a group of 10 images.

119
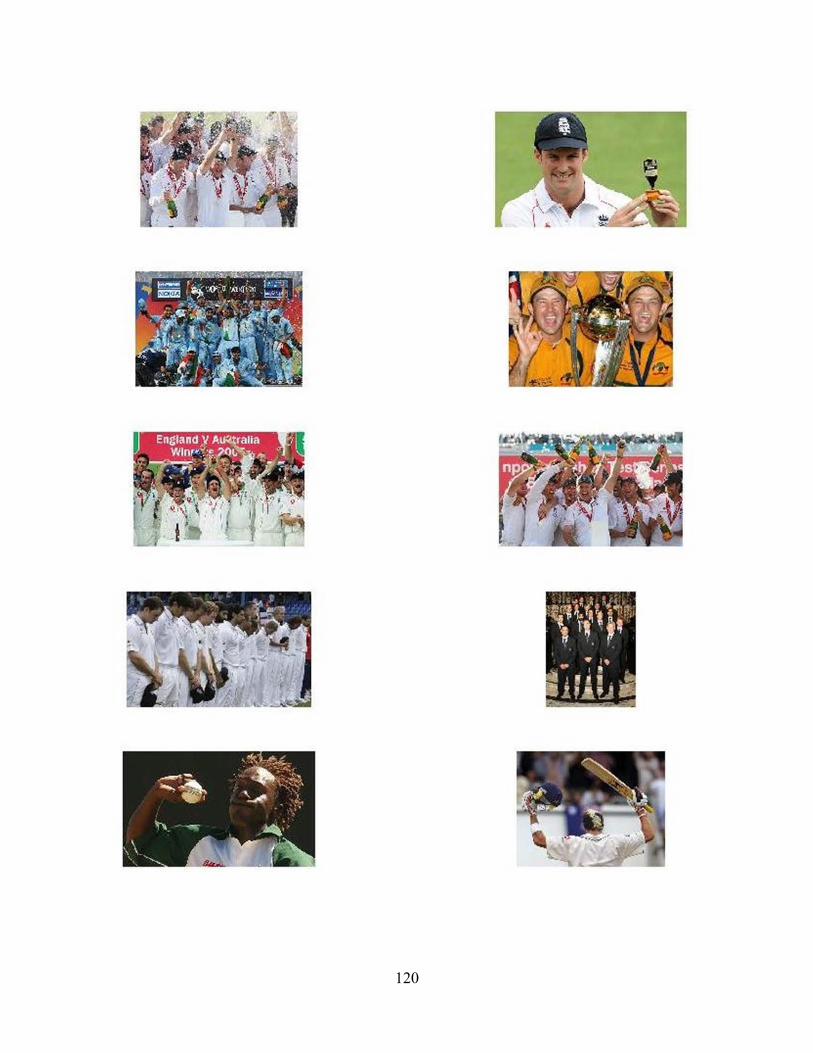
120

121

122

123
References
A. Broder (2002). A Taxonomy of web search. SIGIR Forum, 36(2), 3-10.
A. del Bimbo (1999). Visual Information Retrieval. Morgan Kaufmann, Los Altos, CA.
A. Hanbury (2008). A survey of methods for image annotation. Journal of Visual Languages &
Computing (19, 617-627.
Baeza Yates, Ribeiro Neto (1999). Modern Information Retrieval. ACM Press.
Bryan Burford, Pam Briggs, Guojun Lu, John Eakins (2003). A Taxonomy of the image-
On the classification of Content for Image Retrieval. Visual Communication, 2(2), 123-
161.
Bryan Russell, Antonio Toralba (2008). LabelMe: a data base and web-based tool for image
annotation. International Journal of Computer Vision.
Carson et al. (1997). Region based image querying. Proc of IEEE workshop on Content Based
Access of Image and Video Libraries, 42-49.
Dyson, M.C., Box, H. (1997). Retrieving Symbols from a Database by their Graphic
Characteristics: Are Users Consistent? Journal of Visual Languages & Computing, 8(1),
85-107.
E. Hyvo¨ nen, A. Styrman, S. Saarela (2002). Ontology-based image retrieval. Proceedings of
XML Finland Conference, 27–51.

124
Eakins, J, P. (1996). Automatic image content retrieval - are we getting anywhere. Proc of the
third international conference on Electronic Library and Visual Information Research,
123-135.
Feng Jing, Mingjing Li,Hong-Jiang Zhang, Bo Zhang (2005). A Unified Framework for Image
Retrieval Using Keyword and Visual Features. IEEE Transactions on Image Processing,
14(7), 979-989.
Hrvoje Niksic (2008). GNU Wget. http://www.gnu.org/software/wget/.
I.H. Witten, A. Moffat and T. Bell (1999). Managing Gigabytes: Compressing and Indexing
documents and images. Morgan Kaufmann Publishers.
Ian Ruthven, Mounia Lalmas (2003). A survey on the use of relevance feedback for information
access systems. The Knowledge Engineering Review, 18(2), 95-145.
Jing, X.Y., Wong, H.S., Zhang, D. (2006). Face Recognition based on 2D FisherFace approach. Pattern
Recognition, 39(4), 707-710.
John C Russ (2002). The Image Processing Handbook. Fourth Edition, CRC Press.
John R Smith (1998). Image Retrieval Evaluation. IEEE Workshop on Content-Based Access of
Image and Video Libraries, 21, 112-113.
Jolliffe, I. T. (2002). Principal Component Analysis. Springer, New York.
L. V. Ahn, L. Dabbish (2004). Labeling images with a computer game. Proceedings of ACM
CHI, 319–326.
Lu etal. (2007). Performance Evaulation of Desktop Search Engines. IEEE International
Conference on Information Reuse and Integration, 110-115.

125
M. Turk, A. Pentland (1991). Face recognition using Eigenfaces. Proc. IEEE Conference on
Computer Vision and Pattern Recognition, 586–591.
Manjunath, B, S., Ma, W. (1996). Texture features for browsing and retrieval of large image
data. IEEE Transactions on Pattern Analysis and Machine Intelligence, 18, 837-842.
Masashi Inoue (2004). On the need for annotation-based image retrieval. Workshop on
Information Retrieval in Context, 44-46.
Mehrotra, R and Gary, J. E. (1995). Similar-shape retrieval in shape data management. IEEE
Computer, 28(9). 57-62.
Michael Eziashi Osadebey (2006). Integrated Content Based Image Retrieval using Texture,
Shape and Spatial Information, Master Thesis, Umea University.
Otis Gospodnetic, Erik Hatcher (2005). Lucene in action. Manning Publications.
P.G.B. Enser, C. McGregor (1993). Analysis of Visual Information Retrieval Queries. British
Library Research, and Development Report 6104.
Paul Ekman, Wallace Friesen, Joseph Hager (2002). Facial Action Coding System. The Manual,
Published by Research Nexus division of Network Information Research Corporation,
ISBN 0-931835-01-1
Paul Viola, Michael Jones (2001). Robust Real-Time Object Detection. Second International
Workshop on Statistical and Computational Theories of Vision – Modeling, Learning,
Computing and Sampling.
Remco Veltkamp, Mirela Tanase (2002). Content Based Image Retrieval – A survey. Technical
Report UU-CS-2000-34.

126
S. Shatford (1986). Analyzing the subject of a picture – A theoretical approach. Cataloguing &
Classification Quarterly, 5(3), 39-61.
Soergel, D. (1999). Indexing and Retrieval Performance: The Logical Evidence. Journal of
American Society for Information Science, 45(8), 589-599.
Stan Sclaroff, Marco La Cascia, Saratendu Sethi (1999). Unifying Textual and Visual Cues for
Content Based Image Retrieval on the World Wide Web. Computer Vision and
Understanding, 75(1/2), 86-98.
Steve Smithson (1994). Information Retrieval evaluation in practice: A case study approach.
Information Processing and Management, 30(2), 205-221.
Stricker, M., Orengo, M. (1995). Similarity of color images. Proc. SPIE Storage and Retrieval
for Image and Video Databases, 2, 381-392.
Stricket, M., Dimai, A. (1996). Color Indexing with weak spatial constraints. Proc. SPIE
Storage and Retrieval for Image and Video Databases, 4, 29-40.
Subhashini Ganapathy (2006). Decision Aiding to Support Human Reasoning in Dynamic,
Time-Critical Scenarios. PhD Dissertation.
Swain, M J, Ballard, D. H. (1991). Color indexing. International Journal of Computer Vision,
7(1), 11-32.
Tamura, H. et al (1978). Textural features corresponding to visual perception. IEEE Transactions
on Systems, Man and Cybernetics, 8(6), 460-472.
Xavier Roche (2008). HTTrack Website Copier. http://www.httrack.com/.

127
Y. Chen, J.Z. Wang (2004). Image categorization by learning and reasoning with regions.
Journal of Machine Learning Research, 5, 913–939.
Ying Liu, Dengsheng Zhang, Guojun Lu, Wei-Ying Ma (2007). A survey of content-based
image retrieval with high-level semantics. Pattern Recognition, 40(1), 262-282.
Yong Rui & Thomas S. Huang (1999). Image Retrieval- Current Techniques, Promising
Directions, and Open Issues. Journal of Visual Communication and Image
Representation, 10, 39-62.

128
Curriculum Vitae
EDUCATION Ph.D. in Engineering, Wright State University (WSU) Dayton, Ohio, USA. November 2010 GPA: 3.94 Master of Science in Biomedical Engineering, Wright State University (WSU) Dayton, Ohio, USA. June 2006 GPA: 3.91 Bachelor of Technology in Electronics and Instrumentation Engineering, JNTU Hyderabad, Andhra Pradesh, India. June 2004 GPA: 4.00
AWARDS & HONORS • Founding Member of Wright State University President’s Dream Team Planning Committee, WSU (2009) • Elected Founding Member of Dean’s Student Advisory Board, School of Graduate Studies, WSU (2009) • Dayton Area Graduate Studies Institute scholarship award, WSU (2006‐2009) • Graduate Research Fellowship, WSU (2005‐2008) • Elected Member of Tau Beta Pi Engineering Honor Society, WSU (2007) • Graduate Teaching Assistant Scholarship, WSU (2005‐2007) • Outstanding Teaching Assistant, College of Engineering & Computer Science, WSU (2006) • GOLD medal for placing 1st in Bachelor of Technology course, JNTU, India (2004) • Star of Electronics and Instrumentation award, thesis recognition, JNTU, India (2004) • President, student chapter of Instrument Society of India, JNTU, India (2003)
SOFTWARE SKILLS Programming Languages Matlab, C, C++, Java, PerlWeb Technologies HTML, DHTML, XML, CSS, JavaScript, Adobe Dreamweaver, Adobe
Photoshop, Flash, PHP, Apache, IIS Databases SQL, MS AccessOperating Systems Windows 98/NT/2000/XP, Vista, Windows7, DOS Statistical Tools SAS, JMP IN, SPM, SPSSSimulation Tools Sigma, SimulinkCircuit Simulators Pspice, CircuitMakerVirtual Reality Haptek, Maya, Di‐Guy

129
WORK / RESEARCH EXPERIENCE Research Engineer, Wright State Research Institute, Wright State University Dayton, OH. 06/2009‐Current The Research & Development team at Wright State Research Institute, Wright State University, develops state of art simulations and algorithms for Virtual Standardized Patients, Decision Support Systems, Image processing, Data analytics, and biometric applications that include Face Recognition, Face Intent Recognition, and Fingerprint Matching.
Roles & Responsibilities:
• Designed and developed the framework for the Virtual Standardized Patient utilizing the capabilities of Speech Recognition, Text to Speech and Speech to Text Converters.
• Developed the algorithms for face recognition and matching for biometric applications using the Eigenface method and the Fisherface method.
• Designed and in the process of developing an automatic emotion detection of a person from his speech using the parameter of the pitch of the speech.
• Developed algorithms to detect the facial features that determine the emotional intent of the person from a photograph/video by automatically detecting the Action Units proposed by the Faction Action Coding Units guide.
• Designed and in the process of developing algorithms for text analytics to understand and correlate the patterns in oil refinery mishaps.
Research Associate, Qbase Inc. Dayton, OH. 10/2008‐05/2009 The Research & Development team at Qbase Inc, develops Image Processing algorithms for various applications that include Medical, Geospatial, Surveillance scenarios.
Roles & Responsibilities:
• Designed and developed the data flow for preprocessing of functional MRI (fMRI) images. The flow includes Slice Timing Correction, Head Motion Correction, Multimodal Registration, Segmentation, Normalization and Smoothing.
• Designed and in the process of developing the statistical processing of fMRI images and a frame work for search and retrieval of fMRI images utilizing the features extracted from the images.
• Developed a Duplicate Image Finder application using Principal Component Analysis. • Designed and implemented algorithms for moving object detection, surveillance and anomaly
detection in videos.
Research & Development Intern, Qbase Inc. Dayton, OH. 01/2007‐09/2008 Roles & Responsibilities:
• Developed algorithms for noise removal, intensity normalization, local registration, local contrast enhancement, segmentation and 3D modeling for medical images.
• Researched and documented the entire process of using statistical techniques for fMRI images. • Researched and implemented an algorithm to convert L0 level geospatial images to L1 level images
utilizing the GPS and the IMU coordinates of LO images. • Researched and documented World File format and Geotif format and implemented an algorithm to
convert one format into the other. • Developed algorithms for changing contrast, brightness, gradient, gamma and color curve for
geospatial images. • Developed statistical algorithms for detecting anomalies in numerical data.
130
Graduate Research Assistant, Interactive Systems Modeling and Simulation Lab, Wright State University Dayton, OH. 06/2006 – Present Research Projects & Responsibilities:
• A Human Integrated Approach towards Content Based Image Retrieval (Doctoral thesis In Progress Completed Research Proposal): The goal of the dissertation is to design and implement a novel approach that integrates human reasoning with Content Based Image Retrieval (CBIR) algorithms for image retrieval. By systematically coupling human reasoning and computerized process, an attempt is made to minimize the barrier between the human’s cognitive model of what they are trying to search and the computers understanding of the user’s task. Specifically this approach will be instantiated through an implemented system that aims to reduce the semantic gap between the Annotation Based Image Retrieval (ABIR) and the CBIR techniques, increase the load of human in the loop and learn about the objects embedded in the scene.
• Web Repository Center for Operator Performance: Developed a state of art web repository on the factors that affect the operator performance in process control industries. Some of the factors researched included latest trends in control room design, console design, decision aids, abnormal situation management, valve designs, human errors, biomechanics, teaming etc. The intent of the portal was that the universities/industries can find all the information about various aspects of the human operator performance at a single place and to act as a benchmark and a knowledge base for the research conducted in this field.
• OpenEaagles Simulation Framework: Developed Extensible Architecture for the Analysis and Generation of Linked Simulations (EAAGLES) training material for engineers and computer scientists. The EAAGLES software is a high‐fidelity simulation framework to design and execute robust, scalable, distributed, virtual simulation applications. The framework has traditionally been used to study swarm command‐and‐control strategies in complex multi‐UAV (unmanned aerial vehicles) situations. Developed C++ models for EAAGLES, generated templates to examine interactive strategies in search and rescue situations and designed step‐by‐step presentation material for classroom instruction.
• Web Portal – Tec^Edge: Designed, developed and maintained a web portal to facilitate interaction between multiple stake holders including US Air Force, industry, and academia using web server applications using HTML and JavaScript in MS Access 2000 environment. Trained personnel in the usage of web based applications both individually and in group settings. Designed and developed a distributed web based content management application using Dreamweaver, PHP and MySQL. The objective of the application was to facilitate one‐stop collaboration – cooperation, coordination, and communication – between air force research institute (AFRI) and multidisciplinary joint (government, industry, and academia) teams on wbi‐icc.com. Coordinated and organized focus groups, prepared survey questionnaires for gathering initial user‐requirements and designed user‐interfaces using Human Factors principles.
Graduate Research Assistant, Ultrasound Lab, Wright State University Dayton, OH. 03/2005 – 05/2006 Research Projects & Responsibilities:
• Detection of Pneumothorax using A mode ultrasound: Researched, implemented and documented the detection of Pneumothorax using A mode ultrasound. Pneumothoax is a collection of air in the pleural space which is in between the outer surface of the lung namely the visceral pleura and the inner surface of the chest wall namely the parietal pleura, which results in the collapse of the lung. Ultrasound “A” lines were acquired using the V309 piezoelectric transducer of frequency 5 MHz and the presence of Pneumothorax was detected by the lack of the comet tail artifact on the ultrasound “A” lines.
• Contour Detection: Developed algorithms to detect the contours of the tibia and the fibula bones. Some of the algorithms used were Canny edge detector, Sobel edge detector and Snakes.

131
Graduate Teaching Assistant, Instrumentation Lab, Wright State University Dayton, OH. 03/2005 – 03/2007 Responsibilities:
• Designed and conducted Biomedical Engineering and Biomedical Instrumentation laboratory sessions for senior and graduate students.
• Developed and implemented new teaching strategies on the students to increase the effectiveness of learning and understanding the laboratory sessions.
RESEARCH GRANTS
1. Lexis Nexis, Design and Develop web applications and software packages for websites, by investigating user needs and enhancing the user experience, PI, Funded Amount ‐ $135,182, Oct 2010 – Sept 2011.
2. Web Yoga, Research, Design and Develop a customized Planning, Forecasting, and Reporting System using Hyperion System Planning tool set, PI, Funded Amount ‐ $124,000, Oct 2010 – Sept 2011.
3. Center for Operator Performance, Data Mining of Incident Reports, Co‐PI, Funded Amount‐ $ 37,000, Apr 2010 ‐ Oct 2010.
4. Wright State University, Create a unique 3D Face – Fingerprint Biometric Signature, Co‐PI, Funded Amount‐ $10,000, Sep 2009 – Aug 2012.
5. US Air Force ‐ Advances in Biotechnology and the Biosciences, for Warfighter Performance and Protection, AFRL BAA 05‐02 HE, Co‐PI, Funded Amount‐ $1,600,000, Oct 2008‐Sep 2009.
PATENTS
1. Phani Kidambi, S. Narayanan, Ryan Fendley, Ramya Ramachandran Janaki (2010). “Enhanced Facial
Recognition Decision Support System”, patent application in process. 2. Phani Kidambi, S. Narayanan, Julie Skipper (2010). “Skeletal Scan – A Unique Biometric Signature”,
patent application in process. PUBLICATIONS
1. Phani Kidambi, Mary Fendely, S. Narayanan (submitted 2010). “Performance of Annotation‐Based Image Retrieval”, Advances in Human Computer Interaction.
2. Phani Kidambi, S. Narayanan (submitted 2010). “A Human Computer Integrated Approach towards Content Based Image Retrieval”, Journal of the American Society for Information Science and Technology.
3. Gary Klein, Helen Klein, S. Narayanan, Phani Kidambi (2010). “Modeling Leadership Dynamics in Multinational Environments”, Defense Advanced Research Projects Agency Report.
4. Phani Kidambi, S. Narayanan, Ryan Fendley (2010). "Benchmarking Web Based Image Retrieval". 16th Americas Conference on Information Systems, Lima, Peru.
5. Dhananjai M. Rao, Douglas D. Hodson, Martin Stieger Jr, Carissa B. Johnson, Phani Kidambi, Sundaram Narayanan (2008). “Design and Implementation of Virtual and Constructive Simulations using OpenEaagles”. Linus Publications, ISBN: 1‐60797‐019‐8.
6. Phani Kidambi, Narayanan. S (2008). “A Human Computer Integrated Approach for Content Based Image Retrieval”. Proc. Of 12th WSEAS International Conference on Computers, Heraklion, Greece.
7. Phani Kidambi, Pavan Kumar (2004). “State of the art review on Biometrics”. ISTE Nation Conference on Security, Kurnool, India.
8. Pavan Kumar, Phani Kidambi (2003). “Pneumatic Transmission”. IEEE National Conference on Latest trends in Instrumentation, Hyderabad, India.
KEYNOTE SPEAKER
1 S. Narayanan, Phani Kidambi, Mary Fendley (2009). “Human‐Computer Integrated Reasoning”. 2009
International Conference on Advanced Computing, ICAC 2009 – MIT, Chennai, India.