A Home Security System Based on Smartphone Sensors
44
University of Arkansas, Fayeeville ScholarWorks@UARK eses and Dissertations 5-2018 A Home Security System Based on Smartphone Sensors Michael Mahler University of Arkansas, Fayeeville Follow this and additional works at: hp://scholarworks.uark.edu/etd Part of the Graphics and Human Computer Interfaces Commons , Information Security Commons , and the Soſtware Engineering Commons is esis is brought to you for free and open access by ScholarWorks@UARK. It has been accepted for inclusion in eses and Dissertations by an authorized administrator of ScholarWorks@UARK. For more information, please contact [email protected], [email protected]. Recommended Citation Mahler, Michael, "A Home Security System Based on Smartphone Sensors" (2018). eses and Dissertations. 2816. hp://scholarworks.uark.edu/etd/2816
-
Upload
khangminh22 -
Category
Documents
-
view
1 -
download
0
Transcript of A Home Security System Based on Smartphone Sensors

University of Arkansas, FayettevilleScholarWorks@UARK
Theses and Dissertations
5-2018
A Home Security System Based on SmartphoneSensorsMichael MahlerUniversity of Arkansas, Fayetteville
Follow this and additional works at: http://scholarworks.uark.edu/etd
Part of the Graphics and Human Computer Interfaces Commons, Information SecurityCommons, and the Software Engineering Commons
This Thesis is brought to you for free and open access by ScholarWorks@UARK. It has been accepted for inclusion in Theses and Dissertations by anauthorized administrator of ScholarWorks@UARK. For more information, please contact [email protected], [email protected].
Recommended CitationMahler, Michael, "A Home Security System Based on Smartphone Sensors" (2018). Theses and Dissertations. 2816.http://scholarworks.uark.edu/etd/2816
A Home Security System Based on Smartphone Sensors
A thesis submitted in partial fulfillment of the requirements for the degree of
Master of Science in Computer Science
by
Michael Mahler University of Arkansas
Bachelor of Science in Computer Engineering, 2016
May 2018 University of Arkansas
This thesis is approved for recommendation to the Graduate Council. ____________________________________ Qinghua Li, Ph.D. Thesis Director ____________________________________ ____________________________________ Susan Gauch, Ph.D. Christophe Bobda, Ph.D. Committee Member Committee Member

Abstract
Several new smartphones are released every year. Many people upgrade to new phones,
and their old phones are not put to any further use. In this paper, we explore the feasibility of
using such retired smartphones and their on-board sensors to build a home security system. We
observe that door-related events such as opening and closing have unique vibration signatures
when compared to many types of environmental vibrational noise. These events can be captured
by the accelerometer of a smartphone when the phone is mounted on a wall near a door. The
rotation of a door can also be captured by the magnetometer of a smartphone when the phone is
mounted on a door. We design machine learning and threshold-based methods to detect door
opening events based on accelerometer and magnetometer data and build a prototype home
security system that can detect door openings and notify the homeowner via email, SMS and
phone calls upon break-in detection. To further augment our security system, we explore using
the smartphone’s built-in microphone to detect door and window openings across multiple doors
and windows simultaneously. Experiments in a residential home show that the accelerometer-
based detection can detect door open events with an accuracy higher than 98%, and
magnetometer-based detection has 100% accuracy. By using the magnetometer method to
automate the training phase of a neural network, we find that sound-based detection of door
openings has an accuracy of 90% across multiple doors.

Contents
I. INTRODUCTION............................................................................................................. 1
A. OVERVIEW ....................................................................................................................... 1
B. CONTRIBUTIONS .............................................................................................................. 4
C. ORGANIZATION OF THIS THESIS ....................................................................................... 4
II. LITERATURE REVIEW ............................................................................................. 6
III. SYSTEM DESIGN ........................................................................................................ 9
A. SYSTEM OVERVIEW ......................................................................................................... 9
B. ACCELEROMETER-BASED DETECTION ............................................................................ 11
1. A Naive Detection Algorithm ..................................................................................... 11
2. K-Nearest Neighbors + Dynamic Time Warping ....................................................... 12
3. Feedforward Neural Network .................................................................................... 14
C. MAGNETOMETER-BASED DETECTION ............................................................................. 15
D. AUDIO-BASED DETECTION ............................................................................................. 16
1. Using Raw Samples ................................................................................................... 17
2. Using a Spectrogram ................................................................................................. 18
IV. IMPLEMENTATION ................................................................................................. 19
A. PHONE SOFTWARE ......................................................................................................... 19
B. SMARTPHONE CASE ....................................................................................................... 19
C. NOTIFYING THE HOMEOWNER ........................................................................................ 20
V. EVALUATION ............................................................................................................... 22
A. EXPERIMENTAL METHODOLOGY .................................................................................... 22

B. DETECTION ACCURACY.................................................................................................. 22
C. FIELD TESTS .................................................................................................................. 26
D. MODELING VIBRATION DISSIPATION .............................................................................. 27
E. DOOR PROXIMITY & INTERFERENCE ............................................................................... 29
F. DETECTING OTHER MOTION EVENTS .............................................................................. 29
G. COST EVALUATION ........................................................................................................ 30
1. Processing Time ........................................................................................................ 30
2. Memory Usage .......................................................................................................... 31
3. Network Usage .......................................................................................................... 31
4. Power Consumption .................................................................................................. 31
VI. CONCLUSION & FUTURE WORK ......................................................................... 33
REFERENCES ....................................................................................................................... 35

List of Figures
Figure 1. Raw Vibration Data for Door Open Event .............................................................
Figure 2. Device Motion Axes ................................................................................................
Figure 3. Spectrogram Generated on Smartphone ..................................................................
Figure 4. Air Pressure Fluctuations for Door Event with Windows Closed ..........................
Figure 5. Air Pressure Fluctuations without Any Door Events ..............................................
Figure 6. Air Pressure Fluctuations for Door Event with Windows Open..............................
Figure 7. SecureHouse System Architecture...........................................................................
Figure 8. Vibration Signature for Door Open Event..............................................................
Figure 9. Representation of FFNN Nodes.............................................................................
Figure 10. Magnetic Field Measurements of Door Event.......................................................
Figure 11. Raw Audio Samples of Door Open Event.............................................................
Figure 12. Smartphone Wall Mount........................................................................................
Figure 13. Example Notifications............................................................................................
Figure 14. Vibration-based, Naïve Method.............................................................................
Figure 15. Vibration -based, FFNN, 60% Assurance..............................................................
Figure 16. Vibration -based, FFNN, 75% Assurance..............................................................
Figure 17. Vibration-based, KNN+DTW................................................................................
Figure 18. Magnetometer-based, 2uT Threshold....................................................................
Figure 19. Spectrogram-based, 3 Week Training....................................................................
Figure 20. Overall Detection Rate..........................................................................................
Figure 21. Spectrogram of Door Opening While Car Passes.................................................
Figure 22. Spectrogram of Door Opening with Footfall in Background................................
3
3
5
6
6
7
9
14
15
16
17
20
21
23
23 23 23 24 24 24 25
25

Figure 23. Model of Vibration Dissipation in Drywall..........................................................
Figure 24. Experimental Setup for Modeling Vibration Dissipation.....................................
28
28

1
I. INTRODUCTION
A. Overview
Mobile hardware is evolving at an extremely fast pace. Most big smartphone vendors
produce a new smartphone every year, causing many users to upgrade to a new device every year
or two. In particular, iPhone sales have nearly tripled in the last five years [1]. Most of these
retired devices still function as expected save for some scratches or cracks, but are ignored until
either recycled, sold at a fraction of the initial cost, or thrown away. This leads to the all-too-
common “smartphone graveyard”- a place where old phones collect dust indefinitely. These
retired smartphones are almost always equipped with highly sensitive motion capture chips.
Though less frequently mentioned, these devices are also equipped with triple-axis
magnetometers which are used for analyzing the device’s orientation with respect to Earth’s
Magnetic North Pole. And, of course, these phones are all equipped with microphones.
Personal, small-scale home security systems are becoming increasingly popular. Most
professional systems, however, cannot be installed by the end-user and come with a large upfront
cost as well as recurring costs such as annual fees. ADT, a professional home security company,
charges upwards of $600 annually for their most popular home security package in addition to
installation fees which can run as high as $1,600 [2]. Though a smartphone-based home security
system would not be a smart investment to purchase all at once, the retired phones mentioned
earlier can be used as a home security system without purchasing any new hardware. Since most
users are already familiar with the hardware and software of smartphone, it would be easy for
them to set up and use a smartphone-based home security system in their homes. While several
smartphone-based home security solutions exist, most of them use the device’s camera to
monitor events within the camera’s field of view. These solutions have considerable drawbacks

2
such as poor lowlight performance, using large amounts (several gigabytes) of storage, and the
inability to detect break-in related events out of its field of view. Different from existing work,
we study the feasibility of building a home security system based on smartphone accelerometers,
magnetometers and microphones. Specifically, we will detect door and window opening events
using the device’s accelerometer, magnetometer, and microphone [23].
When a door is opened or closed, some of the kinetic energy transfers into the walls
surrounding the door. The iPhone 4’s accelerometer, with a maximum sensitivity of 1 mg/digit
[3], has been proved to be capable of detecting keystrokes on a keyboard with an accuracy as
high as 80% [4][24][25]. With this level of sensitivity, the six-year-old iPhone 4 is more than
sensitive enough to detect vibrations in a wall caused by door activity. Newer phone models
usually have as good or better sensitivity. Figure 1 shows our observation of vibrations caused by
a door opening captured by accelerometer. This initial data was obtained by simply opening a
door while an iPhone 6 mounted to the wall nine inches from the door recorded vibrations. It can
be seen that door events emit distinguishable vibrational patterns. Most noticeably, when the
device is mounted near a door in portrait orientation, door-related vibrations captured by the on-
board accelerometer are especially large along the z-axis. Figure 2 shows a graphical
representation of how the three motion axes are related to the orientation of the device. In
addition to the accelerometer, the magnetometer can also be used to monitor the rotation of a
door and detect door openings. By mounting a smartphone on a door (e.g., near the hinge) and
monitoring the change in magnetic fields passing through the device, door events can be easily
detected. We reference Earth’s Magnetic North to determine how far the door has rotated -
essentially using the smartphone as a compass needle while the door is the compass body. This

3
method is less likely to produce false detection of door openings under environmental noise,
although it cannot detect other events such as window openings when mounted on the door.
Though the accelerometer and magnetometer are very capable of detecting door open
events, their effectiveness is closely tied to the phone’s proximity to the door. With this in mind,
we explore the possibility of using the phone’s built-in microphone to detect the sounds of door
openings. This approach allows us to place the phone in a more centralized location and monitor
more than one door at a time. We use a neural network that specializes in categorizing images to
classify spectrograms generated by the device. Figure 3 shows an example of one such
spectrogram. Because each door has a relatively unique and distinct audio signature, we found it
necessary to train the model on each door.
In this thesis, we explore several methods to use a smartphone’s embedded
accelerometer, magnetometer, and microphone to reliably detect door and window openings and
propose a home security system (named SecureHouse) for break-in detection and notification
Fig. 1: Raw Vibration Data for Door Open Event Fig. 2: Device Motion Axes

4
[23]. Upon event detection, the detecting smartphone can send a customizable notification to the
homeowner via short message, email, and/or telephone call.
B. Contributions
The contribution of this thesis is summarized as follows:
1. We propose SecureHouse, a home security system based on smartphone sensors. To the
best of our knowledge, this is the first study that detects door openings for home security
purposes using the on-board accelerometer, magnetometer, and microphone of a
smartphone.
2. We propose two machine learning methods to detect door openings using accelerometer
data and one threshold-based method to detect door openings using magnetometer data.
We also propose a machine learning method to detect door openings using sound.
3. We implement a prototype home security system. The system contains a mobile app
which runs on a wall-mounted phone that can efficiently interpret sensor data and
asynchronously dispatch notifications using its Wi-Fi connection, a 3D printed modular
smartphone case specifically designed to capture vibrations in a wall, and a threat
response server that sends out alerts to the homeowner in the form of text messages,
emails, and phone calls.
4. We evaluate the system’s effectiveness to detect door events using extensive
experiments.
C. Organization of This Thesis
The remainder of this thesis is as follows. Chapter II presents related work. Chapter III
presents the design of our system including system architecture and detection methods. Chapter

5
IV describes our prototype implementation. Chapter V describes our experimental methodology
and evaluation results. Chapter VI concludes the paper.
Fig. 3: Spectrogram Generated on Smartphone. Amplitude is
represented by color and ranges from red to violet. To make the figure easier to read, we have replaced the red hues with
white.

6
II. LITERATURE REVIEW
Wu et al. [5] propose a scheme to detect door events using the built-in barometer found in
some modern smartphones. The key principle behind their work is that modern heating,
ventilation and air condition (HVAC) systems maintain a constant pressure difference between
inside and outside. Thus, when a door is opened, a sudden and recognizable change in barometric
pressure occurs. We conducted experiments of our own using their methods and saw very similar
results in a three-bedroom house. Specifically, we measured the fluctuation in pressure inside a
home when a door is opened and closed. Figure 4 shows a clear change in pressure caused by
door movement compared to background noise shown in Figure 5. However, the system can be
rendered ineffective if the home has an open window since the air pressure inside and outside a
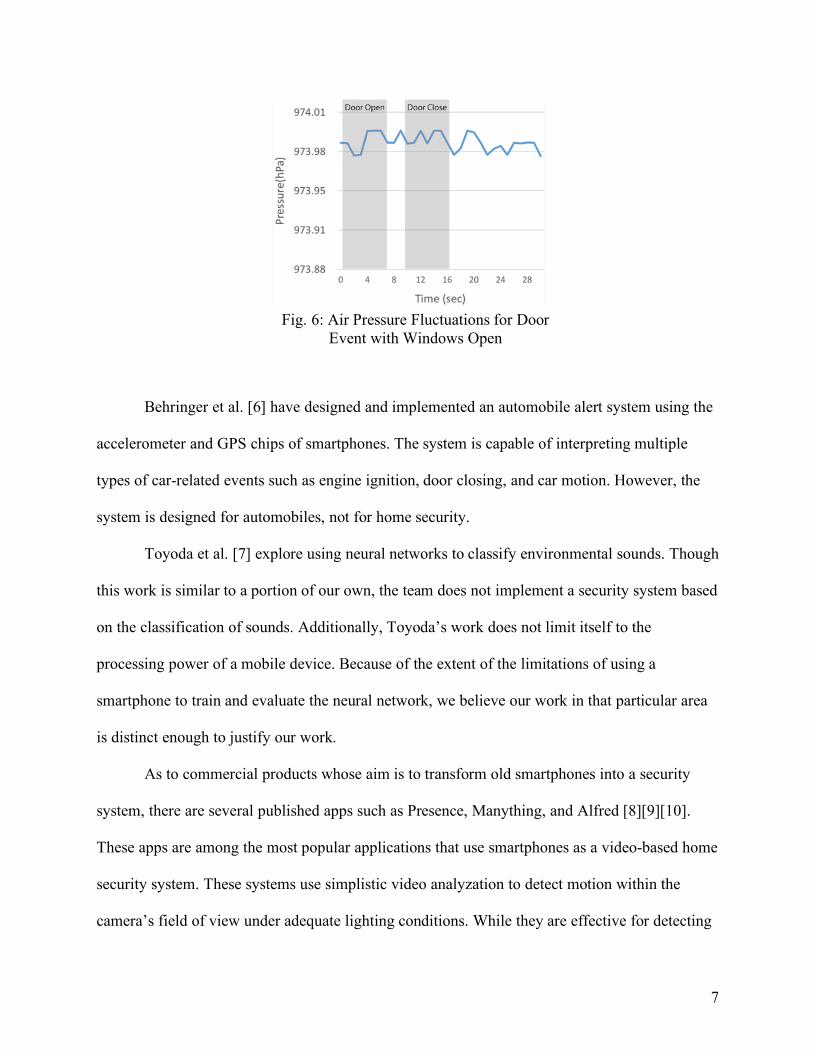
home will be the same in that case. Figure 6 shows barometer readings from a door event when
two windows are open. We no longer see the distinguishable curve similar to Figure 4, and the
barometer readings become close to background noise shown in Figure 5. This is especially
relevant where a homeowner might leave a window open while she is away (e.g., a window has
metal bars on it and thus the homeowner considers it safe to leave the window open).
Fig. 4: Air Pressure Fluctuations for Door
Event with Windows Closed Fig. 5: Air Pressure Fluctuations without
Any Door Events (noise)
7
Behringer et al. [6] have designed and implemented an automobile alert system using the
accelerometer and GPS chips of smartphones. The system is capable of interpreting multiple
types of car-related events such as engine ignition, door closing, and car motion. However, the
system is designed for automobiles, not for home security.
Toyoda et al. [7] explore using neural networks to classify environmental sounds. Though
this work is similar to a portion of our own, the team does not implement a security system based
on the classification of sounds. Additionally, Toyoda’s work does not limit itself to the
processing power of a mobile device. Because of the extent of the limitations of using a
smartphone to train and evaluate the neural network, we believe our work in that particular area
is distinct enough to justify our work.
As to commercial products whose aim is to transform old smartphones into a security
system, there are several published apps such as Presence, Manything, and Alfred [8][9][10].
These apps are among the most popular applications that use smartphones as a video-based home
security system. These systems use simplistic video analyzation to detect motion within the
camera’s field of view under adequate lighting conditions. While they are effective for detecting
Fig. 6: Air Pressure Fluctuations for Door Event with Windows Open

8
general motion inside the home, their fundamental limitation is that a camera cannot detect
motions out of its field of view and it requires good lighting conditions which likely are not
available at night. Also, these systems can generate a large amount of data (more than 200GB
[11] encoded as H.264 [12] at 1080p) each day which needs to be stored somewhere. Storing this
data on the device itself is not practical because most mobile devices have between 16GB and
256GB of local storage. Naturally, these systems propose a solution by storing video on the
cloud. In particular, Manything charges a Cloud Recording fee of $5.99 per month to be able to
view past recorded events. This additional expense combined with the limited field of view and
lighting requirements of a camera show that new technologies are needed.

9
III. SYSTEM DESIGN
A. System Overview
As shown in Figure 7, our system has three components: a wall-mounted smartphone, a
response server, and the homeowner’s smartphone. The wall-mounted smartphone detects door
opening events and dispatches a notification request to the response server. The response server
sends out notifications to the homeowner via email, text message, and/or phone calls. Finally, the
homeowner’s smartphone receives the notifications and alerts the homeowner.
There are a total of six major software modules in our detection system; four in the wall-
mounted device (included in one app) and two in the cloud-based threat response server. The
homeowner’s smartphone does not require any other apps to be installed since the notifications
Fig.7: SecureHouse System Architecture

10
arrive as text messages, phone calls, or emails which are already supported in nearly every
smartphone.
For door opening detection, vibrational or magnetic field data is captured by the raw
motion manager. This module is responsible for reading and interpreting raw acceleration and
magnetic field data and audio samples. Thirty times per second, the manager pre-processes the
motion sensor data and sends it to the threat detection module. This module implements a sliding
window or acts as a data passer depending on the detection algorithm. For accelerometer-based
detection via neural network and k-nearest neighbors (see Chapter III-B), the threat detection
module asks the A.I. module for an interpretation based on the last 30 samples (1s) of data. For
magnetometer-based detection (see Chapter III-C), the detection module simply performs the
basic calculations and checks against a threshold to detect a door opening. Upon detection, the
detection module notifies the threat response module, which decides the appropriate action to
take based on certain conditions of the device such as whether the alarm function is turned on,
internet connectivity, and user preference. When the alarm function is turned on and under
normal circumstances, the threat response module will send an HTTP request to the Threat
Response Server. The HTTP request will indicate what type of event happened and the
homeowner’s preferred ways of notifications such as email, SMS, phone call, or a combination
of them. In the case of Wi-Fi connectivity issues, the threat response module will play a loud
alarm sound in an attempt to deter intruders. Under normal circumstances, the alert system will
not play an alarm since this may panic the intruder- which could cause the intruder to become
reckless, cause damage, and/or escape. The homeowner can disable the alarm when she is at
home awake. She can turn on the alarm function before she goes to sleep or when she leaves
home.

11
Our Threat Response Server is designed to run on any server capable of running Node.js
programs. There are many such services available including free services. Our prototype system
(see Chapter IV) is hosted by Heroku [13], a free third-party cloud application hosting platform.
Several other free Node.js hosting solutions are available, such as IBM Bluemix [14], OpenShift
[15], and Amazon Web Services (AWS). Incoming network requests (generated by the wall-
mounted smartphone) are handled by the server’s network request module. This module is
simply responsible for handling and parsing incoming HTTP requests. After a network request
has been processed, this module sends a message to the server’s notification module, which will
send out the alert according to the HTTP request. Though it is technically possible to use a home
computer to perform this function, using an external server has a few important advantages.
First, a user may want to change their notification preferences or silence the alarm while away
from home. This can be easily done with an external server. However, for this to happen with a
server at home, the homeowner would need to set up port forwarding on their router at home.
This process is usually a little too technical for the average homeowner, and would be a
detriment to the ease of installation of our system. Additionally, if any data related to a break-in
is stored on the Threat Response Server, a burglar could potentially steal the server from the
home and destroy some key pieces of evidence.
B. Accelerometer-Based Detection
1. A Naive Detection Algorithm
Before going to our proposed learning-based algorithms, we describe a naive detection
algorithm. Being very simplistic in nature, the algorithm raises the alarm if and only if the
vibration intensity (Vi) of each vibrational axis falls between a specific range α and β:

12
αx < Vi(x) < βx
αy < Vi(y) < βy
αz < Vi(z) < βz
This method does not use any sort of data queue or sliding window. It just checks every
incoming value independently at 30Hz. The lower threshold α helps ensure that only
significantly strong vibrations are considered - thus filtering out ambient and static noise. The
upper threshold β helps filter stronger types of environmental noise such as the homeowner’s
footfall. In particular, since footfall and other vibrational noise affects all axes nearly equally
while door openings affect primarily the z-axis, the upper thresholds βx and βy are substantially
smaller in magnitude than βz to filter such noise. This approach has several drawbacks. Since the
thresholds are door-dependent and obtaining them takes several minutes of fine-tuning, it is
nontrivial and annoying for the homeowner to find an effective set of lower and upper thresholds
for each door upon installation. Moreover, it performs significantly worse than more advanced
algorithms as to be shown later.
2. K-Nearest Neighbors + Dynamic Time Warping
K-nearest neighbors is a simple machine learning algorithm that classifies an unknown
data point based on the classification of a certain number of “nearby” data points. For example,
in 2-dimensional space, the distance between an unclassified point p and all other classified
points is calculated. Then, we look at k points that are nearest to p and perform a majority vote.
For our purposes, however, we are using a series of 90 points (thus, 90-dimensional space).
These 90 data points represent any one-second window of vibrational data along three axes
captured at 30Hz. To help keep our datasets consistent and to allow our models to be trained
13
more effectively (especially for the neural network in III-B.3), our raw accelerometer data points
are converted to a positive value (Vi) and then normalized from -1 to 1 (through dividing the
value by the maximum recorded value, multiplying it by 2, and then subtracting 1). Lastly, we
decouple the different axes from time such that the new curve takes the form of:
Vs = < x1…x30, y1…y30, z1…z30>
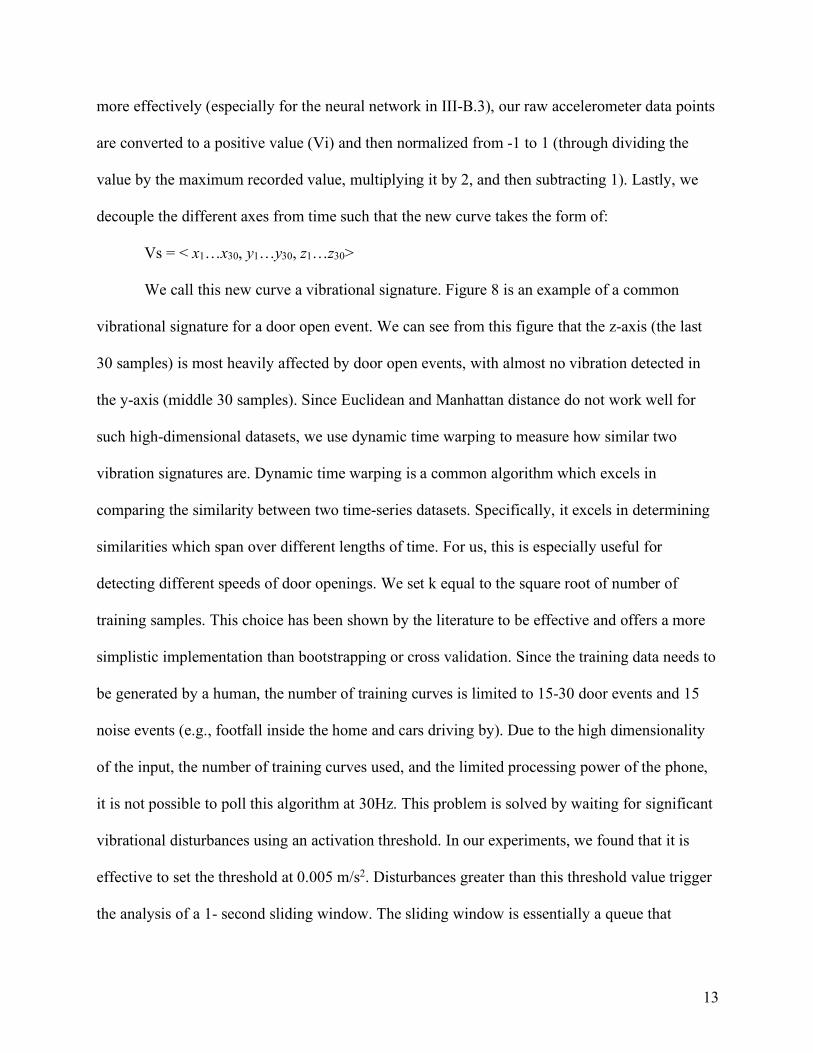
We call this new curve a vibrational signature. Figure 8 is an example of a common
vibrational signature for a door open event. We can see from this figure that the z-axis (the last
30 samples) is most heavily affected by door open events, with almost no vibration detected in
the y-axis (middle 30 samples). Since Euclidean and Manhattan distance do not work well for
such high-dimensional datasets, we use dynamic time warping to measure how similar two
vibration signatures are. Dynamic time warping is a common algorithm which excels in
comparing the similarity between two time-series datasets. Specifically, it excels in determining
similarities which span over different lengths of time. For us, this is especially useful for
detecting different speeds of door openings. We set k equal to the square root of number of
training samples. This choice has been shown by the literature to be effective and offers a more
simplistic implementation than bootstrapping or cross validation. Since the training data needs to
be generated by a human, the number of training curves is limited to 15-30 door events and 15
noise events (e.g., footfall inside the home and cars driving by). Due to the high dimensionality
of the input, the number of training curves used, and the limited processing power of the phone,
it is not possible to poll this algorithm at 30Hz. This problem is solved by waiting for significant
vibrational disturbances using an activation threshold. In our experiments, we found that it is
effective to set the threshold at 0.005 m/s2. Disturbances greater than this threshold value trigger
the analysis of a 1- second sliding window. The sliding window is essentially a queue that

14
contains only the most recent 90 samples (one second at 30Hz for three axes) of accelerometer
data.
3. Feedforward Neural Network
In machine learning, artificial neural networks (ANNs) are known for the similarities they draw
from biological brains. Instead of using neurons, an ANN uses sets of interconnected nodes.
These nodes are separated into three main categories: input, hidden, and output. ANNs are
generally known for their ability to generate nonlinear models based on high-dimensionality
input data. Specifically, we use a feedforward neural network (FFNN). This means that data
passes through the sets of nodes going in one direction only and there are no cycles allowed in
the node graph. Figure 9 shows a graphical representation of what a generic feedforward neural
network looks like at a high level. We choose to use an FFNN since its training phase happens
all at once in the beginning of the program execution and because generating output from the
model is very time-efficient. This benefit allows us to poll the FFNN at 30Hz on a resource
limited smartphone.
Fig. 8: Vibration Signature for Door Open Event

15
For each door, a neural network is trained using 90-dimensional input data - exactly one
second of 3-dimensional vibration data being captured at 30Hz. Due to the input requirements
when training and evaluating the neural network, we use a vibration signature as defined above
for our inputs instead of raw vibration data. We find that when using 90-dimensional data, using
60 hidden nodes (90 ∗ 2/3) as suggested by Hundley [16] works well. We use one output node
which simply returns a float value between 0 and 1. Values closer to 0 correspond to a lower
chance of the interpreted data being a door event, while values closer to 1 correspond to a higher
chance of a door event. Throughout this paper, we refer to this interpretation of the output value
as the assurance of a door opening event. For example, if the assurance of the FFNN is set to
60%, we classify any output greater than or equal to 0.6 to be a door open event. Due to the
prediction efficiency of this algorithm, we were able to use the same sliding window approach
mentioned above to analyze a new vibrational signature every 0.03 seconds (30Hz).
C. Magnetometer-Based Detection
Figure 10 shows raw magnetometer data for a door open and close event. We see large,
easily recognizable curves during the time the door is opening and closing. Very little jitter is
seen in the magnetometer’s readout, and practically no amount of vibrational interference would
Fig.9: Representation of FFNN Nodes

16
cause the readout to be significantly distorted. Though it may be possible for an attacker to use a
strong magnet to interfere with the magnetometer, this would still alert the user because we do
not use an upper threshold for event detection. Next, we look at a realistic threshold to trigger the
detection. Since the data for a door event is easy to recognize, we simply use a threshold value to
detect door events. We found that a difference of 2µT between the current value and the value
when the door is closed worked well as a threshold to detect door events. Because Earth’s
magnetic field may differ from location to location, this approach will need to be
calibrated/zeroed when installed in different locations. Different from the naive vibration-
threshold method mentioned above, the homeowner does not need to fine-tune this system. He
can simply hit an on-screen button while the door is closed to “zero” the magnetometer.
D. Audio-Based Detection
In this section, we will present our audio-based detection method. For this, we created two
implementations. The first implementation used raw audio samples, was very naïve and overall
much less effective. Our second approach involved generating a spectrogram and using that for
Fig.10: Magnetic Field Measurements of Door Event

17
classification in a neural network. This approach worked significantly better, and we focus on
this approach for our evaluation.
1. Using Raw Samples
A naïve approach to classifying sound is to feed the raw audio waveform directly into a
neural network. Figure 11 shows an example of what raw audio samples look like when a door is
opened. Though we can clearly see when the door is opened, there is a lot of jitter and oscillation
in the signal. The main issue with this approach was that the lowest acceptable sample rate was
around 8 KHz. This means when we analyze one second of audio, we have 8,000 samples to
format and classify. Given the limited processing power of the smartphone and the relative
inefficiency of Hundley’s neural network library, this approach turned out to be too much for the
phone’s processor to handle. Nonetheless, we continued to lower the sample rate until the
smartphone was able to process the signal in real-time. At 2 KHz, the phone was finally able to
keep up with the influx of data, but the audio quality was so poor that the detection accuracy was
reduced to less than 20%.
Fig.11: Raw Audio Samples of Door Open Event
18
2. Using a Spectrogram
In this approach, we convert the raw audio samples into a spectrogram using Apple’s UIKit
framework. Generally, spectrograms are used to represent the amplitudes of many frequencies
over time [26][27][28]. Using a spectrogram, we can see a clear, distinguishable, and unique
signal when the door is opened. To further increase the chance of success in this approach, we
decided to abandon Hundley’s neural network library in favor of Apple’s recently released
CoreML library [17]. This library is much more efficient, as it was specifically designed by
Apple to take full advantage of the ARM architecture found in all Apple smartphones. This
approach works by holding raw samples in a circular buffer and executing the spectrogram-
generation and classification function on the buffer four times per second. In order to create a
spectrogram, we first performed a Fast Fourier Transform (FFT) on the raw audio samples. From
there, we normalize, filter, and crop the results to remove the mirrored data produced by the FFT.
Finally, we can use Apple’s UIKit to draw the spectrogram pixel by pixel. To visually represent
amplitude, we simply mapped the amplitude to “hue” in the HSV color representation scheme,
keeping saturation (S) and value (V) fixed at 100%.
Perhaps one of the most beneficial aspects of this detection method is its ability to self-train
using the magnetometer as a ground truth. During the training phase, the phone is mounted on
the door while the magnetometer provides a reliable way to distinguish noise events from door
events. When SecureHouse is first deployed, the user only needs to mount the device on the door
for a short time during which the neural network is trained. Afterwards, she is free to move the
smartphone into a more central and less obtrusive location or continue training with more and/or
different doors.

19
IV. IMPLEMENTATION
To demonstrate the effectiveness of our solution, we implemented SecureHouse as a
prototype system. The following section describes some of the details and choices we made in
the implementation phase.
A. Phone Software
Our detection system was written in Swift 2.3, compiled and tested using Xcode 7, and
finally deployed on an iPhone 6 and 6S. We implemented our KNN+DTW algorithm from
scratch, while our neural network was based on Collin Hundley’s Swift AI library [16]. Because
of the inefficacies of Swift AI, we were forced to use Apple’s CoreML library when dealing with
microphone data. In order to capture acceleration and magnetic field data programmatically, we
used a low-level framework called Core Motion [18]. This library allows us to read the phone’s
acceleration and magnetic field data at a rate up to 100Hz. In order to conserve battery life and
processing power, we chose to set 30Hz as the reading frequency. To capture sound, we used
Apple’s AVKit. This allowed us to capture and store individual audio frames from which we
generated a spectrogram.
B. Smartphone Case
Additive manufacturing enables us to fabricate a smartphone mount specifically to suit
our needs. Figure 12 shows a computer-generated model of the phone mount in its design phase
and an image of the actual mount in use near a door. The case features a large back plate and
screw holes so that it can be mounted on a wall near a door. The case’s large flat back plate
serves two purposes. The first being an easy way to attach the plate to the wall via the four screw
holes. Second, and more importantly, because of its hardness and multiple contact points over a

20
large surface area, it is able to mitigate vibrational dampening that may happen as vibrations
transfer from the wall to the phone.
Though the mount is designed to be a permanent installation, the phone itself can be slid
in and out of the mount with relative ease in the event of replacement, physical service, or
reprogramming. We do not consider the ability to remove the phone from its mount a deficiency
in its security system duties, as an attacker would need to already be inside the home to remove
the phone from its mount.
C. Notifying the Homeowner
For simplicity and to allow a rapid development of this prototype system, our
implementation of texting and calling uses Twilio [19], a third-party service that allows us to
send texts and make phone calls by simply making an HTTP request. We also used an open
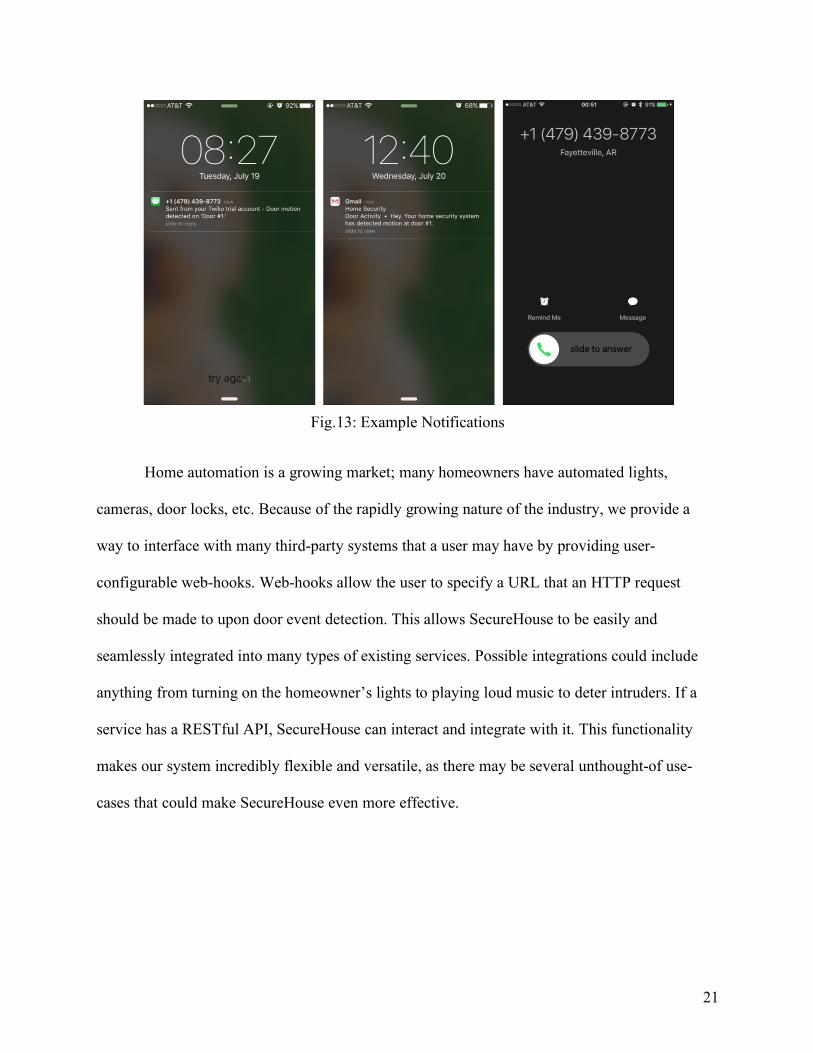
source library called “nodemailer” that allows a Node.js server app to easily send emails. Figure
13 shows examples of alerts received by a homeowner in the form of a text message, an email,
and a phone call.
Fig.12: Smartphone Wall Mount
21
Home automation is a growing market; many homeowners have automated lights,
cameras, door locks, etc. Because of the rapidly growing nature of the industry, we provide a
way to interface with many third-party systems that a user may have by providing user-
configurable web-hooks. Web-hooks allow the user to specify a URL that an HTTP request
should be made to upon door event detection. This allows SecureHouse to be easily and
seamlessly integrated into many types of existing services. Possible integrations could include
anything from turning on the homeowner’s lights to playing loud music to deter intruders. If a
service has a RESTful API, SecureHouse can interact and integrate with it. This functionality
makes our system incredibly flexible and versatile, as there may be several unthought-of use-
cases that could make SecureHouse even more effective.
Fig.13: Example Notifications

22
V. EVALUATION
A. Experimental Methodology
The accelerometer-based experiments were conducted by mounting a smartphone on
lightly textured drywall approximately 9 inches away from the latching mechanism of an exterior
door. During the magnetometer experiment, the phone was mounted on the door itself near the
hinge so that the phone would rotate when the door was opened or closed. For sound-based
experiments, the phone was placed in a central location within direct line-of-sight of two exterior
doors. The experiments were conducted in a 3-bedroom residential home approximately 20 feet
away from the nearest road. Three types of vibrational noise scenarios were accounted for:
ambient noise, walking noise, and automobile noise. Ambient noise was considered dead silence
i.e. no external movement of any sort was present during the test. Automobile noise was
generated by an automobile driving up and down the road closest to the house. Walking noise
included normal to heavy footfall of people in the house during the trials. For acoustic noise, we
considered loud footfall, talking, and automobile noise. Additionally, different speeds of door
openings were accounted for. We considered three different types of door open speeds: slow,
normal, and fast. We used a video camera and stopwatch to record and measure how long it took
for a door to clear the door jamb at different opening speeds. Slow door events were classified as
any door event in which the door took more than 0.6 seconds to clear door jamb. Normal events
took between 0.3 and 0.6 seconds. Fast door open events consisted of any door events in which
the door took less than 0.3 seconds to clear.
B. Detection Accuracy
Figures 14, 15, 16, 17, 18, and 19 show the detection rates for several series of door
openings under various conditions using various detection methods. Detection rate is defined as

23
the number of detected door openings divided by the total number of door openings. Here each
result is the average of 50 independent tests. For the FFNN method, we ran tests with two
different assurance values, one at 60% and one at 75%. For the microphone method, we trained
the model organically for three weeks (i.e. the phone was mounted on the door for three weeks
during the training phase). Figure 20 shows the overall detection rate for all tests.
Fig.14: Vibration-based, Naïve Method
Fig.15: Vibration-based, FFNN, 60% Assurance
Fig.16: Vibration-based, FFNN, 75% Assurance
Fig.17: Vibration-based, KNN + DTW

24
Among the tested algorithms, the naive threshold-based detection using accelerometer
data performs the worst, especially when the door is opened slowly. Its overall detection rate is
61%. The high failure rate of this system is due to our derived threshold values. Though a wider
threshold would produce a higher detection rate, the increase in sensitivity would severely hinder
its ability to filter false positives. The magnetometer-based detection performs the best with a
detection rate of 100%, which is consistent with intuition since rotation of the door is significant
when a person enters the house. The FFNN method (when assurance is set as 60%) and the
KNN+DTW method also have a very high detection rate of 98%. The two machine learning
methods perform similarly when the door is opened fast and when the door is opened at normal
Fig. 20: Overall Detection Rate
Fig.18: Magnetometer-based, 2uT Threshold
Fig.19: Spectrogram-based, 3-Week Training time.

25
speed. The performance is a little lower when the door is slowly opened. For them, the different
types of noise do not have much impact on detection rate when the door is normally or quickly
opened, but have a little effect when the door is slowly opened.
For audio spectrogram-based detection, we see good performance under ideal
circumstances. We notice that walking noise affects the detection accuracy more than automobile
noise. This is expected, as walking produces more impulse-like sounds compared to the
continuous “humming” sounds of nearby vehicles. Figure 21 shows an example of what a door
opening looks like when a car drives by. We can see that automobile noise is mostly filtered until
the door opens. Figure 22 shows an example of footfall in the home while a door opens. The
sharp “spikes” are footsteps while the large colorful area in the center is the door opening.
.
Table I shows the results of false detections caused by knocking on the door. For this test,
we considered two intensities of a knock - light and heavy, and the number of knocks which
occurred - 1 or 2+. It can be seen that the magnetometer has complete immunity to noise, while
Fig. 21: Spectrogram of Door Opening While Car Passes
Fig. 22: Spectrogram of Door Opening with Footfall in Background

26
KNN+DTW is only moderately affected by heavy door knocks. A single heavy door knock is the
more likely to produce a false positive than other knocks.
TABLE I: False Positives Caused by Knocking on Door
FFNN Light
Knock
FFNN Heavy Knock
KNN+DTW Light
Knock
KNN+DTW Heavy Knock
Magnetometer Light Knock
Magnetometer Heavy Knock
Spectrogram Light Knock
Spectrogram Heavy Knock
1 Knock 1/20 8/20 0/20 4/20 0/20 0/20 0/20 0/20
2+ Knocks 0/20 5/20 0/20 1/20 0/20 0/20 0/20 0/20
C. Field Tests
In addition to the 2,700 door openings performed above, we also let the system operate in
a residential 3-bedroom home for short-term period 24 hours and a long-term period of 7 days.
We conducted the 24-hour long test first to quickly determine which methods are most effective
in a real-life scenario. We then used the top performing vibration-based detection method in our
week-long experiment. We define false positives (FP) in these tests as any event that the device
interprets as a door opening which was not a door opening. Table II shows the number of false
positives during the 24-hour long test. Table III shows the results for the 7-day long test. We
took note of whether a false positive was generated while no one was home versus while the
home was occupied by the homeowner with the help of a video camera. Though we saw many
false positives using vibrational-based detection under our machine learning-based detection
methods, all of them occurred while the homeowner was awake at home. We found that our 3-
bedroom house generated a large amount of highly varied environmental noise such as playing
aggressively with dogs, loudly stomping about, and large groups of excited people during

27
televised sporting events. Since the alarm function can be disabled during these times, those false
positives will not cause false warnings to be dispatched to the homeowner.
TABLE II: Field Tests over 24 Hours
Detection Algorithm
FP- Homeowner is Away
FP- Homeowner is Home
False Alerts- Home- owner is
Away
False Alerts- Home- owner is
Home Vibrations-Threshold 2 22 2 0
Vibratoins-FFNN-75% Assurance 0 9 0 0
Vibratoins-FFNN-60% Assurance 0 21 0 0
Vibrations-KNN+DTW 0 19 0 0
Magnetometer 2µT 0 0 0 0
Audio Spectrogram 0 18 0 0
TABLE III: Field Tests over 7 Days
Detection Algorithm FP- Homeowner is Away
FP- Homeowner is Home Unnecessary Warnings
Vibrations- FFNN 75% Assurance 0 53 0
D. Modeling Vibration Dissipation
In order to determine the generality of vibration-based detection, we want to estimate a
maximum distance away from a door that a smartphone could be mounted and still be effective.
Specifically, we are interested in finding a distance such that Vi door open(x, y, z) ≤ Vi noise(x, y, z).
After this distance, the vibration caused by door open is too small to be differentiated from
background noise.
28
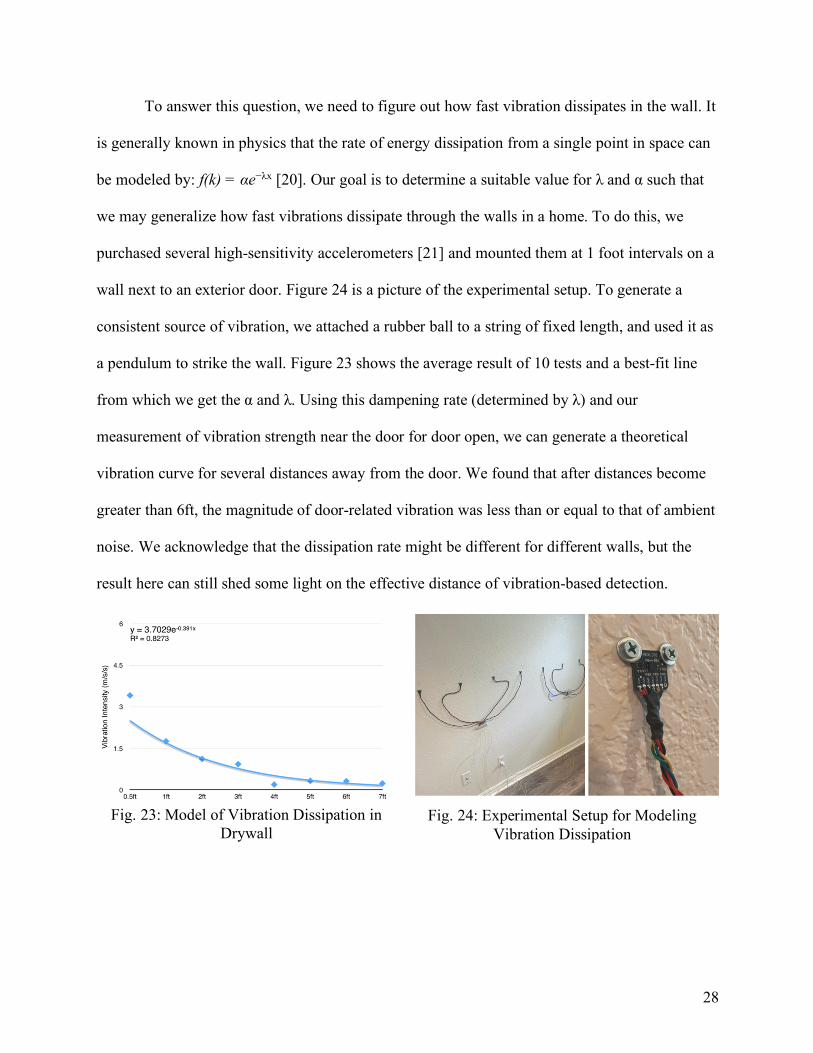
To answer this question, we need to figure out how fast vibration dissipates in the wall. It
is generally known in physics that the rate of energy dissipation from a single point in space can
be modeled by: f(k) = αe−λx [20]. Our goal is to determine a suitable value for λ and α such that
we may generalize how fast vibrations dissipate through the walls in a home. To do this, we
purchased several high-sensitivity accelerometers [21] and mounted them at 1 foot intervals on a
wall next to an exterior door. Figure 24 is a picture of the experimental setup. To generate a
consistent source of vibration, we attached a rubber ball to a string of fixed length, and used it as
a pendulum to strike the wall. Figure 23 shows the average result of 10 tests and a best-fit line
from which we get the α and λ. Using this dampening rate (determined by λ) and our
measurement of vibration strength near the door for door open, we can generate a theoretical
vibration curve for several distances away from the door. We found that after distances become
greater than 6ft, the magnitude of door-related vibration was less than or equal to that of ambient
noise. We acknowledge that the dissipation rate might be different for different walls, but the
result here can still shed some light on the effective distance of vibration-based detection.
Fig. 23: Model of Vibration Dissipation in Drywall
Fig. 24: Experimental Setup for Modeling Vibration Dissipation

29
E. Door Proximity & Interference
In modern living spaces such as apartments and duplexes, exterior doors might be placed
in close proximity to each other. We set out to determine if doors in close proximity would have
any noticeable effect on our detection methods. We started out by visiting a local apartment
building and taking some measurements. We measured 24’ 9” as the horizontal distance between
doors, and 7’ 6” as the vertical distance between doors. With the smartphone mounted on the
wall near a door, we opened and closed next-door neighbors’ doors several times and recorded
the vibration intensity. We did this experiment for neighbor doors on the same floor, and the
floors above and below. We observed that neighbors’ doors had virtually no impact on the
vibration readings. This was expected, though, as our dampening model had predicted distances
greater than six feet would be enough to reduce the magnitude of vibrations to that of
environmental noise.
F. Detecting Other Motion Events
Although the detection rate of vibration-based and audio-based detection is a little lower
than the magnetometer-based detection, they have one distinct advantage: they can detect other
motion events in addition to door open. To demonstrate this, we conducted tests for window
openings. For the accelerometer test, the window is 42 inches away from the wall-mounted
smartphone. For the microphone test, the window is about eight feet away and in direct line-of-
sight. For these tests, we trained the two types of neural networks using 15 samples of window
openings and 15 samples of noise (8 samples of ambient noise, and 7 samples of heavy footfall).
The assurance parameter was set to 60% and the same 1-second sliding window described above
was used. This implementation was nearly identical to how we detected door open events using

30
the neural networks. We tested 25 window openings. The detection results are shown in Table
IV. 92% of the window openings can be detected.
TABLE IV: Window Opening Detection
Detection Algorithm Detection Rate
FFNN – 60% Assurance 23/25
Audio Spectrogram 20/25
We see that the microphone-based method performs a little worse than the accelerometer-
based method. Though the results are slightly less accurate, the microphone is capable of
detecting window openings for multiple windows whereas the accelerometer is limited to just
doors and windows within six feet of the phone.
G. Cost Evaluation
In this section, we will describe how we evaluated the cost of our system as well as the
results compared to a few other popular smartphone applications.
1. Processing Time
For feedforward neural network, the algorithm is able to analyze a curve in
0.0011 seconds. Since we are polling this algorithm at 30Hz (0.033 seconds), our program
spends only 3% of its runtime analyzing curves, and the remaining 97% is spent idle. The
KNN+DTW approach needs a much higher processing time. Each analyzation takes 0.76
seconds. This is because the DTW algorithm has high time-complexity (O(n2)), the method does
not have a training phase, and it uses 30 curves.

31
2. Memory Usage
The total size of our packaged detection app is around 20MB. This is on par with
or lower than many apps in the App Store. Our app does not write any data to disk during
operation, so we can expect this value to remain constant during the life of the operation. For
memory consumption, our analysis shows that the FFNN detection algorithm uses 5.8MB of
memory on average, while the KNN+DTW detection algorithm uses 5.5MB on average. Our
sliding window contains 90 doubles, which iOS allocates 8 bytes [22] each to. Our sliding
window releases unused values, so we say the extra cost of the sliding window is less than 1KB.
3. Network Usage
The SecureHouse detection app only uses the network when a door event is
detected. Upon door event detection, a POST request is made to the threat response server which
contains only an 128-bit access token and two integers representing the type of event and the
homeowner’s notification preferences. The total size of this request is less than 350 bytes. This
results in around 15KB of data being sent per day when the home is in use, and near 0KB of data
being sent when the homeowner is away.
4. Power Consumption
iOS does not support gathering of energy consumption in units of mW, so we
used Xcode’s Instrument Panel to monitor energy consumption. This tool allows us to see an
“energy usage level” on a scale of 0-20. For the FFNN, KNN+DTW, and Magnetometer
detection methods, our app achieves a rating of 0 (best) for energy consumption. Furthermore,
the energy-consumption tool shows that the detection methods use between 6% and 15% of the
CPU cycles. We found that this is much lower than other types of apps. In particular, Crossy
Road, a popular mobile game scores a 3/20 and uses between 39% and 58% of the CPU cycles.

32
While Chrome, a web browser for iOS, scores a little better with a rating of 0/20 but uses an
average of 21% of the CPU cycles. In order to get a better feel for the power consumption of our
detection app, we ran experiments and found that it takes more than 80 minutes to deplete an
iPhone 6’s battery by 10% while running any of the detection algorithms. This means that,
though the phone would need a permanent power source, the system could remain operational
for more than 13 hours in the event of a power loss.

33
VI. CONCLUSION & FUTURE WORK
This paper studied the feasibility of using the accelerometer, magnetometer, and
microphone of a smartphone to detect door openings and build a home security system. We
developed two machine learning based detection methods using the accelerometer data, one
detection method using magnetometer data, one detection method using the microphone, and
developed a prototype system. Experiments showed that door openings can be accurately
detected using accelerometer and magnetometer data, with a detection rate of 98% and higher.
The microphone can detect door openings across multiple doors with an accuracy of 90%.
Accelerometer and sound-based detection can also detect window openings with high accuracy.
Smartphones containing built-in Wi-Fi connectivity are easily capable of dispatching alerts to the
homeowner or even law enforcement. Thus, our smartphone-based home security system built
with retired smartphones could be a viable and economical option for residential homes.
As for future work, our system could be expanded upon in several ways. First, as it stands
currently, if a user wishes to use the accelerometer, she must manually train the model by
opening the door several times for each door. Compared to the magnetometer and microphone-
based approaches, this is a bit clunky. Perhaps we could gather enough data on many doors to
create a generalized prediction model so that a potential user can skip this training process.
Though the microphone-based detection method uses the magnetometer to train itself, three
weeks is quite a long time for the device to spend in training mode. Again, we could potentially
create a generalized model for this such that it can classify most door openings without extra
training from the user. Second, since vibrations caused by door opening dissipate quickly and
become indistinguishable from environmental noise after 6 feet, most likely a smartphone
mounted near one exterior door can only detect the openings of this door when relying on

34
vibrational data. There are many apartments and small duplexes that only have one exterior door
or doors near each other. For a large house with multiple exterior doors, using one smartphone
for each door, although not totally infeasible (e.g., when there are multiple residents with
multiple retired phones), seems too costly. In this scenario, we recommend using the audio-based
detection method, as it can detect several doors while in a central location. In our future work,
we will investigate a way to improve the audio-based detection method.
Finally, we could further augment SecureHosue to incorporate even more sensors and
detection methods. This could include the use of more passive detection methods like Bluetooth
and Wi-Fi scanning or even using the barometer in conjunction with the other detection methods.
Ideally, we want to create a system which can use a single device to detect, report, and deter
break-ins regardless of any environmental variables.

35
REFERENCES [1] iPhone Sales Since 2007 https://www.statista.com/statistics/276306/ global-apple-iphone-sales-since-fiscal-year-2007/ [2] Professional Security System Installation Fees. https://www.angieslist. com/articles/how- much- does- it- cost- install- home- security- system.htm [3] iPhone 4 Accelerometer Specification. http://www.st.com/content/st com/ en/products/mems- and- sensors/accelerometers/lis331dlh.html [4] Arunabh Verma, Henry Carter, and Patrick Traynor, “(sp)iPhone: Decod- ing Vibrations From Nearby Keyboards Using Mobile Phone Accelerom- eters” in Proceedings of the 18th ACM conference on Computer and communications security. ACM, 2011, pp. 551-562. [5] Muchen Wu, Parth H. Pathak, Prasant Mohapatra, “Monitoring Building Door Events using Barometer Sensor in Smartphones” in Proceedings of the 2015 ACM International Joint Conference on Pervasive and Ubiquitous Computing. ACM, 2015, pp. 319-323 [6] Reinhold Behringer, Muthu Ramachandran, Victor Chang, “A Low-Cost Intelligent Car Break-In Alert System Using Smartphone Accelerometers for Detecting Vehicle Break-Ins” in The first International Conference on Internet of Things and Big Data. April 2016, Rome, IT. [7] Toyoda, Y & Huang, Jie & Ding, Shuxue & Liu, Yong. (2004). Environmental sound recognition by multilayered neural networks. 123 - 127. 10.1109/CIT.2004.1357184. [8] Presence: Free smart home motion detector webcam for security, care, and energy. https://itunes.apple.com/us/app/ presence- free- smart- home- motion/id618598211?mt=8 [9] Manything home security camera app with cloud DVR. https://itunes. apple.com/us/app/manything- home- security- camera/id639672976?mt=8 [10] Alfred – Home Security Surveillance IP Camera. https://itunes.apple.com/us/app/alfred-home- security-surveillance/id966460837?mt=8.

36
[11] Video Size Calculator. http://toolstud.io/video/filesize.php [12] Heiko Schwarz, Detlev Marpe, Thomas Wiegand, “Overview of the Scalable Video Coding Extension of the H.264/AVC Standard in IEEE Transactions on Circuits and Systems for Video Technology. 2007 IEEE. [13] Heroku Pricing. https://www.heroku.com/pricing [14] IBM Bluemix Pricing https://console.ng.bluemix.net/pricing [15] OpenShift Pricing https://www.openshift.com/pricing [16] Collin Hundley’s Swift AI https://github.com/collinhundley/Swift-AI [17] Apple’s CoreML Library https://developer.apple.com/documentation/coreml [18] Apple’s Core Motion Library https://developer.apple.com/reference/coremotion [19] Twilio- Cloud Communications Platform. https://www.twilio.com/ [20] Exponential Decay of Dampened Energy http://hyperphysics.phy-astr.gsu.edu/hbase/oscda.html [21] MMA8451 Triple Axis Accelerometer https://cdn-shop.adafruit.com/datasheets/MMA8451Q-1.pdf [22] Size of a Double in 64-bit iOS Operating System https:// developer.apple.com/library/content/documentation/General/Conceptual/ CocoaTouch64BitGuide/Major64- BitChanges/Major64- BitChanges.html [23] M. A. Mahler, Qinghua Li and Ang Li, "SecureHouse: A home security system based on smartphone sensors," 2017 IEEE International Conference on Pervasive Computing and Communications (PerCom), Kona, HI, 2017, pp. 11-20.

37
[24] He Wang, Ted Tsung-Te Lai, and Romit Roy Choudhury. 2015. MoLe: Motion Leaks through Smartwatch Sensors. In Proceedings of the 21st Annual International Conference on Mobile Computing and Networking (MobiCom '15). ACM, New York, NY, USA, 155-166. [25] Liang Cai and Hao Chen. 2011. TouchLogger: inferring keystrokes on touch screen from smartphone motion. In Proceedings of the 6th USENIX conference on Hot topics in security (HotSec'11). USENIX Association, Berkeley, CA, USA, 9-9. [26] Kevin J. Lang, Alex H. Waibel, Geoffrey E. Hinton. 1990. A time-delay neural network architecture for isolated word recognition, Neural Networks, Volume 3, Issue 1, Pages 23-43 [27] Andrew Taylor, Graeme Watson, Gordon Grigg, and Hamish McCallum. 1996. Monitoring frog communities: an application of machine learning. In Proceedings of the eighth annual conference on Innovative applications of artificial intelligence (IAAI'96). AAAI Press 1564-1569. [28] Michael C. RecchioneAnthony P. Russo. AT&T Corp General Dynamics Advanced Technology Systems Inc.. US5502688A