A history and market analysis of tourism in Tanzania
18
PLEASE SCROLL DOWN FOR ARTICLE This article was downloaded by: [Canadian Research Knowledge Network] On: 9 November 2010 Access details: Access Details: [subscription number 783016864] Publisher Routledge Informa Ltd Registered in England and Wales Registered Number: 1072954 Registered office: Mortimer House, 37- 41 Mortimer Street, London W1T 3JH, UK Journal of Ecotourism Publication details, including instructions for authors and subscription information: http://www.informaworld.com/smpp/title~content=t794297788 The Use of Importance-Performance Analysis and Market Segmentation for Tourism Management in Parks and Protected Areas: An Application to Tanzania's National Parks Derek J. Wade; Paul F. J. Eagles Online publication date: 29 March 2010 To cite this Article Wade, Derek J. and Eagles, Paul F. J.(2003) 'The Use of Importance-Performance Analysis and Market Segmentation for Tourism Management in Parks and Protected Areas: An Application to Tanzania's National Parks', Journal of Ecotourism, 2: 3, 196 — 212 To link to this Article: DOI: 10.1080/14724040308668144 URL: http://dx.doi.org/10.1080/14724040308668144 Full terms and conditions of use: http://www.informaworld.com/terms-and-conditions-of-access.pdf This article may be used for research, teaching and private study purposes. Any substantial or systematic reproduction, re-distribution, re-selling, loan or sub-licensing, systematic supply or distribution in any form to anyone is expressly forbidden. The publisher does not give any warranty express or implied or make any representation that the contents will be complete or accurate or up to date. The accuracy of any instructions, formulae and drug doses should be independently verified with primary sources. The publisher shall not be liable for any loss, actions, claims, proceedings, demand or costs or damages whatsoever or howsoever caused arising directly or indirectly in connection with or arising out of the use of this material.
Transcript of A history and market analysis of tourism in Tanzania

PLEASE SCROLL DOWN FOR ARTICLE
This article was downloaded by: [Canadian Research Knowledge Network]On: 9 November 2010Access details: Access Details: [subscription number 783016864]Publisher RoutledgeInforma Ltd Registered in England and Wales Registered Number: 1072954 Registered office: Mortimer House, 37-41 Mortimer Street, London W1T 3JH, UK
Journal of EcotourismPublication details, including instructions for authors and subscription information:http://www.informaworld.com/smpp/title~content=t794297788
The Use of Importance-Performance Analysis and Market Segmentationfor Tourism Management in Parks and Protected Areas: An Application toTanzania's National ParksDerek J. Wade; Paul F. J. Eagles
Online publication date: 29 March 2010
To cite this Article Wade, Derek J. and Eagles, Paul F. J.(2003) 'The Use of Importance-Performance Analysis and MarketSegmentation for Tourism Management in Parks and Protected Areas: An Application to Tanzania's National Parks',Journal of Ecotourism, 2: 3, 196 — 212To link to this Article: DOI: 10.1080/14724040308668144URL: http://dx.doi.org/10.1080/14724040308668144
Full terms and conditions of use: http://www.informaworld.com/terms-and-conditions-of-access.pdf
This article may be used for research, teaching and private study purposes. Any substantial orsystematic reproduction, re-distribution, re-selling, loan or sub-licensing, systematic supply ordistribution in any form to anyone is expressly forbidden.
The publisher does not give any warranty express or implied or make any representation that the contentswill be complete or accurate or up to date. The accuracy of any instructions, formulae and drug dosesshould be independently verified with primary sources. The publisher shall not be liable for any loss,actions, claims, proceedings, demand or costs or damages whatsoever or howsoever caused arising directlyor indirectly in connection with or arising out of the use of this material.

The Use of Importance–PerformanceAnalysis and Market Segmentation forTourism Management in Parks andProtected Areas: An Application toTanzania’s National Parks
Derek J. WadeHealth Canada, Health Policy and Communications Branch, Ottawa,Canada
Paul F.J. EaglesDepartment of Recreation and Leisure Studies, University of Waterloo,Waterloo, Canada
This paper presents an application of the IPA technique, coupled with marketsegmentation, to a sample of visitors to Tanzania’s National Parks. The utility ofthe technique in a protected area context is highlighted, by comparing it with theresults from three programme perspectives – non-segmented data (a homogeneousIPA programme), segmented data that look at performance measurements only (asegmented performance-only programme), and segmented data (a segmented IPAprogramme). A few examples of non-parametric statistical analysis are presented tohighlight the �exibility of the technique. When combined with market segmen-tation, IPA is a superior technique to that of a non-segmented approach, which viewsthe sample as homogeneous and can lead to the displacement of visitors. It is alsosuperior to that of a performance-only approach. The technique is achievable for aprotected area agency with limited resources and expertise and is also a good startingpoint for agencies with suitable resources and expertise.
Keywords: importance–performance analysis, market segmentation, national parks,protected areas management, Tanzania
IntroductionFor many nations, particularly in the developing world, protected area tour-
ism either generates, or has the potential to constitute, a signi�cant proportionof national GDP, foreign exchange earnings and employment �gures. Manyprotected area agencies, which oversee these tourism estates, face decreasinglevels of public funding and an increasing dependence on internal capital gen-eration. As a result, many of these bodies have changed their managementstructure from that of a traditional government agency, to that of a crowncorporation or parastatal which retains its revenues. This scenario has createdan increased managerial focus and reliance on tourist client satisfaction. Mostpark agencies, however, lack experience and expertise in client satisfactionmeasurement and other types of marketing research.
Not all park agencies monitor park visitor satisfaction, and many base stan-dards of satisfaction on the expert judgement of management (Vaske et al., 1991).
1472-4049/03/03 0196-17 $20.00/0 Ó 2003 D.J. Wade and P.F.J. EaglesJOURNAL OF ECOTOURISM Vol. 2, No. 3, 2003
196
Downloaded By: [Canadian Research Knowledge Network] At: 17:31 9 November 2010

197The Use of IPA and Market Segmentation in Tourism Management
For those agencies that have developed a visitor survey, satisfaction measure-ment can consist of a ‘performance only program’, which looks purely at ser-vice ratings but not at the importance of services to clients. Studies and prac-tice have shown that while client input is essential in regards to rating theperformance of service ratings, a park agency must also know what patronsexpect from a service and the aspects they feel are important (Mackay &Crompton, 1988). Tools are therefore needed to help managers comprehendand evaluate client services with more than performance measures alone.
Sophisticated techniques such as the SERVQUAL instrument (Parasuramanet al., 1988) have been developed, and applied to park contexts (Hamilton &Crompton, 1991) but are generally impractical for use in protected areas. Thesetechniques often require the use of complex software and require expertisenot only in their administration, but also in the interpretation of data (Duke &Persia, 1996). In addition these techniques require lengthy survey instrumentsand often exhibit low response rates for park visitors who are accustomed to�lling out surveys about only 10–15 minutes in nature.
One technique available to the protected area professional is Importance–Performance Analysis (IPA). The application of IPA, introduced by Martillaand James (1977) is well documented, and has shown the capability to provideservice managers with valuable information for both satisfaction measurementand the ef�cient allocation of resources, all in an easily applicable format.
In brief, importance and performance scores attained from survey instru-ment Likert scales are plotted onto a two-dimensional matrix, where arbitrarygridlines are established that re�ect standards of service quality and mana-gerial goals. Importance questions may read something like Please rate howimportant the following services are to you while at our establishment, while per-formance questions may read as How did we perform on the following serviceaspects? All points fall into one of four quadrants:
Keep up the good work: Importance and performance ratings both meet orexceed service quality standards;Concentrate here: Importance and performance ratings both fall short ofservice quality standards;Low priority: Performance scores do not meet the service quality standard,but respondents do not place a high level of importance on the service;andPossible overkill: Performance scores meet or exceed service quality stan-dards, but a low level of importance is assigned to this particular service.
An example of an IPA grid is shown in Figure 1.
Importance–Performance AnalysisIPA has been applied to a diverse range of contexts including banking
(Ennew et al., 1993), dentistry (Nitse & Bush, 1993), and health care(Dolinsky & Caputo, 1991) and in a tourism/outdoor recreation context hasbeen applied to special events such as municipal marathons (Guadagnolo,1985), ski resorts (Hudson & Shepherd, 1998; Uysal et al., 1991), escorted tours(Duke & Persia, 1996) and hotels (Martin, 1995). It has also seen limited appli-cation to tourism in protected areas, in the areas of facility evaluation such as
Downloaded By: [Canadian Research Knowledge Network] At: 17:31 9 November 2010

198 Journal of Ecotourism
Figure 1 Importance–Performance matrix
visitor centres (Mengak et al., 1986), and cabins (Hollenhorst et al., 1992), andalso in the measurement of opinions of park concessionaires (Burns, 1988). Inprotected area management, IPA is seldom used in professional marketingpractice, although recommendation for its use as a guideline for managerswas recently proposed (Hornback & Eagles, 1999).
While deemed as a useful tool for homogeneous markets, displacement ofvisitors can occur if subgroups containing different importance ratings are notsegmented from the data (Vaske et al., 1996). For example, if a representativesample of a park population actually contains a number of speci�c visitorgroups, and one of these groups represents a large percentage of use, andsubsequently the sample, the mean IPA ratings will re�ect this dominant seg-ment. Management, thinking they are catering to the general park population,will actually cater to the satisfactions of this large group. However, if thesmaller segments have distinct values that appear in different quadrants ofthe IPA grid, managerial decisions catered toward the dominant group mayactually displace some to go elsewhere. Subsequently, more individuals fromthe dominant group may be attracted to the park, and in future IPA analysisservice quality will appear to be elevated.
Market segmentation is a fundamental practice in marketing research,which involves the process of dissecting markets into smaller subgroups thatshare common characteristics. While there is no universal consensus on thecharacteristics by which to conduct segmentation in the tourism industry, vari-ables are generally categorised according to geographic, demographic, psycho-graphic, and behavioural traits (Morrison & O’Leary, 1994). Since visitors toparks can seldom be grouped into one whole, market segmentation appearsto be a necessary component of the application of IPA to parks. While the
Downloaded By: [Canadian Research Knowledge Network] At: 17:31 9 November 2010

199The Use of IPA and Market Segmentation in Tourism Management
identi�cation of segments often involves the use of complex factor and clusteranalysis techniques, in the context of tourism in parks it is generally basedon the behavioural traits of visitors such as camping or day use, and segmentscan generally be derived in an a priori manner.
PurposeThis paper presents an application of the IPA technique coupled with mar-
ket segmentation to a sample of visitors to Tanzania’s National Parks. Theutility of IPA as a viable client satisfaction measurement instrument for theprotected area manager is highlighted, by comparing the matrix results andinterpretations with those attained from other techniques. Speci�cally, thestudy data are compared and contrasted with three program perspectives –non-segmented data (a homogeneous IPA programme), segmented data thatlook at performance measurements only (a segmented performance-onlyprogramme), and segmented data (a segmented IPA programme). A fewexamples of non-parametric statistical analysis will also be presented to high-light the �exibility of the technique.
Methodology
Case study nation – TanzaniaTanzania, located in East Africa, contains a world-class system of national
parks and game reserves. Tourism, which is largely based on these parks,has developed to become the nation’s second leading foreign exchange earner(MNRT, 1997). The country is less developed than its East African neighbours,and seeks to position itself as a low-density, high-quality, and high-pricedtourism destination (Wade et al., 2001). However, a lack of infrastructure andstaff training – particularly in the area of marketing research exists. TanzaniaNational Parks (TANAPA), the agency that manages the national parks, cur-rently has no formal visitor satisfaction measurement programme. The agencypossesses little managerial research capacity, and is an example of an organis-ation that could bene�t from this technique. The country offers an excellentcase study example for this study.
In order to illustrate various aspects of the IPA and segmentation technique(which will be referred to as a ‘segmented IPA programme’), examples fromsamples of two national parks (Kilimanjaro and Serengeti) and a sample rep-resenting the system of parks will be presented. The details of the samplesand market segments are presented in the results sections.
Development of survey instrument and segmentsSatisfaction variables and market segments for each park were identi�ed
through a series of focus groups conducted with various TANAPA staff bothat the agency headquarters and individual parks, in addition to consultationswith a number of knowledgeable tourism personnel in various sectors of thetourism industry, and some visitors. In addition, surveys used in North Amer-ican parks were also reviewed. A series of park-speci�c and standardisedvariables for all surveys were developed and incorporated onto a surveyinstrument. Questions asking respondents demographic, socio-economic, trip
Downloaded By: [Canadian Research Knowledge Network] At: 17:31 9 November 2010

200 Journal of Ecotourism
characteristic, travel motivation, and expenditure information were alsopresent. Importance-Performance variables were measured on a 5-point Likertscale and limited to an approximate total of 15 depending on the park, inorder to maintain an average time of 15 minutes to �ll in the questionnaire.While some IPA studies develop surveys containing over 100 variables, andsubsequently conduct factor analysis to narrow them down, this was deemedas too complex for an introductory study in an agency with little socialscience experience.
A �rst draft of the survey instrument was administered on a group of parktourists as a pretest. In addition to measuring response times and developingdistribution strategies, the pretest solicited respondents for their feedbackregarding the IPA and other variables being measured on the instrument. Thesurvey was subsequently re�ned based on this feedback. An ‘other’ variablewas included in the pretest but removed due to space and a low responserate. A variety of segmentation scenarios utilising demographic and socio-economic variables were also analysed, to investigate whether other formsof segmentation could prove useful for the study. The behavioural segmentshowever proved to be the most useful discriminator.
Analysis parametersSince the goal of Tanzanian tourism is to position itself as a high end, high
service quality destination (Wade et al., 2001), gridlines were placed at valuesof 4.0 to re�ect standards of ‘extremely important’ and ‘excellent’ perform-ance. Some debate exists in the literature as to whether mean or median valuesare better for the importance and performance ratings (Burns, 1988). Meanvalues were chosen for this study, since they are easily derived. In addition,the study followed the example of Hudson and Shepherd (1998) and did not‘force’ variables into all quadrants.
The examples are analysed from the following three program perspectives:
(1) the Homogeneous IPA programme where importance and performancemeasures are present, but no market segments are identi�ed within thesample;
(2) the Segmented performance-only programme where market segments areidenti�ed but results are only attained for performance measures only; and
(3) the Segmented IPA programme where market segments are identi�ed andmeasures of both importance and performance are present.
In addition, a few results of signi�cant non-parametric statistical will bepresented to highlight its compatibility with importance–performanceanalysis.
Results
Kilimanjaro National Park visitorsFigure 2 illustrates the importance-performance grid results for a non-seg-
mented sample of climbers to Kilimanjaro National Park (n = 129). Based onthis homogeneous group, the (D) friendliness of guides and (E) group har-mony are strengths in the visitor experience. Areas where staff can concentrate
Downloaded By: [Canadian Research Knowledge Network] At: 17:31 9 November 2010

201The Use of IPA and Market Segmentation in Tourism Management
Kilimanjaro National Park Importance and Performance Ratings
Code Variable Mean Mean Differenceimportance performance
A Low level of litter 4.58 3.70 20.88
B Security from theft 4.57 3.46 21.11
C Knowledge of guide 4.52 3.52 21.00
D Friendliness of guide 4.46 4.07 20.39
E Group harmony 4.35 4.44 0.09
F Friendliness of porters 3.92 3.99 0.07
G Convenience of registration 3.84 3.00 20.84
H Security from wildlife attack 3.61 3.85 0.24
I Availability of information 3.96 2.76 21.20
J Low level of crowdedness 4.14 3.26 20.88
K Cleanliness of washrooms 4.02 2.61 21.41
L Friendliness of TANAPA staff 4.02 3.60 20.42
M Accommodation 4.15 3.54 20.61
Figure 2 Importance–Performance grid for Kilimanjaro users
on improving the visitor experience include levels of (A) litter and (J) crowd-ing, (B) security from theft, (C) knowledge of guides, (M) quality of accommo-dation, (K) cleanliness of washrooms and (L) friendliness of park staff. Figure1 suggests that the managers have considerably more issues to address thanissues well handled.
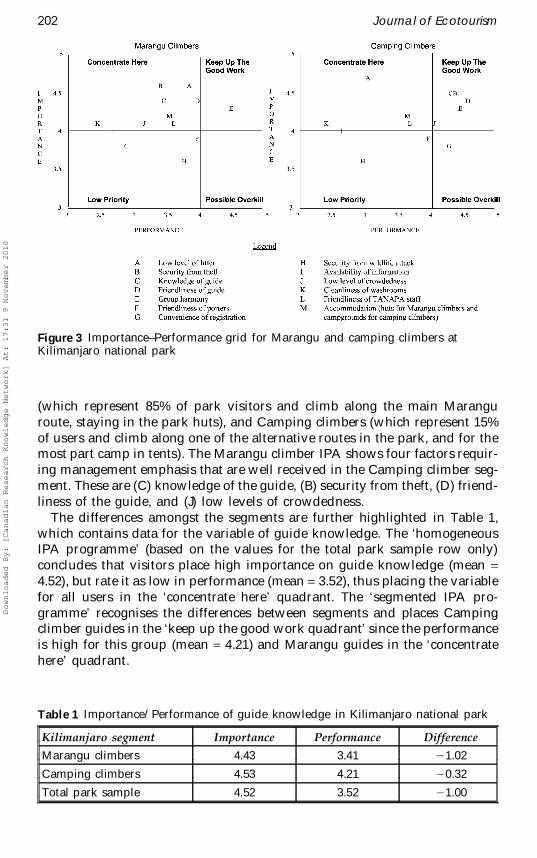
Figure 3 illustrates the differences in the importance–performance gridwhen the Kilimanjaro climber sample is segmented into Marangu climbers
Downloaded By: [Canadian Research Knowledge Network] At: 17:31 9 November 2010
202 Journal of Ecotourism
Figure 3 Importance–Performance grid for Marangu and camping climbers atKilimanjaro national park
(which represent 85% of park visitors and climb along the main Maranguroute, staying in the park huts), and Camping climbers (which represent 15%of users and climb along one of the alternative routes in the park, and for themost part camp in tents). The Marangu climber IPA shows four factors requir-ing management emphasis that are well received in the Camping climber seg-ment. These are (C) knowledge of the guide, (B) security from theft, (D) friend-liness of the guide, and (J) low levels of crowdedness.
The differences amongst the segments are further highlighted in Table 1,which contains data for the variable of guide knowledge. The ‘homogeneousIPA programme’ (based on the values for the total park sample row only)concludes that visitors place high importance on guide knowledge (mean =4.52), but rate it as low in performance (mean = 3.52), thus placing the variablefor all users in the ‘concentrate here’ quadrant. The ‘segmented IPA pro-gramme’ recognises the differences between segments and places Campingclimber guides in the ‘keep up the good work quadrant’ since the performanceis high for this group (mean = 4.21) and Marangu guides in the ‘concentratehere’ quadrant.
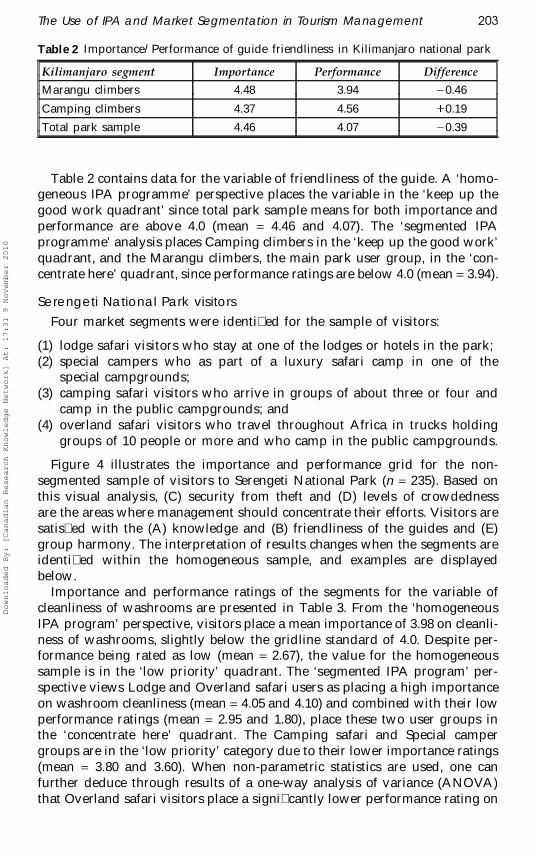
Table 1 Importance/Performance of guide knowledge in Kilimanjaro national park
Kilimanjaro segment Importance Performance Difference
Marangu climbers 4.43 3.41 21.02
Camping climbers 4.53 4.21 20.32
Total park sample 4.52 3.52 21.00
Downloaded By: [Canadian Research Knowledge Network] At: 17:31 9 November 2010
203The Use of IPA and Market Segmentation in Tourism Management
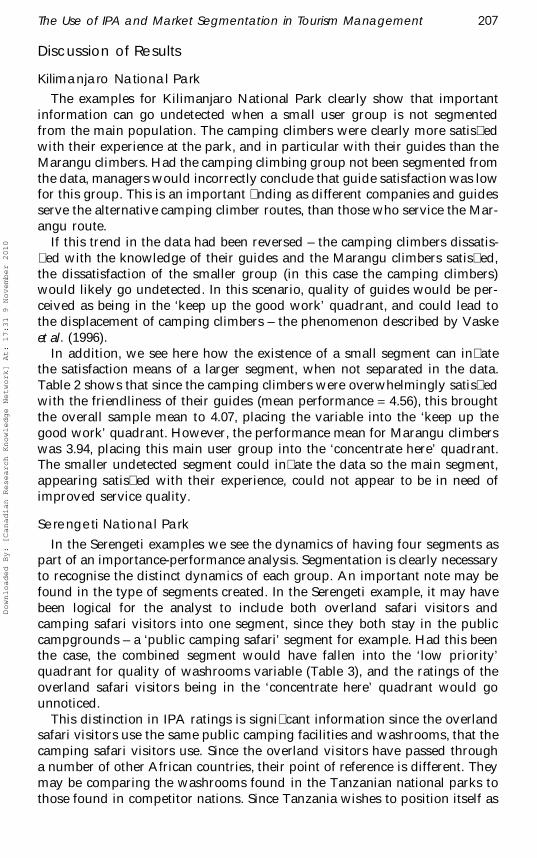
Table 2 Importance/Performance of guide friendliness in Kilimanjaro national park
Kilimanjaro segment Importance Performance Difference
Marangu climbers 4.48 3.94 20.46
Camping climbers 4.37 4.56 0.19
Total park sample 4.46 4.07 20.39
Table 2 contains data for the variable of friendliness of the guide. A ‘homo-geneous IPA programme’ perspective places the variable in the ‘keep up thegood work quadrant’ since total park sample means for both importance andperformance are above 4.0 (mean = 4.46 and 4.07). The ‘segmented IPAprogramme’ analysis places Camping climbers in the ‘keep up the good work’quadrant, and the Marangu climbers, the main park user group, in the ‘con-centrate here’ quadrant, since performance ratings are below 4.0 (mean = 3.94).
Serengeti National Park visitorsFour market segments were identi�ed for the sample of visitors:
(1) lodge safari visitors who stay at one of the lodges or hotels in the park;(2) special campers who as part of a luxury safari camp in one of the
special campgrounds;(3) camping safari visitors who arrive in groups of about three or four and
camp in the public campgrounds; and(4) overland safari visitors who travel throughout Africa in trucks holding
groups of 10 people or more and who camp in the public campgrounds.
Figure 4 illustrates the importance and performance grid for the non-segmented sample of visitors to Serengeti National Park (n = 235). Based onthis visual analysis, (C) security from theft and (D) levels of crowdednessare the areas where management should concentrate their efforts. Visitors aresatis�ed with the (A) knowledge and (B) friendliness of the guides and (E)group harmony. The interpretation of results changes when the segments areidenti�ed within the homogeneous sample, and examples are displayedbelow.
Importance and performance ratings of the segments for the variable ofcleanliness of washrooms are presented in Table 3. From the ‘homogeneousIPA program’ perspective, visitors place a mean importance of 3.98 on cleanli-ness of washrooms, slightly below the gridline standard of 4.0. Despite per-formance being rated as low (mean = 2.67), the value for the homogeneoussample is in the ‘low priority’ quadrant. The ‘segmented IPA program’ per-spective views Lodge and Overland safari users as placing a high importanceon washroom cleanliness (mean = 4.05 and 4.10) and combined with their lowperformance ratings (mean = 2.95 and 1.80), place these two user groups inthe ‘concentrate here’ quadrant. The Camping safari and Special campergroups are in the ‘low priority’ category due to their lower importance ratings(mean = 3.80 and 3.60). When non-parametric statistics are used, one canfurther deduce through results of a one-way analysis of variance (ANOVA)that Overland safari visitors place a signi�cantly lower performance rating on
Downloaded By: [Canadian Research Knowledge Network] At: 17:31 9 November 2010

204 Journal of Ecotourism
Serengeti National Park Importance and Performance Ratings
Code Variable Mean Mean Differenceimportance performance
A Knowledge of guide 4.52 4.28 20.24
B Friendliness of guide 4.50 4.43 20.07
C Security from theft 4.35 3.60 20.75
D Low level of crowdedness 4.30 3.91 20.39
E Group harmony 4.16 4.08 20.08
F Cleanliness of washrooms 3.98 2.67 21.31
G Security from wildlife attack 3.95 3.88 20.07
H Friendliness of TANAPA staff 3.88 3.94 0.06
I Accommodation 3.82 3.80 20.02
J Availability of information 3.76 2.84 20.92
K Visitor centre 3.57 3.20 20.37
L Quality of roads 3.33 2.22 21.11
Figure 4 Importance–Performance grid for Serengeti users
washroom cleanliness than all other groups. Clearly the different Serengetiuser groups have different responses with this important variable.
A very different type of interpretation occurs when a ‘segmented perform-ance-only program’ perspective is taken. In this view, all groups areunsatis�ed – with Overland safari users being the most unsatis�ed, and spe-cial campers the least. All are considered as being unsatis�ed since perform-ance means are all below 4.0. No consideration of importance ratings is taken,since they are not measured in this programme.
Downloaded By: [Canadian Research Knowledge Network] At: 17:31 9 November 2010

205The Use of IPA and Market Segmentation in Tourism Management
Table 3 Importance/Performance of cleanliness of washrooms in Serengeti nationalpark
Serengeti segment Importance Performance Difference
Lodge safari 4.05 2.95 21.10
Special campers 3.80 3.60 20.20
Camping safari 3.60 2.54 21.06
Overland safari 4.10 1.80a 22.30
Total park sample 3.98 2.67 21.31af test probability for one-way ANOVA 0.01 with lodge safari, 0.05 with special campers,and 0.10 with camping safari
Table 4 Importance/Performance of low level of crowdedness in Serengeti nationalpark
Serengeti segment Importance Performance Difference
Lodge safari 4.29 4.10 20.19
Special campers 4.50 4.50 20.00
Camping safari 4.27 3.40 20.87
Overland safari 4.33 3.71 20.62
Total park sample 4.30 3.91 20.39
Table 4 illustrates results for the variable of level of crowdedness in thepark. The ‘homogeneous IPA programme’ interprets that visitors place a highlevel of importance on levels of crowdedness (mean = 4.30) and rate the levelof performance below the service quality standard of 4.0 (mean = 3.91), placingit in the ‘concentrate here’ quadrant. The ‘segmented IPA programme’ wouldplace Lodge and Special campers in the ‘keep up the good work’ quadrantand camping and overland safari users in the ‘concentrate here’ quadrant. A‘segmented performance-only programme’ analyst would conclude that per-formance is low for Camping and Overland safari visitors, but acceptable forLodge and Special campers based on the performance ratings only.
Results for accommodation ratings are presented in Table 5. While Lodgesafari users stay at the lodges, and Special campers at the special campsites,Overland and Camping safari users both stay in public campsites. The ‘hom-ogenous IPA programme’ places the variable in the ‘low priority’ quadrant,since the mean importance (mean = 3.82) and performance (mean 3.80) valuesare below the criterion of 4.0. The segmented IPA programme places Lodge
Table 5 Importance/Performance of accommodation in Serengeti national park
Serengeti segment Importance Performance Difference
Hotel/lodge in park 4.09 4.33 0.24
Special campsite 4.00 4.60 0.60
Public campsite 3.33 2.86 20.47
Total park sample 3.82 3.80 20.02
Downloaded By: [Canadian Research Knowledge Network] At: 17:31 9 November 2010

206 Journal of Ecotourism
safari and Special campers in the ‘keep up the good work’ quadrant, due tothe mean importance (mean = 4.09 and 4.00) and performance ratings (mean= 4.33 and 4.60) being above 4.0. It places the public campers in the ‘lowpriority’ quadrant, since these visitors while rating the campgrounds as lowin performance (mean = 2.86), also place a low level of importance on thecampground (mean = 3.33). The ‘segmented performance-only programme’would conclude that while Lodge and Special campsite users are extremelysatis�ed with their accommodation, public campers are not, and thereforepublic campsite quality should be addressed.
System of national parks
Table 6 presents results from a sample of visitors from across the systemof national parks, and represents the national park tourism market for thenation (n = 474). Southern circuit users are those who visit the remote andundeveloped parks found in the southern part of the country, Climbers arethose who visit one of the two mountain parks, and Northern circuit usersare those who travel along the common travel route of northern safari parks.
The variable of low levels of crowding is illustrated. The ‘homogenous IPAprogramme’ would view national park users as being in the ‘concentrate here’quadrant due to importance being greater than 4.0 (mean = 4.30) and meanperformance being at 3.78. The ‘segmented IPA programme’ while placingClimbers and Northern circuit visitors in the ‘concentrate here’ quadrant,would recognise the satisfaction of the Southern circuit group, placing themin the ‘keep up the good work’ quadrant, due to the high performance rating(mean = 4.71), in conjunction with the mean importance rating above 4.0(mean = 4.80). The ‘segmented performance-only programme’ would drawthe conclusion that Southern circuit users are satis�ed, and Climbers andNorthern circuit visitors unsatis�ed, based on the performance ratings alone.
Table 6 Mean values for low levels of crowdedness by segment
TANAPA segment Importance Performance Difference
Southern circuit 4.80a 4.71b 20.09
Climbers 4.14 3.26 20.88
Northern circuit 4.37 3.92 20.45
Total sample 4.30 3.78 20.52af test probability for one-way ANOVA 0.05 with northern circuit, and 0.01 with climbersbf test probability for one-way ANOVA 0.01 with both groups
When one-way analysis of variance (ANOVA) tests are applied to the data,it is further revealed that Southern circuit users place a signi�cantly higherlevel of importance, and a signi�cantly higher level of performance than theother two groups on levels of crowding in Tanzanian national parks. This�nding is probably due to the much lower levels of public use that occur inthe national parks of the southern circuit.
Downloaded By: [Canadian Research Knowledge Network] At: 17:31 9 November 2010
207The Use of IPA and Market Segmentation in Tourism Management
Discussion of Results
Kilimanjaro National ParkThe examples for Kilimanjaro National Park clearly show that important
information can go undetected when a small user group is not segmentedfrom the main population. The camping climbers were clearly more satis�edwith their experience at the park, and in particular with their guides than theMarangu climbers. Had the camping climbing group not been segmented fromthe data, managers would incorrectly conclude that guide satisfaction was lowfor this group. This is an important �nding as different companies and guidesserve the alternative camping climber routes, than those who service the Mar-angu route.
If this trend in the data had been reversed – the camping climbers dissatis-�ed with the knowledge of their guides and the Marangu climbers satis�ed,the dissatisfaction of the smaller group (in this case the camping climbers)would likely go undetected. In this scenario, quality of guides would be per-ceived as being in the ‘keep up the good work’ quadrant, and could lead tothe displacement of camping climbers – the phenomenon described by Vaskeet al. (1996).
In addition, we see here how the existence of a small segment can in�atethe satisfaction means of a larger segment, when not separated in the data.Table 2 shows that since the camping climbers were overwhelmingly satis�edwith the friendliness of their guides (mean performance = 4.56), this broughtthe overall sample mean to 4.07, placing the variable into the ‘keep up thegood work’ quadrant. However, the performance mean for Marangu climberswas 3.94, placing this main user group into the ‘concentrate here’ quadrant.The smaller undetected segment could in�ate the data so the main segment,appearing satis�ed with their experience, could not appear to be in need ofimproved service quality.
Serengeti National ParkIn the Serengeti examples we see the dynamics of having four segments as
part of an importance-performance analysis. Segmentation is clearly necessaryto recognise the distinct dynamics of each group. An important note may befound in the type of segments created. In the Serengeti example, it may havebeen logical for the analyst to include both overland safari visitors andcamping safari visitors into one segment, since they both stay in the publiccampgrounds – a ‘public camping safari’ segment for example. Had this beenthe case, the combined segment would have fallen into the ‘low priority’quadrant for quality of washrooms variable (Table 3), and the ratings of theoverland safari visitors being in the ‘concentrate here’ quadrant would gounnoticed.
This distinction in IPA ratings is signi�cant information since the overlandsafari visitors use the same public camping facilities and washrooms, that thecamping safari visitors use. Since the overland visitors have passed througha number of other African countries, their point of reference is different. Theymay be comparing the washrooms found in the Tanzanian national parks tothose found in competitor nations. Since Tanzania wishes to position itself as
Downloaded By: [Canadian Research Knowledge Network] At: 17:31 9 November 2010
208 Journal of Ecotourism
a high end, high quality tourist destination (Wade et al., 2001), this �ndingsends a message to management in relation to international service qualitycomparison. Therefore, the type of segments chosen has a signi�cant bearingon the type of information derived.
An important note is also found in the size of the segments. In a representa-tive sample, niche markets may have a low number of respondents. In thecase of the special campers, the results must be treated with caution due tothe low number of respondents in this group (n = 15). However, the techniquecan still highlight the uniqueness of this group and possibly lead to the designof a separate study designed just for these users.
Secondly we see in the data the limited utility of a ‘segmented performance-only program’ and the value-added achieved by the measurement of animportance dimension. In Table 5 for example, the ‘segmented performance-only program’ would lead the analyst to incorrectly conclude that publiccampsite users are unsatis�ed with their accommodation. While the perform-ance rating is low at 2.86, the importance rating is also low at 3.33. Not reco-gnising the dynamic of importance could lead to incorrect interpretation ofresults and improper resource allocation.
Also, the size of the acceptable gap between importance and performanceis one that needs to be established. In the case of camping safari visitors (Table3), the gap is 21.06, even if the variable appears in the ‘low priority’ quadrant.The analyst should consider at what the point this gap is signi�cant.
System of national parks
The example from the overall national study in Table 6, shows how non-parametric statistical analysis when accompanying the importance-perform-ance technique, adds new information to the study. In this case, despite allvisitor groups rating the importance of low levels of crowding as above 4.0,it is seen that southern circuit visitors rate this variable as being signi�cantlymore important than the other groups – who already rate it as important.Despite performance means being below 4.0 for climbers and northern circuitusers (placing them into the ‘concentrate here’ quadrant), it is likely that hadeither group rated performance as being slightly above 4.0 (placing them intothe ‘keep up the good work’ quadrant along with the southern circuit users),this difference in performance would still likely be signi�cant. This shows thatdifferences amongst segments can still be statistically signi�cant, despite beingsituated within the same quadrant.
In the case of Tanzanian tourism, this �nding is important, as Southerncircuit visitors are a clear market segment that needs to be monitored andmanaged independently from the other groups. Southern circuit usersdemand signi�cantly lower levels of crowding and are very satis�ed with theirexperience in southern Tanzanian national parks. The nation, which seeks toposition itself as a low-density tourism destination, will need to be careful notto displace this group by developing the southern park use levels to the higherlevels of the northern circuit.
Downloaded By: [Canadian Research Knowledge Network] At: 17:31 9 November 2010

209The Use of IPA and Market Segmentation in Tourism Management
Implications for Future Research
Utility of the technique
Importance–performance analysis coupled with market segmentation is abasic technique that can provide useful results for the protected area tourismmanager. It can act as a baseline diagnostic tool to provide insight into therelationship between satisfaction dynamics and the importance that speci�cvisitor groups assess to various aspects of the service offering. It can alsoguide resource allocation, as areas of service strength, overkill, low priority,and need for concentration are highlighted in an easily understood matrix.The results can also be used to direct additional research dollars moreef�ciently, as areas that require increased concentration can be furtherinvestigated.
For an agency with limited technical expertise and �nancial resources, itoffers a foundation for exploratory research that can be built upon as resourcesand expertise become available. Parks generally can identify client groups inan a priori manner without large focus group and factor analysis studies. Foran agency with resources, techniques such as non-parametric statistical analy-sis can complement the technique. In addition, both demographic informationand expenditure data can be merged with the IPA data to form more completesegment pro�les to base further strategic decision-making upon.
The use of the technique, in the context of protected areas management, cango beyond that of traditional marketing studies which seek to elevate servicequality and regular use. The technique can also be used to de-market anddeliberately displace visitors for the purpose of lowering use. For example,an ecological impact study seeking to lower the amount of visitors who usean ecologically sensitive area, may wish to identify and concentrate on seg-ments that place a high importance on low density – to produce material for ade-marketing strategy to displace visitors who accept high density elsewhere.
Segmented IPA programme vs other satisfaction programmes in parkagencies
A ‘segmented IPA programme’ is a superior technique to that of a ‘homo-geneous IPA programme’ alone, which can fail to recognise distinct differ-ences in niche markets and ultimately lead to the displacement of these visi-tors. Visitors to protected areas are often not a homogeneous group, but havedistinct preferences and perceptions of quality. In fact, two groups of visitorswho use identical facilities within a park, may appear in differing quadrantsof the IPA grid. Segments can both be sampled and studied separately, orcompared and contrasted within the same sample and study. The techniquecan also highlight the existence of segments, as a number of experimental sub-groups could be separated to check for distinct IPA ratings.
A ‘segmented IPA programme’ is also a superior approach to a ‘segmentedperformance only programme’ which only looks at differences amongst satis-faction ratings, but ignores differences in importance. This can produce theerror of assuming that resources should be allocated toward areas with poorservice ratings, despite some service areas not being important to the visitor.
Downloaded By: [Canadian Research Knowledge Network] At: 17:31 9 November 2010
210 Journal of Ecotourism
The dimension of importance or expectation, can signi�cantly improve thequality of the information with a minimal amount of effort.
Issues and limitations of the technique
The diagnostic sensitivity of the technique is limited to the quality and util-ity of visitor segments identi�ed in the sample population. The identity ofvisitor segments needs to be carefully thought through, particularly in thecontext of the managerial implications of the data. A given classi�cation ofsegments may not produce the information necessary to address speci�cconcerns. For example, a park looking at levels of crowdedness may segmentvisitors into campers and day visitors. However, if the park has twocampgrounds – one with a higher density of campsites than the other,important perceptual differences between the two campground user groupsmay be detected if they are separated, revealing the existence of a thirdsegment.
When conducting segmentation, some segments may have small samplesizes – particularly those that are de�ned during the analysis portion of thestudy, or some that constitute a proportionally low percentage of the overallsurvey population (which in fact occurred with special campers in the Sereng-eti study). For behavioural segmentation variables, which can be de�nedbefore the administration of the survey, this problem can be minimised withcompensatory sampling techniques. For others, further study can be conduc-ted on the speci�c segment. It is important to attain a reasonably large samplesize for each segment under study.
The relativity of the gridlines is a potential shortfall of the technique. Theplacement of the gridlines ultimately determines in which quadrant the vari-ables will appear. For example, with gridlines set at importance and perform-ance ratings of 4.0, a variable with an importance rating of 4.5 and a perform-ance rating of 4.02 will fall into the ‘keep up the good work’ quadrant.However, the same variable with a performance rating of 3.98 will now fallinto the ‘concentrate here’ quadrant. However, the performance differencebetween 3.98 and 4.02 may not be sensitive enough to warrant an entirelyopposite managerial interpretation. The goals of the protected area willdetermine the placement of the gridlines.
One option to address this concern would be to conduct statistical tests todetermine whether a mean value such as 3.98 was signi�cantly different fromthe gridline value of 4.0. While a viable option for the statistician, this addsto the complexity of the technique and may not be viable for an agency suchas TANAPA with limited social science expertise. At a bare minimum, a ‘zoneof caution’ could be exercised for all I/P values that fall below a certain range(i.e. 0.05) of the gridline value.
The gap between importance and performance ratings is an issue that mustbe addressed. A variable that lies in the ‘low priority’ quadrant, with animportance rating of 3.5 and a performance rating of 2.0, still has a service gapof 1.5. Despite the variable being less important than others, the gap should benoted. A maximum gap standard should be developed as another way to �agpoor service delivery.
Downloaded By: [Canadian Research Knowledge Network] At: 17:31 9 November 2010

211The Use of IPA and Market Segmentation in Tourism Management
ConclusionImportance–performance analysis coupled with market segmentation is a
useful exercise for protected area managers to measure service quality. Thistechnique is achievable for agencies lacking expertise and resources such asTANAPA, and provides a simple and visual aid for the diagnosis of tourismservice quality in protected areas. It is also a good starting point for agencieswith suitable resources and expertise. It can be complemented with othermethods such as non-parametric statistical analysis, and segments can bepro�led with demographic and economic information to improve the qualityof data further.
It is a superior method to that of a non-segmented approach that views thesample as homogenous. Displacement of niche visitors can be avoided andthe effects of managerial decisions on different groups understood whenvisitors are segmented. In addition, this technique is superior to that of aperformance-only approach, which can lead to incorrect interpretive assump-tions and ultimately a misallocation of funds, since the importance dimensionis not measured.
CorrespondenceAny correspondence should be directed to Derek J. Wade, Health Canada,
Health Policy and Communications Branch, Jeanne Mance Building, Tunney’sPasture, A.L. 1918C, Ottawa, Ontario, Canada K1A 1B4 (derek [email protected]).
ReferencesBurns, T. (1988) Using Importance–Performance Analysis to measure the opinions of
national park concessioners. Proceedings of the 19th Conference on Tourism Research:Expanding Boundaries. Montreal: Travel and Tourism Research Association.
Dolinsky, A.L. and Caputo, R.K. (1991) Adding a competitive dimension toImportance–Performance Analysis: an application to traditional health care systems.Health Marketing Quarterly 8, 61–77.
Duke, C.R. and Persia, M.A. (1996) Performance–Importance Analysis of escorted tourevaluations. Journal of Travel & Tourism Marketing 5, 207–223.
Ennew, C.T., Reed, G.V. and Binks, M.R. (1993) Importance–Performance Analysis andthe measurement of service quality. European Journal of Marketing 27, 59–70.
Guadagnolo, F. (1985) The Importance–Performance Analysis: An evaluation andmarketing tool. Journal of Park and Recreation Administration 3, 13–22.
Hamilton, J. and Crompton, J. (1991) Identifying the dimensions of service quality ina park context. Journal of Environmental Management 32, 211–220.
Hollenshorst, S., Olson, D. and Fortney, R. (1992) Use of Importance–PerformanceAnalysis to evaluate state park cabins: The case of the West Virginia state parksystem. Journal of Park and Recreation Administration 10, 1–11.
Hornback, K.E. and Eagles, P.F.J. (1999) Guidelines for Public Use Measurement andReporting at Parks and Protected Areas. Cambridge, UK and Gland, Switzerland:IUCN.
Hudson, S. and Shephard, G.W.H. (1998) Measuring service quality at tourist desti-nations: An application of Importance–Performance Analysis to an alpine ski resort.Journal of Travel & Tourism Marketing 7, 61–77.
MacKay, K. and Crompton, J. (1988) A conceptual model of consumer evaluation ofrecreation service quality. Leisure Studies 7, 41–49.
Downloaded By: [Canadian Research Knowledge Network] At: 17:31 9 November 2010

212 Journal of Ecotourism
Martilla, J.A. and James, J.C. (1977) Importance–Performance Analysis. Journal ofMarketing 41, 13–17.
Martin, D.W. (1995) An Importance/Performance Analysis of service providers.Perception of Quality Service in the in the Hotel Industry 3, 5–17.
Mengak, K.K., Dottavio, F.D. and O’Leary, J.T. (1986) Use of Importance–PerformanceAnalysis to evaluate a visitor center. Journal of Interpretation 11, 1–13.
Ministry of Natural Resources and Tourism (MNRT) (1997) National Tourism Policy –First Draft. Tanzania.
Morrison, A.M. and O’Leary, J.T. (1994) A comparison of the travel arrangements ofinternational travelers from France, Germany, and the UK. Tourism Management 15,451–463.
Nitse, P.S. and Bush, R.P. (1993) An examination of retail dental practices versus priv-ate dental practices using an Importance–Performance Analysis. Health MarketingQuarterly 11, 207–221.
Parasuraman, A., Zeithaml, A. and Berry, L. (1988) SERVQUAL: A multi-item scalefor measuring consumer perceptions of service quality. Journal of Retailing 64, 12–40.
Uysal, M., Howard, G. and Jamrozy, U. (1991) An application of Importance–Performance Analysis to a ski resort: A case study in North Carolina. Visions inLeisure and Business 10, 16–25.
Vaske, J.J., Donnelly, M. and Williamson, B. (1991) Monitoring for quality control instate park management. Journal of Park and Recreation Administration 9 (2), 59–72.
Vaske, J.J., Beamen, J., Stanley, R. and Grenier, M. (1996) Importance–Performance andsegmentation: Where do we go from here? Journal of Travel and Tourism Marketing5, 161–185.
Wade, D.J., Mwasaga, B.C. and Eagles, P.F.J. (2001) A history and market analysis oftourism in Tanzania. Tourism Management 22, 93–101.
Downloaded By: [Canadian Research Knowledge Network] At: 17:31 9 November 2010