
A Global Success Story in Gaming - Huuuge
35
A Global Success Story in Gaming February 2021
-
Upload
khangminh22 -
Category
Documents
-
view
4 -
download
0
Transcript of A Global Success Story in Gaming - Huuuge

A Global Success Story in Gaming
February 2021

Disclaimer
1
This presentation (“Presentation”) has been prepared by Huuuge, Inc. (the “Company”). By reading the Presentation, you agree to be bound by the following limitations.
This Presentation is strictly confidential to the recipient. Neither this Presentation or any part hereof nor the information contained herein may be reproduced or redistributed, passed on, or the contents otherwisedivulged, directly or indirectly, to any other person or published, in whole or in part.
If you gain access to this Presentation by mistake, or you are not an addressee of this Presentation or a person authorized to use this Presentation, please bear in mind the confidential nature of this Presentation andimmediately contact the Company in order to return it to the Company.
The Presentation does not constitute an offer to sell or subscribe for or a solicitation of an offer to purchase or subscribe for securities. This Presentation is provided for informational purposes only. This Presentationdoes not constitute or form part of and should not be construed as an offer, solicitation or invitation to sell or issue, or an offer, solicitation or invitation to, subscribe for, underwrite, buy or otherwise acquire, securitiesof the Company or any of its subsidiaries in any jurisdiction, or an inducement/recommendation to enter into investment activity in any jurisdiction. Neither this Presentation nor any part hereof, nor the fact of itsdistribution or issuance, shall form the basis of, or be relied on in connection with, any contract, commitment or investment decision whatsoever.
The information contained herein is only preliminary and indicative and does not purport to contain the information that would be required to evaluate the Company, its financial position and/or any investmentdecision. This Presentation is not intended to provide, and should not be relied upon for, accounting, legal or tax advice nor does it constitute an investment recommendation. This Presentation is given in conjunctionwith an oral Presentation and should not be taken out of context.
No information included in this Presentation may be considered as investment advice or investment recommendation. The information contained in the Presentation has not been independently verified. Norepresentation, warranty or undertaking, expressed or implied, is made as to, and no reliance should be placed on, the fairness, accuracy, completeness or correctness of the information or the opinions containedherein.
Matters discussed in this Presentation may constitute forward-looking statements. Forward-looking statements constitute statements that are other than statements of historical fact. Statements which include thewords “expects”, “intends”, “plans”, “believes”, “projects”, “anticipates”, “will”, “targets”, “aims”, “may”, “would”, “could”, “continue” and similar statements of a future or forward-looking nature identify such forward-looking statements. Forward-looking statements include in particular statements regarding the financial performance, business strategy, plans and objectives of the Company for future operations (including growthpotential). All forward-looking statements included in this Presentation address matters that involve known and unknown risks, uncertainties and other factors which could cause the Company’s actual results,performance or achievements to differ materially from those indicated in such forward-looking statements and from past results, performance or achievements of the Company. Such forward-looking statements arebased upon various assumptions and estimates regarding future events, including numerous assumptions regarding the Company’s present and future business strategies and future operating environment. Althoughthe Company believes that these estimates and assumptions are reasonable, they may prove to be incorrect.
The information, opinions and forward-looking statements contained in this Presentation speak only as at the date of this Presentation and are subject to change without notice. The Company, its directors, agents,employees and advisors do not intend to, and expressly disclaim any duty, undertaking or obligation to, make or disseminate any supplement, amendment, update or revision to any of the information, opinions orforward-looking statements contained in this Presentation to reflect any change in events, conditions or circumstances. To the extent permitted under the applicable provisions of law, neither the Company nor any oftheir affiliates, advisers or representatives shall have any liability whatsoever (in negligence or otherwise) for any loss however arising from any use of this Presentation or its contents or otherwise arising inconnection with this Presentation.
This Presentation is not for distribution or use by any person or entity in any jurisdiction where such distribution or use would be contrary to local law or regulation or which would subject the Company or any of itsaffiliates to authorization, notification, licensing or other registration requirements under applicable laws. Any failure to comply with this restriction may constitute a violation of United States securities laws. Personsinto whose possession this Presentation comes should observe all such restrictions.
.

AgendaPage
Introduction to Huuuge Games 01 3
Key investment highlights 02 8
Financial performance03 27
2

MISSION:Empower billions of
people to play together
VISION:Transform mobile gaming into a massively social experience
3

New and expanded global strategic partnerships
A Huuuge track record of success
2002
First studio in Poland2006 Gamelion
Sold2007
Mobile FIFA Soccer 3D
(EA Sports)
Gamelionbought back
Gamelion becomesHuuuge
2014
Huuuge CasinoMarket launch
2015
Billionaire CasinoMarket launch
2016
Expanded intocasual market
2019
$100m revenue surpassed
2017
$200m revenue surpassed
2018
Multiple new offices opened
Las Vegas office
opened
4 new publishing deals2020
Source: Company data
First acquisitions:
First publishing release
Gamelion incorporated
in Finland
4

Huuuge Games at a glance
Source: Company dataNote: 1 Average Revenue Per Paying User; 2 Average Revenue Per Daily Active User; 3 Monthly Active Users; 4 Including two external studios in Kiev and Hong Kong; 9M 2020 financials are based on management’s unaudited reports; 9M 2020 operational data has neither been reviewed nor audited
$316mRevenue
(LTM 30-Sep-20)
28%Revenue CAGR
(2017 –LTM 30-Sep-20)
$32ARPPU1
(9M 2020)
$0.92ARPDAU2
(9M 2020)
5mAverage MAUs3
(9M 2020)
600+Team members
7.2%MAU3 payer
conversion % on core franchise
(9M 2020)
10Offices across the
globe4
200m+Player interactions
Who we are: A global game developer and publisher focused on the multi-billion, fast growing mobile gaming market
What we do best: Develop, publish and operate mobile games at scale
Why we excel: Best-in-class free-to-play game monetisation
5

Basics of social mobile gaming
Source: NewZoo, Mediakix
Who plays? Why do they play? Why do they make in-app purchases?
EVERYONE2.7bn mobile gamers in 2021E
38%of which make in-app purchases
65%of global players are women
50%+of gamers are older than 34
Entertainment / playtime
Extra bonuses / content
Social network effect
Accelerated in-game progressionand improved performance for rankings
Fun and entertainingway to pass the time and relax
Accessible, low-cost form of entertainmentthat can be played anywhere, 24/7/365
Attractive social featuresretain users and promote play time
Provides an emotional outletor distraction for users to access anytime
Broad audience allows broad social networks and player “liquidity” and can be monetized through in-app purchases and advertising
6

Overview of our core franchises
Source: Company data; 9M 2020 operational data has neither been reviewed nor audited
➔ Our games are free to play, and primarily monetized via in-app purchases
➔ Innovative game mechanics and social features in our games maximize payer conversion and allow our core games to achieve above-market results
➔ We engage our players in personalised activities to retain them
➔ In particular, we focus on Live Ops including various features from daily challenges to periodic large events
➔ Our unique social features also drive the deep engagement and exceptional monetization profile of our players
Huuuge Casino Billionaire Casino
➔ Huuuge Games’ flagship title with over $600m in lifetime
revenue across iOS, Android and Facebook
➔ Offers players over 100 casino slot machines, as well as poker,
baccarat and roulette
➔ Huuuge Casino is a pioneer in the social casino space, with its
truly mobile-first user experience and real-time player vs.
player-style gameplay
➔ First game to introduce features like clubs to social casino
WHYHAVE THEY BEEN SO SUCCESSFUL?
➔ Billionaire Casino’s revenue has grown rapidly since its
release with over $250m in lifetime revenue
➔ Offers players over 100 casino slot machines, as well as poker,
baccarat and roulette
➔ Differentiated aesthetic from Huuuge Casino attracts additive
player base
➔ Allows players to create a club with their friends or join a club
and meet new people while playing slot machines
Launched in 2015 Launched in 2016
Huuuge Casino
Billionaire Casino
1.5m monthly active users (9M 2020)
1m monthly active users (9M 2020)
7

Agenda
Introduction to Huuuge Games 01
Key investment highlights 02
Financial performance03
8
Page
3
8
26

A ‘Huuugely’ exciting and differentiated proposition
Massive and rapidly growing mobile gaming market1
Leader in truly social mobile gaming with proven games and attractive pipeline2
Upside from highly valuable user base and best-in-class monetisation metrics3
Fast growing top line and cash flow generation underpinned by scalable business model 4
Proven Build & Buy strategy with robust and growing pipeline of opportunities 5
Founder-led, visionary and experienced team with a strong track record of success6
9

Global consumer spend on entertainment($bn, 2019)
Mobile fuels gaming growth(2020E - 2022E revenue CAGR)
Mobile gaming is the place to be!
$75
$101
$116 $119
$36
$48
$69Mobile
Console
$152
Video Games
Consumer Books
TVFilm(HE&WWBO)
Music(Rec.& Live)
PC
20-22E CAGR(3) 9.1%
74%App store revenue comes
from gaming apps
4.8bnMobile devices globally
5.5%Smartphone growth
CAGR(1)
#1Source of gaming spend
$22bnGlobal market for casual
games
Surpassed TV
In time spent on device
45%
32%
23%
Source: Newzoo , IBISWorld, Motion Picture Association, IDC, eMarketer, SensorTower, Eilers & KrejcikNote: 12019A – 2021E growth CAGR; 2Includes in-app purchases and advertising revenue; 32020E – 2022E CAGR for all video games
115bnTotal App Store and Google
Play downloads (2019)
$82.6bnGlobal smartphone and tablet gaming revenue(2)
10
12.6%
9.1%
1.8%
Mobile
Console
PC
Mobile gaming is the present and future of entertainment1

2
Large, disruptive gaming social platform, with tremendous scalability…
➔ First true real-time online massive multiplayer game in the social casino genre offering a unique social experience
➔ 200m+ player interactions creating an active network of players who like to play together, have fun, compete and socialize
➔ 195 countries
➔ 200,000+ clubs
…driving stickiness and increasing monetization
➔ 43% of MAUs1 are part of a club2
➔ 74% of paying users are part of one or more clubs2
➔ 85% of paying users interact with other players via club systems, chats and leagues2
Source: Company dataNote: ¹ Monthly Active Users; 2 As of September 2020
Platform provides engaging social meta-game layer
200m+ PLAYER INTERACTIONS
The first truly social, social casino games
Screenshot showcasing Huuuge Casino lobby where players around the world meet
11
Smart social network architecture is difficult to replicate

2
Clubs in our games
Social meta
➔ Club league system – weekly competitive leaderboard
➔ Club events – daily tasks for club members
➔ Additional benefits for playing the same game at the same time
Communication
➔ Club chat and emojis
➔ Club wall (forum)
Advanced, next generation club benefits
➔ Members get a bonus / reward if a member of their club makes a purchase or wins a jackpot
Source: Company data
Our club systems enhance engagement and monetisation
12
Clubs keep players active and engaged, increasing retention

Source: Company dataNote: 1Includes Huuuge Casino and Billionaire Casino, revenue-weighted; 2 Blend of core portfolio, new franchises and otherDAU: Daily Active Users; MPU: Monthly Paying Users; MAU: Monthly Active Users; ARPDAU: Average Revenue Per Daily Active User; 9M 2020 operational data has neither been reviewed nor audited
Core franchises¹
Overall company2
Track record of incremental payer conversion years after initial acquisition
13
509
772 769648
2017 2018 2019 9M 2020
DAU (Thousands)
4.9%6.2% 6.5%
7.2%
2017 2018 2019 9M 2020
Conversion (MPU/MAU)
$0.80 $0.83 $0.90
$1.30
2017 2018 2019 9M 2020
632851 911 965
2017 2018 2019 9M 2020
4.2% 5.5% 5.5%
4.4%
2017 2018 2019 9M 2020
$0.66$0.76 $0.78
$0.92
2017 2018 2019 9M 2020
ARPDAU ($)
DAU (Thousands) Conversion (MPU/MAU) ARPDAU ($)
Impressive user KPIs3

Source: Company informationNote: 1 Average Revenue Per Daily Active User; operational data has neither been reviewed nor audited
Quarterly revenue cohorted by year of install ($m)
Avg. ARPDAU1
$0.60
Avg. ARPDAU1
$1.50
Ability to retain the best users from older cohorts with superior
monetisation
14
3 Our games have an evergreen nature and a sticky player base

Our core portfolio has above-average monetisation vs. peers3
Source: Company data; Eilers & Krejcik; Peer set shown for core franchise only Note: 1Average Revenue Per Daily Active User; 2Average revenue per user shown (ARPU); Company 9M 2020 operational data has neither been reviewed or audited
ARPDAU1 ($)
ARPDAU across our core portfolio materially exceeds that of our closest competitors, driven by our loyal and active player base who are attracted by our social centric games
15
9M 2020
$1.30
$1.05
$0.88 $0.86 $0.84
$0.59
$0.40
(Social Casino)
22
(Core portfolio) (Social Casino)
2

Bra
ve
Marketing tech,
product and BI
Tech
16
UA and Retargeting
User Acquisition Retargeting
App store optimisation Organic growth
Search Social Networks
Reactivation of dormant
players
Reengagement of active players
Creatives
All Formats -Playable Ads, Video, Static
Tools and product - self optimising, reporting
consolidation, performance optimization
Ad-Monetization
Day-to-dayad
monetization optimization
Game / product implementation,
placement, reward type,
segmentation
Marketing
Relationships with partners
Cross promotion
Huuuge marketing overview and strategy3

4 Huuuge Games’ financial performance is strong vs. global peers
17
’17A1 – LTM 30-Sep-20 revenue increase (%)
1,832%
279%
108%105%
99%
79%
52%
Source: Company dataNote: 1Calendarised to December end

➔ Continued acceleration and momentum
➔ Monetisation has continued to improve and December trends are encouraging
➔ Strong performance of new franchises, achievingupper-end of single digit percent share of total revenue in Q4 2020 and achieving double digit percentage share in December 2020
➔ Also held successful, popular live events related to Black Friday, Christmas and New Year’s Eve
➔ Organic uplift in Trolls Pop due to Google Play award
➔ Bytedance has offered to extend our Bow Land China deal
➔ Initial launch in Jan 2021 on Douyin, the top short-form video sharing network in China (600+ million DAU)
➔ Significant growth of Brave division and strong December performance particularly for Traffic Puzzle and Dominoes given UA spend ramp up
18
Overall company1
632
851911
945-955
2017 2018 2019 2020
DAU (Thousands)
Commentary
Source: Company dataNote: 1 Blend of core portfolio, new franchises and otherDAU: Daily Active Users; ARPDAU: Average Revenue Per Daily Active User
ARPDAU ($)
$0.66
$0.76 $0.78
$0.945-$0.965
2017 2018 2019 2020
4 Trading update

19
4 Our new franchises portfolio continues to exhibit strong momentum
Snapshot of key new game launches New franchises daily paying users quarterly trend
Game Global launch Key highlights
Traffic Puzzle April 2019 ➔ DAU more than doubled for 2020 vs. 2019
➔ 4Q20 gross bookings exceeded 2Q20 and 3Q20 combined
Coffee BreakGames
2019 - 2020 ➔ 10.1m installs (Since Feb-19)
➔ 1.1 m MAUs1 (Dec-20)
➔ DAU2 more than doubled for 2020 vs. 2019
Stars Slots January 2020 ➔ 2.7m installs (since Jan-20)
➔ MAUs1 up ~97% from launch to Dec 2020
Source: Company dataNote: 1 Monthly Active Users; 2Daily Active Users; Operational data has neither been reviewed or audited
We continue to see strong growth and momentum across our new franchises portfolio as we scale and invest in each title!
93 324
2,573
2,981
2,469 2,619
2,927
3,913
Q1 Q2 Q3 Q4
2019 2020

20
4 Traffic Puzzle case study The Publishing studio’s debut title proved to be an early success, and is still full of potential
➔ Unique casual puzzle game inspired by the top-grossing match-3 mechanics
➔ Innovative matching game play unseen in competitor titles
➔ An appealing, under-utilised theme (automotive) positions Traffic Puzzle away from “Home Ownership” and food-themed incumbents
➔ Strong long-term retention
➔ Encouraging development progress and ability to scale the product via paid user acquisition
➔ The company’s first foray into the large, high-value puzzle game market
➔ User segmentation and personalised offers
➔ Smart ad-monetisation
➔ Time-limited events with different rules and visuals
WHATMAKES IT DIFFERENT?
WHYDOES IT EXIST?
HOWDO WE GROW IT?
Rapid ramp-up and strong performance
➔ Achieved via high-end playables and Huuuge’s self-optimising creative engine
$28k $67k
October 2020 December 2020
We more than doubled Traffic Puzzle daily revenue in Q4 2020

Multiple organic growth avenues across products and operations5
Rapid revenue growth magnified by high operating leverage
Continue to leverage lower cost developers
Margin improvement
Curated game economies increase engagement
Growing DAU with existing games
Social aspect helps drive incremental conversion vs. typical
mobile gaming product
Increasing payer conversion
More recent cohorts showing higher monetisation
Increasing ARPPU on existing users
21
Strong pipeline of new games
New product development
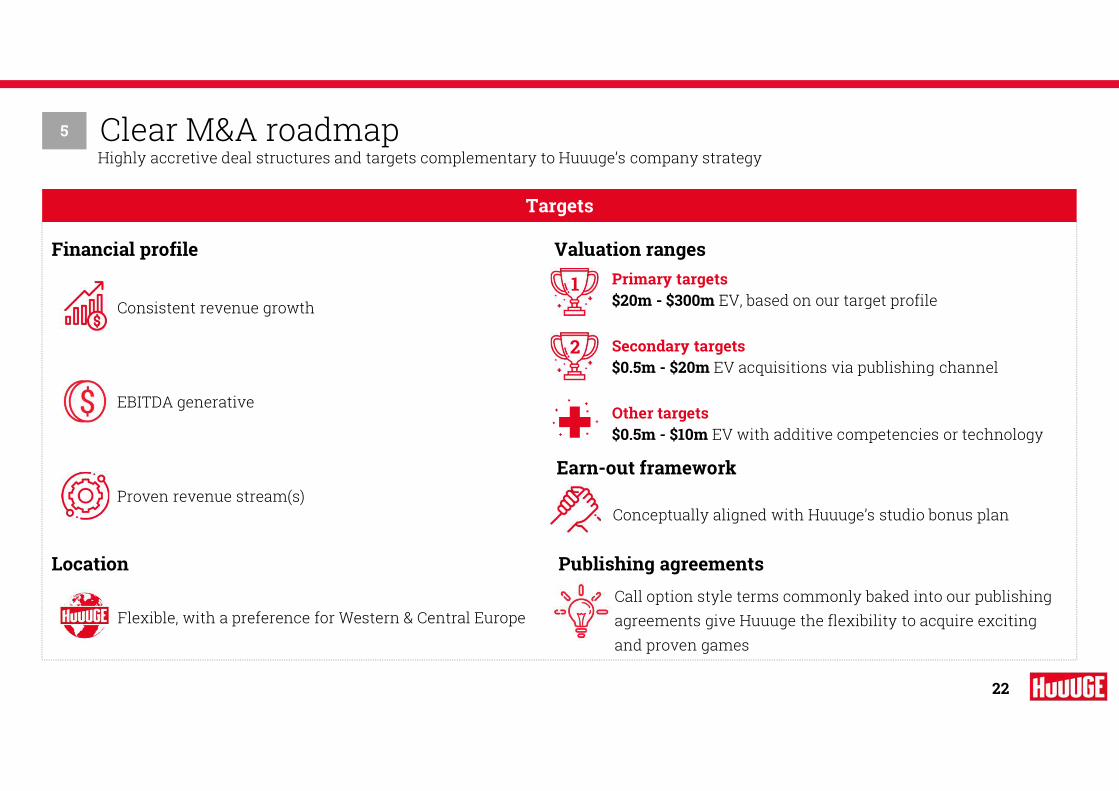
Clear M&A roadmapHighly accretive deal structures and targets complementary to Huuuge’s company strategy
22
Targets
Financial profile
Consistent revenue growth
EBITDA generative
Valuation ranges
Location
Flexible, with a preference for Western & Central Europe
Proven revenue stream(s)
Primary targets$20m - $300m EV, based on our target profile
1
Secondary targets$0.5m - $20m EV acquisitions via publishing channel
2
Earn-out framework
Conceptually aligned with Huuuge’s studio bonus plan
Publishing agreements
Call option style terms commonly baked into our publishing agreements give Huuuge the flexibility to acquire exciting and proven games
5
Other targets$0.5m - $10m EV with additive competencies or technology

TreasureHunt GmbH
Developer of casual, F2P mobile games. Developer of Trolls Pop! and following the acquisition, of Huuuge Bubble Pop Story.
The assets of TreasureHunt were acquired, and the team hired into our existing Berlin Studio.
Location Berlin
Playable Platform B.V.
Advertising technology company focused on the creation of interactive, or “playable” advertisements.
Acquiring Playable Platform meant internalising a valuable service provider to Huuuge and previously, our competitors.
Location Amsterdam
Double Star Oy
Developer of casual, F2P mobile games, founded by early Rovio employees behind Angry Birds: one of the most successful mobile games to-date.
Developer of Bow Land; our Publishing studio’s fourth product.
Location Helsinki
Deal Status Closed, February ‘20 Deal Status Closed, June ‘20 Deal Status Closed, July ‘20
Consideration < $5.0M
Deal Source Inbound
Consideration < $5.0M
Deal Source Marketing Partner
Consideration < $35.0M
Deal Source Publishing Partner
23
Recently completed transactions5

The Huuuge team has an extensive history of successfully executing and integrating transactions
24
5
by
by
Minority Investments
Acquisitions
Sellsides
to
to
to
to
to
Acquisitions
Sellsides
LPs
by
by
by
by
to
Acquisitions
Advisory
Minority Investments
by
LPs
Minority Investments(30+ in total)
Acquisitions
Sellsides
by
to
to
to
to
byto
by
Sellsides
Acquisitions
Minority Investments
The team has executed 15+ acquisitions, 25+ investments and 4 listings totalling $7bn+ in transacted value to date
Anton Gauffin Jon Bellamy Elad Kushnir Maciej Hebda Tal Shoham

Las VegasUnited States
LondonUnited Kingdom
DublinIreland
AmsterdamNetherlands
SzczecinPoland
BydgoszczPoland
WarsawPoland
HelsinkiFinland
Hong KongHong Kong
LimassolCyprus
Tel AvivIsrael
KievUkraine
25
Founder-led, entrepreneurial and truly global team6
600+ team members from around the world
Anton GauffinCEO
HelsinkiLeading Team Huuuge on their wayto championship.

Agenda
Introduction to Huuuge Games 01
Key investment highlights 02
Financial performance03
26
Page
3
8
27

$(4)
$10
$25
$9
$55
2017 2018 2019 9M2019
9M2020
Huuuge’s strong track record of revenue growth across franchises has led to substantially improved EBITDA performance
$152
$236$259
$187
$244
2017 2018 2019 9M 20199M 2020
27
Revenue ($m) Adj. EBITDA and % margin ($m)
4%
10%
5%
Source: Company information, audited financials.Note: 9 months ended 30-Sept-19 and 9 months ended 30-Sept-20 financials are based on management’s unaudited reports
23%

2.2%2.5%
2.8% 2.8%
2.6% 2.7%
3.1%
3.7%
0.5%
1.5%
0.9%
2017 2018 2019 9M 2020
13
2124 24
14
21
2527
2017 2018 2019 9M 2020
Our franchises continue to attract new users while our ability to convert customers into payers drives top-line performance
28
DAU (thousands) DPU (thousands)Conversion
509
772 769648
632
851911
965
2017 2018 2019 9M 2020
Core franchisesNew franchises
Core franchisesNew franchisesConsolidated
DAU: Daily Active Users; Conversion: DPU/DAU; DPU: Daily Paying UsersNote: Core franchises includes Huuuge Casino and Billionaire Casino; consolidated figures represent the blend of core franchises, new franchises and other
Focused investments in higher value gamers…
…and Huuuge’s ability to improve users’ in-game experiences and
monetisation…
…generates continued growth in the number of paying users
Core franchisesNew franchises

Improving monetization drives growth in our core franchises
29
Core franchise DAU (thousands) Core franchise revenue ($m)Core franchise ARPDAU ($ cents)
509
772 769
648
2017 2018 2019 9M 2020
$0.80 $0.83$0.90
$1.30
2017 2018 2019 9M 2020
➔ Social connectivity enhances productivity
➔ 85% of paying users interact with other playersvia club systems, chats and leagues
➔ 73% of paying users are part of one or more clubs
➔ 43% of MAUs are part of a club
ARPDAU: Average Revenue Per Daily Active UserSource: Company data Note: Core franchises includes Huuuge Casino and Billionaire Casino; 9 months ended 30-Sept-20 financials are based on management’s unaudited reports
$148
$233
$184
$231Q4
$252
2017 2018 2019 9M 2020
26% growth 9M 2019 vs. 9M 2020
9MSep
Significant improvements in targeting since 2019 have led to longer sessions, better monetization and improved long-term user retention
➔ Focus is on optimizing the core franchise user base
➔ For IAP focused games, DPUs drive growth
➔ Huuuge is investing in higher ROI users, not just users
➔ Leveraging data analytics improves targeting
➔ DPUs and conversion rates are increasing
Decline in DAU resulting from strategy to optimize the user base by focusing
on DAUs with higher LTVs
Product and operations drive longer sessions
---Live ops and new features---
Marketing opportunities to propel growth
---Retargeting---
---Expand iOS share---
---Increase US market penetration---
Product and operations drive longer sessions
---Live ops and new features---
Marketing opportunities to propel growth
---Retargeting---
---Expand iOS share---
---Increase US market penetration---

Franchise growth and operating scale is fueling our expanding profitability ➔ Historical investments in user acquisition have converted into additional payers and improved top-line
➔ Improved user acquisition spend as a percentage of revenue is complimented by better targeting and reactivation of existing users
➔ Huuuge benefits from operating leverage as the core franchises continues to scale and UA dollars invested in new franchises
Sales margin: Ratio of the return on sales and revenue. Return on sales: gross profit / (loss) from the sales less the cost of external marketing and sales servicesNote: 9 months ended 30-Sep-19 and 9 months ended 30-Sep-20 financials are based on management’s unaudited reports
User Acquisition as a % of revenue Sales margin (%)
67%
56%
48%52%
31%
2017 2018 2019 9M 2019 9M 2020
4%
14%
22%18%
39%
2017 2018 2019 9M 2019 9M 2020
Conservative spend through Jun’20 as a result of COVID, on top of improved efficiency of our market spend
30

Core return on sales growth enhances cash generation and the ability to scale new franchises
➔ Enhanced monetization of existing cohorts results in meaningful result on sales growth
➔ Stable growth in core franchises enables investment to scale new and high growth franchises
➔ New franchises require time to implement networking effects and scale
➔ New franchise installs up 218% YoY through 9 months ended 30-Sep-20
1Return on sales: Gross profit / (loss) from the sales less the cost of external marketing and sales servicesNote: 9 months ended 30-Sep-19 and 9 months ended 30-Sep-20 financials are based on management’s unaudited reports. Cost of external marketing implied based on core franchise eCPI and total installs
$3
$34
$69
$41
$107
2017 2018 2019 9M 2019 9M 2020
Core franchise return on sales(1)
Salesmargin 2% 15% 27% 22% 47%
31
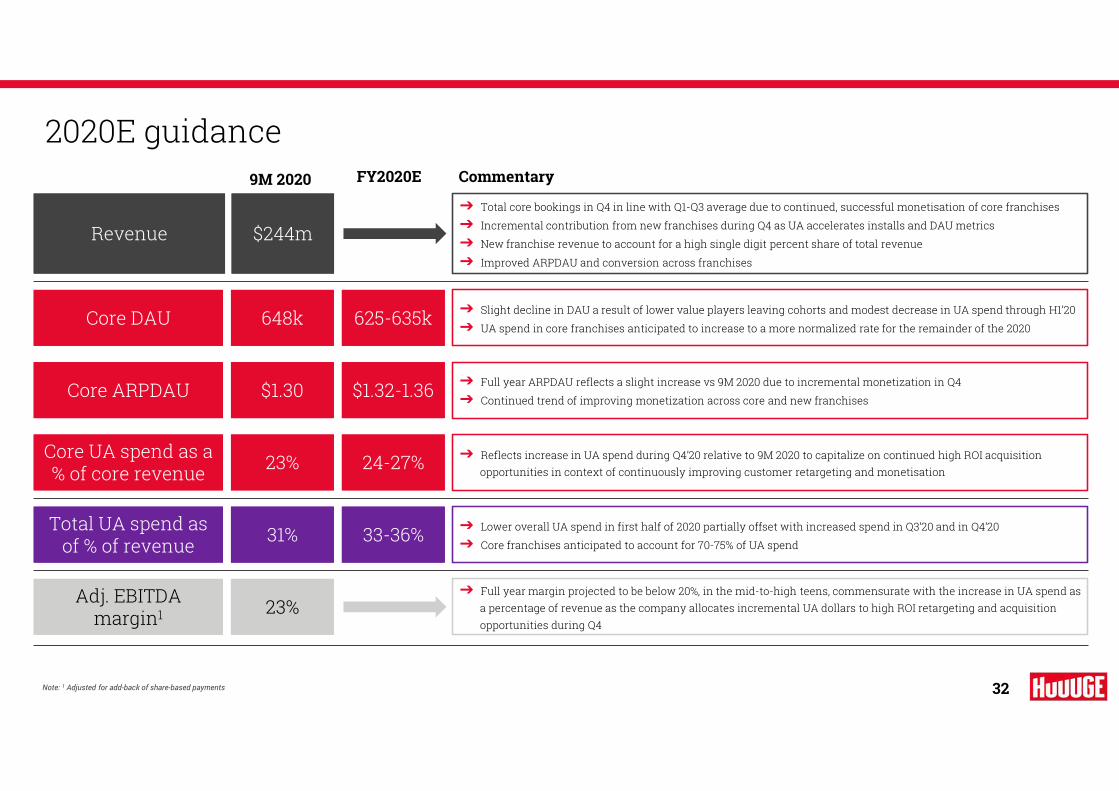
2020E guidance
RevenueRevenue
Core ARPDAUCore ARPDAU
Adj. EBITDA margin1
Adj. EBITDA margin1
➔ Slight decline in DAU a result of lower value players leaving cohorts and modest decrease in UA spend through H1’20
➔ UA spend in core franchises anticipated to increase to a more normalized rate for the remainder of the 2020
➔ Full year ARPDAU reflects a slight increase vs 9M 2020 due to incremental monetization in Q4
➔ Continued trend of improving monetization across core and new franchises
➔ Reflects increase in UA spend during Q4’20 relative to 9M 2020 to capitalize on continued high ROI acquisition opportunities in context of continuously improving customer retargeting and monetisation
$1.30$1.30
Core DAUCore DAU 648k648k
Core UA spend as a % of core revenue
Core UA spend as a % of core revenue 23%23%
Total UA spend as of % of revenue
Total UA spend as of % of revenue 31%31%
➔ Full year margin projected to be below 20%, in the mid-to-high teens, commensurate with the increase in UA spend as a percentage of revenue as the company allocates incremental UA dollars to high ROI retargeting and acquisition opportunities during Q4
➔ Lower overall UA spend in first half of 2020 partially offset with increased spend in Q3’20 and in Q4’20
➔ Core franchises anticipated to account for 70-75% of UA spend
➔ Total core bookings in Q4 in line with Q1-Q3 average due to continued, successful monetisation of core franchises
➔ Incremental contribution from new franchises during Q4 as UA accelerates installs and DAU metrics
➔ New franchise revenue to account for a high single digit percent share of total revenue
➔ Improved ARPDAU and conversion across franchises
Commentary
$1.32-1.36$1.32-1.36
625-635k625-635k
24-27%24-27%
33-36%33-36%
$244m$244m
23%23%
9M 2020 FY2020E
32Note: 1 Adjusted for add-back of share-based payments

Core DAUCore DAU
Mid-term guidance
RevenueRevenue
Core ARPDAUCore ARPDAU
Adj. EBITDA margin1Adj. EBITDA margin1
➔ Modest annual decline in DAUs as the company leverages data science capabilities to focus on targeting & retargeting higher LTV players
➔ Low- to mid-teen growth in line with recent improvements as core franchises recognize superior monetisation of aging cohorts
➔ Emphasis on converting DAUs to DPUs and data driven enhanced monetisation lead to further improvements in ARPDAU
➔ Core UA spend targets in line with 2020 spend as a % of core revenue as the company shifts incremental investment towards new franchise growth
➔ 2021E investment is anticipated to be approximately 200-300 bps higher than mid-term as the company focuses on high ROI retargeting UA initiatives
$1.60-1.80$1.60-1.80
575-625k575-625k
Core UA spend as a % of core revenue
Core UA spend as a % of core revenue 25-28%25-28%
Total UA spend as of % of total revenue
Total UA spend as of % of total revenue 32-35%32-35%
➔ Near-term margins anticipated to be in line with 2020E due to incremental public company costs and increased investment in UA for 2021➔ Margins are anticipated to be lower during the first half of 2021 than the second half of 2021 due to our planned weighting of both core and new
franchise UA spend to the first part of the year, which should also result in revenue acceleration in H2, especially for new franchises
➔ Improving sales margin on new franchises driving a mid-term margin target above 20%, closer to 9M 2020 margins
➔ Total spend anticipated to remain in line with 2020 targets as a percent of total gross bookings, with slightly higher level in 2021 to support the ramp up of new fast-growing franchises
➔ Spend on new games growing from approximately 1/3 of total UA spend in 2021 to approximately 1/2 in mid-term as new games scale, with total spend for 2021 at the high end of the range
➔ New franchise return on sales is expected to break-even for 2021, then grow as new games scale in the mid-term
➔ Annual growth anticipated to be in line with 2020E
➔ Continued growth in monetisation across the full portfolio through both IAP and IAA initiatives
➔ More than half of the company’s growth is anticipated to be generated from new franchises, with a significant acceleration in DAUs
➔ New franchise revenue expected to grow from high teens percent of total revenue in near-term to high twenties in the mid-term
Commentary
33Note: 1 Adjusted for add-back of share-based payments

THANK YOU!