French cosmetics in China, a success story for L'Oreal
112
Academic Year 2019-2020 FRENCH COSMETICS IN CHINA, A SUCCESS STORY FOR L’OREAL: NEW OPPORTUNITIES IN BRAZIL? Master thesis to obtain a master degree in Management Engineering Valentine LEFEBVRE Supervisor: Lucia Tajoli
-
Upload
khangminh22 -
Category
Documents
-
view
3 -
download
0
Transcript of French cosmetics in China, a success story for L'Oreal
Academic Year 2019-2020
FRENCH COSMETICS IN CHINA,
A SUCCESS STORY FOR
L’OREAL: NEW OPPORTUNITIES
IN BRAZIL?
Master thesis to obtain a master degree in Management Engineering
Valentine LEFEBVRE
Supervisor: Lucia Tajoli

Preface
Summarizing my work by writing these few words, I believe that it could be interesting to share my
current state of mind.
The thesis that you are going to read is not only the result of hundreds of hours of research, information
gathering, writing but also of correction and uncertainty. During all of these hours, I worked on a subject
in which I am interested for years: the cosmetics sector. The choice of China and Brazil became obvious
to me after attending the “International markets and European institutions” course at Politecnico di
Milano University. In May 2019, after two months of research and some meetings with my supervisor,
I doubted about my subject. Indeed, the subject was vast and complex. Therefore, together with my
Italian supervisor, we decided to focus on French cosmetics. Following those meetings, I was wondering
how the French cosmetics brands become popular in China. If China was a success, what are the
opportunities in a country where beauty is part of culture?
Despite being original in this content, I expect my answers to give the most real predictions, taking into
account as many objective opinions as possible. In case the reader would be keen to gather more detailed
information about a precise subject that I discussed in this thesis, I would recommend to consult one of
the many documents in references.
Afterwards, I would like to thank both of my supervisors, Lucia Tajoli and Sandra Rothenberger, for
the precious feedback that help me to write this paper.
I am also grateful to the Université Libre de Bruxelles as well as the Solvay Brussels School that allows
me to grow and to spend a year in Milan.
Furthermore, I think it is important to thank Laurence Borgs, Quentin Mabille, Aubry Locht, and all my
friends for their precious rereading and comments.
Last but not least, I would also underline that I am grateful for all the support that my parents, my sisters
and my brother gave me to become what I am today.
Valentine LEFEBVRE Politecnico di Milano, 6th January 2020

“The future belongs to those who believe in the beauty of their dreams” - Elisabeth Roosevelt, U.S. First lady, diplomat, human rights activist

EXECUTIVE SUMMARY
This paper aims to determine if the future growth opportunities for French cosmetics companies
in Brazil will be similar to the actual booming ones in China. The Brazilian consumers’
behaviour is going change in line with trends already existing in China (e.g. skincare segment
booming and the rise e-commerce channel distribution). Hence, French cosmetics enterprises
could apply similar marketing strategies to reach new customers and to develop new
opportunities.
Beauty has always played a major role in the different cultures around the world. Its usage
evolved over time, from the makeup of the Ancient Egypt to the innovative anti-ageing creams.
Furthermore, the cosmetics market grows by 5% each year over the last ten years due to change
in consumers’ habits around the world. Hence, cosmetics companies are likely to continue to
expand in the near future. Today, five main companies1 are leading this market due to the
globalization. France remains the leader in export of cosmetics, due to the performances of the
group L’Oréal (€26.9billion of turnover in 2018). France conquered firstly the European
cosmetics market with its “Made in France” brand image. Once this market became mature in
the early 2000s, French cosmetics brands needed to expand.
Indeed, China becomes today the second largest consumer’s cosmetics market. Nevertheless,
barriers to entry in this market are significant (e.g. strict regulations, government subsidies due
to corruption, cultural distance). Due to new technologies (e.g smartphone, internet), French
cosmetics firms needed to adapt their distribution channel. Especially in China where 73.6% of
the internet users bought at least once online in 2018. (Blazyte, 2018) Besides, Chinese
consumers shifted their cosmetics’ purchase behaviors from the “Made in China” (perceived as
low-cost and low-quality products) to the “Made in France” (perceived as premium products).
Therefore, the success of French cosmetics brands came from the better understanding of the
Chinese consumers’ needs. For ten years, French cosmetics brands grew in China and will
continue to face tremendous opportunities in the near future (e.g. men products, e-commerce,
taking advantages of the trade war between the US and China).
1 L’Oréal, Unilever, Estée Lauder, Shiseido and Procter&Gramble
7
On the other side of the world, there is a country with growth opportunities in the beauty
industry: Brazil. Brazilian pay more attention to their appearance than people from others
countries. Hence, the cosmetics market is one of the motor of the Brazilian economy. Since
Brazil has already main international platforms (e.g. Amazon or Ebay) used by consumers, e-
commerce could be a successful growth opportunity for French cosmetics’ distribution.
In 2019, Brazil is the third largest consumer market of cosmetics in the world. As a matter of
fact, between 1996 and 2012, the Brazilian cosmetics market increased by 10% while the
country GDP increased only by 3%. (Brazilian Association of the Cosmetics Toiletry and
Fragrances Industry, Abihpec, 2013) Furthermore, during the financial crisis of 2008, Brazilian
cosmetics market experienced a considerable growth of 281% compared to a growth of 142%
for the global sector. (L’Oréal, 2014) What is more the Brazilian cosmetics market tends to
move from mass market to a premium one2. In 2018, L’Oréal and other cosmetics firms are
mainly growing in the luxury and skin care segments (the most premium ones). Consequently,
this nation constitutes a potential growing opportunity for them.
It is important to note that French cosmetics companies are today less competitive than the
domestics ones in this country. For instance, L’Oréal3 holds only 4% of the market shares in
the Brazilian cosmetics market. Hence, the main question remains knowing if the incredible
growth of 33% recorded recently by L’Oréal in China could be experienced in Brazil in the
near future. (Xhinhua, 2019)
The parallelism between China and Brazil seems interesting for several reasons. Indeed, China
and Brazil were overgrowing at a high rate since the trade liberalization. Due to the rise of
purchase power, a new social class in both countries emerged: the middle social class. This new
social class contributes to the change of cosmetics consumptions’ habits. The latter provide
opportunities to French cosmetics companies to reach new customers and new markets. Even
though these countries are culturally and politically different, major similarities in terms of the
beauty industry exist (e.g most promising market, skincare boom).
2 Premium market experienced a CAGR of 15.2% between 2010 and 2015 while mass market registered only 8.7% of
CAGR. (Weinswig,2016) 3 L’Oréal is chosen because it is the most representative group of French brands in the world.
8
To conclude, the Brazilian market could become as important as China regarding e-cosmetics,
especially in the skin care segment. Nevertheless, all opportunities for the French cosmetics
companies rely heavily on consumers’ needs and technology availability. Therefore, the trends
of cosmetics consumption could change after ten years. Indeed, French companies have to pay
attention to future challenges such as change in consumer’s habits, potential protectionism
policy or even a change of mindset to accept foreign investments.
9
Table of Contents
INTRODUCTION .......................................................................................................................... 11
CHAPTER 1: COSMETICS MARKET’S HISTORY AND TRENDS .......................................................... 13
1.1 A BRIEF HISTORY OF THE COSMETICS MARKET ........................................................................................ 13
1.2 COSMETICS MARKET IN EUROPE .......................................................................................................... 17
1.3 COSMETICS MARKET IN FRANCE: ......................................................................................................... 19
1.3.1 French cosmetics exports...................................................................................................... 21
1.3.2 French cosmetics trough e-commerce channel .................................................................... 22
1.4 COSMETICS MARKET FUTURE TRENDS: .................................................................................................. 24
1.5. MAIN ACTORS IN THE COSMETICS SECTORS: ......................................................................................... 26
CHAPTER 2: EVOLUTION OF COSMETICS AND FRENCH E-COSMETICS IN CHINA ............................. 29
2.1 ECONOMIC DEVELOPMENT OF CHINA ................................................................................................... 29
2.2 BARRIERS TO TRADE IN CHINA ............................................................................................................. 33
2.2.1 Cultural distance ................................................................................................................... 33
2.2.2 Government supplies ............................................................................................................ 34
2.2.3 Subsidies ............................................................................................................................... 34
2.2.4 Regulations against foreign investments from European Union ......................................... 34
2.3 COSMETICS MARKET IN CHINA ............................................................................................................ 36
2.3.1 Chinese cosmetics market .................................................................................................... 36
2.3.2 Chinese regulations in the cosmetics market ....................................................................... 37
2.4 CHINESE CONSUMER BEHAVIOURS ....................................................................................................... 41
2.5 REVOLUTIONARY CHANGE ON SALES CHANNELS: ................................................................................... 43
2.5.1 E-commerce in China ............................................................................................................ 44
2.5.2 Problems of the cross-border e-commerce in China: ........................................................... 46
2.6 E-COMMERCE IN THE COSMETICS MARKET IN CHINA ............................................................................... 49
2.7 IMPACT OF POSITIVE CHINESE ECONOMIC DEVELOPMENT ON FRENCH COSMETICS SALES IN CHINA ................. 51
2.7.1 Attractiveness of French cosmetics for Chinese ................................................................... 53
2.7.2 L’Oréal China: a success story............................................................................................... 55
2.8 FUTURE OF FRENCH COSMETICS IN CHINA: ............................................................................................ 57
2.8.1 Future Opportunities: ........................................................................................................... 57
2.8.2 Future Threats: ..................................................................................................................... 58
CHAPTER 3: EVOLUTION OF THE COSMETICS MARKET IN BRAZIL.................................................. 61
3.1 BRAZIL ECONOMIC DEVELOPMENT HISTORY ........................................................................................... 61

10
3.2 BRAZIL VS CHINA MACROECONOMIC INDICATORS: ................................................................................ 63
3.2.1 Similar macroeconomic indicators ....................................................................................... 67
3.2.2 Different macroeconomic indicators .................................................................................... 68
3.3 BARRIERS TO TRADE IN BRAZIL ............................................................................................................ 70
3.3.1 Cultural distance ................................................................................................................... 70
3.3.2 Complex regulation framework ............................................................................................ 71
3.3 BRAZILIAN COSMETICS MARKET: ......................................................................................................... 71
3.4 CONSUMER’S HABITS CHANGES ........................................................................................................... 73
3.5 E-COMMERCE IN BRAZIL .................................................................................................................... 75
3.6 ATTRACTIVENESS OF FRENCH COSMETICS FOR BRAZILIANS ....................................................................... 77
CHAPTER 4: ARE THE GROWTH OPPORTUNITIES FOR FRENCH COSMETICS BRANDS SIMILAR IN
BRAZIL AND IN CHINA? ............................................................................................................... 79
4.1 OPPORTUNITIES FOR FRENCH COSMETICS COMPANIES ............................................................................ 80
4.1.1 E-commerce channel opportunity ........................................................................................ 80
4.1.2 The boom in the skin care segment opportunity .................................................................. 82
4.2 CHALLENGES & RECOMMENDATIONS FOR FRENCH COMPANIES................................................................ 84
4.3 EXAMPLE: L’ORÉAL ........................................................................................................................... 87
CONCLUSION .............................................................................................................................. 91
CRITICAL JUDGMENT AND LIMITS OF THE RESEARCH ................................................................... 93
ANNEXES.................................................................................................................................... 95
TABLE OF FIGURES ...................................................................................................................... 99
LISTE OF TABLES ....................................................................................................................... 100
REFERENCES ............................................................................................................................. 100

11
Introduction
This paper aims to determine if the future growth opportunities for French cosmetics companies
in Brazil will be similar to the actual booming ones in China. The Brazilian consumers’
behaviour is going change in line with trends already existing in China (e.g. skincare segment
booming and the rise e-commerce channel distribution). Hence, French cosmetics enterprises
could apply similar marketing strategies to reach new customers and to develop new
opportunities.
Furthermore, this thesis aims to link different fields studied in management engineering: an
analysis of consumer’s behaviour will help companies to understand which marketing strategies
applies in different contexts. Furthermore, through the exports of cosmetics in emerging
countries as potential new markets, the international trade theory could be put in practice.
The choice of China and Brazil is made due to several reasons. Both were overgrowing at a
high rate since the trade liberalization. Due to the rise of purchase power, a new social class in
both countries emerged: the middle social class. This new social class contributes to the change
of cosmetics consumptions’ habits. The latter provide opportunities to French cosmetics
companies to reach new customers and new markets. Even though these countries are culturally
and politically different, major similarities in terms of the beauty industry exist (e.g most
promising market, skincare boom).
Afterwards, beauty, although being different across the world and through the ages, always
played a key role in cultures worldwide. The appearance is one of the essential tool for an
individual to identify to a community. In the beginning, beauty standards and beauty routines
were related to a country and its culture but today, international trends emerge due to the
globalization. Furthermore, the cosmetic market grows by 5% annually over the last ten years
due to change in consumers’ habits around the world. Hence, cosmetics companies are
expecting to grow even more in the near future. Among these companies, L’Oréal is the global
leader with a turnover of €26.9billion and 86.000 employees. (L’Oréal Group, 2018)

12
Indeed, everyone heard about the “Made in France” cosmetics. In Europe, the beauty market
became mature for selling French cosmetics. Therefore, French companies needed to expand
their brand in new markets. Due to the label “Made in France”, France becomes the global
leader in cosmetics exports. In 2018, the Chinese beauty sector amounts to more than €34
billion. As a matter of fact, China became one of the key player for French cosmetics brands.
Besides, due to new technologies (e.g. smartphones, internet), French companies needed to find
new distribution channels. Hence France experienced sales through e-commerce and reached
an online cosmetics penetration of 34% in 2018. Then, these companies developed their e-
commerce distribution in others countries, especially China, one of the trendsetter of e-
commerce. Indeed, 73.6% (Blazyte, 2019) of the Chinese internet users have at least buy once
online in 2018. In comparison, France have an online shopping penetration of 80% (Kulash,
2019). Hence, by developing e-commerce distribution, companies reached easily Chinese
consumers.
Finally, Brazilian pay more attention to their appearance than people from others countries.
Hence, the cosmetics market is one of the motor of the Brazilian economy. Since Brazil has
already main international platforms (e.g. Amazon or Ebay) used by consumers, e-commerce
could be a successful growth opportunity for French cosmetics’ distribution. Furthermore,
Brazil is the third largest consumer market of cosmetics in the world. Hence, this market could
become as important as China regarding e-cosmetics. Therefore, French cosmetics companies
could have opportunities to invest in this country under conditions.
In order to determine if Brazil will show as many growth opportunities as China, this paper is
divided into three main parts. Firstly, a contextual analysis is going to help the understanding
of the French cosmetics market, especially through e-commerce. Then, the second part is
composed by an analysis of the Chinese market and all the opportunities that made French
companies as competitive as the local ones. Finally, an analysis of the economic development
of Brazil will be useful to understand the future opportunities for French e-cosmetics in this
market.

13
Chapter 1: Cosmetics market’s history and trends
1.1 A brief history of the cosmetics market
A first definition of the cosmetic’s science is a mix of skills in Biology, Chemistry, Sociology,
and Pharmacy. Moreover, archaeological and anthropological studies show that the cosmetics
market appears during the ancient when people used them frequently.
A second definition of the word “cosmetic” comes from Greek “kosmêtikos”, coming from
“kosmos” which means appearance related to what you put on your body (Emile Littré’s
Dictionnaire de la langue française, 1877).
Then, years after years, each population defined its usage of cosmetics. For instance, today,
make up is mainly defined as something which is put on the face to enhance the appearance.
However, in the beginning, it was used on the whole body with different significations
according to cultural differences.
1.1.1 Ancient Egypt
First real cosmetics found, such as henna, last from the ancient Egypt period (-3100 before JC).
Egyptians mainly used eye-liner makeup, like khôl (black powder composed by lead). They
used to put this on their eyelids. Moreover, they used malachite green or eggs and ants’ mixture
to put colour on their bodies. (Joshua J. Mark, 2017)
1.1.2 India
Indian culture integrated cosmetics for a long time. Makeup was mean to distinct existing
castes. The Bindis are still using makeup to draw their red point between eyes, realized with
kumkum paste (powder base on Curcuma and green lemon juice). (Awana, 2003).
1.1.3 Greek and Roman Antiquity
In ancient Greece, to preserve the appearance, cosmetic is perceived as a science. Women have
to have white skin, red cheeks, and black eyes. (Tardy, 2012)
Moreover, the Roman conquest of eastern countries impacted the development of cosmetics in
Europe (usage of henna, perfumes). At the same time, not only women but also men were using
dye. (Histoire des cosmétiques, 2016)

14
1.1.4 Middle age
At that time, under Catholicism, skincare, and hygiene were not as important as the period
before excepted fragrances. Until the Renaissance period, beauty was not the main point for
women. (Alvarez, 2014)
1.1.5 Renaissance period and modern times
During the Louis XIV reign, the usage of perfumes was booming due to the lack of hygiene.
Then, France became the leader in makeup and Italy, the leader in beauty care products. No one
knew the lousy effect of lead on health at that time. (De Roeck-Holtzhauer, 1988)
From the XVIIIth century, cosmetics evolution and chemistry one are strictly related to each
other. Moreover, it is only from the XIXth, with the toxicology development, that the discovery
of harmful consequences for health by using cosmetics with lead. Thus, people paid more and
more attention to the composition of the product. (Bonté,2014)
After this period, it is the beginning of the industrialization. Thanks to that, cosmetics were part
of the morning routine of each woman. Then, a fiercely competitive market appears in this
sector not only locally but also globally. It is the globalization era of cosmetics, for perfumes
as first, with the expansion of big companies such as Guerlain, Piver, and Rimmel. (Geoffrey
Jones, 2011)
During the second half of the nineteenth century, soaps’ companies such as Procter&Gamble
(P&G) and Lever Brother (Geoffrey Jones, 2011) caught the wave of globalization trends by
implementing new stores to sell their products around the world. While soaps and perfumes
international market were booming, skin cream was developed and commercialized by two
leading companies: the German one, Nivea by Paul Beiersdorf and the American one, Ponds
by Theron Ponds.
After the Second World War appeared Asian brands, it revolutionized the sectors. Before that
time, cosmetics were mainly importing in Asia from Europe and the US. Therefore, the
apparition of local brands changed the way of trading cosmetics.

15
In addition to that, nowadays, the cosmetics market in the US and in Europe are saturated. The
current challenge for firms is to answer to the change of customers’ needs. Today, the foremost
important thing is the composition of products. Mainly due to global warming, people are
searching for ecological and biological products with good-for-health components.
Globally, the cosmetics sector has evolved positively in terms of market shares in the world. It
comes from Europe and the US. Then since the second half of the nineteenth century, due
mainly to the industrialization period, the market expanded around the world. The figure 1
shows how it has evolved over time and around the world, according to the Harvard University
professor’s research (Geoffrey Jones,2011):
Figure 1: Estimated growth of the Global beauty market 1913-2008
Source: Globalization and Beauty: A Historical and Firm Perspective written by Geoffrey Jones
As Figure 1 shows, cosmetics were firstly implemented in the US, then in Europe and after in
Asian and South American countries such as Japan or Brazil. The reasons why companies seek
to expand internationally are the following: low-cost working forces, access to cheaper raw
material and acquire knowledge in new technologies.
The first step of globalization just after the First World War is the expansion of cosmetics in
the US. At that time, the US was the place to be for cosmetics due to the expansion of
Hollywood where stars and models lived. Thanks to this introduction into the US, cosmetics
companies took advantages of new methods and new distribution channels.
16
The last step of globalization was the integration of emerging countries (Brazil, China or
Russia) which had a rapid growth. According to a study on “globalization and financial
performances in French cosmetics industry” made by Mihai Mutasu and Aurora Murgea in
2016, the difference between the last step of globalization and the first one in the beauty
industry is the way of diffusing cosmetics. On the one hand, in the US, it was an imposition of
Western standard products. On the other hand, the implementation in the developing countries
was more an adaptation to the consumers’ demand. (Mutasu & Murgea, 2017)
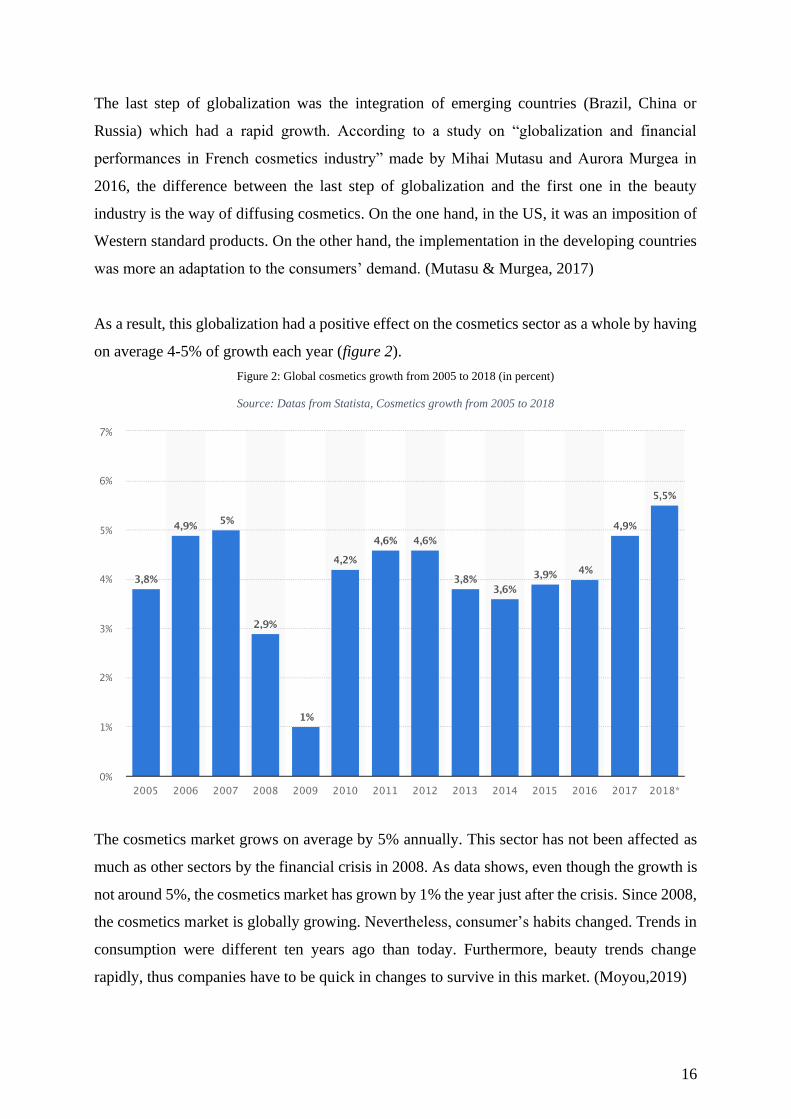
As a result, this globalization had a positive effect on the cosmetics sector as a whole by having
on average 4-5% of growth each year (figure 2).
Figure 2: Global cosmetics growth from 2005 to 2018 (in percent)
Source: Datas from Statista, Cosmetics growth from 2005 to 2018
The cosmetics market grows on average by 5% annually. This sector has not been affected as
much as other sectors by the financial crisis in 2008. As data shows, even though the growth is
not around 5%, the cosmetics market has grown by 1% the year just after the crisis. Since 2008,
the cosmetics market is globally growing. Nevertheless, consumer’s habits changed. Trends in
consumption were different ten years ago than today. Furthermore, beauty trends change
rapidly, thus companies have to be quick in changes to survive in this market. (Moyou,2019)

17
1.2 Cosmetics market in Europe
Firstly, it is essential to define what is a cosmetic according to the European legislation. It is
defined as: « any substance or preparation intended to be placed in contact with the various
external parts of the human body (epidermis, hair system, nails, lips and external genital organs)
or with the teeth and the mucous membranes of the oral cavity with a view exclusively or mainly
to cleaning them, perfuming them, changing their appearance and/or correcting body odors
and/or protecting them or keeping them in good conditions." (“Cosmetics Regulations”, 2016)
The European Union requires that cosmetics products placed on the EU market are safe;
meaning that they "must not cause damage to human health when applied under normal or
reasonably foreseeable conditions of use.” (“Cosmetics info”, 2016)
According to Statista, revenues in the sector amount to 16,918.3 bn US$ in 2019. The chart
below shows the evolution of the cosmetics market and a forecast for the next four years.
Figure 3: Global revenue in the European sector
Source: From Statista DataBase 2019 : Revenues of the European cosmetics market
The trend is positive growth (figure 4) of the market over time, although there is no significant
gap between years. The growth stays more or less constant with a trend to decrease in the future
due to the maturity of the market. Companies have to invest a lot in research and development
to differentiate amongst competitors. That is a reason why this market tends to decrease in the
future years. (Statista, 2019)

18
Figure 4: Evolution of growth in the European cosmetics sector
Source: From Statista DataBase 2019: growth rate in European cosmetics industry forecast
Globally, cosmetics is a sector in growth, even if the growth is expected to slow down in the
coming years (figure 4). This decline could be explained by the maturity of the market.
European cosmetics market remains the worldwide leader before the US and China.
Nonetheless, the figure 5 shows that across Europe, it exists leaders of this market.
(Shahbandeh, 2019) Germany is the leader in terms of market value in this sector with €13.6bn
of market value in 2016. In 2019, leading countries are still these one.
Figure 5: Leading European countries in the cosmetics market between 2014 and 2016
Source: From Statista database 2019: Cosmetics market in Europe

19
In terms of market value, France is the second-largest market. Nevertheless, France remains the
dominant exporter in cosmetics (Figure 6). In addition to the leading position, in 2017, France
exported for an amount of €13.6 billion. That amount is the highest never registered (+12% of
growth compared to 2016).
Figure 6: Beauty cosmetics and skincare exports distribution
Source: Mutascu & Murgea (2017): Globalization and financial performances in french cosmetics industry
Among the European countries, France is the largest exporter of cosmetics with 7 USD billions
in 2015. Therefore, France is the more representative market to analyse cosmetics exports in
emerging countries. We will firstly focus on gaining a deep understanding of the way cosmetics
are managed in France and the importance of the market. (Mutasu & Murgea, 2017)
1.3 Cosmetics market in France:
French corporations sell in more than 200 countries. The presence of French companies in
emerging countries is more significant over years. By holding 23% of the global market shares
in 2018, exports from France is well ahead of the US and Germany in this sector (Martins,
2019). This industry remains the strength of the country. “Made in France” products are famous
not only locally but also everywhere in the world. It is known as “high-quality” products

20
The table 1 shows an overview of French cosmetics production and trade:
Table 1: French cosmetics production and trade key numbers:
Source:France - Cosmetics (COS) - commercial guide (2019)
In USD billion 2016 2017 2018 2019
(estimation)
Total local
production
21,750 22,185 22,236 22,680
Total Exports 13,550 13,413 13,681 13,954
Total imports 3,000 3,100 3,162 3,170
Total market
size4
11,200 11,872 11,717 11,896
Cosmetics sector is the second biggest sector in France representing 10 billion Euros in terms
of sales in 2017. According to the FEBEA, Skincare and Perfumes are the main categories sold
by French companies around the world:
Table 2: Sales of french companies by products categories in 2018
Source: key figures of the cosmetics industry - FEBEA 2017
Skincare is a growing sector mainly due to change of mind-set of consumers. Historically, skin
care segment was the first booming one due to the elder of population over years. Furthermore,
consumers in general pay more attention to effects of pollution on their skin.
4 Total market size = ((total local production + imports) – exports) - French trade association for the cosmetics and perfume
companies (FEBEA)
27%
22%19%
14%
7%
10%1%
Sales by Products Categories
Skincare
Perfumes
Personal Care Product
Hair Care
Oral Care
Make up
Baby Care

21
In addition, the maturity of the European market consumers forced French companies to look
for new markets, new products or new consumers. Therefore, these firms expanded around the
world. France succeed in creating brand image and a loyalty to their products around the world.
The reputation of French cosmetics lead France to the first exporter worldwide in this sector.
1.3.1 French cosmetics exports
In 2017, 13,6 € billion of cosmetics that leaves France to be sold around the world. That is 12%
more than in 2016. Exports through Asia have grown by 25% in one year with a growth rate of
more than 30% in China. 1 out of 5 of French cosmetics products leaves through Asia. It is
surprising after two years without any growth or low growth. (FEBEA,2018)
French brands are mainly SMEs except for the giant L’Oréal that also demonstrated high sales
in China, especially in the luxury and active divisions. Perfumery and care still represent ¾ of
the total of French exports (44,3% for the care sector and 31% for fragrances). (FEBEA,2018)
At the 1st March 2019, France confirms its leading position in the sector. It grew by 6,3%
compared to 2017 and the exports increase until 14,5Bn€ of sales. (FEBEA, 2019)
Figure 7: French Cosmetics exports by regions in 2018
Source: FEBEA (2019)
22
The European Union, North America and Asia are remaining the more performing areas
(Figure 7):
• In the EU, the exports growth is around 4,5% up. The biggest ones come from Spain
(+8,5%) and Italy (7,2%). The end-up of Brexit is crucial for France even in this sector
because the UK is the second European countries towards which France exports. Even
if the market in Europe is mature, exports continue to grow thanks to the safety and
brand image of French products. (FEBEA,2019)
• Exports towards Asia continue to rise with an increase of 16,6% in 2018 and more than
20% of growth in China (22,7%) and Singapore (24%). Thus, more than 2,6bn€ of the
French turnover comes from Asian markets. (FEBEA,2019)
• North America shows a rise of 6,8% in exports, within 5,7% in the US. This country
remains the second destination of European exports. South and Central America remain
stable in importing French cosmetics. (FEBEA,2019)
• Near and the Middle East observe a decrease by 2,8% of imports in this sector.
• In Africa, it is noted an increase of French cosmetics imports by 16,8% in Western
Africa while all other parts of Africa observed a decline. (FEBEA,2019)
Skincare and Perfumes still account for ¾ of the whole number of French cosmetics exports in
2018, with respectively 45% for care and 22% for fragrances. Then there is makeup with a
growth of 4,8% since last year. (FEBEA,2019)
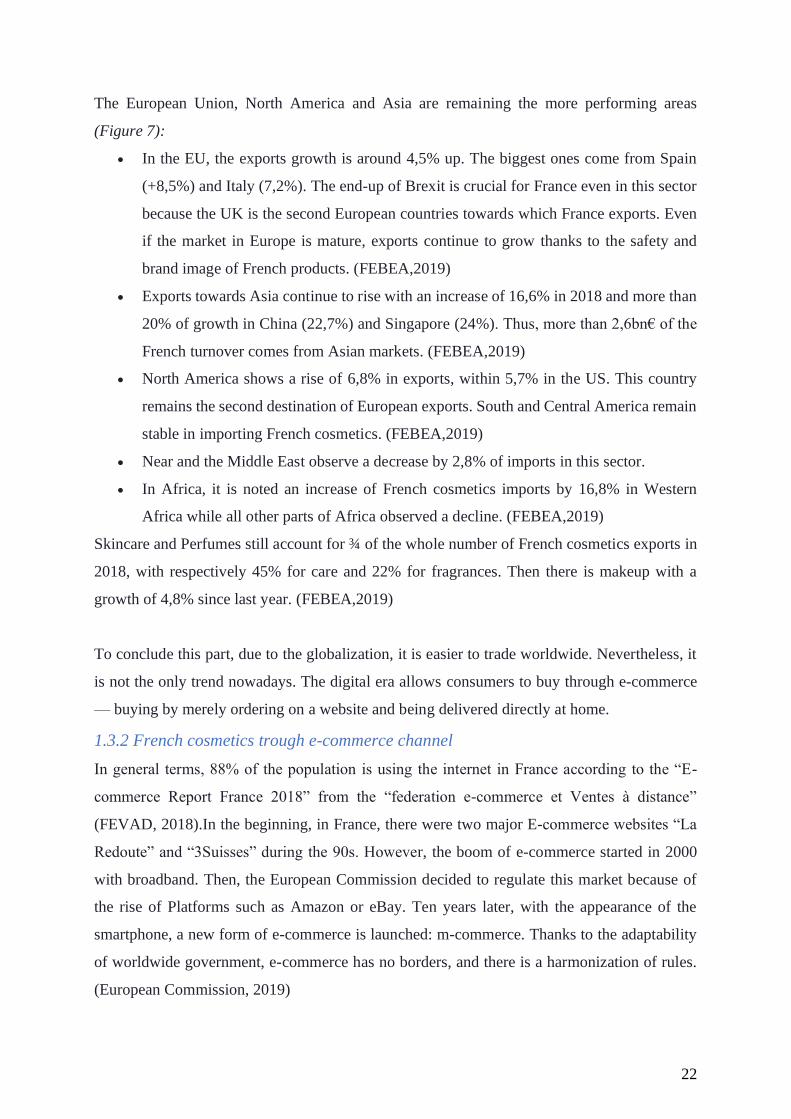
To conclude this part, due to the globalization, it is easier to trade worldwide. Nevertheless, it
is not the only trend nowadays. The digital era allows consumers to buy through e-commerce
— buying by merely ordering on a website and being delivered directly at home.
1.3.2 French cosmetics trough e-commerce channel
In general terms, 88% of the population is using the internet in France according to the “E-
commerce Report France 2018” from the “federation e-commerce et Ventes à distance”
(FEVAD, 2018).In the beginning, in France, there were two major E-commerce websites “La
Redoute” and “3Suisses” during the 90s. However, the boom of e-commerce started in 2000
with broadband. Then, the European Commission decided to regulate this market because of
the rise of Platforms such as Amazon or eBay. Ten years later, with the appearance of the
smartphone, a new form of e-commerce is launched: m-commerce. Thanks to the adaptability
of worldwide government, e-commerce has no borders, and there is a harmonization of rules.
(European Commission, 2019)
23
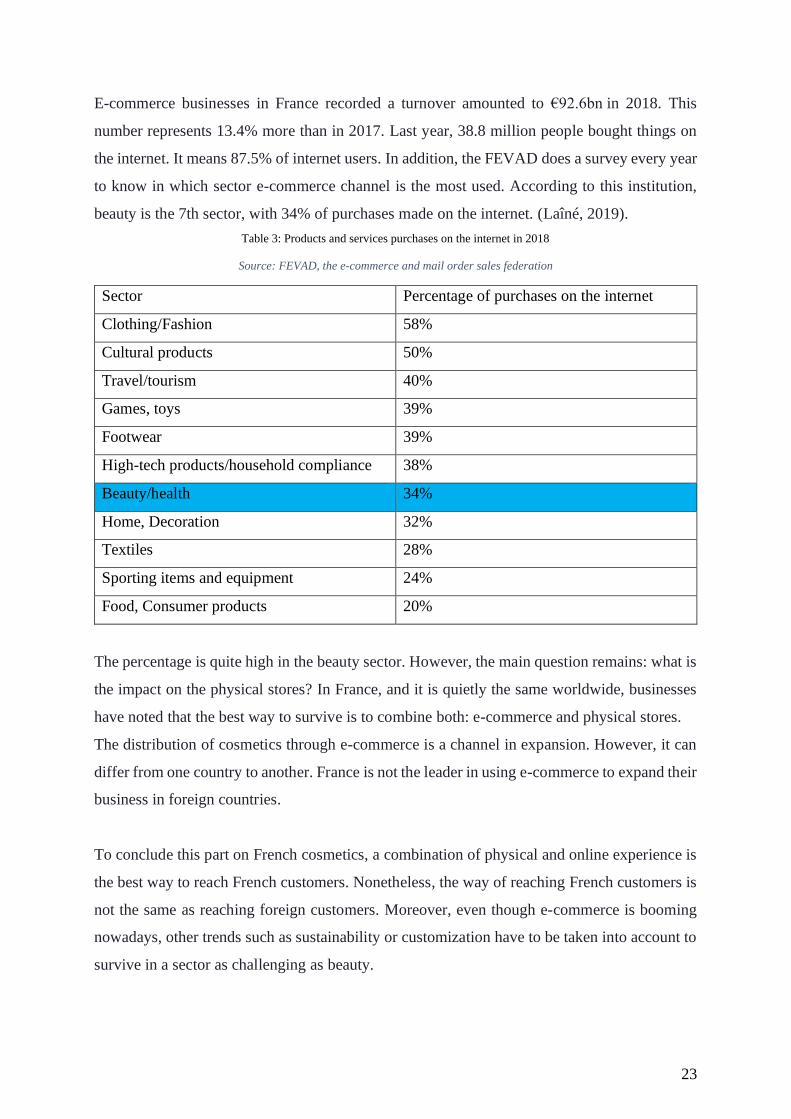
E-commerce businesses in France recorded a turnover amounted to €92.6bn in 2018. This
number represents 13.4% more than in 2017. Last year, 38.8 million people bought things on
the internet. It means 87.5% of internet users. In addition, the FEVAD does a survey every year
to know in which sector e-commerce channel is the most used. According to this institution,
beauty is the 7th sector, with 34% of purchases made on the internet. (Laîné, 2019).
Table 3: Products and services purchases on the internet in 2018
Source: FEVAD, the e-commerce and mail order sales federation
Sector Percentage of purchases on the internet
Clothing/Fashion 58%
Cultural products 50%
Travel/tourism 40%
Games, toys 39%
Footwear 39%
High-tech products/household compliance 38%
Beauty/health 34%
Home, Decoration 32%
Textiles 28%
Sporting items and equipment 24%
Food, Consumer products 20%
The percentage is quite high in the beauty sector. However, the main question remains: what is
the impact on the physical stores? In France, and it is quietly the same worldwide, businesses
have noted that the best way to survive is to combine both: e-commerce and physical stores.
The distribution of cosmetics through e-commerce is a channel in expansion. However, it can
differ from one country to another. France is not the leader in using e-commerce to expand their
business in foreign countries.
To conclude this part on French cosmetics, a combination of physical and online experience is
the best way to reach French customers. Nonetheless, the way of reaching French customers is
not the same as reaching foreign customers. Moreover, even though e-commerce is booming
nowadays, other trends such as sustainability or customization have to be taken into account to
survive in a sector as challenging as beauty.
24
1.4 Cosmetics market future trends:
The industry evolved over the past years due to the change in the demand of consumers. Today,
people want something natural and ecologic more than something coming from a big company.
They are nine main trends listed by “Forbes” magazine (Forbes Magazine, 2018):
1. Environmental impact: the purpose is to reduce wastes and be more ecologic than
before;
2. Process and ingredient transparency: consumers want to know the process and the
ingredients of what they use;
3. Health consciousness: consumers avoid to buy a product with hazardous components;
4. Simple and clean;
5. Independent brands: consumers prefer buying products that are coming from smaller
brands because generally, they are more green and health-conscious;
6. Market share: independent sellers are growing and force large brands to face more
competitors, including a new collaboration between small and large companies;
7. Digital transformation: increasing of digitalization force enterprise to change the way
they are proposing cosmetics to consumers;
8. AI: Customers' data and profiling are becoming more and more critical. The use of this
information is the key to overcome its competitors, especially in this sector;
9. Overseas Influences: Social media is crucial in this sector, and the influencers are the
key to the success of cosmetics products; therefore, a company has to pay attention to
that point too;
To sum up, the global warming impacted the way of consumption. As a matter of fact, people
pay more attention to their skin for ten years. Consumers want to prevent their skin against
pollution. Therefore, the skin care segment is the most promising segment for cosmetics
companies.
25
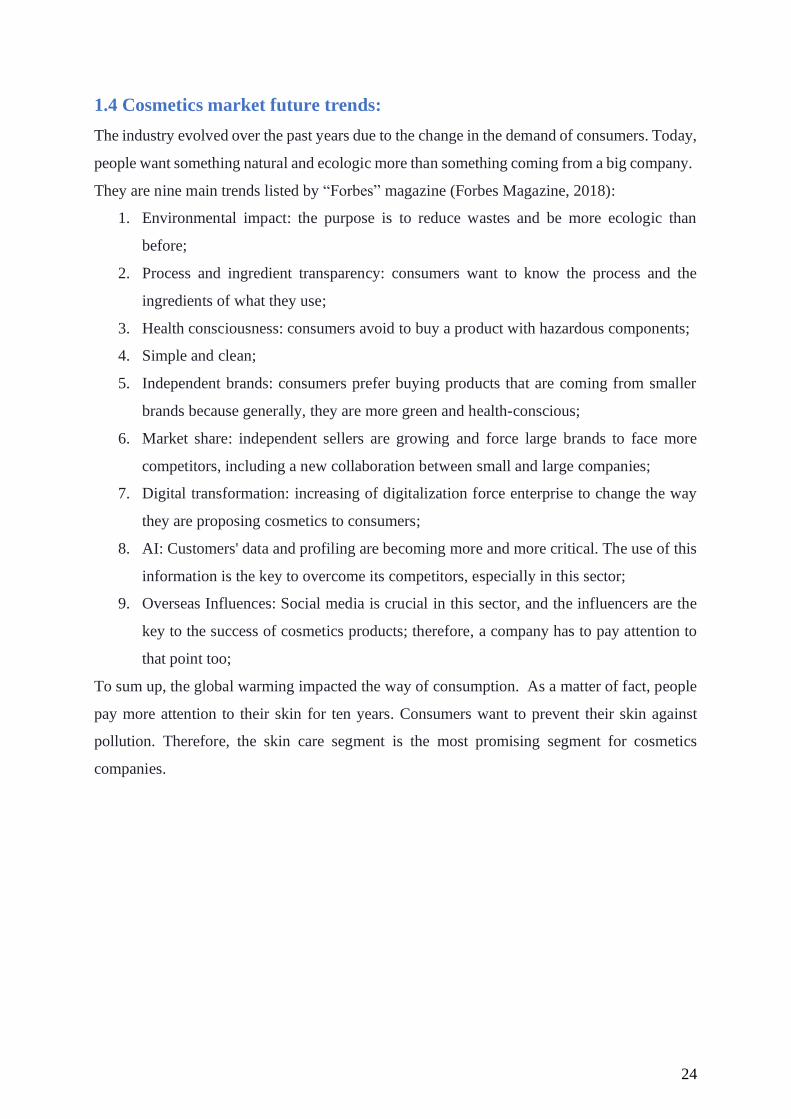
Nowadays, the global distribution of the global market by categories is as follow:
Figure 8: global distribution of products sales by categories
Source: L'Oréal Annual Report 2018
According to the L’Oréal annual report 2018, the main sector is skincare and it is the case since
the launch Nivea first cream. The figure 8 shows the highest interest by consumers for 3
segments: Skincare, Hair Care and Makeup. Companies have therefore different choices to
innovate successfully in this industry: either enterprises try to develop weaker segments
(Fragrances and hygiene products) or they enhance the way the top 3 segments are managed
(for instance, by improving distribution channels).
Besides understanding the industry, identify major players and understand their success are key
factors to enter this sector successfully.
39%
21%
19%
11%
10%
Global repartition by categories 2018
Skin Care
Hair Care
Make Up
Fragrances
Hygiene product
26
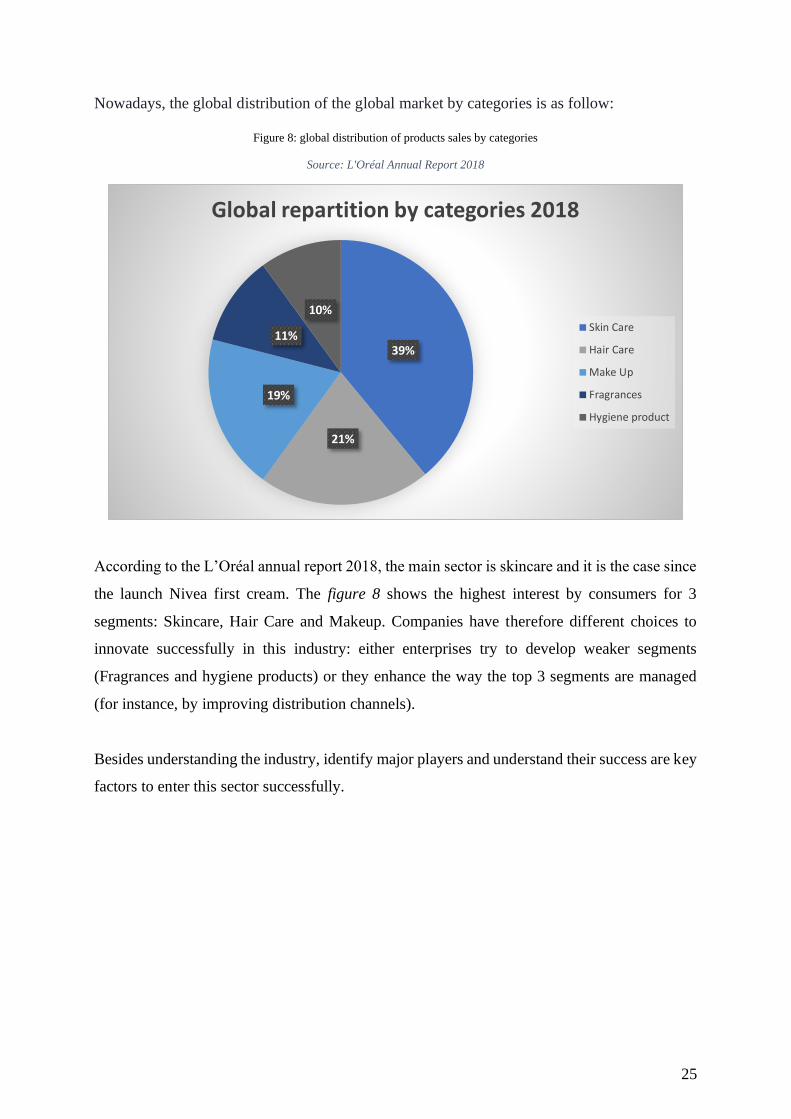
1.5. Main actors in the cosmetics sectors:
The biggest companies are transnational organizations which operate worldwide. It was
essential to understand the way to manage these enterprises because they lead how to enter a
new market by competing with smaller and local companies. According to the L’Oréal finance
annual report 2018, the five companies hereunder are the main actors in the sector.
Figure 9: Worldwide players by turnover in 2018
Source: L'Oréal Annual Report
1.5.1 L’Oréal
This French group, founded in 1909, is mostly present in the beauty sector and become the
biggest producer today. This company has four main segments: luxury goods, retail goods,
professional goods, and active cosmetics. It is represented in more than 150 countries around
the world and owned 36 different brands in the different cosmetics segments. This group
registered 505 patents, and an amount of €3.0Bn was registered as e-commerce sales in 2018.
(L’Oréal annual report, 2018).
29.4
21.5
12.8
12.4
8.8
0 5 10 15 20 25 30 35
L'ORÉAL
UNILEVER
ESTÉE LAUDER
PROCTER AND GRAMBLE
SHISEIDO
Worldwide players in Sales in 2018
Turnover (in Billion USD)
27
1.5.2 Unilever
Unilever, founded in 1930, is a British-Dutch transnational company specialized in the
consumer goods segment. This company is more diversified than L’Oréal and the third
worldwide leader in its sector. It is composed by three different sectors: Beauty and Personal
care, Food and Refreshment, and Home care. These products are sold in more than 190
countries and the group owns more than 400 brands.
In 2018, the Beauty and Personal care segment of the company, leading category of the firm,
accounted for 40% of the total turnover. Thanks to that sector, the group is the second one of
the cosmetics market. (Unilever annual report, 2018).
1.5.3 Procter & Gamble
Founded in the US in 1837, it is the second worldwide company in the consumer goods sector
just before Unilever. However, in the cosmetics sector, it remains just behind The Unilever
group. It is represented in around 180 countries and owned around 200 brands. (Procter &
Gamble Annual Report, 2018)
1.5.4 Estée Lauder
Estée Lauder, founded in 1946 in New York, penetrated four main segments of the cosmetics
market: skincare, makeup, fragrances, and hair care. More than 80% of total sales are operated
in the makeup and skincare segments. The group sell products over 150 countries and owns 31
brands, including MAC, Clinique, and La Mer, considered as premium products. (Estée Lauder
Annual report, 2018).
1.5.5 Shiseido
This Japanese group, founded in 1872, is the oldest cosmetics brand in the world. It sells goods
in around 89 countries. The Premium segment is the specialization of this group, such as Estée
Lauder. Moreover, the group launched “Beauté Prestige International” in 1990. This sub-group
is responsible for fragrances for Elie Saab or Narcisso Rodriguez. Even though it is the 5th
brand in the cosmetics sector, Shiseido lost one of its best brand in 2016: Jean-Paul Gauthier.
(Shiseido Annual Report, 2018)

28
Finally, this industry is growing and growing over the years. The growth is notably due to the
globalization of the sectors and the growth of emerging countries. The leading companies on
the cosmetics market reflects internationalization of businesses. The five main companies come
from different continents and are present worldwide. Nonetheless, two companies among the
top three comes from Europe. This means that Europe is a major actor in this sector.
Furthermore, many studies shown that European cosmetics will continue to grow in the future.
One main reason behind European success in this sector is the ability to rapidly adapt to respond
to changes in demand. Furthermore, L’Oréal is the worldwide leader with around 29,5 billion
USD of turnover in 2018.
To sum up this first chapter, due to the maturity level of the French market, and the European
one, in the cosmetics sectors, companies are looking for new markets. Therefore, to survive and
continue to grow, French brands have to exports in emerging countries (mainly BRIC’s).
BRIC’s countries represent a huge opportunity to increase the global market shares of a
company. In the beauty industry, the most promising countries in terms of expansion are China
and Brazil. (Barmi, 2018) The choice of China and Brazil as new market is not only because
both market are in the worldwide top-five of cosmetics consumers ‘market but also because
people living in these countries are in love with the “made in France” label. (Arora & Bacouël-
Jentjens, 2015)

29
Chapter 2: Evolution of cosmetics and French e-
cosmetics in China
2.1 Economic development of China
The Republic in China was established in 1912. From an economic point of view, nothing was
exciting before 1949 with the proclamation of the People’s Republic of China. Therefore,
economic development will be analysed from that time.
The real development of China started in the 1950s with the share of economic output across
the country regulated by the state. Then the government-supported industrialization by
investing in physical and human capital in the 1960s and 1970s. As a result, most parts of
enterprises controlled by the government had output’s targets decided by the state. The
Congressional Research Service report (2019) shows that the purchasing parity power, a
representative measure of a country’s living standards, in China from 1950 to 1978 has doubled.
Nevertheless, it can be noticed that the standard’s life conditions fell by 20.3% between 1958
and 1962. Another decrease by 9.6% appeared from 1966 to 1968 (Figure 10). These declines
could be explained by historical facts that happened in China.
Figure 10: Chinese Per Capita GDP: 1950 – 1978 ($ billions, PPP basis)
Source:Congressional Research Service Report by Wayne M. Morrison in 2019
30
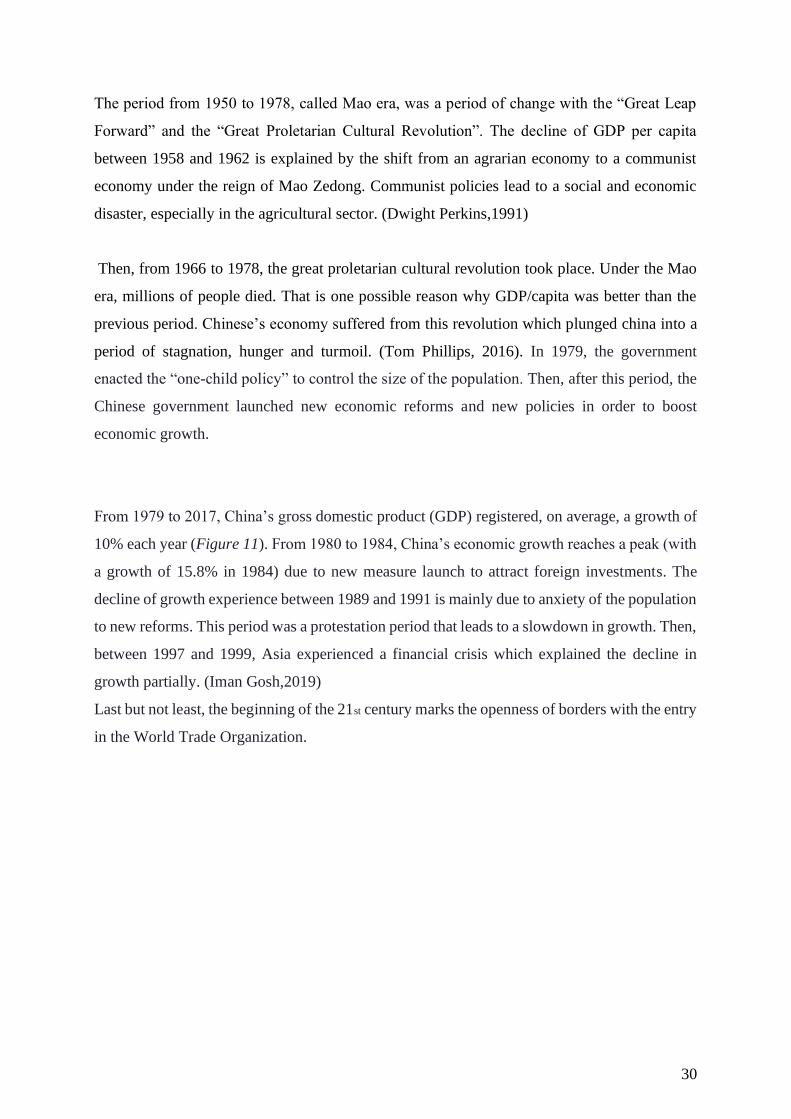
The period from 1950 to 1978, called Mao era, was a period of change with the “Great Leap
Forward” and the “Great Proletarian Cultural Revolution”. The decline of GDP per capita
between 1958 and 1962 is explained by the shift from an agrarian economy to a communist
economy under the reign of Mao Zedong. Communist policies lead to a social and economic
disaster, especially in the agricultural sector. (Dwight Perkins,1991)
Then, from 1966 to 1978, the great proletarian cultural revolution took place. Under the Mao
era, millions of people died. That is one possible reason why GDP/capita was better than the
previous period. Chinese’s economy suffered from this revolution which plunged china into a
period of stagnation, hunger and turmoil. (Tom Phillips, 2016). In 1979, the government
enacted the “one-child policy” to control the size of the population. Then, after this period, the
Chinese government launched new economic reforms and new policies in order to boost
economic growth.
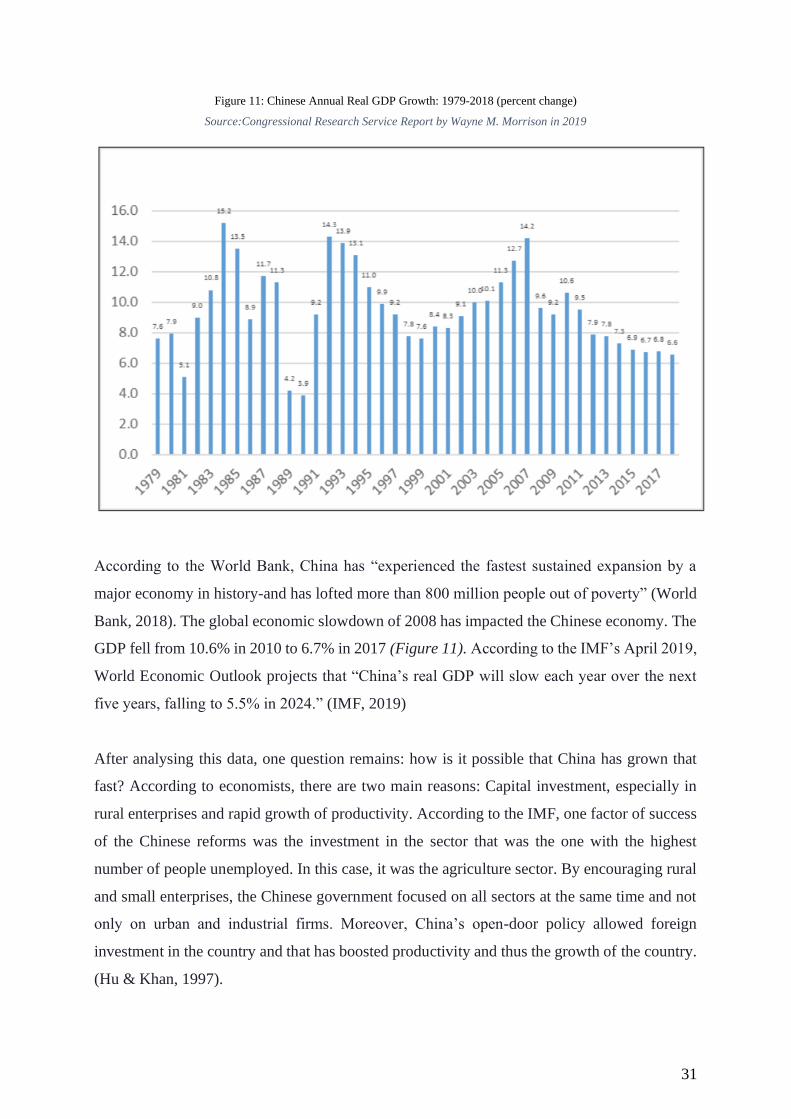
From 1979 to 2017, China’s gross domestic product (GDP) registered, on average, a growth of
10% each year (Figure 11). From 1980 to 1984, China’s economic growth reaches a peak (with
a growth of 15.8% in 1984) due to new measure launch to attract foreign investments. The
decline of growth experience between 1989 and 1991 is mainly due to anxiety of the population
to new reforms. This period was a protestation period that leads to a slowdown in growth. Then,
between 1997 and 1999, Asia experienced a financial crisis which explained the decline in
growth partially. (Iman Gosh,2019)
Last but not least, the beginning of the 21st century marks the openness of borders with the entry
in the World Trade Organization.
31
Figure 11: Chinese Annual Real GDP Growth: 1979-2018 (percent change)
Source:Congressional Research Service Report by Wayne M. Morrison in 2019
According to the World Bank, China has “experienced the fastest sustained expansion by a
major economy in history-and has lofted more than 800 million people out of poverty” (World
Bank, 2018). The global economic slowdown of 2008 has impacted the Chinese economy. The
GDP fell from 10.6% in 2010 to 6.7% in 2017 (Figure 11). According to the IMF’s April 2019,
World Economic Outlook projects that “China’s real GDP will slow each year over the next
five years, falling to 5.5% in 2024.” (IMF, 2019)
After analysing this data, one question remains: how is it possible that China has grown that
fast? According to economists, there are two main reasons: Capital investment, especially in
rural enterprises and rapid growth of productivity. According to the IMF, one factor of success
of the Chinese reforms was the investment in the sector that was the one with the highest
number of people unemployed. In this case, it was the agriculture sector. By encouraging rural
and small enterprises, the Chinese government focused on all sectors at the same time and not
only on urban and industrial firms. Moreover, China’s open-door policy allowed foreign
investment in the country and that has boosted productivity and thus the growth of the country.
(Hu & Khan, 1997).

32
In addition, Robert Solow, an economist who received a Nobel prize in 1987, has developed a
model about the economic growth that corresponds to what happened in China. This model
analyses the level of output produced over time according to a change in technology, in human
capital or saving rate. This model assumes that people save and then invest a fixed share of their
income. It is an explanation of long term economic growth. (Baldwin & Wiplosz, 2015)
Three primary data compose GDP in the Solow formula: Labour (L), Capital (K) and
Technology (A); and Y = output level for an economy or GDP generated.
Model equation: 𝑌 = 𝑓(𝐴, 𝑒𝐿, 𝐾) 𝑤ℎ𝑒𝑟𝑒 𝑒 𝑖𝑠 𝑒𝑑𝑢𝑐𝑎𝑡𝑖𝑜𝑛
This model predicts several new statements:
1. One reason explaining why China, India or other emerging economies have higher
growth rates than advanced economies is the following: Countries that start from a low
level of incomes will grow faster than countries that have a higher level of income.
Because more developed economies are already in the part of flattering out of the Solow
model. In addition to that, according to Solow, fast-growing countries have a higher
marginal rate of return on invested capital. (Lucia Tajoli, 2018)5
2. In this model, everything depends on savings because the assumption suggests that
people save and invest the same part of their income each year thus, the inflow of capital
is just a fraction of the Gross Domestic Product/Labour capital (GDP/L). (Corporate
Finance institute, 2015)
To conclude, China is the best example to confirm the Solow model. Moreover, the model
explains why the Chinese growth decreased for two years and is going to reach the level of
developed countries in the near future. It merely proved that China is becoming more and more
developed over the years. Nevertheless, due to corruption and many governmental regulations
to international trade, entering in the Chinese market remains hard.
5 International market and European institutions – Course 2018
33
2.2 Barriers to trade In China
Everything started with the entry of China in the WTO in 2001. Even though that before that
year, the EU and China had established many trade agreements. In 1975, the first trade
agreement and then in 1996, the Asia-Europe Meeting (European External Action
Service,2019). However, at that moment, it was challenging to expect any trade with China
because it was a very closed economy. Moreover, policies for trading and exporting goods and
services, as mentioned above, were different from the one in the EU. Nevertheless, with the
new strategy that Europe adopted in 2016 (European Commission report, 2019), business
relations between both become closer and closer over time. Even though the Chinese economic
climate remains a complex challenge for European investments.
2.2.1 Cultural distance
It exists differences between countries in international business. For instance, the role of culture
is crucial for expanding its business to foreign countries. Cultural differences impact negatively
businesses taking place in a cross-cultural context if there are not understood. To tackle these
cultural differences, Hofstede (1980) identified five dimensions to score cultural differences
between countries. In 2010, the latter added one index: the indulgence. (See Annexe 1)
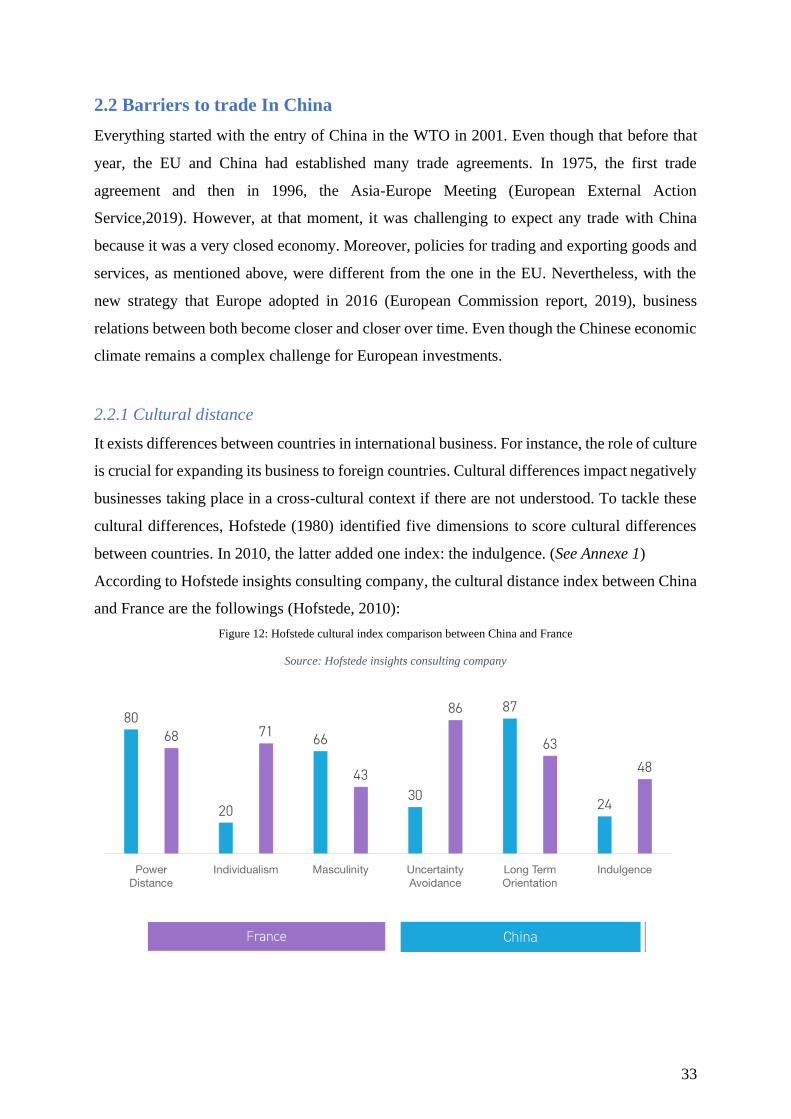
According to Hofstede insights consulting company, the cultural distance index between China
and France are the followings (Hofstede, 2010):
Figure 12: Hofstede cultural index comparison between China and France
Source: Hofstede insights consulting company
34
It is essential to keep in mind that these indexes estimate the difference in cultures.
The Hofstede model is not only for China. However, it is advantageous to understand the mode
of entry for a French company in this country. China is a highly collectivist country which is
not the case in France. Therefore, when French companies want to enter the Chinese market,
they have to adapt their mode of entry. What is more, the mind-set of French people about
uncertainty does not match with the Chinese one. As a result, French firms have to adjust their
strategies to reach Chinese consumers. (Hofstede, 2010)
2.2.2 Government supplies
The republic of China required to buy goods produced in its territory before 2009. And then
they open their borders due to the impact of the financial crisis of 2008. At that time,
government was only allowed to buy foreign goods exceptionally. Thus, this is a problem to
enter in China; there is much corruption in the choice of goods bought. Moreover, China
restricts by putting quotas or duties on the exports of raw materials. However, everything had
changed when China has to follow the WTO rules (which prohibits exports quotas). Even
though it is prohibited, China tries to justify some discriminations as an exception allowed by
the WTO (on rare earth elements, for instance). (WTO, 2018)
2.2.3 Subsidies
This is not only for China, when a country is a member of the WTO, the rules over the subsidies
have to be respected. It is prohibited that the government supports local organization by
subsidizing them. However, China subsidizes local enterprises for an amount of $22bn in 2018.
The explanation of government is to raise employment and keep the tax’s revenues stable.
(Financial Times, 2019)
2.2.4 Regulations against foreign investments from European Union
The Chinese protectionism is one of the tools in the economic development of this country. In
the beginning, the aim in opening borders for Chinese government was to copy knowledge from
other countries to manufacture the same products at lower costs. Once, their economy become
stable, the country became even more protectionist by enacted new regulations.
The European Commission Annual report of 2019 mentioned China as one of the most
protectionist countries regarding trade with Europe. China enacted ten new trade regulations
against European trade in 2017. (Les Echos, 2019)

35
To conclude, exporting in China is quite hard mainly due to cultural differences which have an
impact on foreign companies. For instance, French cosmetics firms have to think about the best
mode of entry on the Chinese market. (Jean-François Hennart, 2012) The Hofstede dimensions
are useful to find the matching mode of entry. This study conducted by Prof. Hofstede allows
companies to better understand the cultural differences with China. Therefore, strategies for
implementing cosmetics in China are more appropriated than before. However, it is essential to
keep in mind that China is a country different from Europe in many points, mainly in stricter
legislation than in European countries.
36
2.3 Cosmetics market in China
2.3.1 Chinese cosmetics market
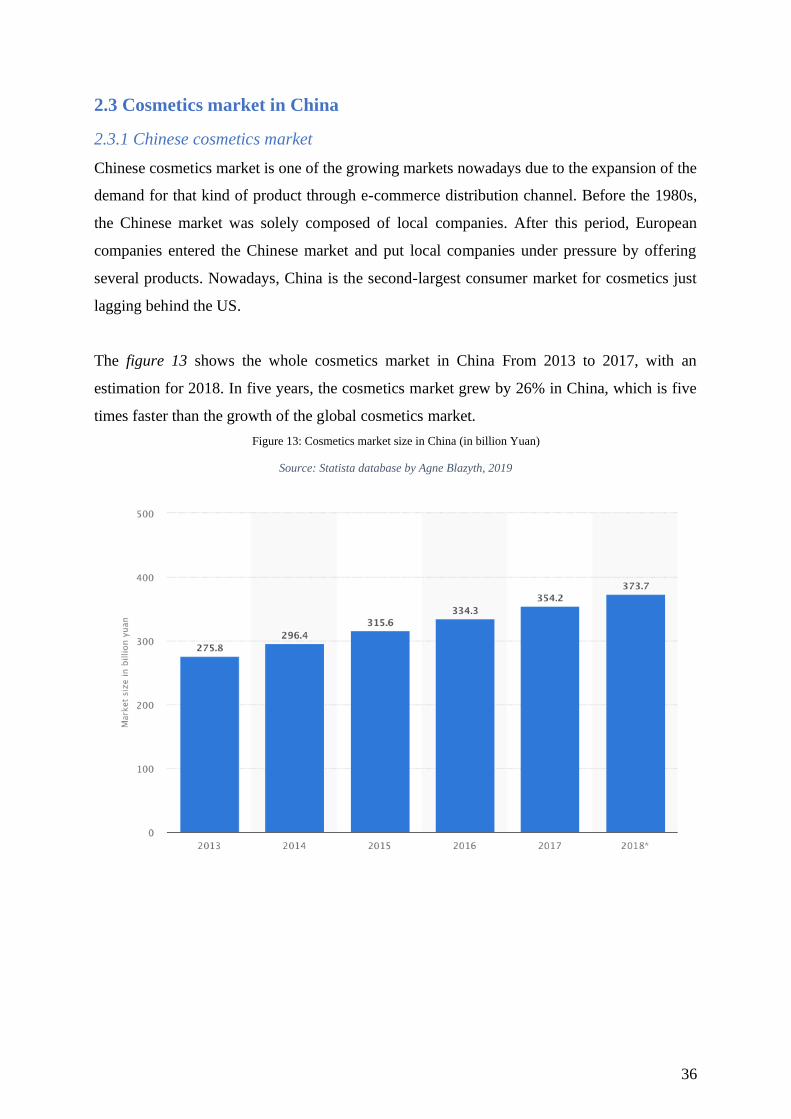
Chinese cosmetics market is one of the growing markets nowadays due to the expansion of the
demand for that kind of product through e-commerce distribution channel. Before the 1980s,
the Chinese market was solely composed of local companies. After this period, European
companies entered the Chinese market and put local companies under pressure by offering
several products. Nowadays, China is the second-largest consumer market for cosmetics just
lagging behind the US.
The figure 13 shows the whole cosmetics market in China From 2013 to 2017, with an
estimation for 2018. In five years, the cosmetics market grew by 26% in China, which is five
times faster than the growth of the global cosmetics market.
Figure 13: Cosmetics market size in China (in billion Yuan)
Source: Statista database by Agne Blazyth, 2019
37
2.3.2 Chinese regulations in the cosmetics market
Imported cosmetics need pre-market approval from the Chinese State Food and Drug
Administration (SFDA) before entering the country. It exists two main rules and many new
laws since 2013 that companies have to follow (See Annexe 2):
1. The “Regulation for the Hygiene Supervision of Cosmetics” (1989) which mentions
that each new cosmetic product is subject to licensing requirement from the SFDA.
2. The “Provision for the Hygiene License application procedure” (2009)
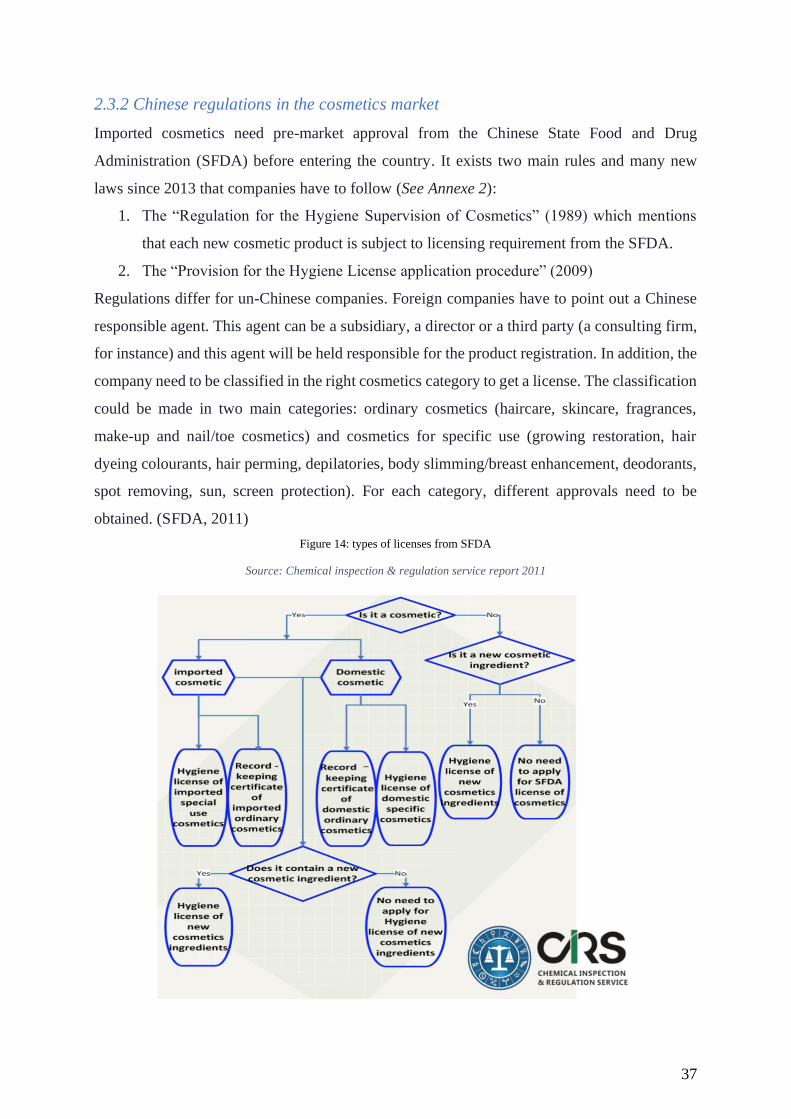
Regulations differ for un-Chinese companies. Foreign companies have to point out a Chinese
responsible agent. This agent can be a subsidiary, a director or a third party (a consulting firm,
for instance) and this agent will be held responsible for the product registration. In addition, the
company need to be classified in the right cosmetics category to get a license. The classification
could be made in two main categories: ordinary cosmetics (haircare, skincare, fragrances,
make-up and nail/toe cosmetics) and cosmetics for specific use (growing restoration, hair
dyeing colourants, hair perming, depilatories, body slimming/breast enhancement, deodorants,
spot removing, sun, screen protection). For each category, different approvals need to be
obtained. (SFDA, 2011)
Figure 14: types of licenses from SFDA
Source: Chemical inspection & regulation service report 2011

38
After the SFDA approval, cosmetics products are subject to the Chinese inspection and
Quarantine Authority (CIQ) verification and testing. This assessment is fortunately only needed
for the first introduction of a product in China. Furthermore, Chinese government impose
regulations on costs according to types of cosmetics.
Table 4: Application costs according to the cosmetics types6
Source: Chemical inspection & regulation service report 20117
As table 4 shows, costs may vary based on the type of products and can be more or less
consequent. However, it is key to keep in mind that this assessment is only applicable for a
product that does not yet exist on the Chinese market. On top of the administrative part, exports
of cosmetics products in the Chinese market will also have importation costs (tariff on imports).
The table below shows the tariffs according to the different categories of cosmetics products.
These tariffs are quietly low compared to others countries and compared to previous years.
6 Including the cost of application, preparation, testing coordination, translation and notarization.
7 Even if the data are old, the applications costs are still the same in 2019

39
Imports tariffs rates in China for different products (Daxue Consulting, 2019):
Cosmetic product Import tariff
Skincare 1%
Makeup 5%
Shampoos and hair products 3%
Nail polish 5%
Perfume 3%
Other 3%
It is worthy essential to keep in mind that even if China evolved a lot over the past decades,
regulations did not change at the same pace. This mismatch of timing increases the complexity
to trade with China. That is why in 2017, Shanghai district decided to simplify registration for
non-specific use cosmetics in the free trade area to boost the cosmetics industry (Daxue
Consulting 2019). This decision has positively impacted the duration for registration of new
products that can be done in less than five days (compared to months before). This major change
in the registration process allows foreign companies to have more power and Chinese
consumers to have more convenient access to the foreign product.

40
2.2.4 Chinese cosmetics trade balance
It is well-known that Chinese people use European cosmetics thanks to their reputation. Indeed,
the two following tables represent how many cosmetics products are exported and imported in
China every year since 2008. It can be observed that just after the financial crisis, China
exported more cosmetics than the one imported and then the trends moved and since 2016,
China imports more than it exports in the cosmetics sector.
Figure 15:Chinese cosmetics trade balance from 2008 to 2017
Source: National Bureau of Statistics of China for Data, Report from 2008 to 2017
The “China Cosmetics Market Report, 2019-2025” report that the growth of the imports of
cosmetics is still fast. The report has shown that imports in this market grew at an annual rate
of 30% between 2008 and 2017. Last year, the monthly growth was over 50% from January to
September. However, it has fallen to 16.84% in November and 37.98% in December. (Research
and Markets, 2019) This decline is mainly due to the mind-set change of Chinese people over
cosmetics.
Chinese people prefer now quality to quantity. The first reason is that they prefer safety and
high quality to low-price and unsafe products; thus, they are ready to pay higher to have better
products. The second one is that Chinese products are perceived as low-cost and unsafe for the
skin. Notably, women from China loves the “made in France”. Last but not least, the middle
class pay more attention to their appearance, and they are more and more attracted by high-
quality product than before.
0.00
10.00
20.00
30.00
40.00
50.00
60.00
70.00
80.00
90.00
2008 2009 2010 2011 2012 2013 2014 2015 2016 2017
Chinese cosmetics trade balance (100million USD)
Exports (UDS) Imports (USD)
41
To conclude, the Chinese cosmetic market is growing faster and faster over the years, mainly
due to the change of habits of Chinese people and the rise in income level over the last past
years.
2.4 Chinese consumer behaviours
The Chinese consumer has evolved. Nowadays, three categories of consumers are the most
promising (L’Oréal China Annual Report, 2018):
• The “senior population”: these consumers are looking for anti-ageing products and
skin care products.
• The “millennials”: this category use mostly cosmetics to express their personality.
Therefore, they are looking for makeup. Nonetheless, they add recently a skincare
routine. Hence, the skincare segment becomes also significant.
• The “men” population: Chinese’men are looking for skincare products than
anywhere else.
Despite these intergenerational differences in consumption behaviour, Chinese have common
characteristics: rise of purchase parity, health, unique customers’ experience, customization and
premium quality goods and services. It is, in fact, the faithful following of the actual trends.
There is a major opportunity for foreign brands in China because Chinese consumers do not
trust in domestic brands. Chinese brands have a reputation for being low-quality and unfair
compared to foreign ones. (Verot & Zhu, 2015)
42
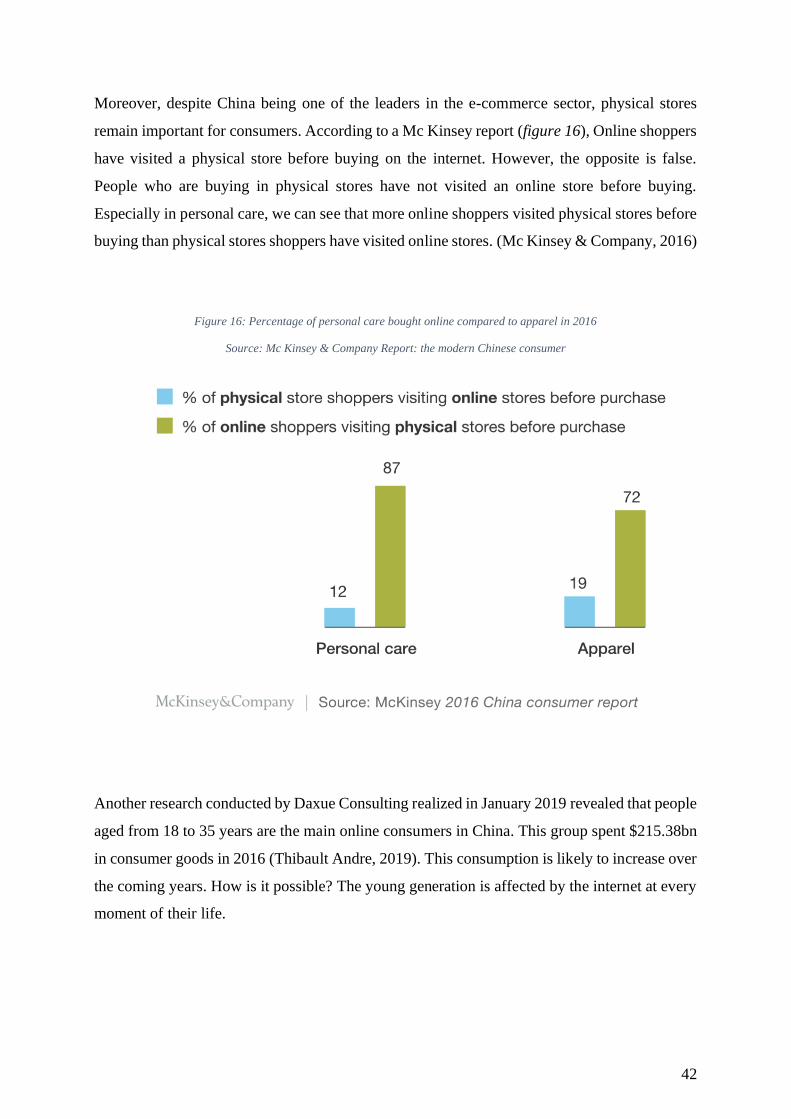
Moreover, despite China being one of the leaders in the e-commerce sector, physical stores
remain important for consumers. According to a Mc Kinsey report (figure 16), Online shoppers
have visited a physical store before buying on the internet. However, the opposite is false.
People who are buying in physical stores have not visited an online store before buying.
Especially in personal care, we can see that more online shoppers visited physical stores before
buying than physical stores shoppers have visited online stores. (Mc Kinsey & Company, 2016)
Figure 16: Percentage of personal care bought online compared to apparel in 2016
Source: Mc Kinsey & Company Report: the modern Chinese consumer
Another research conducted by Daxue Consulting realized in January 2019 revealed that people
aged from 18 to 35 years are the main online consumers in China. This group spent $215.38bn
in consumer goods in 2016 (Thibault Andre, 2019). This consumption is likely to increase over
the coming years. How is it possible? The young generation is affected by the internet at every
moment of their life.
43
The development of new platforms means that people have continuous access to e-commerce
platforms only on their phone, and that they are continuously to consume more and more. In
addition, this permanent access to information through news and media led to a higher expected
life-style compare to previously. As a result, people are willing to acquire a better quality of
life and environment. Furthermore, according to a Morgan Staley report on the cosmetics
consumer’s behaviours published in 2016, domestics brands are declined in terms of rate of
sales in favour of foreign companies, specifically Asian and French ones. (Morgans Stanley,
2016)
Twenty years ago, the Chinese population was classified into two main groups: Consuming
China and Surviving China. This classification is not valid anymore due to emergence of a new
class: the middle class that regroups a considerable part of the population. This new class of
population was born thanks to the increase of income in China. That is the reason why people
are likely to buy more expensive brands that previously. This new class represents one of the
major player in the cosmetic consumption in China and contributes to the positive growth of
this sector. (Lei Tang, 2009)
To sum up, changes in habits of Chinese consumers offered an opportunity to France to export
cosmetics to China. These consumers are looking for premium products. Therefore, French
brands perceived as luxurious sell many products in China. However, due to barriers of entry,
these companies had to develop others distribution channel than the physical ones.
2.5 Revolutionary Change on Sales Channels:
It exists four main distribution channels in the cosmetic market: supermarkets, department
stores, cosmetics chain stores and online platform. In this paper, we will mainly focus on e-
commerce and online platforms as (E-Marketer, 2019):
- It is currently the distribution channel with the fastest growth (27.3%);
- It is the distribution channel with the highest potential for growth;
- It is currently the distribution channel the most widely used.
44
2.5.1 E-commerce in China
The internet appeared in China in 1994 and has recently penetrated the commercial sector.
Thus, industries have to change their way of doing business by implementing the digital world
in their activities. When there is innovation, industries have to adapt their mindset to it.
However, E-commerce is not like all other discoveries because it pushes innovation and
stimulates entrepreneurship. E-commerce platforms in China were initially supported highly by
the government.
According to Mao Yuxin and Zhao Liang (2015), six phases composes the development of e-
commerce: germination, growth, accelerate, mature, outbreak and integration. Based on this
research, UNIDO (united nations industrial development organization) identify four main steps
in the launch of e-commerce in China (Annexe 3). The phase that is the most interesting in this
paper is the last one: The Globalization stage, during which China opens e-commerce to border
and therefore give an access to consumers to new products. (Hongfei, 2017)
Then, it is tough to trade in China due not only to the differences in terms of social media, of
web researcher (this country uses its own “Google”, “Baidu”) but also due to the different
mindset and culture of people living there.
Trade by e-commerce in China means using these platforms:
• Wechat (B2C): sharing a brand story, product information or some beauty trends can
increase engagement.
• Weibo(B2C): “the breeding place for beauty KOLs”, it is a must platform for build
cosmetics brand reputation and drive sales. à a considerable number of users. Four
hundred eleven million active users every month.
• Little Red Book (Xiaohonshu): It is “a sharing platform for young people’s lifestyles
through deep-rooted UGC shopping sharing community” (Godigital China Agency,
2019)
• Tmall B2D platform: it is a business to distributors platform because it is complicated
to understand the customers’ needs in China. It is only devoted to professionals and
more controlled than other platforms.
• Alibaba(B2B): the most prominent platform (equivalent to Amazon, called the
“Chinese” Amazon)
45
• Jingdong (JD): deliveries are directly at home such as Amazon, and that is the main
difference between JD and Tmall. Due to the strict rules to enter a product on this
platform, it is known to have only authentic brands.
• Netease Koala
• Tabao(C2C) : Owned by Alibaba. This platform allows consumers to be in touch with
each other.
• VIP.com: cross-border e-commerce based on in-house logistics which manages most of
the cross-border import process from the product manufacturer to the final delivery.
The unique feature of the two first platforms is the fact that there is not only e-commerce
platform such as Amazon but also social media. This function allows companies to make more
easily advertisements. For instance, by creating partnerships with Chinese influencers to boost
sales.
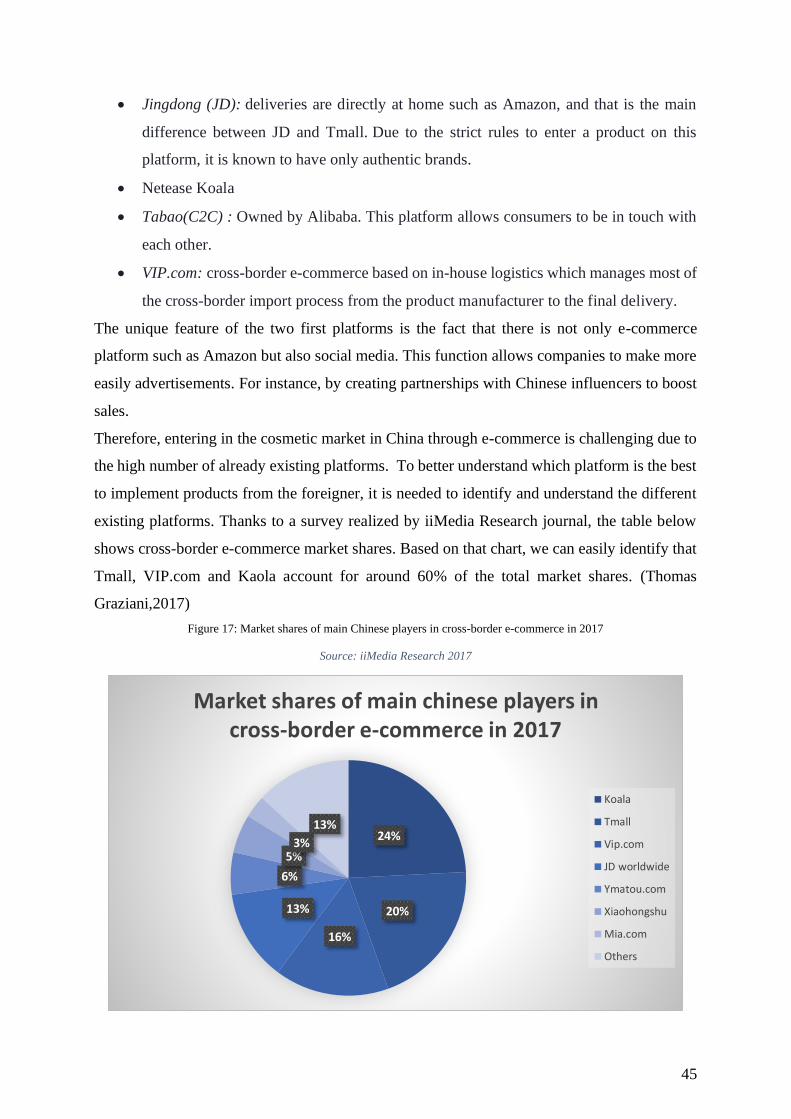
Therefore, entering in the cosmetic market in China through e-commerce is challenging due to
the high number of already existing platforms. To better understand which platform is the best
to implement products from the foreigner, it is needed to identify and understand the different
existing platforms. Thanks to a survey realized by iiMedia Research journal, the table below
shows cross-border e-commerce market shares. Based on that chart, we can easily identify that
Tmall, VIP.com and Kaola account for around 60% of the total market shares. (Thomas
Graziani,2017)
Figure 17: Market shares of main Chinese players in cross-border e-commerce in 2017
Source: iiMedia Research 2017
24%
20%
16%
13%
6%
5%3%
13%
Market shares of main chinese players in cross-border e-commerce in 2017
Koala
Tmall
Vip.com
JD worldwide
Ymatou.com
Xiaohongshu
Mia.com
Others
46
It is important to point out that without any e-commerce channel today, it will be extremely
challenging to enter any market and especially the Chinese one. Furthermore, China online
exports are more important than its online imports. (See Annexe 4) Two main reasons behind
this imbalanced trade balance are the ability of China to manufacture at low-cost and their
second position of leader in developing e-commerce platforms. This channel help china to
expand even more their products around the world.
To sum up, e-commerce channel distribution in China is the most promising one due to different
factors:
• The growing number of online buyers over years over years. (see Annexe 5)
• Entering through this channel is easier than implementing physical stores due to high
regulations.
• It exists many different platforms with different purposes to help French companies to
adopt the right positioning on the market.
Nevertheless, although China is ahead in terms of e-commerce channels, it remains some
problems to trade through this channel for foreign brands.
2.5.2 Problems of the cross-border e-commerce in China:
Legal of e-commerce in China:
One of the main problems is the difference between inspection standards across countries.
Notably, they were not well-defined in China until 2019; thus, it was tough to implement
products and services through the e-commerce channel. The misalignment in laws between the
world and China until 2019 was a major problem to import cosmetic products through this
channel.
Hence, in 2019, a new law about e-commerce in China has been enacted. This law was mainly
enacted due to the counterfeited products sold online. In this new law, it is said that any e-
commerce operator has to register as a market entity. Moreover, each e-commerce activity has
to conform to Chinese regulations and laws. For instance, the seller needs to respect the IP
rights of the founder of the products. In addition to this, the rules for foreign businesses are
stricter as for each sector in this country.
Foreign companies have to follow import and export Chinese laws and have to be truthful for
what is on the e-commerce platform. Data protection, cyber-security and intellectual property

47
protection in order to protect the consumer are the critical point of this new law. These key
points are mainly due to the importance of counterfeit market existing in China.
Counterfeit market in China
One of the main problems in selling in China is the substantial counterfeit market. More than
80% of counterfeit goods in the European Union comes from China or Hong Kong. Counterfeit
products are not specific to the cosmetics sector. According to the OECD report trade in fake
goods account for 3.3% of the world trade and is rising in 2019. (OECD,2019) Moreover,
imports of fake goods from the non-EU countries to the EU countries represents 6.8% of the
global imports number, up from 5% in 2013. As counterfeiting is illegal, it is hard to know
precisely the number of counterfeited goods by categories. Nevertheless, a survey from the
OECD shows the seizures statistics of the counterfeit products to have an idea of counterfeit
items by sectors. The evolution between 2014 and 2016 is such as the number of goods seized
has decreased over two years, especially in the footwear category. (OECD, 2019)
Figure 18: Trends in trade in Counterfeit and Pirated Goods in 2014
Source: OECD/EUIPO (2019), Trends in Trade in Counterfeit and Pirated Goods, Illicit Trade
48
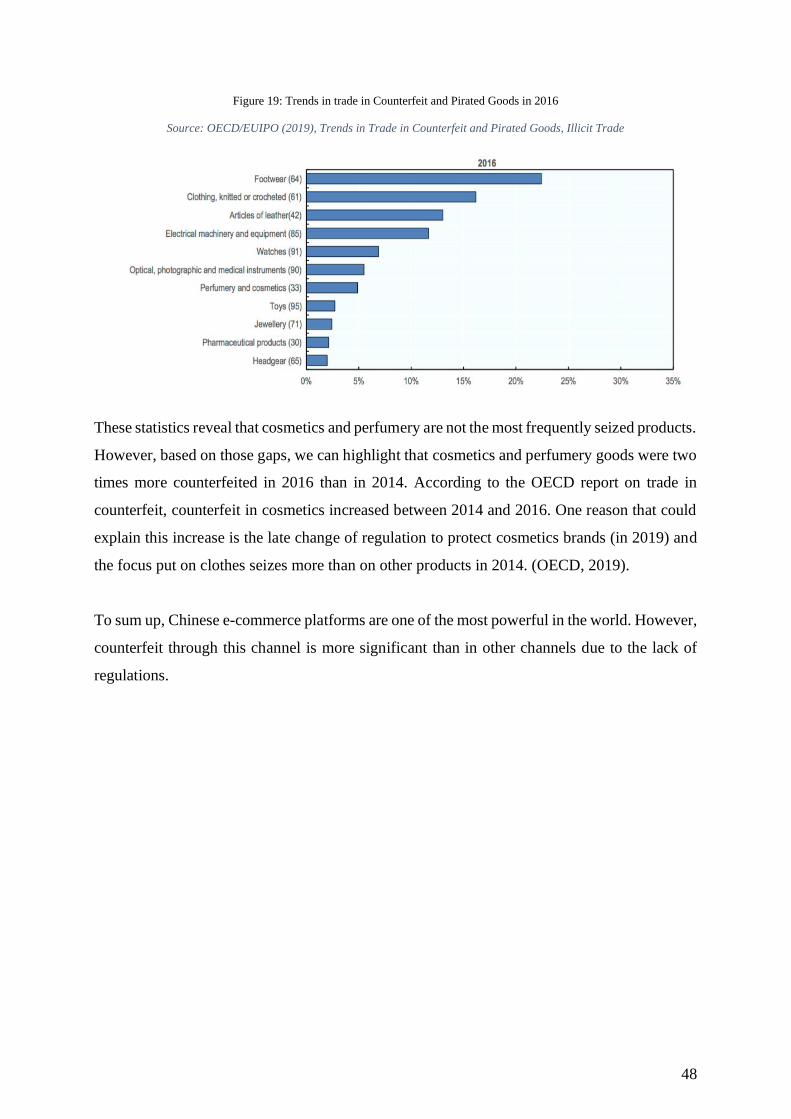
Figure 19: Trends in trade in Counterfeit and Pirated Goods in 2016
Source: OECD/EUIPO (2019), Trends in Trade in Counterfeit and Pirated Goods, Illicit Trade
These statistics reveal that cosmetics and perfumery are not the most frequently seized products.
However, based on those gaps, we can highlight that cosmetics and perfumery goods were two
times more counterfeited in 2016 than in 2014. According to the OECD report on trade in
counterfeit, counterfeit in cosmetics increased between 2014 and 2016. One reason that could
explain this increase is the late change of regulation to protect cosmetics brands (in 2019) and
the focus put on clothes seizes more than on other products in 2014. (OECD, 2019).
To sum up, Chinese e-commerce platforms are one of the most powerful in the world. However,
counterfeit through this channel is more significant than in other channels due to the lack of
regulations.
49
2.6 E-commerce in the cosmetics market in China
China is a crucial player in e-commerce worldwide. Therefore, it is important to understand
what are the opportunities and threats in this distribution way before implementing a brand,
especially in cosmetics sectors. Besides, without this channel, it is quietly impossible to
survive as a French cosmetics brand in China.
Firstly, the purchase habits of Chinese consumers changed over the past ten years. One of the
most important change is consumerism habit is the move to online purchasing. This change of
habit affected all types of products but especially the cosmetic products. When multinationals
entered the market, the leading distribution channel for cosmetics was department stores. Then,
e-commerce and websites stores were emerging, and foreign brands used it more and more.
After having understood e-commerce in China, it is essential to keep in mind that it will
continue to raise and will more than likely become the main channel for cosmetics in the coming
years. According to a research realized by iResearch, 7 out of 25 billion annual sales in the
cosmetics sector are made on e-commerce platforms in 2015. (Olivier Verot, 2015)
Furthermore, since 2009, the penetration rate of online sales of cosmetics rose and reach 25,3%
in 2018. Forecast for 2022 is an online penetration rate of 31.4% for cosmetics. (China
Cosmetics Report, 2019) E-commerce is an excellent alternative to sold goods in China without
strict regulatory requirements. Even if the laws changed about e-commerce last in 2019, it
remains easier to sold by websites than to import physical goods in Chinese stores. However,
it is important to keep in mind that online sales have to be combined with an offline experience
to offer the best experience to customers. People are searching for the best customer experience
and specifically for cosmetics products. People want to see, touch and smell the products before
buying them on the internet.

50
Indeed, a study made by GMA marketing agency in 2019 pointed out that 90% of girls buying
cosmetics looks for information about products before making their purchases. Therefore, it
exists different platforms with different purposes (Olivier Verot, 2015):
1. Tmall/Tabao/JD: information sources, mainly for searching information about
cosmetics.
2. WEIBO: number one for KOL’s beauty. Ideal platform to begin to construct a
community in China.
3. BAIDO: Chinese search engine, really efficient in terms of cosmetics.
4. WECHAT: Social media, more for information and show about how to use cosmetics.
5. The little red book: dedicated for international cosmetics brands.
Consequently, Chinese e-commerce platforms have many different purposes: advertising,
purchasing or creating a community to share information). Nonetheless, the global purpose is
to reach rapidly additional customers and to understand the demand.
In the end, many platforms dedicated to different marketing purpose exist in China. For foreign
companies as the French ones, it is easier to use this channel than directly implementing
physical stores. Nevertheless, the choice of platform is a key factor to success in the Chinese
market. As a result of high regulations and barriers to entry the Chinese beauty market, e-
commerce revolutionized the way French cosmetics brands export their brand.
51
2.7 Impact of positive Chinese economic development on French cosmetics
sales in China
China opened its market in the 1990s, and since then, local companies have to face more
competitors than before. Despite the growing market in this sector, the entry remains
challenging because of the high number of companies presents on the market from everywhere
in the world (Europe, the US, Asia).
Before the emergence of local companies in 2014, China was the place to be for foreign
cosmetics products. Then, in 2016, Chinese companies continued to grow. Moreover, other
Asian brands, such as Shiseido took market shares in the Chinese market. Thus, the
development of Asian companies raises the number of competitors in the Chinese market.
Launching local brands is not easy; thus, the question is more what the reason behind the
success of Asian brand in China is? One main answer: Asian influencer. For instance, one of
La Neige’s lipstick saw its sales grew many thanks to the advertisement on TV by the Korean
Star Hye Ko. European companies understood it and imitated their competitors.
According to the “China cosmetics market Report 2019-2025” (May 2019), in 2017, only 3
Chinese brands were recorded in the top10 ranking of cosmetics companies: Shanghai
CHICMAX, Shanghai Pechoin and JALA Corporation. The rest were foreign brands. At the
end of June 2019, according to the statistics of the National Medical Products Administration,
4933 companies producing cosmetics were present in China.
However, that is not because one brand is famous in one country that it will be the same in
another country. It is well-known that each country has its own culture, its mind-set that differs
from one side of the world to the other side. Therefore, adopting the right position in the market
is a key factor to be successful in China.
To illustrate the importance of the positioning in the Chinese market, two examples will be
studied: a failure and a success of implementation.

52
1. Example of failed implementation: Garnier by L’Oréal
Garnier is present in over 70 countries and has entered the Chinese market in 2006. In 2014,
L’Oréal Group decided to pull out Garnier from the Chinese market. At that time, Garnier was
the second brand of the Group, with an estimated turnover of around 5 billion Euros
(Dromard,2014). Some reasons could explain the failure in implementing a brand in China for
the actual worldwide giant in cosmetics.
Firstly, Garnier had a weak positioning on the market. Prices were too high to enter the mass
market and too low to enter the luxury market. Thus, this brand was in between both sectors.
Moreover, the mass market in China is extremely competitive in terms of domestic brands.
Consequently, local brands overcame Garnier.
Secondly, the distribution channel for Garnier was not the best choice. L’Oréal has chosen to
distribute its products through big stores before going into the supermarket. Then L’Oréal has
decided to focus on its two leading brands: L’Oréal Paris and Maybelline NewYork. (The Wall
Street Journal, 2014).
Finally, Garnier suffered from the high competitiveness of the local market and has difficulties
to enter a market in-between the premium and the mass-market.
2. Example of successful implementation: Avène
In 2003, Avène entered the Chinese market. Ten years after, the brand sold one product every
5 seconds. Chinese consumers trusted Skincare products from this group in less than ten years
which is never happened for any brand before. (Pierre Fabre, 2013)
One key factor of this success is that the brand has succeeded in reaching dermatologists trusted,
and recommended them as best skincare products. The brand has also taken advantages of its
positioning on the market by adapting its strategy to China while having the high-quality
positive reputation of “made in France” brand. Targeted consumers at the beginning were
young women under 30 years old who were supported by a “consumer services after-sales”
department. Avène was one of the first brands to offer that kind of services. (Pierre Fabre,
2013).
53
Although the skincare sector many French competitors such as La Roche Posay, Vichy or
Avène, this sector is still growing. The main reason behind the growth is the pollution. Chinese
pay more and more attention to their skin and the effect of the pollution on it. That is why
Chinese buyers are searching for products approved by dermatologists.
Thus, the brand has easily found consumers to its products in the cosmeceutical segment, which
is less competitive than other cosmetic sectors. Moreover, the positioning of the brand was
well-defined as a premium one which guaranteed high-quality products. This premium aspect
is essential in a country where scandals about toxic products for skin are frequent.
To sum up, enter the cosmetics market in China is not easy. The culture of a country is essential
when a company wants to enter a new market. After reading articles and book on how to enter
in China, one of the best ways is to hire new Chinese employees or to acquire an already existing
Chinese company to understand how consumers think and how Chinese management
works. On the one hand, E-commerce development in China helped French companies to export
their products in China, offering a significant potential to grow. On the other hand, French
brands built an image of luxury over years and succeeded in attracting Chinese population.
2.7.1 Attractiveness of French cosmetics for Chinese
It is known that the Chinese cosmetics market is attractive because the demand for that product
is higher than before. Until 2013, French cosmetics represented around 33% of the market share
with giants as Dior, L’Oreal or Clarins that outperformed local and Asian brands. Then with
the rise of competitors, French brands lose market shares. The competitiveness of domestic’s
brands increased in day-to-day cosmetics products. The rise of local brands could partially
explain some failure, such as Garnier.
As a result, western brands have registered a decrease in their market shares by 4.8% in the
skincare segment and by 3.8% in makeup in 2014 (Daxue Consulting, 2017). For instance,
L’Oreal continues to grow even if there were an economic slowdown. In 2015, sales of this
group grew by only 4.6% compared to 7.7% in 2014. According to the Sina Weibo data centre
report, in 2016, France was not one of the dominant countries in the Chinese market.
54
Conscious of the problem and the slowdown, French enterprises have decided to react rapidly
to keep their market shares. It was essential to meet the expectations of Chinese consumers. For
instance, L’Oréal has decided to launch a haircare brand “Ultra Doux” protecting against
pollution. Another example is Clarins that decided to invest in research and development in
traditional Chinese medicine and the knowledge in plants. All of these were made possible
mainly by creating partnership or by buying local enterprises.
Furthermore, French companies such as L’Oréal decided to focus on business that makes a
higher profit. In the case of the L’Oréal group, it is to focus on luxury brands such as Lancome,
Giorgio Armani, Yves-Saint-Laurent(YSL), Khiel’s or Maybelline. All these brands accounted
for more than 1 million Yuan in 2018. The reason behind this choice is the change of mindset
of the Chinese consumer mentioned before. (Stephane Rinderknech, 2019) Then, it is worth
noting that Chinese consumers allocate more and more budget for online purchases than before.
It is one reason why French companies have boosted and developed their e-commerce websites
and platforms.
A few years ago, Chinese consumers preferred to go directly in stores to buy cosmetics
products, mainly because the internet was perceived as not safe due to counterfeit products.
These years, Chinese purchasers pay more and more attention to their skin and their health
many due to the increasing pollution. Thus, the legislation changed in 2019 to fight
counterfeiting and allowed consumers to buy online in a more secured way than before.
As the case study of Garnier showed, it is tough to enter the Chinese market not only because
of the positioning but also due to the strict legislation to launch new products. By using e-
commerce to reach consumers as a foreign brand is more accessible than implementing stores
directly in the country. Thus, in the point of view of French companies, the expansion of e-
commerce in China is an advantage for them because they can sell their products directly on
their website.
Nonetheless, French companies have to pay attention to the copying. The main goal of china
to attract foreign investment is to have the knowledge to produce similar cosmetics with lower
costs. Although, French product have their brand image, Chinese always try to copy the
products to make it cheaper. Furthermore, the Chinese government control almost all e-
commerce platforms therefore, even though e-commerce boosted French sales, companies have
to invest a lot in patents.
55
Finally, consulting firms identify key drivers to be successful through e-commerce in China as
a French cosmetics company (Daxue Consulting,2018):
➢ Chinese consumers are able to put more money into high-quality products. Therefore,
the French company has to construct a strong reputation with the good positioning on
the market.
➢ Cross-border e-commerce decreases the power of the trade barriers in China by having
fewer taxes.
➢ Use Social media as advertisers. Chinese consumers want to be engaged by the brand.
➢ Creating an online customer experience by using Artificial Intelligence. For instance,
L’Oréal created a unique experience by having an interface to test hair colour directly
on faces.
To have a real idea of the impact of Chinese e-commerce on French cosmetics products, the
French worldwide leader in the sector will be analysed: “L’Oréal”. It is essential to report that
L’Oréal recognized the great opportunity in the used of smartphones to buy luxury cosmetics
by Chinese consumers. Hence, L’Oréal changed its strategic position from traditional brick-
and-motar markets to a combination of luxury and e-commerce market. That was the best
strategic decision to implement L’Oréal in China.
2.7.2 L’Oréal China: a success story
L’Oreal China was launched 20 years ago. The 22 brands and the customized innovation
according to customers' needs made the uniqueness of the French group. The way that this
group worked is to invent with Chinese for china thus, they established directly in China
research and development center to answer to the demand. Sometimes, products found in these
centers could penetrate other similar markets. One key factor of success of L’Oréal in China is
not only the right positioning of their brands on the market but also the launch of new products
never seen on this market and in line with consumer’s expectations.
In September 2019, e-commerce sales in China for L’Oréal represent 40% compared to 13.2%
for the global business of L’Oréal. Chinese consumers buy mainly on mobile applications such
as WeChat. Consequently, for this country, L’Oréal had to develop new technologies and
innovation to attract consumers in another way than the classical in-store experience. For
56
instance, the group developed a new technology that allows Chinese customers to try lipsticks
by taking a photo of themselves. Furthermore, these technologies tested in China are test-
innovations that can be spread out around the world later because the massive digitalization is
not only in China. However, consumers’ expectation for online sales is similar to the one for
offline sales. That means that people expect to have as better customers experience as in-store
but on a website. (Handley, 2019).
The best financial performances for that Group were recorded in Asia-Pacific in the Luxe-
division which recorded a growth of 20.4% in 2018. (L’Oréal Annual Report, 2018)
Furthermore, the Magazine Forbes point out in 2019 that “The Active Cosmetics Division saw
an outstanding performance in China.” This Active Cosmetics division contains mainly skin
care products. (Forbes Magazine, 2019) Therefore, the most promising segment in China is the
skin care one.
In addition, a positive correlation between e-commerce and strong performance for L’Oréal
Paris is recorded due mainly to the ability of the group to react rapidly to the change of
consumption habits. Stephane Rinderknech, CEO of L’Oréal China, reported in an interview
for the ChinaDaily magazine in 2019 that 22 brands of L’Oréal present on the Chinese market
have launched e-commerce stores. To understand the weight of e-commerce in China for
L’Oréal, Stephane Rinderknech points out that 48% of YSL’s sales came from consumers living
in cities where the brand is not selling in physical stores. (Shi Jing, 2019) Moreover, in general,
half of the sales in China are made online. As a result, e-commerce sales in China represents a
massive part of the turnover for L’Oréal. (L’Oréal Annual report 2018)
To conclude, L’Oréal has successfully implemented twenty-two brands. The main reasons
behind this success is the way the group targeted consumers. Brands implemented meet the
consumers’expectations. Furthermore, the group chose the right positioning in the market by
using the luxurious “made in France” image. Last but not least, L’Oréal was one of the first
French player after LVMH which has developed its e-commerce platforms.

57
2.8 Future of French cosmetics in China:
2.8.1 Future Opportunities:
➢ “Made in France” reputation: Chinese people appreciate French cosmetics
brands even more than before. Mainly due to the brand image but also due to the
perception of France in their mind. Chinese perceived France as a country
representing elegance and luxury. Moreover, consumers pay attention to their
skin more than ever. As researches have shown, French cosmetics companies
are active in this segment of beauty. Besides, makeup is a growing sector in
China, especially French makeup, with the launch of Sephora in China. Both of
these beauty segment represents the main opportunities for growth in China in
the next five years.
➢ Consumers will continue to change their habits: the Tmall 2019 Beauty Trends
report identified four major promising consumer’s groups: young people in
small cities, generation Z (15-25 years old), mature women and families with
children. (He, 2019) In 2018, still according to the Tmall report, young people’s
online purchases grew by 38% in small cities. Therefore, French companies have
a tremendous opportunity to develop e-commerce marketing campaigns for
young consumers living in small cities. The e-commerce distribution in small
towns is going to grow because physical stores are not implemented in these
parts of the country. Finally, there is a vast opportunity for penetrating the 2nd
tier and 3rd tier market and reaching new consumers.
➢ Channel distribution: the mainstream for beauty purchases in China remains
online platforms. However, the sales growth through this channel between 2017
and 2018 declined. This decline can be explained by the improvement of the
customer’s experience in physical stores. Although, e-commerce in beauty
remains strong, French companies have an opportunity to develop their
customer’s experience in-store and improve the online experience they are
offering. Two main trends will be the focus for the coming years for both online
and offline sales in order to meet consumer’s expectations; a customer-centric
strategy and the adaptability of product on demand.
58
➢ The trade war between China and the US: It could be a huge opportunity to gain
market shares for French companies. Due to trade tensions between China and
the US, Chinese consumers shift from American brand to French or Japanese
cosmetics brands. This shift is mainly due to the increase of tariffs between the
US and China. As a result, US cosmetics brands are losing market shares in
favour of French and Japanese brands. Therefore, France could take advantages
of this trade war between the US and China. (WTO,2019)
➢ Last but not least, a significant opportunity is the man beauty market that is in
expansion in China. According to a study conducted by the platform Weibo
among its users, the growth of the man skincare segment grew by 18.6%
between 2013 and 2017. Furthermore, according to Euromonitor International,
the expecting growth for 2019 is 6.8% in this segment. Although, it is less than
the women skincare sector. However, it is promising to grow even more in the
next five years. (Deborah Weinswig, 2018)
To sum up, the rise of the middle class constitutes a huge opportunity to reach more customers
for French cosmetics brands. According to the old CEO of L’Oréal China, in 5 years, there will
be 100 million potential consumers more than today. (Stephane Rinderknech, 2018). Moreover,
e-commerce is crucial for international brands that want to enter the Chinese market as well as
using social media to engage consumers.
2.8.2 Future Threats:
➢ Asian competition: the appealing for Japanese cosmetics by Chinese consumers.
➢ Counterfeit: even if China put stricter regulations, counterfeit products sold in
China remains higher than everywhere else in the world.
➢ Regulations changes:
➢ ` in such a country, regulations are significant barriers to entry. Government has
a high influence on trade in China. Therefore, trade in China depends mainly on
the evolution of laws. French companies have to keep in mind not only current
Chinese laws but also the way it could evolve in the next ten years.

59
To sum up, opportunities for French cosmetics firms are stronger than the threats. Future for
French cosmetics is promising; consumers love the “made in France” in their cosmetics. As
long as French companies understand the needs of Chinese consumers, they will be successful.
Nevertheless, the positioning of French companies is different from the one for Asian
companies due to their reputation.

60

61
Chapter 3: Evolution of the cosmetics market in
Brazil
After having understood the way French cosmetics are implemented in China, it would be
interesting to compare it with Brazil. The reason why Brazil is chosen is that both of these
countries have had similar economic development until 2007. The aim of this analysis is to
understand if the Brazilian consumer’s habits are going to evolve in the same way as in China.
Therefore, the purpose is to help French companies to better understand the Brazilian consumer
and the future opportunities to expand French cosmetics in this country. The first step is to
understand the economic development of Brazil.
3.1 Brazil economic development history
Brazil’s economy has experienced huge booms followed by decline’s period. The first boom
was during the 16th century when sugar production was the main driver of Brazil’s economic
growth. Late in the 17th century, Brazil suffered from the rise of the Carribean in the sugar
industry. After the boom of sugar, the 19th century let place for the coffee boom.
According to an economic report on Brazil by Herwin Loman, 75% of the coffee consumed in
the 19th century was produced in Brazil. However, with the global recession of 1930, Brazil
experienced a slowdown in economic growth. The decline resulted in the fact that the Brazilian
economic depended heavily on coffee producers. Then, the period from 1930 to 1945 was a
period of economic and political changes.
After World War II, Brazil wanted to be less dependent on commodities exports. The country
enacted policies on imports to avoid repeating the same story as sugar, coffee or even gold.

62
Then, the most interesting part in the economic development of Brazil is the period between
1970 and 2019. During this period, Brazil experienced globally positive growth except some
years due to historical facts.
Figure 20: GDP growth rate annually of Brazil from 1970 to 2019
Source: World Bank Group data's
As the figure 20 shows, during the 70s, Brazil experienced very high economic growth due
mainly to support by the government on different industries. However, the support to diversify
industries widens inequalities. Then, in 1973, Brazil countered the oil shock by borrowing large
amounts of dollars. Therefore, the boom continued until 1980. From 1980 to 1984, Brazil
experienced an economic recession. This country depended on foreign lending. Due to the rise
of interest rates, the country was in trouble to reimburse its debts. In 1987, Brazil public debts
were as massive as the country was not able to pay interests. Political tensions joined
indebtedness. Until 1985 Brazil was a dictatorship, then the republican system enhanced
economic growth. In 1990, Brazil’s growth experienced a considerable decline of 3.10% due
to hyperinflation.
-10.00
-5.00
0.00
5.00
10.00
15.00
197
0
197
2
197
4
197
6
197
8
198
0
198
2
198
4
198
6
198
8
199
0
199
2
199
4
199
6
199
8
200
0
200
2
200
4
200
6
200
8
201
0
201
2
201
4
201
6
201
8
%
GDP growth(annual%) of Brazil from 1970 to 2019

63
Finally, the Real plan boosted economic growth at the beginning of the 21st century. The new
currency helps the country to have positive growth almost every year until 2014. In 2014, Brazil
experienced a downturn, mainly due to political tensions. Therefore, Brazil has never reached
a growth as important as in China. One reason could be the difference in economic model and
inequalities.
On the one hand, the Solow model explained the fast growth in China due to the dependence
of this economy to savings. On the other hand, Brazil does not rely heavily on savings, therefore
the Solow model could not explain the positive growth. The recent boom in growth depends
mainly on two factors: increase of external demand for commodities and rapid domestics
consumption growth. (Herwin Loman,2014) Nevertheless, this model is not sustainable in the
long term. Therefore, the Mc Kinsey report of 2014 shows that Brazil has to shift to an inclusive
growth mode by taking actions (e.g. reduce regulation for foreign products, reduce the informal
sector or expand infrastructure). (Mc Kinsey, 2014) An inclusive growth is “economic growth
that is distributed fairly across society and creates opportunities for all”. (OECD, 2019) This
model of inclusive growth could partially explain the tremendous growth as the beginning of
the 21st century.
To sum up, such a country has a stormy economic past. Nevertheless, last past year was more
stable thanks to the more stable exchange rate. Until 2014, Brazil experienced a high GDP’s
growth then political tensions changed the game. Furthermore, the election of Jair Bolsonaro
changes the rules of the game of Brazil. This president has a protectionist view of Brazil, which
change the way the economic growth will evolve compared to other BRICS, such as China.
3.2 Brazil VS China Macroeconomic indicators:
Brazil and China both began opening their market in the 1990s. The trend to liberalize the
emerging market was to fight against stagflation. Today, Brazil is the 9th largest economy in
the world, while China is the second one. (Focus Economics, 2018) These countries are
different in terms of size, population and weight in the world economy. They are not at the same
stage of economic development. As we have seen above, China is one step ahead compared to
Brazil. However, they have both experienced recently a period with an increasing growth.
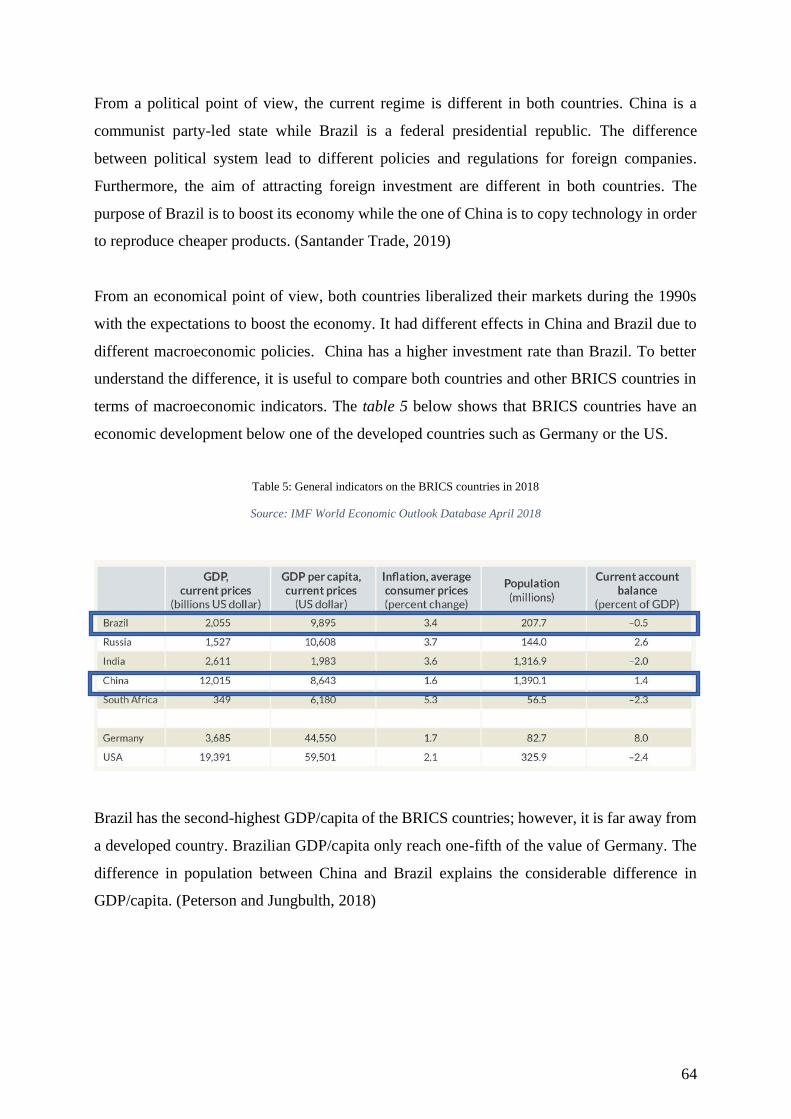
64
From a political point of view, the current regime is different in both countries. China is a
communist party-led state while Brazil is a federal presidential republic. The difference
between political system lead to different policies and regulations for foreign companies.
Furthermore, the aim of attracting foreign investment are different in both countries. The
purpose of Brazil is to boost its economy while the one of China is to copy technology in order
to reproduce cheaper products. (Santander Trade, 2019)
From an economical point of view, both countries liberalized their markets during the 1990s
with the expectations to boost the economy. It had different effects in China and Brazil due to
different macroeconomic policies. China has a higher investment rate than Brazil. To better
understand the difference, it is useful to compare both countries and other BRICS countries in
terms of macroeconomic indicators. The table 5 below shows that BRICS countries have an
economic development below one of the developed countries such as Germany or the US.
Table 5: General indicators on the BRICS countries in 2018
Source: IMF World Economic Outlook Database April 2018
Brazil has the second-highest GDP/capita of the BRICS countries; however, it is far away from
a developed country. Brazilian GDP/capita only reach one-fifth of the value of Germany. The
difference in population between China and Brazil explains the considerable difference in
GDP/capita. (Peterson and Jungbulth, 2018)

65
In addition, Brazil has always been one country with substantial inequalities. This country is
active in the manufacturing, agricultural and mining sectors. Since 2003, Brazil has experienced
a period of social progress that left out of poverty 29 million of people and decreased
inequalities by reducing its debt. The income level of the 40% poorest of the population has
increased by 7.1% on average. (World Bank, 2019) However, it remains one of the unequal
countries in the world.
After steady growth in 2007, Brazil has suffered from the global financial crisis of 2008. After
having two-quarters of recession in 2008, Brazil was ready to begin a recovery. In 2010, the
country reached the highest level of growth that it had ever had in the 25 past last year (7.5%).
(NationMaster, 2018) Then since 2014, Brazil has experienced an economic recession coupled
with a political crisis. This recession comes from a debate between Brazilian economist. Two
main factors lead to a recession: on the one hand, the expansionist monetary policy between
2012 and 2014, which causes the loss of control on the public expenditures. Nevertheless, it is
well-known that Brazil used a lot of public spends to invest in domestic enterprises. On the
other hand, there were a decrease in interest rates between 2011 and 2013. (Nassif & Feijò &
Araùjo, 2016). (Figure 21) All these political and economic factors lead to a significant
recession period starting in 2014. As a result, unemployment rate doubled.
Figure 21: GDP growth and unemployment
Source: OECD economic surveys about Brazil 2018

66
As the figure 22 shown, the unemployment rate decreased in 2014. The boost in the economy
allows companies to hire more workers. However, with the inflation and the decrease of
consumption power, companies were not able anymore to have additional workers, and they
closed some existing jobs. (Cosmetic Business magazine, Euromonitor, 2015).
According to the OECD economic survey of Brazil’s economy in 2018 (figure 22), Brazil
performs less well in the global integration trade than other countries. This low performance,
is mainly due to high barriers to trade and political tensions in this country.
Figure 22: Imports and exports, Average 2010-2016
Source: OECD economic surveys about Brazil 2018
Therefore, they have an opportunity to improve their collaboration with international markets
and to reduce their entry borders. It will enhance productivity for domestic producers as they
will be able to export and have new opportunities around the world. Moreover, it would increase
the employment rate by offering new jobs, especially for those that are less-skilled.
Additionally, there is also a positive impact on the consumer by having more competitive
prices; this would have precisely an effect on the lower-income household. It is interesting to
notice that China pass-through this development stage a few years ago. Once could therefore
consider Brazil as following the first steps of China in its economic development.
67
Despite the beginning of the 2000s, both countries had high growth but they evolved differently;
China had economic reforms that move the system from a closed to an open market-oriented
while Brazil decided new reforms in 2016 that suggested slowing growth of government
spending and limited foreign investments. Hence, nowadays, one of the most significant
differences between the Chinese and Brazilian economies are the balance between imports and
exports. Currently China has more power than Brazil but according to a survey realized by
PWC in 2016, Brazil will gain more power than some European countries in 2050. (The
Guardian, 2016)
3.2.1 Similar macroeconomic indicators
In addition to similarities between Brazil and China in terms of microeconomic indictors, both
countries also share similar macroeconomic indicators (Salama, 2015):
• Inequalities in income distribution: even though it decreases a bit in Brazil and it
increases in China, the income inequalities in both countries are rather similar;
• Trade balance: positive in both countries8 (CountryEconomy, 2018);
• Compared to developed countries, China and Brazil have different wages and
productivity according to the size of enterprises (OCDE, 2012);
• Growth in the level of income higher than the productivity one (Salama, 2015);
• High level of corruption and low level of transparency from the government (Salama,
2015).
8 in 2017, $60.254,0 M for Brazil and $429.580,0 M for China,

68
3.2.2 Different macroeconomic indicators
Although China and Brazil share common macroeconomic indicators, it exists also major
differences between those two countries (Salama, 2015):
• Demography: Chinese population size is around 7 times the Brazilian one.
Figure 23: Chinese demographic pyramid 2018
Source: Population Pyramid 2018
That pyramid shows that the Chinese population is ageing. The old age of the population is
mainly due to the “one-child policy” imposed by the government ten years ago. As a result, the
working population size decrease over the year. The main problem is the financing of
retirement. In 2011, Lee and al. suggested that demographic transition has a positive effect on
economic growth because the working population is higher in numbers than the non-working
one. However, today as the number of retires is higher than the number of workers; it has an
impact on government spending. (Nagarajan & Teixeira & Silva, 2016)
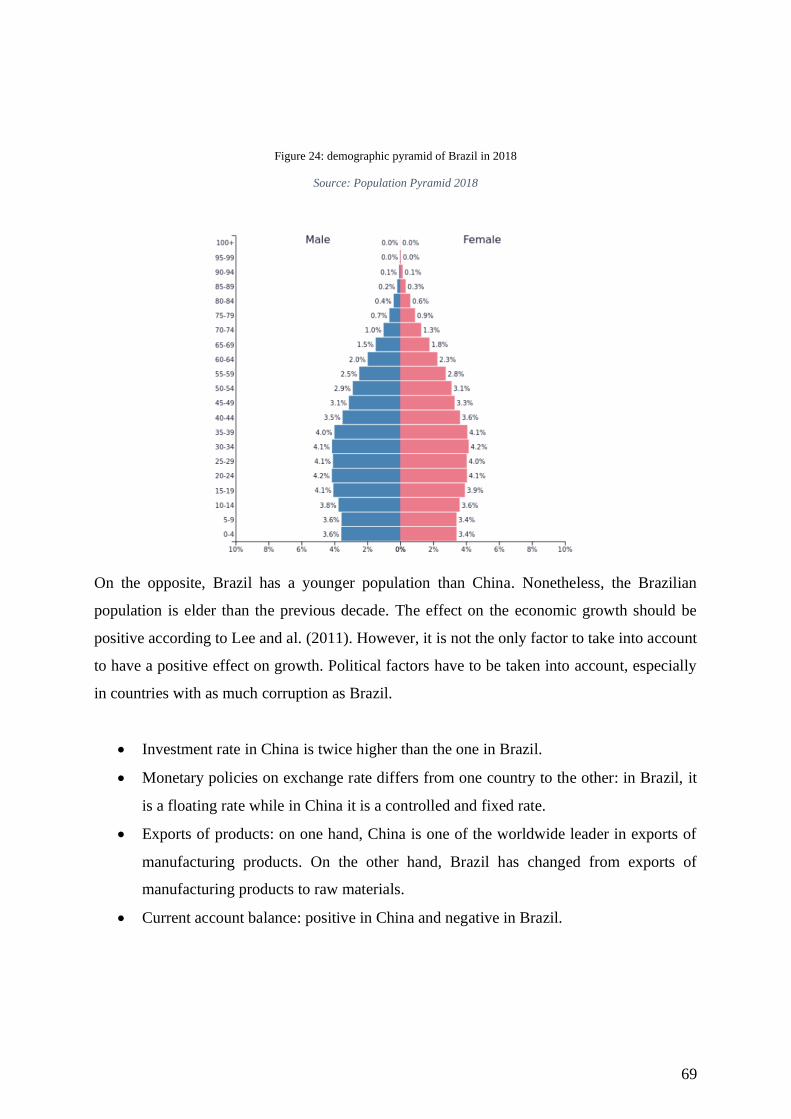
69
Figure 24: demographic pyramid of Brazil in 2018
Source: Population Pyramid 2018
On the opposite, Brazil has a younger population than China. Nonetheless, the Brazilian
population is elder than the previous decade. The effect on the economic growth should be
positive according to Lee and al. (2011). However, it is not the only factor to take into account
to have a positive effect on growth. Political factors have to be taken into account, especially
in countries with as much corruption as Brazil.
• Investment rate in China is twice higher than the one in Brazil.
• Monetary policies on exchange rate differs from one country to the other: in Brazil, it
is a floating rate while in China it is a controlled and fixed rate.
• Exports of products: on one hand, China is one of the worldwide leader in exports of
manufacturing products. On the other hand, Brazil has changed from exports of
manufacturing products to raw materials.
• Current account balance: positive in China and negative in Brazil.
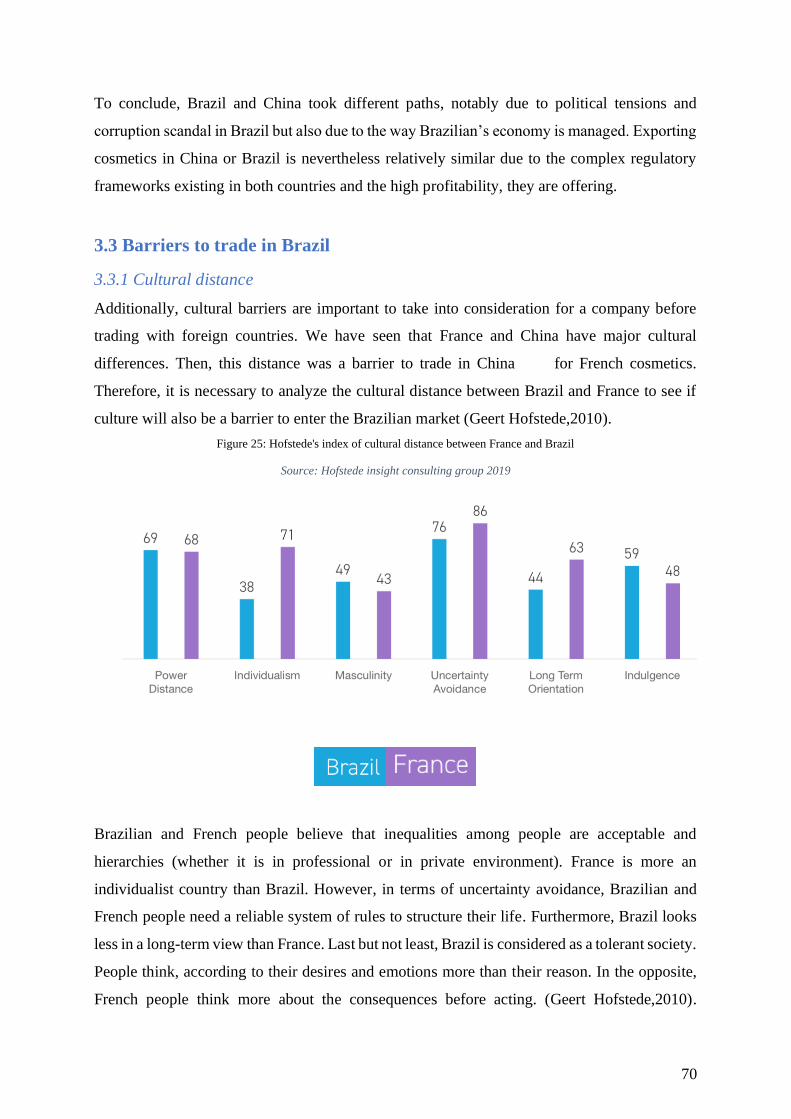
70
To conclude, Brazil and China took different paths, notably due to political tensions and
corruption scandal in Brazil but also due to the way Brazilian’s economy is managed. Exporting
cosmetics in China or Brazil is nevertheless relatively similar due to the complex regulatory
frameworks existing in both countries and the high profitability, they are offering.
3.3 Barriers to trade in Brazil
3.3.1 Cultural distance
Additionally, cultural barriers are important to take into consideration for a company before
trading with foreign countries. We have seen that France and China have major cultural
differences. Then, this distance was a barrier to trade in China for French cosmetics.
Therefore, it is necessary to analyze the cultural distance between Brazil and France to see if
culture will also be a barrier to enter the Brazilian market (Geert Hofstede,2010).
Figure 25: Hofstede's index of cultural distance between France and Brazil
Source: Hofstede insight consulting group 2019
Brazilian and French people believe that inequalities among people are acceptable and
hierarchies (whether it is in professional or in private environment). France is more an
individualist country than Brazil. However, in terms of uncertainty avoidance, Brazilian and
French people need a reliable system of rules to structure their life. Furthermore, Brazil looks
less in a long-term view than France. Last but not least, Brazil is considered as a tolerant society.
People think, according to their desires and emotions more than their reason. In the opposite,
French people think more about the consequences before acting. (Geert Hofstede,2010).
71
Therefore, French cosmetics companies could enter this country knowing the difference in
culture. As a matter of fact, France and Brazil are closer than China and Brazil regarding
culture.
To conclude, Brazil has a complex economic history. However, this country reserves many
surprises for the future. On one hand, Brazil and China are two high-populated where culture
is a key factor to enter these markets. Moreover, both countries are different regarding
demography or political system and similar in others terms (for instance, in trade balances or
economic growth). On the other hand, Brazil is culturally close to France regarding the six
indicators of Hofstede. These cultural similarities will help French companies to implement
their cosmetics product in this country. Then, the next step is to analyse the cosmetic market in
Brazil and the behaviour of consumers.
3.3.2 Complex regulation framework
The World’s Bank ranks Brazil as 116 out of 138 economies with the most complicated
regulations framework. The government has discriminatory regulations for foreign products
in order to protect domestics producers or Latin American ones. The authorities signed
preferential trade agreements with Latin American countries in order to apply advantageous
tariffs to products from these countries. (WTO, 2014)
3.3 Brazilian Cosmetics market:
Brazil stands behind the US, Japan and China in the ranking of the largest beauty market in the
world. It accounts for 9.4% of the global cosmetics market in 2016, according to ABIHPEC.
As in China, Beauty and personal care are part of the culture. The economic turndown does not
affect the beauty and personal care segment a lot. (Weinswig ,2016)
As in China, a change in the trade balance observed that Brazil tends in recent years more to
import than exporting cosmetics products. However, it is worth to notice that there was a peak
in 2013 and then imports of products in these sectors decreased. However, it is worthy essential
to remember that the number of Chinese imports and exports has increased continuously until
today while is not the case for Brazil.

72
The figure 26 shows that the economic and political crisis between 2014 and 2016 had an impact
on the trade balance. Before 2014, the trade balance was similar to the one of China with a
continuous increase in international trade. Until 2013, Brazil imports of cosmetics were higher
than the exports, like China. At that time, the purchasing power parity of the population has
risen, and a new class of population appeared (precisely as in China). The middle class
increased a lot, and thus people preferred to put money in more expensive and higher quality
products.
Figure 26: Trade Balance in perfumes, cosmetics and bath products from 2007 to 2018 in Brazil
Source: Statista data's publied in 2018
In 2017, Brazil imported cosmetics from 4 main countries: Argentina (15.7%), the US (15.1%),
France (14.9%) and China (11.7%). (Liversain, 2019) The economic slowdown in 2015 has
affected the growth in the beauty industry, even if the country currently remains one of the
largest consumer markets. (Industries cosmetiques, 2016)
In this emerging country, cosmetics sector represents a significant opportunity to grow
regarding the consumption per inhabitant. Furthermore, Brazil is a key country of cosmetics
exports for France. As mentioned above, Brazilian pay significant attention to Beauty.
Nowadays, cosmetics, perfumes and toiletries represent only 2.6% of the total French exports
towards Brazil. Reasons that could explain that the low rate is the strict regulation in this sector
and the huge growth of domestic enterprises. (Trade economics, 2018)
0
100
200
300
400
500
600
700
800
900
2007 2008 2009 2010 2011 2012 2013 2014 2015 2016 2017 2018
Imports and Exports value in perfumes, cosmetics and bath products from 2007 to 2018(USD mil.)
Imports Exports
73
To conclude, the Brazilian cosmetic market is a non-negligible player for France in the near
future. Besides the attractiveness for the beauty industry in this country, Brazilian consumers
are looking for premium product more than before. Furthermore, imports from France are
already in the top four however, the latter country could become the first one thanks to its luxury
segment and its e-commerce knowledge. Nonetheless, the success of French products depends
on the change in consumers’ habits (shift from standardization to premiumization).
3.4 Consumer’s habits changes
Due to the evolution of the economy in Brazil, consumer’s habits changed. Between 2004 and
2014, an increase of the minimum wage level combined with the monetary expansion policy
increased the level of consumption. Afterwards, it led to an inflation period, and that directly
impacted the purchasing power of the population and consumer’s behaviour (Gylfason &
Lindbeck, 1994).
Moreover, the decrease of interest rates imposed by the Brazilian government to banks in 2012
to stimulate economic growth resulted in pressure on consumers’ debts in 2014. Thus,
consumers did not know if they would be able to refund their debts. The result is a slowdown
in consumption and conditions tightened by banks. (Cosmetics Business magazine,
Euromonitor, 2015).
As a matter of fact, consumption habits have changed mainly due to the crisis and the lower
purchasing power owned by the population. Nevertheless, consumption habits in cosmetics are
specific. Firstly, Brazilians are the most conscious-beauty population in the world. The latter
continue to spend a part of their budget in hair care and makeup but less in skin care. As
mentioned in the section about Chinese consumers’ behaviours, the most consumed segment is
skincare. However, consumption habits in Brazil are currently different than the Chinese ones.
According to a study realized by Mc Kinsey and Company in Brazil in 2016, consumption of
cosmetics for men and women are different. For instance, this study pointed out that women
are less loyal than men to a brand. Furthermore, the review highlights three key factors that
Brazilian looks for before buying a product: treatment (medical indications), well-being and
improvement of the appearance. (Mc Kinsey and Company, 2016)
74
Typically, online purchases are currently not made by the same type of consumers in Brazil as
in China. On one side, Chinese internet users are young people between 19and 29 years old.
The major part of the population using e-commerce is young workers and millennials. On the
other side, in Brazil, the central part of the population using e-commerce is from 35 to 49 years
old (37% of online shoppers’ population) (Statista, 2019).
Two reasons explain the elder of online shoppers: a high number of young Brazilians that do
not hold a credit card or even a bank account – which is the primary way of payment for e-
commerce – and they face financial difficulties. (Bianca Lopez, 2018) However, according to
Statista research, young people (25-34 years old) will purchase more online in the future due to
improvement in payments’ technologies.
What is more, the most promising consumers’ categories in the near future in Brazil are the
following ones (exactly the same as the current consumers’ profiles in China):
• The “senior population”: the ageing of population for the next years put senior as a
precious target for French cosmetics. The number of consumers with this profile is
going to increase. Therefore, the demand for anti-ageing or skin care products will
increase.
• The “Millennials” population: due the diffusion of e-commerce and the search for
unique personality, the young population constitutes future consumers to target. This
population will be more interesting in the skin care and make up segment.
The consumers’ profiles are similar to the ones that can be currently found in China. Therefore,
Brazilian consumers are more similar to the Chinese ones than expected.
To summarize, French cosmetics brands have to understand the Brazilian consumers’ needs in
order to be successful in this market. Thanks to different studies, French cosmetics organization
needs to invest in strategies marketing, in research and development to find products adapted
to Brazilian consumers and in pricing policies to be align with the attempts of consumers.
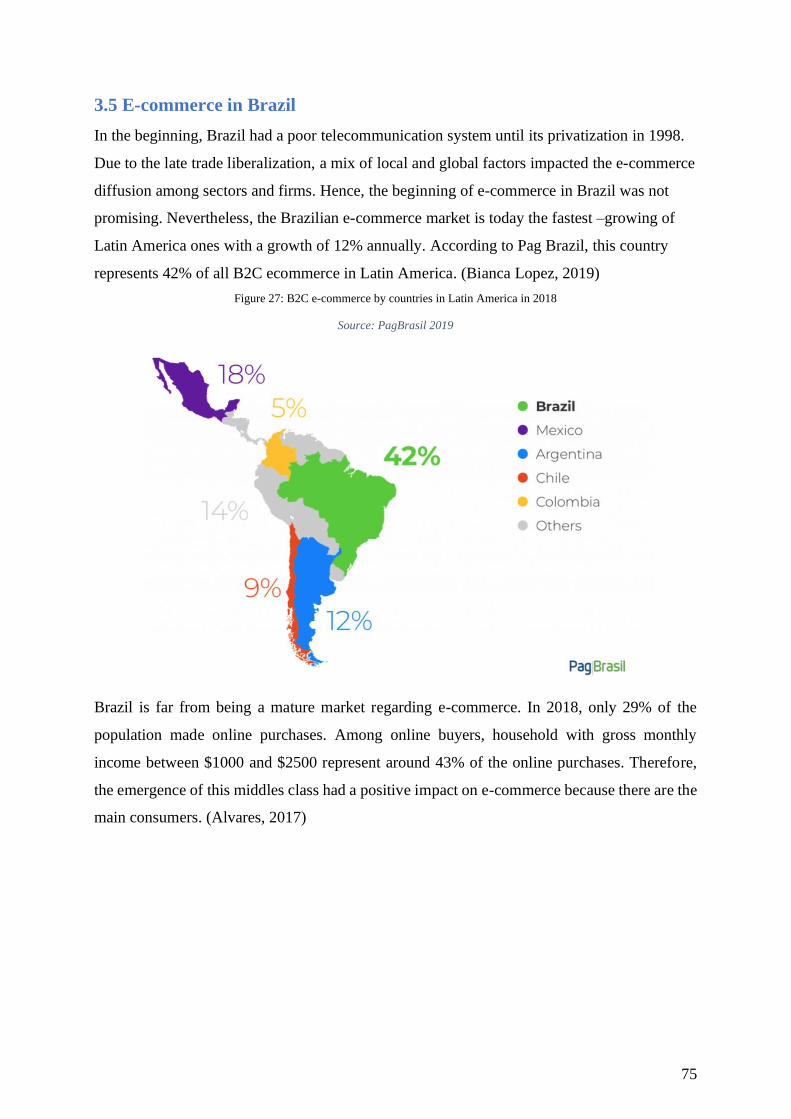
75
3.5 E-commerce in Brazil
In the beginning, Brazil had a poor telecommunication system until its privatization in 1998.
Due to the late trade liberalization, a mix of local and global factors impacted the e-commerce
diffusion among sectors and firms. Hence, the beginning of e-commerce in Brazil was not
promising. Nevertheless, the Brazilian e-commerce market is today the fastest –growing of
Latin America ones with a growth of 12% annually. According to Pag Brazil, this country
represents 42% of all B2C ecommerce in Latin America. (Bianca Lopez, 2019)
Figure 27: B2C e-commerce by countries in Latin America in 2018
Source: PagBrasil 2019
Brazil is far from being a mature market regarding e-commerce. In 2018, only 29% of the
population made online purchases. Among online buyers, household with gross monthly
income between $1000 and $2500 represent around 43% of the online purchases. Therefore,
the emergence of this middles class had a positive impact on e-commerce because there are the
main consumers. (Alvares, 2017)
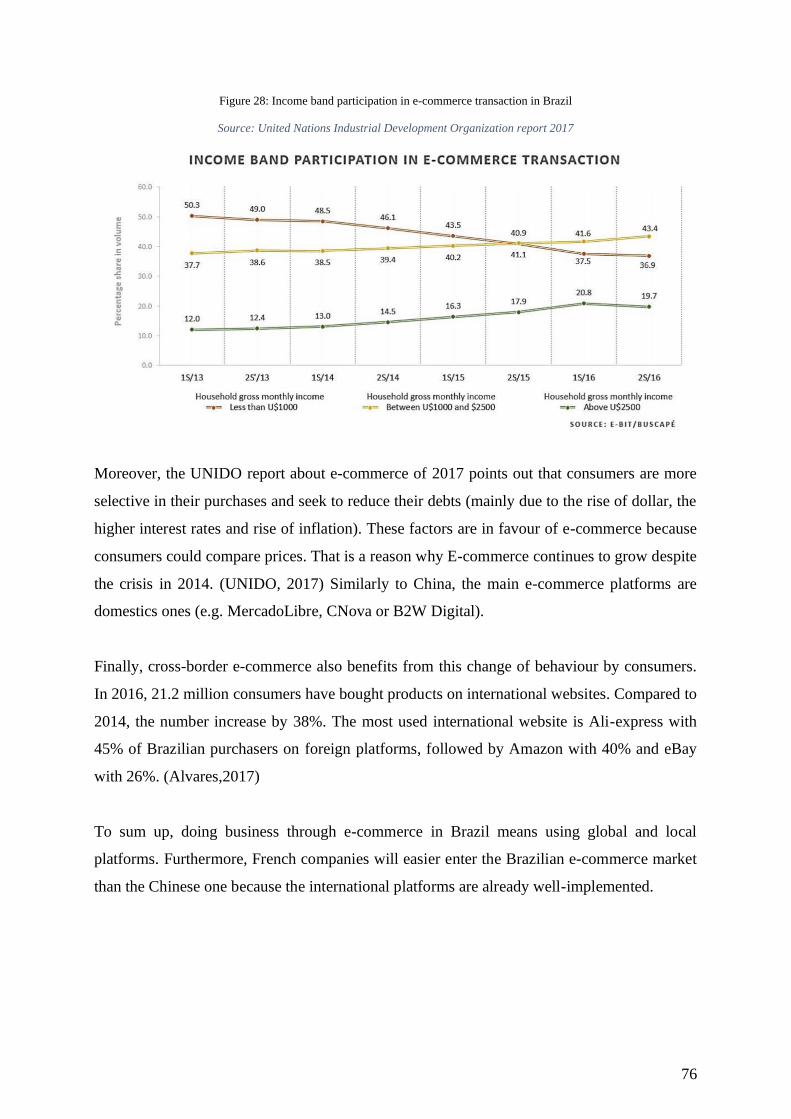
76
Figure 28: Income band participation in e-commerce transaction in Brazil
Source: United Nations Industrial Development Organization report 2017
Moreover, the UNIDO report about e-commerce of 2017 points out that consumers are more
selective in their purchases and seek to reduce their debts (mainly due to the rise of dollar, the
higher interest rates and rise of inflation). These factors are in favour of e-commerce because
consumers could compare prices. That is a reason why E-commerce continues to grow despite
the crisis in 2014. (UNIDO, 2017) Similarly to China, the main e-commerce platforms are
domestics ones (e.g. MercadoLibre, CNova or B2W Digital).
Finally, cross-border e-commerce also benefits from this change of behaviour by consumers.
In 2016, 21.2 million consumers have bought products on international websites. Compared to
2014, the number increase by 38%. The most used international website is Ali-express with
45% of Brazilian purchasers on foreign platforms, followed by Amazon with 40% and eBay
with 26%. (Alvares,2017)
To sum up, doing business through e-commerce in Brazil means using global and local
platforms. Furthermore, French companies will easier enter the Brazilian e-commerce market
than the Chinese one because the international platforms are already well-implemented.

77
3.6 Attractiveness of French cosmetics for Brazilians
Currently, Brazilians are buying more local cosmetics products than the French ones. This
trends is going to shift in favour of French companies. Brazilians will be more attracted by
French product over years for the following reasons.
Firstly, women work, and their purchasing power has increased during the last past years. As a
result, women have fewer children and a higher level of income. On average the level of income
for women increased by 38% between 2001 to 2009 while only increased by 16% for men. As
a result, people allocate a higher part of their income in purchasing premium cosmetics. (Barmi,
2018) Therefore, Brazilians could be more attracted by French cosmetics products thanks to the
“Made in France” image of high-quality and luxury products.
Secondly, Brazilians are looking for more luxurious products than before. Therefore, imports
from France could increase because France is the worldwide leader in manufacturing cosmetics
in the luxury division.
Last but not least, Brazilians consumers tend to pay more attention to the effect of pollution on
their skin. They want to protect it by using appropriated creams. Hence, Brazilians will tend to
buy more French product due their strong reputation in the skin care segment.

78

79
CHAPTER 4: Are the growth opportunities for
French cosmetics brands similar in Brazil and in
China?
The principal analysis in this part is to look at the consumer’s behaviour evolution in Brazil.
Therefore, looking if Brazilian consumption will evolve in a similar path as the actual Chinese
consumption in the French cosmetics sector. The reasoning behind is to understand if the way
of managing French cosmetics brands in China could be applied in the Brazilian market. As
mentioned above, purchases of French cosmetics by Chinese people are made mainly through
e-commerce. Besides, the primary segment is the skincare segment in the beauty industry.
Furthermore, trends in consumption in the Brazilian beauty sector are going to change over the
next years.
Brazilian beauty consumption will evolve with an increasing of consumption of skin care
products and a boom of e-commerce channel distribution. Mainly due to pollution problem,
people pay more and more attention to their skin. Therefore, the demand for skin care products
will increase and it offers opportunities to grow for all cosmetics companies. Thus, France, as
leader in the skincare market, have even more opportunities to develop this market.
Furthermore, online shopping is a non-negligible trend in this sector in Brazil. In fact, French
cosmetics will have opportunities to grow in the skincare segment, the most profitable segment
for the French leader, L’Oréal Group (Annual report,2018). Additionally, e-commerce could
be the main channel to reach Brazilian consumers for French cosmetics.

80
4.1 Opportunities for French cosmetics companies
Based on the literature review above, some opportunities could arise for French cosmetics in
Brazil in the future. Even if the previous economic analysis shows that Brazil is currently lag
behind China in terms of economic development; nonetheless, this country is expected to rank
the 8th in terms of GDP by 2030 and the 5th by 2050. (PWC report, 2017) Moreover, Brazil is
currently the third largest beauty consumer market in the world.
As a result of trade liberalization in the 90s, Brazil becomes attractive for foreign companies
due to several factors mentioned in the Chapter 3 of this paper: population of 210 million of
inhabitants, accessible raw materials, less impact of crisis due to diversified economy and a
geographic position that allows reaching easily other South American countries.
Moreover, Beauty is part of the culture of Brazil. Between 1996 and 2012, this market increase
by 10% while the country’s GDP increased only by 3%. Furthermore, during the financial crisis
of 2008, Brazilian cosmetics market experienced a considerable growth of 281% compared to
a growth of 142% for the global sector. (L’Oréal Media, 2014) Hence, cosmetics enterprises
have even more incentives to invest in this market.
4.1.1 E-commerce channel opportunity
A change in consumer’s habits is expected for the next five years, especially in the channel
through which consumers buy cosmetics. If Brazilian e-commerce platforms are evolving
towards the ones existing in China, French cosmetics enterprises could reach faster Brazilian
consumers. Even if some platforms already exist in Brazil, they do not have as trusted as the
Chinese ones by consumers.
On the one hand, Brazilian consumers could buy directly French products online with more
advantageous prices than in physical stores (mainly due to fewer tariffs on imports). On the
other hand, French companies could increase their market shares in Brazil by implementing
new brands and reaching faster new customers than before.

81
In Brazil, digital buyers amounted to around 58.5 million of shoppers in 2018, representing
only 28.16% of the population 9. Moreover, the growth estimation from 2018 to 2022 by Statista
is 11% annually. The chart below shows the evolution of the number of online buyers’.
Figure 29: Evolution of online buyers from 2018 to 2022
Source: Valentine LEFEBVRE based on datas from Statista10
As the number of online shoppers is expected to grow in the next five years, there is an extensive
opportunity of using e-commerce channel to reach new customers. In 2018, the online buyer
penetration amounted to 29% compared to 43% in China. By 2022, the Brazilian population
expects to reach 214.04 million inhabitants. Therefore, the online buyer penetration will reach
41% if the country enhances the development of e-commerce. 11
Furthermore, in 2018, 48% of online shoppers purchased cross-border. Assuming that the
growth of cross-border transactions will remain stable in the next five year. Therefore, French
cosmetics companies have the opportunity to reach 14.547,3612 million potential new
customers by developing e-commerce. However, not all online buyers purchase cosmetics. In
2018, only 12% of online consumers bought cosmetics products.
9 58.5million/ 207.7 million (total of online shoppers/total population)
10 As Statista computed that the growth will be 11% annual in the next 5 years, the number of online shoppers for the next
five years could be easily computed.
11 88.807/214.04 → online buyers’ penetration.
12 48%*(88.807-58.500)
58.50064.935
72.078
80.006
88.807
0.000
10.000
20.000
30.000
40.000
50.000
60.000
70.000
80.000
90.000
100.000
2018 2019 2020 2021 2022
Numbers of Online Shoppers from 2018 to 2022
Online shoppers (in million)

82
In comparison, in 2018, the penetration of online cosmetics reached 25.3% in China and is
expected to continue to grow (China Cosmetics Market Report, 2019-2025). The e-commerce
trend in Brazil is going to evolve positively, meaning that Brazilians are going to buy more and
more online, even in the cosmetics sector. Furthermore, according to the E-bit study, 50% of
the Brazilian population purchased at least once on an international website (Santander Trade,
2019).
Finally, Brazil does not have any regulations about e-commerce; however, companies have to
respect any laws related to consumer protection. Therefore, e-commerce distribution for French
cosmetics brands could be the new way of penetrating of the Brazilian cosmetics market.
4.1.2 The boom in the skin care segment opportunity
Brazilian consumers will change their habits and are going to pay more attention to their skin
than ten years ago. Even if hair care is the current leading segment in the Brazilian beauty
industry, skincare segment has significant growth opportunities.
Several factors (seen in Chapter 3) could explain the attraction for skincare product by Brazilian
consumers: the elder of the population as demonstrated the demographic pyramid, the pollution
effect on skin or even the importance of appearance in this country.
On the one hand, significant players in the skincare segment in Brazil are nowadays domestics
brands (Natura and Botica Commercial Farmaceutica), holding 32% of the market shares in
2014. (Waldock, 2015). On the other hand, Brazil accounts only for 4% of the skincare market
of L’Oréal, and it is representative of French cosmetics brands. French cosmetics companies
are not yet leaders in the Brazilian skincare market. Consequently, an opportunity to grow exists
for French brands which are not currently well-developed in this country. Moreover, L’Oréal
2018 annual report shows that the global skincare market grows faster than the overall beauty
industry. (Annual Report L’Oréal,2018)
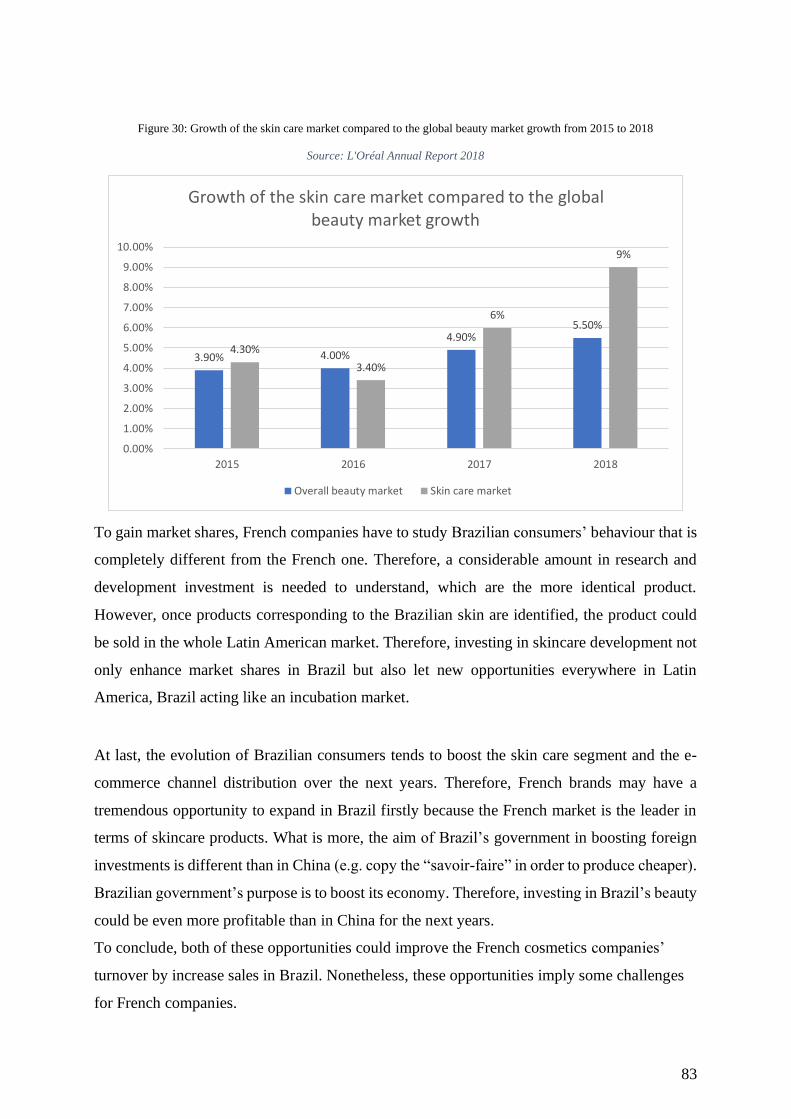
83
Figure 30: Growth of the skin care market compared to the global beauty market growth from 2015 to 2018
Source: L'Oréal Annual Report 2018
To gain market shares, French companies have to study Brazilian consumers’ behaviour that is
completely different from the French one. Therefore, a considerable amount in research and
development investment is needed to understand, which are the more identical product.
However, once products corresponding to the Brazilian skin are identified, the product could
be sold in the whole Latin American market. Therefore, investing in skincare development not
only enhance market shares in Brazil but also let new opportunities everywhere in Latin
America, Brazil acting like an incubation market.
At last, the evolution of Brazilian consumers tends to boost the skin care segment and the e-
commerce channel distribution over the next years. Therefore, French brands may have a
tremendous opportunity to expand in Brazil firstly because the French market is the leader in
terms of skincare products. What is more, the aim of Brazil’s government in boosting foreign
investments is different than in China (e.g. copy the “savoir-faire” in order to produce cheaper).
Brazilian government’s purpose is to boost its economy. Therefore, investing in Brazil’s beauty
could be even more profitable than in China for the next years.
To conclude, both of these opportunities could improve the French cosmetics companies’
turnover by increase sales in Brazil. Nonetheless, these opportunities imply some challenges
for French companies.
3.90% 4.00%
4.90%5.50%
4.30%
3.40%
6%
9%
0.00%
1.00%
2.00%
3.00%
4.00%
5.00%
6.00%
7.00%
8.00%
9.00%
10.00%
2015 2016 2017 2018
Growth of the skin care market compared to the global beauty market growth
Overall beauty market Skin care market
84
4.2 Challenges & Recommendations for French companies
Challenge 1: fierce domestic competition in the skin care segment
The cosmetics market has a reputation for having high barriers to entry, mainly due to the risks
of counterfeit products.
Recommendation 1: Chose the appropriate mode of entry.
One example to enter the Brazilian skincare market with French cosmetics is to create a
partnership with a Brazilian personal care company. It is usually used when a company want to
expand its business in a new segment or a new category (such as men skincare or bio-
cosmetics). This partnership could be a win-win situation for both companies. On the one hand,
the French company could bring investment in research and development in order to create a
new product. On the other hand, the Brazilian partner could provide a way to manage the
Brazilian demand. The Brazilian company could help the French company in understanding the
consumers to adapt their products.
Challenge 2: Shifting from direct selling to e-commerce distribution.
Direct sales model remains the major one used by companies mainly due to the collectivism of
the country. For many years, domestic companies sell products with the help of sales
representatives. According to an article from the “TechinBrazil” journal, online purchases
would be unfair competition to the sales representative (around 2 million people). E-commerce
will change the strategies of local companies. Furthermore, new foreign competitors will enter
the market.
Recommendation 2: Adopt a multichannel strategy
One recommendation for French companies entering the Brazilian market is to adopt a multi-
channel strategy. If companies focus too much on e-commerce, they will reach in the short term
only one type of customers (people between 39-45 years old). A multi-channel strategy allows
the use of multiple channels at the same time, in order to reach consumers of all ages and all
social classes. Furthermore, e-commerce is not the safer mean to trade in brazil. In such a
country where corruption is still a problem, online payments are not as safe as in Europe.
Therefore, to implement a brand through e-commerce, gain consumer’s trust is a decisive factor
to success (mainly by adopting safe way of payments).
85
Challenge 3: potential protectionism
As mentioned in the Chapter 2, China remains protectionist regarding European trade.
Therefore, it is important to consider a potential future protectionism in Brazil. One reason
behind this future protectionism is the election of Jair Bolsonaro in January 2019. He is
perceived as the “Trump of the Tropics” (The Financial times, 2019). One way to apply a
protectionist policy is to close border by increasing tariff on cosmetics products. Indeed, Brazil
could protect and promote local trade. Therefore, that strategy would enhance domestics
revenues, and foreign goods would be less competitive. (See Annexe 6)
In the short term, this point of view presumes a negative impact on the penetration of French
cosmetics brands in Brazil. In such a case, government rules would support domestic cosmetics
brands. Therefore, Brazil beauty market would not be as attractive for French cosmetics
companies. French cosmetics would have a higher price than the Brazilian one. In that case,
French product would be less competitive on that market.
Furthermore, Brazil relies heavily on regulations. As a result, regulations are high barriers to
entry in the cosmetics market. If Brazil’s government decides to enact new laws to protect local
production, French cosmetics imports through e-commerce will be impacted.
Recommendation 3: Change the mode of entry
If Brazil becomes a protectionism country, French cosmetics companies should use different
mode of entry as the ones used today. These enterprises should make partnerships, joint venture
or strategic alliances directly with Brazilian companies. In that case, French cosmetics could
reach consumers without paying high tariff on their exports. Furthermore, selling through cross-
border e-commerce would be more expensive than creating partnerships.

86
To sum up, despite the challenges that French enterprises could face, the Brazilian market
remains a major player for them. Hence, the opportunities for the near future are the following
ones:
• Development of the skin care segment: due to the rise of pollution, consumers pay
more attention to their skin. Product that are the most promising are not only anti-age
cream or soft cream but also sun cream. As mentioned above, France is the leader in
the skin care segment. Therefore, it is a growing opportunity as similar as in China.
• E-commerce platforms: in the Brazilian cosmetics development chapter, it is proved
that e-commerce is far from being mature in this country. Hence, the opportunities to
imports French cosmetics through this channel is non-negligible. Furthermore,
consumer’s behaviour tends to follow the digital era.
• Reach Latin American consumers: by entering the Brazilian cosmetics market, French
companies could reach new consumers in South America. Indeed, Brazil counts fifty-
five different types of skin out of sixty-sic in the world. Therefore, one French
companies have invested in research and development in the skincare products, these
could be merchandized in others countries.
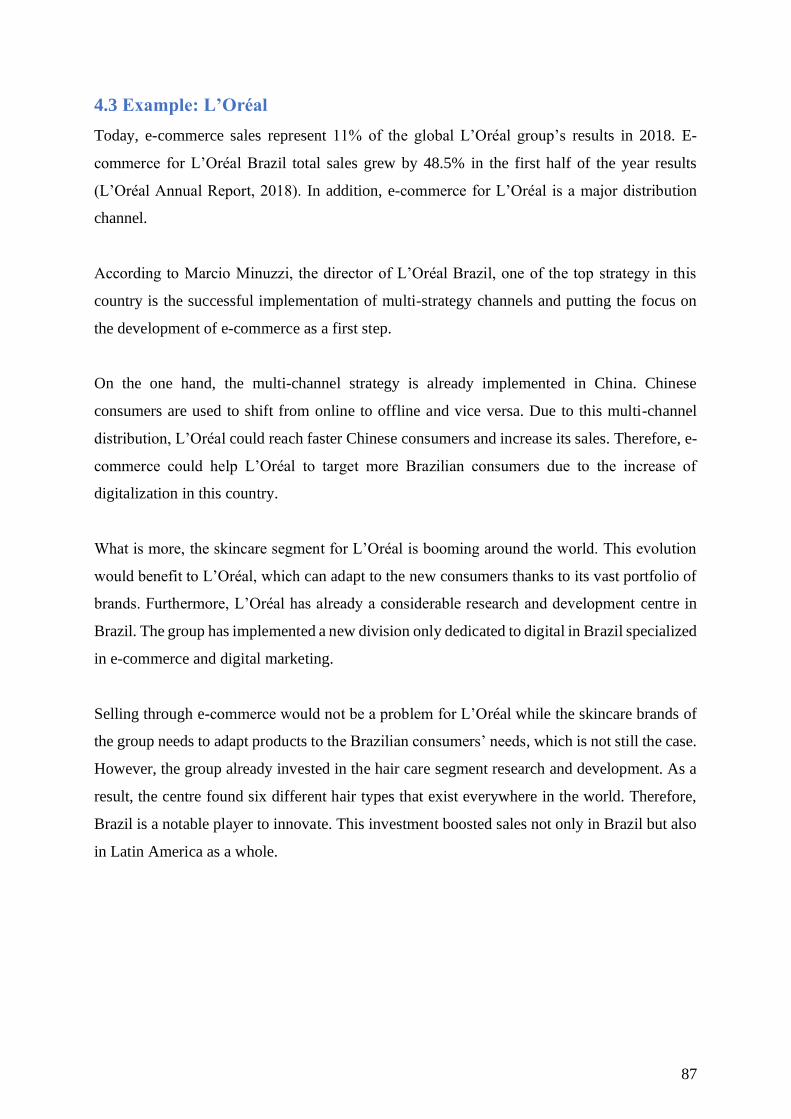
87
4.3 Example: L’Oréal
Today, e-commerce sales represent 11% of the global L’Oréal group’s results in 2018. E-
commerce for L’Oréal Brazil total sales grew by 48.5% in the first half of the year results
(L’Oréal Annual Report, 2018). In addition, e-commerce for L’Oréal is a major distribution
channel.
According to Marcio Minuzzi, the director of L’Oréal Brazil, one of the top strategy in this
country is the successful implementation of multi-strategy channels and putting the focus on
the development of e-commerce as a first step.
On the one hand, the multi-channel strategy is already implemented in China. Chinese
consumers are used to shift from online to offline and vice versa. Due to this multi-channel
distribution, L’Oréal could reach faster Chinese consumers and increase its sales. Therefore, e-
commerce could help L’Oréal to target more Brazilian consumers due to the increase of
digitalization in this country.
What is more, the skincare segment for L’Oréal is booming around the world. This evolution
would benefit to L’Oréal, which can adapt to the new consumers thanks to its vast portfolio of
brands. Furthermore, L’Oréal has already a considerable research and development centre in
Brazil. The group has implemented a new division only dedicated to digital in Brazil specialized
in e-commerce and digital marketing.
Selling through e-commerce would not be a problem for L’Oréal while the skincare brands of
the group needs to adapt products to the Brazilian consumers’ needs, which is not still the case.
However, the group already invested in the hair care segment research and development. As a
result, the centre found six different hair types that exist everywhere in the world. Therefore,
Brazil is a notable player to innovate. This investment boosted sales not only in Brazil but also
in Latin America as a whole.
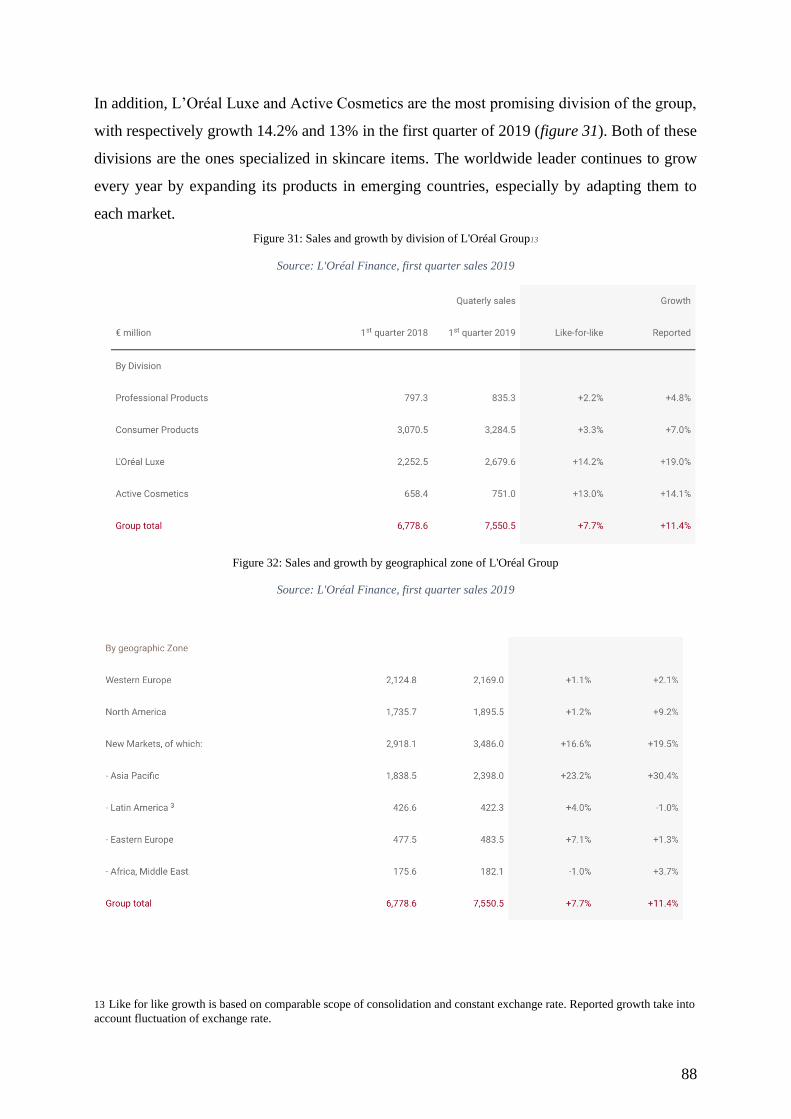
88
In addition, L’Oréal Luxe and Active Cosmetics are the most promising division of the group,
with respectively growth 14.2% and 13% in the first quarter of 2019 (figure 31). Both of these
divisions are the ones specialized in skincare items. The worldwide leader continues to grow
every year by expanding its products in emerging countries, especially by adapting them to
each market.
Figure 31: Sales and growth by division of L'Oréal Group13
Source: L'Oréal Finance, first quarter sales 2019
Figure 32: Sales and growth by geographical zone of L'Oréal Group
Source: L'Oréal Finance, first quarter sales 2019
13 Like for like growth is based on comparable scope of consolidation and constant exchange rate. Reported growth take into
account fluctuation of exchange rate.

89
The analysis made by geographical regions (figure 32) shows that the primary growth comes
from the Asia Pacific, especially from China. Even if today, Latin America is far from having
the same growth as China. However, there is a return to growth in Brazil. The Active division
experienced a double-digit growth in the first quarter of 2019(L’Oréal Finance, 2019).
Therefore, L’Oréal has already see the opportunity to grow in the skin care segment. To
continue to grow, the research and development centre in Rio de Janeiro should focus more on
skin research than on hair care.
Furthermore, L’Oréal has to enhance distributions and customer experience in this segment. If
Brazil reaches the same growth as China today, it would enhance the financial performance of
L’Oréal. It could globally increase the number of sales and hence, revenues in Brazil for
L’Oréal. In order to achieve that goal, L’Oréal should invest in research and development. For
instance, in 2016, L’Oréal Group invested in a Research & Innovation centre for 500 million
Real in order to increase market shares in the hair care segment. Furthermore, L’Oréal acquired
Niely Cosmeticos, a Brazilian company specialized in hair care in 2014, with a net income of
USD 98,77 million (Renata Martins, 2014). Today, hair care is a substantial segment. However,
opportunities to grow in haircare in the long term are limited due to the actual well-established
segment. Therefore, diversification is one of the required factors to grow on a market.
By investing in the Brazilian skincare market, L’Oréal has to spend a non-negligible amount in
research and development as the group did for hair care. This investment could be useful not
only to enter this market but also to discover new products which could be launched on other
markets. Nowadays, the skincare market in Latin America represents 4% of the global skincare
market of L’Oréal compared to 55% of the Asian market. L’Oréal Brazil is far from what the
group realized in China. Nonetheless, investing in skincare products’ innovations in Brazil will
help to understand not only Brazilian consumers but also for many other consumers worldwide.
As a matter of fact, among the sixty-six different skin tones14 existing in the world, fifty-five
are present in Brazil. (Allard, 2018)
14 According to the model of classification of L’Oréal, sixty-six different skin tones exists around the world.
90
Finally, if L’Oreal is willing to continue its journey in the cosmetic world in Brazil, the group
should invest a lot in understanding customers’ needs (because cultural differences play a role
in implementing cosmetics). Moreover, the firm has to define proper positioning on the market
to not repeat the failure of Garnier in China. What is more, political and social factors have to
be taken into account because they always have an impact on the way of managing a business.
91
CONCLUSION
In the end, as the European market is saturated, French cosmetics companies have to look for
new growth opportunities. In that regard, L’Oréal is the most representative success story.
This international brand successfully implements the “Made in France” brand image
worldwide. The main factors of its success are based on the adoption of the appropriate mode
of entry, the right positioning on the market, a deep understanding consumers’ needs and the
adaption of its products to culture. After having conquered the whole European market,
L’Oréal (along with the other French cosmetics brands) sees opportunities for growth in
developing countries such as China or Brazil. The Chinese market is currently one of the most
performing markets for L’Oréal and all the French cosmetics firms. As a matter of fact, new
products and innovations developed in China increased market shares of French cosmetics
brands.
The incredible growth of 33% recorded recently by L’Oréal in China could be experienced in
Brazil in the near future. (Xhinua,2019) On the one hand, Brazilians living in urban areas are
becoming more sensitive to the adverse effects caused by the recurring peaks of pollution,
which affect both skin and hair. Therefore, the latter are now searching for skincare products
of higher quality than before. On the other hand, Brazilians are changing the channel through
which they purchase their cosmetics products. E-commerce will become one of the key
distribution channels in Brazil. Therefore, this shift in consumer’s behaviour offers
opportunities to French cosmetics companies to grow as much as in China, or even more.
Indeed, Brazil can become more attractive than China due to its increasing foreign investment
opportunities. Whereas China, which aims at copying French brands “savoir-faire” at lower
costs, and hence restricting the physical implementation of French cosmetics companies
through joint ventures, strategic alliances or partnerships. The reason behind the restriction is
that the Chinese want to copy by stealing knowledge to produce themselves at low-costs. On
the other hand, Brazil aims to boost its economic development by attracting foreign
investments. Therefore, French companies have to be careful and protect their products by
avoiding Chinese market to reproduce the exact same, cheaper.

92
To conclude, French cosmetics enterprises have many opportunities to grow in Brazil as they
did in China, and even more. Nevertheless, all opportunities for the French cosmetics
companies rely heavily on the behaviour of consumers. Therefore, the future trends of
cosmetics consumption could change after ten years. Indeed, once companies are well-
implemented in Brazil, they have to follow the customers’ needs by being able to adapt their
products to them.
The next step of this work could be to analyse the opportunities for French cosmetics in other
developing countries such as India or Russia. This analysis could lead to the establishment of a
timeline to help French cosmetics companies to better allocate their investment according to
opportunities over time in each country.
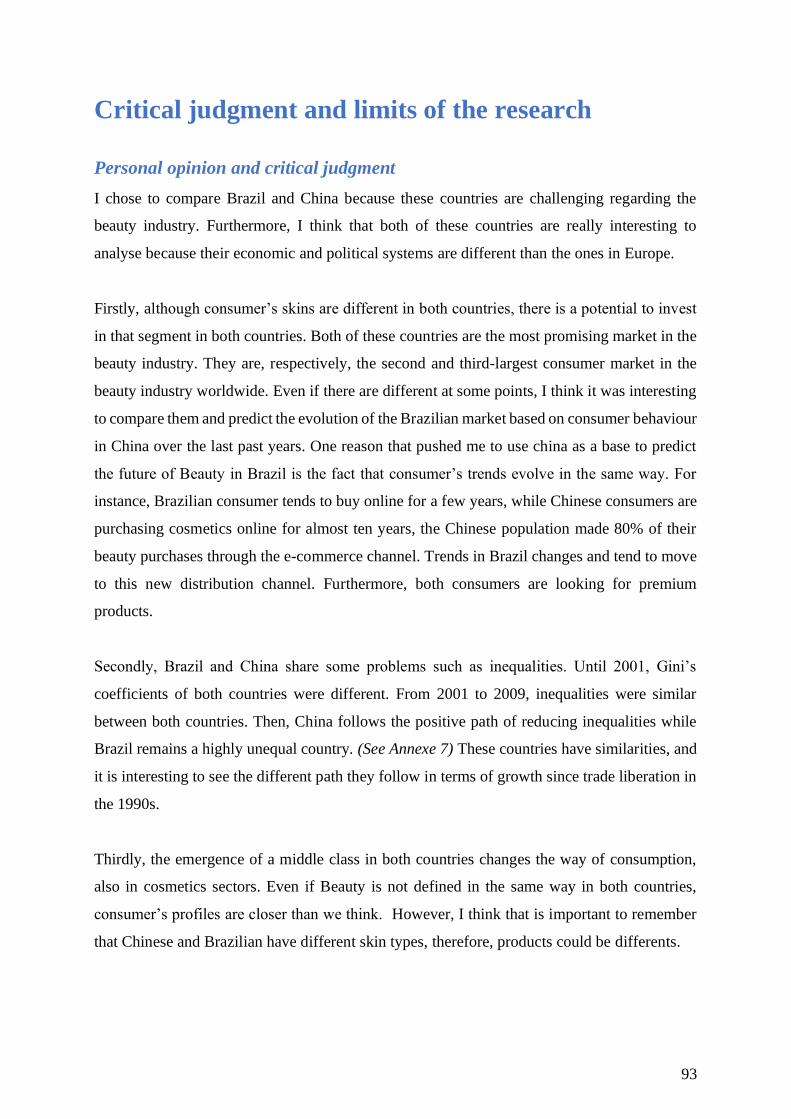
93
Critical judgment and limits of the research
Personal opinion and critical judgment
I chose to compare Brazil and China because these countries are challenging regarding the
beauty industry. Furthermore, I think that both of these countries are really interesting to
analyse because their economic and political systems are different than the ones in Europe.
Firstly, although consumer’s skins are different in both countries, there is a potential to invest
in that segment in both countries. Both of these countries are the most promising market in the
beauty industry. They are, respectively, the second and third-largest consumer market in the
beauty industry worldwide. Even if there are different at some points, I think it was interesting
to compare them and predict the evolution of the Brazilian market based on consumer behaviour
in China over the last past years. One reason that pushed me to use china as a base to predict
the future of Beauty in Brazil is the fact that consumer’s trends evolve in the same way. For
instance, Brazilian consumer tends to buy online for a few years, while Chinese consumers are
purchasing cosmetics online for almost ten years, the Chinese population made 80% of their
beauty purchases through the e-commerce channel. Trends in Brazil changes and tend to move
to this new distribution channel. Furthermore, both consumers are looking for premium
products.
Secondly, Brazil and China share some problems such as inequalities. Until 2001, Gini’s
coefficients of both countries were different. From 2001 to 2009, inequalities were similar
between both countries. Then, China follows the positive path of reducing inequalities while
Brazil remains a highly unequal country. (See Annexe 7) These countries have similarities, and
it is interesting to see the different path they follow in terms of growth since trade liberation in
the 1990s.
Thirdly, the emergence of a middle class in both countries changes the way of consumption,
also in cosmetics sectors. Even if Beauty is not defined in the same way in both countries,
consumer’s profiles are closer than we think. However, I think that is important to remember
that Chinese and Brazilian have different skin types, therefore, products could be differents.
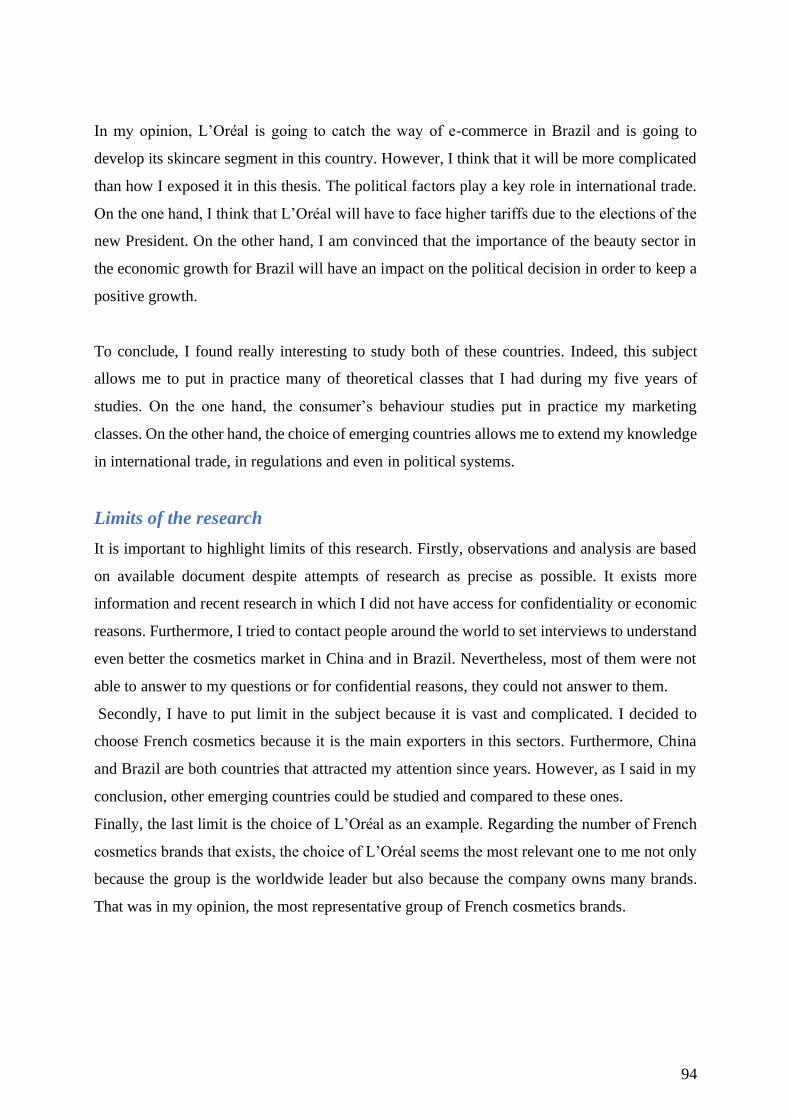
94
In my opinion, L’Oréal is going to catch the way of e-commerce in Brazil and is going to
develop its skincare segment in this country. However, I think that it will be more complicated
than how I exposed it in this thesis. The political factors play a key role in international trade.
On the one hand, I think that L’Oréal will have to face higher tariffs due to the elections of the
new President. On the other hand, I am convinced that the importance of the beauty sector in
the economic growth for Brazil will have an impact on the political decision in order to keep a
positive growth.
To conclude, I found really interesting to study both of these countries. Indeed, this subject
allows me to put in practice many of theoretical classes that I had during my five years of
studies. On the one hand, the consumer’s behaviour studies put in practice my marketing
classes. On the other hand, the choice of emerging countries allows me to extend my knowledge
in international trade, in regulations and even in political systems.
Limits of the research
It is important to highlight limits of this research. Firstly, observations and analysis are based
on available document despite attempts of research as precise as possible. It exists more
information and recent research in which I did not have access for confidentiality or economic
reasons. Furthermore, I tried to contact people around the world to set interviews to understand
even better the cosmetics market in China and in Brazil. Nevertheless, most of them were not
able to answer to my questions or for confidential reasons, they could not answer to them.
Secondly, I have to put limit in the subject because it is vast and complicated. I decided to
choose French cosmetics because it is the main exporters in this sectors. Furthermore, China
and Brazil are both countries that attracted my attention since years. However, as I said in my
conclusion, other emerging countries could be studied and compared to these ones.
Finally, the last limit is the choice of L’Oréal as an example. Regarding the number of French
cosmetics brands that exists, the choice of L’Oréal seems the most relevant one to me not only
because the group is the worldwide leader but also because the company owns many brands.
That was in my opinion, the most representative group of French cosmetics brands.

95
ANNEXES ANNEXE 1: HOFSTEDE INDICATORS15
Meaning of cultural indicators identified by Hofstede in order to understand cultural differences
between countries:
• Power distance: “the extent to which the less powerful members of institutions and
organization within a country expect and accept that power is distributed unequally.”
(Hofstede, 1980)
• Individualism VS Collectivism: “the degree of interdependence a society maintains
among its members.” (Hofstede, 1980)
• Masculinity VS Femininity: “The fundamental issue here is what motivates people,
wanting to be the best (Masculine) or linking what you do (Feminine).” (Hofstede,
1980)
• Uncertainty Avoidance: “The extent to which the members of a culture feel threatened
by ambiguous or unknown situations and have created beliefs and institutions try to
avoid these.” (Hofstede, 1980)
• Long-term orientation VS Short-term orientation: “how a society has to maintain some
links with its own past while dealing with the challenges of the present and future.”
(Hofstede, 1980)
• Indulgene VS Restraint: this dimension was added in 2010 and is related to the
happiness of people. It is defined as “the extent to which people try to control their
desires and impulsions.” (Hofstede insight consulting, 2010)
ANNEXE 2: CHINESE LAWS FOR COSMETICS16
Different laws for cosmetics in China:
• Regulations concerning the hygiene supervision over cosmetics(1990);
• Detailed Rules for the Implementation of the Regulation on the Hygiene Supervision
over Cosmetics(2005);
• Hygienic Standard for Cosmetics(2007)
• The Measures for the Administration of Hygiene License for Cosmetics (revised in
2010);
15 https://www.hofstede-insights.com/country-comparison/china,france/
16 http://www.cirs-reach.com/Cosmetics_Registration/Imported_Cometics_Regulation__Registration_China_Hygience_License_CIQ_Label.pdf

96
• Guideline for Risk Evaluation of Substances with Possibility of Safety Risk in
Cosmetics(2010);
• Standard Chinese Names of International Cosmetics Ingredients Inventory (2010);
• Cosmetics Technical Requirement Standard(2011);
• Guidelines for the Registration and Evaluation of New Cosmetic Ingredient(2011);
• AQSIQ Order No. 143 of 2011 - The Administrative Measures on the Inspection,
Quarantine and Supervision of Chinese Imported & Exported Cosmetics (2011)
ANNEXE 3: EVOLUTION OF E-COMMERCE OVER TIME17
• The initial Stage
At this stage, only innovators such as Alibaba and eBay were established on the market in 1999.
After this launch of C2C and B2B e-commerce, the trend spread around other sectors with the
launch, for instance of Dangdang, the first online bookstore service. At that time, many
problems appeared. First, only a few people have access to the Internet. Then, Logistics and
distribution networks were not entirely available. Last but not least, online payment was
perceived as not safe.
• The Accelerate develop Stage
The sector expanded from enterprise services to personal services targeting more and more
consumers. Moreover, during this period, the number of Internet users in China increased and
reached 210 million people in 2007. Thus, thanks to this rise, online shopping has been more
and more implemented in all sectors. New regulations implemented truthful online payments.
• The Standardization Stage
This stage lasted from 2008 to 2014 with an incredible growth of the number of online
consumers on the market. CNNIC statistics shows that Chinese online shopping accounts for
128.18 billion yuan in 2008 and reached 1.3 trillion yuan in 2012. Furthermore, during this
period, it was the development of platform such as Aliexpress which are platforms, especially
for cross-border e-commerce. Thus, it meant the beginning of the globalization period.
• The Globalization Stage
Given the history of China, 2014 could be considered as the most influential year for China
global E-commerce. Not only because of the high number of companies that were traded on the
NewYork Stock Exchange but also by the creation of new legal and logistical management
system.
17 https://www.unido.org/sites/default/files/2017-10/WP_17_2017.pdf
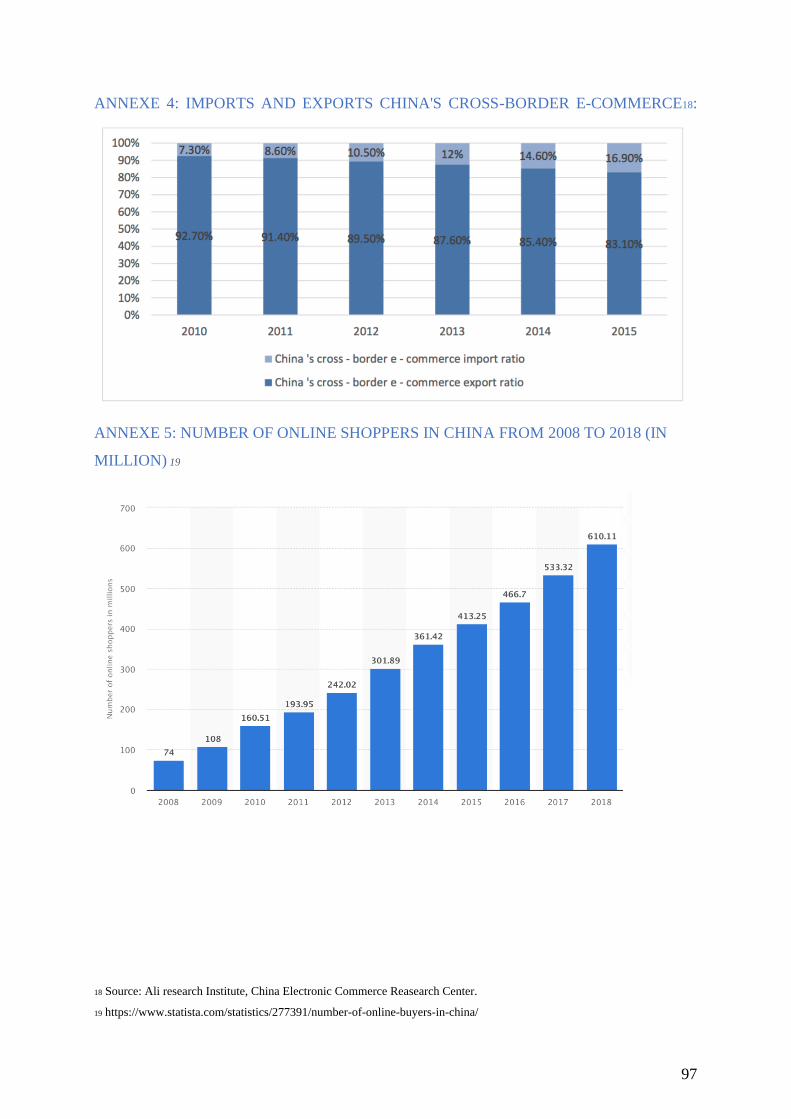
97
ANNEXE 4: IMPORTS AND EXPORTS CHINA'S CROSS-BORDER E-COMMERCE18:
ANNEXE 5: NUMBER OF ONLINE SHOPPERS IN CHINA FROM 2008 TO 2018 (IN
MILLION) 19
18 Source: Ali research Institute, China Electronic Commerce Reasearch Center.
19 https://www.statista.com/statistics/277391/number-of-online-buyers-in-china/
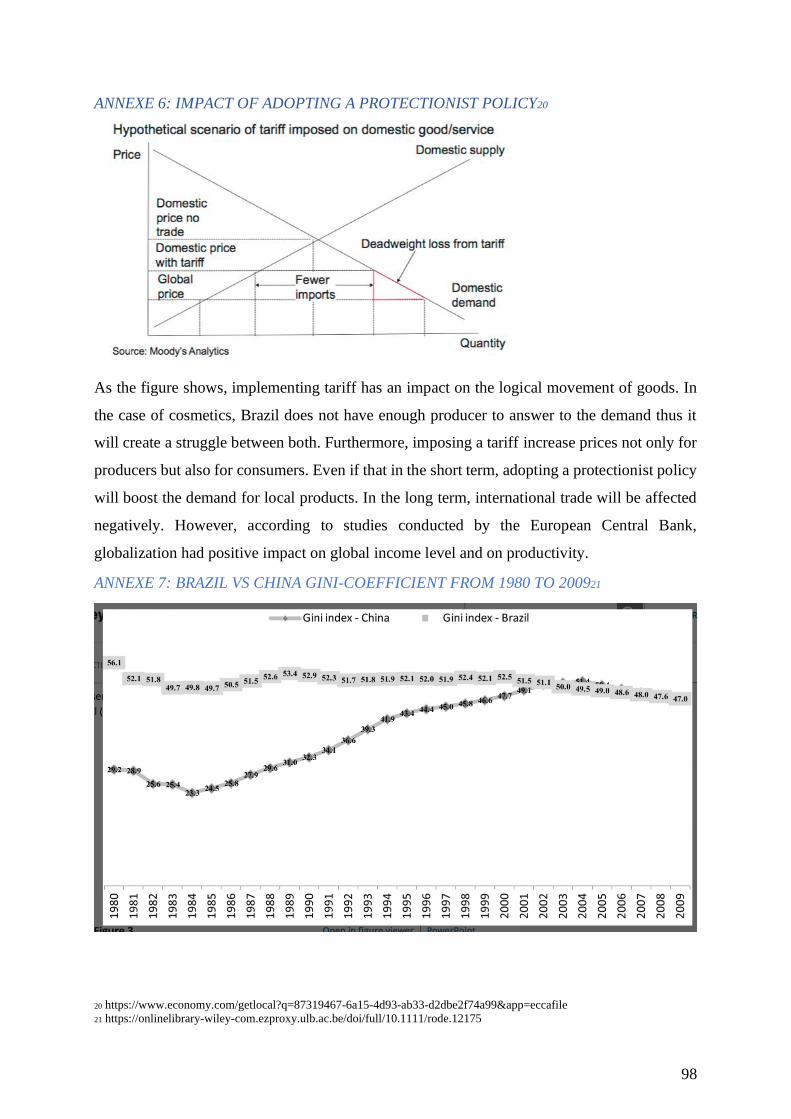
98
ANNEXE 6: IMPACT OF ADOPTING A PROTECTIONIST POLICY20
As the figure shows, implementing tariff has an impact on the logical movement of goods. In
the case of cosmetics, Brazil does not have enough producer to answer to the demand thus it
will create a struggle between both. Furthermore, imposing a tariff increase prices not only for
producers but also for consumers. Even if that in the short term, adopting a protectionist policy
will boost the demand for local products. In the long term, international trade will be affected
negatively. However, according to studies conducted by the European Central Bank,
globalization had positive impact on global income level and on productivity.
ANNEXE 7: BRAZIL VS CHINA GINI-COEFFICIENT FROM 1980 TO 200921
20 https://www.economy.com/getlocal?q=87319467-6a15-4d93-ab33-d2dbe2f74a99&app=eccafile
21 https://onlinelibrary-wiley-com.ezproxy.ulb.ac.be/doi/full/10.1111/rode.12175

99
TABLE OF FIGURES FIGURE 1: ESTIMATED GROWTH OF THE GLOBAL BEAUTY MARKET 1913-2008 ...................................................................... 15
FIGURE 2: GLOBAL COSMETICS GROWTH FROM 2005 TO 2018 (IN PERCENT) ........................................................................ 16
FIGURE 3: GLOBAL REVENUE IN THE EUROPEAN SECTOR ..................................................................................................... 17
FIGURE 4: EVOLUTION OF GROWTH IN THE EUROPEAN COSMETICS SECTOR ............................................................................. 18
FIGURE 5: LEADING EUROPEAN COUNTRIES IN THE COSMETICS MARKET BETWEEN 2014 AND 2016 ........................................... 18
FIGURE 6: BEAUTY COSMETICS AND SKINCARE EXPORTS DISTRIBUTION ................................................................................... 19
FIGURE 7: FRENCH COSMETICS EXPORTS BY REGIONS IN 2018 ............................................................................................. 21
FIGURE 8: GLOBAL DISTRIBUTION OF PRODUCTS SALES BY CATEGORIES ................................................................................... 25
FIGURE 9: WORLDWIDE PLAYERS BY TURNOVER IN 2018 .................................................................................................... 26
FIGURE 10: CHINESE PER CAPITA GDP: 1950 – 1978 ($ BILLIONS, PPP BASIS) ..................................................................... 29
FIGURE 11: CHINESE ANNUAL REAL GDP GROWTH: 1979-2018 (PERCENT CHANGE)............................................................. 31
FIGURE 12: HOFSTEDE CULTURAL INDEX COMPARISON BETWEEN CHINA AND FRANCE .............................................................. 33
FIGURE 13: COSMETICS MARKET SIZE IN CHINA (IN BILLION YUAN) ....................................................................................... 36
FIGURE 14: TYPES OF LICENSES FROM SFDA ..................................................................................................................... 37
FIGURE 15:CHINESE COSMETICS TRADE BALANCE FROM 2008 TO 2017 ................................................................................ 40
FIGURE 16: PERCENTAGE OF PERSONAL CARE BOUGHT ONLINE COMPARED TO APPAREL IN 2016 ............................................... 42
FIGURE 17: MARKET SHARES OF MAIN CHINESE PLAYERS IN CROSS-BORDER E-COMMERCE IN 2017 ............................................ 45
FIGURE 18: TRENDS IN TRADE IN COUNTERFEIT AND PIRATED GOODS IN 2014 ....................................................................... 47
FIGURE 19: TRENDS IN TRADE IN COUNTERFEIT AND PIRATED GOODS IN 2016 ....................................................................... 48
FIGURE 20: GDP GROWTH RATE ANNUALLY OF BRAZIL FROM 1970 TO 2019 ........................................................................ 62
FIGURE 21: GDP GROWTH AND UNEMPLOYMENT ............................................................................................................. 65
FIGURE 22: IMPORTS AND EXPORTS, AVERAGE 2010-2016................................................................................................ 66
FIGURE 23: CHINESE DEMOGRAPHIC PYRAMID 2018 ......................................................................................................... 68
FIGURE 24: DEMOGRAPHIC PYRAMID OF BRAZIL IN 2018.................................................................................................... 69
FIGURE 25: HOFSTEDE'S INDEX OF CULTURAL DISTANCE BETWEEN FRANCE AND BRAZIL ............................................................ 70
FIGURE 26: TRADE BALANCE IN PERFUMES, COSMETICS AND BATH PRODUCTS FROM 2007 TO 2018 IN BRAZIL ............................ 72
FIGURE 27: B2C E-COMMERCE BY COUNTRIES IN LATIN AMERICA IN 2018 ............................................................................ 75
FIGURE 28: INCOME BAND PARTICIPATION IN E-COMMERCE TRANSACTION IN BRAZIL ............................................................... 76
FIGURE 29: EVOLUTION OF ONLINE BUYERS FROM 2018 TO 2022 ....................................................................................... 81
FIGURE 30: GROWTH OF THE SKIN CARE MARKET COMPARED TO THE GLOBAL BEAUTY MARKET GROWTH FROM 2015 TO 2018 ...... 83
FIGURE 31: SALES AND GROWTH BY DIVISION OF L'ORÉAL GROUP ........................................................................................ 88
FIGURE 32: SALES AND GROWTH BY GEOGRAPHICAL ZONE OF L'ORÉAL GROUP ....................................................................... 88
100
LISTE OF TABLES TABLE 1: FRENCH COSMETICS PRODUCTION AND TRADE KEY NUMBERS: ................................................................................. 20
TABLE 2: SALES OF FRENCH COMPANIES BY PRODUCTS CATEGORIES IN 2018 .......................................................................... 20
TABLE 3: PRODUCTS AND SERVICES PURCHASES ON THE INTERNET IN 2018 ............................................................................ 23
TABLE 4: APPLICATION COSTS ACCORDING TO THE COSMETICS TYPES ..................................................................................... 38
TABLE 5: GENERAL INDICATORS ON THE BRICS COUNTRIES IN 2018 ..................................................................................... 64
REFERENCES
Achim, A.-L. (2019). 6 Beauty Industry Trends in China Brands Must Know. JingDaily. Retrieved
from https://jingdaily.com/6-beauty-industry-trends-in-china-brands-must-know/
Adrogué, R., Cerisola, M., & Gelos, G. (2006). Brazil’s Long-Term Growth Performance— Trying to
Explain the Puzzle. Retrieved from
https://www.imf.org/external/pubs/ft/wp/2006/wp06282.pdf
Agon, J.-P. (2018). Rapport Annuel 2018. Retrieved from https://www.loreal-finance.com/fr/rapport-annuel-2018/marche-cosmetique-2-1/
Allard, D. (2018) « Brazilian consumers are a strategic source of inspiration for L’Oréal »/Interviewer:
K. Milet. Retrieved from https://www.premiumbeautynews.com/en/brazilian-consumers-are-a,13598
Alvares, G. (2017). National report on e-commerce development in Brazil. Retrieved from
https://www.unido.org/sites/default/files/2017-10/WP_14.pdf
Alvarez, S. (2014). Make-Up and Medicine in the Middle Ages. Medievalists. Retrieved from
https://www.medievalists.net/2015/01/make-middle-ages/
Amadeo, K. (2019). Trade Protectionism Methods With Examples, Pros, and Cons. The Balance.
Retrieved from https://www.thebalance.com/what-is-trade-protectionism-3305896
Andre, T. (2017a). French cosmetics and China: A faltering love story? Retrieved from
https://daxueconsulting.com/french-cosmetics-in-china/
Andre, T. (2017b). What new importers need to know about cosmetics regulations in China? Retrieved
from https://daxueconsulting.com/cosmetics-regulations-in-china/
Andre, T. (2019). Market Trends: Chinese Consumer Behavior and Motivation. Retrieved from
https://daxueconsulting.com/market-trends-chinese-consumer-behavior-and-motivation/
Anthony, S., & Filho, F. F. (2009). Why economic performace has differed between Brazil and China?
A comparative analysis of Brazilian and Chinese Macroeconomic policy. XV. Retrieved from
https://www.researchgate.net/publication/41394783_WHY_ECONOMIC_PERFORMANCE_HAS_DIFFERED_BETWEEN_BRAZIL_AND_CHINA_A_COMPARATIVE_ANALYSIS_OF_BRAZILIAN_AND_CHINESE_MACROECONOMIC_POLICY
Awana, M. (2003). Makeup in Ancient India. Retrieved from
https://classroom.synonym.com/makeup-ancient-india-7475.html
101
B2C Still Got The Dominated Share in China's Online Shopping Market. (2019). Retrieved from
http://www.iresearchchina.com/content/details7_52940.html
Baldwin, R., & Wyplosz, C. (2015). The Economics of European Integration, fifth edition (M. G.-h. E.
2015 Ed. fifth ed.).
Beauty & Personal Care - China. (2019). Statista. Retrieved from
https://www.statista.com/outlook/70000000/117/beauty-personal-care/china
Beauty Ecommerce Deep Dive. (2017). Criteo. Retrieved from https://www.criteo.com/wp-content/uploads/2018/01/1710_Beauty_Deep_Dive_Design_Final.pdf
Best Sales Growth Reported By L'Oreal In The Last 10 Years. (2019). Forbes Magazine. Retrieved
from https://www.forbes.com/sites/greatspeculations/2019/02/12/best-sales-growth-reported-by-loreal-in-the-last-10-years/ - 785544841ada
Blazyte, A. (2019). Cosmetics market size in China from 2013 to 2018. Statista. Retrieved from
https://www.statista.com/statistics/875794/china-cosmetics-market-size/
Blazyte, A. (2019). Number of online shoppers in China from 2008 to 2018 (In million). Statista.
Retrieved from https://www.statista.com/statistics/277391/number-of-online-buyers-in-china/
Blazyte, A. (2019c). Penetration rate of online shopping in China 2008-2018. Statista. Retrieved from
https://www.statista.com/statistics/302071/china-penetration-rate-of-online-shopping/
Bonilla, H. (2019). 9 Cosmetics Industry Trends to Expect in 2019. Retrieved from
https://www.swktech.com/9-cosmetics-industry-trends-to-expect-in-2019/
Bonté, F. (2014). Secrets de Beauté. L’Obervatoire des cosmetiques. Retrieved from
https://cosmeticobs.com/fr/articles/la-cosmetotheque-35/secrets-de-beaute-2569/
Born, P. (2018). Is Brazil’s Beauty World Bouncing Back? WWD. Retrieved from
https://wwd.com/beauty-industry-news/beauty-features/brazil-beauty-industry-growth-1202672169/
Bounouara, M. (2019). Pourquoi vendre vos cosmétiques en Chine? Sino sourcing. Retrieved from
https://sino-sourcing.fr/vendre-en-chine/export-cosmetiqie-chine/
Brami, A. (2018). L’explosion du marché de la beauté au brésil. MyLittleBrasil. Retrieved from
https://www.mylittlebrasil.com.br/explosion-marche-beaute-bresil/
Brandão, L. (2019). E-commerce Law in Brazil. Institute for Research on Internet and Society.
Retrieved from http://irisbh.com.br/en/e-commerce-law-in-brazil/
Brazil - eCommerce. (2019). export.gov. Retrieved from https://www.export.gov/article?id=Brazil-e-Commerce
Brazil VS China. (2019). Retrieved from
https://www.indexmundi.com/factbook/compare/brazil.china
Brazil: Distributing products. (2019). Santander Trade. Retrieved from
https://santandertrade.com/en/portal/analyse-markets/brazil/distributing-a-product
102
Brazil: Foreign investment. (2019). Santander Trade Retrieved from
https://santandertrade.com/en/portal/establish-overseas/brazil/foreign-investment
Brazil’s consumer market is changing. (2015). CosmeticBusiness. Retrieved from
http://www.cosmetic-business.com/de/News/brazils-consumer-market-is-changing/290476
Carof, J. R. G., & Munich, C. (2018). L’Oréal Finance: the letter to shareholders. Retrieved from
https://www.loreal-finance.com/sites/default/files/2019-09/LAA69_EN.pdf
Carof, J. R. g., Munich, C., Lauvin, F. o., & Parker, S. p. C. (2018). L’Oréal Annual Report 2018.
Retrieved from https://www.loreal-finance.com/sites/default/files/2019-10/LOreal_2018_Annual_Report.pdf
Chen, S. (2014). What Are The Stages of a Business Lifecycle and Its Challenges?
business2community. Retrieved from
https://www.business2community.com/strategy/stages-business-lifecycle-challenges-0798879
Cheung, M.-C. (2017). More than 95% of Internet Users in China Use Mobile Devices to Go Online.
Retrieved from https://www.emarketer.com/Article/More-than-95-of-Internet-Users-China-Use-Mobile-Devices-Go-Online/1015155
Chiffres Clés L’Oréal. (2018). L’Oréal Group. Retrieved from https://www.loreal.fr/groupe/nos-activités/chiffres-clés
China. (2019). Retrieved from https://ec.europa.eu/trade/policy/countries-and-regions/countries/china/
China ’s E-commerce: the new branding game. (2015). Retrieved from
http://www2.bain.com/Images/BAIN_REPORT_China_ecommerce_The_new_branding_game.pdf
China Cosmetics Market Report, 2019-2025. (2019). Retrieved from Dublin:
https://www.researchandmarkets.com/reports/4770732/china-cosmetics-market-report-2019-2025?utm_source=CI&utm_medium=PressRelease&utm_code=t8hwnm&utm_campaign=1247112+-+China+Cosmetics+Market+2019-2025+%3a+Market+Size+is+Expected+to+Surge+from+RMB361.6+Billion+in+2017+to+RMB62.61+Billion+in+2022%2c+showing+an+AAGR+of+8.16%25&utm_exec=chdo54prd
China-EU - International trade in goods statistics. (2019). Retrieved from
https://ec.europa.eu/eurostat/statistics-explained/index.php/China-EU_-_international_trade_in_goods_statistics - EU_and_China_in_world_trade_in_goods
China’s Cosmetics Market. (2019). Retrieved from http://china-trade-research.hktdc.com/business-news/article/China-Consumer-Market/China-s-Cosmetics-Market/ccm/en/1/1X000000/1X002L09.htm
China’s e-commerce Revolution. (2015). Morgan Stanley. Retrieved from
https://www.morganstanley.com/ideas/china-e-commerce-revolution
Chinese e-commerce platforms. (2019). Retrieved from https://www.godigitalchina.com/
103
Chu, S.-C., & Lin, J.-S. (2013). Consumers' Perception of Corporate Social Responsibility in the
United States and China: A Study of Female Cosmetics Consumers. 7, 43. Retrieved from
https://cibleplus.ulb.ac.be/primo-explore/fulldisplay?docid=TN_proquest1241611163&context=PC&vid=32ULB_VU1&lang=fr_FR&search_scope=default_scope&adaptor=primo_central_multiple_fe&tab=default_tab&query=any,contains,China%20consumers%20behavior%20cosmetics&offset=0
Cœuré, B. (2018). The consequences of protectionism. European Central Bank. Retrieved from
https://www.ecb.europa.eu/press/key/date/2018/html/ecb.sp180406.en.html
Connecting Brazil to the world: A path to inclusive growth. (2014). McKinsey & Company. Retrieved
from https://www.mckinsey.com/~/media/McKinsey/Featured Insights/Americas/Brazils path to inclusive growth/MGI_Connecting_Brazil_to_the_world_Executive_summary_May 2014.ashx
Cosmetic Regulation in the European Union. (2016). Retrieved from
https://cosmeticsinfo.org/Regulation-in-eu
Cosmetics Europe: Revenues and Growth. (2019). Statista. Retrieved from
https://www.statista.com/outlook/70010000/102/cosmetics/europe - market-revenue
Cosmetics market in Europe - Dossier. (2019). Statista. Retrieved from
https://www.statista.com/study/27159/cosmetics-market-in-europe-statista-dossier/
The cosmetics sector in the chinese e-commerce. (2014). Marketing to China. Retrieved from
https://www.marketingtochina.com/cosmetics-sector-chinese-e-commerce/
Counterfeit Cosmetics; The Billion Dollar Toxic Trade. (2018). Beauty Business. Retrieved from
https://beautybusinessjournal.com/counterfeit-cosmetics-the-billion-dollar-toxic-trade/
Country comparison Brazil vs China. (2018). Countryeconomy. Retrieved from
https://countryeconomy.com/countries/compare/uk/usa
Couteau, C., & Coiffard, L. Histoire des cosmetiques. Regard sur les Cosmetiques. Retrieved from
https://www.regard-sur-les-cosmetiques.fr/histoire-des-cosmetiques/
DataBank - World Development Indicators : Brazil. (2019). World Bank Group. Retrieved from:
https://databank.worldbank.org/reports.aspx?source=2&series=NY.GDP.MKTP.KD.ZG&country=BRA
Definition cosmétique. (2014). Emile Littré Dictionnaire. Retrieved from
https://www.littre.org/definition/cosmétique
Digital technology serving the conquest of the chinese market. (2013). L’Oréal Luxe Media. Retrieved
from https://www.loreal.com/media/beauty-in/beauty-in-luxe-in-china/l'oréal-luxe
Donatelli, M., Hoefel, F., Resstom, S., & Stul, F. (2016). Meet the new Brazilian consumer. Retrieved
from https://www.mckinsey.com/industries/consumer-packaged-goods/our-insights/meet-the-new-brazilian-consumer

104
Dromard, T. (2014). Pourquoi L'Oréal retire les produits Garnier des supermarchés chinois.
Challenges Magazine. Retrieved from https://www.challenges.fr/entreprise/pourquoi-l-oreal-retire-les-produits-garnier-des-supermarches-chinois_14778
E-Commerce in China. (2018). Retrieved from http://exportvirginia.org/wp-content/uploads/2018/08/E-Commerce_China_Aug_2018.pdf
E-commerce Law of the People’s Republic of China. (2018). Retrieved from
https://www.izvoznookno.si/Dokumenti/E-commerce Law of the People’s%20Republic%20of%20China.pdf
Economy Stats: compare key data on Brazil & China. (2019, 2020). Retrieved from
https://www.nationmaster.com/country-info/compare/Brazil/China/Economy
EU-China Relations factsheet. (2019). [Press release]. Retrieved from
http://eueuropaeeas.fpfis.slb.ec.europa.eu:8084/headquarters/headquarters-homepage/34728/eu-china-relations-factsheet_en
EU-China Trade Relations. (2011). Directorate-general for external policies. Retrieved from
http://www.europarl.europa.eu/RegData/etudes/etudes/join/2011/433861/EXPO-INTA_ET(2011)433861_EN.pdf
Exports: Accéder au marché Brésilien. (2019). Industries Cosmetiques. Retrieved from
https://www.industries-cosmetiques.fr/export-acceder-au-marche-bresilien/
Fabre, P. (2013). One Avène product sold every 5 seconds in China. Retrieved from
https://www.pierre-fabre.com/en/news/one-avene-product-sold-every-5-seconds-in-china
Fargeas, O., Lozevis, A.-H., & Piederrière, O. (2019). L’Oréal, Analyse du secteur d’activité des
cosmétiques. Retrieved from https://fr.calameo.com/read/0031128245bb50bd20187
France and China Bilateral Relations. (2019). Diplomatie France Retrieved from
https://www.diplomatie.gouv.fr/en/country-files/china/france-and-china/
GDP projections from PwC: how China, India and Brazil will overtake the West by 2050. (2016). The
Guargian. Retrieved from https://www.theguardian.com/news/datablog/2011/jan/07/gdp-projections-china-us-uk-brazil
Ghosh, I. (2019). The People’s Republic of China: 70 Years of Economic History. Visual Capitalist.
Retrieved from https://www.visualcapitalist.com/china-economic-growth-history/
GINI index (World Bank estimate) - Brazil, China. (2017). The World Bank. Retrieved from
https://data.worldbank.org/indicator/SI.POV.GINI?contextual=aggregate&end=2017&locations=BR-CN&start=1981&view=chart
Global Powers of Luxury Goods 2019 : Bridging the gap between the old and the new. (2019).
Deloitte Retrieved from
https://www2.deloitte.com/content/dam/Deloitte/es/Documents/bienes-comsumo-distribucion-hosteleria/Deloitte-ES-consumer-industry-global-powers-luxury-goods-2019.pdf
Government regulation of the cosmetics industry in China. (2019). Daxue Consulting. Retrieved from
https://daxueconsulting.com/selling-cosmetic-products-china/
http://www.europarl.europa.eu/RegData/etudes/etudes/join/2011/433861/EXPO-INTA_ET(2011)433861_EN.pdf

105
GRAZIANI, T. (2017). Cross-border e-commerce in China: what’s the trend in 2017? Retrieved from
https://walkthechat.com/cross-border-e-commerce-china-whats-trend-2017/
Guo, A. (2011). Application of SFDA license and CIQ label for imported cosmetics in China.
Chemical inspection & regulation service. Retrieved from http://www.cirs-reach.com/Cosmetics_Registration/Imported_Cometics_Regulation__Registration_China_Hygience_License_CIQ_Label.pdf
Gutierrez Gallardo, Z. (2019). How is e-commerce in China different from the West? Retrieved from
http://dmb-shanghai.com/marketing/the-main-differences-in-chinese-and-western-ecommerce/
Gylfason, T., & Lindbeck, A. (1994). The Interaction of Monetary Policy and Wages. Public Choice,
79, 33-46. Retrieved from https://www.jstor.org/stable/30026861?seq=1
Hancock, T., & Jia, Y. (2019). China paid record $22bn in corporate subsidies in 2018. Financial
Times Magazine. Retrieved from https://www.ft.com/content/e2916586-8048-11e9-b592-5fe435b57a3b
Handley, L. (2019). The world’s largest beauty company sees China as its digital ‘laboratory. CNBC.
Retrieved from https://www.cnbc.com/2019/09/03/how-loreal-uses-china-as-a-place-to-learn-about-digital-marketing.html
Hawksworth, J., Clarry, R., & Audino, H. (2017). The Long View: How will the global economic
order change by 2050? PWC Publications Retrieved from https://www.pwc.com.au/government/pwc-
the-world-in-2050-full-report-feb-2017.pdf
He, H. (2019). Chinese Cosmetic Consumers: Trends and Forecasts. Chemlinked. Retrieved from
https://cosmetic.chemlinked.com/expert-article/chinese-cosmetic-consumers-trends-and-forecasts
Hennart, J. M. A. (2012). Emerging market multinationals and the theory of the multinational
enterprise. Global Strategy Journal, 168-187. Retrieved from https://doi.org/10.1111/j.2042-5805.2012.01038.x
Hiault, R. (2019). La Chine est le pays le plus protectionniste vis-à-vis de l'Europe. Les Echos.
Retrieved from https://www.lesechos.fr/monde/europe/la-chine-est-le-pays-le-plus-protectionniste-vis-a-vis-de-leurope-1029884
Hieronimus, N. (2013, April 2013) L’Oréal Luxe incarnates expertise and refinement across three key
sectors: skin care, make-up and fragrances. L’Oréal Luxe
A History of Cosmetics from Ancient Times. (2016). Retrieved from
https://cosmeticsinfo.org/Ancient-history-cosmetics
Hoffmann, S., & Lannes, B. (2013). China's e-commerce prize. Retrieved from
https://www.bain.com/insights/chinas-e-commerce-prize/
Hofstede, G. (2011). Dimensionalizing Cultures: the Hofstede Model in Context. Retrieved from
https://scholarworks.gvsu.edu/cgi/viewcontent.cgi?article=1014&context=orpc
Hofstede, Country comparison. (2019). Hofstede insights. Retrieved from https://www.hofstede-insights.com/country-comparison/china,france/
106
Hongfei, Y. (2017). National report on e-commerce development in China. Inclusive and Sustainable
Industrial Development Working Paper Series WP 17 | 2017. Retrieved from
https://www.unido.org/sites/default/files/2017-10/WP_17_2017.pdf
Hu, Z., & Khan, M. S. (1997). Why Is China Growing So Fast? Retrieved from
https://www.imf.org/external/pubs/ft/issues8/index.htm
Inclusive Growth defintion. (2019). OECD. Retrieved from https://www.oecd.org/inclusive-growth/ - introduction
ITC by Country - Report: Brazil. (2014). Retrieved from
http://www.intracen.org/layouts/CountryTemplate.aspx?pageid=47244645034&id=47244647462
Jing, S. (2019). China boost propels L'Oreal. Retrieved from
https://www.chinadaily.com.cn/a/201902/26/WS5c7479e0a3106c65c34eb569.html
Jones, G. (2011). Globalization and Beauty: A Historical and Firm Perspective. Retrieved from
https://www.researchgate.net/publication/257692395_Globalization_and_Beauty_A_Historical_and_Firm_Perspective
Kestenbaum, R. (2018). The Biggest Trends In The Beauty Industry. Forbes Magazine. Retrieved
from https://www.forbes.com/sites/richardkestenbaum/2018/09/09/beauty-industry-biggest-trends-skin-care-loreal-shiseido-lauder/ - 60158c5e6982
Key figures e-commerce France. (2019). Retrieved from https://www.fevad.com/wp-content/uploads/2019/07/Chiffres-Cles-2019_BasDef_ENGLISH1.pdf
Key figures of the cosmetics industry. (2017). Le secteur cosmétique. Retrieved from
https://www.febea.fr/en/le-secteur-cosmetique/key-figures-cosmetics-industry
Kulach, K. (2019). Selling to France: The 3rd Largest Market in Europe. Retrieved from
https://www.bigcommerce.com/blog/selling-to-france/ - main-characteristics-of-the-french-marketplace-and-consumers
L'ORÉAL CHINA, SPOTLIGHT ON A SUCCES STORY. (2018). Retrieved from
https://www.loreal.com/media/news/2018/june/itw-srinderknech-loreal-china
L’Oréal announces a new research base. (2005). CosmeticosBr. Retrieved from
http://www.cosmeticosbr.com.br/conteudo/en/loreal-announces-new-research-base/
L’Oréal Finance Annual Report. (2018). Retrieved from https://www.loreal-finance.com/en/annual-report-2018/cosmetics-market-2-1/
L’Oréal Finance: First Quarter 2019 Sales. (2019). L’Oréal Finance. Retrieved from
https://www.loreal-finance.com/eng/news-release/first-quarter-2019-sales
L’Oréal reinforces long-term commitment in the brazilian market with state of the art Research &
innovation center. (2017). L’Oréal Media Room. Retrieved from
https://mediaroom.loreal.com/en/loreal-reinforces-long-term-commitment-in-the-brazilian-market-with-state-of-the-art-research-innovation-center/

107
Laîné, N. (2019). Bilan 2018 du e-commerce en France [Press release]. Retrieved from
https://www.fevad.com/bilan-e-commerce-ventes-internet/
. Le secteur cosmétique français affiche 14,5 milliards d’euros d’exportations et confirme son rôle de
leader mondial. (2019, 01/03/2019). Industries Cosmetiques. Retrieved from
https://www.industries-cosmetiques.fr/le-secteur-cosmetique-francais-affiche-145-milliards-deuros-dexportations-et-confirme-son-role-de-leader-mondial/
Le secteur cosmétique français affiche 14,5 milliards d’euros d’exportations et confirme son rôle de
leader mondial. (2019). FEBEA (Federation des entreprises de la beauté). Retrieved from
https://www.febea.fr/fr/newsroom/espace-presse/le-secteur-cosmetique-francais-affiche-145-milliards-deuros
Le secteur cosmétique français confirme sa position de leader mondial avec 13,6 milliards d’euros
d’exportations. (2018). FEBEA (Federation des entreprises de la beauté). Retrieved from
https://www.febea.fr/sites/default/files/media/communique_le_secteur_cosmetique_francais_leader_mondial_avec_136_milliards_deuros_dexportations_150218.pdf
Les cosmétiques français en Chine séduisent-ils toujours autant ? (2017). Retrieved from
https://daxueconseil.fr/cosmetiques-francais-en-chine-seduisent-toujours/
Les tendances de l’industrie de la cosmétique en Chine en 2019. (2019). Retrieved from
https://daxueconseil.fr/lindustrie-du-cosmetique-en-chine/
Lin, J.-S., & Chu, S.-C. (2013). Consumers’ Perception of Corporate Social Responsibility in the
United States and China: A Study of Female Cosmetics Consumers. International Journal of
Strategic Communication 7. Retrieved from
https://www.tandfonline.com/doi/abs/10.1080/1553118X.2012.711401
Liversain, M. (2019). Regulatory trends of Brazilian and Chinese cosmetic markets. Lascom.
Retrieved from https://www.inno-foodproducts-brainbox.com/2019/04/17/regulatory-trends-of-brazilian-and-chinese-cosmetic-markets/
Loman, H. (2014). Brazil’s economic model: In need of a revamp. Retrieved from
https://economics.rabobank.com/publications/2014/january/brazils-economic-model-in-need-of-a-revamp/
Lopez, B. (2018). E-commerce Consumers in Brazil: Profile and Behaviour. PagBrasil. Retrieved
from https://www.pagbrasil.com/insights/e-commerce-consumers-brazil/
Lopez, B. (2019). Brazil: one of the biggest e-commerce opportunities in the world. PagBrasil.
Retrieved from https://www.pagbrasil.com/news/ecommerce-market-brazil/
Lourenco, S. (2015). Cosmetics and Brazilian Consumer Behavior. In-Cosmetics. Retrieved from
https://news.in-cosmetics.com/2015/01/20/cosmetics-and-brazilian-consumer-behavior/
Lu, P. X. (2008). Elite China: Luxury Consumer Behavior in China. In 2008 (Ed.), (John Wiley &
sons (Asia) Pte Ltd ed.). Retrieved from https://books.google.be/books?id=m-PgS7sFRDIC&pg=PT7&lpg=PT7&dq=chinese+consumer+behavior+in+beauty+sector+book&source=bl&ots=4JUVla5lnr&sig=ACfU3U1qLihX21HaZZSnCYqqtZKRSXCzCA&hl=fr&sa=X&ved=2ahUKEwiqzbfxhcfmAhWBiFwKHVbUC1sQ6AEwA3oECAgQAQ - v=onepage&q=chinese%20consumer%20behavior%20in%20beauty%20sector%20book&f=false
https://economics.rabobank.com/publications/2014/january/brazils-economic-model-in-need-of-a-revamp/

108
Luan, L., Kim, A., Zipser, D., Su, M., Lo, A., Chen, C., & Zhang, C. (2019). China Luxury Report 2019 : How young Chinese consumers are reshaping global luxury. Retrieved from
https://www.mckinsey.com/~/media/mckinsey/featured insights/china/how young chinese consumers are reshaping global luxury/mckinsey-china-luxury-report-2019-how-young-chinese-consumers-are-reshaping-global-luxury.ashx
Luinaud, M., & Schott, H. (2019). Le Marché des Cosmetiques, France. Retrieved from
https://www.businesscoot.com/fr/etude/le-marche-des-cosmetiques-france
Malmsten, A. (2018). Cosmetics and personal care market in China: Making use of the digital
landscape Retrieved from https://daxueconsulting.com/cosmetics-and-personal-care-market-in-china/
Malmsten, A. (2019a). Cosmetics and personal care market in China: Making use of the digital
landscape. Retrieved from https://daxueconsulting.com/cosmetics-and-personal-care-market-in-china/
Malmsten, A. (2019b). The counterfeit good industry in modern China. Retrieved from
https://daxueconsulting.com/counterfeit-products-in-china/
Mark, J. J. (2017). Cosmetics, Perfume, & Hygiene in Ancient Egypt. In Ancient History Encyclopedia.
Martins, R. (2014). To increase its market share in Brazil, L’Oréal will invest R$500 million in
infrastructure by 2016. Brazilbeauty News. Retrieved from
https://www.brazilbeautynews.com/to-increase-its-market-share-in-brazil-l-oreal,384
Martins, R. (2017). Brazil: Premium products on the rise despite economy uncertainties. Premium
Beauty News. Retrieved from https://www.premiumbeautynews.com/en/brazil-premium-products-on-the,12119
Masidlover, N., & Burkitt, L. (2014). L'Oréal Pulls Garnier Brand From China. The Wall Street
Journal. Retrieved from https://www.wsj.com/articles/l8217or233al-pulls-garnier-brand-from-china-1389180668
Morrison, W. M. (2019). China’s Economic Rise: History, Trends, Challenges, and Implications for
the United States. Retrieved from https://fas.org/sgp/crs/row/RL33534.pdf
Moyou, E. (2019, 11/07/2019). Taux de croissance du marché mondial des produits cosmétiques entre
2005 et 2018. Produits de beauté et d'hygiène corporelle. Retrieved from
https://fr.statista.com/statistiques/506300/cosmetiques-croissance-marche-mondial/
Mutascu, M., & Murgea, A. (2017). Globalization and financial performances in French cosmetic
industry. Retrieved from https://halshs.archives-ouvertes.fr/halshs-01504099/document
Nagarajan, R., Teixeira, A., & Silva, S. (2016). The Impact of an Ageing Population on Economic
Growth: An Explanatory Review of the Main Mechanisms. LI. Retrieved from
https://www.researchgate.net/publication/301680578_The_Impact_of_an_Ageing_Population_on_Economic_Growth_An_Explanatory_Review_of_the_Main_Mechanisms
Nagarajan, R., Teixeira, A. A. C., & Silva, S. (2016). The Impact of an Ageing Population on
Economic Growth: An Explanatory Review of the Main Mechanisms. Retrieved from
https://www.researchgate.net/publication/301680578_The_Impact_of_an_Ageing_Population_on_Economic_Growth_An_Explanatory_Review_of_the_Main_Mechanisms

109
Nassif, A., Feijó, C., & Araújo, E. C. (2014). Structural change and economic development: Is Brazil
catching up or falling behind? Cambridge Journal of Economics, 39. Retrieved from
https://www.researchgate.net/publication/280772716_Structural_change_and_economic_development_Is_Brazil_catching_up_or_falling_behind
New EU rules on e-commerce. (2019, 2/12/2019). European Commission. Retrieved from
https://ec.europa.eu/digital-single-market/en/new-eu-rules-e-commerce
A new law to regulate the online retail industry of China. (2019). 2019 Policy Updates – E-commerce
Law of China. Retrieved from https://www.sjgrand.cn/ecommerce-law-china-2019/
OECD. (2018). Economic Sureys : Brazil. Retrieved from http://www.oecd.org/economy/brazil-economic-snapshot/
OECD. (2019). Going for growth 2019. Retrieved from http://www.oecd.org/economy/going-for-growth/
Overview of Brazil’s Economy. (2014). L’Oréal Média Retrieved from
https://www.loreal.com/media/beauty-in/beauty-in-brazil/overview-of-brazil%27s-economy
Pasquali, M. (2019). Import and export value of perfumery, cosmetic and bath products in Brazil from
2007 to 2018. Statista. Retrieved from https://www.statista.com/statistics/919834/brazil-perfumery-cosmetics-products-foreign-trade-values/
Pereira, C., & Neves, J. o. A. C. (2011). Brazil and China: South-South Partnership or North-South
Competition? Policy paper. Retrieved from https://www.brookings.edu/wp-content/uploads/2016/06/03_brazil_china_pereira.pdf
Perkins, D. (1991). Revolutions within the Chinese Revolution, 1966-1982. In The Cambridge History
of China: The People's Republic (Cambridge University Press. ed., Vol. 15).
Petersen, D. T., & Jungbluth, D. C. (2018). Globalization Report 2018: What about the BRICS
countries? Bertelsmann stiftung. Retrieved from https://ged-project.de/ged-blog/improving-public-understanding-of-economic-globalisation/globalization-report-2018-what-about-the-brics-countries/
Phillips, T. (2016). The Cultural Revolution: all you need to know about China's political convulsion.
The Guargian. Retrieved from https://www.theguardian.com/world/2016/may/11/the-cultural-revolution-50-years-on-all-you-need-to-know-about-chinas-political-convulsion
Population Pyramid. (2019). Retrieved from https://www.populationpyramid.net/china/2018/
Principles of the trading system. (2019). WTO. Retrieved from
https://www.wto.org/english/thewto_e/whatis_e/tif_e/fact2_e.htm
The promise and perils of Bolsonaro’s Brazil. (2019). Financial Times Retrieved from
https://www.ft.com/content/33e2640c-5ba6-11e9-939a-341f5ada9d40
Pyramide des âges: Brésil. (2018, 04/01/2020). Perspective Monde. Retrieved from
http://perspective.usherbrooke.ca/bilan/servlet/BMPagePyramide?codePays=BRA&annee=2018
https://www.statista.com/statistics/919834/brazil-perfumery-cosmetics-products-foreign-trade-values/

110
Pyramide des âges: Chine. (2018, 04/01/2020). Perspective monde. Retrieved from
http://perspective.usherbrooke.ca/bilan/servlet/BMPagePyramide?codePays=CHN&annee=2018
Raphael de Cunto, Barata, P. P. B., Figueiredo, B. L. L., Antonio, L., Mendes, F., & Carpinetti, A.
(2019). E-commerce Pinheiro Neto Advogados. Retrieved from
https://gettingthedealthrough.com/area/11/jurisdiction/6/e-commerce-brazil/
Rapoza, K. (2017). Brazil's Spending Power Now Lower Than China's. Forbes Magazine. Retrieved
from https://www.forbes.com/sites/gradsoflife/2020/01/02/where-to-begin-essential-metrics-for-talent-conscious-businesses/ - 5f3d69bb29c7
Rebufet, M., Loussaief, L., & Jentjens, S. B.-. (2015). Does the Country of origin matter for
Cosmetics? The « Made in France » Argument. In A. Arora (Ed.), Advertising Confluence:
Transitioning marketing Communications into Social Movements (Savannah State University -
COBA ed.). Retrieved from
https://books.google.be/books?hl=fr&lr=&id=SqDtBQAAQBAJ&oi=fnd&pg=PT61&dq=french+cosmetics+brazil&ots=aHgXbFxHti&sig=8usxEWjozclXW0huvdIKXYT0Q4U&redir_esc=y - v=onepage&q=french%20cosmetics%20brazil&f=false
Roeck-Holtzhauer, Y. D. (1988). La cosmétologie à travers les âges. 279, 397-399. Retrieved from
https://www.persee.fr/doc/pharm_0035-2349_1988_num_76_279_3019
Salama, P. (2014). Chine-Brésil, une comparaison instructive. Retrieved from
http://crbc.ehess.fr/docannexe/file/2429/p._salama_9_avril_2015.pdf
Salvador, A., & Chisvert, A. (2018). Analysis of Cosmetics products. In ELSEVIER (Ed.), (Second
ed.). Retrieved from https://books.google.be/books?id=Si-lCgAAQBAJ&pg=PA19&lpg=PA19&dq=why+comparing+brazil+and+china+in+cosmetics&source=bl&ots=BP4WF0BXe0&sig=ACfU3U3ZXGliNf-8bGPlARdDjXR9ZUVMLw&hl=fr&sa=X&ved=2ahUKEwjhgcKfyLXmAhVgQEEAHSJwBTkQ6AEwCXoECAoQAQ - v=onepage&q=why%20comparing%20brazil%20and%20china%20in%20cosmetics&f=false
Shades for success - Influence in the beauty market. (2017). Retrieved from
https://www2.deloitte.com/content/dam/Deloitte/cn/Documents/international-business-support/deloitte-cn-ibs-france-beauty-market-en-2017.pdf
Shahbandeh, M. (2019). Growth rate of the global cosmetics market 2004-2018. Statista. Retrieved
from https://www.statista.com/statistics/297070/growth-rate-of-the-global-cosmetics-market/
Shiseido Annual Report 2018. (2018). Retrieved from Tokyo:
https://www.shiseidogroup.com/report/pdf/anu_digest.pdf
Skincare in Brazil. (2019). MarketResearch. Retrieved from
https://www.marketresearch.com/MarketLine-v3883/Skincare-Brazil-12253418/
Tang, L. (2009). The Chinese Consumer Market: Opportunities and Risks. In C. Publibishing (Ed.),
(2009 ed.). Retrieved from
https://books.google.be/books?hl=fr&lr=&id=9p6jAgAAQBAJ&oi=fnd&pg=PP1&dq=Chinese+consumer+habits+in+cosmetics+sector&ots=bQSBX24-6J&sig=8zilqUZ-e3E0-YfekSsmhSnbY8c - v=onepage&q=Chinese%20consumer%20habits%20in%20cosmetics%20sector&f=false

111
Tardy, M. (2012). Histoire du maquillage: des Egyptiens à nos jours (Dangles Ed. 2012 ed.).
Taylor, D. S., Moeller, J. R., & Cincinnati, O. (2018). 2018 Annual Report Retrieved from
https://www.pg.com/annualreport2018/static/PG-2018-Annual-Report.pdf
Thiessen, T. (2019). Why French luxury cosmetics need a compelling brand story in China, and non-
stop innovation, to feed demand for novelty. South China Morning post. Retrieved from
https://www.scmp.com/lifestyle/fashion-beauty/article/3030592/why-french-luxury-cosmetics-need-compelling-brand-story
Tigre, P. B., & Dedrick, J. (2004). E-commerce in Brazil: Local Adaptation of a Global Technology.
Volume 14. Retrieved from http://aws.iwi.uni-leipzig.de/em/fileadmin/user_upload/doc/Issues/Volume_14/Issue_01/V14I1_E-commerce_in_Brazil__Local_Adaptation_of_a_Global_Technology.pdf
Travis, T. T. (2018). Fiscal 2018 Annual Report to Stockholders. Retrieved from Washington, D.C.:
https://media.elcompanies.com/files/e/estee-lauder-companies/universal/news-and-media/media-resources/resources-and-reports/reports/2018-elc-10k.pdf
Trends in Trade in Counterfeit and Pirated Goods. (2019). Illicit Trade. OECD. Retrieved from
https://doi.org/10.1787/g2g9f533-en.
Unilever Annual Report and Accounts 2018. (2018). Retrieved from London:
https://www.unilever.com/Images/unilever-annual-report-and-accounts-2018_tcm244-534881_en.pdf
Value of Imports and Exports of Goods By HS Section and Division. (2019). National Bureau of
Statistics of China. Retrieved from:
http://www.stats.gov.cn/english/Statisticaldata/AnnualData/
Verot, O. (2015a). The e-commerce cosmetic world in China Gentlemen Marketing Agency. Retrieved
from http://cosmeticschinaagency.com/the-e-commerce-cosmetic-world-in-china/
Verot, O. (2015b). The high-end cosmetic market in China. Gentlemen Marketing Agency. Retrieved
from http://cosmeticschinaagency.com/the-high-end-cosmetics-market-in-china/
Verot, O. (2018). Guide to market Cosmetics Brands in China. Retrieved from
https://ecommercechinaagency.com/guide-to-market-cosmetics-brands-in-china/
Verot, O., & Zhu, V. (2015). China’s Cosmetics market. Retrieved from
http://cosmeticschinaagency.com/wp-content/uploads/2015/04/Chinas-Cosmetics-Market-2014-2015.pdf
Villoutreys, C. D. (2019). France - Cosmetics (COS) - commercial guide. Export.gov. Retrieved from
https://www.export.gov/article?id=France-Cosmetics
Waldock, A. (2015). Brazilian Skincare Market Analysis: New Entrant Cultural & Economic Insights.
Retrieved from https://fr.slideshare.net/AubreyWaldock/brazilian-skincare-market-analysis-new-entrant-cultural-and-economic-insights-55658524
A weakening global expansion. (2019). Retrieved from
https://www.imf.org/en/Publications/WEO/Issues/2019/01/11/weo-update-january-2019

112
Weinswig, D. (2016). The Beauty Market in Brazil. Retrieved from
http://www.deborahweinswig.com/wp-content/uploads/2016/08/The-Beauty-Market-in-Brazil-by-Fung-Global-Retail-Tech-August-10-2016.pdf
What is the Solow Growth Model? (2015). Solow Growth Model. Corporate Finance Institute.
Retrieved from
https://corporatefinanceinstitute.com/resources/knowledge/economics/solow-growth-model/
The World Bank In Brazil. (2019). Retrieved from
https://www.worldbank.org/en/country/brazil/overview
The World Bank In China. (2019). The World Bank. Retrieved from
https://www.worldbank.org/en/country/china/overview
The World's Top 10 Largest Economies. (2018). Focus Economy. Retrieved from https://www.focus-economics.com/blog/the-largest-economies-in-the-world
Xia, S. (2019). China’s New E-Commerce Law and Its Foreign Company Impacts. Retrieved from
https://www.chinalawblog.com/2019/04/chinas-new-e-commerce-law-and-its-foreign-company-impacts.html
Xinhua. (2019). L'Oreal achieves 33% growth in China: company CEO. ChinaDaily. Retrieved from
http://www.chinadaily.com.cn/a/201903/27/WS5c9b3c14a3104842260b2ec2.html
Xu, Q. (2019). The Chinese Cosmetics Market. Retrieved from
https://www.1421.consulting/2019/05/the-chinese-cosmetics-market/
Zilber, S. N., Júnior, C. H. M., & Silva, F. L. d. (2010). Internationalization strategy and foreign
distribution channels: analysis of the brazilian cosmetics company Natura. Retrieved from
https://www.bbronline.com.br/index.php/bbr/article/view/321/485
Zipser, D., Yougang, C., & Gong, F. (2016). The Modernization of the Chinese Consumer. Retrieved
from Shanghai: https://www.mckinsey.com/~/media/mckinsey/industries/retail/our insights/here comes the modern chinese consumer/2016 china consumer report the modernization of the chinese consumer.ashx