BASF Creditor Story
73
1 March 2022 | BASF Creditor Story BASF Creditor Story March 2022
-
Upload
khangminh22 -
Category
Documents
-
view
1 -
download
0
Transcript of BASF Creditor Story
1 March 2022 | BASF Creditor Story
BASF Creditor StoryMarch 2022
2 March 2022 | BASF Creditor Story
Cautionary note regarding
forward-looking statements
This presentation contains forward-looking statements. These statements are based on current
estimates and projections of the Board of Executive Directors and currently available information.
Forward-looking statements are not guarantees of the future developments and results outlined
therein. These are dependent on a number of factors; they involve various risks and uncertainties; and
they are based on assumptions that may not prove to be accurate. Such risk factors include those
discussed in Opportunities and Risks on pages 151 to 160 of the BASF Report 2021. BASF does not
assume any obligation to update the forward-looking statements contained in this presentation above
and beyond the legal requirements.
3 March 2022 | BASF Creditor Story
Agenda
1At a glance
4Battery materials driving
electromobility and future
growth
4Battery materials driving electromobility and future growth
5Pushing the transition to a sustainable economy
2Strategy implementation in full swing
6Reporting and financing highlights
3Unique position to capture growth in Asia

4 March 2022 | BASF Creditor Story
+24%2021 to 2050
Population growth:
Driven by the
emerging markets
~200million metric tons per year
Circular economy:
Non-recycled plastics
worldwide
~50%by 2030
China the largest market:
Share of global
chemical market
What is driving BASF’s future growth?
Global trends provide opportunities for growth in the chemical industry
456zettabytes in 2030
Digitalization:
Rapid growth in
volume of data
–70%by 2050 (baseline 1990)
Climate change:
Required reduction of greenhouse gas
emissions to achieve the 2°C goal
~21%per year
Electromobility:
Growing demand for
battery materials
Sources: UN, IEA, Conversio, UBS Foresight, BASF
2021 to 2030
5 March 2022 | BASF Creditor Story
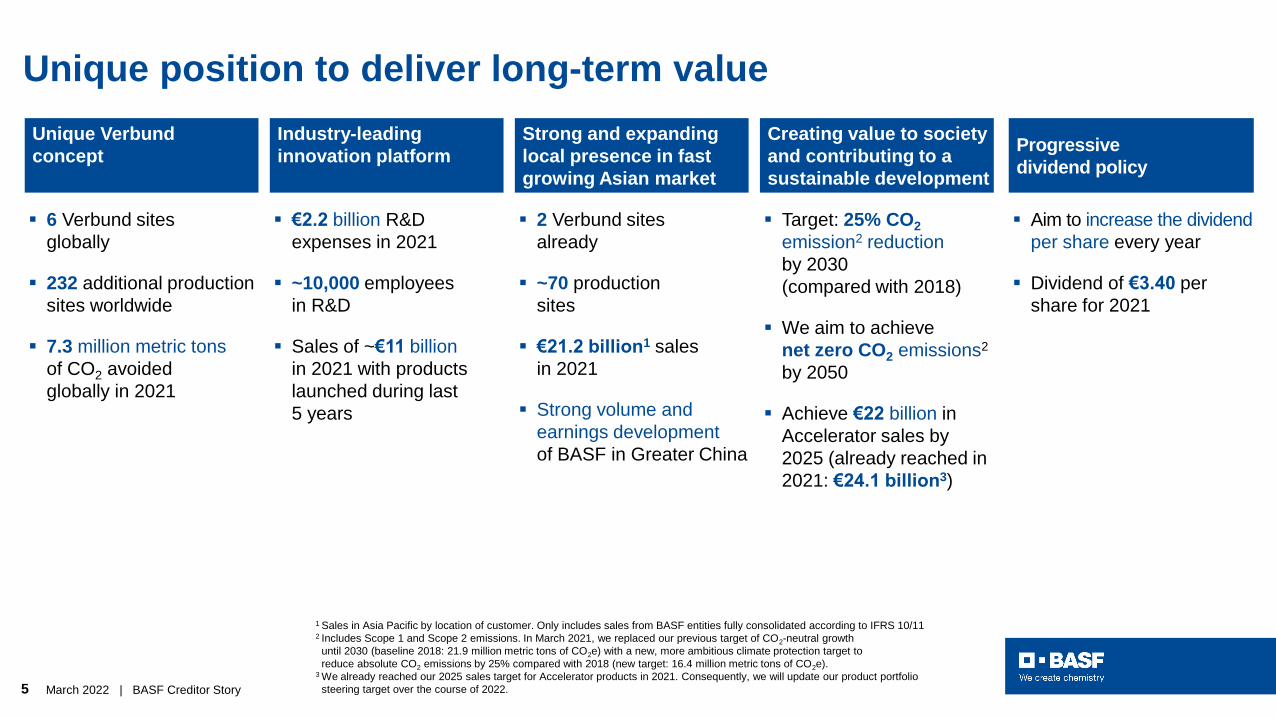
Unique Verbund
concept
Industry-leading
innovation platform
Strong and expanding
local presence in fast
growing Asian market
Creating value to society
and contributing to a
sustainable development
Progressive
dividend policy
▪ 6 Verbund sites
globally
▪ 232 additional production
sites worldwide
▪ 7.3 million metric tons
of CO2 avoided
globally in 2021
▪ €2.2 billion R&D
expenses in 2021
▪ ~10,000 employees
in R&D
▪ Sales of ~€11 billion
in 2021 with products
launched during last
5 years
▪ 2 Verbund sites
already
▪ ~70 production
sites
▪ €21.2 billion1 sales
in 2021
▪ Strong volume and
earnings development
of BASF in Greater China
▪ Target: 25% CO2
emission2 reduction
by 2030
(compared with 2018)
▪ We aim to achieve
net zero CO2 emissions2
by 2050
▪ Achieve €22 billion in
Accelerator sales by
2025 (already reached in
2021: €24.1 billion3)
▪ Aim to increase the dividend
per share every year
▪ Dividend of €3.40 per
share for 2021
Unique position to deliver long-term value
1 Sales in Asia Pacific by location of customer. Only includes sales from BASF entities fully consolidated according to IFRS 10/112 Includes Scope 1 and Scope 2 emissions. In March 2021, we replaced our previous target of CO2-neutral growth
until 2030 (baseline 2018: 21.9 million metric tons of CO2e) with a new, more ambitious climate protection target to
reduce absolute CO2 emissions by 25% compared with 2018 (new target: 16.4 million metric tons of CO2e).3 We already reached our 2025 sales target for Accelerator products in 2021. Consequently, we will update our product portfolio
steering target over the course of 2022.
6 March 2022 | BASF Creditor Story
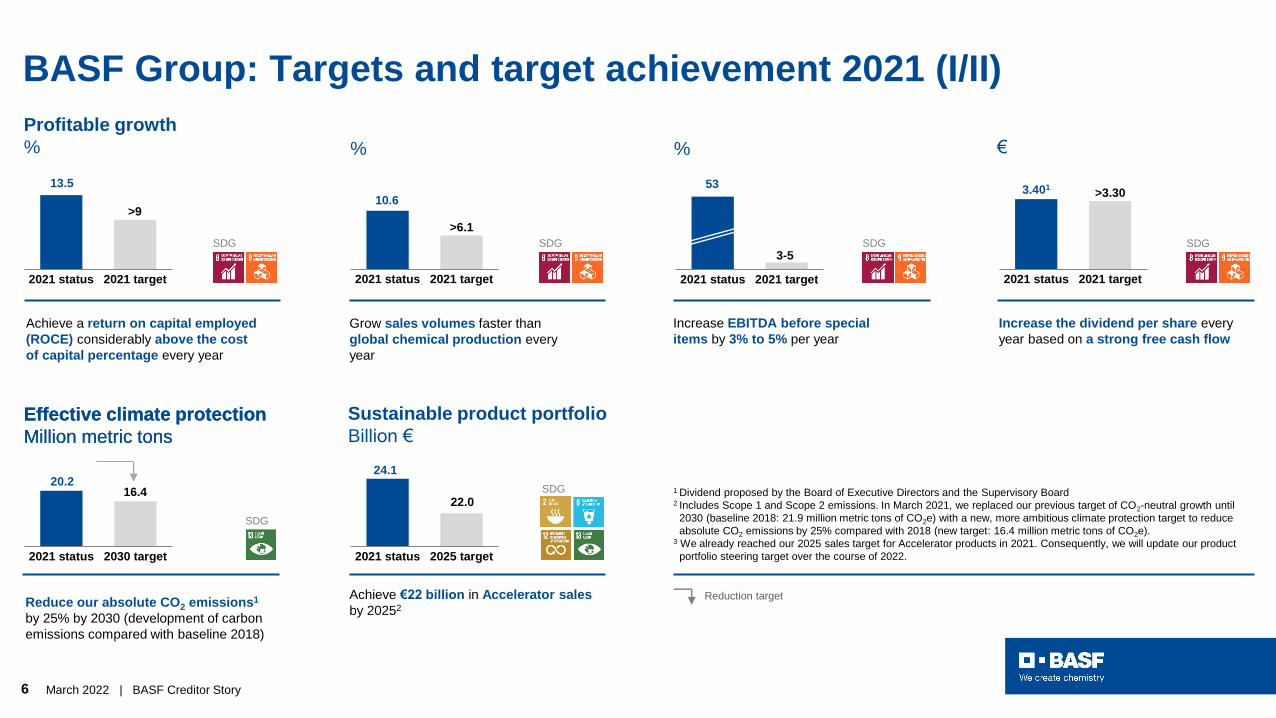
BASF Group: Targets and target achievement 2021 (I/II)
Grow sales volumes faster than
global chemical production every
year
Increase EBITDA before special
items by 3% to 5% per year
Increase the dividend per share every
year based on a strong free cash flow
Achieve a return on capital employed
(ROCE) considerably above the cost
of capital percentage every year
SDG
13.5
>9
2021 status 2021 target
SDG
Reduce our absolute CO2 emissions1
by 25% by 2030 (development of carbon
emissions compared with baseline 2018)
Achieve €22 billion in Accelerator sales
by 20252
SDG
10.6
>6.1
2021 status 2021 target
SDG SDG
53
3-5
2021 status 2021 target
24.1
22.0
2021 status 2025 target
Effective climate protection
Million metric tons
Sustainable product portfolio
Billion €
Profitable growth
% €
Reduction target
1 Dividend proposed by the Board of Executive Directors and the Supervisory Board2 Includes Scope 1 and Scope 2 emissions. In March 2021, we replaced our previous target of CO2-neutral growth until
2030 (baseline 2018: 21.9 million metric tons of CO2e) with a new, more ambitious climate protection target to reduce
absolute CO2 emissions by 25% compared with 2018 (new target: 16.4 million metric tons of CO2e).3 We already reached our 2025 sales target for Accelerator products in 2021. Consequently, we will update our product
portfolio steering target over the course of 2022.
3.401>3.30
2021 status 2021 target
% %
SDG
20.2 16.4
2021 status 2030 target
Effective climate protection
Million metric tons
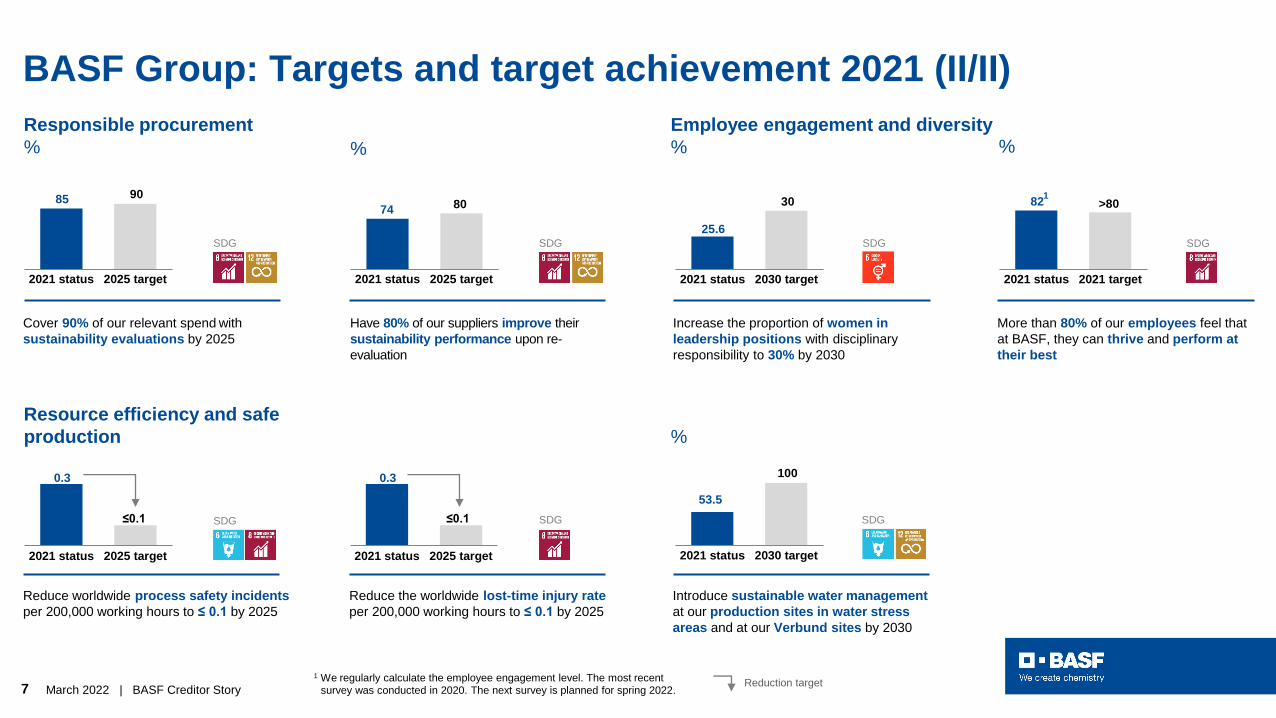
7 March 2022 | BASF Creditor Story
Cover 90% of our relevant spend with
sustainability evaluations by 2025
Have 80% of our suppliers improve their
sustainability performance upon re-
evaluation
Reduce worldwide process safety incidents
per 200,000 working hours to ≤ 0.1 by 2025
SDG
Reduce the worldwide lost-time injury rate
per 200,000 working hours to ≤ 0.1 by 2025
SDG
Introduce sustainable water management
at our production sites in water stress
areas and at our Verbund sites by 2030
Increase the proportion of women in
leadership positions with disciplinary
responsibility to 30% by 2030
More than 80% of our employees feel that
at BASF, they can thrive and perform at
their best
1 We regularly calculate the employee engagement level. The most recent survey was conducted in 2020. The next survey is planned for spring 2022.
85 90
2021 status 2025 target
74 80
2021 status 2025 target
0.3
≤0.1
2021 status 2025 target
0.3
≤0.1
2021 status 2025 target
53.5
100
2021 status 2030 target
25.6
30
2021 status 2030 target
Employee engagement and diversity
%
82 >80
2021 status 2021 target
Responsible procurement
%
SDG SDG
Resource efficiency and safe
production
SDG
%
SDG SDG
BASF Group: Targets and target achievement 2021 (II/II)
1
Reduction target
% %
8 March 2022 | BASF Creditor Story
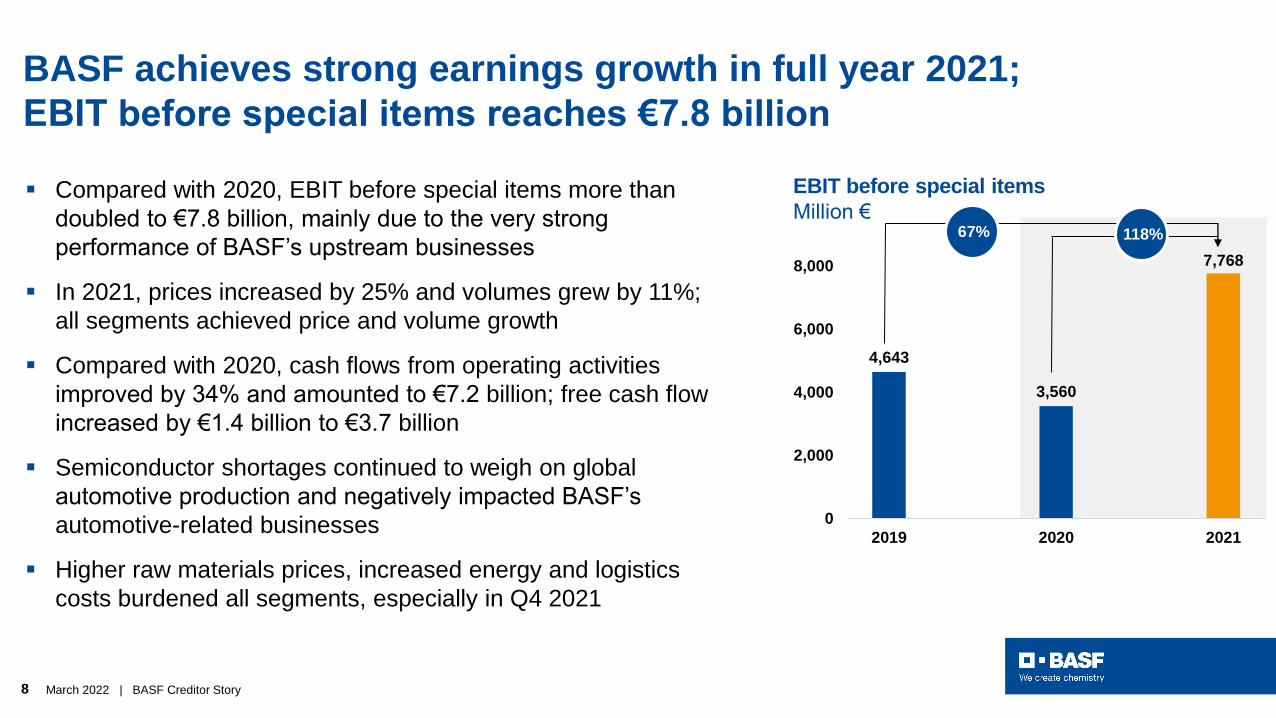
▪ Compared with 2020, EBIT before special items more than
doubled to €7.8 billion, mainly due to the very strong
performance of BASF’s upstream businesses
▪ In 2021, prices increased by 25% and volumes grew by 11%;
all segments achieved price and volume growth
▪ Compared with 2020, cash flows from operating activities
improved by 34% and amounted to €7.2 billion; free cash flow
increased by €1.4 billion to €3.7 billion
▪ Semiconductor shortages continued to weigh on global
automotive production and negatively impacted BASF’s
automotive-related businesses
▪ Higher raw materials prices, increased energy and logistics
costs burdened all segments, especially in Q4 2021
4,643
3,560
7,768
0
2,000
4,000
6,000
8,000
2019 2020 2021
EBIT before special items
Million €67% 118%
BASF achieves strong earnings growth in full year 2021;
EBIT before special items reaches €7.8 billion
9 March 2022 | BASF Creditor Story
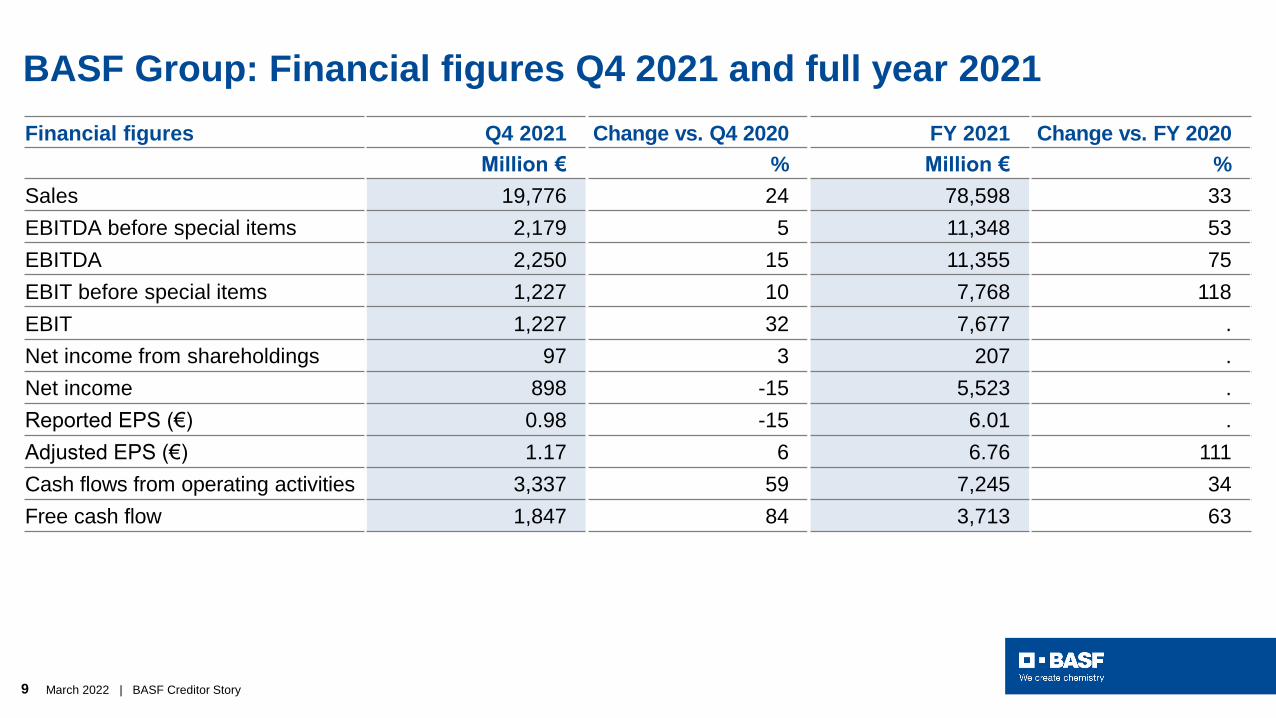
BASF Group: Financial figures Q4 2021 and full year 2021
Financial figures Q4 2021 Change vs. Q4 2020 FY 2021 Change vs. FY 2020
Million € % Million € %
Sales 19,776 24 78,598 33
EBITDA before special items 2,179 5 11,348 53
EBITDA 2,250 15 11,355 75
EBIT before special items 1,227 10 7,768 118
EBIT 1,227 32 7,677 .
Net income from shareholdings 97 3 207 .
Net income 898 -15 5,523 .
Reported EPS (€) 0.98 -15 6.01 .
Adjusted EPS (€) 1.17 6 6.76 111
Cash flows from operating activities 3,337 59 7,245 34
Free cash flow 1,847 84 3,713 63
10 March 2022 | BASF Creditor Story
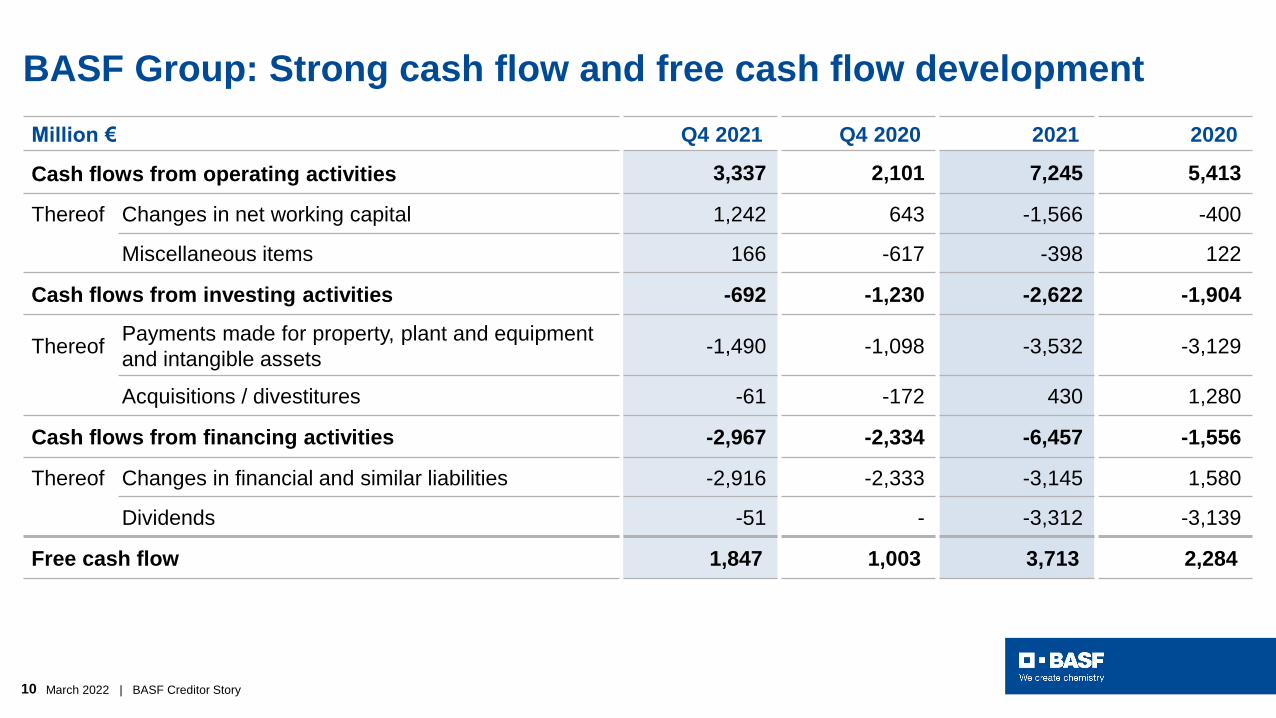
BASF Group: Strong cash flow and free cash flow development
Million € Q4 2021 Q4 2020 2021 2020
Cash flows from operating activities 3,337 2,101 7,245 5,413
Thereof Changes in net working capital 1,242 643 -1,566 -400
Miscellaneous items 166 -617 -398 122
Cash flows from investing activities -692 -1,230 -2,622 -1,904
ThereofPayments made for property, plant and equipment
and intangible assets -1,490 -1,098 -3,532 -3,129
Acquisitions / divestitures -61 -172 430 1,280
Cash flows from financing activities -2,967 -2,334 -6,457 -1,556
Thereof Changes in financial and similar liabilities -2,916 -2,333 -3,145 1,580
Dividends -51 - -3,312 -3,139
Free cash flow 1,847 1,003 3,713 2,284
11 March 2022 | BASF Creditor Story
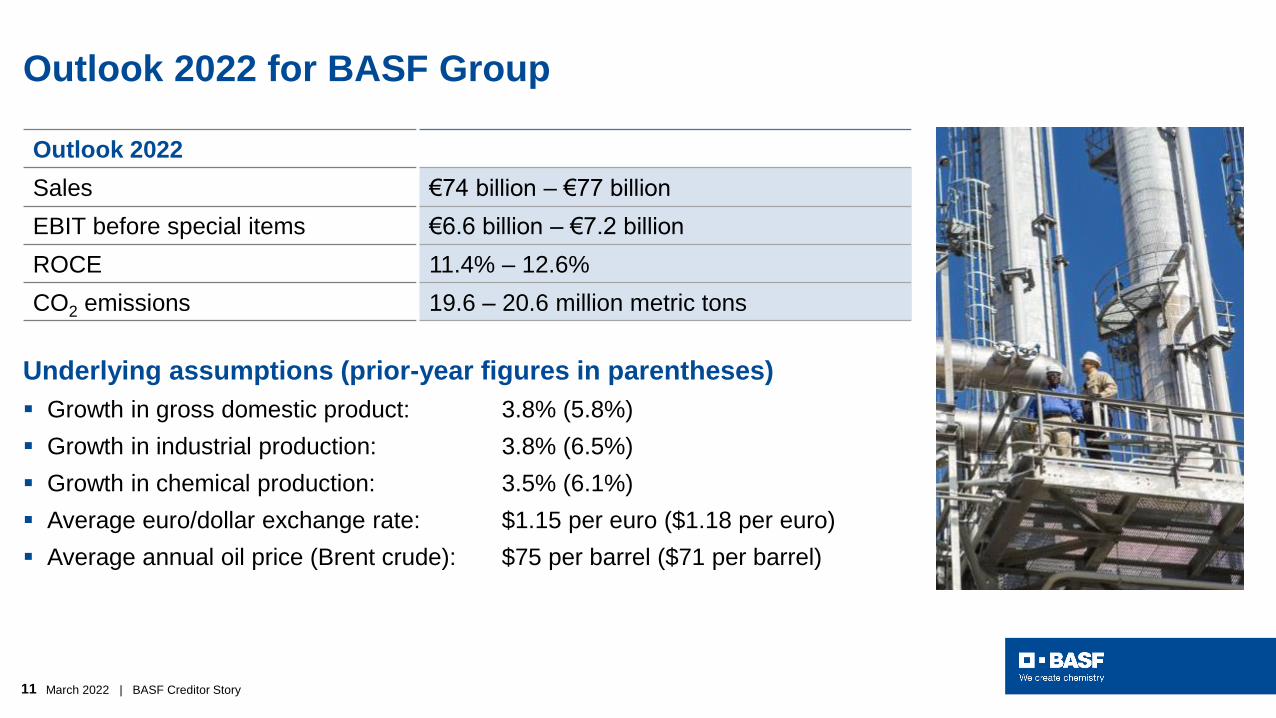
Outlook 2022 for BASF Group
Outlook 2022
Sales €74 billion – €77 billion
EBIT before special items €6.6 billion – €7.2 billion
ROCE 11.4% – 12.6%
CO2 emissions 19.6 – 20.6 million metric tons
Underlying assumptions (prior-year figures in parentheses)
▪ Growth in gross domestic product: 3.8% (5.8%)
▪ Growth in industrial production: 3.8% (6.5%)
▪ Growth in chemical production: 3.5% (6.1%)
▪ Average euro/dollar exchange rate: $1.15 per euro ($1.18 per euro)
▪ Average annual oil price (Brent crude): $75 per barrel ($71 per barrel)
12 March 2022 | BASF Creditor Story
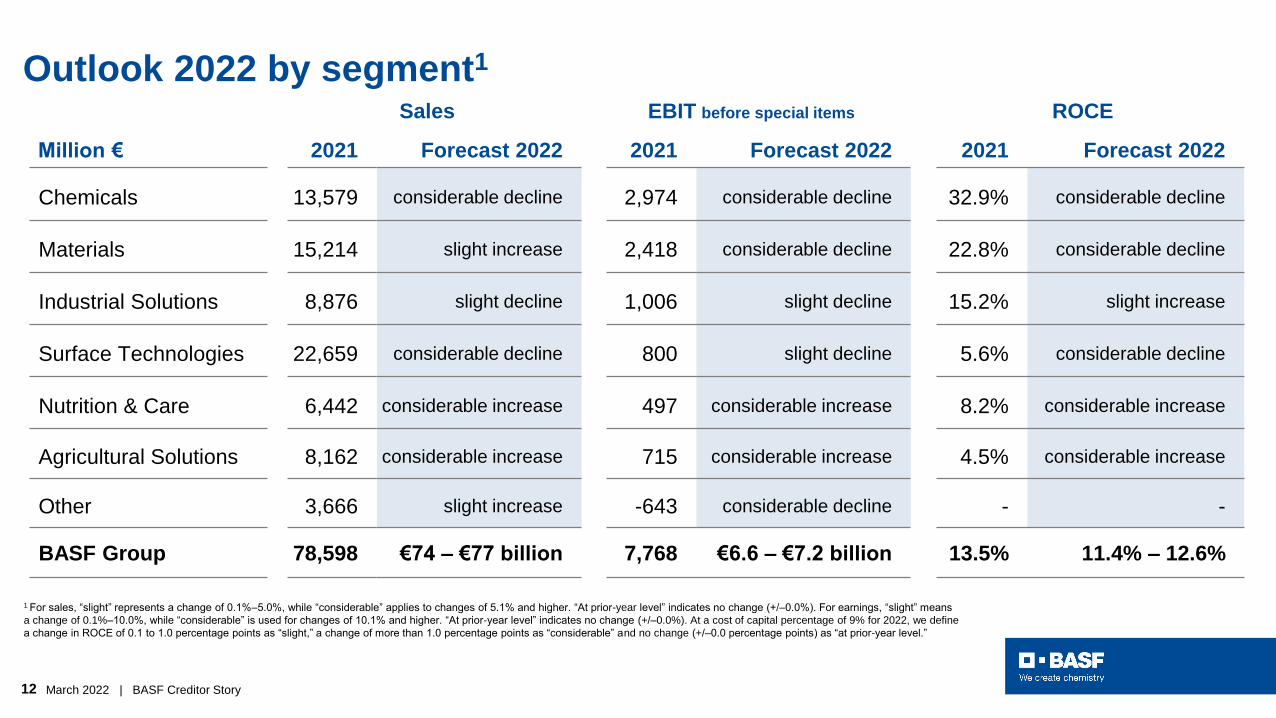
Outlook 2022 by segment1
Sales EBIT before special items ROCE
Million € 2021 Forecast 2022 2021 Forecast 2022 2021 Forecast 2022
Chemicals 13,579 considerable decline 2,974 considerable decline 32.9% considerable decline
Materials 15,214 slight increase 2,418 considerable decline 22.8% considerable decline
Industrial Solutions 8,876 slight decline 1,006 slight decline 15.2% slight increase
Surface Technologies 22,659 considerable decline 800 slight decline 5.6% considerable decline
Nutrition & Care 6,442 considerable increase 497 considerable increase 8.2% considerable increase
Agricultural Solutions 8,162 considerable increase 715 considerable increase 4.5% considerable increase
Other 3,666 slight increase -643 considerable decline - -
BASF Group 78,598 €74 – €77 billion 7,768 €6.6 – €7.2 billion 13.5% 11.4% – 12.6%
1 For sales, “slight” represents a change of 0.1%–5.0%, while “considerable” applies to changes of 5.1% and higher. “At prior-year level” indicates no change (+/–0.0%). For earnings, “slight” means
a change of 0.1%–10.0%, while “considerable” is used for changes of 10.1% and higher. “At prior-year level” indicates no change (+/–0.0%). At a cost of capital percentage of 9% for 2022, we define
a change in ROCE of 0.1 to 1.0 percentage points as “slight,” a change of more than 1.0 percentage points as “considerable” and no change (+/–0.0 percentage points) as “at prior-year level.”
13 March 2022 | BASF Creditor Story
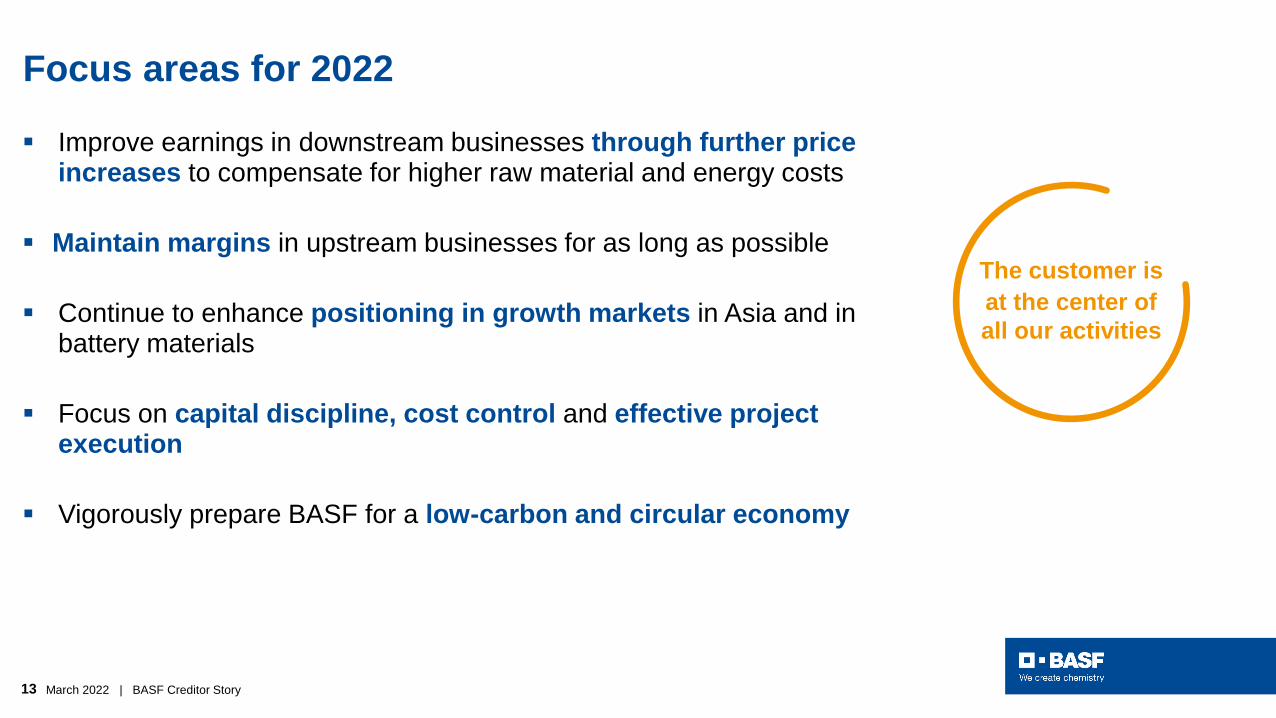
Focus areas for 2022
▪ Improve earnings in downstream businesses through further price increases to compensate for higher raw material and energy costs
▪ Maintain margins in upstream businesses for as long as possible
▪ Continue to enhance positioning in growth markets in Asia and in battery materials
▪ Focus on capital discipline, cost control and effective project execution
▪ Vigorously prepare BASF for a low-carbon and circular economy
The customer is
at the center of
all our activities
14 March 2022 | BASF Creditor Story
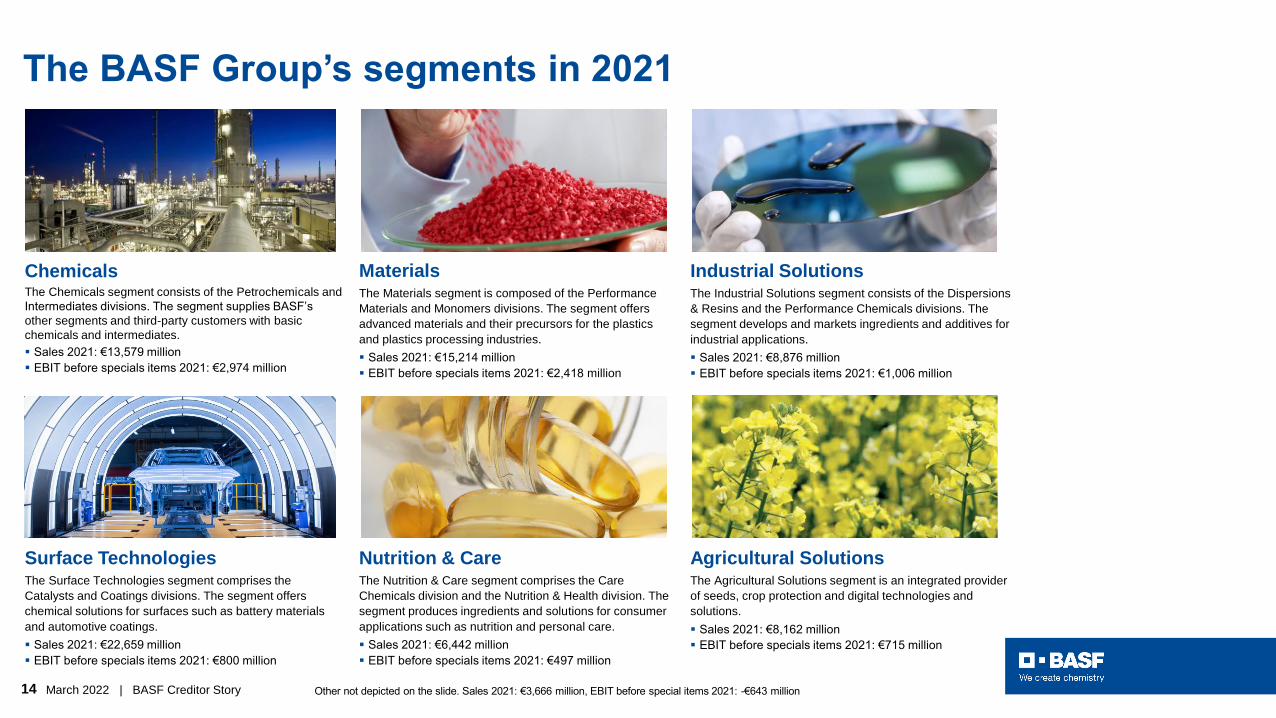
The BASF Group’s segments in 2021
ChemicalsThe Chemicals segment consists of the Petrochemicals and
Intermediates divisions. The segment supplies BASF’s
other segments and third-party customers with basic
chemicals and intermediates.
▪ Sales 2021: €13,579 million
▪ EBIT before specials items 2021: €2,974 million
MaterialsThe Materials segment is composed of the Performance
Materials and Monomers divisions. The segment offers
advanced materials and their precursors for the plastics
and plastics processing industries.
▪ Sales 2021: €15,214 million
▪ EBIT before specials items 2021: €2,418 million
Industrial SolutionsThe Industrial Solutions segment consists of the Dispersions
& Resins and the Performance Chemicals divisions. The
segment develops and markets ingredients and additives for
industrial applications.
▪ Sales 2021: €8,876 million
▪ EBIT before specials items 2021: €1,006 million
Surface TechnologiesThe Surface Technologies segment comprises the
Catalysts and Coatings divisions. The segment offers
chemical solutions for surfaces such as battery materials
and automotive coatings.
▪ Sales 2021: €22,659 million
▪ EBIT before specials items 2021: €800 million
Nutrition & CareThe Nutrition & Care segment comprises the Care
Chemicals division and the Nutrition & Health division. The
segment produces ingredients and solutions for consumer
applications such as nutrition and personal care.
▪ Sales 2021: €6,442 million
▪ EBIT before specials items 2021: €497 million
Agricultural SolutionsThe Agricultural Solutions segment is an integrated provider
of seeds, crop protection and digital technologies and
solutions.
▪ Sales 2021: €8,162 million
▪ EBIT before specials items 2021: €715 million
Other not depicted on the slide. Sales 2021: €3,666 million, EBIT before special items 2021: -€643 million
15 March 2022 | BASF Creditor Story
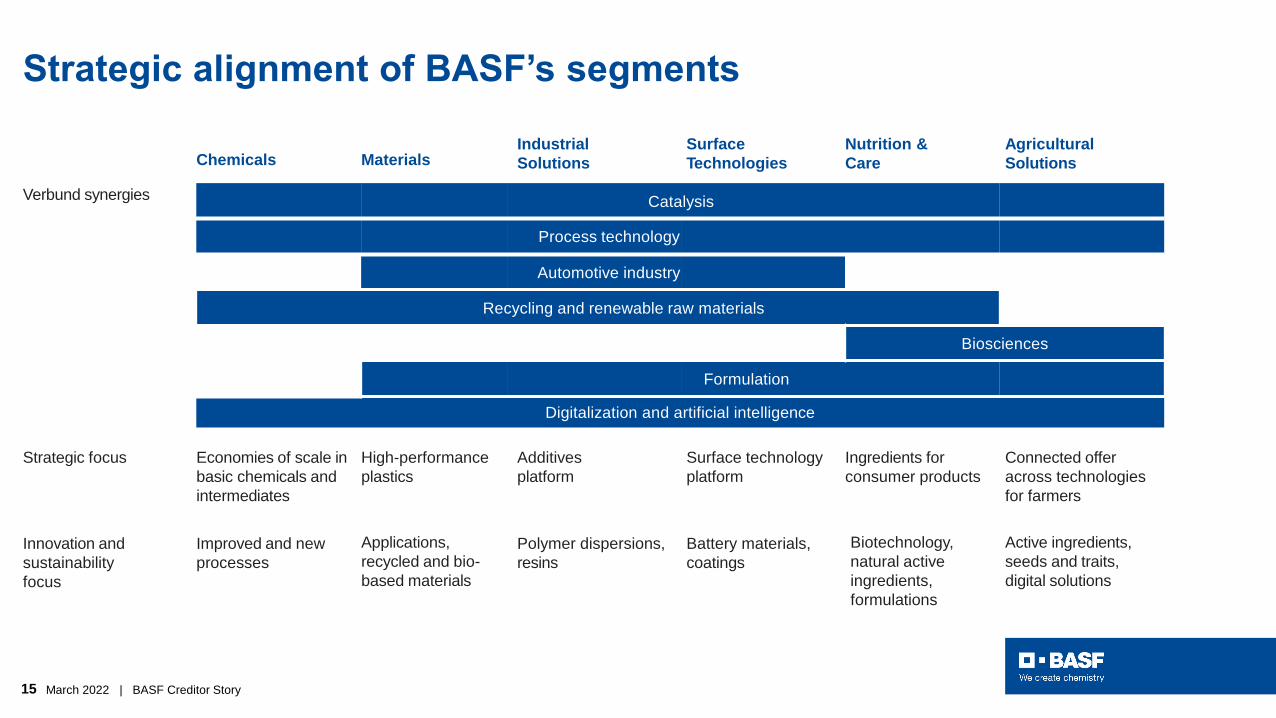
Strategic alignment of BASF’s segments
Chemicals MaterialsIndustrial
Solutions
Surface
Technologies
Nutrition &
Care
Agricultural
Solutions
Verbund synergies Catalysis
Process technology
Automotive industry
Recycling and renewable raw materials
Biosciences
Formulation
Digitalization and artificial intelligence
Strategic focus Economies of scale in
basic chemicals and
intermediates
High-performance
plastics
Additives
platform
Surface technology
platform
Ingredients for
consumer products
Connected offer
across technologies
for farmers
Innovation and
sustainability
focus
Improved and new
processes
Applications,
recycled and bio-
based materials
Polymer dispersions,
resins
Battery materials,
coatings
Biotechnology,
natural active
ingredients,
formulations
Active ingredients,
seeds and traits,
digital solutions
16 March 2022 | BASF Creditor Story
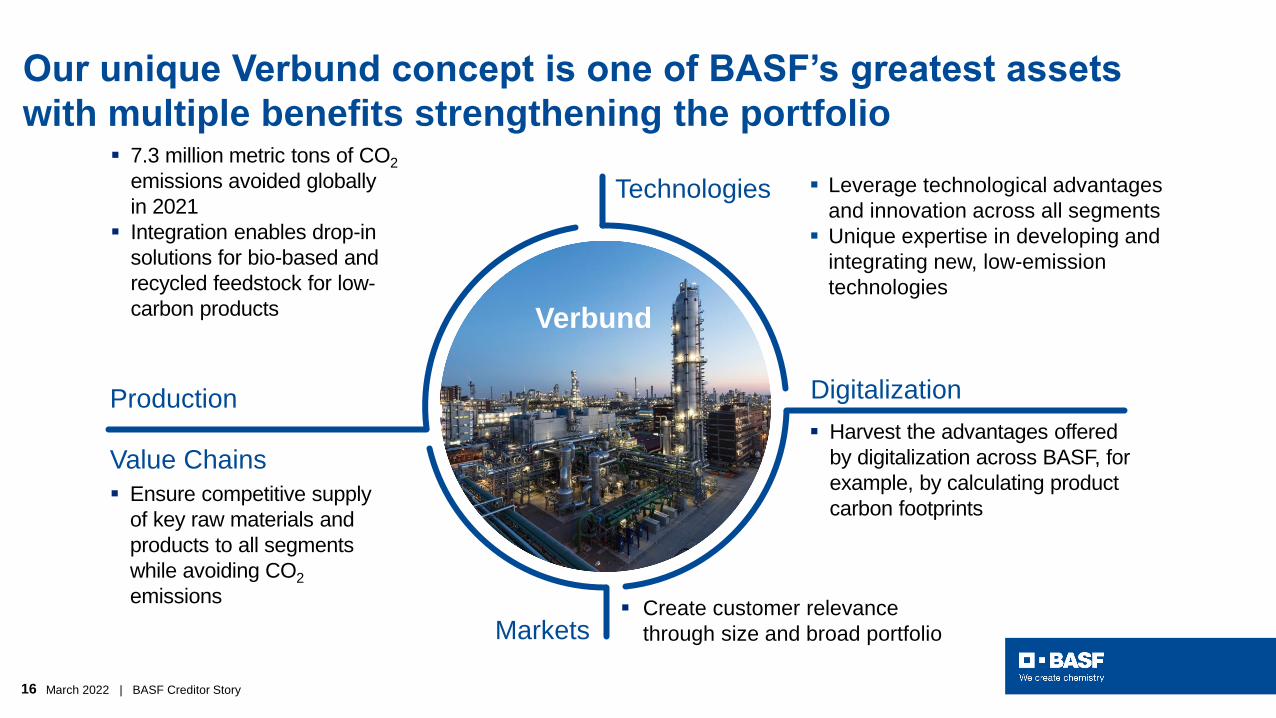
Our unique Verbund concept is one of BASF’s greatest assets
with multiple benefits strengthening the portfolio
Technologies
Production
Value Chains
Markets
Digitalization
▪ 7.3 million metric tons of CO2
emissions avoided globally
in 2021
▪ Integration enables drop-in
solutions for bio-based and
recycled feedstock for low-
carbon products
▪ Ensure competitive supply
of key raw materials and
products to all segments
while avoiding CO2
emissions
▪ Leverage technological advantages
and innovation across all segments
▪ Unique expertise in developing and
integrating new, low-emission
technologies
▪ Create customer relevance
through size and broad portfolio
▪ Harvest the advantages offered
by digitalization across BASF, for
example, by calculating product
carbon footprints
Verbund
17 March 2022 | BASF Creditor Story
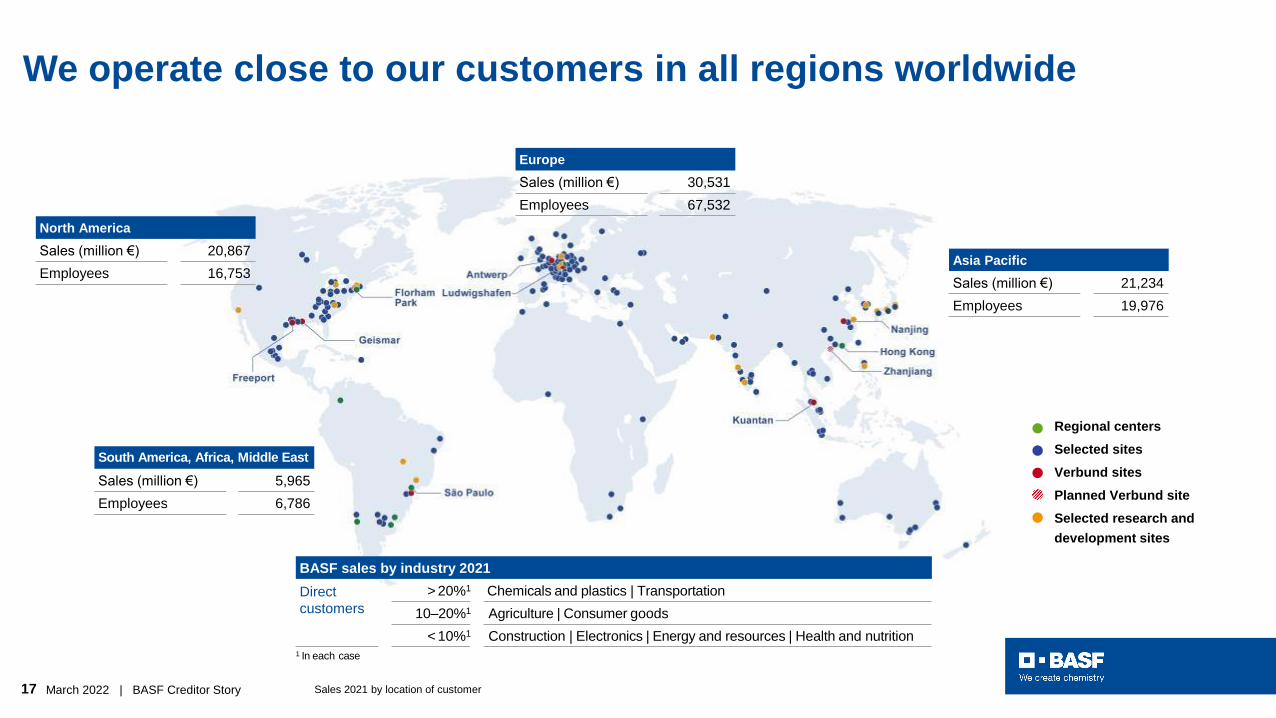
We operate close to our customers in all regions worldwide
Sales 2021 by location of customer
Sablona
North America
Sales (million €) 20,867
Employees 16,753Asia Pacific
Sales (million €) 21,234
Employees 19,976
South America, Africa, Middle East
Sales (million €) 5,965
Employees 6,786
1 In each case
BASF sales by industry 2021
Direct
customers
> 20%1 Chemicals and plastics | Transportation
10–20%1 Agriculture | Consumer goods
< 10%1 Construction | Electronics | Energy and resources | Health and nutrition
Regional centers
Selected sites
Verbund sites
Selected research and
development sites
Planned Verbund site
Europe
Sales (million €) 30,531
Employees 67,532
18 March 2022 | BASF Creditor Story
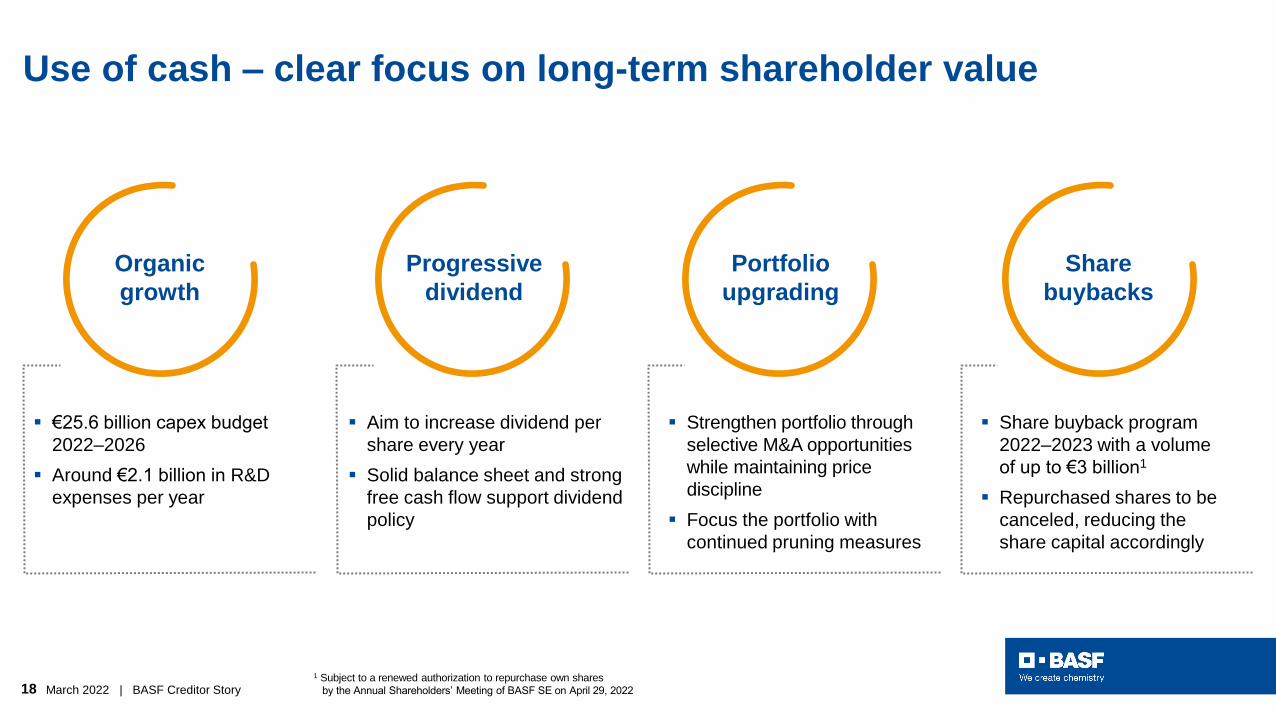
Use of cash – clear focus on long-term shareholder value
Organic
growth
Progressive
dividend
Portfolio
upgrading
Share
buybacks
▪ €25.6 billion capex budget
2022–2026
▪ Around €2.1 billion in R&D
expenses per year
▪ Aim to increase dividend per
share every year
▪ Solid balance sheet and strong
free cash flow support dividend
policy
▪ Strengthen portfolio through
selective M&A opportunities
while maintaining price
discipline
▪ Focus the portfolio with
continued pruning measures
▪ Share buyback program
2022–2023 with a volume
of up to €3 billion1
▪ Repurchased shares to be
canceled, reducing the
share capital accordingly
1 Subject to a renewed authorization to repurchase own shares
by the Annual Shareholders’ Meeting of BASF SE on April 29, 2022
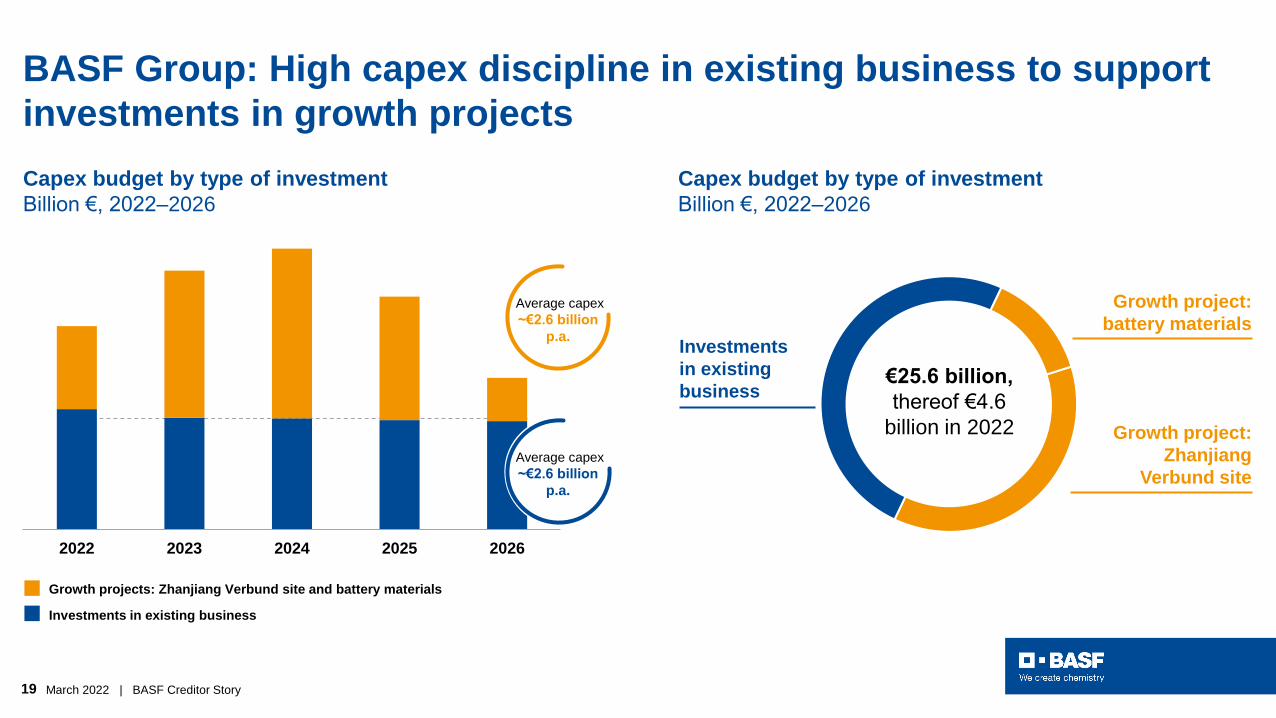
19 March 2022 | BASF Creditor Story
2022 2023 2024 2025 2026
Investments in existing business
Growth projects: Zhanjiang Verbund site and battery materials
BASF Group: High capex discipline in existing business to support
investments in growth projects
Capex budget by type of investment
Billion €, 2022–2026
Investments
in existing
business€25.6 billion,
thereof €4.6
billion in 2022
Growth project:
battery materials
Average capex
~€2.6 billion
p.a.
Average capex
~€2.6 billion
p.a.
Capex budget by type of investment
Billion €, 2022–2026
Growth project:
Zhanjiang
Verbund site
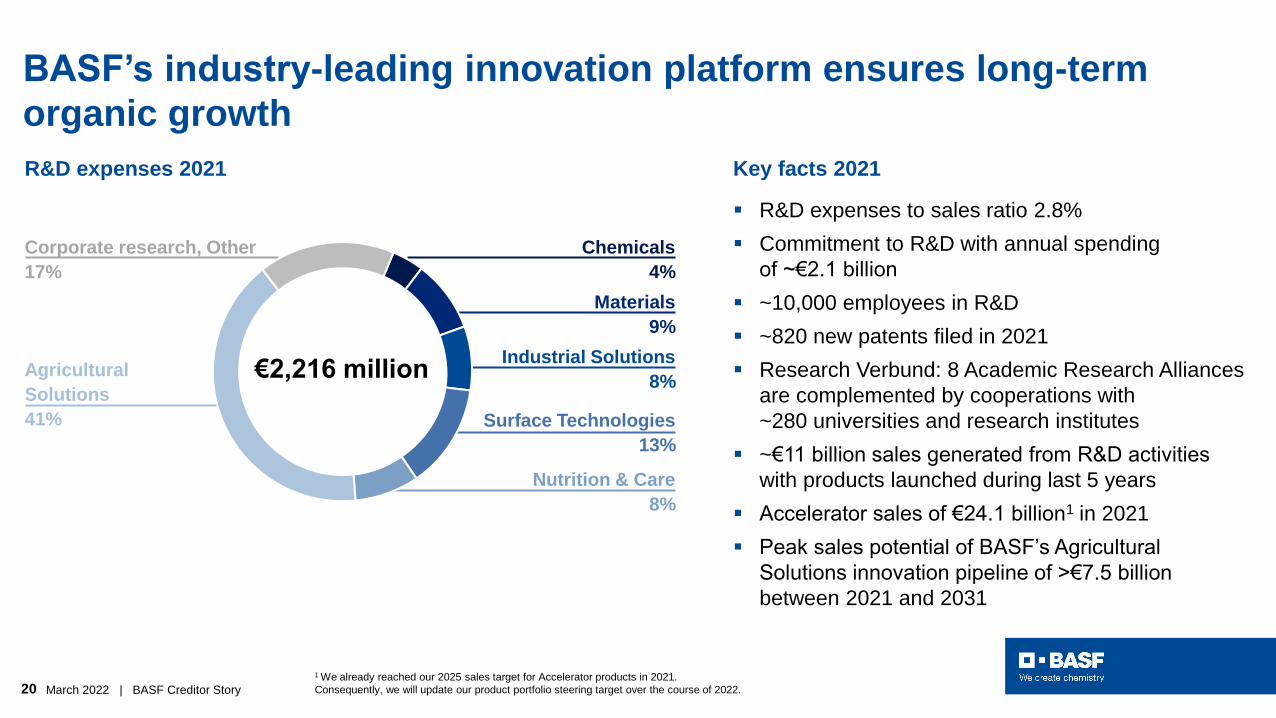
20 March 2022 | BASF Creditor Story
BASF’s industry-leading innovation platform ensures long-term
organic growth
Key facts 2021
▪ R&D expenses to sales ratio 2.8%
▪ Commitment to R&D with annual spending
of ~€2.1 billion
▪ ~10,000 employees in R&D
▪ ~820 new patents filed in 2021
▪ Research Verbund: 8 Academic Research Alliances
are complemented by cooperations with
~280 universities and research institutes
▪ ~€11 billion sales generated from R&D activities
with products launched during last 5 years
▪ Accelerator sales of €24.1 billion1 in 2021
▪ Peak sales potential of BASF’s Agricultural
Solutions innovation pipeline of >€7.5 billion
between 2021 and 2031
R&D expenses 2021
Agricultural
Solutions
41%
Materials
9%
Nutrition & Care
8%
Corporate research, Other
17%
Chemicals
4%
Industrial Solutions
8%
Surface Technologies
13%
€2,216 million
1 We already reached our 2025 sales target for Accelerator products in 2021.
Consequently, we will update our product portfolio steering target over the course of 2022.

21 March 2022 | BASF Creditor Story
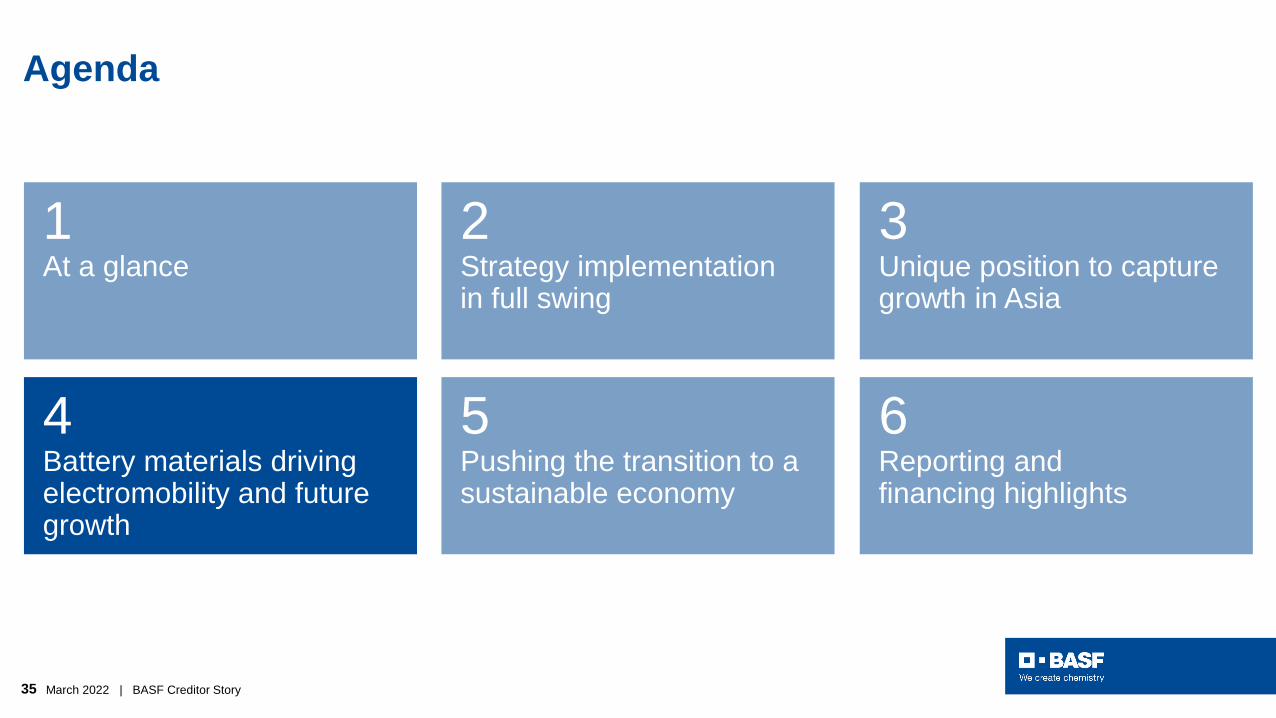
Agenda
1At a glance
4Battery materials driving
electromobility and future
growth
4Battery materials driving electromobility and future growth
5Pushing the transition to a sustainable economy
2Strategy implementation in full swing
6Reporting and financing highlights
3Unique position to capture growth in Asia
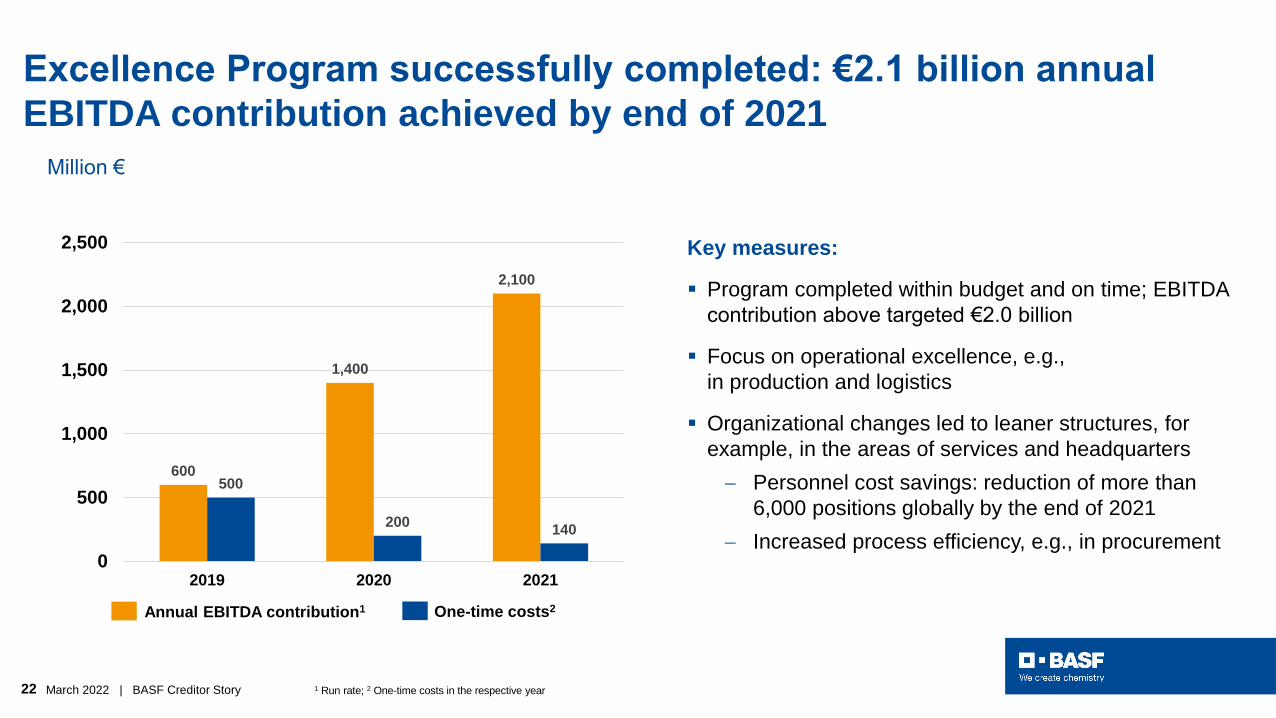
22 March 2022 | BASF Creditor Story
Excellence Program successfully completed: €2.1 billion annual
EBITDA contribution achieved by end of 2021
1 Run rate; 2 One-time costs in the respective year
600
1,400
2,100
500
200140
0
500
1,000
1,500
2,000
2,500
2019 2020 2021
Annual EBITDA contribution1 One-time costs2
Key measures:
▪ Program completed within budget and on time; EBITDA
contribution above targeted €2.0 billion
▪ Focus on operational excellence, e.g.,
in production and logistics
▪ Organizational changes led to leaner structures, for
example, in the areas of services and headquarters
− Personnel cost savings: reduction of more than
6,000 positions globally by the end of 2021
− Increased process efficiency, e.g., in procurement
Million €
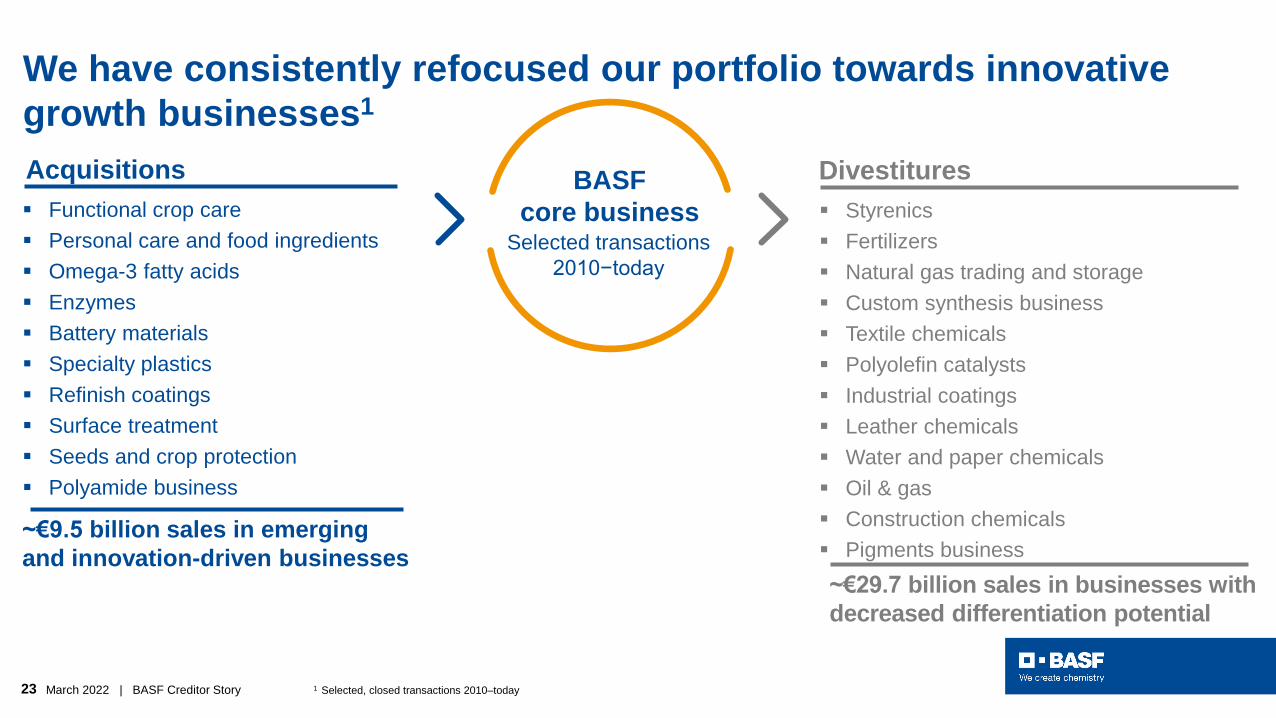
23 March 2022 | BASF Creditor Story 1 Selected, closed transactions 2010–today
~€9.5 billion sales in emerging
and innovation-driven businesses
▪ Functional crop care
▪ Personal care and food ingredients
▪ Omega-3 fatty acids
▪ Enzymes
▪ Battery materials
▪ Specialty plastics
▪ Refinish coatings
▪ Surface treatment
▪ Seeds and crop protection
▪ Polyamide business
Divestitures
~€29.7 billion sales in businesses with
decreased differentiation potential
▪ Styrenics
▪ Fertilizers
▪ Natural gas trading and storage
▪ Custom synthesis business
▪ Textile chemicals
▪ Polyolefin catalysts
▪ Industrial coatings
▪ Leather chemicals
▪ Water and paper chemicals
▪ Oil & gas
▪ Construction chemicals
▪ Pigments business
Acquisitions
Selected transactions
2010−today
BASF
core business
We have consistently refocused our portfolio towards innovative
growth businesses1
24 March 2022 | BASF Creditor Story
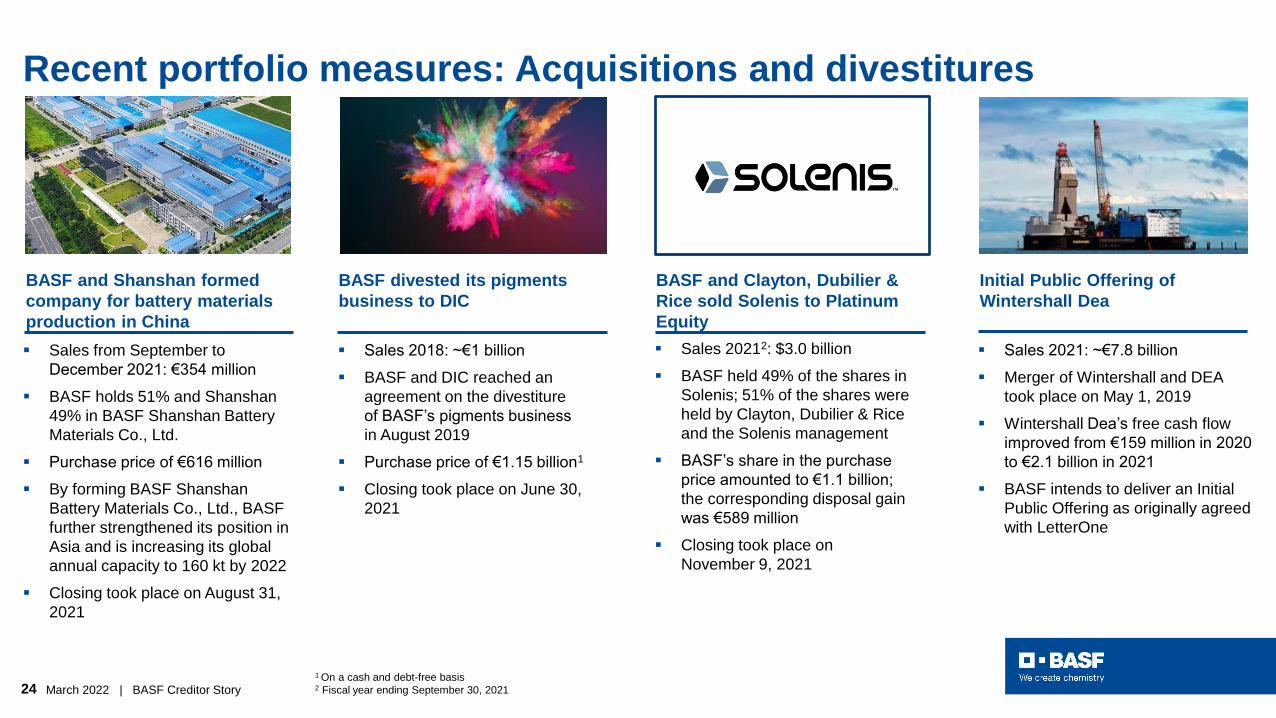
Recent portfolio measures: Acquisitions and divestitures
Initial Public Offering of
Wintershall Dea
▪ Sales 2021: ~€7.8 billion
▪ Merger of Wintershall and DEA
took place on May 1, 2019
▪ Wintershall Dea’s free cash flow
improved from €159 million in 2020
to €2.1 billion in 2021
▪ BASF intends to deliver an Initial
Public Offering as originally agreed
with LetterOne
▪ Sales from September to
December 2021: €354 million
▪ BASF holds 51% and Shanshan
49% in BASF Shanshan Battery
Materials Co., Ltd.
▪ Purchase price of €616 million
▪ By forming BASF Shanshan
Battery Materials Co., Ltd., BASF
further strengthened its position in
Asia and is increasing its global
annual capacity to 160 kt by 2022
▪ Closing took place on August 31,
2021
BASF and Shanshan formed
company for battery materials
production in China
1 On a cash and debt-free basis 2 Fiscal year ending September 30, 2021
▪ Sales 2018: ~€1 billion
▪ BASF and DIC reached an
agreement on the divestiture
of BASF’s pigments business
in August 2019
▪ Purchase price of €1.15 billion1
▪ Closing took place on June 30,
2021
BASF divested its pigments
business to DIC
BASF and Clayton, Dubilier &
Rice sold Solenis to Platinum
Equity
▪ Sales 20212: $3.0 billion
▪ BASF held 49% of the shares in
Solenis; 51% of the shares were
held by Clayton, Dubilier & Rice
and the Solenis management
▪ BASF’s share in the purchase
price amounted to €1.1 billion;
the corresponding disposal gain
was €589 million
▪ Closing took place on
November 9, 2021
25 March 2022 | BASF Creditor Story
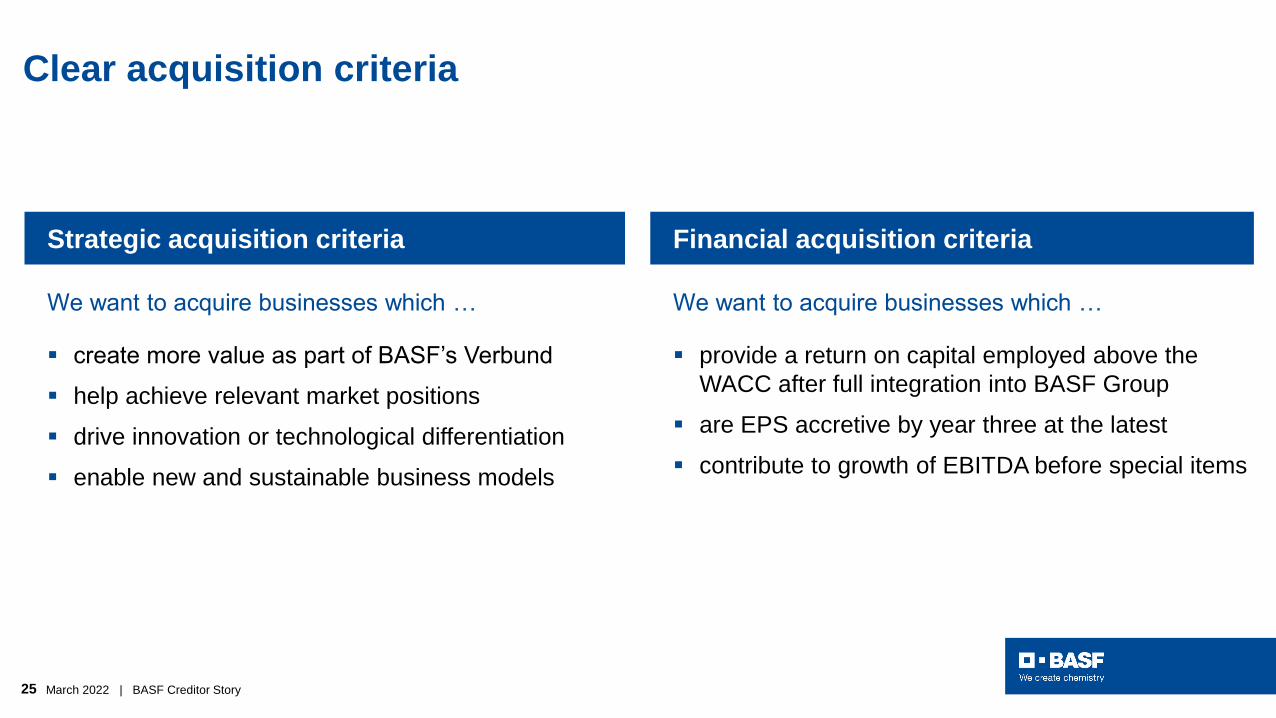
Clear acquisition criteria
Strategic acquisition criteria Financial acquisition criteria
We want to acquire businesses which …
▪ create more value as part of BASF’s Verbund
▪ help achieve relevant market positions
▪ drive innovation or technological differentiation
▪ enable new and sustainable business models
We want to acquire businesses which …
▪ provide a return on capital employed above the
WACC after full integration into BASF Group
▪ are EPS accretive by year three at the latest
▪ contribute to growth of EBITDA before special items
26 March 2022 | BASF Creditor Story
Agenda
1At a glance
4Battery materials driving
electromobility and future
growth
4Battery materials driving electromobility and future growth
5Pushing the transition to a sustainable economy
2Strategy implementation in full swing
6Reporting and financing highlights
3Unique position to capture growth in Asia
27 March 2022 | BASF Creditor Story
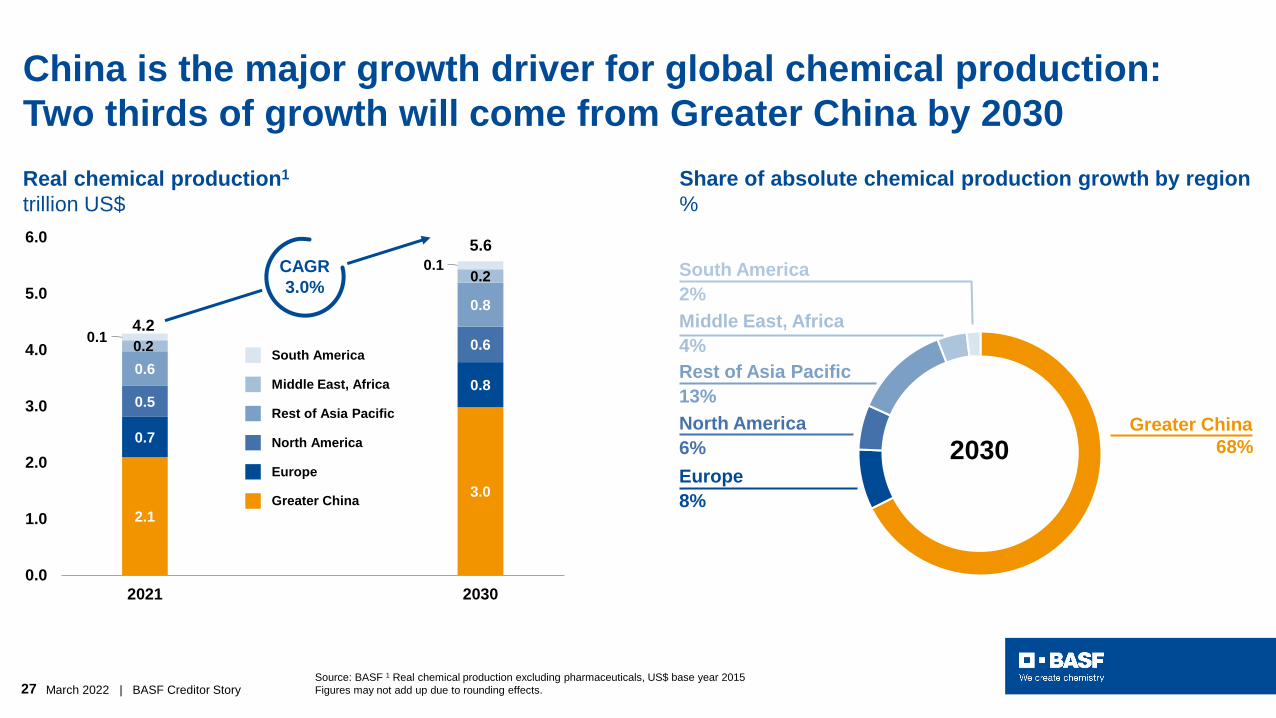
Share of absolute chemical production growth by region
%
2030Greater China
68%
Europe
8%
North America
6%
Rest of Asia Pacific
13%
Middle East, Africa
4%
South America
2%
2.1
3.0
0.7
0.80.5
0.6
0.6
0.8
0.2
0.2
0.1
0.1
0.0
1.0
2.0
3.0
4.0
5.0
6.0
2021 2030
China is the major growth driver for global chemical production:
Two thirds of growth will come from Greater China by 2030
Real chemical production1
trillion US$
4.2
5.6
Greater China
Europe
North America
Rest of Asia Pacific
Middle East, Africa
South America
CAGR
3.0%
Source: BASF 1 Real chemical production excluding pharmaceuticals, US$ base year 2015
Figures may not add up due to rounding effects.
28 March 2022 | BASF Creditor Story
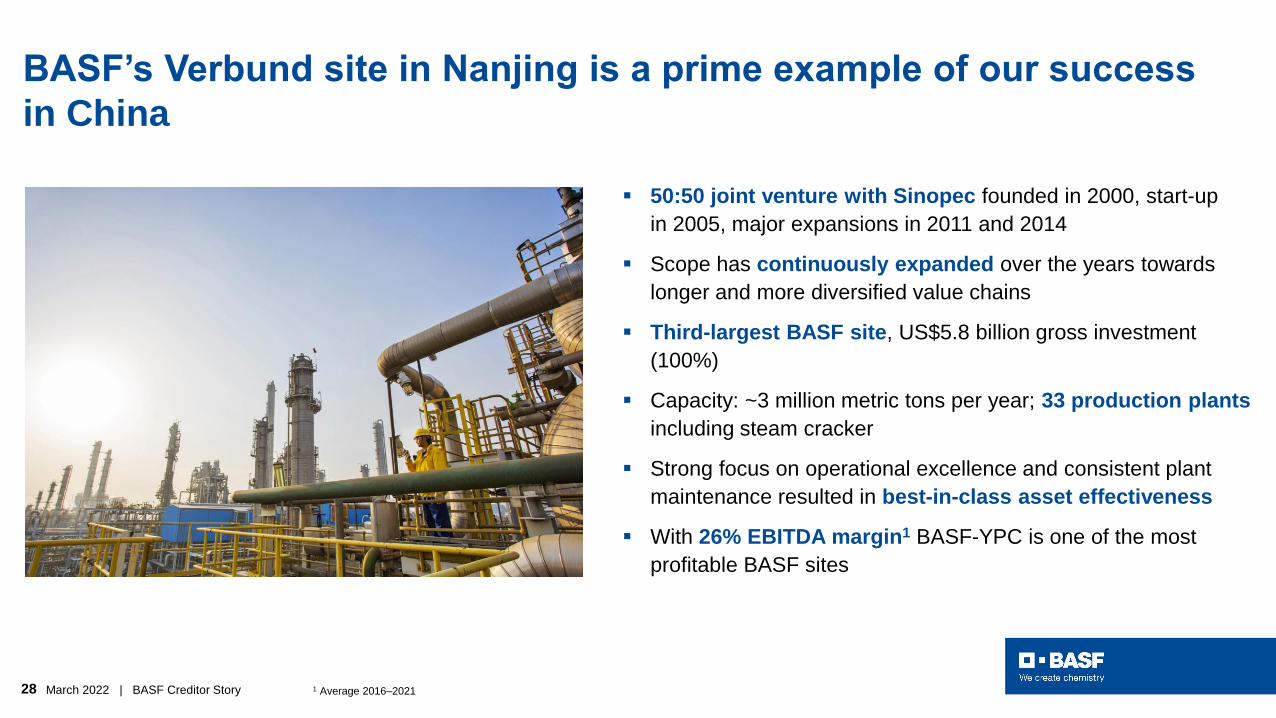
BASF’s Verbund site in Nanjing is a prime example of our success
in China
▪ 50:50 joint venture with Sinopec founded in 2000, start-up
in 2005, major expansions in 2011 and 2014
▪ Scope has continuously expanded over the years towards
longer and more diversified value chains
▪ Third-largest BASF site, US$5.8 billion gross investment
(100%)
▪ Capacity: ~3 million metric tons per year; 33 production plants
including steam cracker
▪ Strong focus on operational excellence and consistent plant
maintenance resulted in best-in-class asset effectiveness
▪ With 26% EBITDA margin1 BASF-YPC is one of the most
profitable BASF sites
1 Average 2016–2021
29 March 2022 | BASF Creditor Story
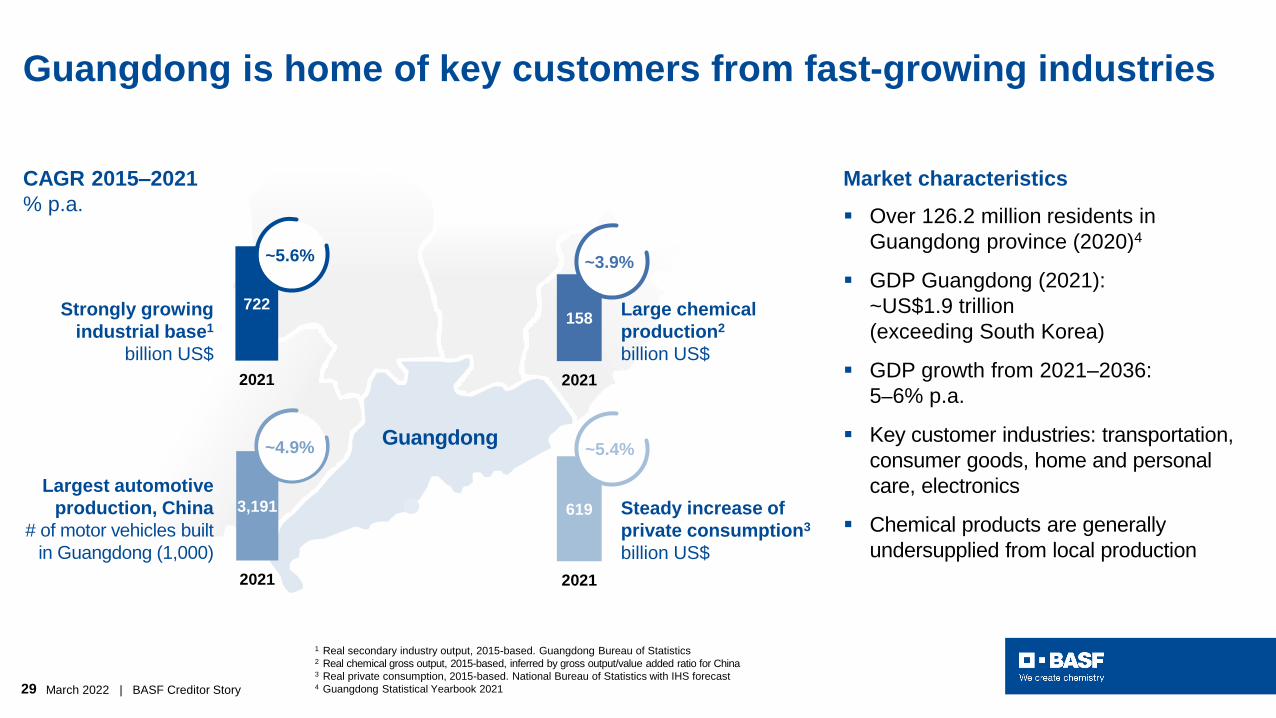
Guangdong is home of key customers from fast-growing industries
Guangdong
722
2021
158
2021
Strongly growing
industrial base1
billion US$
Largest automotive
production, China
# of motor vehicles built
in Guangdong (1,000)
Large chemical
production2
billion US$
Steady increase of
private consumption3
billion US$
3,191
2021
619
2021
~5.6% ~3.9%
~5.4% ~4.9%
CAGR 2015–2021
% p.a.
Market characteristics
▪ Over 126.2 million residents in
Guangdong province (2020)4
▪ GDP Guangdong (2021):
~US$1.9 trillion
(exceeding South Korea)
▪ GDP growth from 2021–2036:
5–6% p.a.
▪ Key customer industries: transportation,
consumer goods, home and personal
care, electronics
▪ Chemical products are generally
undersupplied from local production
1 Real secondary industry output, 2015-based. Guangdong Bureau of Statistics2 Real chemical gross output, 2015-based, inferred by gross output/value added ratio for China3 Real private consumption, 2015-based. National Bureau of Statistics with IHS forecast4 Guangdong Statistical Yearbook 2021
30 March 2022 | BASF Creditor Story
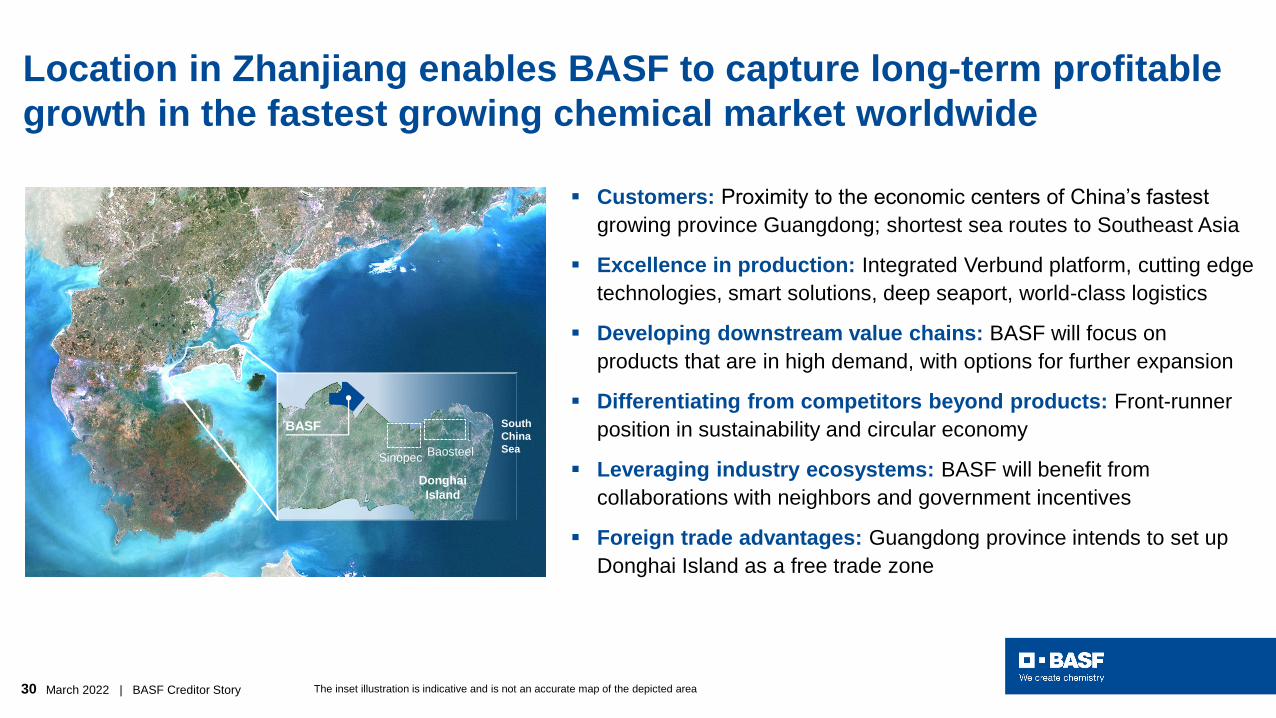
Location in Zhanjiang enables BASF to capture long-term profitable
growth in the fastest growing chemical market worldwide
▪ Customers: Proximity to the economic centers of China’s fastest
growing province Guangdong; shortest sea routes to Southeast Asia
▪ Excellence in production: Integrated Verbund platform, cutting edge
technologies, smart solutions, deep seaport, world-class logistics
▪ Developing downstream value chains: BASF will focus on
products that are in high demand, with options for further expansion
▪ Differentiating from competitors beyond products: Front-runner
position in sustainability and circular economy
▪ Leveraging industry ecosystems: BASF will benefit from
collaborations with neighbors and government incentives
▪ Foreign trade advantages: Guangdong province intends to set up
Donghai Island as a free trade zone
BASF
Baosteel
South
China
Sea
Donghai
Island
Sinopec
The inset illustration is indicative and is not an accurate map of the depicted area
31 March 2022 | BASF Creditor Story
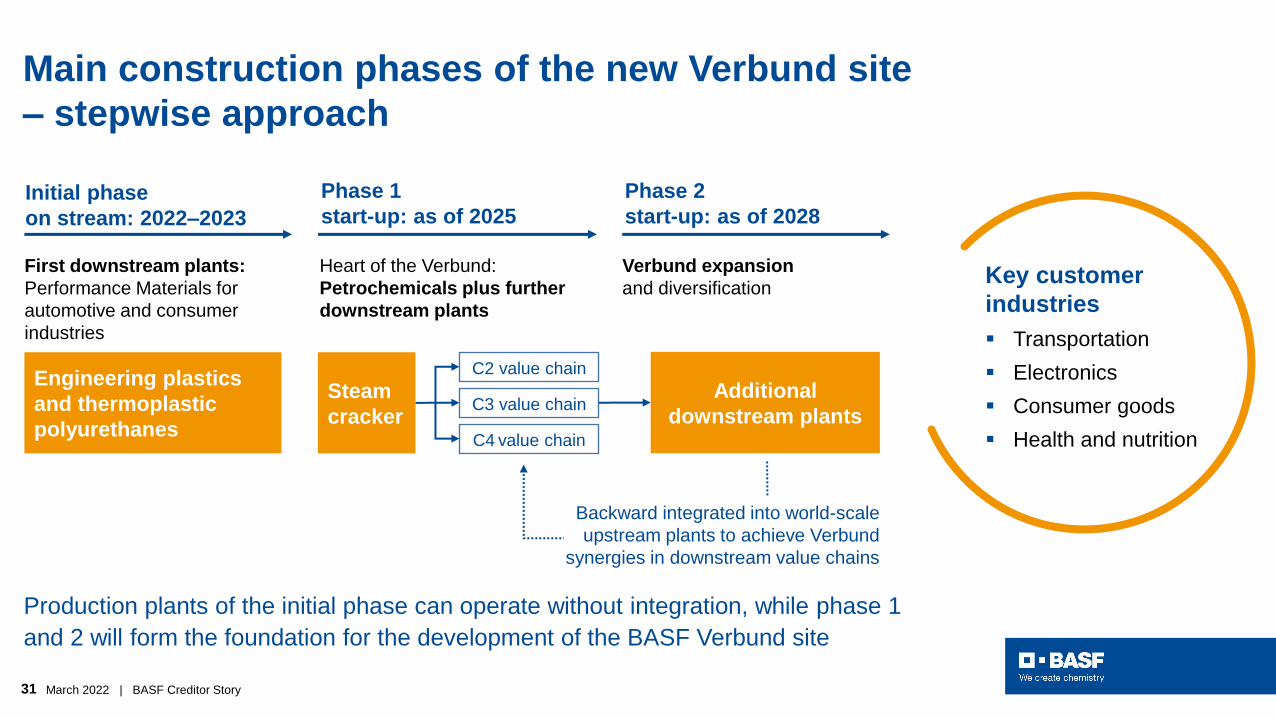
Main construction phases of the new Verbund site
– stepwise approach
Initial phase
on stream: 2022–2023
Phase 1
start-up: as of 2025
Steam
cracker
Phase 2
start-up: as of 2028
Engineering plastics
and thermoplastic
polyurethanes
C2 value chain
Heart of the Verbund:
Petrochemicals plus further
downstream plants
Verbund expansion
and diversification
First downstream plants:
Performance Materials for
automotive and consumer
industries
C3 value chain
C4 value chain
Additional
downstream plants
Key customer
industries
▪ Transportation
▪ Electronics
▪ Consumer goods
▪ Health and nutrition
Backward integrated into world-scale
upstream plants to achieve Verbund
synergies in downstream value chains
Production plants of the initial phase can operate without integration, while phase 1
and 2 will form the foundation for the development of the BASF Verbund site
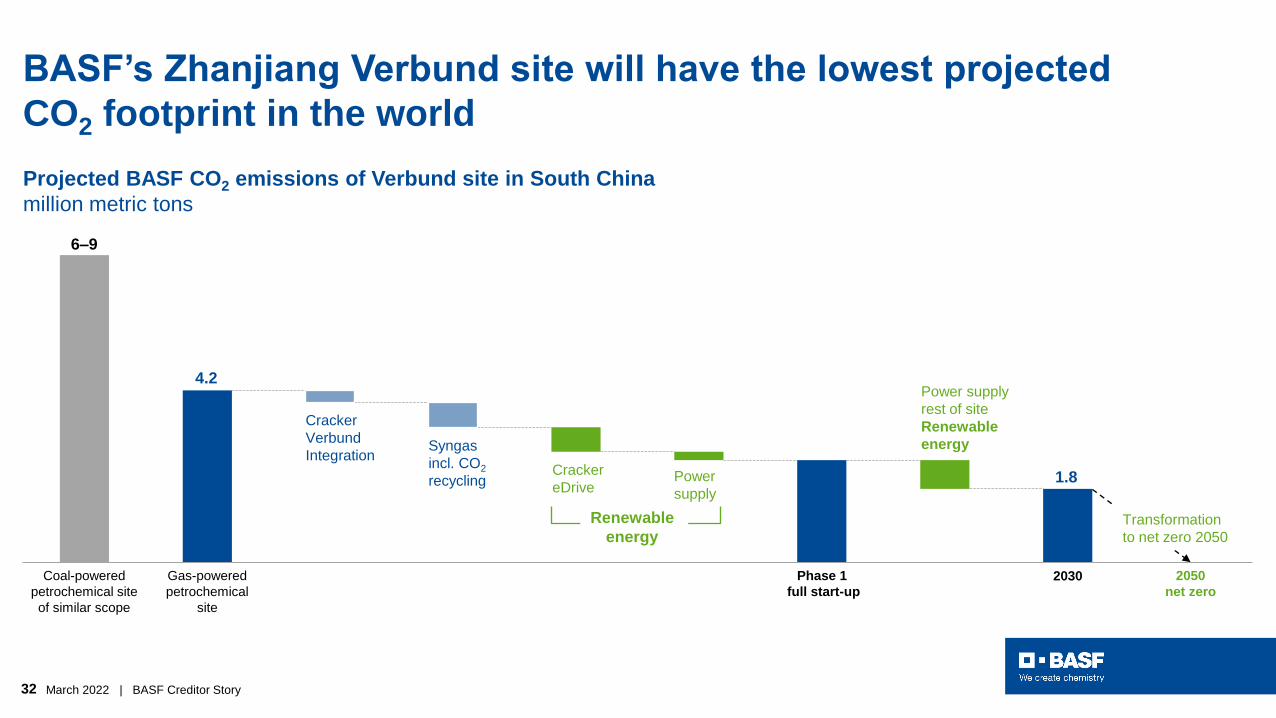
32 March 2022 | BASF Creditor Story
BASF’s Zhanjiang Verbund site will have the lowest projected
CO2 footprint in the world
Phase 1
full start-up
Coal-powered
petrochemical site
of similar scope
Gas-powered
petrochemical
site
2050
net zero
2030
Renewable
energy
Syngas
incl. CO2
recyclingCracker
eDrivePower
supply
Projected BASF CO2 emissions of Verbund site in South China
million metric tons
1.8
4.2Power supply
rest of site
Renewable
energy
6–9
Cracker
Verbund
Integration
Transformation
to net zero 2050
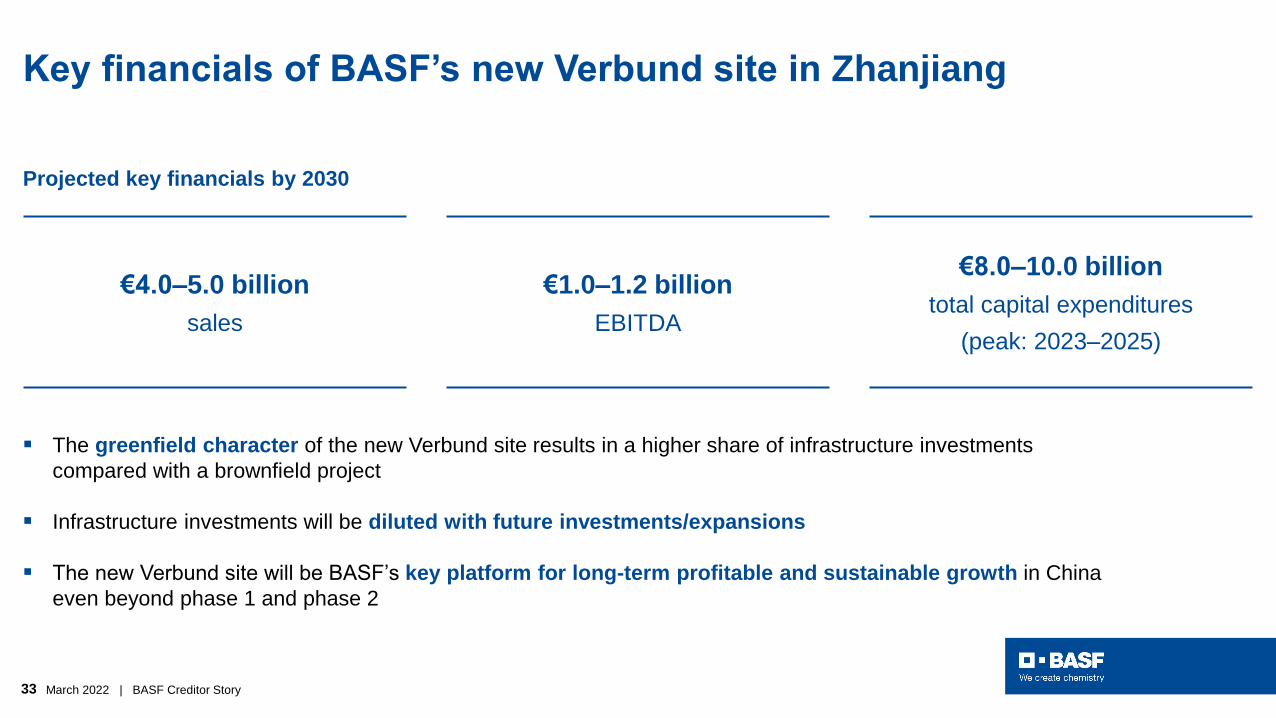
33 March 2022 | BASF Creditor Story
Key financials of BASF’s new Verbund site in Zhanjiang
▪ The greenfield character of the new Verbund site results in a higher share of infrastructure investments
compared with a brownfield project
▪ Infrastructure investments will be diluted with future investments/expansions
▪ The new Verbund site will be BASF’s key platform for long-term profitable and sustainable growth in China
even beyond phase 1 and phase 2
€4.0–5.0 billion
sales
€1.0–1.2 billion
EBITDA
€8.0–10.0 billion
total capital expenditures
(peak: 2023–2025)
Projected key financials by 2030
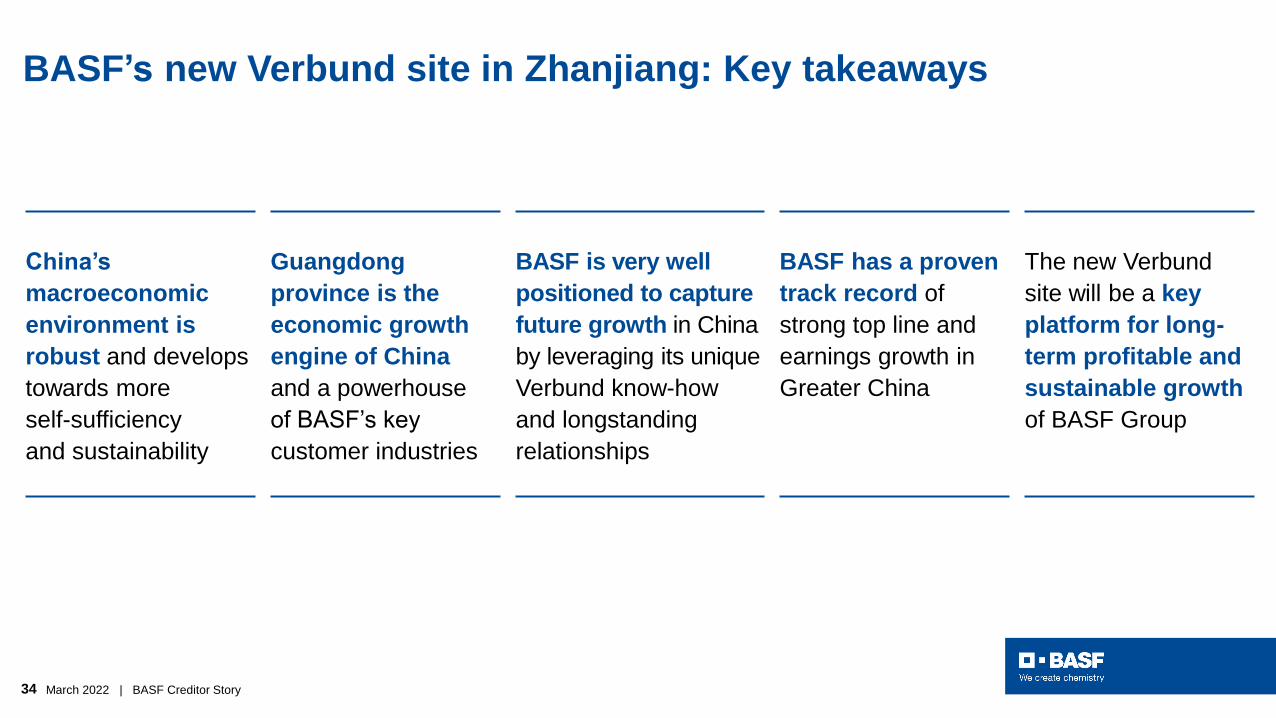
34 March 2022 | BASF Creditor Story
BASF’s new Verbund site in Zhanjiang: Key takeaways
China’s
macroeconomic
environment is
robust and develops
towards more
self-sufficiency
and sustainability
Guangdong
province is the
economic growth
engine of China
and a powerhouse
of BASF’s key
customer industries
BASF is very well
positioned to capture
future growth in China
by leveraging its unique
Verbund know-how
and longstanding
relationships
BASF has a proven
track record of
strong top line and
earnings growth in
Greater China
The new Verbund
site will be a key
platform for long-
term profitable and
sustainable growth
of BASF Group
35 March 2022 | BASF Creditor Story
Agenda
1At a glance
4Battery materials driving
electromobility and future
growth
4Battery materials driving electromobility and future growth
5Pushing the transition to a sustainable economy
2Strategy implementation in full swing
6Reporting and financing highlights
3Unique position to capture growth in Asia
36 March 2022 | BASF Creditor Story
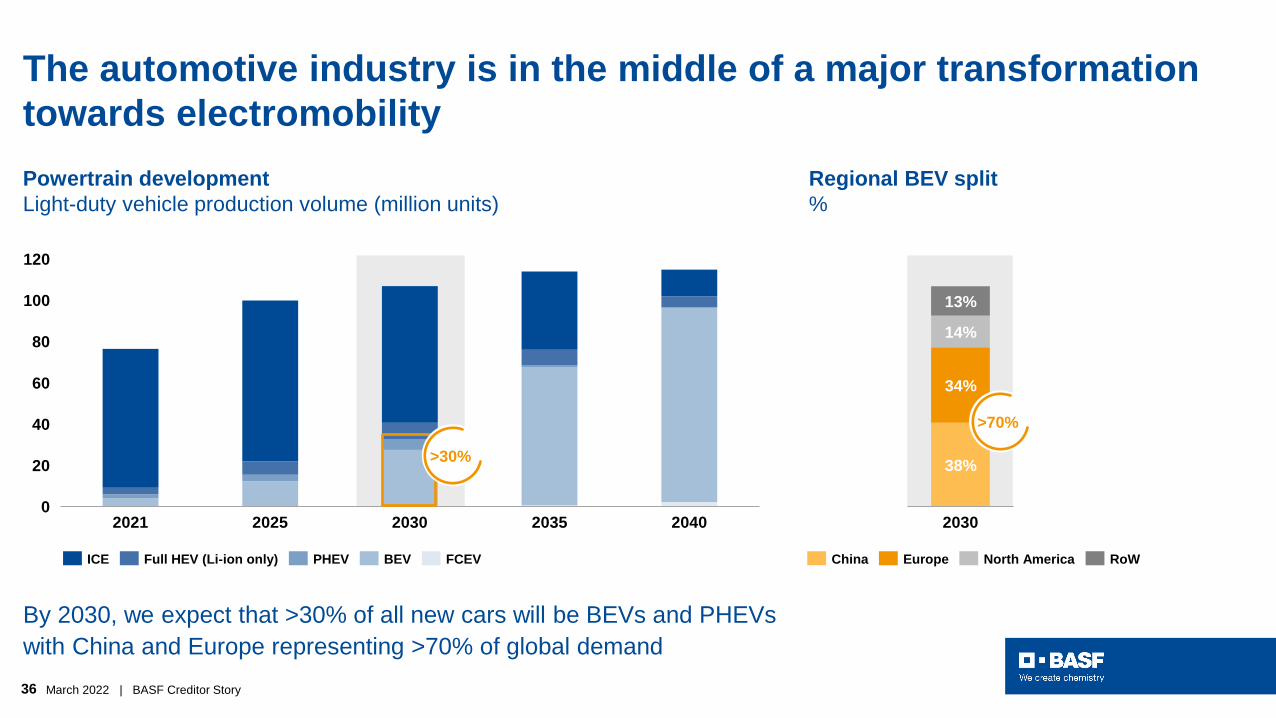
The automotive industry is in the middle of a major transformation
towards electromobility
80
40
100
0
120
20
60
2021 2025 2030 2035 2040
By 2030, we expect that >30% of all new cars will be BEVs and PHEVs
with China and Europe representing >70% of global demand
ICE PHEVFull HEV (Li-ion only) BEV FCEV
Powertrain development
Light-duty vehicle production volume (million units)
2030
38%
34%
14%
13%
China RoWEurope North America
>30%
>70%
Regional BEV split
%
37 March 2022 | BASF Creditor Story
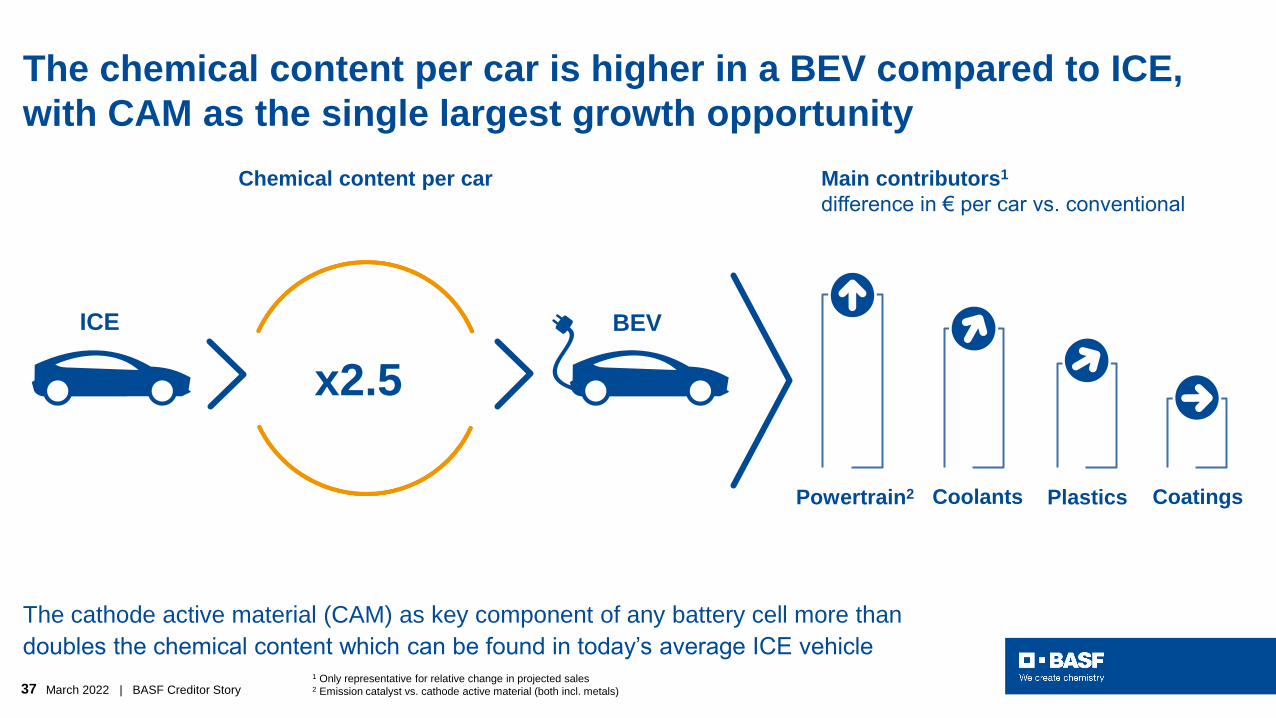
The chemical content per car is higher in a BEV compared to ICE,
with CAM as the single largest growth opportunity
x2.5
ICE BEV
Main contributors1
difference in € per car vs. conventional
Powertrain2 Coolants Plastics Coatings
Chemical content per car
1 Only representative for relative change in projected sales2 Emission catalyst vs. cathode active material (both incl. metals)
The cathode active material (CAM) as key component of any battery cell more than
doubles the chemical content which can be found in today’s average ICE vehicle
38 March 2022 | BASF Creditor Story
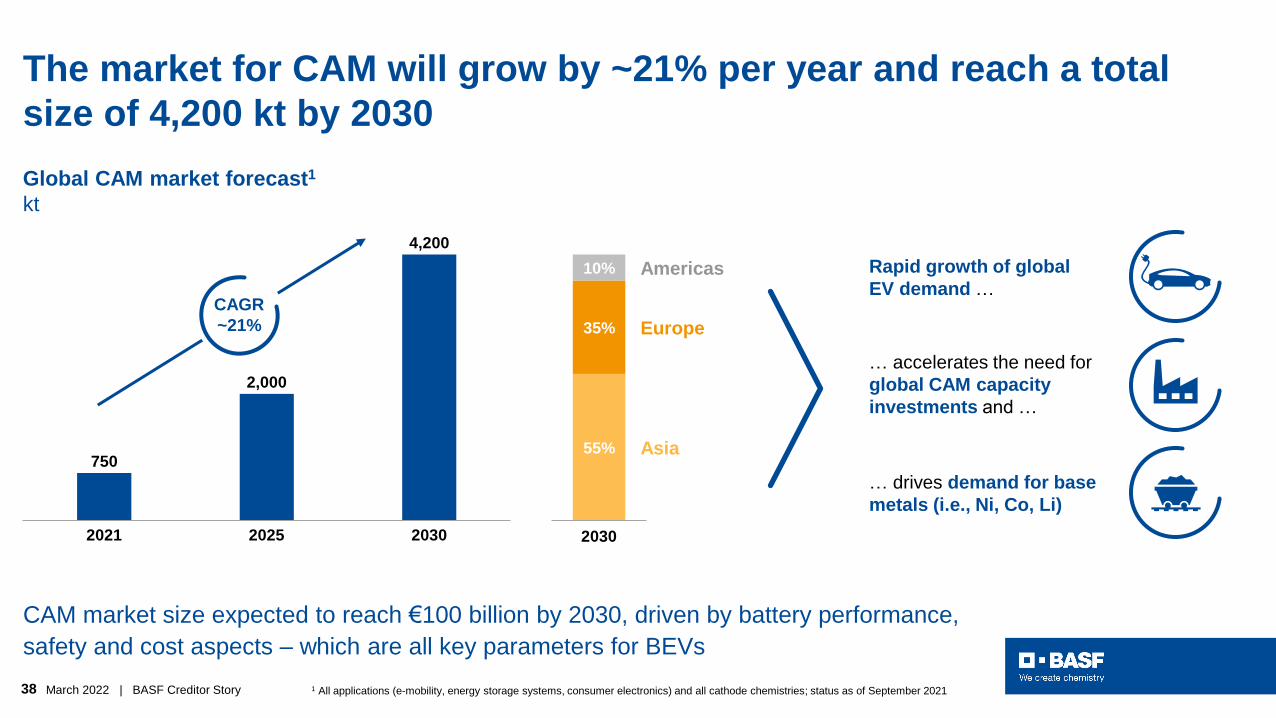
The market for CAM will grow by ~21% per year and reach a total
size of 4,200 kt by 2030
750
2,000
4,200
2021 2025 2030
1 All applications (e-mobility, energy storage systems, consumer electronics) and all cathode chemistries; status as of September 2021
CAM market size expected to reach €100 billion by 2030, driven by battery performance,
safety and cost aspects – which are all key parameters for BEVs
Rapid growth of global
EV demand …
… accelerates the need for
global CAM capacity
investments and …
… drives demand for base
metals (i.e., Ni, Co, Li)
Americas
55%
35% Europe
2030
10%
Asia
CAGR
~21%
Global CAM market forecast1
kt
39 March 2022 | BASF Creditor Story
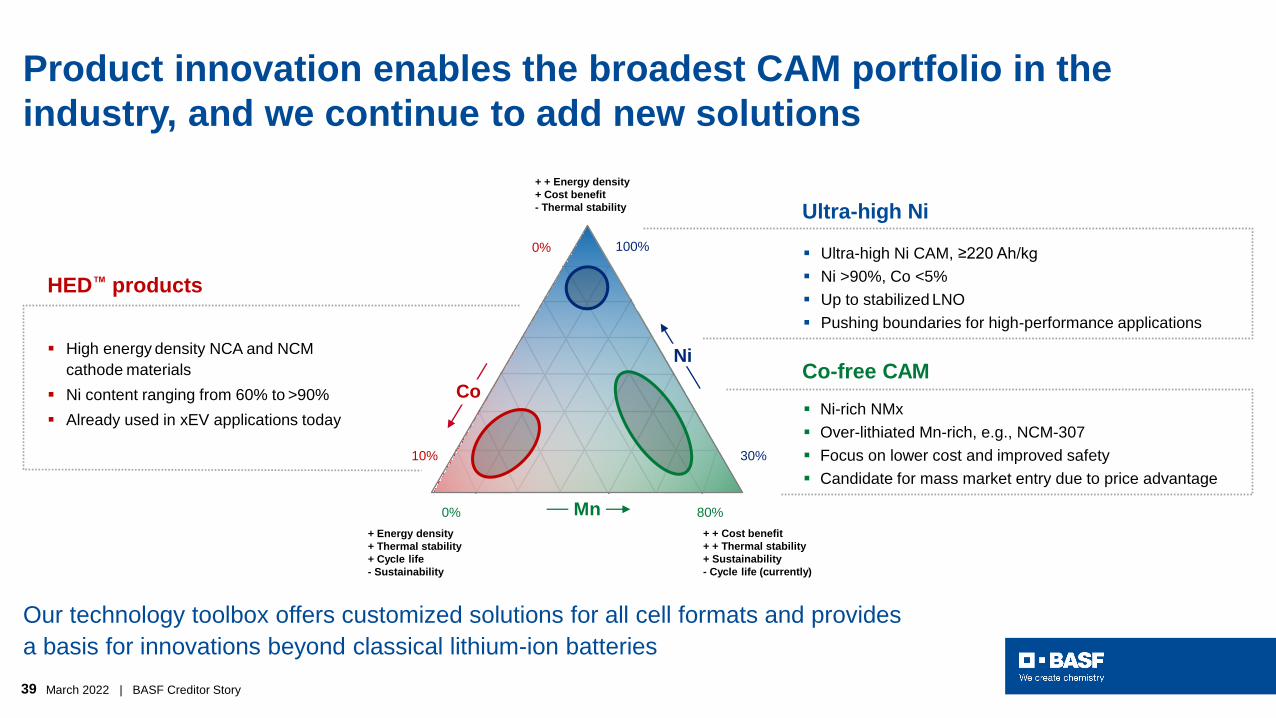
Product innovation enables the broadest CAM portfolio in the
industry, and we continue to add new solutions
▪ High energy density NCA and NCM
cathode materials
▪ Ni content ranging from 60% to >90%
▪ Already used in xEV applications today
▪ Ultra-high Ni CAM, ≥220 Ah/kg
▪ Ni >90%, Co <5%
▪ Up to stabilized LNO
▪ Pushing boundaries for high-performance applications
▪ Ni-rich NMx
▪ Over-lithiated Mn-rich, e.g., NCM-307
▪ Focus on lower cost and improved safety
▪ Candidate for mass market entry due to price advantage
Our technology toolbox offers customized solutions for all cell formats and provides
a basis for innovations beyond classical lithium-ion batteries
HED™ products
Ultra-high Ni
Co-free CAM
10%
0%
30%
100%
0% 80%
Ni
Co
Mn+ Energy density
+ Thermal stability
+ Cycle life
- Sustainability
+ + Cost benefit
+ + Thermal stability
+ Sustainability
- Cycle life (currently)
+ + Energy density
+ Cost benefit
- Thermal stability
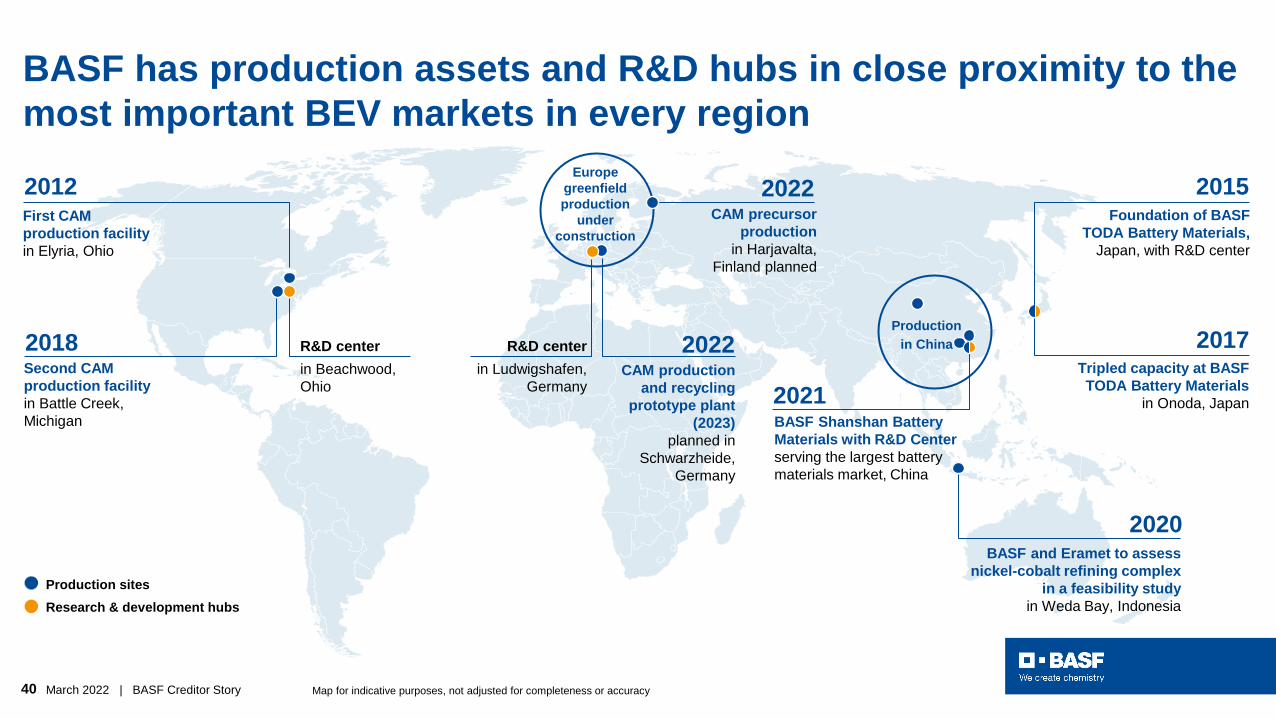
40 March 2022 | BASF Creditor Story
Production sites
Research & development hubs
2018Second CAM
production facility
in Battle Creek,
Michigan
First CAM
production facility
in Elyria, Ohio
2012
R&D center
in Beachwood,
Ohio
Foundation of BASF
TODA Battery Materials,
Japan, with R&D center
Tripled capacity at BASF
TODA Battery Materials
in Onoda, Japan
2017
2015
BASF and Eramet to assess
nickel-cobalt refining complex
in a feasibility study
in Weda Bay, Indonesia
2020
CAM production
and recycling
prototype plant
(2023)
planned in
Schwarzheide,
Germany
2022R&D center
in Ludwigshafen,
Germany
CAM precursor
production
in Harjavalta,
Finland planned
2022Europe
greenfield
production
under
construction
2021BASF Shanshan Battery
Materials with R&D Center
serving the largest battery
materials market, China
Production
in China
BASF has production assets and R&D hubs in close proximity to the
most important BEV markets in every region
Map for indicative purposes, not adjusted for completeness or accuracy
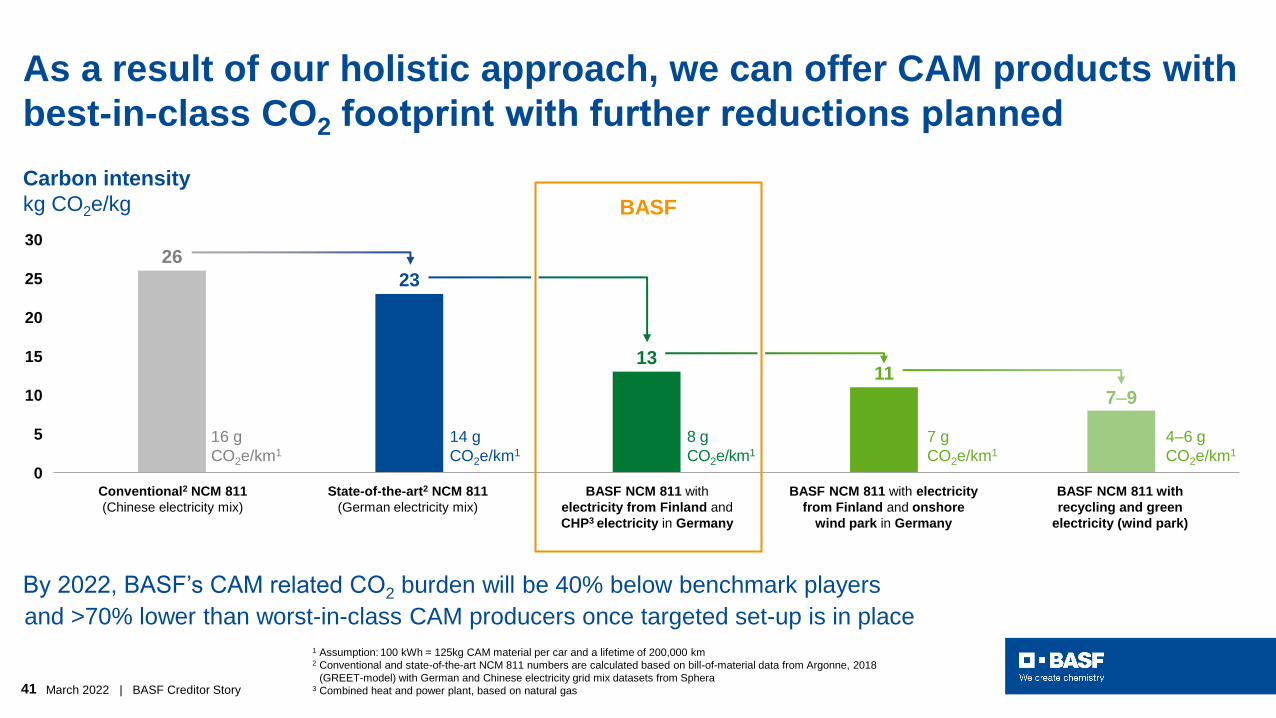
41 March 2022 | BASF Creditor Story
As a result of our holistic approach, we can offer CAM products with
best-in-class CO2 footprint with further reductions planned
State-of-the-art2 NCM 811
(German electricity mix)
BASF NCM 811 with electricity
from Finland and onshore
wind park in Germany
Conventional2 NCM 811
(Chinese electricity mix)
BASF NCM 811 with
recycling and green
electricity (wind park)
26
23
1311
30
10
0
20
5
15
25
7–9
16 g
CO2e/km1
14 g
CO2e/km1
8 g
CO2e/km1
7 g
CO2e/km1
1 Assumption: 100 kWh = 125kg CAM material per car and a lifetime of 200,000 km2 Conventional and state-of-the-art NCM 811 numbers are calculated based on bill-of-material data from Argonne, 20182 (GREET-model) with German and Chinese electricity grid mix datasets from Sphera3 Combined heat and power plant, based on natural gas
Carbon intensity
kg CO2e/kg
BASF NCM 811 with
electricity from Finland and
CHP3 electricity in Germany
4–6 g
CO2e/km1
By 2022, BASF’s CAM related CO2 burden will be 40% below benchmark players
and >70% lower than worst-in-class CAM producers once targeted set-up is in place
BASF
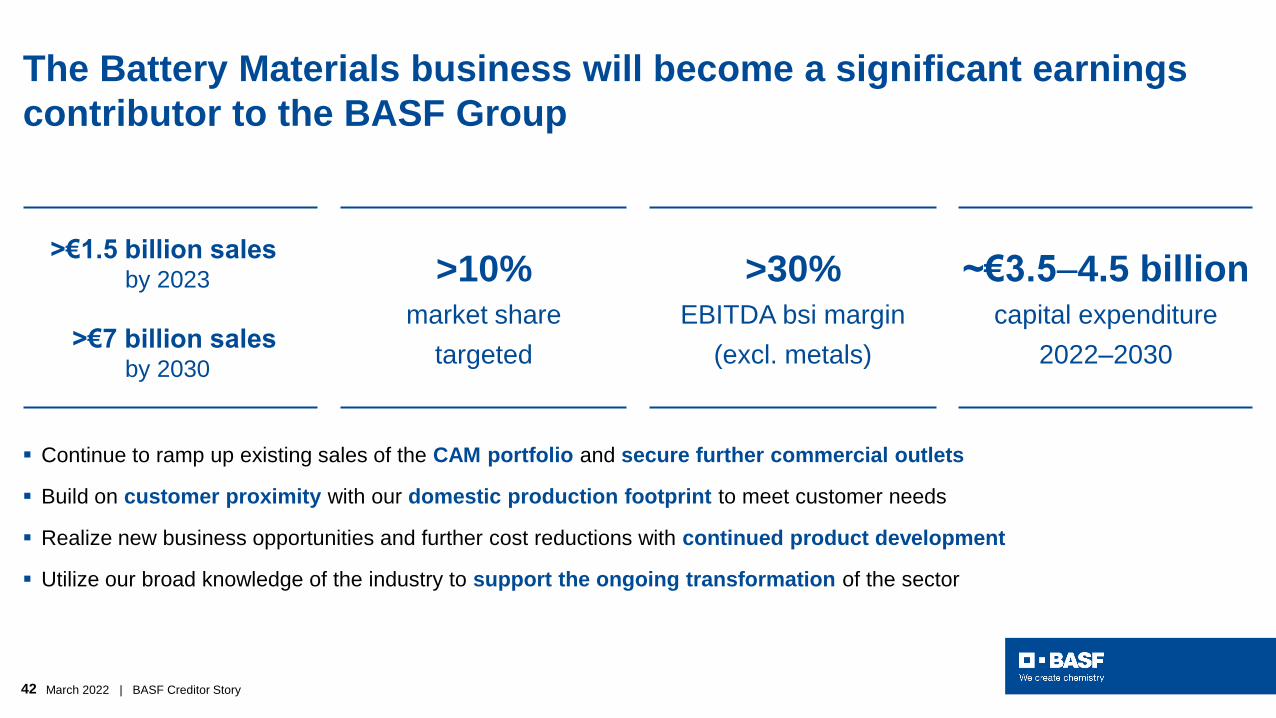
42 March 2022 | BASF Creditor Story
The Battery Materials business will become a significant earnings
contributor to the BASF Group
▪ Continue to ramp up existing sales of the CAM portfolio and secure further commercial outlets
▪ Build on customer proximity with our domestic production footprint to meet customer needs
▪ Realize new business opportunities and further cost reductions with continued product development
▪ Utilize our broad knowledge of the industry to support the ongoing transformation of the sector
>€1.5 billion sales by 2023
>€7 billion salesby 2030
>10%market share
targeted
>30%EBITDA bsi margin
(excl. metals)
~€3.5–4.5 billioncapital expenditure
2022–2030
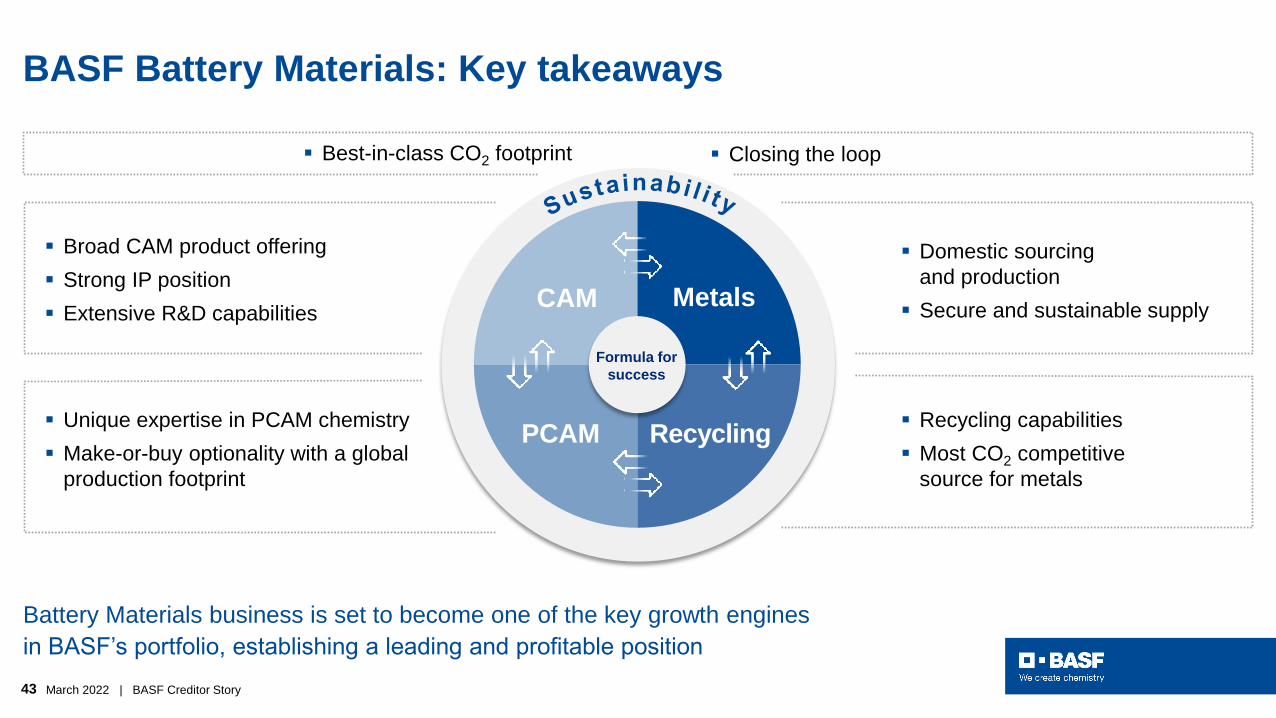
43 March 2022 | BASF Creditor Story
BASF Battery Materials: Key takeaways
Battery Materials business is set to become one of the key growth engines
in BASF’s portfolio, establishing a leading and profitable position
▪ Domestic sourcing
and production
▪ Secure and sustainable supply
▪ Unique expertise in PCAM chemistry
▪ Make-or-buy optionality with a global
production footprint
▪ Broad CAM product offering
▪ Strong IP position
▪ Extensive R&D capabilities
▪ Recycling capabilities
▪ Most CO2 competitive
source for metals
▪ Best-in-class CO2 footprint ▪ Closing the loop
RecyclingPCAM
MetalsCAM
Formula for
success
44 March 2022 | BASF Creditor Story
Agenda
1At a glance
4Battery materials driving
electromobility and future
growth
4Battery materials driving electromobility and future growth
5Pushing the transition to a sustainable economy
2Strategy implementation in full swing
6Reporting and financing highlights
3Unique position to capture growth in Asia
45 March 2022 | BASF Creditor Story
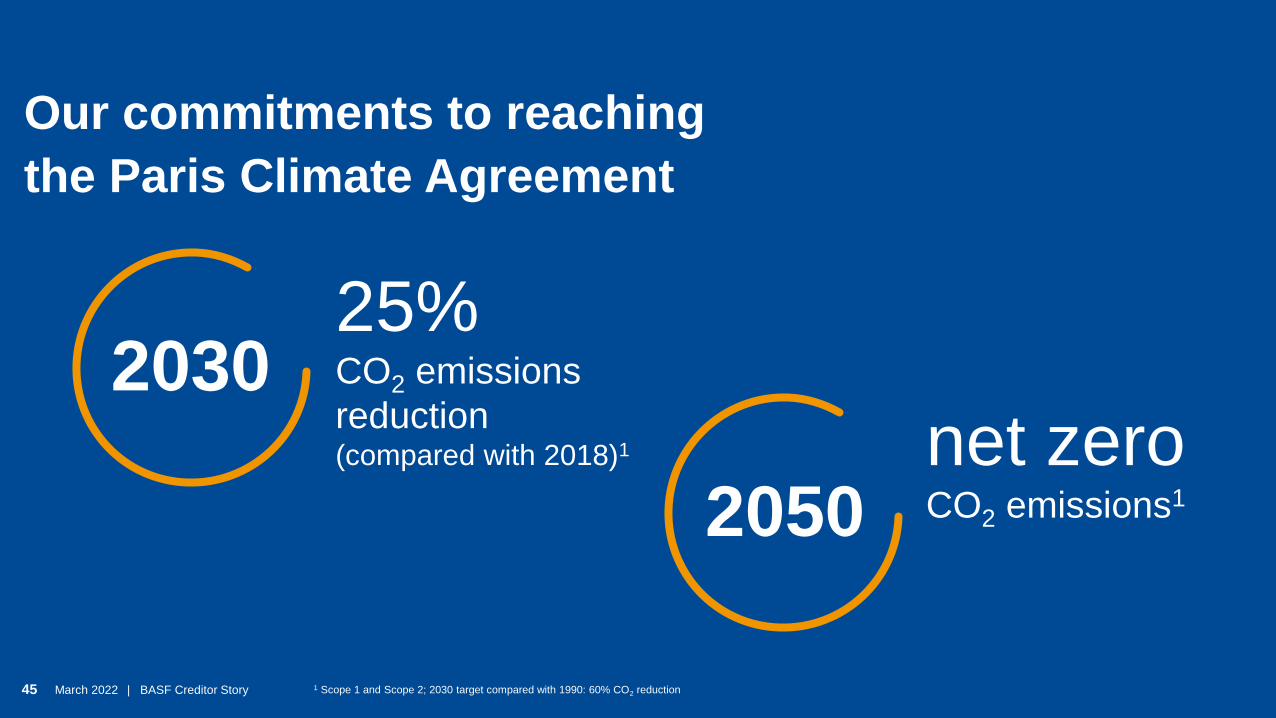
Our commitments to reaching
the Paris Climate Agreement
203025% CO2 emissions
reduction (compared with 2018)1
2050net zeroCO2 emissions1
1 Scope 1 and Scope 2; 2030 target compared with 1990: 60% CO2 reduction45 March 2022 | BASF Creditor Story
46 March 2022 | BASF Creditor Story
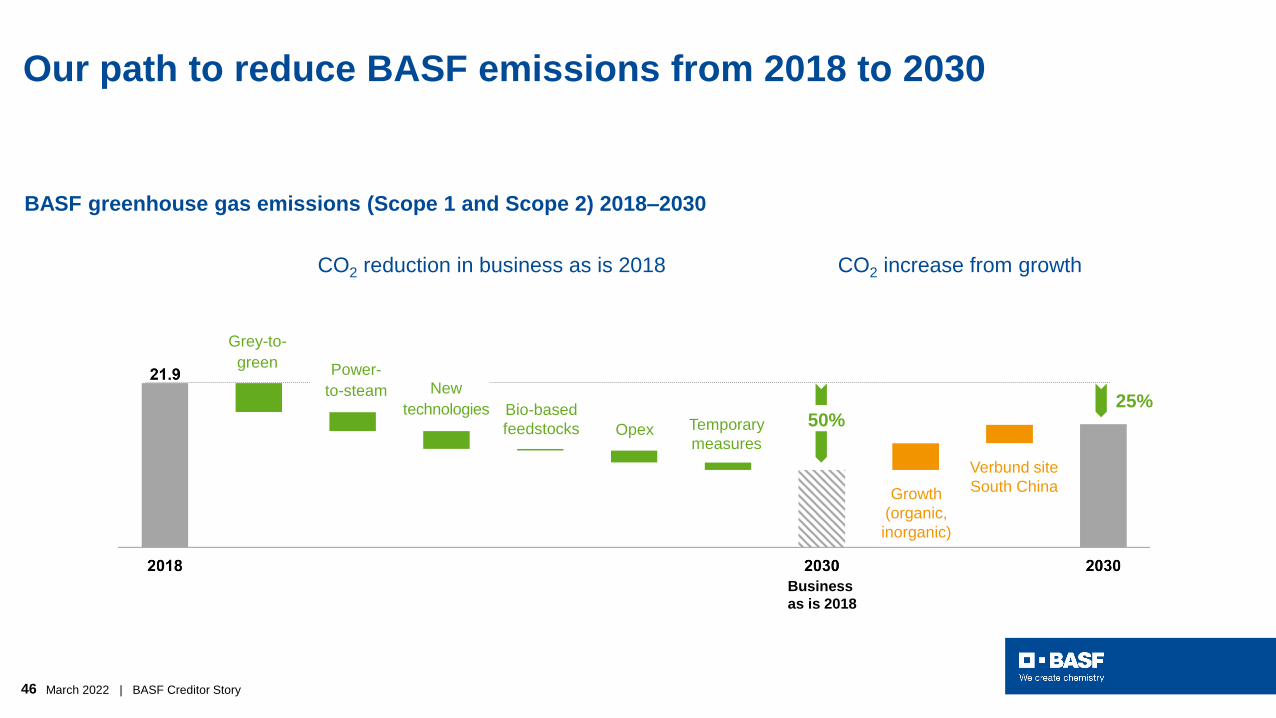
Our path to reduce BASF emissions from 2018 to 2030
BASF greenhouse gas emissions (Scope 1 and Scope 2) 2018–2030
50%25%
Business
as is 2018
Growth
(organic,
inorganic)
Verbund site
South China
Grey-to-
green Power-
to-steam
Temporary
measures
CO2 increase from growthCO2 reduction in business as is 2018
Opex
New
technologies Bio-based
feedstocks
47 March 2022 | BASF Creditor Story
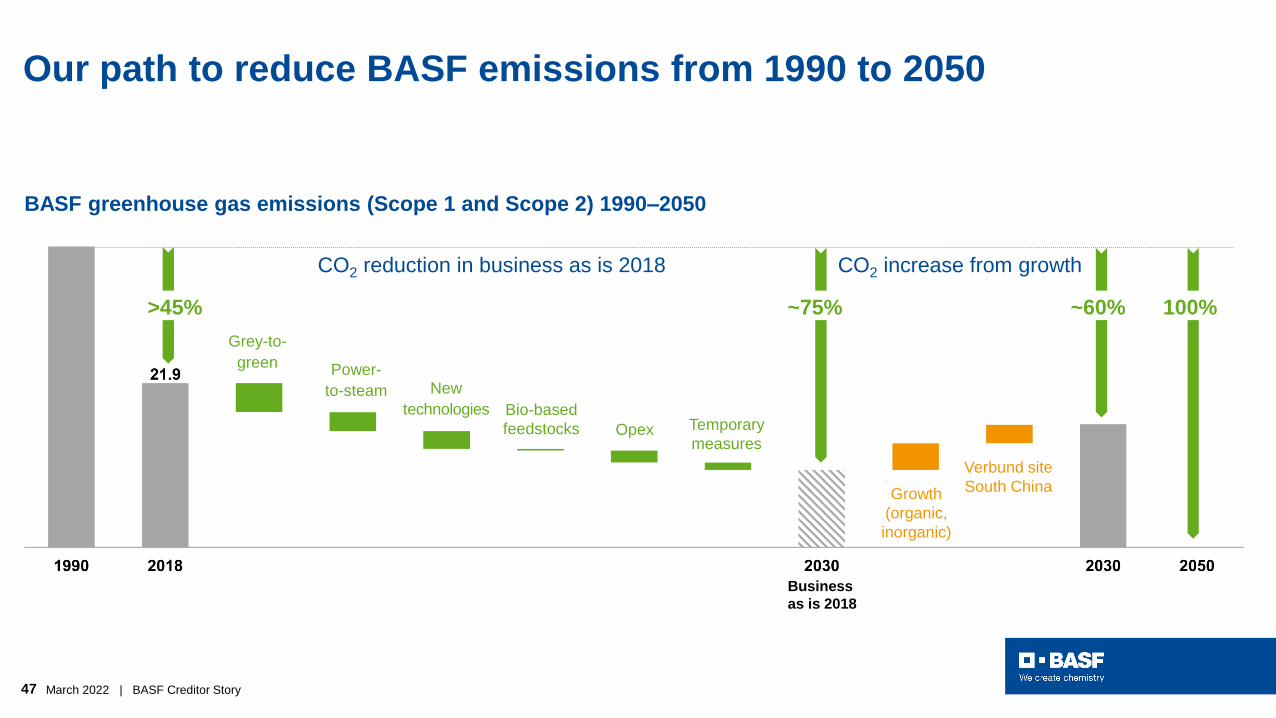
Our path to reduce BASF emissions from 1990 to 2050
BASF greenhouse gas emissions (Scope 1 and Scope 2) 1990–2050
>45% ~75% ~60% 100%
CO2 reduction in business as is 2018 CO2 increase from growth
Business
as is 2018
Growth
(organic,
inorganic)
Verbund site
South China
Grey-to-
green
Temporary
measuresOpex
New
technologies Bio-based
feedstocks
Power-
to-steam
48 March 2022 | BASF Creditor Story
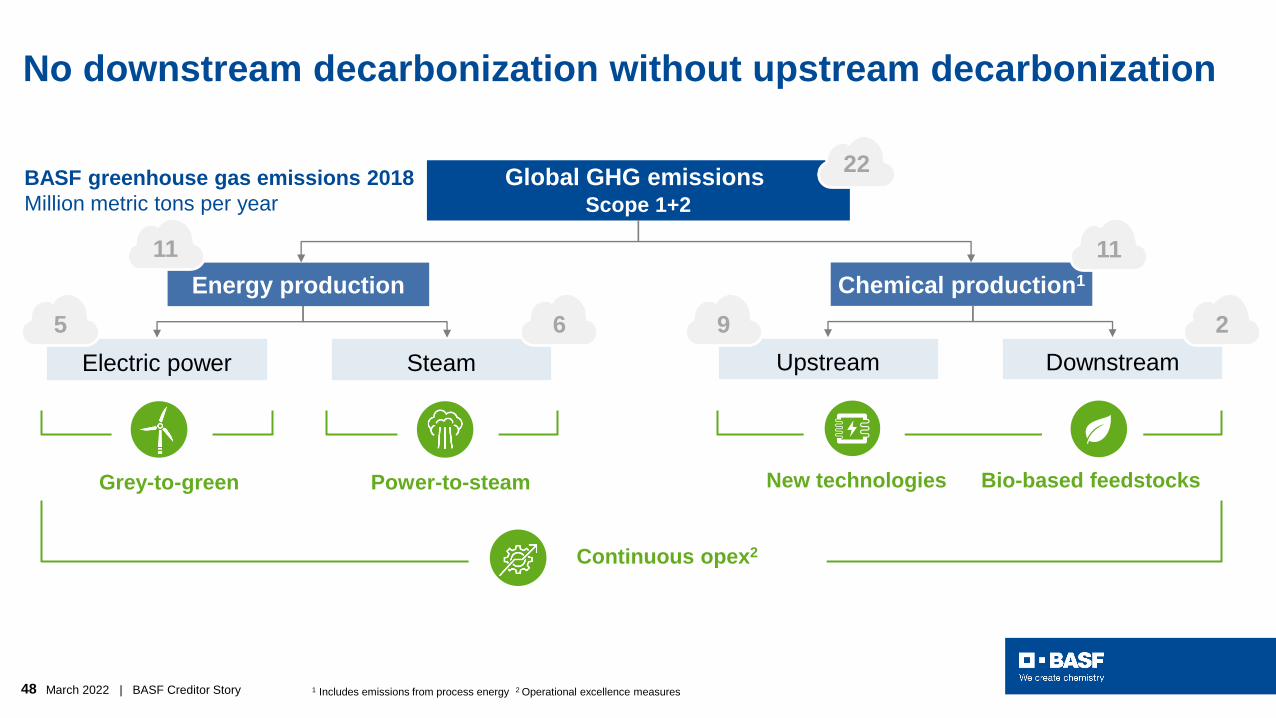
No downstream decarbonization without upstream decarbonization
Global GHG emissionsScope 1+2
Electric power Steam Upstream Downstream
22
965 2
Grey-to-green
Continuous opex2
New technologiesPower-to-steam
1 Includes emissions from process energy 2 Operational excellence measures
Bio-based feedstocks
BASF greenhouse gas emissions 2018
Million metric tons per year
Energy production
11
Chemical production1
11
49 March 2022 | BASF Creditor Story
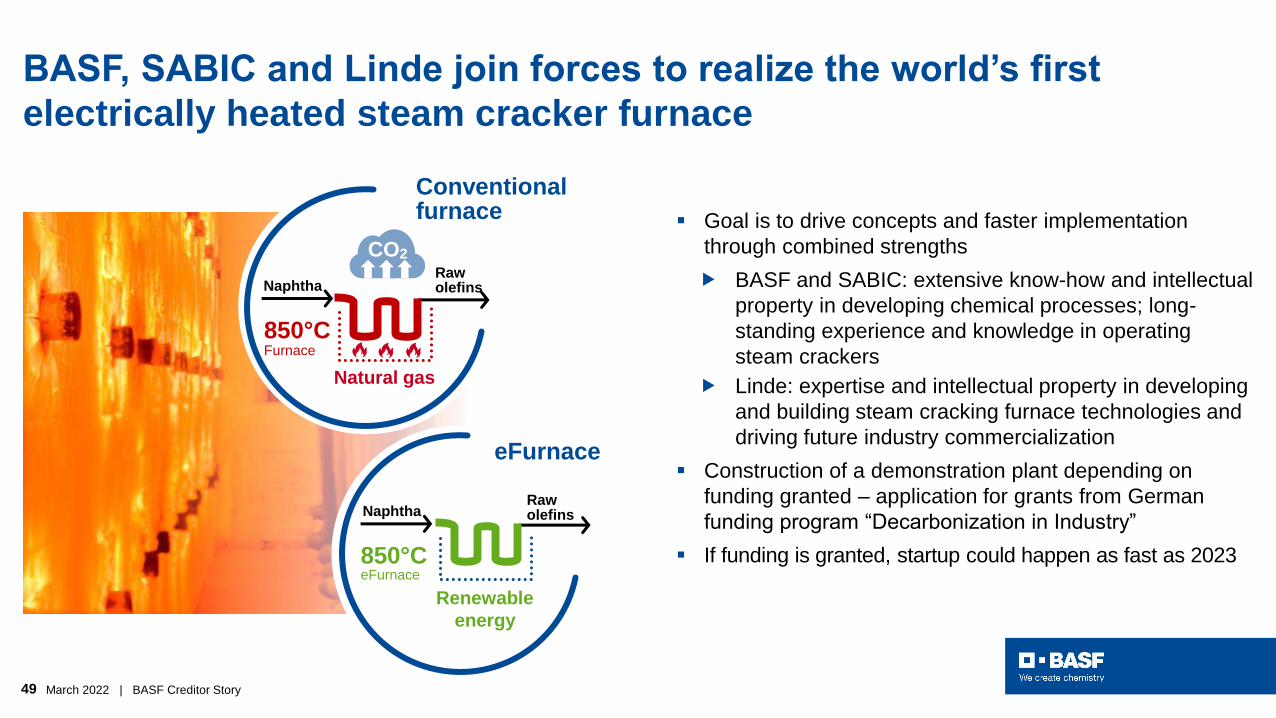
BASF, SABIC and Linde join forces to realize the world’s first
electrically heated steam cracker furnace
▪ Goal is to drive concepts and faster implementation
through combined strengths
BASF and SABIC: extensive know-how and intellectual
property in developing chemical processes; long-
standing experience and knowledge in operating
steam crackers
Linde: expertise and intellectual property in developing
and building steam cracking furnace technologies and
driving future industry commercialization
▪ Construction of a demonstration plant depending on
funding granted – application for grants from German
funding program “Decarbonization in Industry”
▪ If funding is granted, startup could happen as fast as 2023
Conventionalfurnace
eFurnace
CO2
Raw olefinsNaphtha
850°CFurnace
Natural gas
Renewable
energy
Naphtha Raw olefins
850°CeFurnace
50 March 2022 | BASF Creditor Story
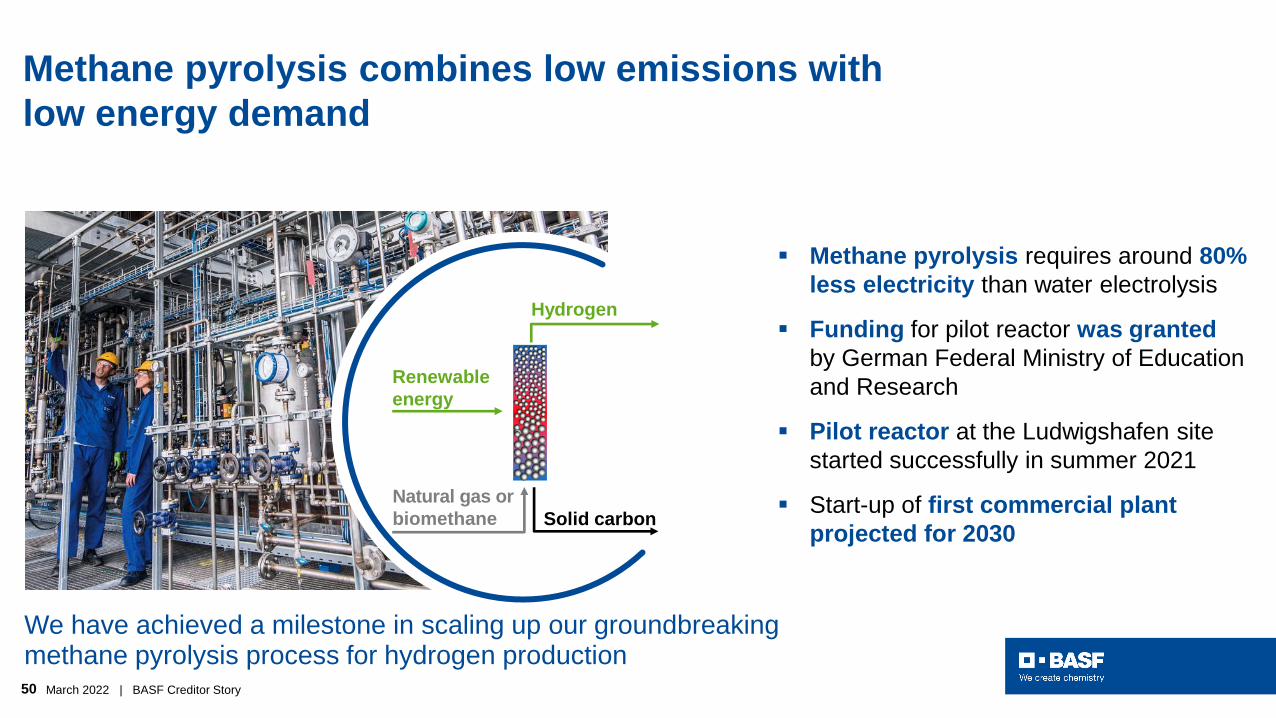
Methane pyrolysis combines low emissions with
low energy demand
▪ Methane pyrolysis requires around 80%
less electricity than water electrolysis
▪ Funding for pilot reactor was granted
by German Federal Ministry of Education
and Research
▪ Pilot reactor at the Ludwigshafen site
started successfully in summer 2021
▪ Start-up of first commercial plant
projected for 2030
Natural gas or
biomethane
Renewable
energy
Hydrogen
Solid carbon
We have achieved a milestone in scaling up our groundbreakingmethane pyrolysis process for hydrogen production
51 March 2022 | BASF Creditor Story
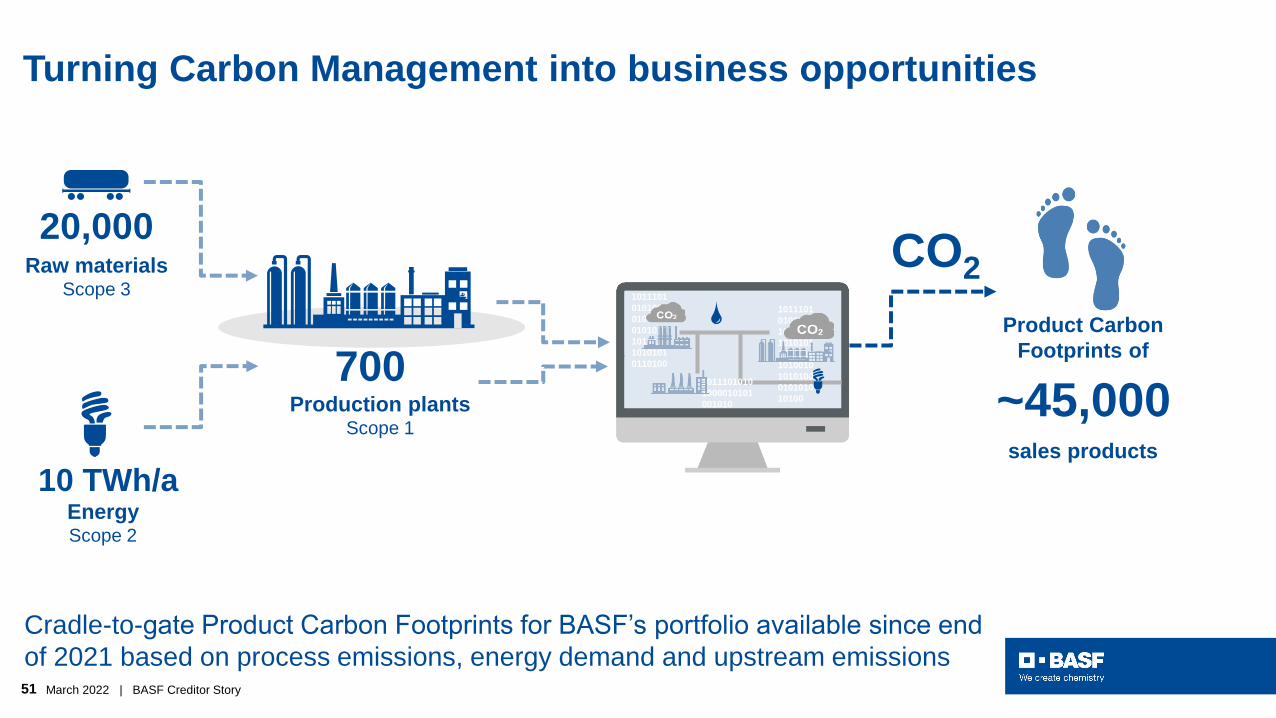
Raw materialsScope 3
20,000
Production plantsScope 1
700Product Carbon
Footprints of
sales products
~45,000
CO2
EnergyScope 2
10 TWh/a
Cradle-to-gate Product Carbon Footprints for BASF’s portfolio available since end
of 2021 based on process emissions, energy demand and upstream emissions
Turning Carbon Management into business opportunities
1011101
0101000
0101010
0101010
1010111
1010101
0110100
1011101010
1000010101
001010
1011101
0101010
1011110
1010101
1010010
1010010
1010100
0101010
10100

52 March 2022 | BASF Creditor Story
What we expect from our suppliers:
Transparency on and reduction of CO2 emissions
BASF will work all levers to reduce CO2 emissions
▪ BASF is establishing certified, full CO2 tracing
(Product Carbon Footprint) and needs
transparency from its suppliers for this
▪ To support its suppliers and the industry,
BASF will share its knowledge to create an
international standard for CO2 transparency tools
▪ BASF will work together with its suppliers and
expects them to reduce the CO2 footprint
of their products
Raw materials
Extraction
1Scope 3 upstream
TransportProcessing
CO2
53 March 2022 | BASF Creditor Story
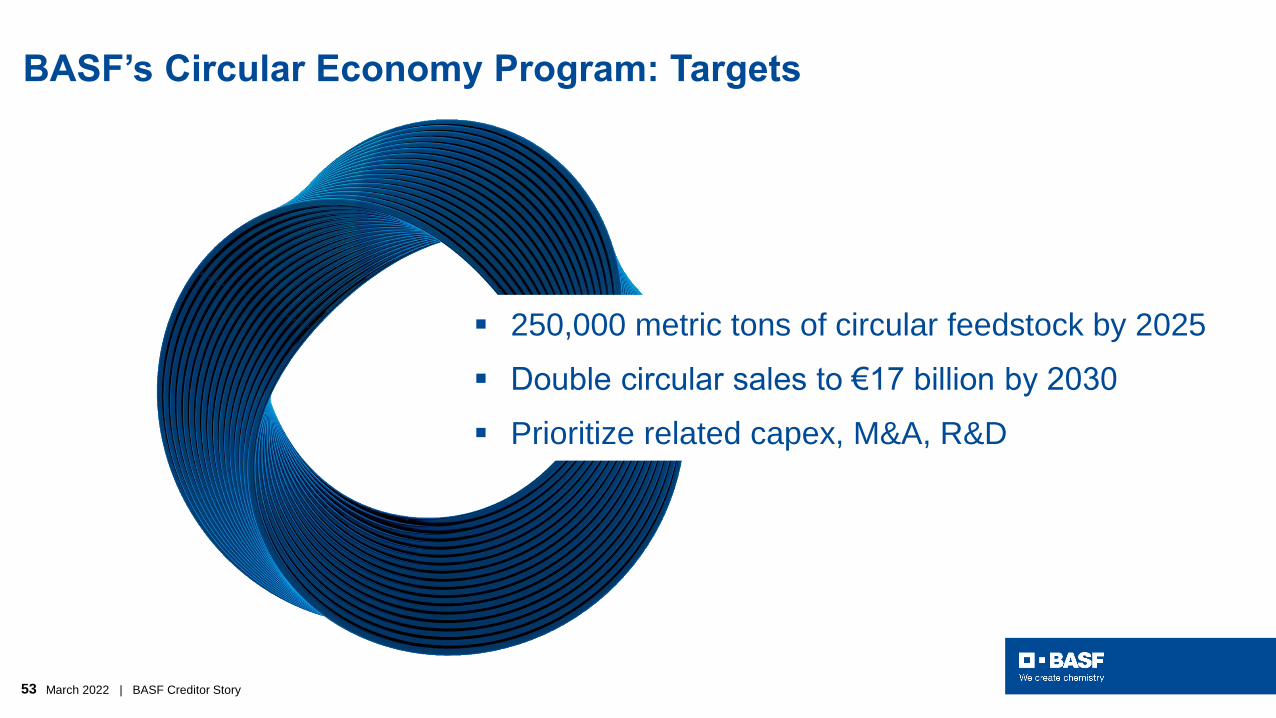
BASF’s Circular Economy Program: Targets
▪ 250,000 metric tons of circular feedstock by 2025
▪ Double circular sales to €17 billion by 2030
▪ Prioritize related capex, M&A, R&D
54 March 2022 | BASF Creditor Story
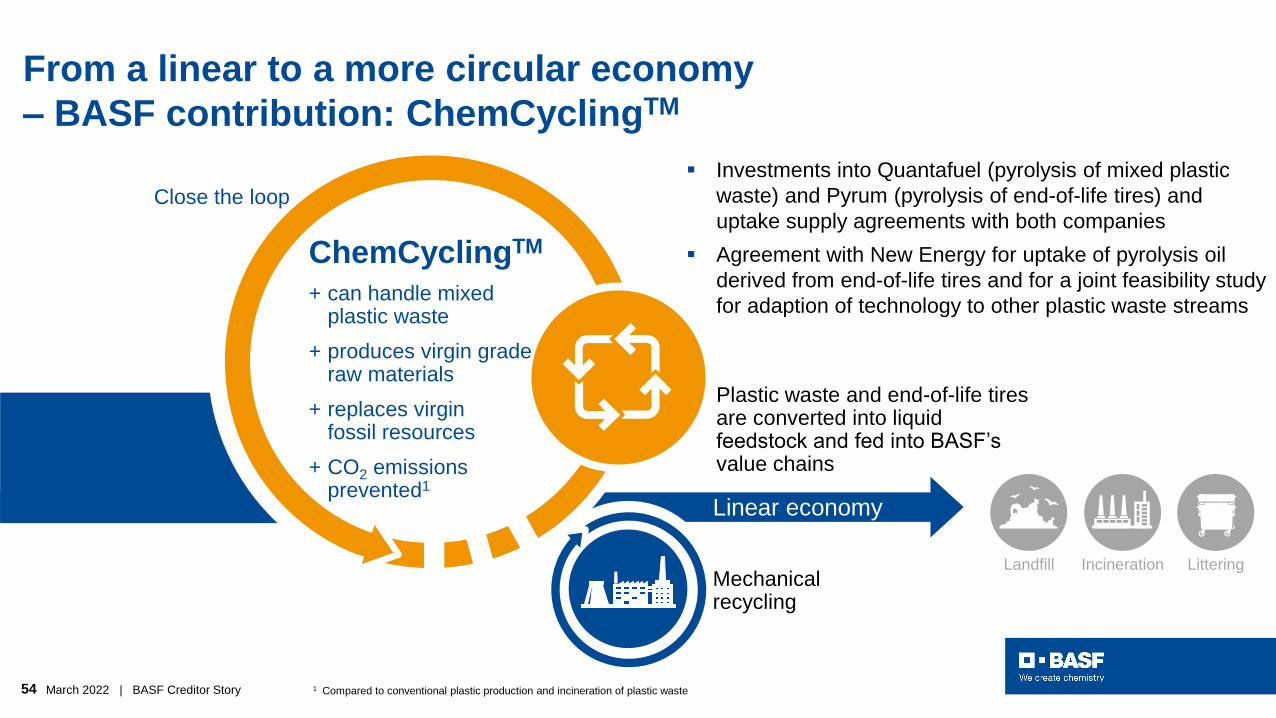
From a linear to a more circular economy
– BASF contribution: ChemCyclingTM
Incineration LitteringLandfill
Close the loop
Linear economy
Mechanicalrecycling
ChemCyclingTM
+ can handle mixed plastic waste
+ produces virgin graderaw materials
+ replaces virgin fossil resources
+ CO2 emissions prevented1
Plastic waste and end-of-life tires are converted into liquid feedstock and fed into BASF’s value chains
▪ Investments into Quantafuel (pyrolysis of mixed plastic
waste) and Pyrum (pyrolysis of end-of-life tires) and
uptake supply agreements with both companies
▪ Agreement with New Energy for uptake of pyrolysis oil
derived from end-of-life tires and for a joint feasibility study
for adaption of technology to other plastic waste streams
1 Compared to conventional plastic production and incineration of plastic waste
55 March 2022 | BASF Creditor Story
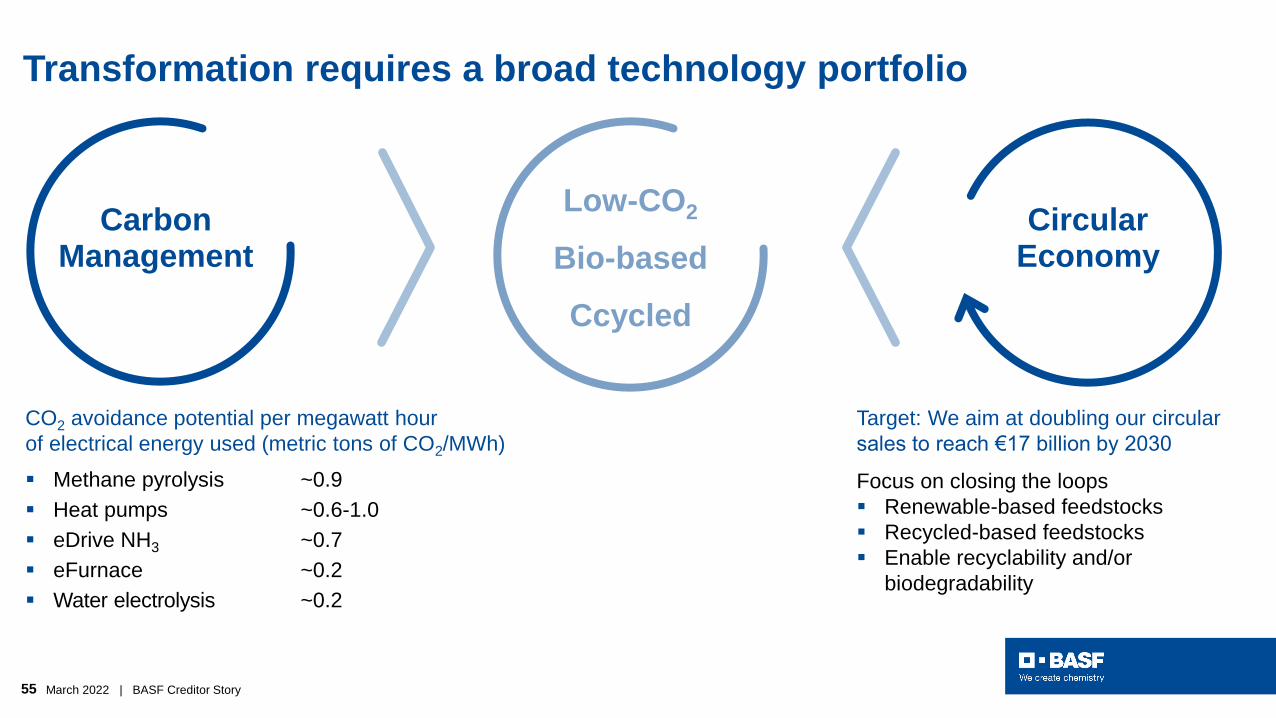
Transformation requires a broad technology portfolio
Low-CO2
Bio-based
Ccycled
CircularEconomy
Carbon Management
▪ Methane pyrolysis ~0.9
▪ Heat pumps ~0.6-1.0
▪ eDrive NH3 ~0.7
▪ eFurnace ~0.2
▪ Water electrolysis ~0.2
CO2 avoidance potential per megawatt hour
of electrical energy used (metric tons of CO2/MWh)
Target: We aim at doubling our circular
sales to reach €17 billion by 2030
Focus on closing the loops
▪ Renewable-based feedstocks
▪ Recycled-based feedstocks
▪ Enable recyclability and/or
biodegradability
56 March 2022 | BASF Creditor Story
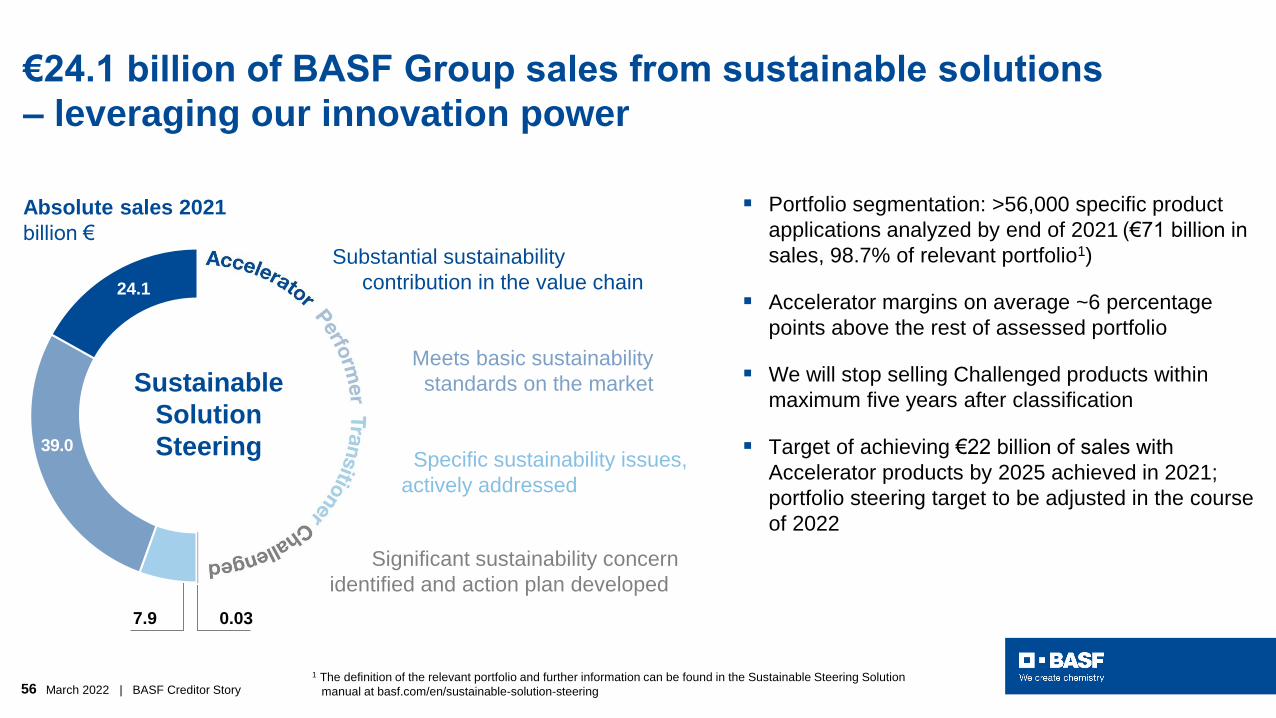
€24.1 billion of BASF Group sales from sustainable solutions
– leveraging our innovation power
▪ Portfolio segmentation: >56,000 specific product
applications analyzed by end of 2021 (€71 billion in
sales, 98.7% of relevant portfolio1)
▪ Accelerator margins on average ~6 percentage
points above the rest of assessed portfolio
▪ We will stop selling Challenged products within
maximum five years after classification
▪ Target of achieving €22 billion of sales with
Accelerator products by 2025 achieved in 2021;
portfolio steering target to be adjusted in the course
of 2022
1 The definition of the relevant portfolio and further information can be found in the Sustainable Steering Solution
manual at basf.com/en/sustainable-solution-steering
Sustainable
Solution
Steering
Substantial sustainability
contribution in the value chain
Meets basic sustainability
standards on the market
Specific sustainability issues,
actively addressed
Significant sustainability concern
identified and action plan developed
Absolute sales 2021
billion €
24.1
39.0
7.9 0.03
57 March 2022 | BASF Creditor Story
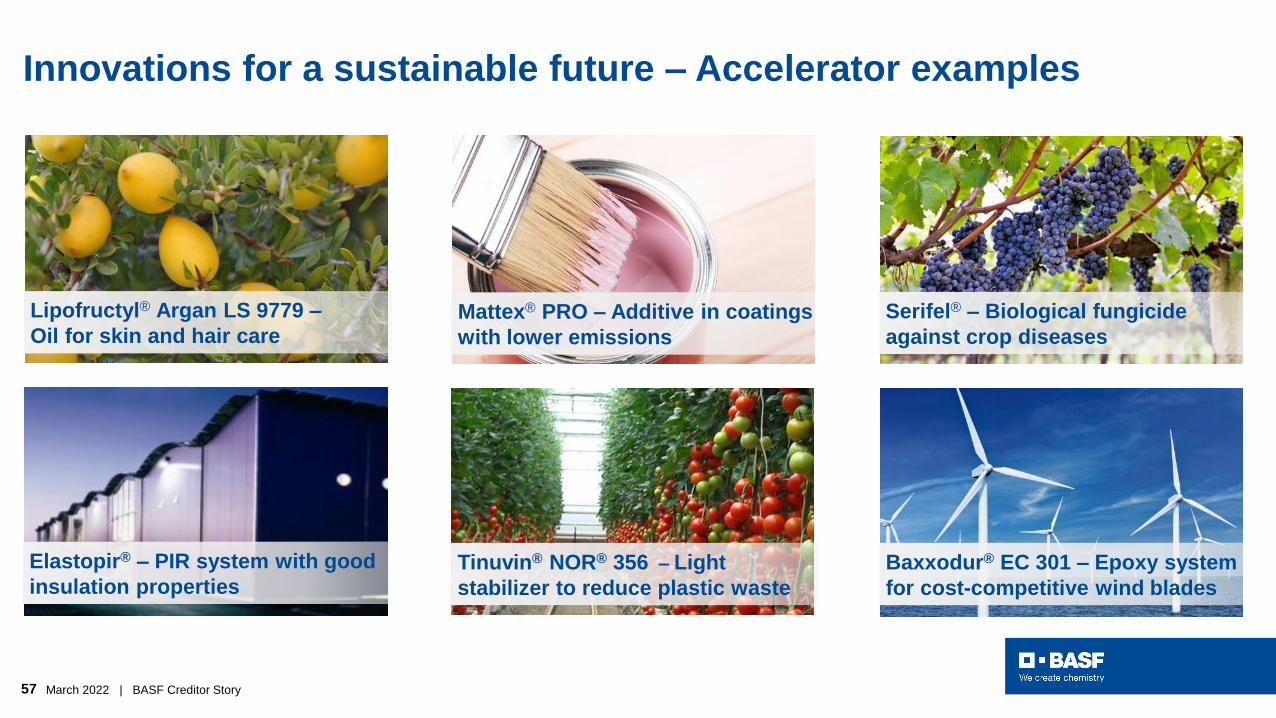
Innovations for a sustainable future – Accelerator examples
Baxxodur® EC 301 – Epoxy system
for cost-competitive wind blades
Mattex® PRO – Additive in coatings
with lower emissions
Serifel® – Biological fungicide
against crop diseases
Lipofructyl® Argan LS 9779 –
Oil for skin and hair care
Tinuvin® NOR® 356 – Light
stabilizer to reduce plastic waste
Elastopir® – PIR system with good
insulation properties
58 March 2022 | BASF Creditor Story
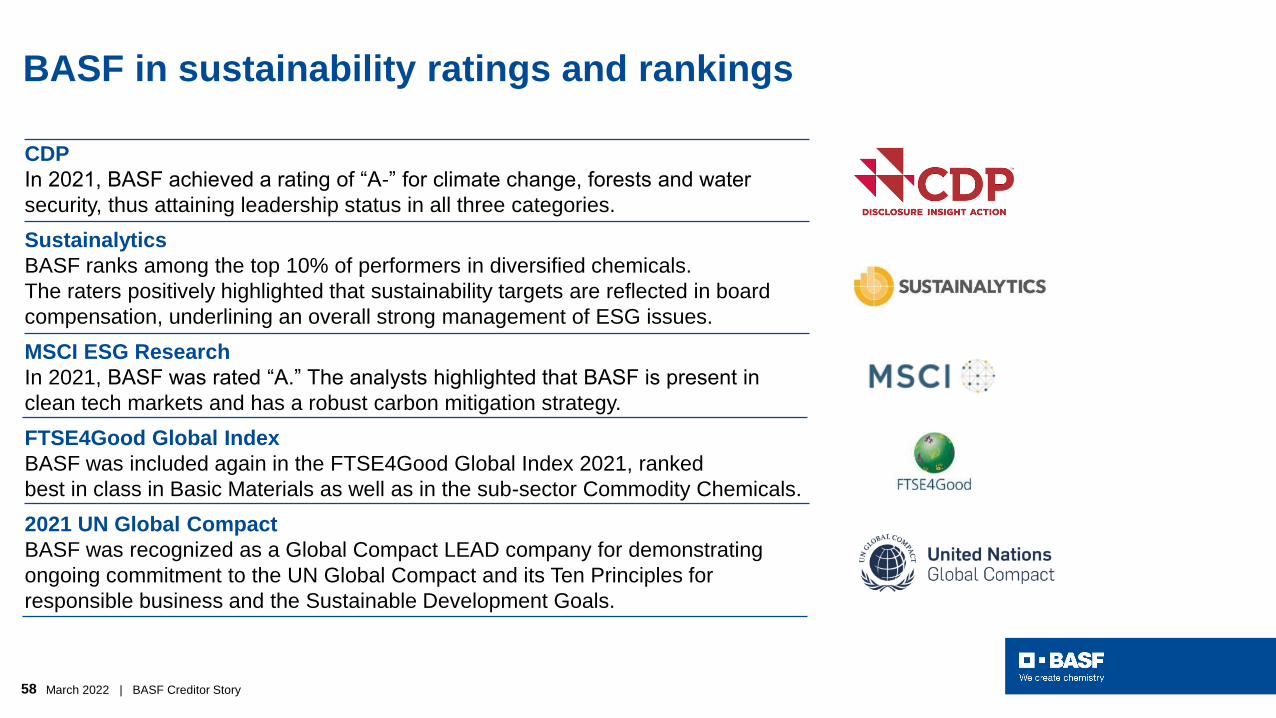
BASF in sustainability ratings and rankings
CDP
In 2021, BASF achieved a rating of “A-” for climate change, forests and water
security, thus attaining leadership status in all three categories.
Sustainalytics
BASF ranks among the top 10% of performers in diversified chemicals.
The raters positively highlighted that sustainability targets are reflected in board
compensation, underlining an overall strong management of ESG issues.
MSCI ESG Research
In 2021, BASF was rated “A.” The analysts highlighted that BASF is present in
clean tech markets and has a robust carbon mitigation strategy.
FTSE4Good Global Index
BASF was included again in the FTSE4Good Global Index 2021, ranked
best in class in Basic Materials as well as in the sub-sector Commodity Chemicals.
2021 UN Global Compact
BASF was recognized as a Global Compact LEAD company for demonstrating
ongoing commitment to the UN Global Compact and its Ten Principles for
responsible business and the Sustainable Development Goals.
59 March 2022 | BASF Creditor Story
Agenda
1At a glance
4Battery materials driving
electromobility and future
growth
4Battery materials driving electromobility and future growth
5Pushing the transition to a sustainable economy
2Strategy implementation in full swing
6Reporting and financing highlights
3Unique position to capture growth in Asia
60 March 2022 | BASF Creditor Story
BASF
Group Chemicals Materials
Industrial
Solutions
Surface
Technologies
Nutrition
& Care
Agricultural
Solutions Other
BASF
Group
Sales
FY 2021 vs.
FY 2020
Million €
EBIT before
special items
FY 2021 vs.
FY 2020
Million €
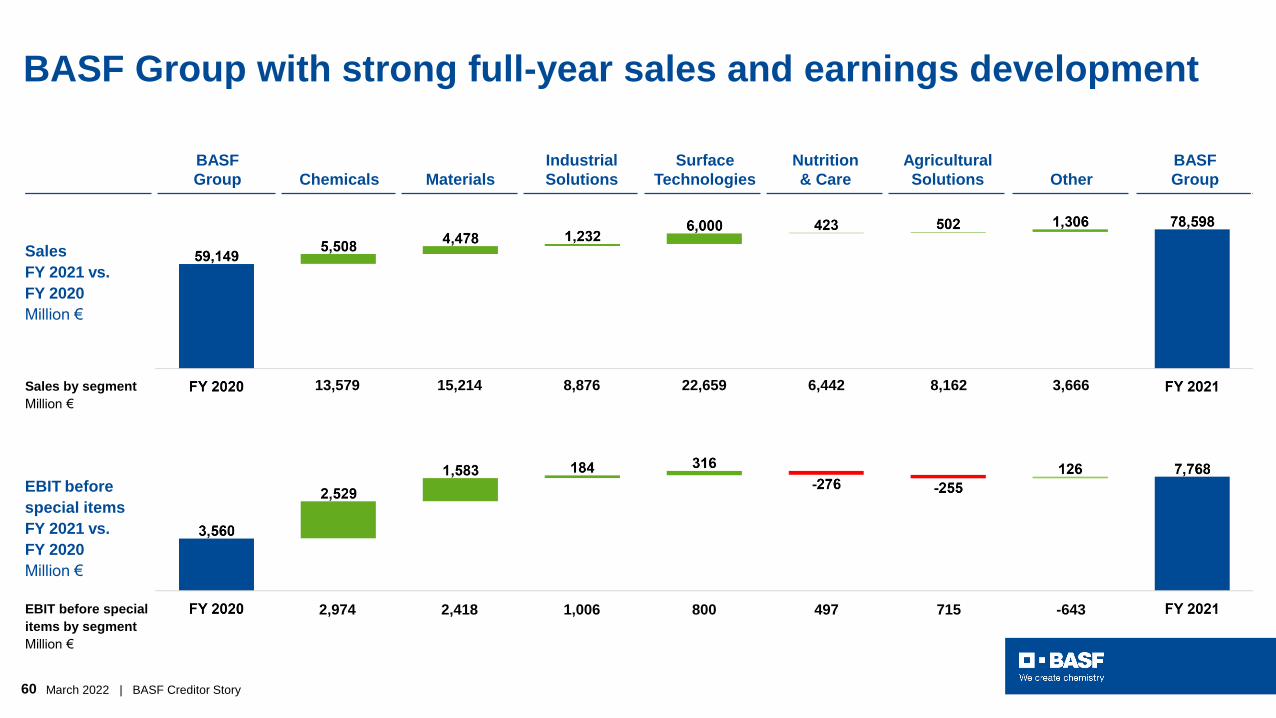
BASF Group with strong full-year sales and earnings development
2,974 2,418 1,006 800 497 715 -643
13,579 15,214 8,876 22,659 6,442 8,162 3,666Sales by segment
Million €
EBIT before special
items by segment
Million €
61 March 2022 | BASF Creditor Story
BASF
Group Chemicals Materials
Industrial
Solutions
Surface
Technologies
Nutrition
& Care
Agricultural
Solutions Other
BASF
Group
Sales
Q4 2021 vs.
Q4 2020
Million €
EBIT before
special items
Q4 2021 vs.
Q4 2020
Million €
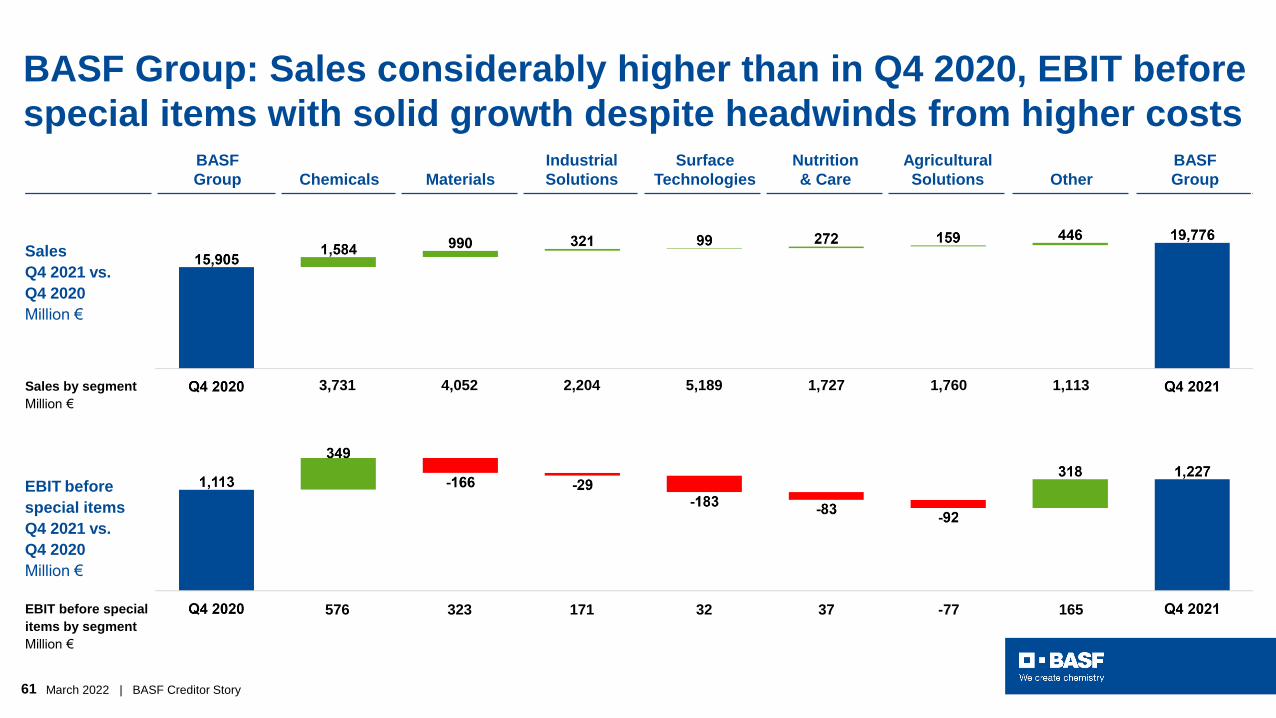
BASF Group: Sales considerably higher than in Q4 2020, EBIT before
special items with solid growth despite headwinds from higher costs
576 323 171 32 37 -77 165
3,731 4,052 2,204 5,189 1,727 1,760 1,113Sales by segment
Million €
EBIT before special
items by segment
Million €
62 March 2022 | BASF Creditor Story
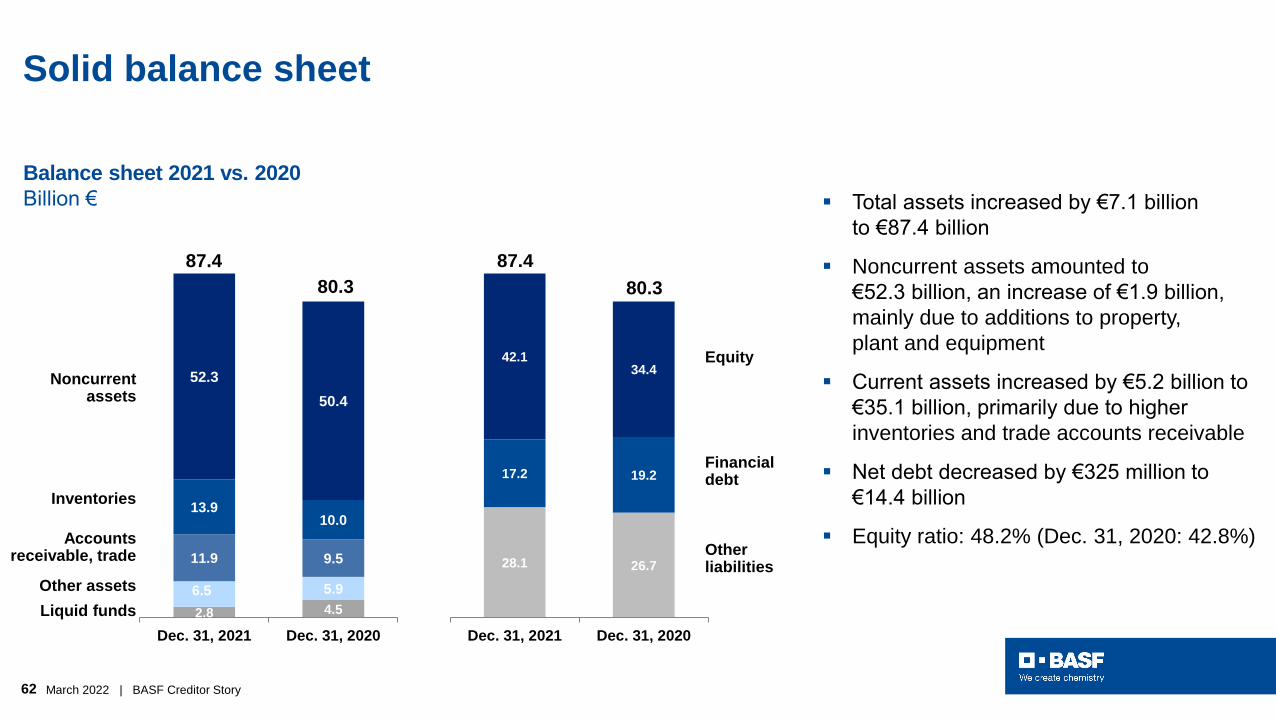
Solid balance sheet
Balance sheet 2021 vs. 2020
Billion €
Liquid funds
Accountsreceivable, trade
Noncurrentassets
Inventories
Other assets
2.8 4.5
6.5 5.9
11.9 9.5
13.910.0
52.3
50.4
Dec. 31, 2021 Dec. 31, 2020
80.3
87.4
Otherliabilities
Financialdebt
Equity
28.1 26.7
17.2 19.2
42.134.4
Dec. 31, 2021 Dec. 31, 2020
80.3
87.4
▪ Total assets increased by €7.1 billion
to €87.4 billion
▪ Noncurrent assets amounted to
€52.3 billion, an increase of €1.9 billion,
mainly due to additions to property,
plant and equipment
▪ Current assets increased by €5.2 billion to
€35.1 billion, primarily due to higher
inventories and trade accounts receivable
▪ Net debt decreased by €325 million to
€14.4 billion
▪ Equity ratio: 48.2% (Dec. 31, 2020: 42.8%)
63 March 2022 | BASF Creditor Story
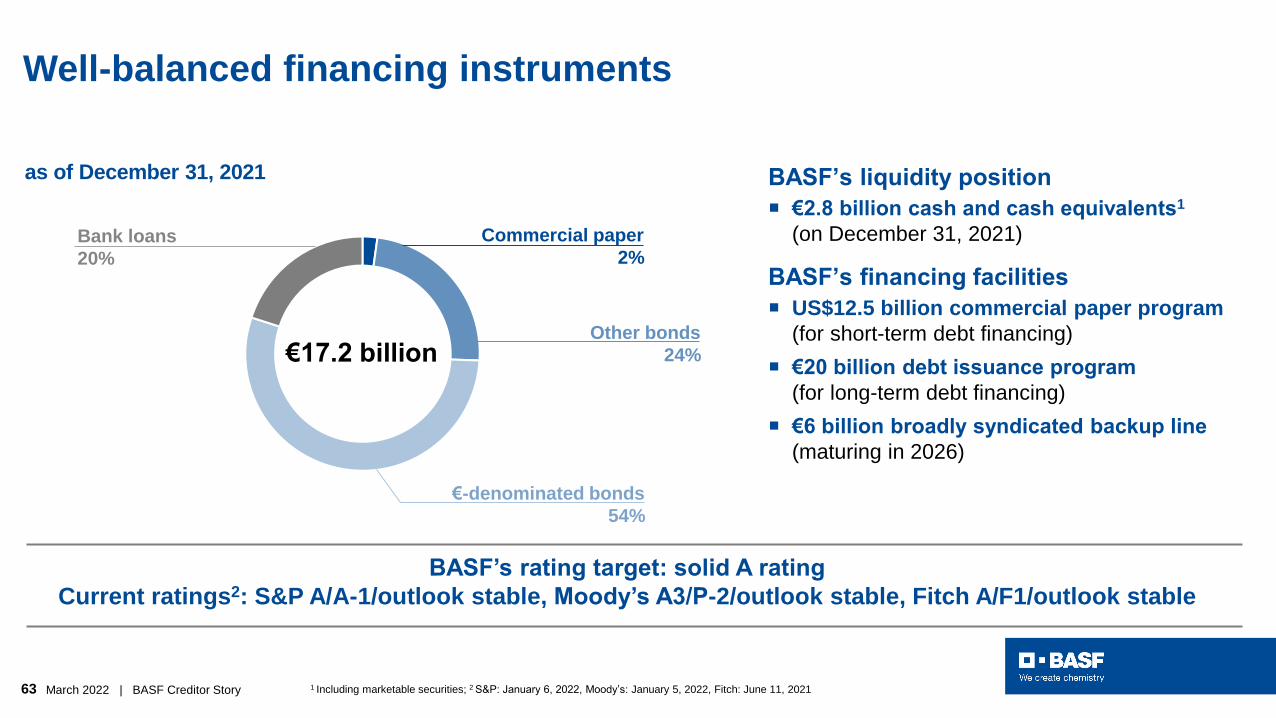
Well-balanced financing instruments
1 Including marketable securities; 2 S&P: January 6, 2022, Moody’s: January 5, 2022, Fitch: June 11, 2021
BASF’s liquidity position
€2.8 billion cash and cash equivalents1
(on December 31, 2021)
BASF’s financing facilities
US$12.5 billion commercial paper program
(for short-term debt financing)
€20 billion debt issuance program
(for long-term debt financing)
€6 billion broadly syndicated backup line
(maturing in 2026)
BASF’s rating target: solid A rating
Current ratings2: S&P A/A-1/outlook stable, Moody’s A3/P-2/outlook stable, Fitch A/F1/outlook stable
as of December 31, 2021
€17.2 billion
Bank loans
20%
Other bonds
24%
€-denominated bonds
54%
Commercial paper
2%
64 March 2022 | BASF Creditor Story
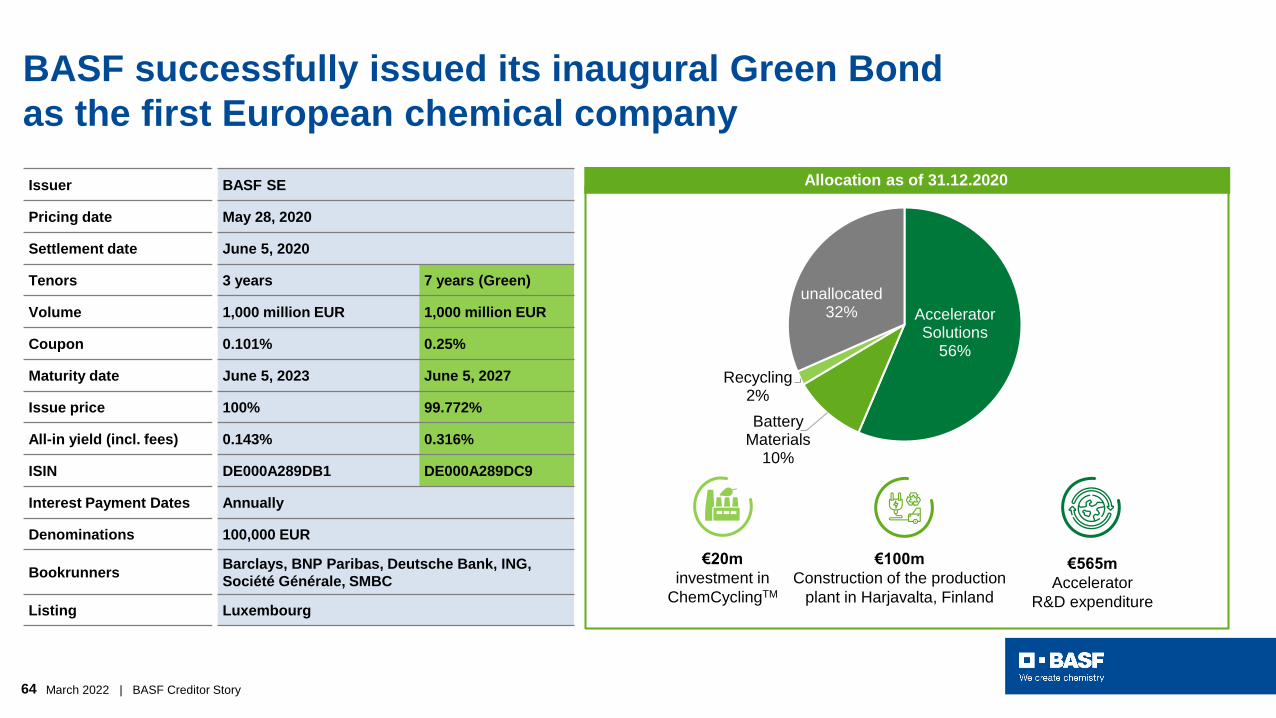
BASF successfully issued its inaugural Green Bond
as the first European chemical company
Issuer BASF SE
Pricing date May 28, 2020
Settlement date June 5, 2020
Tenors 3 years 7 years (Green)
Volume 1,000 million EUR 1,000 million EUR
Coupon 0.101% 0.25%
Maturity date June 5, 2023 June 5, 2027
Issue price 100% 99.772%
All-in yield (incl. fees) 0.143% 0.316%
ISIN DE000A289DB1 DE000A289DC9
Interest Payment Dates Annually
Denominations 100,000 EUR
BookrunnersBarclays, BNP Paribas, Deutsche Bank, ING,
Société Générale, SMBC
Listing Luxembourg
€20m
investment in
ChemCyclingTM
€565m
Accelerator
R&D expenditure
€100m
Construction of the production
plant in Harjavalta, Finland
Accelerator Solutions
56%
Battery Materials
10%
Recycling2%
unallocated32%
Allocation as of 31.12.2020
65 March 2022 | BASF Creditor Story
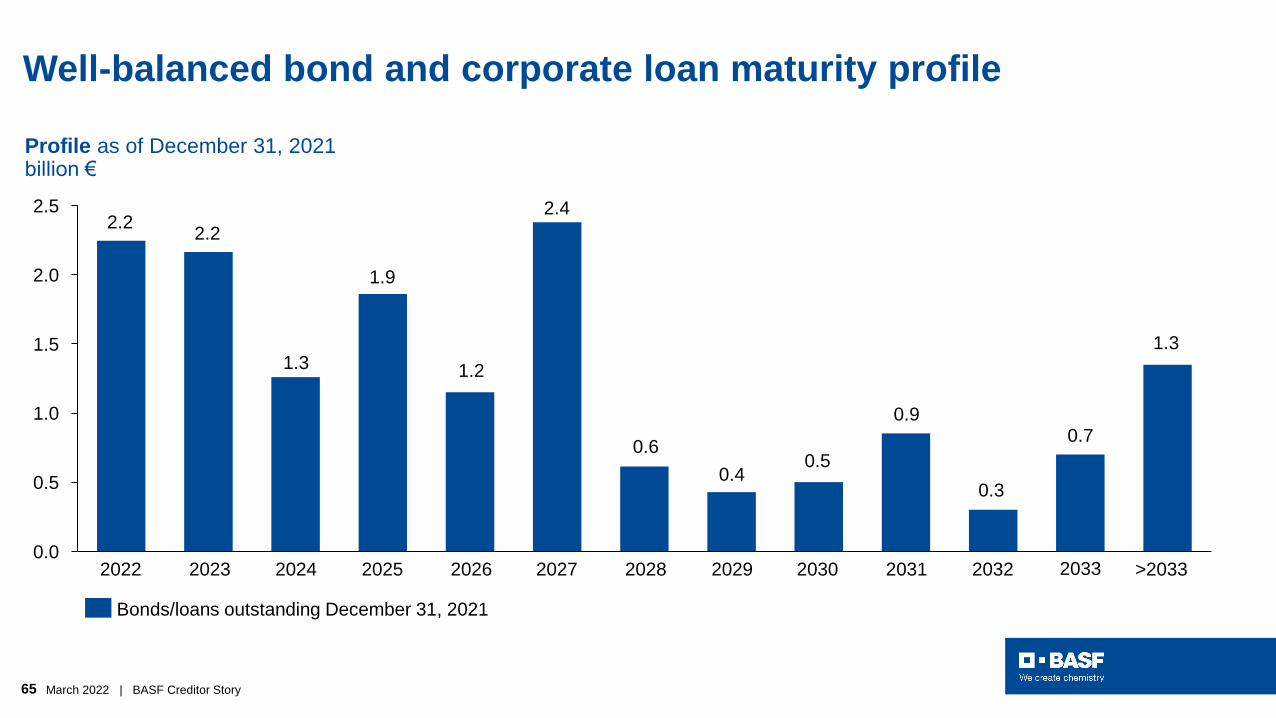
Well-balanced bond and corporate loan maturity profile
Profile as of December 31, 2021 billion €
0.5
2.0
1.0
2.5
1.5
0.02027 2031
1.9
202420232022 2025 2026
0.9
2028 2029 2030 2032
2.4
>2033
2.2
0.7
2.2
1.3 1.2
0.6
0.40.5
0.3
Bonds/loans outstanding December 31, 2021
2033
1.3
66 March 2022 | BASF Creditor Story
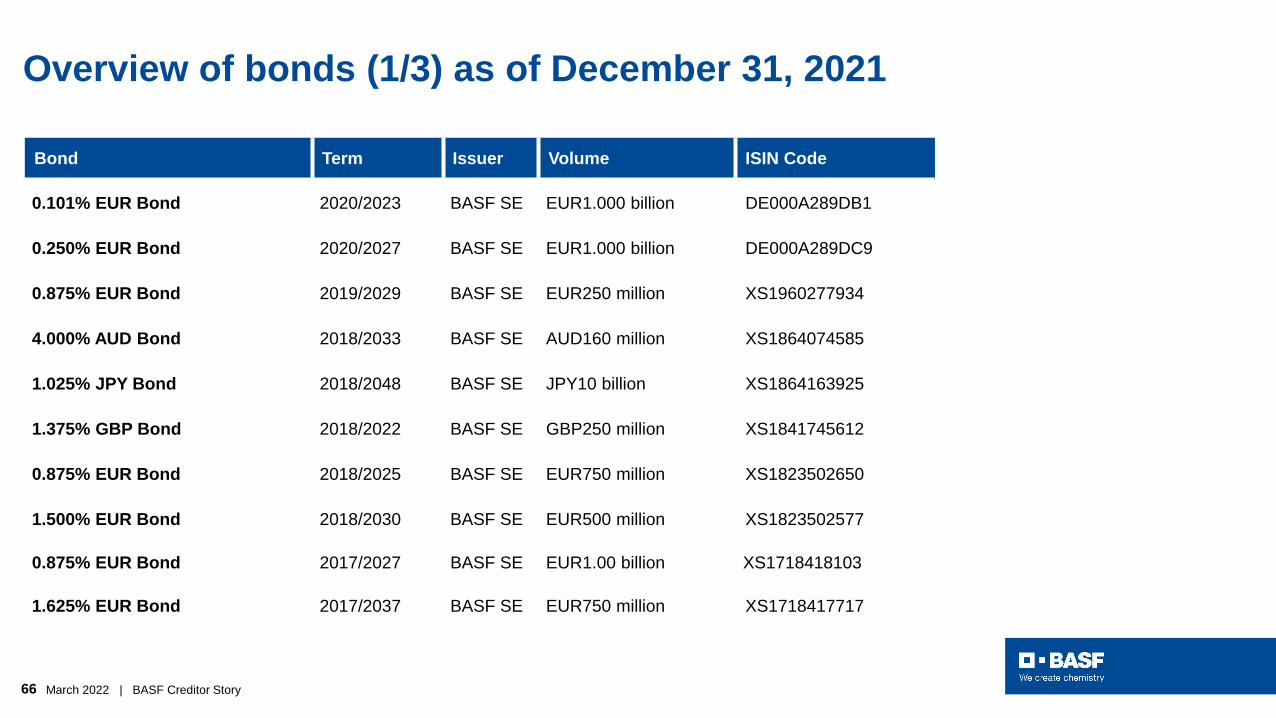
Overview of bonds (1/3) as of December 31, 2021
Bond Term Issuer Volume ISIN Code
0.101% EUR Bond 2020/2023 BASF SE EUR1.000 billion DE000A289DB1
0.250% EUR Bond 2020/2027 BASF SE EUR1.000 billion DE000A289DC9
0.875% EUR Bond 2019/2029 BASF SE EUR250 million XS1960277934
4.000% AUD Bond 2018/2033 BASF SE AUD160 million XS1864074585
1.025% JPY Bond 2018/2048 BASF SE JPY10 billion XS1864163925
1.375% GBP Bond 2018/2022 BASF SE GBP250 million XS1841745612
0.875% EUR Bond 2018/2025 BASF SE EUR750 million XS1823502650
1.500% EUR Bond 2018/2030 BASF SE EUR500 million XS1823502577
0.875% EUR Bond 2017/2027 BASF SE EUR1.00 billion XS1718418103
1.625% EUR Bond 2017/2037 BASF SE EUR750 million XS1718417717
67 March 2022 | BASF Creditor Story
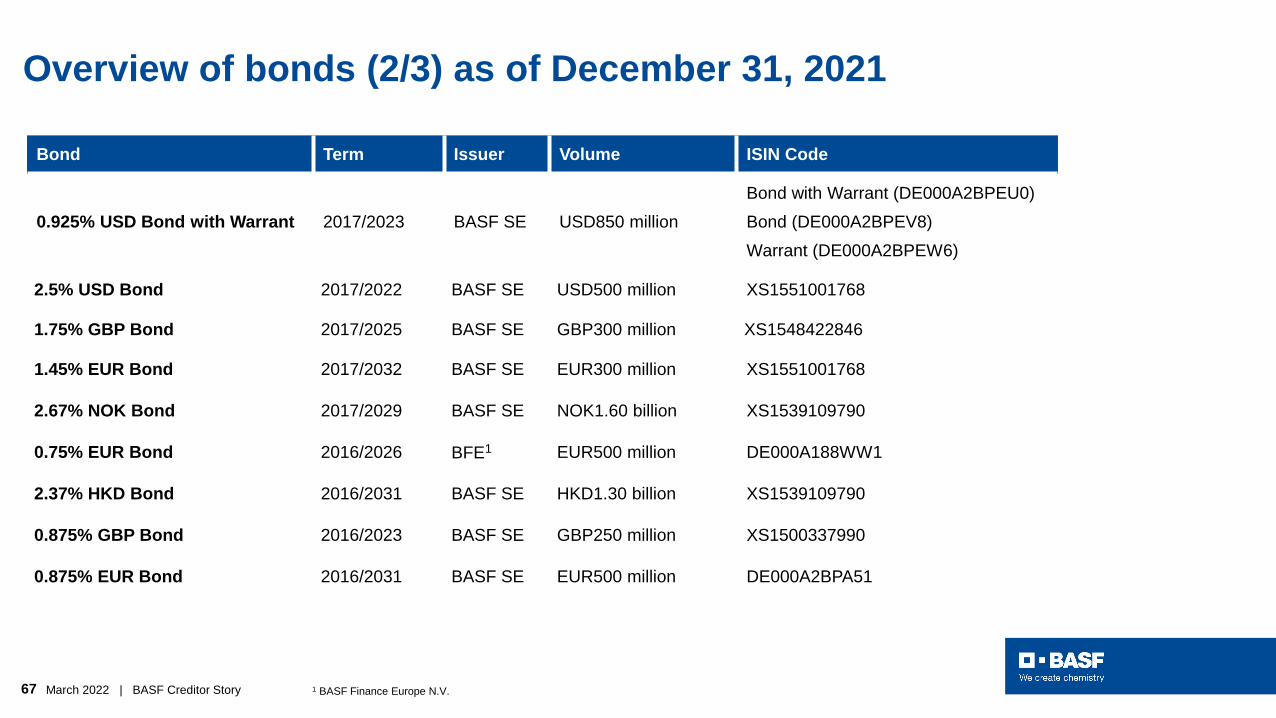
Overview of bonds (2/3) as of December 31, 2021
Bond Term Issuer Volume ISIN Code
0.925% USD Bond with Warrant 2017/2023 BASF SE USD850 million
Bond with Warrant (DE000A2BPEU0)
Bond (DE000A2BPEV8)
Warrant (DE000A2BPEW6)
2.5% USD Bond 2017/2022 BASF SE USD500 million XS1551001768
1.75% GBP Bond 2017/2025 BASF SE GBP300 million XS1548422846
1.45% EUR Bond 2017/2032 BASF SE EUR300 million XS1551001768
2.67% NOK Bond 2017/2029 BASF SE NOK1.60 billion XS1539109790
0.75% EUR Bond 2016/2026 BFE1 EUR500 million DE000A188WW1
2.37% HKD Bond 2016/2031 BASF SE HKD1.30 billion XS1539109790
0.875% GBP Bond 2016/2023 BASF SE GBP250 million XS1500337990
0.875% EUR Bond 2016/2031 BASF SE EUR500 million DE000A2BPA51
1 BASF Finance Europe N.V.
68 March 2022 | BASF Creditor Story
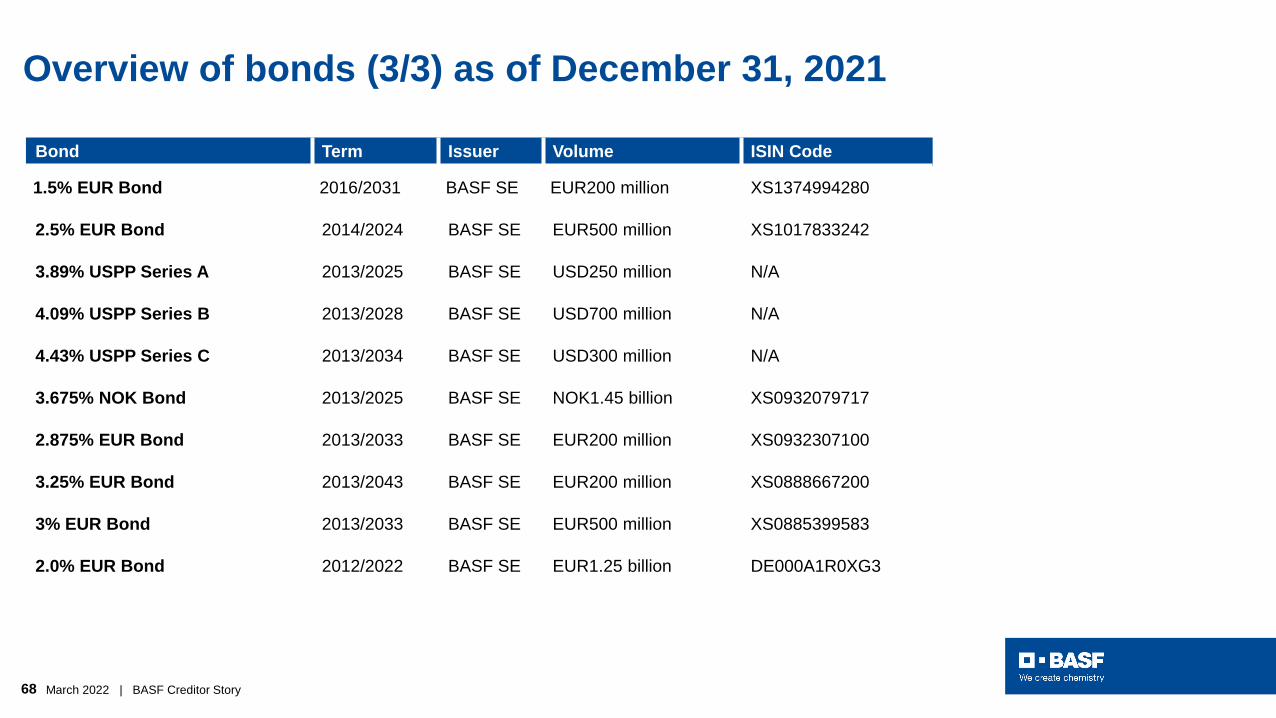
Overview of bonds (3/3) as of December 31, 2021
Bond Term Issuer Volume ISIN Code
1.5% EUR Bond 2016/2031 BASF SE EUR200 million XS1374994280
2.5% EUR Bond 2014/2024 BASF SE EUR500 million XS1017833242
3.89% USPP Series A 2013/2025 BASF SE USD250 million N/A
4.09% USPP Series B 2013/2028 BASF SE USD700 million N/A
4.43% USPP Series C 2013/2034 BASF SE USD300 million N/A
3.675% NOK Bond 2013/2025 BASF SE NOK1.45 billion XS0932079717
2.875% EUR Bond 2013/2033 BASF SE EUR200 million XS0932307100
3.25% EUR Bond 2013/2043 BASF SE EUR200 million XS0888667200
3% EUR Bond 2013/2033 BASF SE EUR500 million XS0885399583
2.0% EUR Bond 2012/2022 BASF SE EUR1.25 billion DE000A1R0XG3
69 March 2022 | BASF Creditor Story
BASF Creditor Relations Team
Siegfried Iro
Head of Financing Group
Dr. Lars Budde
Deputy Head Investor Relations
Creditor Relations
Contact Details:
Email: [email protected]
Phone: +49 621 60 91386
Websites: www.basf.com/bonds
www.basf.com/anleihenBrian Gerard Marren
Financing Group
Lisa Grundhöfer
Financing Group
70 March 2022 | BASF Creditor Story
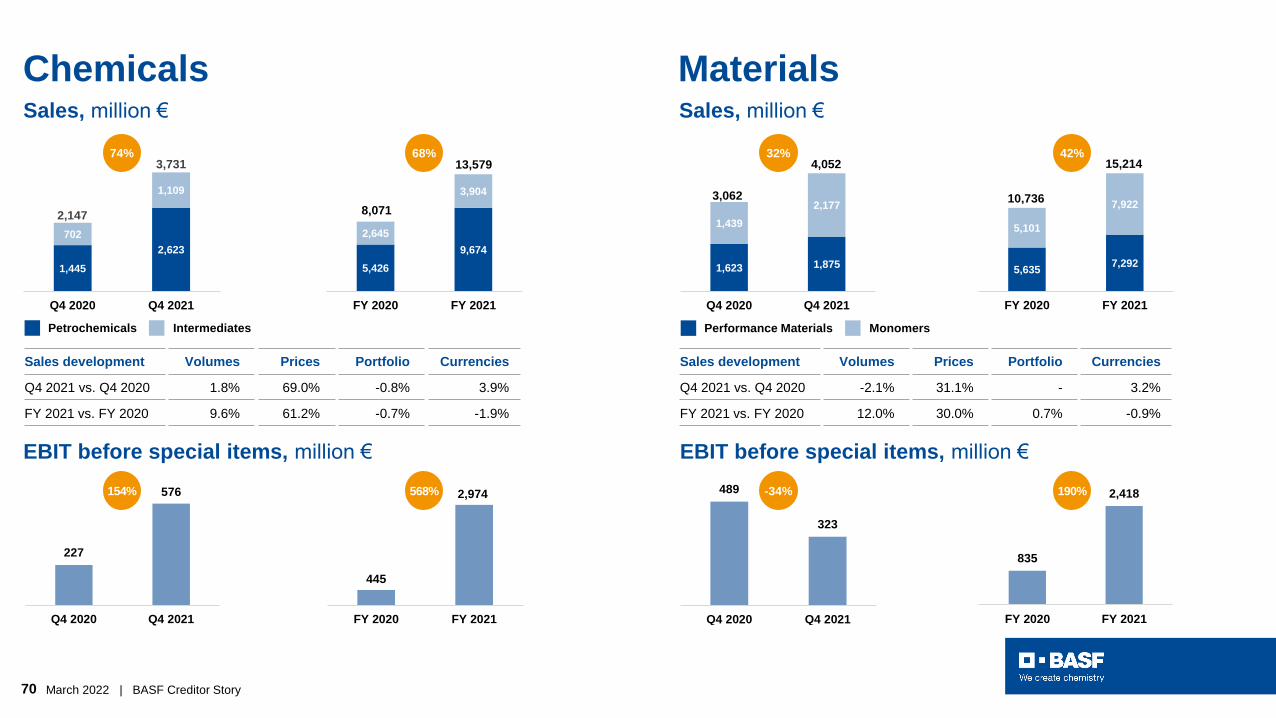
489
323
Q4 2020 Q4 2021
1,623 1,875
1,439
2,1773,062
4,052
Q4 2020 Q4 2021
1,445
2,623
702
1,109
2,147
3,731
Q4 2020 Q4 2021
227
576
Q4 2020 Q4 2021
445
2,974
FY 2020 FY 2021
Chemicals MaterialsSales, million €
Sales development Volumes Prices Portfolio Currencies
Q4 2021 vs. Q4 2020 1.8% 69.0% -0.8% 3.9%
FY 2021 vs. FY 2020 9.6% 61.2% -0.7% -1.9%
Sales development Volumes Prices Portfolio Currencies
Q4 2021 vs. Q4 2020 -2.1% 31.1% - 3.2%
FY 2021 vs. FY 2020 12.0% 30.0% 0.7% -0.9%
EBIT before special items, million €
Sales, million €
IntermediatesPetrochemicals
5,426
9,674
2,645
3,904
8,071
13,579
FY 2020 FY 2021
5,6357,292
5,101
7,92210,736
15,214
FY 2020 FY 2021
835
2,418
FY 2020 FY 2021
EBIT before special items, million €
-34%
MonomersPerformance Materials
190%568%154%
32% 42%68%74%
71 March 2022 | BASF Creditor Story
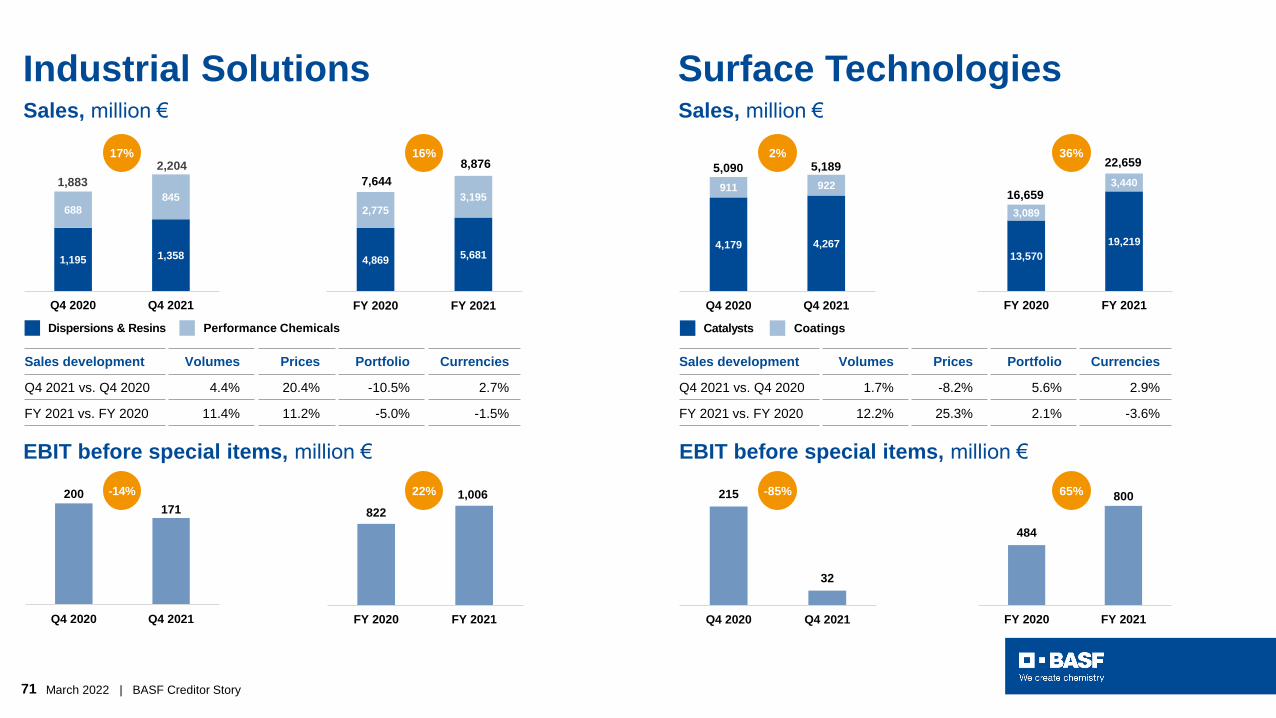
200
171
Q4 2020 Q4 2021
822
1,006
FY 2020 FY 2021
Industrial Solutions Surface TechnologiesSales, million €
Sales development Volumes Prices Portfolio Currencies
Q4 2021 vs. Q4 2020 4.4% 20.4% -10.5% 2.7%
FY 2021 vs. FY 2020 11.4% 11.2% -5.0% -1.5%
Sales development Volumes Prices Portfolio Currencies
Q4 2021 vs. Q4 2020 1.7% -8.2% 5.6% 2.9%
FY 2021 vs. FY 2020 12.2% 25.3% 2.1% -3.6%
EBIT before special items, million €
1,195 1,358
688
845
1,883
2,204
Q4 2020 Q4 2021
Performance ChemicalsDispersions & Resins
4,8695,681
2,775
3,195
7,644
8,876
FY 2020 FY 2021
13,570
19,219
3,089
3,440
16,659
22,659
FY 2020 FY 2021
215
32
Q4 2020 Q4 2021
484
800
FY 2020 FY 2021
EBIT before special items, million €
-85%
CoatingsCatalysts
65%22%-14%
36%16%17%
4,179 4,267
911 922
5,090 5,189
Q4 2020 Q4 2021
Sales, million €
2%
72 March 2022 | BASF Creditor Story
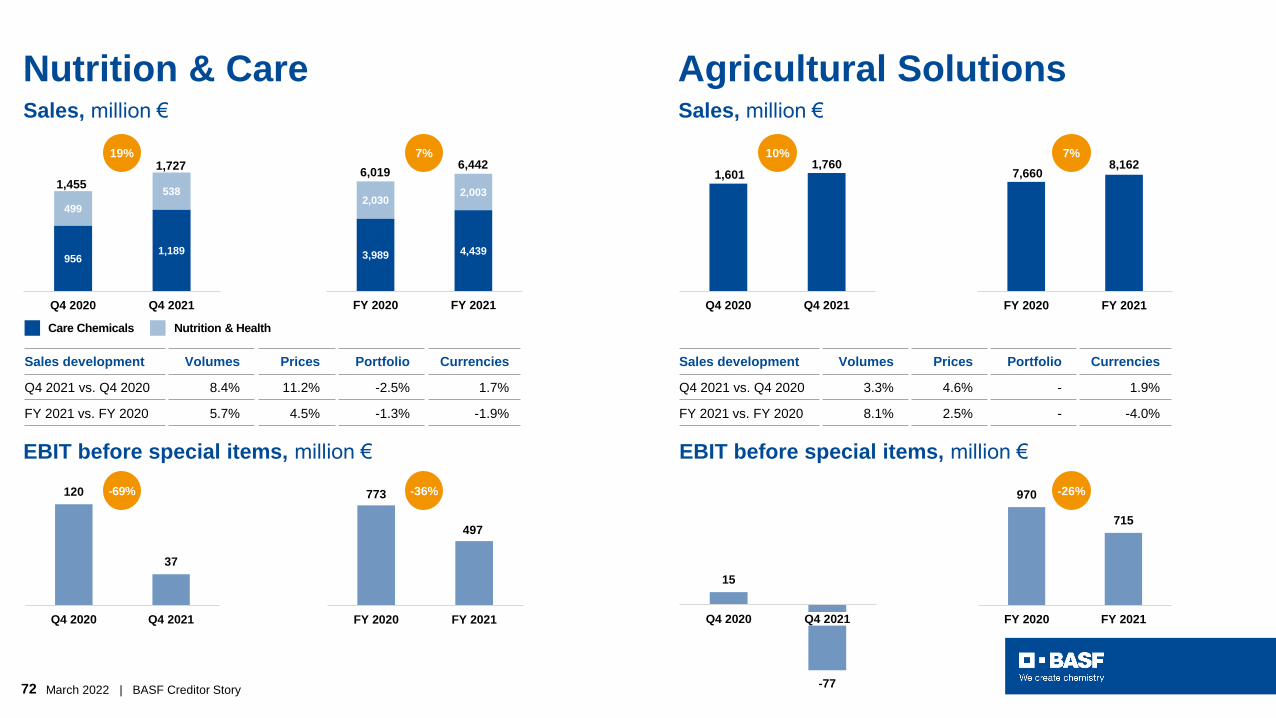
9561,189
499
5381,455
1,727
Q4 2020 Q4 2021
120
37
Q4 2020 Q4 2021
773
497
FY 2020 FY 2021
Nutrition & Care Agricultural SolutionsSales, million €
Sales development Volumes Prices Portfolio Currencies
Q4 2021 vs. Q4 2020 8.4% 11.2% -2.5% 1.7%
FY 2021 vs. FY 2020 5.7% 4.5% -1.3% -1.9%
Sales development Volumes Prices Portfolio Currencies
Q4 2021 vs. Q4 2020 3.3% 4.6% - 1.9%
FY 2021 vs. FY 2020 8.1% 2.5% - -4.0%
EBIT before special items, million €
Nutrition & HealthCare Chemicals
3,989 4,439
2,0302,003
6,0196,442
FY 2020 FY 2021
7,6608,162
FY 2020 FY 2021
15
-77
Q4 2020 Q4 2021
970
715
FY 2020 FY 2021
EBIT before special items, million €
-26%-36%-69%
7%7%19%
1,6011,760
Q4 2020 Q4 2021
Sales, million €
10%