A Geographically Diverse Collection of Schizosaccharomyces pombe Isolates Shows Limited Phenotypic...
12
INVESTIGATION A Geographically Diverse Collection of Schizosaccharomyces pombe Isolates Shows Limited Phenotypic Variation but Extensive Karyotypic Diversity William R. A. Brown,* ,1 Gianni Liti,* Carlos Rosa, † Steve James, ‡ Ian Roberts, ‡ Vincent Robert, § Neil Jolly,** Wen Tang, †† Peter Baumann, †† Carter Green,* Kristina Schlegel,* Jonathan Young,* Fabienne Hirchaud,* Spencer Leek,* Geraint Thomas,* Anders Blomberg, ‡‡ and Jonas Warringer ‡‡ *School of Biology, Queen’s Medical Centre, Nottingham, NG7 2UH, United Kingdom, † Departamento de Microbiologia, ICB, C.P. 486, Universidade Federal de Minas Gerais, Belo Horizonte, MG, 31270-901, Brazil, ‡ National Collection of Yeast Cultures, Institute of Food Research, Norwich, NR4 7UA, United Kingdom, § Centraalbureau voor Schimmelcultures, 3584 CT Utrecht, The Netherlands, **ARC Infruitec-Nietvoorbij, Stellenbosch 7599, Republic of South Africa †† Howard Hughes Medical institute and Stowers Institute for Medical Research, Department of Molecular and Integrative Physiology, University of Kansas Medical Centre, Kansas City, Missouri 64110, and ‡‡ Department of Cell and Molecular Biology, University of Gothenburg, SE-405 30 Gothenburg, Sweden ABSTRACT The fission yeast Schizosaccharomyces pombe has been widely used to study eukaryotic cell biology, but almost all of this work has used derivatives of a single strain. We have studied 81 independent natural isolates and 3 designated laboratory strains of Schizosaccharomyces pombe. Schizosaccharomyces pombe varies significantly in size but shows only limited variation in proliferation in different environments compared with Saccharomyces cerevisiae. Nucleotide diversity, p, at a near neutral site, the central core of the centromere of chromosome II is approximately 0.7%. Approximately 20% of the isolates showed karyotypic rearrangements as detected by pulsed field gel electrophoresis and filter hybridization analysis. One translocation, found in 6 different isolates, including the type strain, has a geographically widespread distribution and a unique haplotype and may be a marker of an incipient speciation event. All of the other translocations are unique. Exploitation of this karyotypic diversity may cast new light on both the biology of telomeres and centromeres and on isolating mechanisms in single-celled eukaryotes. KEYWORDS pombe karyotype diversity fission yeast Variation segregating in natural populations of model organisms is now widely studied to address questions about the populations struc- ture (Ruderfer et al. 2006; Tsai et al. 2008), geographic differentiation (Johnson et al. 2004), and phylogeny, as well as to provide new sources of variation for the investigation of traits that were previously studied using either experimentally induced mutations or a small set of natural variants (Nieduszynski and Liti 2011). In the case of the budding yeast Saccharomyces cerevisiae, variation has, on one hand, been used to establish the origins and relatedness of the many yeast strains (Fay and Benavides 2005; Schacherer et al. 2009; Liti et al. 2009) that have been exploited by humans and, on the other, to identify new components of pathways and processes that have been exhaustively studied by laboratory methods (Torabi and Kruglyak 2011; Parts et al. 2011). In contrast; variation in Arabidopsis thaliana (Nordborg and Weigel 2008) has been studied to understand the population structure of a predominantly self-fertilizing plant (Kim et al. 2007; Fournier-Level et al. 2011), to identify variation in traits of fundamental and agricultural interest, such as disease resistance (Atwell et al. 2010; Nemri et al. 2010); and to serve as an ecological model that allows a unified understanding of trait variation at the population and nucleotide levels (Todesco et al. 2010). Copyright © 2011 Brown et al. doi: 10.1534/g3.111.001123 Manuscript received September 11, 2011; accepted for publication October 26, 2011 This is an open-access article distributed under the terms of the Creative Commons Attribution Unported License (http://creativecommons.org/licenses/ by/3.0/), which permits unrestricted use, distribution, and reproduction in any medium, provided the original work is properly cited. Supporting information is available online at http://www.g3journal.org/lookup/ suppl/doi:10.1534/g3.111.001123/-/DC1 1 Corresponding author: School of Biology, Queen’s Medical Centre, Nottingham, NG7 2UH, UK. E-mail: [email protected] Volume 1 | December 2011 | 615
-
Upload
independent -
Category
Documents
-
view
3 -
download
0
Transcript of A Geographically Diverse Collection of Schizosaccharomyces pombe Isolates Shows Limited Phenotypic...
INVESTIGATION
A Geographically Diverse Collection ofSchizosaccharomyces pombe Isolates ShowsLimited Phenotypic Variation but ExtensiveKaryotypic DiversityWilliam R. A. Brown,*,1 Gianni Liti,* Carlos Rosa,† Steve James,‡ Ian Roberts,‡ Vincent Robert,§
Neil Jolly,** Wen Tang,†† Peter Baumann,†† Carter Green,* Kristina Schlegel,* Jonathan Young,*Fabienne Hirchaud,* Spencer Leek,* Geraint Thomas,* Anders Blomberg,‡‡ and Jonas Warringer‡‡*School of Biology, Queen’s Medical Centre, Nottingham, NG7 2UH, United Kingdom, †Departamento deMicrobiologia, ICB, C.P. 486, Universidade Federal de Minas Gerais, Belo Horizonte, MG, 31270-901, Brazil, ‡NationalCollection of Yeast Cultures, Institute of Food Research, Norwich, NR4 7UA, United Kingdom, §Centraalbureau voorSchimmelcultures, 3584 CT Utrecht, The Netherlands, **ARC Infruitec-Nietvoorbij, Stellenbosch 7599, Republic of SouthAfrica ††Howard Hughes Medical institute and Stowers Institute for Medical Research, Department of Molecular andIntegrative Physiology, University of Kansas Medical Centre, Kansas City, Missouri 64110, and ‡‡Department of Cell andMolecular Biology, University of Gothenburg, SE-405 30 Gothenburg, Sweden
ABSTRACT The fission yeast Schizosaccharomyces pombe has been widely used to study eukaryotic cellbiology, but almost all of this work has used derivatives of a single strain. We have studied 81 independentnatural isolates and 3 designated laboratory strains of Schizosaccharomyces pombe. Schizosaccharomycespombe varies significantly in size but shows only limited variation in proliferation in different environmentscompared with Saccharomyces cerevisiae. Nucleotide diversity, p, at a near neutral site, the central core ofthe centromere of chromosome II is approximately 0.7%. Approximately 20% of the isolates showedkaryotypic rearrangements as detected by pulsed field gel electrophoresis and filter hybridization analysis.One translocation, found in 6 different isolates, including the type strain, has a geographically widespreaddistribution and a unique haplotype and may be a marker of an incipient speciation event. All of the othertranslocations are unique. Exploitation of this karyotypic diversity may cast new light on both the biology oftelomeres and centromeres and on isolating mechanisms in single-celled eukaryotes.
KEYWORDS
pombekaryotypediversityfission yeast
Variation segregating in natural populations of model organisms isnow widely studied to address questions about the populations struc-ture (Ruderfer et al. 2006; Tsai et al. 2008), geographic differentiation(Johnson et al. 2004), and phylogeny, as well as to provide newsources of variation for the investigation of traits that were previously
studied using either experimentally induced mutations or a small setof natural variants (Nieduszynski and Liti 2011). In the case of thebudding yeast Saccharomyces cerevisiae, variation has, on one hand,been used to establish the origins and relatedness of the many yeaststrains (Fay and Benavides 2005; Schacherer et al. 2009; Liti et al.2009) that have been exploited by humans and, on the other, toidentify new components of pathways and processes that have beenexhaustively studied by laboratory methods (Torabi and Kruglyak2011; Parts et al. 2011). In contrast; variation in Arabidopsis thaliana(Nordborg and Weigel 2008) has been studied to understand thepopulation structure of a predominantly self-fertilizing plant (Kimet al. 2007; Fournier-Level et al. 2011), to identify variation in traitsof fundamental and agricultural interest, such as disease resistance(Atwell et al. 2010; Nemri et al. 2010); and to serve as an ecologicalmodel that allows a unified understanding of trait variation at thepopulation and nucleotide levels (Todesco et al. 2010).
Copyright © 2011 Brown et al.doi: 10.1534/g3.111.001123Manuscript received September 11, 2011; accepted for publication October 26, 2011This is an open-access article distributed under the terms of the CreativeCommons Attribution Unported License (http://creativecommons.org/licenses/by/3.0/), which permits unrestricted use, distribution, and reproduction in anymedium, provided the original work is properly cited.Supporting information is available online at http://www.g3journal.org/lookup/suppl/doi:10.1534/g3.111.001123/-/DC11Corresponding author: School of Biology, Queen’s Medical Centre, Nottingham,NG7 2UH, UK. E-mail: [email protected]
Volume 1 | December 2011 | 615
The fission yeast Schizosaccharomyces pombe (Egel 2003) is a pow-erful complement to S. cerevisiae for the study of eukaryotic cellautonomous processes. S. pombe was originally isolated from EastAfrican beer, but subsequently it has been found in many parts ofthe world in indigenous fermentations, fruit, molasses, and industrialglucose. There have been two large efforts to isolate S. pombe fromfruit, nectar, or fermentations: one by Florenzano et al. (1977) in thevineyards of Western Sicily, and the other by Gomes et al. (2002) infour regions of Southeast Brazil. Thus, while S. pombe has played onlya minor role in biotechnology in comparison to S. cerevisiae, isolatesof S. pombe are present in many of the major yeast strain collections.Although S. cerevisiae was intensively studied by brewers, oenologists,and bakers prior to its exploitation as a laboratory model, S. pombehas only been studied in any depth as a model of eukaryotic cellbiology. Almost all of this work exploits derivatives of the strain968, which was first identified in a French wine by Osterwalder andthen developed as a genetic system by Leupold (1950) (Jürg Kohli,personal communication). Little is known, therefore, about the extentor nature of the variation of this yeast in nature. We assembleda collection of 81 isolates from many regions of the world. We ana-lyzed the isolates at both the phenotypic, genotypic, and karyotypiclevel. We identified inherited variation in cell size but only limitedvariability in the proliferative ability in various environments. Thereare extensive karyotypic differences between many of the strains. Thelevel of nucleotide variation, p, at neutral sites is about 0.7%, whichis higher than S. cerevisiae (Liti et al. 2009). Our data suggest thatS. pombe exists in small, incompletely isolated populations and thatthese occupy a limited range of environments. Although mechanisticanalysis of the phenotypic diversity of S. pombe will require structuralanalysis of the different karyotypes, the diverse karyotypes maythemselves provide new insights into centromere and telomere func-tion, isolation mechanisms, and speciation in single-celled eukaryotes(Gordon et al. 2011).
MATERIALS AND METHODS
Handling of strainsIsolates typically arrived on agar slopes or as freeze-dried samples. Ifthey were freeze dried, then the yeast was reconstituted with water andstreaked onto supplemented yeast extract agar plates; (YES; 5% yeastextract, 3% glucose, 225 mg/L histidine, 225 mg/L adenine, 225 mg/Lleucine, and 225 mg/L uracil), 2% agar Bacto agar (Becton Dickinson).Strains were maintained either on YES agar or cultured in liquid YES.
Restriction site mapping and PCRFilter transfer, hybridization analysis, and pulsed field gel electropho-resis were carried out as previously described (Brown 1988; Brownet al. 1990). PCR was carried using Taq polymerase (homemade orfrom Yorkshire Biosciences). Sanger sequencing was carried out usingBigDye v3.1 (Applied Biosystems). Primers used to construct probesfor filter hybridization are given in supporting information, Table S3.
DNA extraction, sequencing, and analysisDNA for PCR was extracted from the 5 mL of yeast cultures usinga protocol kindly supplied by Jacob Dalgaard of the Marie CurieResearch Institute. Five milliliters of saturated culture was concen-trated by centrifugation; spheroplasted using zymolyase 20T in 100 ml1M sorbitol and 50 mM EDTA; concentrated by centrifugation onceagain; resuspended in 0.2 mL of DNAzol; and vortex mixed. TheDNA was precipitated with an equal volume of cold ethanol. The
crude DNA was treated with ribonuclease and then pronase in10 mM Tris-HCl (pH 8.0), 1 mM EDTA, and 0.1% SDS; extractedbetween three and five times with a 1:1 mixture of phenol and chloro-form; and finally precipitated with ethanol prior to use. Primers usedto amplify and sequence DNA for diversity analysis are listed in TableS4.
DNA was amplified with Taq polymerase in an ammoniumchloride buffer containing 2 mM MgCl2 using the following condi-tions: an initial denaturation step of 92� for 30 sec was followed by 33cycles of 92� for 10 sec, 56� for 10 sec, and 65� for 2 min. Primers andunincorporated dNTP were removed from the reactions usingAmpure (Agencourt, Beckman Coulter), the products were sequencedon each strand using the primers described above using BigDye (v2 orv3.1; Applied Biosystems), and then purified prior to electrophoreticanalysis by Cleanseq (Agencourt, Beckman Coulter). Sequences werealigned and edited using Bioedit and collapsed into haplotypes usingFaBox (http://www.birc.au.dk/~biopv/php/fabox/). Sequences that de-fined unique haplotypes at any one locus were reamplified and rese-quenced. Standard summary statistics were extracted with Arlequin(Excoffier et al. 2005) and DNASp (Librado and Rozas 2009). DNAfor pulsed field gel electrophoresis was embedded in agarose plugs andextracted as described (Smith et al. 1987).
Microarray analysisFor microarray analysis, chromosomal DNA was size-fractionated bypulsed field gel electrophoresis, electroeluted from the gel into dialysistubing, concentrated using Butan-2-ol, amplified by the QiagenREPL1-g mini kit before labeling using the Agilent DNA ULS labelingkit (5190-0419), and then purified and hybridized to the AgilentS. pombe 4 · 44K ChIP-on-chip array (G4810) using unfractionatedCRUK 972 DNA as competitor. In some experiments, unfractionatedDNA from natural isolates was used as target. All steps were carriedout according to the manufacturer’s instructions. Arrays were scannedusing an Agilent Scanner, and the data were analyzed using the Agi-lent Genomic Workbench v5.0.14.
Quantifying natural trait variationStrains were subjected to high-throughput phenotyping by micro-cultivation (n ¼ 2) in an array of environments essentially as de-scribed (Warringer et al. 2008; Warringer and Blomberg 2003).Briefly, strains were inoculated in 350 ml of YES medium (5% yeastextract, 3% glucose, 225 mg/L histidine, 225 mg/L adenine, 225 mg/Lleucine, and 225 mg/L uracil) and incubated in two serial rounds ofprecultivation for 48–72 h at 30�. For experimental runs, strains wereinoculated to an OD of 0.05–0.1 in 350 ml of YES medium (3%glucose was replaced by 3% of alternative carbon sources where in-dicated) and microcultivated for 48 h or 72 h in a Bioscreen analyzerC (Oy Growth Curves, Finland). Optical density was measured every20 min using a wide band (450–580 nm) filter. The mitotic prolifer-ation rate (population doubling time), lag (population adaptationtime), and efficiency (total change in population density) wereextracted from high-density growth curves and LN (natural loga-rithm)–transformed (data set in Table S5). Relative fitness variablefor each strain and trait, LSCij, was calculated as:
LSCij ¼P2
r¼1
��110
X10
k¼1log
�wtrkj
��2 log
�xrij
��
2
where wtkj is the fitness variable of the kth measurement of the wild-type for trait j; xij is the measure of strain i for trait j; and r indicates
616 | W. R. A. Brown et al.
the run. The measure for proliferation efficiency was inverted tomaintain directionality between fitness components.
Cell size at septationCells were cultured over night in YES containing glucose at 0.5%weight per volume until they reached mid-log phase, concentrated bycentrifugation, and visualized using phase microscopy using a ZeissAxioscop microscope with a Plan NeoFluor 40· objective. Imageswere collected and sizes were quantitated using Metamorph (Univer-sal Imaging) v6.1.
Population structure revealed by Fst analysis ofconcatenated sequences of noncoding DNAThe SPBC660.16 large intron (which encodes phosphogluconatedehydrogease), TER1, and CEN2 sequences were stripped of indelsand, in the case of the large intron of SPBC 660.16, the microsatellite;concatenated; and then grouped according to geographic origin. Fstvalues (Cockerham and Weir 1984) were estimated using the Arlequinpackage (Excoffier et al. 2005).
Linkage disequilibrium calculationInformative SNPs were identified both in the centromere of chro-mosome 2 (Figure S6) and in the flanking DNA (Figure S7) and in theTER1 gene and in the flanking DNA (Figure S8) and used to estimatelinkage disequilibrium (LD) statistics using DNAsp (Table 5).
RESULTS
A collection of natural isolates of S. pombe
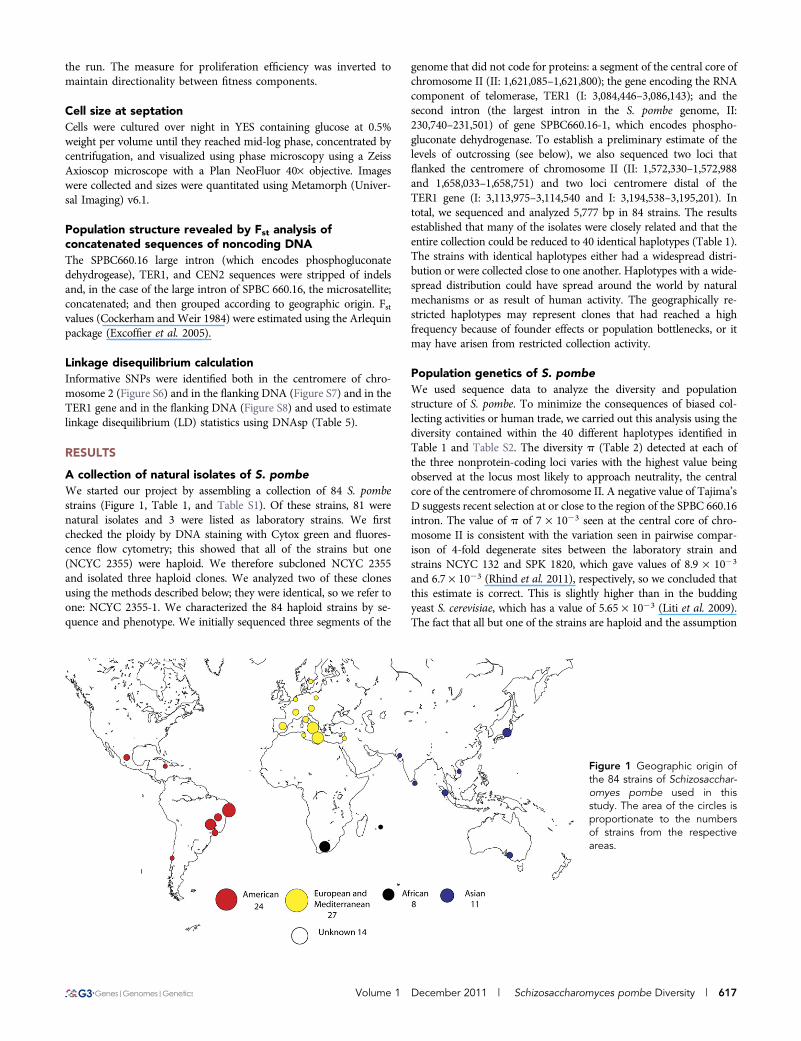
We started our project by assembling a collection of 84 S. pombestrains (Figure 1, Table 1, and Table S1). Of these strains, 81 werenatural isolates and 3 were listed as laboratory strains. We firstchecked the ploidy by DNA staining with Cytox green and fluores-cence flow cytometry; this showed that all of the strains but one(NCYC 2355) were haploid. We therefore subcloned NCYC 2355and isolated three haploid clones. We analyzed two of these clonesusing the methods described below; they were identical, so we refer toone: NCYC 2355-1. We characterized the 84 haploid strains by se-quence and phenotype. We initially sequenced three segments of the
genome that did not code for proteins: a segment of the central core ofchromosome II (II: 1,621,085–1,621,800); the gene encoding the RNAcomponent of telomerase, TER1 (I: 3,084,446–3,086,143); and thesecond intron (the largest intron in the S. pombe genome, II:230,740–231,501) of gene SPBC660.16-1, which encodes phospho-gluconate dehydrogenase. To establish a preliminary estimate of thelevels of outcrossing (see below), we also sequenced two loci thatflanked the centromere of chromosome II (II: 1,572,330–1,572,988and 1,658,033–1,658,751) and two loci centromere distal of theTER1 gene (I: 3,113,975–3,114,540 and I: 3,194,538–3,195,201). Intotal, we sequenced and analyzed 5,777 bp in 84 strains. The resultsestablished that many of the isolates were closely related and that theentire collection could be reduced to 40 identical haplotypes (Table 1).The strains with identical haplotypes either had a widespread distri-bution or were collected close to one another. Haplotypes with a wide-spread distribution could have spread around the world by naturalmechanisms or as result of human activity. The geographically re-stricted haplotypes may represent clones that had reached a highfrequency because of founder effects or population bottlenecks, or itmay have arisen from restricted collection activity.
Population genetics of S. pombe
We used sequence data to analyze the diversity and populationstructure of S. pombe. To minimize the consequences of biased col-lecting activities or human trade, we carried out this analysis using thediversity contained within the 40 different haplotypes identified inTable 1 and Table S2. The diversity p (Table 2) detected at each ofthe three nonprotein-coding loci varies with the highest value beingobserved at the locus most likely to approach neutrality, the centralcore of the centromere of chromosome II. A negative value of Tajima’sD suggests recent selection at or close to the region of the SPBC 660.16intron. The value of p of 7 · 1023 seen at the central core of chro-mosome II is consistent with the variation seen in pairwise compar-ison of 4-fold degenerate sites between the laboratory strain andstrains NCYC 132 and SPK 1820, which gave values of 8.9 · 1023
and 6.7 · 1023 (Rhind et al. 2011), respectively, so we concluded thatthis estimate is correct. This is slightly higher than in the buddingyeast S. cerevisiae, which has a value of 5.65 · 1023 (Liti et al. 2009).The fact that all but one of the strains are haploid and the assumption
Figure 1 Geographic origin ofthe 84 strains of Schizosacchar-omyes pombe used in thisstudy. The area of the circles isproportionate to the numbersof strains from the respectiveareas.
Volume 1 December 2011 | Schizosaccharomyces pombe Diversity | 617
of a neutral coalescent allows estimation of the effective mitotic pop-ulation size Ne by use of relationship p = 2Neu, where u is the mu-tation rate per nucleotide per mitotic generation (Tsai et al. 2008). Theneutral mutation rate in S. pombe is not known, so we assumed therate that has been used for S. cerevisiae of 0.33 · 1029/bp/generation(Lynch et al. 2008), leading to an estimate of the global effective
population size of 1 · 107. It is also of interest to know how muchvariation is endemic to particular population. There was too littlesequence variation to be able to estimate population structure a prioriusing the Bayesian approaches implemented in the STRUCTURE(Pritchard et al. 2000) and BAPS (Corander et al. 2008) packages,so we grouped the haplotypes according to their geographic origin,
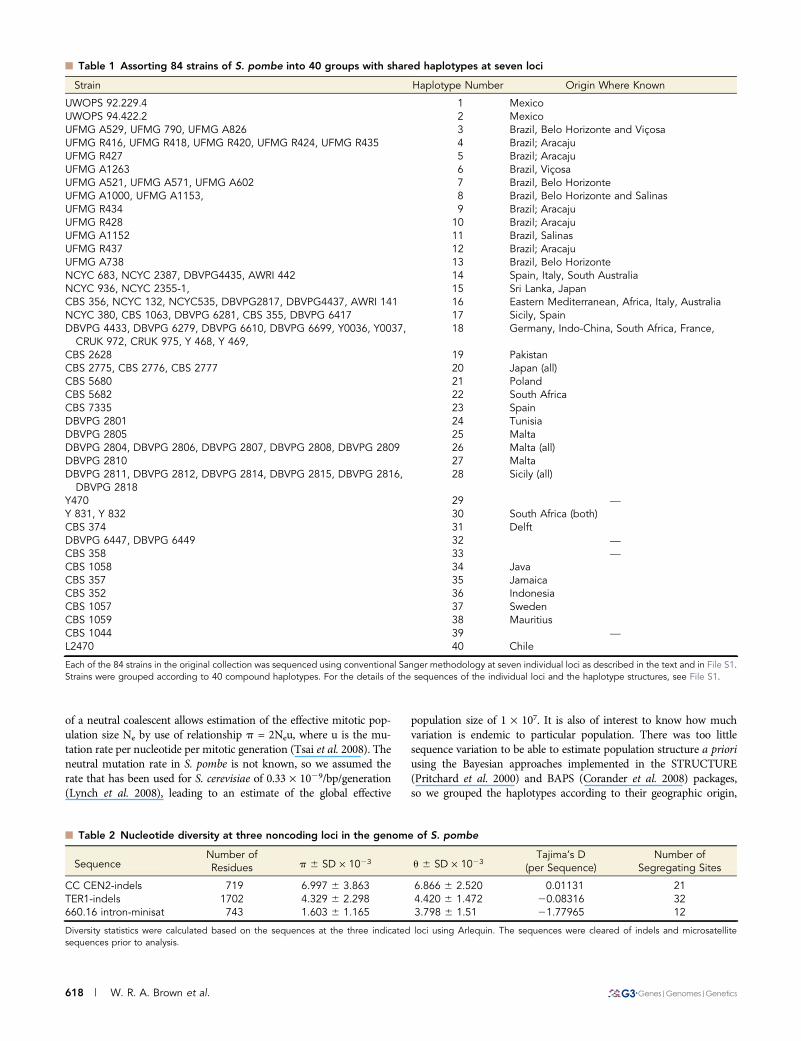
n Table 1 Assorting 84 strains of S. pombe into 40 groups with shared haplotypes at seven loci
Strain Haplotype Number Origin Where Known
UWOPS 92.229.4 1 MexicoUWOPS 94.422.2 2 MexicoUFMG A529, UFMG 790, UFMG A826 3 Brazil, Belo Horizonte and ViçosaUFMG R416, UFMG R418, UFMG R420, UFMG R424, UFMG R435 4 Brazil; AracajuUFMG R427 5 Brazil; AracajuUFMG A1263 6 Brazil, ViçosaUFMG A521, UFMG A571, UFMG A602 7 Brazil, Belo HorizonteUFMG A1000, UFMG A1153, 8 Brazil, Belo Horizonte and SalinasUFMG R434 9 Brazil; AracajuUFMG R428 10 Brazil; AracajuUFMG A1152 11 Brazil, SalinasUFMG R437 12 Brazil; AracajuUFMG A738 13 Brazil, Belo HorizonteNCYC 683, NCYC 2387, DBVPG4435, AWRI 442 14 Spain, Italy, South AustraliaNCYC 936, NCYC 2355-1, 15 Sri Lanka, JapanCBS 356, NCYC 132, NCYC535, DBVPG2817, DBVPG4437, AWRI 141 16 Eastern Mediterranean, Africa, Italy, AustraliaNCYC 380, CBS 1063, DBVPG 6281, CBS 355, DBVPG 6417 17 Sicily, SpainDBVPG 4433, DBVPG 6279, DBVPG 6610, DBVPG 6699, Y0036, Y0037,
CRUK 972, CRUK 975, Y 468, Y 469,18 Germany, Indo-China, South Africa, France,
CBS 2628 19 PakistanCBS 2775, CBS 2776, CBS 2777 20 Japan (all)CBS 5680 21 PolandCBS 5682 22 South AfricaCBS 7335 23 SpainDBVPG 2801 24 TunisiaDBVPG 2805 25 MaltaDBVPG 2804, DBVPG 2806, DBVPG 2807, DBVPG 2808, DBVPG 2809 26 Malta (all)DBVPG 2810 27 MaltaDBVPG 2811, DBVPG 2812, DBVPG 2814, DBVPG 2815, DBVPG 2816,
DBVPG 281828 Sicily (all)
Y470 29 —
Y 831, Y 832 30 South Africa (both)CBS 374 31 DelftDBVPG 6447, DBVPG 6449 32 —
CBS 358 33 —
CBS 1058 34 JavaCBS 357 35 JamaicaCBS 352 36 IndonesiaCBS 1057 37 SwedenCBS 1059 38 MauritiusCBS 1044 39 —
L2470 40 Chile
Each of the 84 strains in the original collection was sequenced using conventional Sanger methodology at seven individual loci as described in the text and in File S1.Strains were grouped according to 40 compound haplotypes. For the details of the sequences of the individual loci and the haplotype structures, see File S1.
n Table 2 Nucleotide diversity at three noncoding loci in the genome of S. pombe
SequenceNumber ofResidues p 6 SD · 1023 u 6 SD · 1023
Tajima’s D(per Sequence)
Number ofSegregating Sites
CC CEN2-indels 719 6.997 6 3.863 6.866 6 2.520 0.01131 21TER1-indels 1702 4.329 6 2.298 4.420 6 1.472 20.08316 32660.16 intron-minisat 743 1.603 6 1.165 3.798 6 1.51 21.77965 12
Diversity statistics were calculated based on the sequences at the three indicated loci using Arlequin. The sequences were cleared of indels and microsatellitesequences prior to analysis.
618 | W. R. A. Brown et al.
where this was possible, and then analyzed them using the F statistic(Cockerham and Weir 1984). These results (Table 3) demonstratedlittle by way of population structure but suggested that the Americanstrains were the most highly differentiated. Network analysis of theCEN2, TER, and 660.16 sequences was also consistent with extensivemixing between the different haplotypes (Figure S6, Figure S8, FigureS9, and Figure S10). Two loci include sufficient data to estimate theextent of linkage disequilibrium, which is inversely proportional to theout-crossing rate. To do this, we identified informative SNPs in andaround the centromere of chromosome II and within and centromeredistal of the TER1 gene (Figure S6, Figure S7, Figure S8, Figure S9, andFigure S10). A four gamete test of the sequence variation around thecentromere does not indicate recombination. Significant linkage dis-equilibrium is also detectable 30 kb from the telomerase RNA geneusing both the D’ and R statistics (Table 4). The extent of linkagedisequilibrium would seem, therefore, to be greater than in S. para-
doxus (Tsai et al. 2008), which out-crosses once in every 1000 asexualgenerations and which shows lower levels of nucleotide diversity.Network analysis (Figure S6, Figure S9, and Figure S10) of the hap-lotypes at centromere II, TER1, and SPBC660.16, however, demon-strate that there is extensive mixing between different strains. Moredetailed analysis will be required to measure the rate of out-crossing inS. pombe and to correlate it with the karyotypic diversity describedbelow.
Trait variation in S. pombe is defined by populationstructure and geographic boundariesTo survey natural trait variation in S. pombe, isolates were subjected tohigh-resolution quantification of proliferative ability in an array ofenvironments representing variations in nutrient availability, temper-ature, and exposure to toxic metals and drugs. From high-densitymitotic growth curves, the fitness components lag of proliferation,rate of proliferation (population doubling time), and efficiency of pro-liferation (population density change) were extracted, providing.120distinct measures of organism-environment interactions (Figure 2).These fitness components were compared with those of the S. cerevi-siae universal type strain BY4741. In optimal conditions, S. pombefeatured a delay in the time to initiate population growth and a mar-ginal reduction in proliferation rate relative S. cerevisiae (Figure S1,A and B). In contrast, the performance of S. pombe was very severelyimpaired in many stress-inducing environments (Figure 2B). In par-ticular, S. pombe proliferation in the presence of alkali and alkalineearth metals, DNA damaging agents, and respiratory or partially re-spiratory carbon sources was reduced (Figure 2B and Figure S1D).Utilization of maltose, the main storage carbohydrate of barley, rep-resented an exception, being more efficient in S. pombe (Figure S1,D and E). Overall, trait variation in S. pombe was lower than what has
n Table 3 Population differentiation as measured by Fst
Population American African European Asian Unknown
American (15) 0African (5) 0.075 0European (11) 0.087 20.021 0Asian (7) 0.009 0.02 0.035 0Unknown origin (9) 0.044 20.01 0.051 0.022 0
The sequence data from the 40 compound haplotypes were used to estimatepairwise Fst measures of population differentiation using the Arlequin package.Haplotypes (e.g. haplotypes 16 and 18) containing strains of different originswere considered as being of unknown origin. The numbers of strains in therespective populations are indicated in parentheses. Haplotypes containingstrains of different known origins were assigned multiply to different populationsand thus the sum of the numbers in brackets exceeds 40.
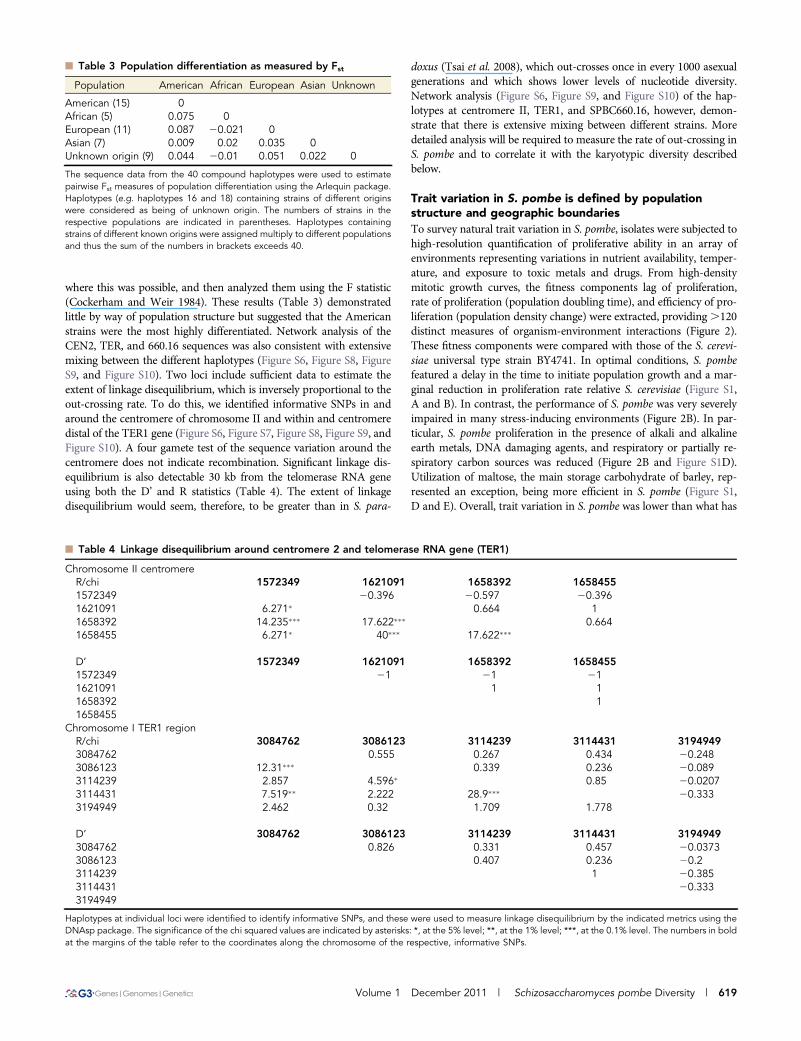
n Table 4 Linkage disequilibrium around centromere 2 and telomerase RNA gene (TER1)
Chromosome II centromereR/chi 1572349 1621091 1658392 16584551572349 20.396 20.597 20.3961621091 6.271� 0.664 11658392 14.235��� 17.622��� 0.6641658455 6.271� 40��� 17.622���
D’ 1572349 1621091 1658392 16584551572349 21 21 211621091 1 11658392 11658455
Chromosome I TER1 regionR/chi 3084762 3086123 3114239 3114431 31949493084762 0.555 0.267 0.434 20.2483086123 12.31��� 0.339 0.236 20.0893114239 2.857 4.596� 0.85 20.02073114431 7.519�� 2.222 28.9��� 20.3333194949 2.462 0.32 1.709 1.778
D’ 3084762 3086123 3114239 3114431 31949493084762 0.826 0.331 0.457 20.03733086123 0.407 0.236 20.23114239 1 20.3853114431 20.3333194949
Haplotypes at individual loci were identified to identify informative SNPs, and these were used to measure linkage disequilibrium by the indicated metrics using theDNAsp package. The significance of the chi squared values are indicated by asterisks: *, at the 5% level; **, at the 1% level; ***, at the 0.1% level. The numbers in boldat the margins of the table refer to the coordinates along the chromosome of the respective, informative SNPs.
Volume 1 December 2011 | Schizosaccharomyces pombe Diversity | 619
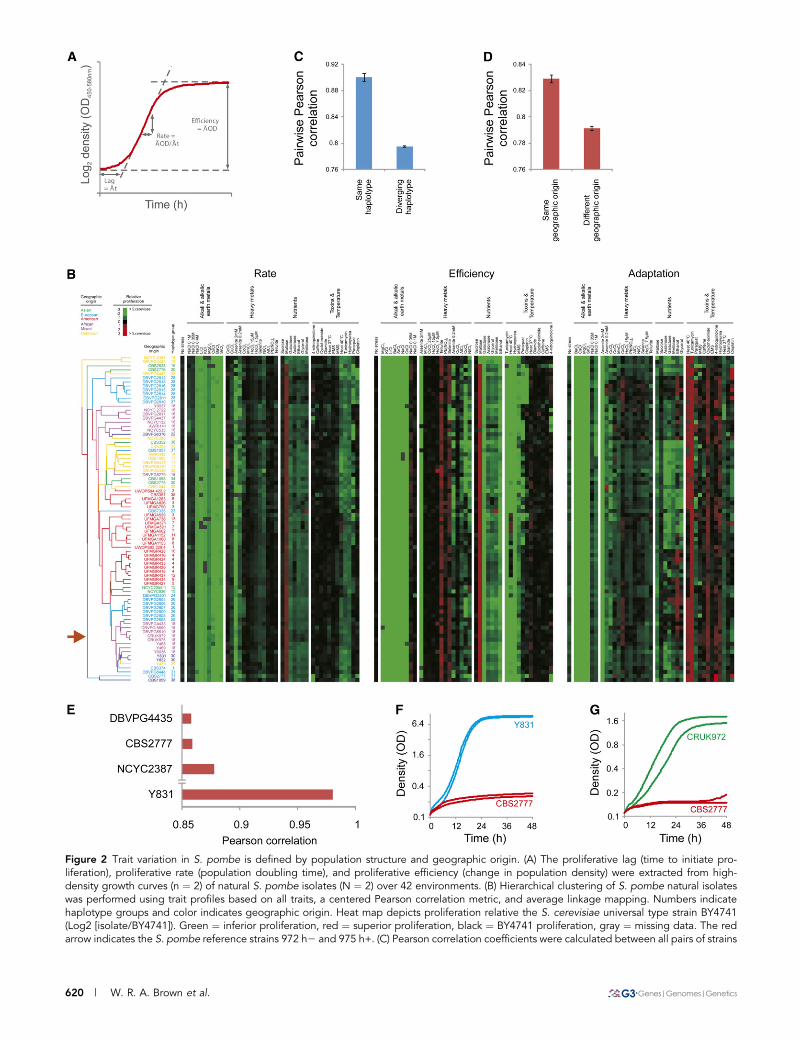
Figure 2 Trait variation in S. pombe is defined by population structure and geographic origin. (A) The proliferative lag (time to initiate pro-liferation), proliferative rate (population doubling time), and proliferative efficiency (change in population density) were extracted from high-density growth curves (n ¼ 2) of natural S. pombe isolates (N ¼ 2) over 42 environments. (B) Hierarchical clustering of S. pombe natural isolateswas performed using trait profiles based on all traits, a centered Pearson correlation metric, and average linkage mapping. Numbers indicatehaplotype groups and color indicates geographic origin. Heat map depicts proliferation relative the S. cerevisiae universal type strain BY4741(Log2 [isolate/BY4741]). Green ¼ inferior proliferation, red ¼ superior proliferation, black ¼ BY4741 proliferation, gray ¼ missing data. The redarrow indicates the S. pombe reference strains 972 h2 and 975 h+. (C) Pearson correlation coefficients were calculated between all pairs of strains
620 | W. R. A. Brown et al.
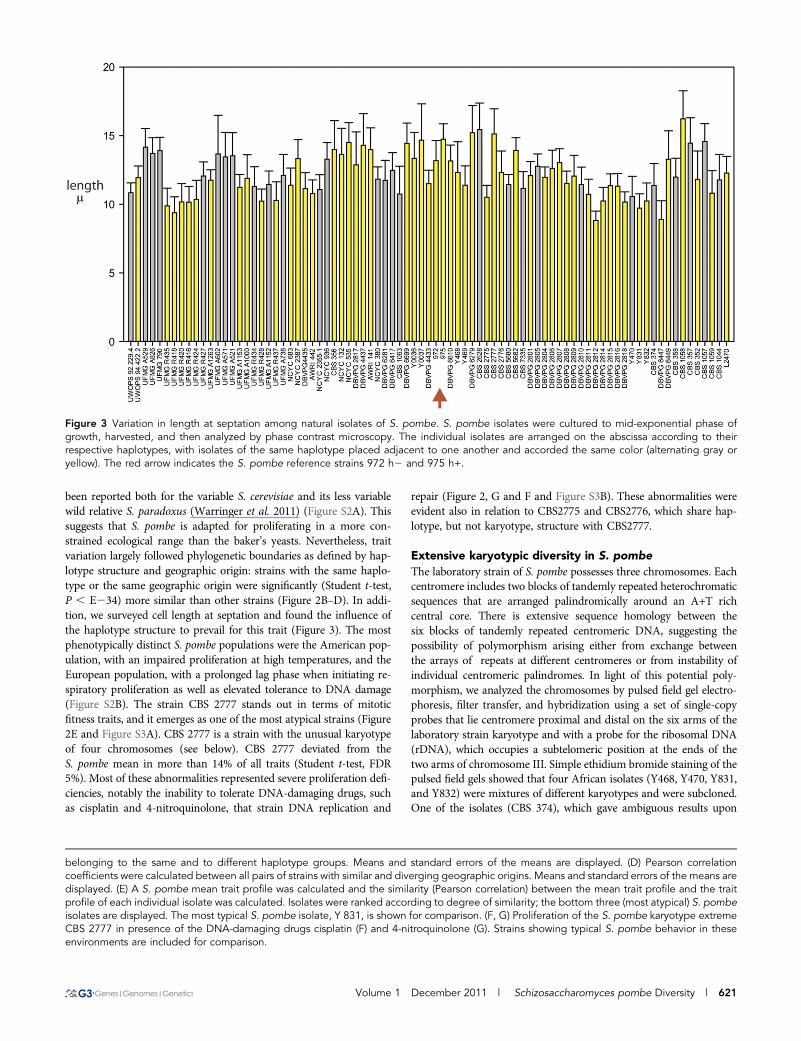
been reported both for the variable S. cerevisiae and its less variablewild relative S. paradoxus (Warringer et al. 2011) (Figure S2A). Thissuggests that S. pombe is adapted for proliferating in a more con-strained ecological range than the baker’s yeasts. Nevertheless, traitvariation largely followed phylogenetic boundaries as defined by hap-lotype structure and geographic origin: strains with the same haplo-type or the same geographic origin were significantly (Student t-test,P , E234) more similar than other strains (Figure 2B–D). In addi-tion, we surveyed cell length at septation and found the influence ofthe haplotype structure to prevail for this trait (Figure 3). The mostphenotypically distinct S. pombe populations were the American pop-ulation, with an impaired proliferation at high temperatures, and theEuropean population, with a prolonged lag phase when initiating re-spiratory proliferation as well as elevated tolerance to DNA damage(Figure S2B). The strain CBS 2777 stands out in terms of mitoticfitness traits, and it emerges as one of the most atypical strains (Figure2E and Figure S3A). CBS 2777 is a strain with the unusual karyotypeof four chromosomes (see below). CBS 2777 deviated from theS. pombe mean in more than 14% of all traits (Student t-test, FDR5%). Most of these abnormalities represented severe proliferation defi-ciencies, notably the inability to tolerate DNA-damaging drugs, suchas cisplatin and 4-nitroquinolone, that strain DNA replication and
repair (Figure 2, G and F and Figure S3B). These abnormalities wereevident also in relation to CBS2775 and CBS2776, which share hap-lotype, but not karyotype, structure with CBS2777.
Extensive karyotypic diversity in S. pombe
The laboratory strain of S. pombe possesses three chromosomes. Eachcentromere includes two blocks of tandemly repeated heterochromaticsequences that are arranged palindromically around an A+T richcentral core. There is extensive sequence homology between thesix blocks of tandemly repeated centromeric DNA, suggesting thepossibility of polymorphism arising either from exchange betweenthe arrays of repeats at different centromeres or from instability ofindividual centromeric palindromes. In light of this potential poly-morphism, we analyzed the chromosomes by pulsed field gel electro-phoresis, filter transfer, and hybridization using a set of single-copyprobes that lie centromere proximal and distal on the six arms of thelaboratory strain karyotype and with a probe for the ribosomal DNA(rDNA), which occupies a subtelomeric position at the ends of thetwo arms of chromosome III. Simple ethidium bromide staining of thepulsed field gels showed that four African isolates (Y468, Y470, Y831,and Y832) were mixtures of different karyotypes and were subcloned.One of the isolates (CBS 374), which gave ambiguous results upon
Figure 3 Variation in length at septation among natural isolates of S. pombe. S. pombe isolates were cultured to mid-exponential phase ofgrowth, harvested, and then analyzed by phase contrast microscopy. The individual isolates are arranged on the abscissa according to theirrespective haplotypes, with isolates of the same haplotype placed adjacent to one another and accorded the same color (alternating gray oryellow). The red arrow indicates the S. pombe reference strains 972 h2 and 975 h+.
belonging to the same and to different haplotype groups. Means and standard errors of the means are displayed. (D) Pearson correlationcoefficients were calculated between all pairs of strains with similar and diverging geographic origins. Means and standard errors of the means aredisplayed. (E) A S. pombe mean trait profile was calculated and the similarity (Pearson correlation) between the mean trait profile and the traitprofile of each individual isolate was calculated. Isolates were ranked according to degree of similarity; the bottom three (most atypical) S. pombeisolates are displayed. The most typical S. pombe isolate, Y 831, is shown for comparison. (F, G) Proliferation of the S. pombe karyotype extremeCBS 2777 in presence of the DNA-damaging drugs cisplatin (F) and 4-nitroquinolone (G). Strains showing typical S. pombe behavior in theseenvironments are included for comparison.
Volume 1 December 2011 | Schizosaccharomyces pombe Diversity | 621
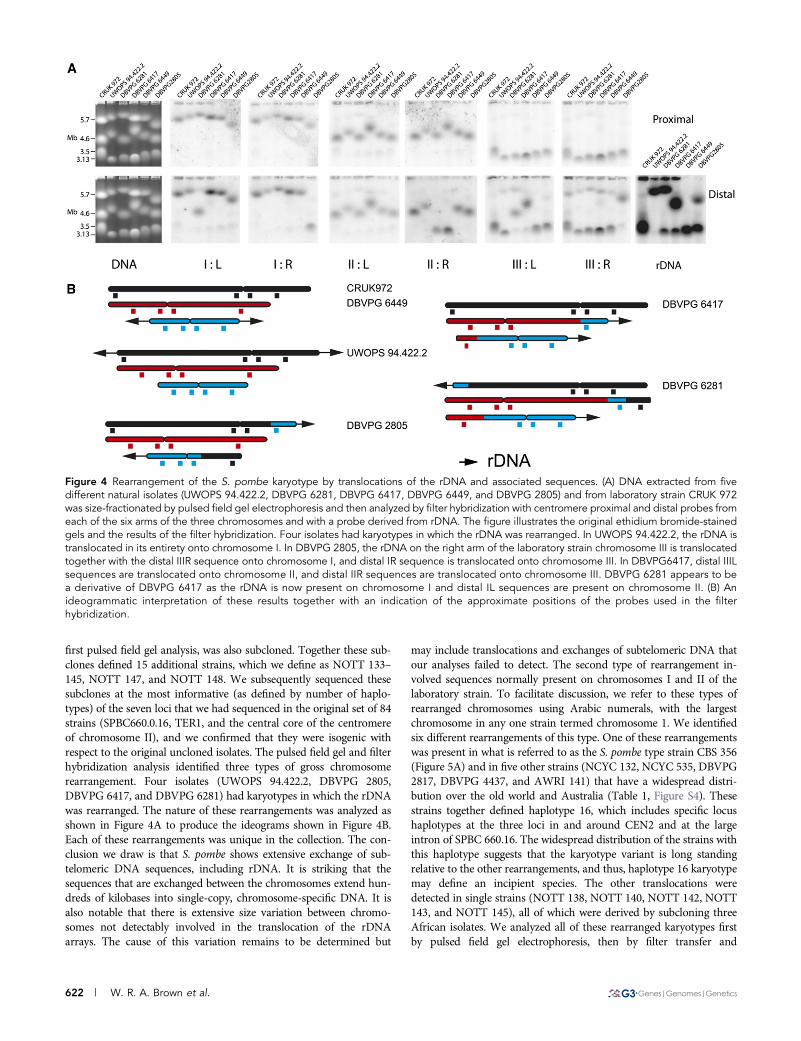
first pulsed field gel analysis, was also subcloned. Together these sub-clones defined 15 additional strains, which we define as NOTT 133–145, NOTT 147, and NOTT 148. We subsequently sequenced thesesubclones at the most informative (as defined by number of haplo-types) of the seven loci that we had sequenced in the original set of 84strains (SPBC660.0.16, TER1, and the central core of the centromereof chromosome II), and we confirmed that they were isogenic withrespect to the original uncloned isolates. The pulsed field gel and filterhybridization analysis identified three types of gross chromosomerearrangement. Four isolates (UWOPS 94.422.2, DBVPG 2805,DBVPG 6417, and DBVPG 6281) had karyotypes in which the rDNAwas rearranged. The nature of these rearrangements was analyzed asshown in Figure 4A to produce the ideograms shown in Figure 4B.Each of these rearrangements was unique in the collection. The con-clusion we draw is that S. pombe shows extensive exchange of sub-telomeric DNA sequences, including rDNA. It is striking that thesequences that are exchanged between the chromosomes extend hun-dreds of kilobases into single-copy, chromosome-specific DNA. It isalso notable that there is extensive size variation between chromo-somes not detectably involved in the translocation of the rDNAarrays. The cause of this variation remains to be determined but
may include translocations and exchanges of subtelomeric DNA thatour analyses failed to detect. The second type of rearrangement in-volved sequences normally present on chromosomes I and II of thelaboratory strain. To facilitate discussion, we refer to these types ofrearranged chromosomes using Arabic numerals, with the largestchromosome in any one strain termed chromosome 1. We identifiedsix different rearrangements of this type. One of these rearrangementswas present in what is referred to as the S. pombe type strain CBS 356(Figure 5A) and in five other strains (NCYC 132, NCYC 535, DBVPG2817, DBVPG 4437, and AWRI 141) that have a widespread distri-bution over the old world and Australia (Table 1, Figure S4). Thesestrains together defined haplotype 16, which includes specific locushaplotypes at the three loci in and around CEN2 and at the largeintron of SPBC 660.16. The widespread distribution of the strains withthis haplotype suggests that the karyotype variant is long standingrelative to the other rearrangements, and thus, haplotype 16 karyotypemay define an incipient species. The other translocations weredetected in single strains (NOTT 138, NOTT 140, NOTT 142, NOTT143, and NOTT 145), all of which were derived by subcloning threeAfrican isolates. We analyzed all of these rearranged karyotypes firstby pulsed field gel electrophoresis, then by filter transfer and
Figure 4 Rearrangement of the S. pombe karyotype by translocations of the rDNA and associated sequences. (A) DNA extracted from fivedifferent natural isolates (UWOPS 94.422.2, DBVPG 6281, DBVPG 6417, DBVPG 6449, and DBVPG 2805) and from laboratory strain CRUK 972was size-fractionated by pulsed field gel electrophoresis and then analyzed by filter hybridization with centromere proximal and distal probes fromeach of the six arms of the three chromosomes and with a probe derived from rDNA. The figure illustrates the original ethidium bromide-stainedgels and the results of the filter hybridization. Four isolates had karyotypes in which the rDNA was rearranged. In UWOPS 94.422.2, the rDNA istranslocated in its entirety onto chromosome I. In DBVPG 2805, the rDNA on the right arm of the laboratory strain chromosome III is translocatedtogether with the distal IIIR sequence onto chromosome I, and distal IR sequence is translocated onto chromosome III. In DBVPG6417, distal IIILsequences are translocated onto chromosome II, and distal IIR sequences are translocated onto chromosome III. DBVPG 6281 appears to bea derivative of DBVPG 6417 as the rDNA is now present on chromosome I and distal IL sequences are present on chromosome II. (B) Anideogrammatic interpretation of these results together with an indication of the approximate positions of the probes used in the filterhybridization.
622 | W. R. A. Brown et al.
Volume 1 December 2011 | Schizosaccharomyces pombe Diversity | 623
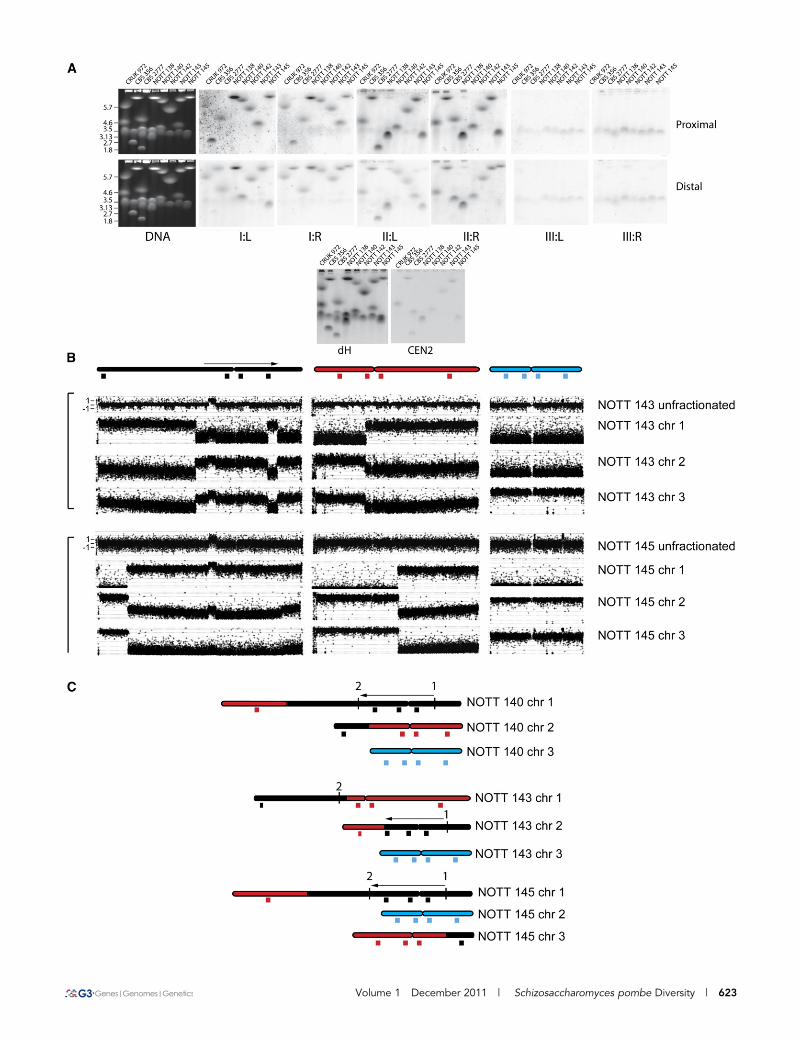
hybridization (Figure 5A), and then for two of the karyotypes, NOTT143 and NOTT 145, by comparative genomic hybridization (CGH) ofgel-purified chromosomes to microarrays (Figure 5B), followed byPCR analysis and sequencing (File S1) across hypothetical breakpointsto produce the maps shown in Figure 5C. These demonstrate featuresheld in common by the two rearrangements, first they are both trans-locations, and second, they both share a 2,227,883 bp pericentric in-version with respect to chromosome I of the laboratory strain. PCRshowed that this inversion is present in all of the strains in the col-lection with the exception of DBVPG 2805, DBVPG 6610, DBVPG4433, DBVPG 6279, DBVPG 6699, CRUK 972, and CRUK 975. Thesestrains belong to haplotype 18 or the closely related haplotype 25.
However, these strains have a widespread distribution, which sug-gested that the laboratory strain arrangement and possibly other rear-rangements on a shared background are acting as barriers to fertilemating. Sequencing across the inversion and translocation breakpoints(File S1, and Figure S5) showed only microhomology in two of fivesequences involved in the exchanges. Repetitive sequences were ab-sent. This fact that the 2.23 Mb inversion was present in a minority ofstrains also suggested that the sequence arrangement in the laboratorystrain was a derived trait, which we confirmed by comparison with thearrangement of the homologous sequences in S. octosporus andS. cryophilus (not shown). Pulsed field gel and filter hybridizationanalysis (Figure 5A) indicated that the rearrangements in NOTT
Figure 5 Rearrangement of the S. pombe karyotype by translocations between chromosomes I and II. (A) DNA extracted from seven differentnatural isolates (CBS 356, CBS2777, NOTT 136, NOTT 140, NOTT 142, NOTT 143, and NOTT 145) and laboratory strain CRUK 972 was size-fractionated by pulsed field gel electrophoresis and then analyzed after transfer by filter hybridization with centromere proximal and distal probesfrom each of the six arms of the three chromosomes and with probes for the centromeric dGdH repeat and the central core of chromosome II. Thefigure illustrates the original ethidium bromide-stained gels and the results of the filter hybridization. (B) DNA was extracted from strains NOTT143 and NOTT 145, size fractionated by pulsed field gel electrophoresis, and analyzed together with unfractionated DNA by CGH using Agilent44K ChIP on CHIP arrays using unfractionated DNA from the laboratory strain CRUK 975 as competitor. In the case of NOTT 145, chromosomes 2and 3 are very similar in size; there is cross contamination in the CGH experiments, but this does not obscure the details of the translocationbetween sequences that normally reside on chromosomes I and II. (C) Ideogrammatic representation of the CGH results together with anindication of the approximate positions of the probes used in the filter hybridization. Also indicated is the position of the 2.3 Mb pericentricinversion of sequences with respect to laboratory strain chromosome I. This inversion is present in both NOTT 143, as indicated by the results ofthe CGH experiments, and NOTT 143, as indicated by the results of PCR analysis. For a detailed discussion of the experimental approachesneeded to define the rearrangements, see File S1.
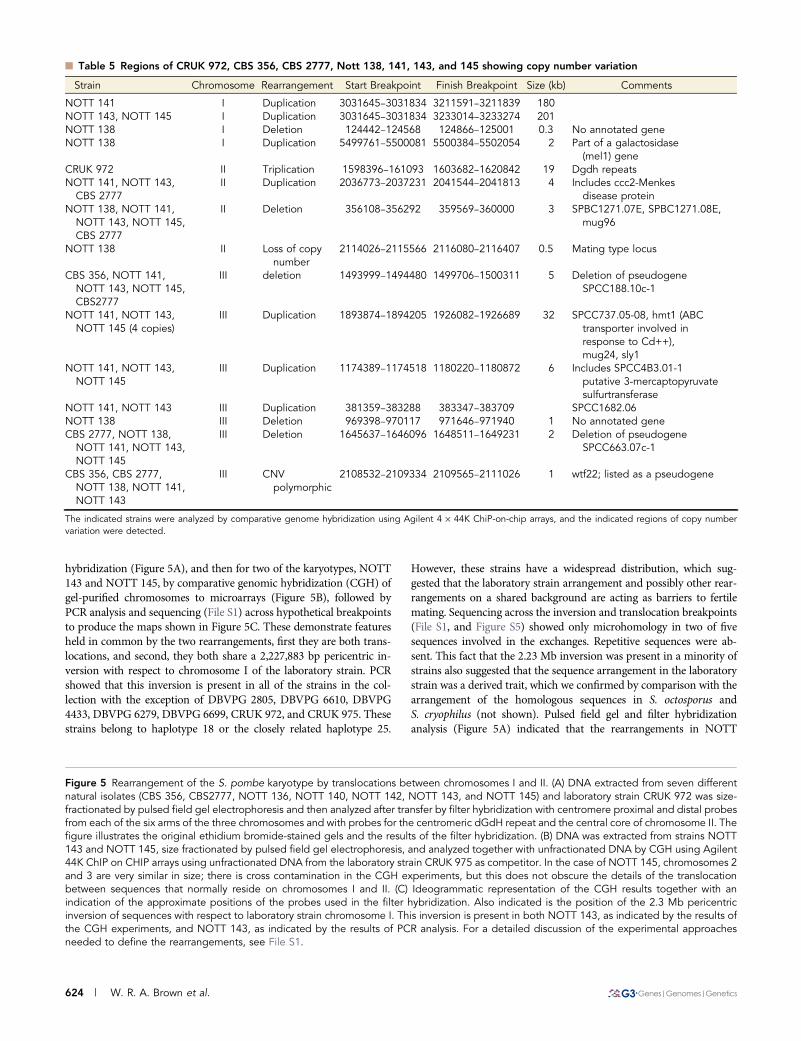
n Table 5 Regions of CRUK 972, CBS 356, CBS 2777, Nott 138, 141, 143, and 145 showing copy number variation
Strain Chromosome Rearrangement Start Breakpoint Finish Breakpoint Size (kb) Comments
NOTT 141 I Duplication 3031645–3031834 3211591–3211839 180NOTT 143, NOTT 145 I Duplication 3031645–3031834 3233014–3233274 201NOTT 138 I Deletion 124442–124568 124866–125001 0.3 No annotated geneNOTT 138 I Duplication 5499761–5500081 5500384–5502054 2 Part of a galactosidase
(mel1) geneCRUK 972 II Triplication 1598396–161093 1603682–1620842 19 Dgdh repeatsNOTT 141, NOTT 143,
CBS 2777II Duplication 2036773–2037231 2041544–2041813 4 Includes ccc2-Menkes
disease proteinNOTT 138, NOTT 141,
NOTT 143, NOTT 145,CBS 2777
II Deletion 356108–356292 359569–360000 3 SPBC1271.07E, SPBC1271.08E,mug96
NOTT 138 II Loss of copynumber
2114026–2115566 2116080–2116407 0.5 Mating type locus
CBS 356, NOTT 141,NOTT 143, NOTT 145,CBS2777
III deletion 1493999–1494480 1499706–1500311 5 Deletion of pseudogeneSPCC188.10c-1
NOTT 141, NOTT 143,NOTT 145 (4 copies)
III Duplication 1893874–1894205 1926082–1926689 32 SPCC737.05-08, hmt1 (ABCtransporter involved inresponse to Cd++),mug24, sly1
NOTT 141, NOTT 143,NOTT 145
III Duplication 1174389–1174518 1180220–1180872 6 Includes SPCC4B3.01-1putative 3-mercaptopyruvatesulfurtransferase
NOTT 141, NOTT 143 III Duplication 381359–383288 383347–383709 SPCC1682.06NOTT 138 III Deletion 969398–970117 971646–971940 1 No annotated geneCBS 2777, NOTT 138,
NOTT 141, NOTT 143,NOTT 145
III Deletion 1645637–1646096 1648511–1649231 2 Deletion of pseudogeneSPCC663.07c-1
CBS 356, CBS 2777,NOTT 138, NOTT 141,NOTT 143
III CNVpolymorphic
2108532–2109334 2109565–2111026 1 wtf22; listed as a pseudogene
The indicated strains were analyzed by comparative genome hybridization using Agilent 4 · 44K ChiP-on-chip arrays, and the indicated regions of copy numbervariation were detected.
624 | W. R. A. Brown et al.
140 and 142 were also simple reciprocal translocations, and they werenot characterized further. Filter hybridization and CGH microarrayanalysis showed that CBS 356 and NOTT 138 also contained trans-locations or transpositions, but in both cases, one of the two partnerchromosomes was not detectably rearranged when analyzed by CGHon microarrays (not shown). The simplest explanation for theseresults is that one of the breakpoints is close to a telomere.
In addition to the analyses of the chromosomal rearrangements inCBS 356, NOTT 138, NOTT 140, and NOTT 142, we carried outcomparative genomic hybridization (CGH) and microarray analysisCGH on unfractionated DNA of strains CRUK 972, NOTT 141,NOTT 143, NOTT 145, and CBS 2777 using CRUK 975 DNA asa competitor. This CGH analysis detected extensive regions of copynumber variation (Table 5). Three of the eight regions that are am-plified include genes that are involved in resistance to heavy metals,consistent with exposure to Bordeaux mixture (CuSO4/Ca(OH)2) usedas a fungicide in vineyards.
The strain CBS 2777 contained four chromosomes (Figure 5A).Preliminary pulsed field gel and filter hybridization analysis of intactchromosomal DNA demonstrated a complex pattern of sequencerearrangements. Detailed functional and structural analysis of thisstrain will be described elsewhere.
DISCUSSIONIn many organisms, natural isolates have been a source of variation forthe analysis of pathways and processes of basic biological interest. Inthe short term, the aim of such studies is to increase knowledge of thecomponents of these pathways and processes, whereas in the longterm, the aim is to understand the architecture of a trait or feature atall levels from DNA to phenotype in terms of the ecology of therespective organism (Mackay et al. 2009). We initiated the study of thevariation of S. pombe because this organism is easy and cheap tomanipulate and analyze and because much is known about the cellbiology of S. pombe. We showed that the amount of phenotypicvariation segregating in S. pombe is small in comparison to that seen,for example, in S. cerevisiae and that the existence of karyotypicrearrangements may limit access to some of it. We conclude thatthe variation that does exist (in size, for example) will need to bestudied in a focused way. Our pulsed field gel-based approach is likelyto have revealed the presence of only a subset of the translocations,inversions, and deletions segregating in the collection, and thus, a sub-set of strains, segregating a trait of particular interest, will need to becompletely sequenced and characterized in terms of rearrangements.In light of the expense required to carry out such work, it would seemprudent to start with the most significant of the variable traits andcharacterize the strains segregating this variation first.
Cell size is a feature of the biology of S. pombe that has beenintensively studied, is of general biological importance, and shows clearevidence of variation among the different isolates. Such variation is alsoobserved in budding yeast (Nogami et al. 2007). It may be that thisvariation is adaptively neutral, and the correlation between the size ofparticular haplotype and the source from which it is isolated that isobserved in haplotypes 3 and 4 of Brazilian origin has arisen by drift.Alternatively, the variation may be adaptively significant and related tothe fact that the strains were isolated from different environments:caçhaca must (haplotype 3) or the frozen pulp of Eugenia uniflora(haplotye 4). A combination of experimental and ecological studiesshould discriminate between these alternative explanations and im-prove our understanding of this important aspect of cell physiology.
Although karyotypic diversity will make it necessary to adapt andapply the approaches used to exploit diversity in other model
organisms to S. pombe, karyotype diversity is itself of interest. Thus,an understanding of the karyotype diversity is essential if we are tounderstand the nucleotide diversity because inversion and transloca-tions will limit exchange between segments of DNA and strains. Rear-ranged chromosomes have been useful as both genetic reagents and interms of their ability to cast new and often unexpected perspectives onfundamental problems. Thus the discovery of strain CBS 2777 withfour chromosomes poses interesting questions about the mechanismof formation of additional centromeres and telomeres. The unexpect-edly high levels of karyotypic diversity that characterize S. pombeworldwide also require explanation in population genetic and mech-anistic terms. The simplest explanation, at the population geneticlevel, is that S. pombe exists in small, rarely out-crossing populationsthat favor the accumulation of weakly deleterious mutations, includingkaryotypic rearrangements. This explanation is consistent with boththe pattern of linkage distribution around CEN2 and TER1 and withthe observation that most of the rearrangements occur once in thecollection or are confined to single haplotypes (Table S2). Note, how-ever, that our perspective on out-crossing is based on only two regionsof the genome and the patterns of LD within these regions will in turnbe sensitive to whether they include any common rearrangements.Genome-wide estimates of LD will thus also require a knowledge ofthe karyotype diversity. A second, and not exclusive, adaptive expla-nation for the high levels of karyotypic diversity at the populationgenetic level is suggested by the isogenic rearrangements isolated bysubcloning the African strains Y468, Y470, Y831, and Y832. The factthat the substrains are isogenic at the sequence level, vary karyotyp-ically, and are derived from the same isolates raises the possibility thatadaptive radiation may be occurring within in a limited geographicarea and that the rearrangements are acting to isolate variants adaptedto different, specific subniches. Although it may be possible to in-vestigate such hypothetical microspeciation, a potential limitation ofthis line of work is that the traits under selection may be significantonly for yeast ecology (e.g. sugar utilization) and not of general in-terest as regards eukaryotic cell biology. However, it seems worthwhileto study this aspect of the biology of S. pombe because speciation isa problem of general interest that remains incompletely understood,and S. pombe offers the possibility of rigorous analysis and under-standing. In this respect, our population level approach extends thecomparative genomics analysis of four different Schizosaccharomycesspecies by Rhind et al. (2011). Deeper understanding at both levelsshould help cast light on the mode and tempo of speciation in Schiz-osaccharomyces spp. and, in particular, on the relative significance ofkaryotypic and gene incompatibility as isolating mechanisms in thisgenus (Greig 2009).
It is clear from our analysis that our understanding of the originsand spread of S. pombe would be improved not only by more se-quence data and data about the rearrangements segregating in thepopulation but also by the collection and analysis of many morestrains from around the world. S. pombe will grow at high concen-trations of glucose and at low pH. An enrichment medium for S.pombe has been described (Florenzano et al. 1977). Thus, it may bepossible to collect many more strains, although the ease with whichthis might be done is not yet clear. In particular, more strains fromAfrica and South and East Asia will be necessary to establish thegeographic origins and phylogeny of the species. The success of theBrazilian collection expeditions suggests that it should be possible toisolate such strains. This work should also help define the range ofenvironments that harbor S. pombe, provide additional karyotypicvariants, and perhaps identify convenient locations for field work.
Volume 1 December 2011 | Schizosaccharomyces pombe Diversity | 625
ACKNOWLEDGMENTSWe thank André Lachance, Gert Marais, Jacky Hayles, and EvelineBartowsky for strains; Jürg Kohli for information about the origin ofthe laboratory strain; and Sheila McCormick (PGEC, Albany, Califor-nia) and John Armour (Nottingham University) for comments on themanuscript. This work was supported by grants from the GeneticsSociety (UK) and Nottingham University.
LITERATURE CITEDAtwell, S., Y. S. Huang, B. J. Vilhjalmsson, G. Willems, M. Horton et al.,
2010 Genome-wide association study of 107 phenotypes in Arabidopsisthaliana inbred lines. Nature 465: 627–631.
Brown, W. R. A., 1988 A physical map of the human pseudoautosomalregion. EMBO J. 7: 2377–2385.
Brown, W. R. A., P. J. MacKinnon, A. Villasante, N. Spurr, V. J. Buckle et al.,1990 Structure and polymorphism of human telomere-associated DNA.Cell 63: 119–132.
Cockerham, C. C., and B. S. Weir, 1984 Covariances of relatives stemmingfrom a population undergoing mixed self and random mating. Biometrics40: 157–164.
Corander, J., P. Marttinen, J. Siren, and J. Tang, 2008 Enhanced Bayesianmodelling in BAPS software for learning genetic structures of popula-tions. BMC Bioinformatics 9: 539.
R. Egel (Editor), 2003 The Molecular Biology of Schizosaccharomycespombe. Springer-Verlag, Berlin.
Excoffier, L., G. Laval, and S. Schneider, 2005 Arlequin (version 3.0): anintegrated software package for population genetics data analysis. Evol.Bioinform. Online 1: 47–50.
Fay, J. C., and J. A. Benavides, 2005 Evidence for domesticated and wildpopulations of Saccharomyces cerevisiae. PLoS Genet. 1: 66–71.
Florenzano, G., W. Balloni, and R. Materasisi, 1977 Contributo alla acologiadei lieviti Schizosaccharomyces sulle uve. Vitis 16: 38–44.
Fournier-Level, A., A. Korte, M. D. Cooper, M. Nordborg, J. Schmitt et al.,2011 A map of local adaptation in Arabidopsis thaliana. Science 334:86–89.
Gomes, F. C., C. Pataro, J. B. Guerra, M. J. Neves, S. R. Correa et al.,2002 Physiological diversity and trehalose accumulation in Schizosac-charomyces pombe strains isolated from spontaneous fermentationsduring the production of the artisanal Brazilian cachaca. Can. J. Micro-biol. 48: 399–406.
Gordon, J. L., K. P. Byrne, and K. H. Wolfe, 2011 Mechanisms of chro-mosome number evolution in yeast. PLoS Genet. 7: e1002190.
Greig, D., 2009 Reproductive isolation in Saccharomyces. Heredity 102: 39–44.
Johnson, L. J., V. Koufopanou, M. R. Goddard, R. Hetherington, S. M. Schaferet al., 2004 Population genetics of the wild yeast Saccharomyces para-doxus. Genetics 166: 43–52.
Kim, S., V. Plagnol, T. T. Hu, C. Toomajian, R. M. Clark et al.,2007 Recombination and linkage disequilibrium in Arabidopsis thali-ana. Nat. Genet. 39: 1151–1155.
Leupold, U., 1950 Die Vererbung von Homothallie und Heterothallie beiSchizosaccharomyces pombe. Cr. Trav. Lab. Carlsberg Ser. Physiol. 24:381–480.
Librado, P., and J. Rozas, 2009 DnaSP v5: a software for comprehensiveanalysis of DNA polymorphism data. Bioinformatics 25: 1451–1452.
Liti, G., D. M. Carter, A. M. Moses, J. Warringer, L. Parts et al.,2009 Population genomics of domestic and wild yeasts. Nature 458:337–341.
Lynch, M., W. Sung, K. Morris, N. Coffey, C. R. Landry et al., 2008 Agenome-wide view of the spectrum of spontaneous mutations in yeast.Proc. Natl. Acad. Sci. USA 105: 9272–9277.
Mackay, T. F., E. A. Stone, and J. F. Ayroles, 2009 The genetics of quan-titative traits: challenges and prospects. Nat. Rev. Genet. 10: 565–577.
Nemri, A., S. Atwell, A. M. Tarone, Y. S. Huang, K. Zhao et al.,2010 Genome-wide survey of Arabidopsis natural variation in downymildew resistance using combined association and linkage mapping.Proc. Natl. Acad. Sci. USA 107: 10302–10307.
Nieduszynski, C. A., and G. Liti, 2011 From sequence to function: insightsfrom natural variation in budding yeasts. Biochim. Biophys. Acta 1810:959–966.
Nogami, S., Y. Ohya, and G. Yvert, 2007 Genetic complexity and quanti-tative trait loci mapping of yeast morphological traits. PLoS Genet. 3: e31.
Nordborg, M., and D. Weigel, 2008 Next-generation genetics in plants.Nature 456: 720–723.
Parts, L., F. A. Cubillos, J. Warringer, K. Jain, F. Salinas et al.,2011 Revealing the genetic structure of a trait by sequencing a popula-tion under selection. Genome Res. 21: 1131–1138.
Pritchard, J. K., M. Stephens, and P. Donnelly, 2000 Inference of populationstructure using multilocus genotype data. Genetics 155: 945–959.
Rhind, N., Z. Chen, M. Yassour, D. A. Thompson, B. J. Haas et al.,2011 Comparative functional genomics of the fission yeasts. Science332: 930–936.
Ruderfer, D. M., S. C. Pratt, H. S. Seidel, and L. Kruglyak, 2006 Populationgenomic analysis of outcrossing and recombination in yeast. Nat. Genet.38: 1077–1081.
Schacherer, J., J. A. Shapiro, D. M. Ruderfer, and L. Kruglyak,2009 Comprehensive polymorphism survey elucidates populationstructure of Saccharomyces cerevisiae. Nature 458: 342–345.
Smith, C. L., T. Matsumoto, O. Niwa, S. Klco, J. B. Fan et al., 1987 Anelectrophoretic karyotype for Schizosaccharomyces pombe by pulsed fieldgel electrophoresis. Nucleic Acids Res. 15: 4481–4489.
Todesco, M., S. Balasubramanian, T. T. Hu, M. B. Traw, M. Horton et al.,2010 Natural allelic variation underlying a major fitness trade-off inArabidopsis thaliana. Nature 465: 632–636.
Torabi, N., and L. Kruglyak, 2011 Variants in SUP45 and TRM10 underlienatural variation in translation termination efficiency in Saccharomycescerevisiae. PLoS Genet. 7: e1002211.
Tsai, I. J., D. Bensasson, A. Burt, and V. Koufopanou, 2008 Populationgenomics of the wild yeast Saccharomyces paradoxus: quantifying the lifecycle. Proc. Natl. Acad. Sci. USA 105: 4957–4962.
Warringer, J., D. Anevski, B. Liu, and A. Blomberg, 2008 Chemogeneticfingerprinting by analysis of cellular growth dynamics. BMC Chem. Biol.8: 3.
Warringer, J., and A. Blomberg, 2003 Automated screening in environ-mental arrays allows analysis of quantitative phenotypic profiles in Sac-charomyces cerevisiae. Yeast 20: 53–67.
Warringer, J., E. Zorgo, F. A. Cubillos, A. Zia, A. Gjuvsland et al.,2011 Trait variation in yeast is defined by population history. PLoSGenet. 7: e1002111.
Communicating editor: J. C. Fay
626 | W. R. A. Brown et al.