Glucocorticoid receptor mRNA in Alzheimer's diseased hippocampus
BioMed CentralBMC Medical Genomics
ss
Open AcceResearch articleA genome-wide association study for late-onset Alzheimer's disease using DNA poolingRichard Abraham1, Valentina Moskvina1,2, Rebecca Sims1, Paul Hollingworth1, Angharad Morgan1, Lyudmila Georgieva1, Kimberley Dowzell1, Sven Cichon3, Axel M Hillmer3, Michael C O'Donovan1, Julie Williams1,2, Michael J Owen*1 and George Kirov1Address: 1Department of Psychological Medicine, Cardiff University School of Medicine, Heath Park, Cardiff, CF14 4XN, UK, 2Biostatistics & Bioinformatics Unit, Cardiff University School of Medicine, Heath Park, Cardiff, CF14 4XN, UK and 3Department of Genomics, Life & Brain Center, University of Bonn, Sigmund-Freud-Strasse 25, D-53127 Bonn, Germany
Email: Richard Abraham - [email protected]; Valentina Moskvina - [email protected]; Rebecca Sims - [email protected]; Paul Hollingworth - [email protected]; Angharad Morgan - [email protected]; Lyudmila Georgieva - [email protected]; Kimberley Dowzell - [email protected]; Sven Cichon - [email protected]; Axel M Hillmer - [email protected]; Michael C O'Donovan - [email protected]; Julie Williams - [email protected]; Michael J Owen* - [email protected]; George Kirov - [email protected]
* Corresponding author
AbstractBackground: Late-onset Alzheimer's disease (LOAD) is an age related neurodegenerative diseasewith a high prevalence that places major demands on healthcare resources in societies withincreasingly aged populations. The only extensively replicable genetic risk factor for LOAD is theapolipoprotein E gene. In order to identify additional genetic risk loci we have conducted a genome-wide association (GWA) study in a large LOAD case – control sample, reducing costs through theuse of DNA pooling.
Methods: DNA samples were collected from 1,082 individuals with LOAD and 1,239 controlsubjects. Age at onset ranged from 60 to 95 and Controls were matched for age (mean = 76.53years, SD = 33), gender and ethnicity. Equimolar amounts of each DNA sample were added toeither a case or control pool. The pools were genotyped using Illumina HumanHap300 and IlluminaSentrix HumanHap240S arrays testing 561,494 SNPs. 114 of our best hit SNPs from the poolingdata were identified and then individually genotyped in the case – control sample used to constructthe pools.
Results: Highly significant association with LOAD was observed at the APOE locus confirming thevalidity of the pooled genotyping approach.
For 109 SNPs outside the APOE locus, we obtained uncorrected p-values ≤ 0.05 for 74 afterindividual genotyping. To further test these associations, we added control data from 1400 subjectsfrom the 1958 Birth Cohort with the evidence for association increasing to 3.4 × 10⁻⁶ for ourstrongest finding, rs727153.
Published: 29 September 2008
BMC Medical Genomics 2008, 1:44 doi:10.1186/1755-8794-1-44
Received: 10 April 2008Accepted: 29 September 2008
This article is available from: http://www.biomedcentral.com/1755-8794/1/44
© 2008 Abraham et al; licensee BioMed Central Ltd. This is an Open Access article distributed under the terms of the Creative Commons Attribution License (http://creativecommons.org/licenses/by/2.0), which permits unrestricted use, distribution, and reproduction in any medium, provided the original work is properly cited.
Page 1 of 13(page number not for citation purposes)
BMC Medical Genomics 2008, 1:44 http://www.biomedcentral.com/1755-8794/1/44
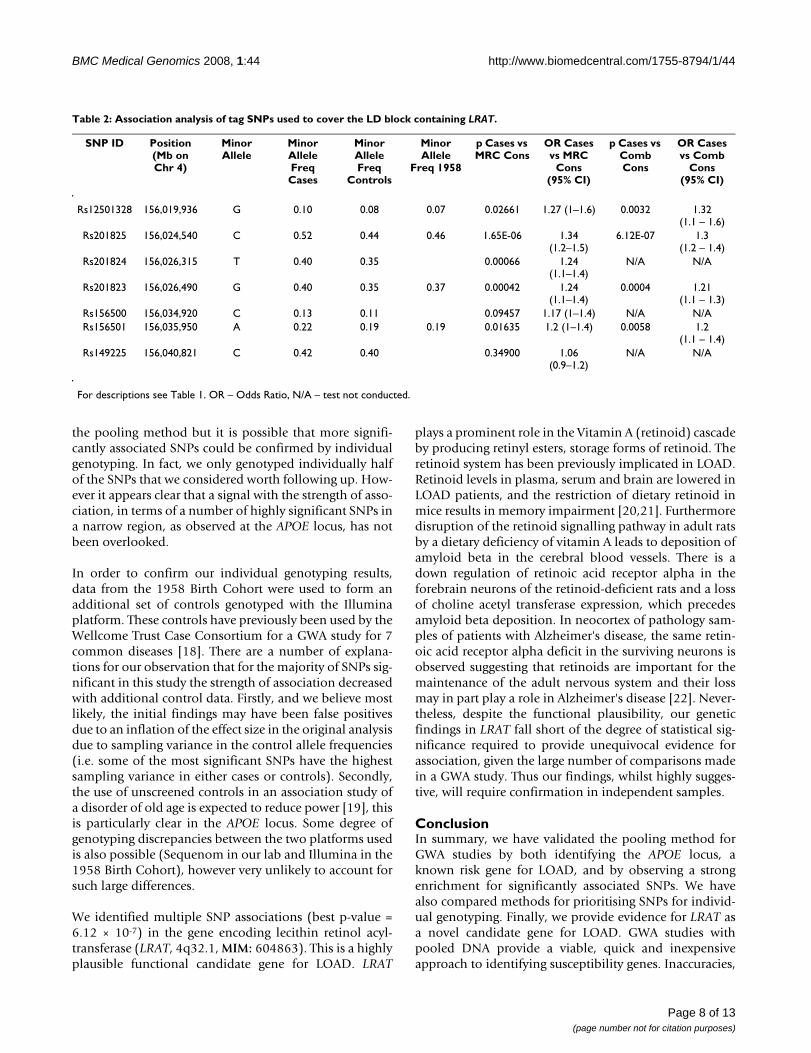
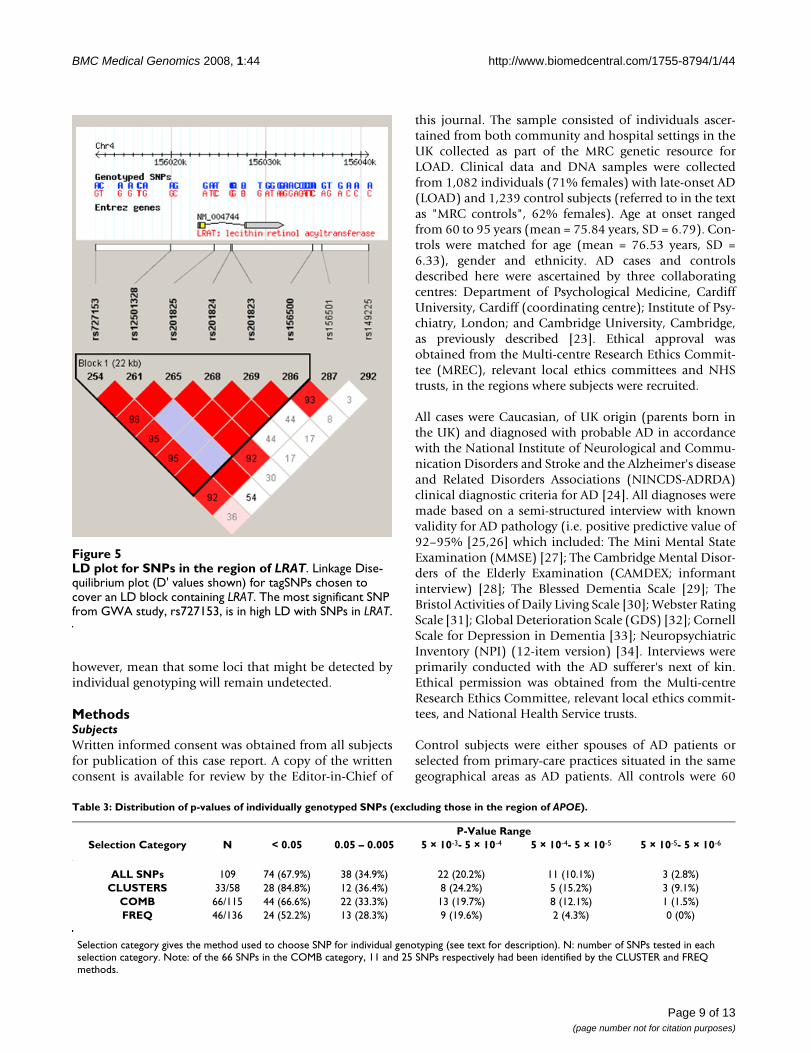
rs727153 lies 13 kb from the start of transcription of lecithin retinol acyltransferase(phosphatidylcholine – retinol O-acyltransferase, LRAT). Five of seven tag SNPs chosen to coverLRAT showed significant association with LOAD with a SNP in intron 2 of LRAT, showing greatestevidence of association (rs201825, p-value = 6.1 × 10⁻⁷).
Conclusion: We have validated the pooling method for GWA studies by both identifying the APOElocus and by observing a strong enrichment for significantly associated SNPs. We provide evidencefor LRAT as a novel candidate gene for LOAD. LRAT plays a prominent role in the Vitamin A cascade,a system that has been previously implicated in LOAD.
BackgroundLate-onset Alzheimer's disease (LOAD) is an age relatedneurodegenerative disease and the most common form ofdementia in the over 65 age group. It affects 20% of peo-ple aged 75 – 84 years, rising to 50% in the over 85's, thusplacing major demands on healthcare resources in socie-ties with increasingly aged populations [1]. It has a highheritability with estimates ranging between 60 – 80% [2].The only extensively replicable genetic risk factor forLOAD is the apolipoprotein E gene, in which the ε4 gen-otype is overrepresented in LOAD cases compared to con-trols. The ε2 genotype is underrepresented and believed tohave a protective effect on disease development. Howeverthe presence of the APOE-ε4 genotype is neither necessarynor sufficient for the development of the disease, indeed40 – 70% of European LOAD patients do not carry an ε4variant, and additional genetic loci remain to be identi-fied [3].
Recent advances in genotyping technology make it possi-ble to conduct genome-wide association (GWA) studies,testing the whole genome with hundreds of thousands ofsingle nucleotide polymorphisms (SNPs). For a complexdisease such as LOAD, in which multiple genetic and envi-ronmental factors are thought to contribute to risk [2,4]GWA studies offer the potential to detect susceptibilitygenes with greater confidence than with linkage analysis.It has been estimated that over 80% of genetic variation ofcommon SNPs of the human genome in European popu-lations can be captured at an r2 > 0.8 by using current SNPgenotyping arrays [5].
In order to detect variants of small effect, particularly if theassociation is indirect, and to overcome the issue of mul-tiple testing, large sample sizes are required [6,7]. Cur-rently, GWA studies are expensive, generally restrictingthis type of work to groups or consortia with substantialfunding for that purpose. Genome-wide association anal-ysis of pools of case and control DNA offers an economicapproach with the potential to identify disease loci [8-10].In DNA pooling, equal amounts of DNA from each sam-ple are combined to form pools from cases and controls,which are genotyped to get an estimate of the true allelefrequency difference for each variant. This estimate is then
used to test a limited number of SNPs for genetic associa-tion at a fraction of the cost of individual genotyping[9,11,12].
In this study, 561,494 SNPs were genotyped in DNA poolsconstructed from the Medical Research Council (MRC)Genetic Resource for LOAD case – control samples. Inorder to select SNPs for testing by individual genotyping,we applied three complimentary approaches to select thehighest-ranked SNPs. We successfully genotyped individ-ually 114 SNPs. We found association with LOAD of sev-eral SNPs close to the APOE locus (2.08 × 10⁻⁹ – 8.24 × 10-
11) thus confirming the validity of the pooled genotypingapproach. In addition, we obtained evidence for severalnovel genetic associations to LOAD, our most significantfindings being association of SNPs in the lecithin retinolacyltransferase (phosphatidylcholine – retinol O-acyl-transferase, LRAT) gene.
ResultsBefore we started work with Illumina arrays, we validatedthe pool construction with the SNaPshot method. Thepools gave an accurate estimate of the real difference inallele frequencies for 3 SNPs previously individually gen-otyped in this sample. rs11084424, rs157580 andrs157581 showed allele frequency differences betweencases and controls in pools of 4%, 9% and 17% respec-tively which compared well with the real differences of3%, 10% and 19%. Published estimates of the accuracy ofDNA pooling report similar high accuracy with errors of <2% between predicted and true allele frequency differ-ences using different methods [11].
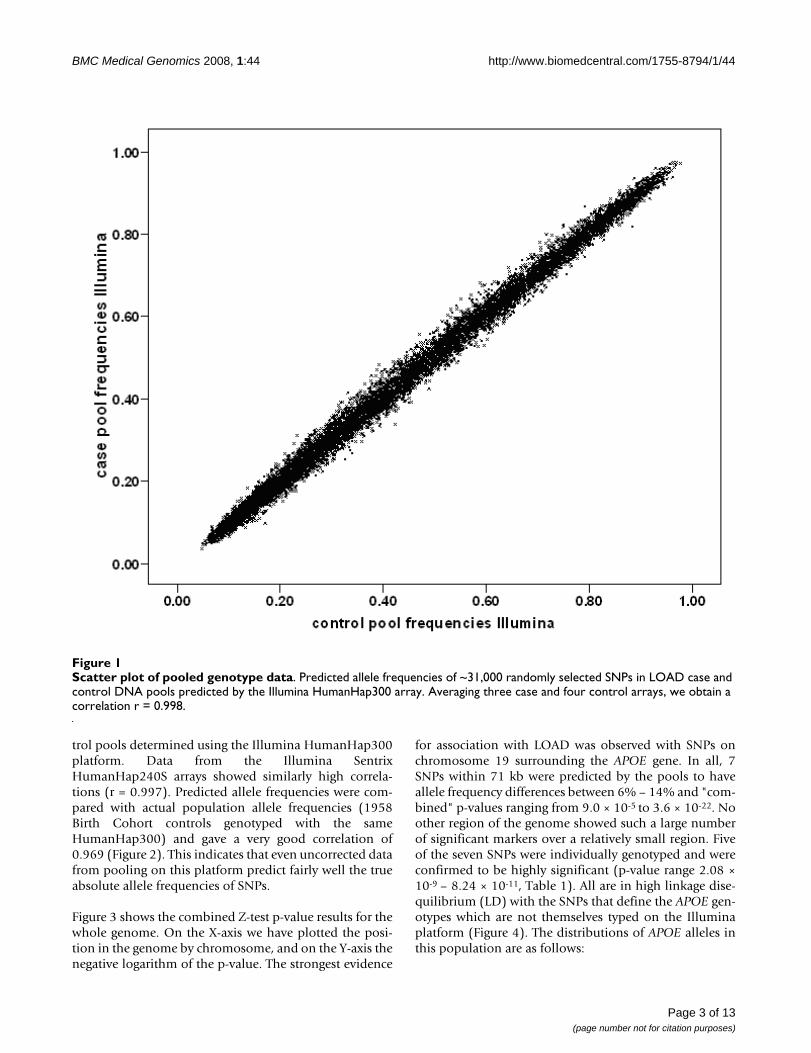
Genome-wide pooled genotyping was carried out on theIllumina HumanHap300 and Illumina SentrixHumanHap240S arrays assaying 561,494 SNPs. Frequen-cies for each SNP were averaged over four replicate caseand three replicate control arrays for the IlluminaHumanHap300 and eight each for the SentrixHumanHap240S arrays. The predicted averaged patientand control allele frequencies showed as expected a veryhigh Pearson correlation with each other of r = 0.998,indicating a low technical variability of the method. Fig-ure 1 shows predicted allele frequencies in case and con-
Page 2 of 13(page number not for citation purposes)
BMC Medical Genomics 2008, 1:44 http://www.biomedcentral.com/1755-8794/1/44
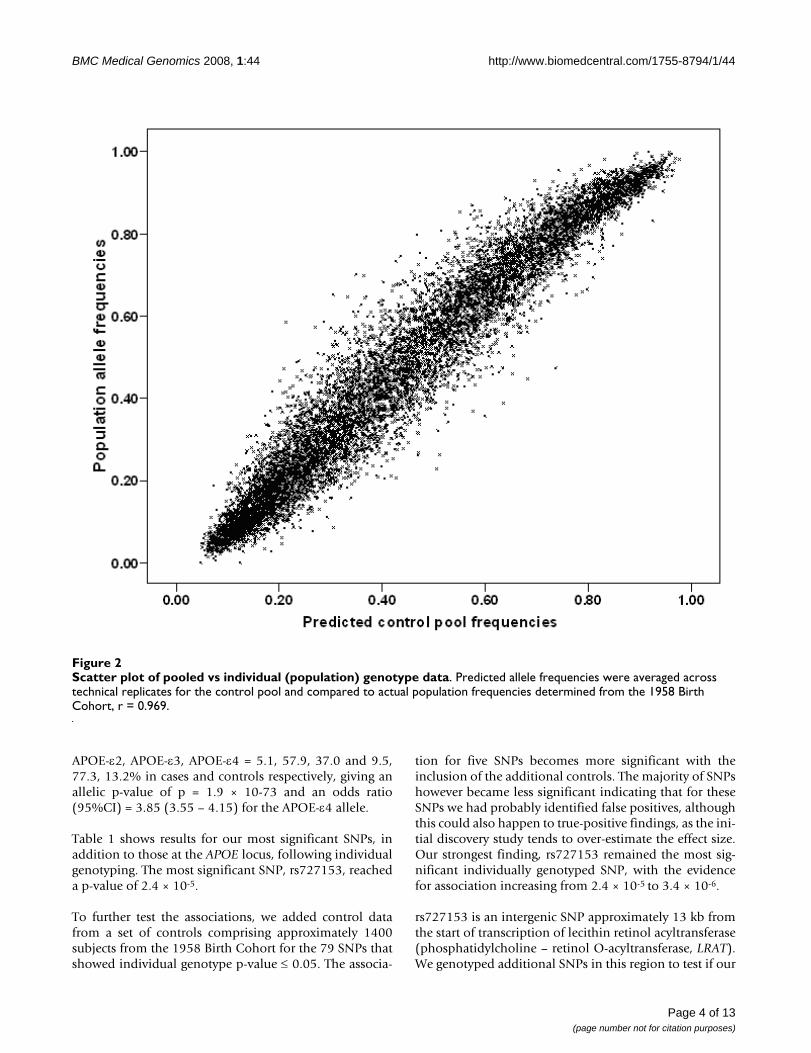
trol pools determined using the Illumina HumanHap300platform. Data from the Illumina SentrixHumanHap240S arrays showed similarly high correla-tions (r = 0.997). Predicted allele frequencies were com-pared with actual population allele frequencies (1958Birth Cohort controls genotyped with the sameHumanHap300) and gave a very good correlation of0.969 (Figure 2). This indicates that even uncorrected datafrom pooling on this platform predict fairly well the trueabsolute allele frequencies of SNPs.
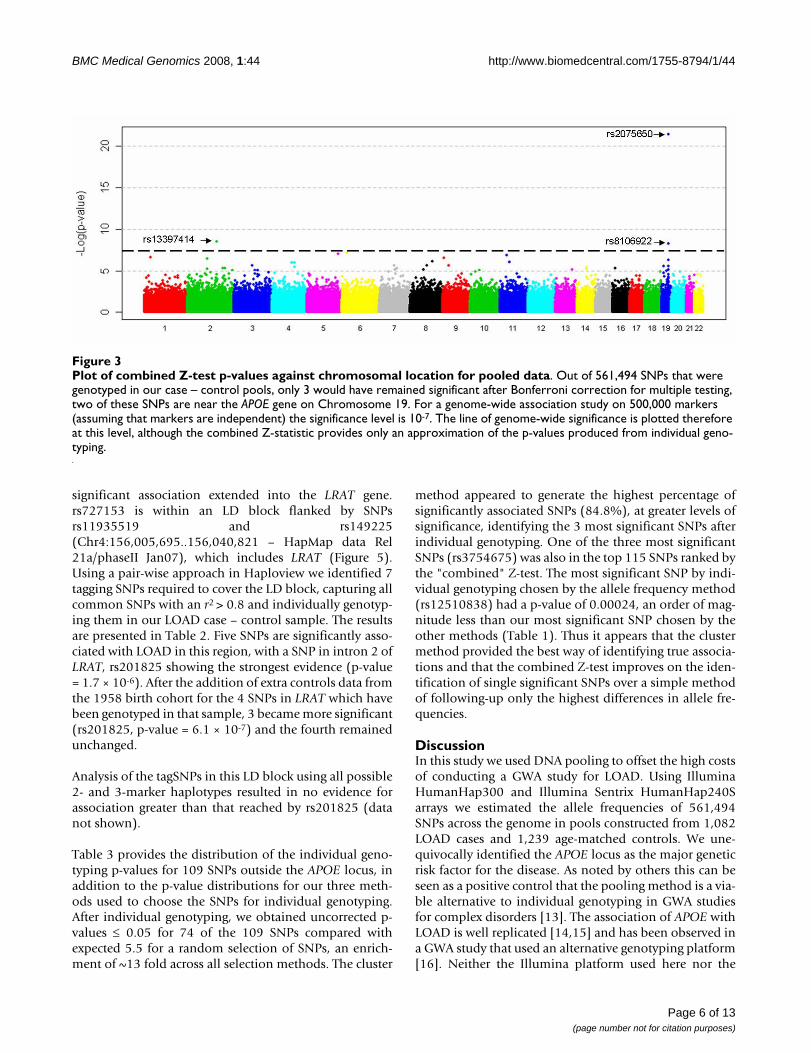
Figure 3 shows the combined Z-test p-value results for thewhole genome. On the X-axis we have plotted the posi-tion in the genome by chromosome, and on the Y-axis thenegative logarithm of the p-value. The strongest evidence
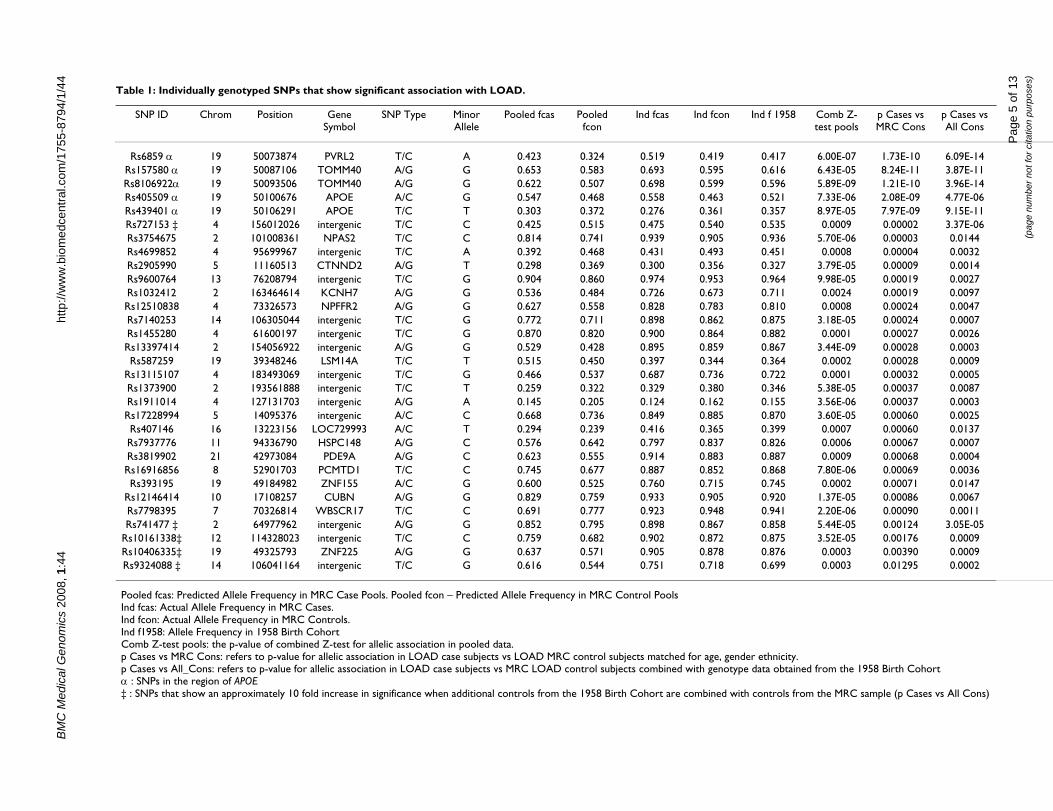
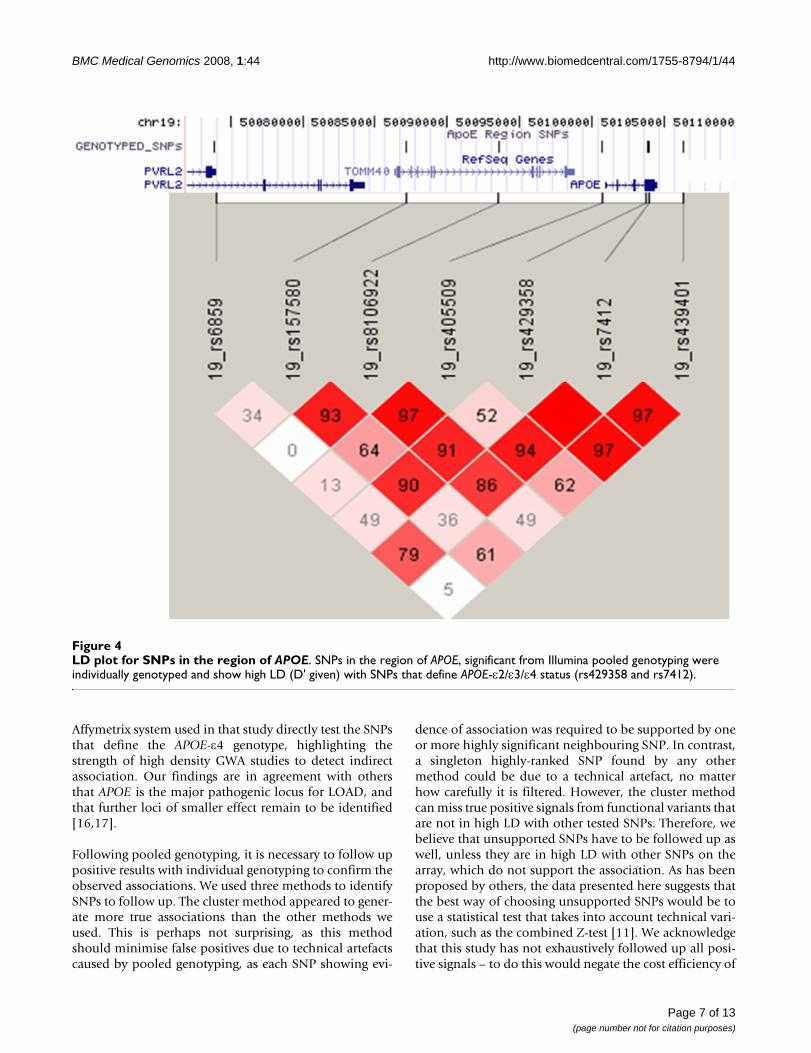
for association with LOAD was observed with SNPs onchromosome 19 surrounding the APOE gene. In all, 7SNPs within 71 kb were predicted by the pools to haveallele frequency differences between 6% – 14% and "com-bined" p-values ranging from 9.0 × 10⁻⁵ to 3.6 × 10⁻²². Noother region of the genome showed such a large numberof significant markers over a relatively small region. Fiveof the seven SNPs were individually genotyped and wereconfirmed to be highly significant (p-value range 2.08 ×10⁻⁹ – 8.24 × 10⁻¹¹, Table 1). All are in high linkage dise-quilibrium (LD) with the SNPs that define the APOE gen-otypes which are not themselves typed on the Illuminaplatform (Figure 4). The distributions of APOE alleles inthis population are as follows:
Scatter plot of pooled genotype dataFigure 1Scatter plot of pooled genotype data. Predicted allele frequencies of ~31,000 randomly selected SNPs in LOAD case and control DNA pools predicted by the Illumina HumanHap300 array. Averaging three case and four control arrays, we obtain a correlation r = 0.998.
Page 3 of 13(page number not for citation purposes)
BMC Medical Genomics 2008, 1:44 http://www.biomedcentral.com/1755-8794/1/44
APOE-ε2, APOE-ε3, APOE-ε4 = 5.1, 57.9, 37.0 and 9.5,77.3, 13.2% in cases and controls respectively, giving anallelic p-value of p = 1.9 × 10-73 and an odds ratio(95%CI) = 3.85 (3.55 – 4.15) for the APOE-ε4 allele.
Table 1 shows results for our most significant SNPs, inaddition to those at the APOE locus, following individualgenotyping. The most significant SNP, rs727153, reacheda p-value of 2.4 × 10⁻⁵.
To further test the associations, we added control datafrom a set of controls comprising approximately 1400subjects from the 1958 Birth Cohort for the 79 SNPs thatshowed individual genotype p-value ≤ 0.05. The associa-
tion for five SNPs becomes more significant with theinclusion of the additional controls. The majority of SNPshowever became less significant indicating that for theseSNPs we had probably identified false positives, althoughthis could also happen to true-positive findings, as the ini-tial discovery study tends to over-estimate the effect size.Our strongest finding, rs727153 remained the most sig-nificant individually genotyped SNP, with the evidencefor association increasing from 2.4 × 10⁻⁵ to 3.4 × 10⁻⁶.
rs727153 is an intergenic SNP approximately 13 kb fromthe start of transcription of lecithin retinol acyltransferase(phosphatidylcholine – retinol O-acyltransferase, LRAT).We genotyped additional SNPs in this region to test if our
Scatter plot of pooled vs individual (population) genotype dataFigure 2Scatter plot of pooled vs individual (population) genotype data. Predicted allele frequencies were averaged across technical replicates for the control pool and compared to actual population frequencies determined from the 1958 Birth Cohort, r = 0.969.
Page 4 of 13(page number not for citation purposes)
BM
C M
edic
al G
enom
ics
2008
, 1:4
4ht
tp://
ww
w.b
iom
edce
ntra
l.com
/175
5-87
94/1
/44
Page
5 o
f 13
(pag
e nu
mbe
r not
for c
itatio
n pu
rpos
es)
Table 1: Individually genotyped SNPs that show significant association with LOAD.
SNP ID Chrom Position Gene Symbol
SNP Type Minor Allele
Pooled fcas Pooled fcon
Ind fcas Ind fcon Ind f 1958 Comb Z-test pools
p Cases vs MRC Cons
p Cases vs All Cons
Rs6859 α 19 50073874 PVRL2 T/C A 0.423 0.324 0.519 0.419 0.417 6.00E-07 1.73E-10 6.09E-14Rs157580 α 19 50087106 TOMM40 A/G G 0.653 0.583 0.693 0.595 0.616 6.43E-05 8.24E-11 3.87E-11Rs8106922α 19 50093506 TOMM40 A/G G 0.622 0.507 0.698 0.599 0.596 5.89E-09 1.21E-10 3.96E-14Rs405509 α 19 50100676 APOE A/C G 0.547 0.468 0.558 0.463 0.521 7.33E-06 2.08E-09 4.77E-06Rs439401 α 19 50106291 APOE T/C T 0.303 0.372 0.276 0.361 0.357 8.97E-05 7.97E-09 9.15E-11Rs727153 ‡ 4 156012026 intergenic T/C C 0.425 0.515 0.475 0.540 0.535 0.0009 0.00002 3.37E-06Rs3754675 2 101008361 NPAS2 T/C C 0.814 0.741 0.939 0.905 0.936 5.70E-06 0.00003 0.0144Rs4699852 4 95699967 intergenic T/C A 0.392 0.468 0.431 0.493 0.451 0.0008 0.00004 0.0032Rs2905990 5 11160513 CTNND2 A/G T 0.298 0.369 0.300 0.356 0.327 3.79E-05 0.00009 0.0014Rs9600764 13 76208794 intergenic T/C G 0.904 0.860 0.974 0.953 0.964 9.98E-05 0.00019 0.0027Rs1032412 2 163464614 KCNH7 A/G G 0.536 0.484 0.726 0.673 0.711 0.0024 0.00019 0.0097Rs12510838 4 73326573 NPFFR2 A/G G 0.627 0.558 0.828 0.783 0.810 0.0008 0.00024 0.0047Rs7140253 14 106305044 intergenic T/C G 0.772 0.711 0.898 0.862 0.875 3.18E-05 0.00024 0.0007Rs1455280 4 61600197 intergenic T/C G 0.870 0.820 0.900 0.864 0.882 0.0001 0.00027 0.0026Rs13397414 2 154056922 intergenic A/G G 0.529 0.428 0.895 0.859 0.867 3.44E-09 0.00028 0.0003Rs587259 19 39348246 LSM14A T/C T 0.515 0.450 0.397 0.344 0.364 0.0002 0.00028 0.0009
Rs13115107 4 183493069 intergenic T/C G 0.466 0.537 0.687 0.736 0.722 0.0001 0.00032 0.0005Rs1373900 2 193561888 intergenic T/C T 0.259 0.322 0.329 0.380 0.346 5.38E-05 0.00037 0.0087Rs1911014 4 127131703 intergenic A/G A 0.145 0.205 0.124 0.162 0.155 3.56E-06 0.00037 0.0003Rs17228994 5 14095376 intergenic A/C C 0.668 0.736 0.849 0.885 0.870 3.60E-05 0.00060 0.0025Rs407146 16 13223156 LOC729993 A/C T 0.294 0.239 0.416 0.365 0.399 0.0007 0.00060 0.0137Rs7937776 11 94336790 HSPC148 A/G C 0.576 0.642 0.797 0.837 0.826 0.0006 0.00067 0.0007Rs3819902 21 42973084 PDE9A A/G C 0.623 0.555 0.914 0.883 0.887 0.0009 0.00068 0.0004Rs16916856 8 52901703 PCMTD1 T/C C 0.745 0.677 0.887 0.852 0.868 7.80E-06 0.00069 0.0036Rs393195 19 49184982 ZNF155 A/C G 0.600 0.525 0.760 0.715 0.745 0.0002 0.00071 0.0147
Rs12146414 10 17108257 CUBN A/G G 0.829 0.759 0.933 0.905 0.920 1.37E-05 0.00086 0.0067Rs7798395 7 70326814 WBSCR17 T/C C 0.691 0.777 0.923 0.948 0.941 2.20E-06 0.00090 0.0011Rs741477 ‡ 2 64977962 intergenic A/G G 0.852 0.795 0.898 0.867 0.858 5.44E-05 0.00124 3.05E-05
Rs10161338‡ 12 114328023 intergenic T/C C 0.759 0.682 0.902 0.872 0.875 3.52E-05 0.00176 0.0009Rs10406335‡ 19 49325793 ZNF225 A/G G 0.637 0.571 0.905 0.878 0.876 0.0003 0.00390 0.0009Rs9324088 ‡ 14 106041164 intergenic T/C G 0.616 0.544 0.751 0.718 0.699 0.0003 0.01295 0.0002
Pooled fcas: Predicted Allele Frequency in MRC Case Pools. Pooled fcon – Predicted Allele Frequency in MRC Control PoolsInd fcas: Actual Allele Frequency in MRC Cases.Ind fcon: Actual Allele Frequency in MRC Controls.Ind f1958: Allele Frequency in 1958 Birth CohortComb Z-test pools: the p-value of combined Z-test for allelic association in pooled data.p Cases vs MRC Cons: refers to p-value for allelic association in LOAD case subjects vs LOAD MRC control subjects matched for age, gender ethnicity.p Cases vs All_Cons: refers to p-value for allelic association in LOAD case subjects vs MRC LOAD control subjects combined with genotype data obtained from the 1958 Birth Cohortα : SNPs in the region of APOE‡ : SNPs that show an approximately 10 fold increase in significance when additional controls from the 1958 Birth Cohort are combined with controls from the MRC sample (p Cases vs All Cons)
BMC Medical Genomics 2008, 1:44 http://www.biomedcentral.com/1755-8794/1/44
significant association extended into the LRAT gene.rs727153 is within an LD block flanked by SNPsrs11935519 and rs149225(Chr4:156,005,695..156,040,821 – HapMap data Rel21a/phaseII Jan07), which includes LRAT (Figure 5).Using a pair-wise approach in Haploview we identified 7tagging SNPs required to cover the LD block, capturing allcommon SNPs with an r2 > 0.8 and individually genotyp-ing them in our LOAD case – control sample. The resultsare presented in Table 2. Five SNPs are significantly asso-ciated with LOAD in this region, with a SNP in intron 2 ofLRAT, rs201825 showing the strongest evidence (p-value= 1.7 × 10⁻⁶). After the addition of extra controls data fromthe 1958 birth cohort for the 4 SNPs in LRAT which havebeen genotyped in that sample, 3 became more significant(rs201825, p-value = 6.1 × 10⁻⁷) and the fourth remainedunchanged.
Analysis of the tagSNPs in this LD block using all possible2- and 3-marker haplotypes resulted in no evidence forassociation greater than that reached by rs201825 (datanot shown).
Table 3 provides the distribution of the individual geno-typing p-values for 109 SNPs outside the APOE locus, inaddition to the p-value distributions for our three meth-ods used to choose the SNPs for individual genotyping.After individual genotyping, we obtained uncorrected p-values ≤ 0.05 for 74 of the 109 SNPs compared withexpected 5.5 for a random selection of SNPs, an enrich-ment of ~13 fold across all selection methods. The cluster
method appeared to generate the highest percentage ofsignificantly associated SNPs (84.8%), at greater levels ofsignificance, identifying the 3 most significant SNPs afterindividual genotyping. One of the three most significantSNPs (rs3754675) was also in the top 115 SNPs ranked bythe "combined" Z-test. The most significant SNP by indi-vidual genotyping chosen by the allele frequency method(rs12510838) had a p-value of 0.00024, an order of mag-nitude less than our most significant SNP chosen by theother methods (Table 1). Thus it appears that the clustermethod provided the best way of identifying true associa-tions and that the combined Z-test improves on the iden-tification of single significant SNPs over a simple methodof following-up only the highest differences in allele fre-quencies.
DiscussionIn this study we used DNA pooling to offset the high costsof conducting a GWA study for LOAD. Using IlluminaHumanHap300 and Illumina Sentrix HumanHap240Sarrays we estimated the allele frequencies of 561,494SNPs across the genome in pools constructed from 1,082LOAD cases and 1,239 age-matched controls. We une-quivocally identified the APOE locus as the major geneticrisk factor for the disease. As noted by others this can beseen as a positive control that the pooling method is a via-ble alternative to individual genotyping in GWA studiesfor complex disorders [13]. The association of APOE withLOAD is well replicated [14,15] and has been observed ina GWA study that used an alternative genotyping platform[16]. Neither the Illumina platform used here nor the
Plot of combined Z-test p-values against chromosomal location for pooled dataFigure 3Plot of combined Z-test p-values against chromosomal location for pooled data. Out of 561,494 SNPs that were genotyped in our case – control pools, only 3 would have remained significant after Bonferroni correction for multiple testing, two of these SNPs are near the APOE gene on Chromosome 19. For a genome-wide association study on 500,000 markers (assuming that markers are independent) the significance level is 10-7. The line of genome-wide significance is plotted therefore at this level, although the combined Z-statistic provides only an approximation of the p-values produced from individual geno-typing.
Page 6 of 13(page number not for citation purposes)
BMC Medical Genomics 2008, 1:44 http://www.biomedcentral.com/1755-8794/1/44
Affymetrix system used in that study directly test the SNPsthat define the APOE-ε4 genotype, highlighting thestrength of high density GWA studies to detect indirectassociation. Our findings are in agreement with othersthat APOE is the major pathogenic locus for LOAD, andthat further loci of smaller effect remain to be identified[16,17].
Following pooled genotyping, it is necessary to follow uppositive results with individual genotyping to confirm theobserved associations. We used three methods to identifySNPs to follow up. The cluster method appeared to gener-ate more true associations than the other methods weused. This is perhaps not surprising, as this methodshould minimise false positives due to technical artefactscaused by pooled genotyping, as each SNP showing evi-
dence of association was required to be supported by oneor more highly significant neighbouring SNP. In contrast,a singleton highly-ranked SNP found by any othermethod could be due to a technical artefact, no matterhow carefully it is filtered. However, the cluster methodcan miss true positive signals from functional variants thatare not in high LD with other tested SNPs. Therefore, webelieve that unsupported SNPs have to be followed up aswell, unless they are in high LD with other SNPs on thearray, which do not support the association. As has beenproposed by others, the data presented here suggests thatthe best way of choosing unsupported SNPs would be touse a statistical test that takes into account technical vari-ation, such as the combined Z-test [11]. We acknowledgethat this study has not exhaustively followed up all posi-tive signals – to do this would negate the cost efficiency of
LD plot for SNPs in the region of APOEFigure 4LD plot for SNPs in the region of APOE. SNPs in the region of APOE, significant from Illumina pooled genotyping were individually genotyped and show high LD (D' given) with SNPs that define APOE-ε2/ε3/ε4 status (rs429358 and rs7412).
Page 7 of 13(page number not for citation purposes)
BMC Medical Genomics 2008, 1:44 http://www.biomedcentral.com/1755-8794/1/44
the pooling method but it is possible that more signifi-cantly associated SNPs could be confirmed by individualgenotyping. In fact, we only genotyped individually halfof the SNPs that we considered worth following up. How-ever it appears clear that a signal with the strength of asso-ciation, in terms of a number of highly significant SNPs ina narrow region, as observed at the APOE locus, has notbeen overlooked.
In order to confirm our individual genotyping results,data from the 1958 Birth Cohort were used to form anadditional set of controls genotyped with the Illuminaplatform. These controls have previously been used by theWellcome Trust Case Consortium for a GWA study for 7common diseases [18]. There are a number of explana-tions for our observation that for the majority of SNPs sig-nificant in this study the strength of association decreasedwith additional control data. Firstly, and we believe mostlikely, the initial findings may have been false positivesdue to an inflation of the effect size in the original analysisdue to sampling variance in the control allele frequencies(i.e. some of the most significant SNPs have the highestsampling variance in either cases or controls). Secondly,the use of unscreened controls in an association study ofa disorder of old age is expected to reduce power [19], thisis particularly clear in the APOE locus. Some degree ofgenotyping discrepancies between the two platforms usedis also possible (Sequenom in our lab and Illumina in the1958 Birth Cohort), however very unlikely to account forsuch large differences.
We identified multiple SNP associations (best p-value =6.12 × 10⁻⁷) in the gene encoding lecithin retinol acyl-transferase (LRAT, 4q32.1, MIM: 604863). This is a highlyplausible functional candidate gene for LOAD. LRAT
plays a prominent role in the Vitamin A (retinoid) cascadeby producing retinyl esters, storage forms of retinoid. Theretinoid system has been previously implicated in LOAD.Retinoid levels in plasma, serum and brain are lowered inLOAD patients, and the restriction of dietary retinoid inmice results in memory impairment [20,21]. Furthermoredisruption of the retinoid signalling pathway in adult ratsby a dietary deficiency of vitamin A leads to deposition ofamyloid beta in the cerebral blood vessels. There is adown regulation of retinoic acid receptor alpha in theforebrain neurons of the retinoid-deficient rats and a lossof choline acetyl transferase expression, which precedesamyloid beta deposition. In neocortex of pathology sam-ples of patients with Alzheimer's disease, the same retin-oic acid receptor alpha deficit in the surviving neurons isobserved suggesting that retinoids are important for themaintenance of the adult nervous system and their lossmay in part play a role in Alzheimer's disease [22]. Never-theless, despite the functional plausibility, our geneticfindings in LRAT fall short of the degree of statistical sig-nificance required to provide unequivocal evidence forassociation, given the large number of comparisons madein a GWA study. Thus our findings, whilst highly sugges-tive, will require confirmation in independent samples.
ConclusionIn summary, we have validated the pooling method forGWA studies by both identifying the APOE locus, aknown risk gene for LOAD, and by observing a strongenrichment for significantly associated SNPs. We havealso compared methods for prioritising SNPs for individ-ual genotyping. Finally, we provide evidence for LRAT asa novel candidate gene for LOAD. GWA studies withpooled DNA provide a viable, quick and inexpensiveapproach to identifying susceptibility genes. Inaccuracies,
Table 2: Association analysis of tag SNPs used to cover the LD block containing LRAT.
SNP ID Position (Mb on Chr 4)
Minor Allele
Minor Allele Freq Cases
Minor Allele Freq
Controls
Minor Allele
Freq 1958
p Cases vs MRC Cons
OR Cases vs MRC
Cons (95% CI)
p Cases vs Comb Cons
OR Cases vs Comb
Cons (95% CI)
Rs12501328 156,019,936 G 0.10 0.08 0.07 0.02661 1.27 (1–1.6) 0.0032 1.32 (1.1 – 1.6)
Rs201825 156,024,540 C 0.52 0.44 0.46 1.65E-06 1.34 (1.2–1.5)
6.12E-07 1.3 (1.2 – 1.4)
Rs201824 156,026,315 T 0.40 0.35 0.00066 1.24 (1.1–1.4)
N/A N/A
Rs201823 156,026,490 G 0.40 0.35 0.37 0.00042 1.24 (1.1–1.4)
0.0004 1.21 (1.1 – 1.3)
Rs156500 156,034,920 C 0.13 0.11 0.09457 1.17 (1–1.4) N/A N/ARs156501 156,035,950 A 0.22 0.19 0.19 0.01635 1.2 (1–1.4) 0.0058 1.2
(1.1 – 1.4)Rs149225 156,040,821 C 0.42 0.40 0.34900 1.06
(0.9–1.2)N/A N/A
For descriptions see Table 1. OR – Odds Ratio, N/A – test not conducted.
Page 8 of 13(page number not for citation purposes)
BMC Medical Genomics 2008, 1:44 http://www.biomedcentral.com/1755-8794/1/44
however, mean that some loci that might be detected byindividual genotyping will remain undetected.
MethodsSubjectsWritten informed consent was obtained from all subjectsfor publication of this case report. A copy of the writtenconsent is available for review by the Editor-in-Chief of
this journal. The sample consisted of individuals ascer-tained from both community and hospital settings in theUK collected as part of the MRC genetic resource forLOAD. Clinical data and DNA samples were collectedfrom 1,082 individuals (71% females) with late-onset AD(LOAD) and 1,239 control subjects (referred to in the textas "MRC controls", 62% females). Age at onset rangedfrom 60 to 95 years (mean = 75.84 years, SD = 6.79). Con-trols were matched for age (mean = 76.53 years, SD =6.33), gender and ethnicity. AD cases and controlsdescribed here were ascertained by three collaboratingcentres: Department of Psychological Medicine, CardiffUniversity, Cardiff (coordinating centre); Institute of Psy-chiatry, London; and Cambridge University, Cambridge,as previously described [23]. Ethical approval wasobtained from the Multi-centre Research Ethics Commit-tee (MREC), relevant local ethics committees and NHStrusts, in the regions where subjects were recruited.
All cases were Caucasian, of UK origin (parents born inthe UK) and diagnosed with probable AD in accordancewith the National Institute of Neurological and Commu-nication Disorders and Stroke and the Alzheimer's diseaseand Related Disorders Associations (NINCDS-ADRDA)clinical diagnostic criteria for AD [24]. All diagnoses weremade based on a semi-structured interview with knownvalidity for AD pathology (i.e. positive predictive value of92–95% [25,26] which included: The Mini Mental StateExamination (MMSE) [27]; The Cambridge Mental Disor-ders of the Elderly Examination (CAMDEX; informantinterview) [28]; The Blessed Dementia Scale [29]; TheBristol Activities of Daily Living Scale [30]; Webster RatingScale [31]; Global Deterioration Scale (GDS) [32]; CornellScale for Depression in Dementia [33]; NeuropsychiatricInventory (NPI) (12-item version) [34]. Interviews wereprimarily conducted with the AD sufferer's next of kin.Ethical permission was obtained from the Multi-centreResearch Ethics Committee, relevant local ethics commit-tees, and National Health Service trusts.
Control subjects were either spouses of AD patients orselected from primary-care practices situated in the samegeographical areas as AD patients. All controls were 60
LD plot for SNPs in the region of LRATFigure 5LD plot for SNPs in the region of LRAT. Linkage Dise-quilibrium plot (D' values shown) for tagSNPs chosen to cover an LD block containing LRAT. The most significant SNP from GWA study, rs727153, is in high LD with SNPs in LRAT.
Table 3: Distribution of p-values of individually genotyped SNPs (excluding those in the region of APOE).
P-Value RangeSelection Category N < 0.05 0.05 – 0.005 5 × 10⁻³- 5 × 10⁻⁴ 5 × 10⁻⁴- 5 × 10⁻⁵ 5 × 10⁻⁵- 5 × 10⁻⁶
ALL SNPs 109 74 (67.9%) 38 (34.9%) 22 (20.2%) 11 (10.1%) 3 (2.8%)CLUSTERS 33/58 28 (84.8%) 12 (36.4%) 8 (24.2%) 5 (15.2%) 3 (9.1%)
COMB 66/115 44 (66.6%) 22 (33.3%) 13 (19.7%) 8 (12.1%) 1 (1.5%)FREQ 46/136 24 (52.2%) 13 (28.3%) 9 (19.6%) 2 (4.3%) 0 (0%)
Selection category gives the method used to choose SNP for individual genotyping (see text for description). N: number of SNPs tested in each selection category. Note: of the 66 SNPs in the COMB category, 11 and 25 SNPs respectively had been identified by the CLUSTER and FREQ methods.
Page 9 of 13(page number not for citation purposes)

BMC Medical Genomics 2008, 1:44 http://www.biomedcentral.com/1755-8794/1/44
years or above and of UK origin. Control individuals werescreened for cognitive decline using the MMSE, and a cut-off score of ≥ 28 was adopted. Assessment of controls alsoincluded a section of the Cambridge Mental Disorders ofthe Elderly Examination and the Geriatric DepressionScale [35]. Exclusion criteria were the presence of demen-tia, depression, delirium or other illnesses likely to signif-icantly reduce cognitive function.
DNA Pool ConstructionDNA was obtained from blood samples by phenol/choloroform extraction, followed by precipitation in eth-anol and storage in TE buffer. DNA quality was assessedby PCR amplification of microsatellite markers understandard conditions, with those samples showing robustamplification being included in pools (1,082 LOAD casesand 1,239 controls). Initial DNA concentrations weredetermined by UV spectrophotometry using absorbanceat 260 nm readings. Dilutions were made using water tobring the concentration of each sample to a target of 20ng/ul. The concentration of each sample was then deter-mined using the PicoGreen dsDNA Quantitation Reagent(Molecular Probes, Eugene, Ore.) in a Labsystems AscentFluoroskan (LifeSciences Int., Basingstoke, UK). Eachsample was then diluted to 4 ng/ul (± 0.5 ng/ul), allowedto equilibrate at 4°C for 48 h before another quantifica-tion using the PicoGreen method. Samples out of the 4ng/ul (± 0.5 ng/ul) range were diluted/concentrated, incu-bated and re-quantified until they were within therequired range. Equal volumes of each sample were thenadded to either a case or control pool using a Biomek® FXLaboratory Automation Workstation (Beckman Coulter,Inc., Fullerton, CA). We chose to make single pools ofcases and controls and hybridise them multiple times,rather than construct many small pools and hybridisethem on single arrays, as this method has been shown tobe more powerful [36].
Pool validation with the SNaPshot methodIn order to test the accuracy of our pool construction, wegenotyped 3 significantly associated SNPs in the pools forwhich we had individual genotype data on the samplesused to create the pools (rs11084424, rs157580 andrs157581). SNaPshot genotyping was carried out as previ-ously described [12]. Briefly, forward and reverse primerswere designed using primer 3 software http://primer3.sourceforge.net/. Extension primers for theSNaPshot assay were designed using FP PRIMER 1.0.1 bsoftware http://m034.pc.uwcm.ac.uk/FP_Primer.html.PCR was performed under standard conditions, using 15ng pooled genomic DNA and HotStar Taq DNA polymer-ase (Qiagen). Primer extension products were run on a3100 DNA sequencer (Applied Biosystems) and the datawere processed by the GeneScan Analysis 3.7 (AppliedBiosystems). SNP allele frequencies in DNA pools were
estimated from peak heights obtained by using Genotyper2.5 (PE Biosystems, Cheshire, UK). Estimated allele fre-quencies from pools were corrected for unequal represen-tation of alleles using the mean of the ratios obtainedfrom four analyses of a heterozygote [37].
Pooled DNA Genotyping using Illumina PlatformGenome-wide genotyping was performed using IlluminaHumanHap300 and Illumina Sentrix HumanHap240Sarrays (Illumina Inc., San Diego, CA, USA) according tothe manufacturer's protocols. Chips were scanned instandard mode on a BeadStation 500 GX (Illumina) at theUniversity of Bonn and raw data were extracted for statis-tical analysis with BeadStudio v3.1 software. Because ofthe expected inter-experiment variation, replicate arrayswere genotyped for each pool: four arrays on the IlluminaHumanHap300, and 8 arrays on the Illumina SentrixHumanHap240S array. The reason for using moreHumanHap240S arrays is that we first performed thework on HumanHap300, and noticed the need for morereplications. Replicate arrays were excluded if the esti-mated allele frequencies produced a Pearson correlationof r ≤ 0.991 with two or more other replicate arrays of thesame pool (i.e. only arrays which correlated at r ≥ 0.992with each other were retained for analysis). This cut-offwas adopted during other pooling work in our depart-ment, but in this experiment resulted in the exclusion ofdata from only a single array (from a control pool) geno-typed on the HumanHap300 array.
Analysis of pooled DNAApproximation of allele A frequencies for each replicatewas produced on the basis of the raw data as follows:f_alleleA = Xraw/(Xraw+Yraw), averaged over the numberof replicates in each pool (Xraw and Yraw are the intensi-ties of the two dyes Cy5 and Cy3, used to genotype SNPson the Illumina platform).
Selection of SNPs for individual genotypingSNPs from the pooling data were prioritised for individualgenotyping based on three different methods, outlinedbelow, since, at the time of this experiment we did notknow which method would perform best. For all meth-ods, we excluded rare SNPs (true allele frequency less than5% in the CEU population of the HapMap, http://www.hapmap.org/) and the 5% of SNPs showing thehighest technical variability as indicated by the size of thestandard deviation amongst measures from the replicatearrays.
1) Cluster MethodWe plotted the differences in allele frequencies betweencases and controls for each SNP against their position inthe genome. We identified 58 clusters where at least twoSNPs within 100 kb had a predicted allele frequency dif-
Page 10 of 13(page number not for citation purposes)
BMC Medical Genomics 2008, 1:44 http://www.biomedcentral.com/1755-8794/1/44
ference greater than 5%. One SNP from each cluster wasselected for individual genotyping.
2) Allele Frequency Difference MethodSeparately for the Illumina HumanHap300 and IlluminaSentrix HumanHap240S arrays (to account for any differ-ences caused by technical artefacts between the twoarrays) the pooled data were sorted by predicted allele fre-quency differences in cases and controls. The top 136SNPs showing the greatest allele frequency differences(8% difference between cases and controls) and satisfyingthe above filtering criteria were put forward for potentialindividual genotyping. SNPs that had previously beenflagged as being in a cluster were not included.
3) "Combined Z-test"The third method was based on p-values estimated usingthe following statistic which combines experimental andsampling errors, a general description of which has previ-ously been presented [11,36,38]:
This statistic combines:
a) chi-square statistic T for testing differences between twoproportions (allele frequencies) in cases and in controlsaccounting for the sampling variance:
where is the mean of the allele frequen-
cies over nk pool replicates, is the binomial
sampling variance and Nk is number of controls and cases
respectively (k = 1,2).
b) Z-statistics for testing the difference in mean allele fre-quencies between cases and controls:
where is the square of the
standard error due to experimental error.
Thus we have taken into account the two single availablesources of error: sampling error and experimental error ina simple way which is equivalent to a simplified versionof the complex regression model suggested by MacGre-gor[36].
Excluding 36 SNPs already selected by the allele frequency(25 SNPs) or cluster (11 SNPs) methods, and any filteredones, 79 of the highest-ranking SNPs identified by thecombined Z-test method were put forward for individualgenotyping.
Individual GenotypingThe 273 SNPs chosen by the three methods, (in additionto 5 SNPs at the APOE locus which had been identified byall three methods) were presented to the Sequenom AssayDesign 3.1 software (Sequenom, San Diego, CA), whichselected 130 for genotyping. We deliberately presentedabout twice as many SNPs to the software, as we wantedto type, in order to maximise the chance of producingwell-performing panels.
Genotyping was performed with the MassARRAY andiPlex systems (Sequenom, San Diego, CA) according tothe manufacturer's recommendations. Assays were opti-mized in 30 reference CEU parent – offspring trios, whichhave been used extensively in the HapMap project. Allsample plates contained cases, controls, blanks, CEU andduplicate samples. Quality control (QC) measuresincluded independent double genotyping blind to sampleidentity and blind to the other rater, and comparison ofour CEU genotypes to those in the HapMap databasehttp://www.hapmap.org. SNPs showing deviation fromHardy-Weinberg equilibrium (p-value < 0.001 in con-trols) or with genotyping success rates of less than 90%, orshowing differences in genotypes in the CEU samplesfrom those in the HapMap database were excluded fromanalysis. Individual DNA samples for whom the genotyp-ing success rate across all SNPs was < 75% were alsoexcluded (40 cases and 49 controls).
Of the 130 SNPs chosen from the pooling GWA study,114 passed QC. Of these 5 were located within 32 kb ofAPOE, 33 were selected from the cluster method, 30 wereidentified solely by the combined Z-test method and 46were chosen based on the allele frequency difference.
Calculation of allele frequencies, genotype counts, testsfor departure from HWE, allelic association and oddsratio were carried out using PLINK (vers 0.99s, http://pngu.mgh.harvard.edu/purcell/plink/, [39].
Linkage Disequilibrium analysis was conducted usingHaploview version 4.0 http://www.broad.mit.edu/mpg/haploview/, [40].
Tf f
v vcomb = −
+ + +
( ( ) ( )).
1 2 2
1 2 12
22e e
Tf f
v v1
1 2 2
1 2= −
+( ( ) ( ))
,
f fk ik
i
n
nk
k
==∑1
1
( )
vkfk fk
Nk= −( )1
2
Zf f= −
+
( ),1 2
12
22e e
e k ik
ki
n
nk nkf f
k2
1
211= −−
=∑( ) ( )( )
Page 11 of 13(page number not for citation purposes)
BMC Medical Genomics 2008, 1:44 http://www.biomedcentral.com/1755-8794/1/44
Additional control genotype data were obtained from(http://www.b58cgene.sgul.ac.uk/, accessed September2007) which contains genotyping data on the British1958 Birth Cohort DNA Collection, deposited by theWellcome Trust Sanger Institute.
AbbreviationsAD: Alzheimer's Disease; APOE: Apolipoprotein E; DNA:Deoxyribonucleic Acid; GWA: Genome-Wide Association;Kb: kilobase pairs; LD: Linkage Disequilibrium; LOAD:Late-Onset Alzheimer's Disease; LRAT: lecithin retinolacyltransferase; MRC: Medical Research Council; SNP:Single Nucleotide Polymorphism.
Competing interestsThe authors declare that they have no competing interests.
Authors' contributionsAll authors read and approved the final manuscript. GKconceived of and designed the study, analysed pooledgenotyping and contributed to writing of manuscript. LG,RS and AM assisted with DNA pool construction and indi-vidual genotyping. KD and PH were responsible forpatient/control diagnosis and sample collection. SC andAH conducted pooled genome-wide genotyping. VM ana-lysed pooled genotype data, designing combined Z-testand conducted test for association using 1958 controlgroup. MO'D contributed to experimental design andwriting of manuscript. JW and MO supervised and con-tributed to sample collection, interpretation of data andwriting of manuscript. RA took the lead in DNA pool con-struction, writing the manuscript, conducted and ana-lysed individual genotyping.
AcknowledgementsWe would like to thank the patients and their families who participated in this study. We acknowledge our collaborators John Powell and Simon Lovestone, Institute of Psychiatry, London and both Carol Brayne and David Rubinsztein at the Cambridge Institute for Medical Research, Univer-sity of Cambridge for the supervision of sample collection.
This research was supported by funding from the Alzheimer's Research Trust (grant to GK, JW, MJO and MCO'D: ART/PPG2006B/5), the Medical Research Council (UK), and the Welsh Assembly Government.
References1. Ferri CP, Prince M, Brayne C, Brodaty H, Fratiglioni L, Ganguli M, Hall
K, Hasegawa K, Hendrie H, Huang Y, et al.: Global prevalence ofdementia: a Delphi consensus study. Lancet 2005,366(9503):2112-2117.
2. Gatz M, Reynolds CA, Fratiglioni L, Johansson B, Mortimer JA, BergS, Fiske A, Pedersen NL: Role of genes and environments forexplaining Alzheimer disease. Arch Gen Psychiatry 2006,63(2):168-174.
3. Daw EW, Payami H, Nemens EJ, Nochlin D, Bird TD, SchellenbergGD, Wijsman EM: The number of trait loci in late-onset Alzhe-imer disease. Am J Hum Genet 2000, 66(1):196-204.
4. Wang WY, Barratt BJ, Clayton DG, Todd JA: Genome-wide asso-ciation studies: theoretical and practical concerns. Nat RevGenet 2005, 6(2):109-118.
5. Eberle MA, Ng PC, Kuhn K, Zhou L, Peiffer DA, Galver L, Viaud-Mar-tinez KA, Lawley CT, Gunderson KL, Shen R, et al.: Power to detectrisk alleles using genome-wide tag SNP panels. PLoS Genet2007, 3(10):1827-1837.
6. Risch NJ: Searching for genetic determinants in the new mil-lennium. Nature 2000, 405(6788):847-856.
7. Cardon LR, Bell JI: Association study designs for complex dis-eases. Nat Rev Genet 2001, 2(2):91-99.
8. MacGregor S, Zhao ZZ, Henders A, Nicholas MG, Montgomery GW,Visscher PM: Highly cost-efficient genome-wide associationstudies using DNA pools and dense SNP arrays. Nucleic AcidsRes 2008, 36(6):e35.
9. Kirov G, Nikolov I, Georgieva L, Moskvina V, Owen MJ, O'DonovanMC: Pooled DNA genotyping on Affymetrix SNP genotypingarrays. BMC Genomics 2006, 7(1):27.
10. Docherty SJ, Butcher LM, Schalkwyk LC, Plomin R: Applicability ofDNA pools on 500 K SNP microarrays for cost-effective ini-tial screens in genomewide association studies. BMC Genomics2007, 8:214.
11. Sham P, Bader JS, Craig I, O'Donovan M, Owen M: DNA Pooling: atool for large-scale association studies. Nat Rev Genet 2002,3(11):862-871.
12. Norton N, Williams NM, Williams HJ, Spurlock G, Kirov G, MorrisDW, Hoogendoorn B, Owen MJ, O'Donovan MC: Universal,robust, highly quantitative SNP allele frequency measure-ment in DNA pools. Hum Genet 2002, 110(5):471-478.
13. Pearson JV, Huentelman MJ, Halperin RF, Tembe WD, Melquist S,Homer N, Brun M, Szelinger S, Coon KD, Zismann VL, et al.: Identi-fication of the genetic basis for complex disorders by use ofpooling-based genomewide single-nucleotide-polymorphismassociation studies. Am J Hum Genet 2007, 80(1):126-139.
14. Saunders AM, Schmader K, Breitner JC, Benson MD, Brown WT,Goldfarb L, Goldgaber D, Manwaring MG, Szymanski MH, McCownN, et al.: Apolipoprotein E epsilon 4 allele distributions in late-onset Alzheimer's disease and in other amyloid-forming dis-eases. Lancet 1993, 342(8873):710-711.
15. Farrer LA, Cupples LA, van Duijn CM, Kurz A, Zimmer R, Muller U,Green RC, Clarke V, Shoffner J, Wallace DC, et al.: ApolipoproteinE genotype in patients with Alzheimer's disease: implica-tions for the risk of dementia among relatives. Ann Neurol1995, 38(5):797-808.
16. Coon KD, Myers AJ, Craig DW, Webster JA, Pearson JV, Lince DH,Zismann VL, Beach TG, Leung D, Bryden L, et al.: A high-densitywhole-genome association study reveals that APOE is themajor susceptibility gene for sporadic late-onset Alzheimer'sdisease. J Clin Psychiatry 2007, 68(4):613-618.
17. Li H, Wetten S, Li L, St Jean PL, Upmanyu R, Surh L, Hosford D,Barnes MR, Briley JD, Borrie M, et al.: Candidate single-nucleotidepolymorphisms from a genomewide association study ofAlzheimer disease. Arch Neurol 2008, 65(1):45-53.
18. Genome-wide association study of 14,000 cases of sevencommon diseases and 3,000 shared controls. Nature 2007,447(7145):661-678.
19. Colhoun HM, McKeigue PM, Davey Smith G: Problems of report-ing genetic associations with complex outcomes. Lancet 2003,361(9360):865-872.
20. Goodman AB, Pardee AB: Evidence for defective retinoid trans-port and function in late onset Alzheimer's disease. Proc NatlAcad Sci USA 2003, 100(5):2901-2905.
21. Goodman AB: Retinoid receptors, transporters, and metabo-lizers as therapeutic targets in late onset Alzheimer disease.J Cell Physiol 2006, 209(3):598-603.
22. Corcoran JP, So PL, Maden M: Disruption of the retinoid signal-ling pathway causes a deposition of amyloid beta in the adultrat brain. Eur J Neurosci 2004, 20(4):896-902.
23. Morgan AR, Turic D, Jehu L, Hamilton G, Hollingworth P, MoskvinaV, Jones L, Lovestone S, Brayne C, Rubinsztein DC, et al.: Associa-tion studies of 23 positional/functional candidate genes onchromosome 10 in late-onset Alzheimer's disease. Am J MedGenet B Neuropsychiatr Genet 2007, 144B(6):762-770.
24. McKhann G, Drachman D, Folstein M, Katzman R, Price D, StadlanEM: Clinical diagnosis of Alzheimer's disease: report of theNINCDS-ADRDA Work Group under the auspices ofDepartment of Health and Human Services Task Force onAlzheimer's Disease. Neurology 1984, 34(7):939-944.
Page 12 of 13(page number not for citation purposes)
BMC Medical Genomics 2008, 1:44 http://www.biomedcentral.com/1755-8794/1/44
Publish with BioMed Central and every scientist can read your work free of charge
"BioMed Central will be the most significant development for disseminating the results of biomedical research in our lifetime."
Sir Paul Nurse, Cancer Research UK
Your research papers will be:
available free of charge to the entire biomedical community
peer reviewed and published immediately upon acceptance
cited in PubMed and archived on PubMed Central
yours — you keep the copyright
Submit your manuscript here:http://www.biomedcentral.com/info/publishing_adv.asp
BioMedcentral
25. Holmes C, Cairns N, Lantos P, Mann A: Validity of current clinicalcriteria for Alzheimer's disease, vascular dementia anddementia with Lewy bodies. Br J Psychiatry 1999, 174:45-50.
26. Foy CM, Nicholas H, Hollingworth P, Boothby H, Willams J, BrownRG, Al-Sarraj S, Lovestone S: Diagnosing Alzheimer's disease –non-clinicians and computerised algorithms together are asaccurate as the best clinical practice. Int J Geriatr Psychiatry 2007,22(11):1154-1163.
27. Folstein MF, Folstein SE, McHugh PR: "Mini-mental state". Apractical method for grading the cognitive state of patientsfor the clinician. J Psychiatr Res 1975, 12(3):189-198.
28. Roth M, Tym E, Mountjoy CQ, Huppert FA, Hendrie H, Verma S,Goddard R: CAMDEX. A standardised instrument for thediagnosis of mental disorder in the elderly with special refer-ence to the early detection of dementia. Br J Psychiatry 1986,149:698-709.
29. Blessed G, Tomlinson BE, Roth M: The association betweenquantitative measures of dementia and of senile change inthe cerebral grey matter of elderly subjects. Br J Psychiatry1968, 114(512):797-811.
30. Bucks RS, Ashworth DL, Wilcock GK, Siegfried K: Assessment ofactivities of daily living in dementia: development of the Bris-tol Activities of Daily Living Scale. Age Ageing 1996,25(2):113-120.
31. Webster DD: Critical analysis of the disability in Parkinson'sdisease. Mod Treat 1968, 5(2):257-282.
32. Reisberg B, Ferris SH, de Leon MJ, Crook T: Global DeteriorationScale (GDS). Psychopharmacol Bull 1988, 24(4):661-663.
33. Alexopoulos GS, Abrams RC, Young RC, Shamoian CA: CornellScale for Depression in Dementia. Biol Psychiatry 1988,23(3):271-284.
34. Cummings JL: The Neuropsychiatric Inventory: assessing psy-chopathology in dementia patients. Neurology 1997, 48(5Suppl 6):S10-16.
35. Sheikh JI, Yesavage JA: A knowledge assessment test for geriat-ric psychiatry. Hosp Community Psychiatry 1985, 36(11):1160-1166.
36. Macgregor S: Most pooling variation in array-based DNA pool-ing is attributable to array error rather than pool construc-tion error. Eur J Hum Genet 2007, 15(4):501-504.
37. Hoogendoorn B, Norton N, Kirov G, Williams N, Hamshere ML,Spurlock G, Austin J, Stephens MK, Buckland PR, Owen MJ, et al.:Cheap, accurate and rapid allele frequency estimation of sin-gle nucleotide polymorphisms by primer extension andDHPLC in DNA pools. Hum Genet 2000, 107(5):488-493.
38. Kirov G, Zaharieva I, Georgieva L, Moskvina V, Nikolov I, Cichon S,Hillmer A, Toncheva D, Owen MJ, O'Donovan MC: A genome-wide association study in 574 schizophrenia trios using DNApooling. Mol Psychiatry 2008.
39. Purcell S, Neale B, Todd-Brown K, Thomas L, Ferreira MA, BenderD, Maller J, Sklar P, de Bakker PI, Daly MJ, et al.: PLINK: a tool setfor whole-genome association and population-based linkageanalyses. Am J Hum Genet 2007, 81(3):559-575.
40. Barrett JC, Fry B, Maller J, Daly MJ: Haploview: analysis and visu-alization of LD and haplotype maps. Bioinformatics 2005,21(2):263-265.
Pre-publication historyThe pre-publication history for this paper can be accessedhere:
http://www.biomedcentral.com/1755-8794/1/44/prepub
Page 13 of 13(page number not for citation purposes)
Copyright © 2022 FDOKUMEN